Dennis E. Culley and Michelle M. Bright Glenn Research Center, Cleveland, Ohio Patricia S. Prahst AP Solutions, Inc., Cleveland, Ohio Anthony J. Strazisar Glenn Research Center, Cleveland, Ohio Active Flow Separation Control of a Stator Vane Using Surface Injection in a Multistage Compressor Experiment NASA/TM—2003-212356 June 2003 GT2003–38863 https://ntrs.nasa.gov/search.jsp?R=20030064100 2018-06-23T01:29:25+00:00Z

Welcome message from author
This document is posted to help you gain knowledge. Please leave a comment to let me know what you think about it! Share it to your friends and learn new things together.
Transcript

Dennis E. Culley and Michelle M. BrightGlenn Research Center, Cleveland, Ohio
Patricia S. PrahstAP Solutions, Inc., Cleveland, Ohio
Anthony J. StrazisarGlenn Research Center, Cleveland, Ohio
Active Flow Separation Control of a StatorVane Using Surface Injection in a MultistageCompressor Experiment
NASA/TM—2003-212356
June 2003
GT2003–38863
https://ntrs.nasa.gov/search.jsp?R=20030064100 2018-06-23T01:29:25+00:00Z

The NASA STI Program Office . . . in Profile
Since its founding, NASA has been dedicated tothe advancement of aeronautics and spacescience. The NASA Scientific and TechnicalInformation (STI) Program Office plays a key partin helping NASA maintain this important role.
The NASA STI Program Office is operated byLangley Research Center, the Lead Center forNASA’s scientific and technical information. TheNASA STI Program Office provides access to theNASA STI Database, the largest collection ofaeronautical and space science STI in the world.The Program Office is also NASA’s institutionalmechanism for disseminating the results of itsresearch and development activities. These resultsare published by NASA in the NASA STI ReportSeries, which includes the following report types:
• TECHNICAL PUBLICATION. Reports ofcompleted research or a major significantphase of research that present the results ofNASA programs and include extensive dataor theoretical analysis. Includes compilationsof significant scientific and technical data andinformation deemed to be of continuingreference value. NASA’s counterpart of peer-reviewed formal professional papers buthas less stringent limitations on manuscriptlength and extent of graphic presentations.
• TECHNICAL MEMORANDUM. Scientificand technical findings that are preliminary orof specialized interest, e.g., quick releasereports, working papers, and bibliographiesthat contain minimal annotation. Does notcontain extensive analysis.
• CONTRACTOR REPORT. Scientific andtechnical findings by NASA-sponsoredcontractors and grantees.
• CONFERENCE PUBLICATION. Collectedpapers from scientific and technicalconferences, symposia, seminars, or othermeetings sponsored or cosponsored byNASA.
• SPECIAL PUBLICATION. Scientific,technical, or historical information fromNASA programs, projects, and missions,often concerned with subjects havingsubstantial public interest.
• TECHNICAL TRANSLATION. English-language translations of foreign scientificand technical material pertinent to NASA’smission.
Specialized services that complement the STIProgram Office’s diverse offerings includecreating custom thesauri, building customizeddatabases, organizing and publishing researchresults . . . even providing videos.
For more information about the NASA STIProgram Office, see the following:
• Access the NASA STI Program Home Pageat http://www.sti.nasa.gov
• E-mail your question via the Internet [email protected]
• Fax your question to the NASA AccessHelp Desk at 301–621–0134
• Telephone the NASA Access Help Desk at301–621–0390
• Write to: NASA Access Help Desk NASA Center for AeroSpace Information 7121 Standard Drive Hanover, MD 21076

Dennis E. Culley and Michelle M. BrightGlenn Research Center, Cleveland, Ohio
Patricia S. PrahstAP Solutions, Inc., Cleveland, Ohio
Anthony J. StrazisarGlenn Research Center, Cleveland, Ohio
Active Flow Separation Control of a StatorVane Using Surface Injection in a MultistageCompressor Experiment
NASA/TM—2003-212356
June 2003
National Aeronautics andSpace Administration
Glenn Research Center
Prepared for theTurbo Expo 2003cosponsored by the American Society of Mechanical Engineersand the International Gas Turbine InstituteAtlanta, Georgia, June 16–19, 2003
GT2003–38863

Acknowledgments
The work reported in this paper is part of the Smart Efficient Components program at NASA Glenn ResearchCenter. In large part, this effort has been funded by the DARPA Micro-Adaptive Flow Control Program, with
NASA GRC, Honeywell Engines & Systems, and the Illinois Institute of Technology as team members.The authors would like to thank Honeywell Engines & Systems for cooperation in this effort, especially MukundAcharya for project management and significant contributions to the research; Steve Emo for development of thesiren valve actuator and relevant insight into engine systems; John Thurston for development of the embedded
fluidic actuator; and Dan Bugajski for contributions to the control model. The authors also wish to extend sincerethanks to Dave Williams and his team of students at the Illinois Institute of Technology for extensive contributions
to the development of experiment design parameters and analysis of data. Finally, the authors offer unendinggratitude to the crew of test cell W1; Mary Gibson, Rick Senyitko, Bob Davis, and Valarie Roundtree for which
without their expertise this research would not have been possible.
Available from
NASA Center for Aerospace Information7121 Standard DriveHanover, MD 21076
National Technical Information Service5285 Port Royal RoadSpringfield, VA 22100
Available electronically at http://gltrs.grc.nasa.gov
The Propulsion and Power Program atNASA Glenn Research Center sponsored this work.

ACTIVE FLOW SEPARATION CONTROL OF A STATOR VANE USING SURFACE INJECTION IN A MULTISTAGE COMPRESSOR EXPERIMENT
ABSTRACT
Active flow control has been applied to the suction surface of stator vanes in a low speed axial compressor. Injection from the suction surface has been shown to reduce separation on vanes that were induced to separate by increasing the vane stagger angle by 3˚. Various configurations were investigated including injector geometry (slots versus holes) and type of injection (steady versus unsteady). Unsteady injection was realized using two different approaches; external actuation through a high frequency valve and embedded actuation using a fluidic device internal to the vane. Using total pressure loss through the vane passage as a metric, reductions in area-averaged loss of 25% were achieved using injected massflow rates on the order of 1% of compressor through flow. The development of a tracking control algorithm was also explored for the purpose of closed-loop control. A reliable method of detecting surface separation was implemented using unsteady pressure measurements on the compressor casing near the vane suction surface.
NOMENCLATURE jetA - total area of injector slots or holes
c - chord µc - time-mean momentum coefficient
= ( )( )212 UUsLA jetjet
µc′ - harmonic oscillation momentum coefficient
= ( ) ( )2
122
′ UusLA jetjet
µC - total momentum coefficient = µµ cc ′+
f - frequency of harmonic oscillation, Hz +F - non-dimensional forcing frequency = 1UfL
L - distance from injection location to vane trailing edge = 0.65c
1m& - free stream massflow rate upstream of the vane passage
cjetm& - controlled massflow
jetm& - injected massflow rate
cp′ - unsteady pressure at the compressor casing, Figure 1
jetp′ - unsteady pressure internal to the flow control vane
jetP - time-averaged total pressure internal to the flow control vane
1P - area-averaged total pressure upstream of the vane passage
2P - area-averaged total pressure downstream of the vane passage
1p - area-averaged static pressure upstream of the vane PR - total pressure ratio = 12 PP s - span
1U - mean free stream velocity upstream of the vane passage
jetU - mean jet velocity = jetjet Am ρ&
jetu ′ - unsteady jet velocity
UR - injection velocity ratio = 1UU jet γ - ratio of specific heat ρ - density ϕ - flow coefficient = (mean inlet velocity)/(compressor tip speed) ψ - pressure rise coefficient
= ( )
−
−
−
1/11
12 γγ
ργγ PPP
ref
ref
ω - total pressure loss coefficient
Dennis E. Culley and Michelle M. Bright
National Aeronautics and Space Administration
Glenn Research Center
Cleveland, Ohio 44135
Patricia S. Prahst
AP Solutions, Inc.
Cleveland, Ohio 44135
Anthony J. Strazisar
National Aeronautics and Space Administration
Glenn Research Center
Cleveland, Ohio 44135
NASA/TM—2003-212356 1
INTRODUCTION In recent external flow control applications, unsteady
injection has been shown to generate large eddy structures that greatly enhance mixing between the boundary layer and fluid from the freestream [1]. Siefert et al [2] found that for a given level of mixing the injected massflow could be reduced by an order of magnitude by using unsteady injection rather than steady injection. In a separation control application McManus et al [3] was able to achieve a 20:1 reduction by using unsteady injection. Amitay and Glezer [4] showed that pulse-width modulated injection was even more efficient at conserving massflow than sinusoidal injection at a given frequency.
Based on the proven success of flow control in external flows, several research groups have recently begun to investigate the application of aerodynamic flow control to turbomachinery blading. Carter et al. [5] investigated the use of an ejector pump approach to simultaneously apply suction and injection to the suction surface of a cascade blade that was separated under nominal flow conditions. They achieved a 65% reduction in total pressure loss and a 4.5˚ increase in turning when injecting 1.6% of the freestream flow rate. Successful application of the same approach to a subsonic turbine cascade blade experiencing suction side separation at low Reynolds number has also been reported [6]. Bons et al. [7, 8] reported on the application of skewed vortex generator jets to a low-pressure turbine cascade blade to prevent separation at low Reynolds number. They found that pulsed injection with duty cycles as low as 10% was just as effective as harmonic pulsing (duty cycle of 50%) while providing a large reduction in the time-average injected massflow. This result is similar to that found in an external flow control application [4].
The long-term objective of our research is to develop and demonstrate flow control methods that utilize air injection in high-speed compressors for control of flow separation within stators. Successful separation control may enable improved performance in two ways; i) by increasing the range of incidence angles over which total pressure loss is acceptable, and ii) by increasing the loading level at which an acceptable level of loss occurs. The tangible benefits may be an increase in operability and an increase in stator aerodynamic loading, which can lead to reduced engine weight and parts count through lower solidity.
The focus of the present effort is the development of stator vane separation control methods using a low speed compressor. For durability and ease of maintenance it is desired that there be no moving parts within the vane. Since injected air must be bled from the aft stages of the compressor, we desire to minimize the amount of injection required. We therefore explore two approaches to reducing the required massflow; i) biased oscillatory injection, and ii) active control of injection (to provide injection only when the vane separates). Biased oscillatory injection, with a non-zero time-average massflow, is implemented using a motor-driven siren valve mounted in an injection supply line external to the stator vane. An alternative actuation approach is also assessed in which biased oscillatory injection is generated with a fluidic actuator embedded within the vane. While this approach requires a more complicated vane fabrication process, it eliminates the need for an external actuator and achieves unsteady injection with no moving parts, which may be more attractive for implementation on a production compressor.
Finally, the development of an algorithm for use in autonomous control of separation via injection is discussed. Active separation control requires a method of sensing the onset of separation. Results are presented that demonstrate separation sensing using time-averaged vane surface pressure measurements and a second method using time-resolved casing static pressure measurements.
Experimental Setup A description of the experiment hardware follows in the
next three sections. Part one describes the existing compressor facility which is used to perform the experiments in this paper. Part two describes the flow delivery system which is unique to this investigation. The flow delivery system augments the compressor rig and its hardware and resides wholly outside of the flow field. Components of the control system are also primarily associated with this hardware and are described here. Part three describes the internal component of the injection system, namely the flow control vane.
Research Compressor. The NASA-Glenn Low Speed
Axial Compressor (LSAC) facility is used for this study. Air enters the facility through a filtered roof vent, is conditioned for temperature and turbulence, and then passes through a calibrated bellmouth and into the research compressor. Airflow exiting the compressor is controlled by a throttle valve, close-coupled to the collector, and discharged into either an atmospheric or altitude exhaust system. A 1500-hp variable speed motor drives the compressor rotor.
The compressor consists of an inlet guide vane and four identical stages designed for accurate low-speed simulation of the rear stages of a high-speed core compressor. A long entrance duct is used to develop thick endwall boundary layers typical of an embedded stage. The first two stages are used to setup a “repeating stage” environment. The third stage is the focus of research measurements, while the fourth stage acts as a buffer to the exit conditions. The flow path has an outer diameter of 1.219 m and a hub-tip radius ratio of 0.80. All stators have inner shrouds with a single labyrinth seal-tooth in the shrouded stator cavity. The nominal rotor tip and stator seal clearances are 1.4% and 0.6% of span respectively. Rotor tip speed is 61 m/sec and nominal axial velocity is on the order of 25 m/sec. The increased size and low speed of this facility enables intrastage surveys of the flow field thus making possible an increased understanding of the complex flow phenomena within multi-stage axial compressors. A complete description of the LSAC facility is given by Wasserbauer [9].
The blading used for the current tests is based on the Rotor B/Stator B blading designed by General Electric for the NASA Energy Efficient Engine program. Details of the original designs are reported by Wisler [10]. The stators are designed by applying modified 65-series thickness distributions to modified circular-arc meanlines. The NASA stators are slightly modified from the GE design to accommodate a difference in hub-tip radius ratio between the GE and NASA low speed compressor facilities. The NASA stator features a solidity of 1.38, an aspect ratio of 1.32, a stagger angle of 42º and a camber of 40.5º. The stator chord is 9.4 cm. Stators are sealed at both the hub and tip junctions with the flow path.
Overall performance is expressed in terms of the average pressure rise coefficient, ψ, and flow coefficient, φ. The
NASA/TM—2003-212356 2

average pressure rise coefficient is determined from inlet and outlet static pressure measurements on the hub and casing. The flow coefficient is defined as the measured mean inlet velocity normalized by the rotor tip speed. The mean inlet velocity is determined from static pressure measurements at the exit of the inlet bellmouth using a previously determined discharge coefficient, and is corrected for humidity. Vane element performance is calculated from total pressure measurements acquired with miniature (1.64 mm) Kiel head probes and static pressure and flow angle measurements acquired with 18º wedge probes. All pressure measurements are acquired at midgap of the rotor-stator spacing (the spacing is approximately 35% of axial chord) and are referenced to stagnation conditions measured in the inlet plenum of the facility. The following measurement accuracies are reported by Wellborn [11]: ∆ψ = 1.09%, ∆φ = 0.39%, ∆ω = 2.1%.
To reduce the time and expense of exploring several different flow control configurations, all tests are performed under a removable window in the casing over stage three. Two flow control vanes are mounted under the window, with penetrations to the exterior of the casing, which allow for connection to the source of injection air. An experiment reconfiguration is thus achieved without removing the casing by simply disconnecting the air source and removing the window and flow control vanes as a unit.
The flow over the LSAC stator vanes is not prone to strong separation prior to compressor stall. Therefore, the two flow control vanes are installed at a stagger angle increase of approximately 3o from nominal to induce early flow separation. Surface pressure measurements acquired from a pair of instrumented stator vanes indicate that at this 3o re-stagger the vanes are not separated under open-throttle conditions but suffer a severe separation at lower flow coefficients. All other vanes are installed at the nominal design stagger. The vane restagger is determined from changes in the circumferential position of the vane trailing edge as the vane is rotated about the trunion axis and is accurate to +/- 1o.
The Flow Delivery System. Figure 1 is a schematic
representation of the overall flow control system including the flow control vanes. Discussion in this section is limited to the details of flow delivery outside of the compressor and the sensing and actuation associated with open or closed loop control. The various vane configurations tested are described in the next section.
The source of injection fluid in all cases is from a filtered shop air line available in the facility. A remotely-operated control valve enables the precise metering of the injected massflow rate. The flow rate is measured with a massflow meter to an accuracy of +/- 1% full scale. The meter is isolated by a large (volume = 5500 cc) accumulator at its output. The accumulator filters out rapid fluctuations in the flow, present during cases of unsteady injection, which will interfere with the accuracy of the flow meter. The accumulator also serves as a stable pressure source for the downstream components of the flow system. There are two independent flow paths from the accumulator to the flow control vanes. Since care is taken to maintain symmetry in the tubing, intermediate fittings, and any other devices inserted between the accumulator and the vanes, an equal distribution of flow to each vane is assumed.
HUB
Massflow
Controller / Meter
External Air Supply
Accumulator
Valve
Controller
Data Acquisition and Control
jetm&
f
1jetp′
2jetp′
cjetm&
cp′ 1U
ju ju ju 1jetu
2jetuSiren
Valve
1jetP
TIP
Figure 1 Schematic of the flow control actuation system.
The vane configuration under test determines the exact configuration of the flow delivery system. When externally modulated flow is required a valve is inserted immediately upstream of the flow control vane. This valve, hereafter referred to as the “siren valve”, is a high-speed motor driven device which houses two independent flow modulators on a single spool. Steady flow is supplied to the valve from the accumulator through a 1.7 m length of 0.95 cm inner diameter hard nylon tubing. The flow control vane is connected to the valve output using a 35 cm length of 0.95 cm inner diameter stainless tubing.
When the delivery system is required to provide a constant, steady flow to the flow control vane the same 1.7 meter length of tubing described above connects each vane directly to the accumulator. Note that the embedded-fluidic-vane, described later, also uses this configuration even though the injected flow is actually unsteady.
Also shown in Figure 1 are the sensing and control parameters used in open and closed loop tests. At the tip end of each flow control vane a high frequency piezo-electric pressure transducer is used to measure time-resolved delivery system dynamics. These signals are labeled 1jetp′ and 2jetp′ . In some configurations a 1 mm diameter tube is inserted into the internal flow control vane cavity to measure the time averaged total pressure, jetP , of the injected flow. Another high frequency piezo-electric pressure signal, cp′ , originates in the casing over the stator vane to track fluid disturbances related to vane separation dynamics. The injected massflow is both a measured value, jetm& , as well as a controlled parameter,
cjetm& . Finally, the speed of the valve and therefore the injection frequency, f , is controlled. All of these signals are tied to a high bandwidth data acquisition and control system.
Flow Control Vane Design The last component of the
experimental setup is the flow control vane. Several different injection configurations are examined in this investigation. The features of each vane are discussed here in detail.
The shape of the flow control vane is identical (within the tolerance limits of the fabrication process) to that of the standard LSAC vanes. However, injection through the vane surface requires the fabrication of flow passages within the
NASA/TM—2003-212356 3

narrow geometry of the vane. This is accomplished using a rapid prototyping process that enables the fabrication of parts with internal passages directly from a solid model CAD design file. The flow control vanes used in the present work are fabricated by a laser-sintering machine that uses powdered polyamide. There are limitations to the process that prevent the precise replication of feature sizes smaller than 0.375 mm. Absolute accuracy of the part geometry is also not assured. However, careful location of the parts to be grown within the laser-sintering machine minimizes these issues and enhances the surface finish and part strength. To further improve the surface finish of the flow control vanes, several coats of primer are applied before installation into the LSAC, yielding a surface finish that is comparable to that of the standard composite glass fiber LSAC vanes. The rapid prototype flow control vanes have been demonstrated to be entirely capable of surviving within the low speed compressor environment.
The optimum injection location on the suction surface for this investigation is 35% of chord. This location was previously determined in a wind tunnel study of separation location performed by the Illinois Institute of Technology using a custom-designed NACA airfoil whose suction surface pressure distribution closely matched that of the standard LSAC stator vane. In all vane configurations the injection angle is pitched at 30o relative to the vane surface to impart stream-wise momentum to the flow. Three different flow control vanes with injection at this nominal chord location and injection angle are investigated and are shown schematically in Figure 2.
Figure 2 Flow control vanes. a) slot-vane; b) embedded-fluidic-vane; c) hole-vane.
The first vane design is referred to as the slot-vane and is shown in Figure 2a. This design uses a span-wise slot divided into six segments separated by support webs in order to
maintain structural rigidity of the vane skin. The slot width and vane skin thickness are each 0.63 mm (0.7% of chord). The span-wise coverage is from approximately 10 to 90% of span and is constrained by the vane cavity design. This vane produces steady injection or unsteady injection when coupled with the external siren valve.
The second design is referred to as the embedded-fluidic-vane and is shown in Figure 2b. This design features three micro-fluidic devices embedded within pockets fabricated on the pressure side of the vane. Each device operates in a bi-stable mode that alternately switches flow entering from the vane trunion to two plenums at the device exit. Each output plenum covers 20% of span and the two plenums are separated by 4% of chord in the streamwise direction. Since each plenum is fed from a narrow output port on the fluidic device, the flow exiting the device must be spread along the length of the plenum before exiting the blade. A row of holes is therefore used in the blade skin over the plenums in lieu of a slot because the higher pressure loss across the holes improves the spanwise uniformity of flow within the plenum. The holes are 0.73 mm in diameter and are separated by 2.3 mm in the spanwise direction. The actuation frequency of each device is fixed at a nominal 2100 Hz. Phase differences between the three embedded-fluidic devices cannot be controlled and steady injection is not possible with this vane.
The final vane design is referred to as the hole-vane and is shown in Figure 2c. This vane is a hybrid of the first two configurations and is designed to resolve differences in actuation technology and injection geometry between the first two vane styles. Internally, the same cavity design is employed as in the first vane. Externally, the same injection hole array is used as found on the second vane but with hole diameters of 0.55 mm. This vane can produce steady injection or unsteady injection when used with the siren valve.
Nishri and Wygnanski [12] suggest that the most effective forcing frequency for flow control is 11 ≈=+ UfLF , where L is the distance between the injection location and the vane trailing edge. The siren valve, which operates over a frequency range of 200-900 Hz (0.37< +F <1.68), is used with the first and third vanes to explore this regime of forcing frequencies. The fluidic device is evaluated for several reasons. First, the higher physical frequencies it produces are necessary to achieve an 1≈+F in future high-speed flow applications. Second, it generates +F values on the order of 3.50 in this application. Investigation of higher frequency excitation is of interest because Amitay et al. [1] showed that excitation at higher frequency produced smaller scale structures in the interaction between the injection jet and mean flow, resulting in lower amplitude lift fluctuations compared to forcing at 1≈+F , thus reducing the structural forces on the airfoil. Third, the fluidic actuator has no moving parts. Finally, since it generates an unsteady flow at the vane surface, its performance is not dependent on the resonance characteristics of the delivery system and vane cavity. As discussed in the Results section, this is not the case for the siren valve.
Each flow control vane type is calibrated in still air using a hotwire anemometer to measure the exit velocity from the slot or hole at several locations along the span. The calibration establishes the spanwise uniformity of the injected flow and the
NASA/TM—2003-212356 4
(a)
(c)
Suction Surface
Pressure Surface
(b)fluidicdevice

relative magnitudes of the fluctuating ( HWu ′ ) and time mean ( HWU ) components of the injected flow. When the vane is installed in the LSAC a desired bulk injection velocity, jetU , is set using the measured injected massflow and the total area of the slots or holes. The hot wire measurements are then used to estimate the fluctuating component of the injected flow,
( )HWHWjetjet UuUu ′=′ .
0.050
28
24
20
1612
0 0.01
(a)
(c)
(b)
0 0.05T (seconds)
34
30
26
22Vel
ocity
(m/se
c)
28
24
20
16
12
Figure 3 Comparison of unsteady output generated by the three flow control vanes. a) Slot-vane driven by siren valve. Cµµµµ = 0.012 at F+ = .52; b) Embedded-fluidic-vane. Cµµµµ = 0.014 at F+ = 3.36; and c) Hole-vane driven by siren valve. Cµµµµ = 0.011 at F+ = .52
Examples of the injected velocity waveform measured with a hotwire anemometer during vane calibration are shown in Figure 3 for each type of vane at an injection velocity ratio of
75.0≈UR . The hotwire was located 6 mm (6% chord) downstream of the holes and slots, which corresponds to 8-10 hole diameters. The normal distance between the hotwire and the vane surface corresponded to the location of peak velocity in the injection wall jet, approximately 1 mm from the vane surface. The injection produced from the slot-vane and the hole-vane using the siren valve at 280 Hz ( 52.0=+F ) is shown in Figures 3a and 3c respectively. The output is an oscillatory jet with a non-zero mean flow. The output of the embedded-fluidic device is shown in Figure 3b, unfortunately at this level of injection the device is operating below its design point. The predominant frequency is about 1800 Hz
( +F =3.33) with evidence of some lower frequency components. At higher levels of injection there is an upward shift in the fundamental frequency to 2100 Hz ( +F =3.89) and little evidence of lower frequency components. By design the fluidic device is expected to fully modulate the injected flow with an 180o phase difference between the two output plenums. Additional hotwire measurements acquired closer to the injection holes verify that the instantaneous minimum flow never reaches zero, indicating that the output plenum under the vane skin does not empty in the time it takes the device to switch. The fluidic device therefore produces a harmonic oscillation that is quite similar in character to that produced by the siren valve coupled to the slot-vane and hole-vane.
The injected velocity is characterized by its mean and fluctuating components,
jetjetjet uUtu ′+=)( ,
where jetU is the mean velocity and jetu ′ is the harmonic oscillation imparted by the actuator. Following Nishri and Wygnanski [12], the strength of the injected flow is characterized by a momentum coefficient,
µµµ ccC ′+= , where µc is the momentum coefficient formed from the mean
injected velocity and µc′ is the momentum coefficient formed from the RMS of the harmonic oscillation. Nishri and Wygnanski performed flow control along the entire span of an airfoil and defined µc as
=
21
22U
ULhc jet
µ ,
where h is the width of the injection slot. In the present work the injection does not cover the entire span of the vane, and both holes and slots are used. We therefore define a momentum coefficient using the area of injection, jetA , and the airfoil span, s ,
= 2
1
22
U
UsLA
c jetjetµ
The ratio of unsteady ( µc′ ) to time-mean momentum ( µc ) developed by the jet is plotted against the total momentum ( µC ) in Figure 4 for the slot-vane and Figure 5 for the two vane styles with holes. The results indicate substantially lower levels of unsteadiness than that used in the external flow control applications mentioned in the introduction. Note that for a synthetic jet, which produces harmonic oscillations with zero mean velocity, µc′ is 100% of µC . Unsteady momentum generated by the slot-vane is 12-18% of the time-mean momentum while the unsteady momentum generated by the two hole-vane styles is a maximum of only 4% of the time-mean momentum. The lower unsteady momentum in the vanes with holes may be a result of increased impedance developed by the smaller area of the holes relative to the larger slot area.
The variation in unsteady momentum delivered by the siren valve and slot-vane at various forcing frequencies is a function of the delivery system dynamics and will be discussed in the Results section. The unsteady momentum generated in
NASA/TM—2003-212356 5

Cµ
0 0.010 0.020 0.030 0.040
0.20
0.16
0.12
0.08
0.04
0.00
F+
0.470.561.121.68
µµ cc /′
Figure 4 Injection characteristics of the slot-vane as a function of total momentum
Cµ
0.000 0.020 0.040 0.060 0.0800.000
0.010
0.020
0.030
0.040
0.050
Embedded-fluidic-vane9.33.3 << +F
F+
0.470.561.121.68
µµ cc /′
Figure 5 Injection characteristics of the hole-vane and embedded-fluidic-vane as a function of total momentum for selected test frequencies as a function of total momentum.
0.60
0.55
0.50
0.45
0.40
0.35
0.300.25 0.30 0.35 0.40 0.45 0.50
Flow Coefficient, φ
Pres
sure
Rise
Coe
ffic
ient
, ψ
Figure 6 Overall performance at design speed of the Low Speed Axial Compressor rig.
the hole-vane by the siren valve decays rapidly in amplitude as frequency is increased, making this actuator/vane combination unsuitable for application in higher speed flows where higher frequencies are required to attain 1≈+F . The fluidic device generates low amplitude unsteady momentum at low flow rates because it is not switching flow between its output plenums. As the flow rate increases the device starts to switch, generating higher unsteady oscillations. Since the device operates at the higher physical frequencies required for high-speed flow control applications, it holds some promise for use in such applications if the unsteady momentum level can be increased.
Results All results reported herein are obtained at design speed.
For reference, the overall performance curve for this condition is shown in Figure 6. The investigation primarily centers on a flow coefficient of 0.36, which is sufficiently far away from stall yet produces well separated flows across the restaggered flow control vanes.
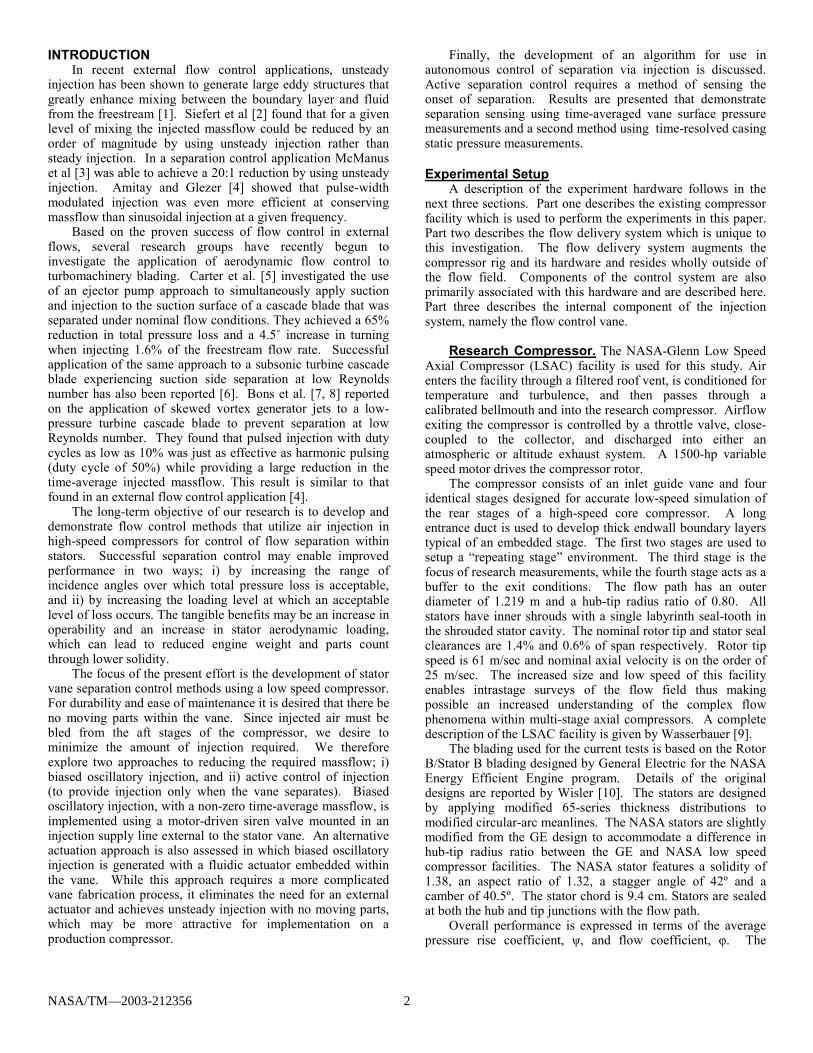
The effect of vane surface separation is a significant widening and deepening of the vane wake. Circumferential surveys of the downstream total pressure distribution across the vane pitch are used as an indicator of the degree of this separation. Figure 7 depicts a family of these total pressure profiles for the restaggered slot-vane, at 56% span, using steady injection ( 0=′µc ) over a range of injection momentum coefficients, µC . Also shown in the figure is the total pressure profile for the same vane with no injection at nominal stagger. A comparison of the zero injection profiles at both stagger conditions clearly indicates that 3o restagger produces a separated flow on the vane suction surface. The investigation uses the zero injection wake profile of the flow control vane under test at restagger as the baseline condition for comparison.
At momentum coefficients µC < 0.006 the wake momentum deficit grows relative to the baseline wake because the injected fluid does not carry enough momentum to energize the separation region on the vane suction surface. As the injection is increased a break-even point is reached, and further injection increases energize the separated region and result in wake size reduction. The response of the wake to injection shown in Figure 7 is typical for vanes with hole or slot injection geometries. Although the momentum coefficient is the proper measure of injection strength the amount of bleed required to achieve a given µC is also of interest since it can impact stage matching. This is shown in Table 1.
The benefit to vane performance due to injection is quantified using a total pressure loss coefficient. The conventional definition of loss coefficient for a vane passage with no mass addition is,
11
21
pPPP
−−=ω
Here, 1P and 2P are the area-averaged total pressure upstream and downstream of the vane and 1p is the area-averaged static pressure upstream of the vane. This must be corrected to account for the injected flow, which can have a different total pressure than the fluid in the vane passage. With injection present, there are two loss mechanisms within the vane passage: i) the viscous dissipation due to the vane surface
NASA/TM—2003-212356 6
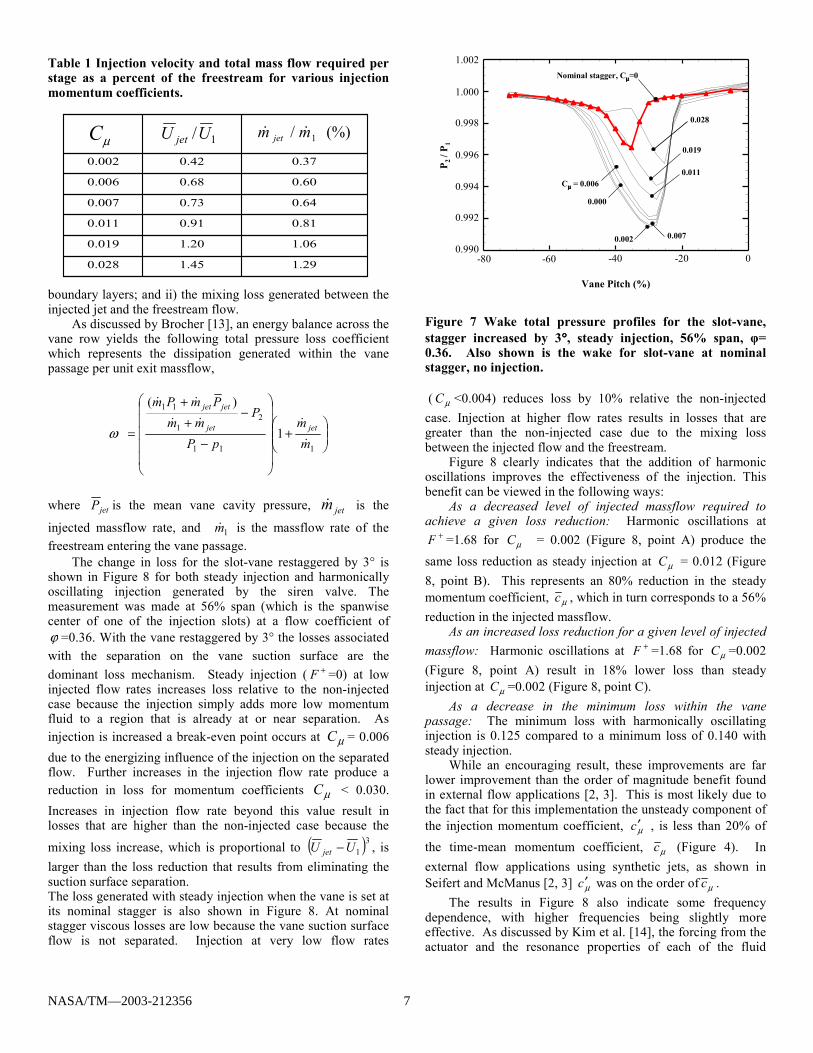
Table 1 Injection velocity and total mass flow required per stage as a percent of the freestream for various injection momentum coefficients.
µC 1/UU jet (%) / 1mm jet &&
1.291.450.028
1.061.200.019
0.810.910.011
0.640.730.007
0.600.680.006
0.370.420.002
boundary layers; and ii) the mixing loss generated between the injected jet and the freestream flow.
As discussed by Brocher [13], an energy balance across the vane row yields the following total pressure loss coefficient which represents the dissipation generated within the vane passage per unit exit massflow,
+
−
−+
+
=111
21
11
1
)(
mm
pP
Pmm
PmPm
jetjet
jetjet
&
&&&
&&
ω
where jetP is the mean vane cavity pressure, jetm& is the
injected massflow rate, and 1m& is the massflow rate of the freestream entering the vane passage.
The change in loss for the slot-vane restaggered by 3° is shown in Figure 8 for both steady injection and harmonically oscillating injection generated by the siren valve. The measurement was made at 56% span (which is the spanwise center of one of the injection slots) at a flow coefficient of ϕ =0.36. With the vane restaggered by 3° the losses associated with the separation on the vane suction surface are the dominant loss mechanism. Steady injection ( +F =0) at low injected flow rates increases loss relative to the non-injected case because the injection simply adds more low momentum fluid to a region that is already at or near separation. As injection is increased a break-even point occurs at µC = 0.006 due to the energizing influence of the injection on the separated flow. Further increases in the injection flow rate produce a reduction in loss for momentum coefficients µC < 0.030. Increases in injection flow rate beyond this value result in losses that are higher than the non-injected case because the
mixing loss increase, which is proportional to ( )31UU jet − , is
larger than the loss reduction that results from eliminating the suction surface separation. The loss generated with steady injection when the vane is set at its nominal stagger is also shown in Figure 8. At nominal stagger viscous losses are low because the vane suction surface flow is not separated. Injection at very low flow rates
0.019
0.028
0.011Cµµµµ = 0.006
0.000
0.0070.002
Nominal stagger, Cµµµµ=0
Vane Pitch (%)
P 2 /
P 1
1.002
1.000
0.998
0.996
0.992
0.994
0.990-80 -60 -40 -20 0
Figure 7 Wake total pressure profiles for the slot-vane, stagger increased by 3°°°°, steady injection, 56% span, φ= 0.36. Also shown is the wake for slot-vane at nominal stagger, no injection. ( µC <0.004) reduces loss by 10% relative the non-injected case. Injection at higher flow rates results in losses that are greater than the non-injected case due to the mixing loss between the injected flow and the freestream.
Figure 8 clearly indicates that the addition of harmonic oscillations improves the effectiveness of the injection. This benefit can be viewed in the following ways:
As a decreased level of injected massflow required to achieve a given loss reduction: Harmonic oscillations at
+F =1.68 for µC = 0.002 (Figure 8, point A) produce the same loss reduction as steady injection at µC = 0.012 (Figure 8, point B). This represents an 80% reduction in the steady momentum coefficient, µc , which in turn corresponds to a 56% reduction in the injected massflow.
As an increased loss reduction for a given level of injected massflow: Harmonic oscillations at +F =1.68 for µC =0.002 (Figure 8, point A) result in 18% lower loss than steady injection at µC =0.002 (Figure 8, point C).
As a decrease in the minimum loss within the vane passage: The minimum loss with harmonically oscillating injection is 0.125 compared to a minimum loss of 0.140 with steady injection.
While an encouraging result, these improvements are far lower improvement than the order of magnitude benefit found in external flow applications [2, 3]. This is most likely due to the fact that for this implementation the unsteady component of the injection momentum coefficient, µc′ , is less than 20% of the time-mean momentum coefficient, µc (Figure 4). In external flow applications using synthetic jets, as shown in Seifert and McManus [2, 3] µc′ was on the order of µc .
The results in Figure 8 also indicate some frequency dependence, with higher frequencies being slightly more effective. As discussed by Kim et al. [14], the forcing from the actuator and the resonance properties of each of the fluid
NASA/TM—2003-212356 7
F+
0.47
1.120.56
00
restagger
3º
3º3º
03o
1.68 3º*
0 0.0400.020 0.0300.010
0.20
0.08
0.12
0.16
0
0.04
Los
s Coe
ffic
ient
, ωω ωω
Injection Momentum Coefficient, Cµµµµ
A
B
C
Figure 8 Loss coefficient as a function of injected momentum for the slot-vane driven by the siren valve actuator, 56% span φ= 0.36.
0.9945
0.9950
0.9955
0.9960
0.9965
F+ = .47
F+ = .56
F+ = 1.12
F+ = 1.68
0.4 0.7 1.0 1.3 1.6 1.9F+
Cavity rms
Cavity mean
Wakepressureratio
0.025
0.050
0.075
0.100
0.125
0.150
0.175
0.200
0.225
12 / PP1P
pP sjet −
( )1
2
Pp jet′
Figure 9 Flow delivery system dynamics and the wake response as a function of harmonic oscillation frequency.
0 .040.020 .030.010Injection Momentum Coefficient, Cµµµµ
0
40
-40
20
-20
Los
s Red
uctio
n (%
)
5.0º
4.0º
3.5º
3.0º
2.5º
Figure 10 Sensitivity of loss reduction to vane restagger angle for the slot-vane, steady injection, 56% span,ϕ =0.36.
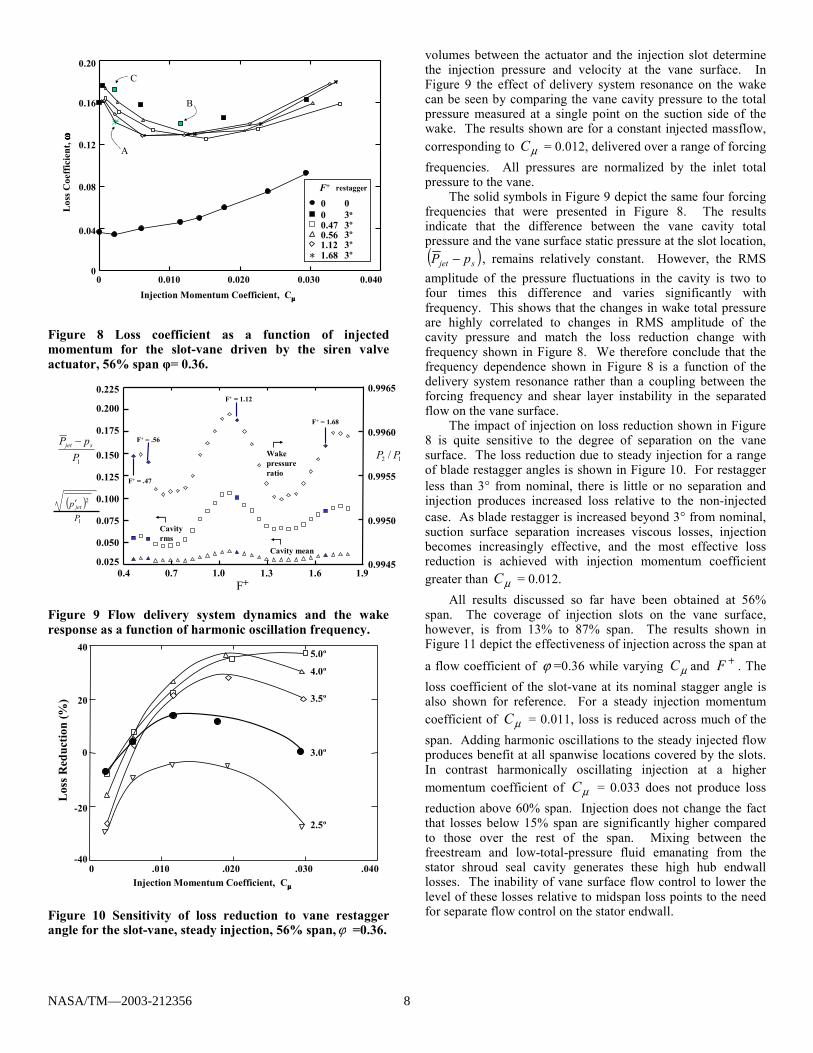
volumes between the actuator and the injection slot determine the injection pressure and velocity at the vane surface. In Figure 9 the effect of delivery system resonance on the wake can be seen by comparing the vane cavity pressure to the total pressure measured at a single point on the suction side of the wake. The results shown are for a constant injected massflow, corresponding to µC = 0.012, delivered over a range of forcing frequencies. All pressures are normalized by the inlet total pressure to the vane.
The solid symbols in Figure 9 depict the same four forcing frequencies that were presented in Figure 8. The results indicate that the difference between the vane cavity total pressure and the vane surface static pressure at the slot location, ( )sjet pP − , remains relatively constant. However, the RMS amplitude of the pressure fluctuations in the cavity is two to four times this difference and varies significantly with frequency. This shows that the changes in wake total pressure are highly correlated to changes in RMS amplitude of the cavity pressure and match the loss reduction change with frequency shown in Figure 8. We therefore conclude that the frequency dependence shown in Figure 8 is a function of the delivery system resonance rather than a coupling between the forcing frequency and shear layer instability in the separated flow on the vane surface.
The impact of injection on loss reduction shown in Figure 8 is quite sensitive to the degree of separation on the vane surface. The loss reduction due to steady injection for a range of blade restagger angles is shown in Figure 10. For restagger less than 3° from nominal, there is little or no separation and injection produces increased loss relative to the non-injected case. As blade restagger is increased beyond 3° from nominal, suction surface separation increases viscous losses, injection becomes increasingly effective, and the most effective loss reduction is achieved with injection momentum coefficient greater than µC = 0.012.
All results discussed so far have been obtained at 56% span. The coverage of injection slots on the vane surface, however, is from 13% to 87% span. The results shown in Figure 11 depict the effectiveness of injection across the span at
a flow coefficient of ϕ =0.36 while varying µC and +F . The loss coefficient of the slot-vane at its nominal stagger angle is also shown for reference. For a steady injection momentum coefficient of µC = 0.011, loss is reduced across much of the span. Adding harmonic oscillations to the steady injected flow produces benefit at all spanwise locations covered by the slots. In contrast harmonically oscillating injection at a higher momentum coefficient of µC = 0.033 does not produce loss reduction above 60% span. Injection does not change the fact that losses below 15% span are significantly higher compared to those over the rest of the span. Mixing between the freestream and low-total-pressure fluid emanating from the stator shroud seal cavity generates these high hub endwall losses. The inability of vane surface flow control to lower the level of these losses relative to midspan loss points to the need for separate flow control on the stator endwall.
NASA/TM—2003-212356 8

0.0 0.20 0.25 0.300.10 0.150.05
100
40
60
80
0
20
% sp
an
Loss Coefficient, ω
UR00
0.0110.0120.033
0.92
1.470.92
00
F+
0
1.681.12
00
restagger
3º
3º3º
03º
Cµ
Figure 11 Reduction in loss coefficient over the vane span for the slot-vane driven by the siren valve actuator, stagger increased by 3o, ϕ =0.36.
UR0
0.0110.012
0.033
0.92
1.47
0.92
0F+
0
1.12
1.12
0
0.028 1.47 0
nominal stagger
3º restagger
0.20
0.08
0.12
0.16
0
0.04
Los
s Coe
ffic
ient
, ω
0.30 0.35 0.40 0.45Flow Coefficient, φφφφ
Cµ
Figure 12 Reduction in loss coefficient as a function of flow coefficient for the slot-vane driven by the siren valve actuator, stagger angle increased by 3o, at 56% span.
The results shown in Figure 11 reflect the performance of the vane surface flow control at a flow coefficient ofϕ =0.36, which represents a highly-loaded operating condition (Figure 6) at which the restaggered vane is badly separated. The effectiveness of injection at lower-loaded operating conditions is shown for the slot-vane driven by the siren valve in Figure 12. At the nominal stagger angle, where the vane is unseparated over much of the operating envelope, injection does not provide loss reduction at any flow coefficient. At an increased stagger of 3°, both steady and harmonically oscillating injection at a level of µC = 0.011 provide a loss reduction benefit as loading increases at low flow coefficients. However, both steady and unsteady injection at a higher momentum coefficient of µC = 0.033 increases loss relative to the non-injected case.
0.20
0.08
0.12
0.16
0
0.04
Loss
Coe
ffic
ient
, ωω ωω
Injection Momentum Coefficient, Cµµµµ
0.000 0.010
*
F +00.47 Siren valve0.56 Siren valve1.12 Siren valve1.68 Siren valve3.33 Fluidic device
0.020 0.030 0.040 0.050 0.060
Figure 13 Loss coefficient as a function of injected momentum for the embedded-fluidic-vane and hole-vane driven by the siren valve actuator, stagger angle increased by 3o, 56% span φ= 0.36.
0 .040.020 .030.010Injection Momentum Coefficient, Cµµµµ
0
40
-40
20
-20
Los
s Red
uctio
n (%
)
Slot vaneHole vaneEmbedded fluidic vane
Figure 14 Comparison of loss reduction for the slot-vane, embedded-fluidic-vane, and hole-vane at 5o restagger angle, steady injection, 56% span,ϕ =0.36.
Experiments were repeated under the same conditions for the embedded-fluidic-vane and the hole-vane. The results of these experiments are shown in Figure 13 for a blade restagger of 2.5o. Recalling that the frequency of the embedded device is not controllable a single curve is used to define its performance. The hole-vane is capable of variable frequency operation and therefore loss data is shown using the same harmonic oscillation frequencies which were chosen for the slot-vane. Unsteady injection using the fluidic device increases the loss of the embedded-fluidic-vane at all injected flow rates. Similarly, steady injection increases the loss of the hole-vane at all injection rates. When driven by the siren valve at µC <0.015, the hole-vane loss is reduced relative to that with steady injection. Although this improved loss reduction behavior due to unsteady injection is similar to that of the slot-vane (Figure 8) little or no loss reduction is achieved relative to the non-
NASA/TM—2003-212356 9

injected case. The fact that injection increases loss for both hole vane styles is primarily due to the fact that there is little or no separation at this restagger angle. Performance of the two hole vane styles is compared to that of the slot-vane at a larger restagger angle (5o) in Figure 14, where the ordinate is the change in loss relative to the non-injected case. At this increased restagger angle all three vane styles reduce loss and the performance of the slot-vane and hole-vane is nearly identical.
Separation Detection and Control The final task in the present effort is to design and
demonstrate a method capable of active sensing and closed loop control of vane surface separation. Closed loop separation control is desirable because it commands injection only when necessary, thus minimizing the thermodynamic cycle penalty associated with the increased compressor bleed, which is the source of air needed for injection. In an installed compressor, separation is an effect of off-design loading caused by throttle transients, distortion, and increased clearances due to deterioration. In the LSAC, loading changes are induced by closing the rig throttle valve. Our closed loop control architecture is therefore based on forcing the onset of vane suction surface separation using changes in the throttle position, and reducing the separation using massflow input to the vane. The signals required to implement control are the massflow input, jetm& , the massflow commanded, cjetm& , and the pressure,
cp′ , measured from a pressure transducer at the casing over the stator vane, and are all shown in Figure 1.
In order to characterize the dynamics associated with a control scheme, open-loop experiments are performed to provide information on the lag between the start of injection and the response of the vane surface separation. The lag is determined by injecting a slug of fluid through the slot-vane using a fast solenoid valve (in place of the siren valve) to gate the flow on and off. The response of the vane surface separation to gated injection is inferred by measuring velocity changes in the suction side of the vane wake. This is accomplished with a hotwire anemometer probe axially located at the stream-wise measurement location used for the total pressure surveys. The internal vane cavity pressure, jetp′ , is monitored with the pressure transducer located at the inlet of the cavity (Figure 1). A time history of the solenoid command signal, the wake velocity, and internal vane cavity pressure is shown in Figure 15. The results indicate that the cavity pressure (and therefore the injected velocity) does not attain its peak until 0.025 seconds after the solenoid is opened and that the wake velocity change is complete 0.010 seconds after the cavity pressure peaks. Both of these effects contribute a 0.035 second delay between commanded injection and measured response. This information characterizes the vane dynamics time lag for our control design.
Implementation of a closed-loop control scheme requires a method of detecting separation. Two separation detection schemes were therefore developed. The first scheme employs a flow control vane with suction surface static pressure taps located at 70% and 85% chord and 56% span. The pressure rise between these two locations provides the controller with information on the pressure gradient over the rear of the vane. Measurements of this pressure rise with and without steady
injection are acquired over a flow coefficient range of 0.31 < ϕ < 0.45 and are shown in Figure 16. Without injection, the pressure rise falls to zero at flow coefficients of ϕ < 0.40, indicating separation. When injection is activated at an injection level of µC =0.012, a pressure rise is restored at flow coefficients of ϕ < 0.40. The pressure rise is gradually reduced as ϕ decreases, and the flow is once again separated at ϕ = 0.31. When the injection level is increased to µC =0.030, the pressure rise is maintained over a wide range of flow coefficients at levels near that experienced at ϕ = 0.45 without control, and does not begin to decrease until ϕ = 0.35. This type of detection scheme is achieved using static pressure measurements along the vane surface.
Time, seconds
Wake Velocity Response
Forcing Pressure Internal to Vane
0.00 0.02 0.04 0.06 0.08 0.10
Valve Command
Figure 15 Time history of wake response to injection gated with a solenoid valve. Slot-vane, 56% span, φ=0.36.
0.30 0.40 0.45 0.500.35
0.0
0.20
0.40
Flow Coefficient, φ φ φ φ
P/(P
1–
p 1)
Cµ
0.0000.0120.030
Figure 16 Vane surface static pressure rise from 70–85% chord with and without steady injection. Slot-vane driven by the siren valve actuator, stagger increased by 3o, 56% span.
The second separation detection scheme investigated uses a pressure transducer located in the casing next to the vane suction surface at 85% chord (Figure 1). This scheme was developed because it requires access to only a casing static
NASA/TM—2003-212356 10

pressure. This should therefore be less costly to implement in an engine than the scheme described above which requires an instrumented airfoil. This detection scheme is based on a time-series analysis of the casing static pressure and works as follows. The wake shed from the vane causes an unsteady loading of the downstream rotor. The first Fourier harmonic of the rotor blade passing frequency is a measure of the wake-induced pressure variation generated by the rotor. Since vane surface separation causes increased wake strength, a separation can be detected from the casing static pressure signal by monitoring the power in the first harmonic.
The power measured in the first harmonic over the flow coefficient range of 0.31< ϕ <0.45 with and without injection is shown in Figure 17. A sample power spectrum is shown in the inset of Figure 17. At a flow coefficient of ϕ =0.39, which is near the design point of the compressor, the first harmonic is at a minimum. As the flow coefficient is reduced, vane loading increases and the wake soon begins to grow due to suction surface separation, resulting in increased power in the first harmonic. (The presence of separation for ϕ <0.39 is independently verified by the vane suction surface pressure data shown in Figure 16.) Injection reduces the wake strength for ϕ < 0.39 and the power in the first harmonic is reduced. Increasing the flow coefficient above ϕ = 0.39 also results in increased power in the first harmonic. In this situation a reduced incidence angle produces a separation on the pressure surface of the vane. Since there is no injection on the pressure side of the vane, the power in the first harmonic does not change with injection. The fact that the power of the first Fourier harmonic increases above and below the design flow coefficient of ϕ =0.39 indicates that additional information about the machine operating condition is necessary in order for a controller to decide if suction surface injection is required.
In a control strategy for the vane, the power of the first Fourier harmonic of the pressure signal is used to determine when to switch injection on or off. When the power of the first Fourier harmonic rises above a threshold level of 0.4 the control computer automatically opens a valve to begin injection. The injected massflow from the vane surface is then varied proportionally to the casing signal strength. Results from an experiment in which this control strategy is used while the flow coefficient is varied over a range of 0.31<ϕ <0.45 are shown in Figure 18. The power spectral density of the pressure signal cp′ is plotted with and without control. With controlled injection, the amplitude of the power signal is maintained at a level below 0.8. This indicates that the flow is attached using active control.
Summary Control of stator vane suction surface separation has been
demonstrated in a low speed multistage compressor using steady and unsteady injection on the suction surface. Reductions in exit total pressure loss on the order of 25% were realized using an injected flow equivalent to 1% of the compressor throughflow. For a given injection level, the addition of harmonic oscillations to steady injection can reduce the level of injection required to attain a given loss reduction. Although injection was found to be effective across the full span of the vane, the high inner endwall losses typically found
in hub-shrouded stators were not significantly reduced by the vane surface injection, pointing to the need for a separate approach to endwall loss reduction. Although injection was found to be effective across a wide range of operating conditions, a given level of injection is most effective when losses are high.
0
0.2
0.4
0.6
0.8
1.0
1.2
1.4
1.6
1.8
0.31 0.33 0.35 0.37 0.39 0.41 0.43 0.45
Flow Coefficient
Pow
er a
t Bla
de P
assi
ng F
requ
ency
No Injection
With Injection
Control Threshold
Blade Passing Frequency
Figure 17 Power of the first Fourier harmonic of the downstream rotor blade passing frequency is plotted as a function of flow coefficient without injection and with steady injection at ≈µC 0.010. The inset shows the relative magnitude of the BPF signal at ϕ = 0.36 with no injection. Slot-vane driven by the siren valve actuator, stagger increased by 3°°°°, 56% span.
No Control,
=0.36ϕ
Flow Control,
=0.36ϕ Flow Control,
=0.35ϕ
Figure 18 Power spectral density of the casing static pressure with and without closed loop control. Slot-vane driven by the siren valve actuator, stagger increased by 3°°°°, 56% span.
Harmonic oscillations were generated with two types of actuators, a motor-driven siren valve located external to the vane and a bi-stable fluidic actuator embedded within the vane. In addition, two different injection configurations were evaluated – a spanwise slot and a double row of spanwise
NASA/TM—2003-212356 11
holes. The best performance was obtained with the siren valve and slot-vane. Although the siren valve was closely coupled to two vanes, resonance of the fluid volumes between the siren valve and vane surface slots was found to affect the amplitude of the harmonic oscillations generated at the vane surface. This finding suggests caution when supplying injected flow to multiple vanes from a single source of unsteady actuation. As the distance between actuator and vanes increases, the frequency separation between resonance conditions decreases, necessitating careful matching of system volumes between each actuator and vane.
The magnitude of the harmonic oscillation generated by the fluidic actuator evaluated in the present work was attenuated by the small holes in the vane surface. Design of a more effective coupling between the actuator output and the vane surface holds the promise for improved performance compared to the siren valve. Although embedding the fluidic device within the vane entails increased vane fabrication complexity, the device itself has no moving parts and can be driven by a constant pressure source connected to the vane.
Spectral analysis of the casing static pressure measured near the vane-endwall junction was found to provide a reliable indicator of the degree of vane separation. The design of a feedback control system that modulates vane injection to control separation was presented.
A careful cycle study is needed to evaluate the cost/benefit trade of adding flow control vanes to a compressor. The manufacturing cost of the added mechanical complexity of hollow airfoils and embedded or external actuators needs to be assessed against performance benefits. The thermodynamic cycle penalty of recirculating the flow control air within the compressor also needs to be assessed against the performance benefits. Results from this investigation provide an initial quantification of the aerodynamic benefits associated with flow control, which should prove useful when input to a cycle study. Only two flow control vanes in a stage were used in the present work. The next step is to evaluate a full row of flow control vanes, which will enable a study of stage matching issues arising from loss reduction in the stator. Turning changes due to flow control, which will impact stage matching, also need to be quantified.
The authors also wish to extend sincere thanks to Dave Williams and his team of students at the Illinois Institute of Technology for extensive contributions to the development of experiment design parameters and analysis of data.
Finally, the authors offer unending gratitude to the crew of test cell W1; Mary Gibson, Rick Senyitko, Bob Davis, and Valarie Roundtree for which without their expertise this research would not have been possible.
REFERENCES [1] Amitay, M., Kibens, V., Parekh, D., and Glezer A., 1999,
“The Dynamics of Flow Reattachment over a Thick Airfoil Controlled by Synthetic Jet Actuators,” AIAA Paper No. 99-1001.
[2] Seifert, A., Bachar, T., Koss, D., Shepshelovich, M., and Wygnanski, I., 1993, “Oscillatory Blowing: A Tool to Delay Boundary-Layer Separation,” AIAA J., 31, No. 11, pp. 2052-2060.
[3] McManus, K., Legner, H., and Davis, S., 1994, “Pulsed Vortex Generator Jets for Active Control of Flow Separation,” AIAA Paper No. 94-2218.
[4] Amitay, M., and Glezer, A., 1999, “Aerodynamic Flow Control of a Thick Airfoil Using Synthetic Jet Actuators,” ASME/JSME Paper FEDSM99-6922.
[5] Carter, C., Guillot, S., Ng, W., and Copenhaver, W., 2001, “Aerodynamic Performance of a High-Turning Compressor Stator with Flow Control,” AIAA Paper 2001-3973.
[6] Stitzel, S., 2002, “Integrated Ejector Pump Flow Control for Low Pressure Turbine,” NASA Phase I SBIR Final Report, NASA-LPT-FR01.
[7] Bons, J., Sondergaard, R., and Rivir, R., 2000, “Turbine Separation Control Using Pulsed Vortex Generator Jets,” ASME J. Turbomachinery, 123, pp. 198-206.
[8] Bons, J., Sondergaard, R., and Rivir, R., 2002, “The Fluid Dynamics of LPT Blade Separation Control Using Pulsed Jets,” ASME J. of Turbomachinery, 124, pp. 77-85.
[9] Wasserbauer, C.A., Weaver, H.F., and Senyitko, R.G., 1995, “NASA Low Speed Compressor for Fundamental Research,” NASA TM4635.
[10] Wisler, D.C., 1977, “Core Compressor Exit Stage Study: Volume I – Blade Design,” NASA CR135391.
[11] Wellborn, S., and Okiishi, T., 1999, “The Influence of Shrouded Stator Cavity Flows on Multistage Compressor Performance,” ASME J. of Turbomachinery, 121, pp. 486-498.
[12] Nishri, B., and Wygnanski, I., 1998, “Effects of Periodic Excitation on Turbulent Flow Separation from a Flap,” AIAA Journal, 36, No. 4, pp. 547-556.
[13] Brocher, E., 1961, “The Jet-Flap Compressor Cascade,” ASME Journal of Basic Engineering, p. 401.
[14] Kim, B., Williams, D., Emo, S., and Acharya, M., 2002, “Large Amplitude Pneumatic Oscillator for Pulsed-Blowing Actuators”, AIAA Paper 2002-2704.
NASA/TM—2003-212356 12


This publication is available from the NASA Center for AeroSpace Information, 301–621–0390.
REPORT DOCUMENTATION PAGE
2. REPORT DATE
19. SECURITY CLASSIFICATION OF ABSTRACT
18. SECURITY CLASSIFICATION OF THIS PAGE
Public reporting burden for this collection of information is estimated to average 1 hour per response, including the time for reviewing instructions, searching existing data sources,gathering and maintaining the data needed, and completing and reviewing the collection of information. Send comments regarding this burden estimate or any other aspect of thiscollection of information, including suggestions for reducing this burden, to Washington Headquarters Services, Directorate for Information Operations and Reports, 1215 JeffersonDavis Highway, Suite 1204, Arlington, VA 22202-4302, and to the Office of Management and Budget, Paperwork Reduction Project (0704-0188), Washington, DC 20503.
NSN 7540-01-280-5500 Standard Form 298 (Rev. 2-89)Prescribed by ANSI Std. Z39-18298-102
Form Approved
OMB No. 0704-0188
12b. DISTRIBUTION CODE
8. PERFORMING ORGANIZATION REPORT NUMBER
5. FUNDING NUMBERS
3. REPORT TYPE AND DATES COVERED
4. TITLE AND SUBTITLE
6. AUTHOR(S)
7. PERFORMING ORGANIZATION NAME(S) AND ADDRESS(ES)
11. SUPPLEMENTARY NOTES
12a. DISTRIBUTION/AVAILABILITY STATEMENT
13. ABSTRACT (Maximum 200 words)
14. SUBJECT TERMS
17. SECURITY CLASSIFICATION OF REPORT
16. PRICE CODE
15. NUMBER OF PAGES
20. LIMITATION OF ABSTRACT
Unclassified Unclassified
Technical Memorandum
Unclassified
National Aeronautics and Space AdministrationJohn H. Glenn Research Center at Lewis FieldCleveland, Ohio 44135–3191
1. AGENCY USE ONLY (Leave blank)
10. SPONSORING/MONITORING AGENCY REPORT NUMBER
9. SPONSORING/MONITORING AGENCY NAME(S) AND ADDRESS(ES)
National Aeronautics and Space AdministrationWashington, DC 20546–0001
Available electronically at http://gltrs.grc.nasa.gov
June 2003
NASA TM—2003-212356GT2003–38863
E–13944
WBS–22–708–28–03
18
Active Flow Separation Control of a Stator Vane Using Surface Injection in aMultistage Compressor Experiment
Dennis E. Culley, Michelle M. Bright, Patricia S. Prahst, and Anthony J. Strazisar
Compressor stator control; Flow control
Unclassified -UnlimitedSubject Category: 07 Distribution: Nonstandard
Prepared for the Turbo Expo 2003 cosponsored by the American Society of Mechanical Engineers and the InternationalGas Turbine Institute, Atlanta, Georgia, June 16–19, 2003. Dennis E. Culley, Michelle M. Bright, and Anthony J.Strazisar, NASA Glenn Research Center; Patricia S. Prahst, AP Solutions, Inc., Cleveland, Ohio 44135. Responsibleperson, Dennis E. Culley, organization code 5530, 216–433–3797.
Micro-flow control actuation embedded in a stator vane was used to successfully control separation and improve near stall performancein a multistage compressor rig at NASA Glenn. Using specially designed stator vanes configured with internal actuation to deliverpulsating air through slots along the suction surface, a research study was performed to identify performance benefits using thismicroflow control approach. Pressure profiles and unsteady pressure measurements along the blade surface and at the shroud provideda dynamic look at the compressor during microflow air injection. These pressure measurements lead to a tracking algorithm to identifythe onset of separation. The testing included steady air injection at various slot locations along the vane. The research also examinedthe benefit of pulsed injection and actively controlled air injection along the stator vane. Two types of actuation schemes were studied,including an embedded actuator for on-blade control. Successful application of an online detection and flow control scheme will bediscussed. Testing showed dramatic performance benefit for flow reattachment and subsequent improvement in diffusion through theuse of pulsed controlled injection. The paper will discuss the experimental setup, the blade configurations, and preliminary CFD resultswhich guided the slot location along the blade. The paper will also show the pressure profiles and unsteady pressure measurementsused to track flow control enhancement, and will conclude with the tracking algorithm for adjusting the control.
Related Documents