1 Active Flow Control Systems Architectures for Civil Transport Aircraft M. Jabbal * , S.C. Liddle † and W.J. Crowther ‡ University of Manchester, PO Box 88, Sackville Street, Manchester M60 1QD, UK Abstract This paper considers the effect of choice of actuator technology and associated power systems architecture on the mass cost and power consumption of implementing active flow control systems on civil transport aircraft. The research method is based on the use of a mass model that includes a mass due to systems hardware and a mass due to the system energy usage. An A320 aircraft wing is used as a case study application. The mass model parameters are based on first principle physical analysis of electric and pneumatic power systems combined with empirical data on system hardware from existing equipment suppliers. Flow control methods include direct fluidic, electromechanical-fluidic and electro-fluidic actuator technologies. The mass cost of electrical power distribution is shown to be considerably less than that for pneumatic systems, however this advantage is reduced by the requirement for relatively heavy electrical power management and conversion systems. A trade exists between system power efficiency and the system hardware mass required to achieve this efficiency. For short duration operation the flow control solution is driven towards lighter, less power efficient systems, whereas for long duration operation there is benefit in considering heavier but more efficient systems. It is estimated that a practical electromechanical- fluidic system for flow separation control may have a mass up to 40% of the slat mass for a leading edge application and 5% of flap mass for a trailing edge application. Nomenclature * Research Associate, School of Mechanical, Aerospace and Civil Engineering, Sackville Street [email protected] † Research Associate, School of Mechanical, Aerospace and Civil Engineering, Sackville Street ‡ Senior Lecturer, School of Mechanical, Aerospace and Civil Engineering, Sackville Street a Actuator diaphragm peak-to-peak displacement, m A Cross sectional area of pipe, orifice, or exposed plasma electrode, m 2 d Orifice diameter, m D Drag off-take associated with a flow control system, N D i Internal diameter of pipe; diameter of wire, m E Fuel usage, gallons f Friction factor; frequency, Hz

Welcome message from author
This document is posted to help you gain knowledge. Please leave a comment to let me know what you think about it! Share it to your friends and learn new things together.
Transcript
1
Active Flow Control Systems Architectures for Civil Transport Aircraft
M. Jabbal*, S.C. Liddle† and W.J. Crowther‡
University of Manchester, PO Box 88, Sackville Street, Manchester M60 1QD, UK
Abstract
This paper considers the effect of choice of actuator technology and associated power systems architecture
on the mass cost and power consumption of implementing active flow control systems on civil transport
aircraft. The research method is based on the use of a mass model that includes a mass due to systems
hardware and a mass due to the system energy usage. An A320 aircraft wing is used as a case study
application. The mass model parameters are based on first principle physical analysis of electric and
pneumatic power systems combined with empirical data on system hardware from existing equipment
suppliers. Flow control methods include direct fluidic, electromechanical-fluidic and electro-fluidic actuator
technologies. The mass cost of electrical power distribution is shown to be considerably less than that for
pneumatic systems, however this advantage is reduced by the requirement for relatively heavy electrical
power management and conversion systems. A trade exists between system power efficiency and the
system hardware mass required to achieve this efficiency. For short duration operation the flow control
solution is driven towards lighter, less power efficient systems, whereas for long duration operation there is
benefit in considering heavier but more efficient systems. It is estimated that a practical electromechanical-
fluidic system for flow separation control may have a mass up to 40% of the slat mass for a leading edge
application and 5% of flap mass for a trailing edge application.
Nomenclature
* Research Associate, School of Mechanical, Aerospace and Civil Engineering, Sackville Street
† Research Associate, School of Mechanical, Aerospace and Civil Engineering, Sackville Street
‡ Senior Lecturer, School of Mechanical, Aerospace and Civil Engineering, Sackville Street
a Actuator diaphragm peak-to-peak displacement, m
A Cross sectional area of pipe, orifice, or exposed plasma electrode, m2
d Orifice diameter, m D Drag off-take associated with a flow control system, N Di Internal diameter of pipe; diameter of wire, m E Fuel usage, gallons f Friction factor; frequency, Hz
2
F Output force of active surface membrane actuator, N H Number of airborne hours I Current, A L Distribution length of pipe or wire, m m Overall mass of flow control system, kg m Mass flow rate, kg/s M Mach number md Distribution mass, kg mfuel Fuel mass required for flow control operation, kg mw Power specific mass of a system component, kg/kW m'wd Power distribution specific mass per unit length, kg/kWm
Wgm& Power generation specific fuel mass flow rate, kg/kWs
n Number of actuators P Pressure, Pa R Wire resistance, Ohms; Universal gas constant, m
3Pa/Kmol
Re Pipe Reynolds number S Number of aircraft seats sA Span wise extent of actuator array, m T Temperature, K; period of oscillation, s U Pipe flow velocity, m/s Uj Actuator jet velocity, m/s U∞ Free stream velocity, m/s V Average aircraft speed, mph; Voltage, volts VR Actuator jet to free stream velocity ratio WE Electrical power, W WF Flow (fluid) power, W WP Pressure power, W δ Boundary layer height, m ∆ Ratio of orifice diameter to local boundary layer height ∆P Pressure drop, Pa ∆V Voltage drop, Volts ∆t Operation duration of flow control system, s η Overall power efficiency of flow control system ηd Power distribution efficiency λ Ratio of actuator span wise spacing to orifice diameter
ρ Fluid density, kg/m3
τ Pulse duty cycle
I. Introduction Whilst there has been some progress towards identifying suitable fluidic actuator concepts for application on
commercial transport aircraft, there is still considerable uncertainty as to the nature of the systems
architectures that are needed to support the generation, management and distribution of power to these
actuators. In particular, the choice between distributing power electrically or pneumatically is still an open
question, despite significant historical development of boundary layer control (BLC) technologies using
compressed air [1] and progress towards the development of the More Electric Aircraft (MEA) [2].
For pneumatic flow control technologies, compressed air is needed at the point of delivery at the actuator
hence direct bleed of compressed air from an engine initially appears to provide a very competitive power
3
option. However, there are issues in that the amount of bleed air available is correlated with the engine
throttle setting, which may severely limit bleed availability at low throttle conditions, e.g. landing.
Furthermore, the pipe work required for ducting compressed air is relatively heavy compared to a system for
delivering the same amount of power electrically, and there is significant maintenance costs associated with
pressurized systems with many joints.
For electric solutions, an engine mounted generator is used to generate electrical power which is then
distributed using wires. However, electrical power has to be converted back into the fluidic domain at the
actuator through some form of electromechanical-fluidic transduction. The additional conversion steps
involved in electrical power generation and distribution for fluidic flow control actuators means that it takes
considerable engineering effort to design electrical generation/distribution/conversion systems that match the
mass efficiency of pneumatic-only systems. That said, mass reduction and efficiency of electrical machines
and digital power systems continues to improve, whilst there seems little scope for similar improvement in
pneumatic systems. Therefore, it is likely that the balance will shift further towards electric power generation
and distribution for flow control systems in the future.
Traditionally civil transport aircraft have used hydraulic, electric and pneumatic systems to transmit power
around the aircraft, with different choices for different service applications. However, in more recent designs
including the production Boeing 787, the large majority of systems are electrically powered. The generation
system is therefore of greater power capacity when compared to corresponding previous practice. For
example, the engine driven generators of the 787 are of 1000kVA capacity, compared to the conventional
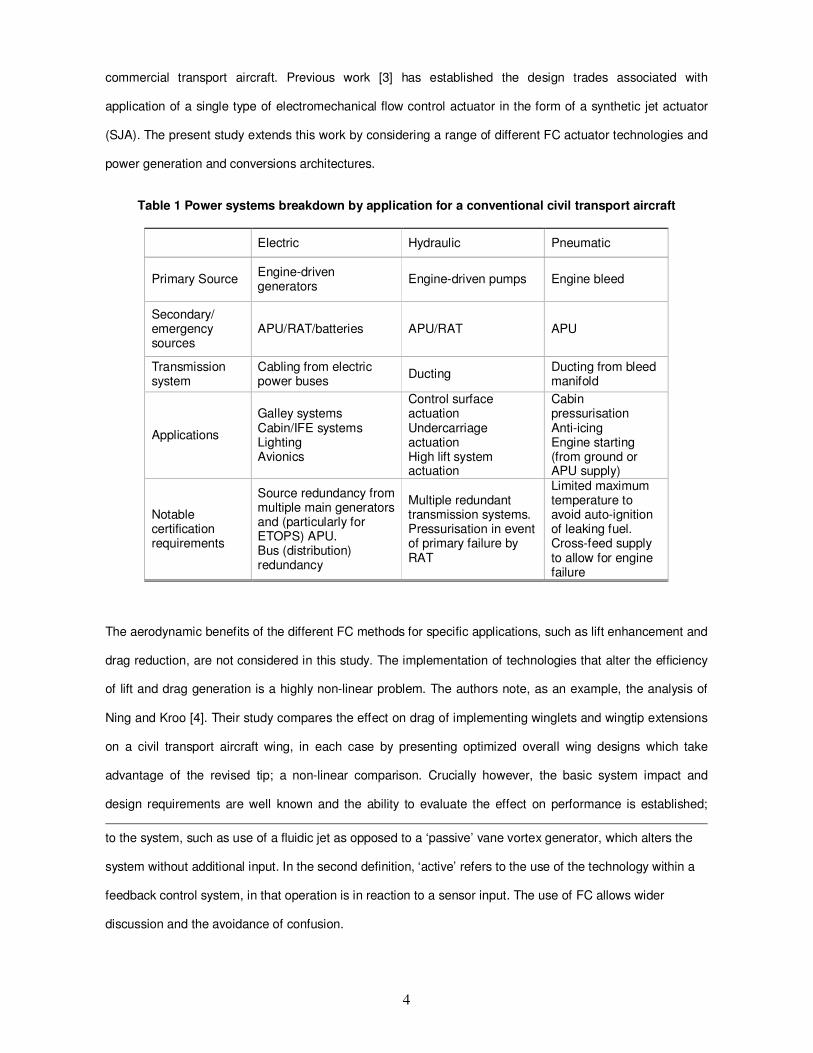
power architecture Boeing 767 which has only 180kVA, but is comparable in terms of mission. Table 1 gives
details of typical applications for each of these systems in an aircraft of conventional architecture. In the
Boeing 787, which may be considered to be representative of some future designs, all of the applications
identified here are electrically powered with the exception of engine intake anti-icing.
The purpose of the present work is specifically to allow meaningful comparisons to be made between
different flow control (FC)§ methods, in terms of mass cost and power consumption, for operation on
§ ‘Flow Control (FC)’ is used throughout in preference to ‘Active Flow Control (AFC)’. A literature study
reveals two different definitions of AFC, both of which have validity. In the first, ‘active’ refers to energy input
4
commercial transport aircraft. Previous work [3] has established the design trades associated with
application of a single type of electromechanical flow control actuator in the form of a synthetic jet actuator
(SJA). The present study extends this work by considering a range of different FC actuator technologies and
power generation and conversions architectures.
Table 1 Power systems breakdown by application for a conventional civil transport aircraft
Electric Hydraulic Pneumatic
Primary Source Engine-driven generators
Engine-driven pumps Engine bleed
Secondary/ emergency sources
APU/RAT/batteries APU/RAT APU
Transmission system
Cabling from electric power buses
Ducting Ducting from bleed manifold
Applications
Galley systems Cabin/IFE systems Lighting Avionics
Control surface actuation Undercarriage actuation High lift system actuation
Cabin pressurisation Anti-icing Engine starting (from ground or APU supply)
Notable certification requirements
Source redundancy from multiple main generators and (particularly for ETOPS) APU. Bus (distribution) redundancy
Multiple redundant transmission systems. Pressurisation in event of primary failure by RAT
Limited maximum temperature to avoid auto-ignition of leaking fuel. Cross-feed supply to allow for engine failure
The aerodynamic benefits of the different FC methods for specific applications, such as lift enhancement and
drag reduction, are not considered in this study. The implementation of technologies that alter the efficiency
of lift and drag generation is a highly non-linear problem. The authors note, as an example, the analysis of
Ning and Kroo [4]. Their study compares the effect on drag of implementing winglets and wingtip extensions
on a civil transport aircraft wing, in each case by presenting optimized overall wing designs which take
advantage of the revised tip; a non-linear comparison. Crucially however, the basic system impact and
design requirements are well known and the ability to evaluate the effect on performance is established;
to the system, such as use of a fluidic jet as opposed to a ‘passive’ vane vortex generator, which alters the
system without additional input. In the second definition, ‘active’ refers to the use of the technology within a
feedback control system, in that operation is in reaction to a sensor input. The use of FC allows wider
discussion and the avoidance of confusion.
5
there can be a high degree of confidence that wing performance can be calculated. The state of the art of FC
systems engineering has not yet reached this standard. The technology readiness level of the FC actuators
considered is currently far below that which would allow successful implementation on a transport aircraft.
There is little empirical data or developed theory on the performance of flight standard FC systems.
Recognizing that this will be an issue for the foreseeable future, the present study focuses on providing
information on the implementation costs of FC systems for where there is currently little reliable information.
This requires the assumption to be made in advance that these FC systems would be able to provide the
required flow control benefit. By choosing appropriate case studies it is possible to compare the relative
impacts of different strategies, while noting that the non-linear absolute impact of using any FC system would
not be fully captured. The conclusions drawn in terms of trends however, remain valid.
II. Flow Control Systems Architectures
A. Overview
In order to aid meaningful comparison of different FC systems, it is useful to define the overall systems
architectures required to support FC integration into civil transport aircraft. For the present study, the
reference aircraft is the Airbus A320 civil transport aircraft. The overall aircraft power systems architecture is
a series of interacting systems, comprising of power generation systems, power transformation systems,
power distribution systems and power consuming systems [5,6]. These different systems are interconnected
via exchanged energy, e.g. fuel, electric, hydraulic, pneumatic, mechanical and thermal energy.
It is proposed to classify FC systems architectures in a similar manner to the aircraft power systems
architecture. For the present work, ‘architecture’ is defined as the combination of an actuator technology and
the means of delivering power to it. A FC systems architecture specifically consists of generation,
management, distribution and actuator systems. Energy exchanges or transduction occurs at the start
(generation) and end (actuator) of the power distribution system. The actuator type is a given a priori and
thus consideration of the different actuator systems will allow for different distribution systems to be defined.
6
B. Actuator Systems
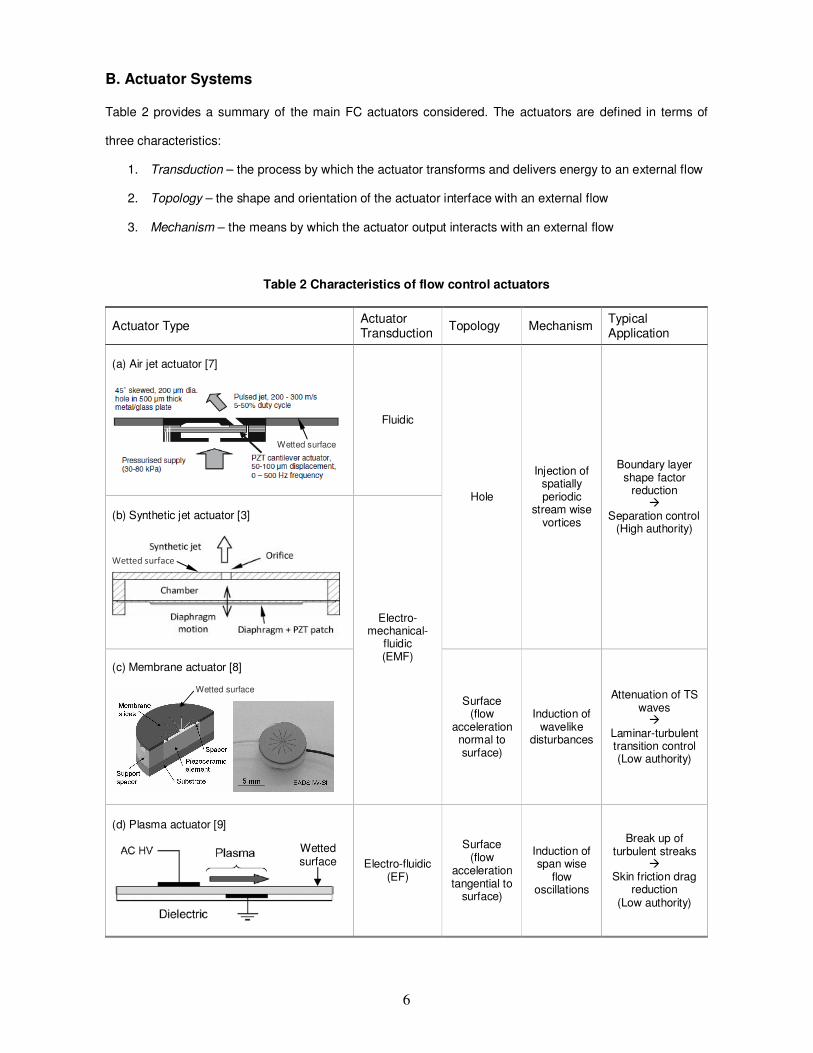
Table 2 provides a summary of the main FC actuators considered. The actuators are defined in terms of
three characteristics:
1. Transduction – the process by which the actuator transforms and delivers energy to an external flow
2. Topology – the shape and orientation of the actuator interface with an external flow
3. Mechanism – the means by which the actuator output interacts with an external flow
Table 2 Characteristics of flow control actuators
Actuator Type Actuator Transduction
Topology Mechanism Typical Application
(a) Air jet actuator [7]
Fluidic
Hole
Injection of spatially periodic
stream wise vortices
Boundary layer shape factor
reduction �
Separation control (High authority)
(b) Synthetic jet actuator [3]
Electro-mechanical-
fluidic (EMF)
(c) Membrane actuator [8]
Surface (flow
acceleration normal to surface)
Induction of wavelike
disturbances
Attenuation of TS waves �
Laminar-turbulent transition control (Low authority)
(d) Plasma actuator [9]
Electro-fluidic (EF)
Surface (flow
acceleration tangential to
surface)
Induction of span wise
flow oscillations
Break up of turbulent streaks
� Skin friction drag
reduction (Low authority)
Wetted surface
Wetted surface
Wetted surface
Wetted surface
7
In quantitative terms, the typical application of a FC system can be defined according to the actuator
authority, which is based on the ratio of actuator output velocity to the local free stream velocity. High
authority implies a velocity ratio of around 1, as required for flow separation control applications; low
authority is defined by a velocity ratio <<1, as used for transition control and skin friction drag reduction.
1. Air Jet Actuator
Air jet actuators comprise a class of devices that impart control through injection of high momentum fluid into
an external flow. A distinction may be made between ‘high authority’ blowing systems which seek to directly
modify the circulation round a lifting body usually though tangential injection and ‘low authority’ blowing
systems which seek to reduce the effects of flow separation by enhancing boundary layer mixing. The
present study focuses on the use of pulsed air jet vortex generators or pulsed jet actuators (PJA) [10]. Data
used here are from that given by Warsop et al. [7]. The actuator device is designed to generate streamwise
vortices in the boundary layer with a high velocity (200-300m/s) jet of air modulated by operation of a
piezoelectric microvalve. The energy efficiency of the air jet actuator is estimated to be around 40%, with
most of the losses due to the sudden contraction experienced by the flow moving into the actuator plenum
[11].
2. Synthetic Jet Actuator
Synthetic jet actuators (SJA) are a subset of air jet actuators that use an oscillating mechanical element in a
cavity to produce a net momentum flux in an external flow by a process similar to acoustic streaming
[12,13,14]. Like air jet actuators, SJAs seek to control flow separation by enhancing boundary layer mixing.
Example applications of SJA separation control include airfoils and bluff bodies [15,16]. Current generation
SJAs driven by commercial polycrystalline piezoelectric (PZT) diaphragms can achieve reasonably high
levels of authority (peak velocity of 150m/s), with an electrical-to-fluidic power conversion efficiency of
around 10% [3]. Polycrystalline PZT has an electrical-to-mechanical energy conversion efficiency of around
40%, whereas single crystal PZT has an equivalent efficiency of 80% [17]. Thus it could be expected that
actuator efficiency and authority could be doubled by use of bespoke single crystal PZT diaphragms in the
existing actuator designs.
8
3. Membrane Actuator
As an alternative configuration to the SJA, the oscillating mechanical element can be a flexible part of the
wetted surface, leading to the concept of an active surface or membrane actuator [8,18,19]. The impedance
mismatch at the actuator-air interface typically limits the achievable peak velocity output to a few meters per
second for practical devices. However, for applications such as transition control, the required actuator
velocity is only a few meters per second even at cruise Mach numbers; low velocity disturbances are
required to damp out the Tollmien-Schlichting (TS) waves. Therefore, the low authority of integral surface
devices in absolute terms may not be an issue.
Methods of actuating the membrane include mechanical displacement via the use of a loudspeaker and
connecting rod [19,20] and fluidic displacement via a pressurized air chamber [21]. The former requires high
maintenance and is practically unrealistic for aircraft application, while the latter requires a separate air
supply and ducting. A MEMS-based device [8] offers a viable alternative and is used as the reference
membrane actuator in this study. The device consists of a surface silicon membrane that amplifies the
displacement generated by a piezoceramic disc. The PZT material has an electromechanical coupling factor
of 0.7. With transmission losses, a power conversion efficiency of 60% can be expected. It has been shown
that the actuator is capable of influencing TS wave specific frequencies between 2.5kHz and 7.4kHz at Mach
0.33 to delay transition [22].
4. Plasma Actuator
These devices produce fluidic actuation by ionization and subsequent acceleration of the air local to the
actuator. This transduction process tends to be very inefficient, e.g. less than 0.1% electrical-to-fluidic energy
conversion efficiency [9], with most of the supplied energy dissipated as heat as a result of the ionization
process rather than fluidic kinetic energy. Practically, actuator authority is relatively low, e.g. peak velocities
of the order of a few meters per second. This makes plasma actuators a potential candidate technology for
applications such as turbulent skin friction drag reduction. Previous work has shown that surface plasma
actuators applied in a turbulent boundary layer are capable of achieving drag reductions of up to 45% [23].
Plasma actuators have a unique advantage in that the transduction process requires no moving parts, which
is significant from a maintenance point of view. Additionally, the actuators can be manufactured to be very
9
thin meaning that retrofit on existing aircraft skins is possible without major structural redesign. Moreau [9]
provides a recent review of the literature on plasma actuators. The reference actuator considered is the
surface dielectric barrier discharge (DBD) plasma actuator [24,25], which consists of two thin aluminum foil
electrodes flush mounted across a Plexiglas (PMMA) dielectric layer.
C. Power Distribution Systems
A true appreciation of the costs of a proposed FC actuator can only be gained by considering how energy
supply to the actuator may be achieved within the framework of the aircraft’s existing power systems
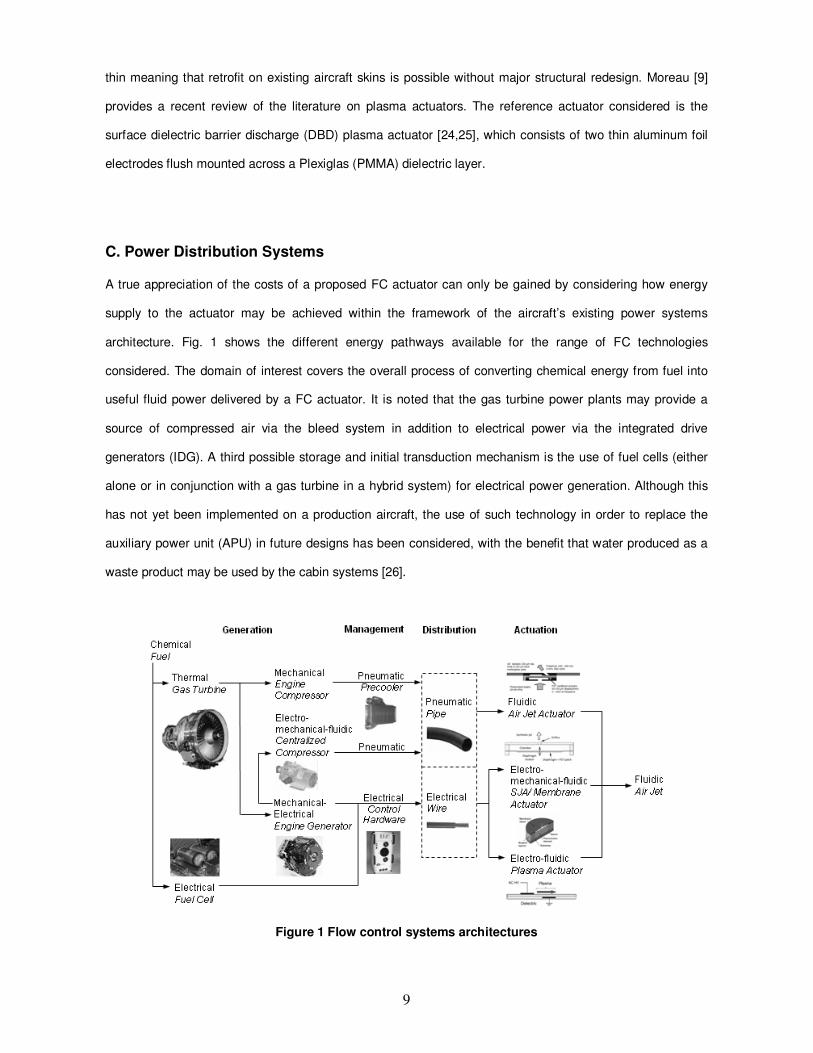
architecture. Fig. 1 shows the different energy pathways available for the range of FC technologies
considered. The domain of interest covers the overall process of converting chemical energy from fuel into
useful fluid power delivered by a FC actuator. It is noted that the gas turbine power plants may provide a
source of compressed air via the bleed system in addition to electrical power via the integrated drive
generators (IDG). A third possible storage and initial transduction mechanism is the use of fuel cells (either
alone or in conjunction with a gas turbine in a hybrid system) for electrical power generation. Although this
has not yet been implemented on a production aircraft, the use of such technology in order to replace the
auxiliary power unit (APU) in future designs has been considered, with the benefit that water produced as a
waste product may be used by the cabin systems [26].
Figure 1 Flow control systems architectures
10
The key system in terms of overall aircraft design is the distribution system, which connects the generation
system to the actuator system. The distribution system may be pneumatic, electric or some combination of
the two. It is worth noting that power distribution systems will already be present on the aircraft and these will
give an indication of the likely system design parameters and certification requirements for the FC
distribution system, and the possibility of deriving synergistic benefits from its shared use.
Pneumatic distribution gives rise to direct bleed based flow control in which compressed air can be used to
directly power air jet actuators. Hot bleed air piped from the engine off-take requires power management in
the form of precooling before passage to the actuator plenums.
Electric distribution is required for SJAs, membrane actuators and plasma actuators. Before electrical power
can be distributed from the IDG to the actuators, it needs to be regulated, conditioned, and if necessary,
converted. This is the function of the power management system, of which a detailed overview is given in
[27]. The IDG for an Airbus A320 supplies 115VAC, 400Hz, three-phase power. The advantage of running
the electrical system at 400Hz rather than 50/60Hz is that the power generation systems are smaller and
lighter. As a result, FC actuator systems electronics must either be designed to operate with a 400Hz supply
or the power must be converted to low frequency, single phase supply. While many aircraft electrical loads
can run directly from high-frequency 3-phase supply, FC actuators will require dedicated power electronics.
In this study, the power management system comprises:
� Generator control unit (GCU) – regulates supply voltage and frequency
� Electronic load control unit (ELCU) – trip devices that provide electrical load protection
� Transformer rectifier unit (TRU) – converts 3-phase 115VAC to 28VDC for FC electronics
� Power amplifiers and high voltage (HV) power transformers
An alternative is a hybrid approach that utilizes both electric and pneumatic distribution. This solution uses
one or more electrically driven air compressors to generate compressed air locally to the FC actuators. The
actuators themselves are identical to those considered for pneumatic systems (i.e. air jet actuators). The
advantage over native pneumatic systems is that engine bleed air is not required and therefore it may be
possible to provide the required flow control effectiveness at low engine throttle settings, assuming that
generator power is available.
11
It may be argued that the length and therefore mass of piping required in the hybrid approach may be
reduced by utilizing several electrical compressors to source air locally to the actuators, rather than a single
centralized compressor. This advantage would only come to fruition, if (under the assumption that the
relative mass costs are less for electrical distribution compared to pneumatic distribution), the piping is
eliminated completely by performing transduction to fluidic power at the point of actuation, i.e. equipping
each air jet actuator with its own compressor for air supply. This architecture would be similar to the
distributed EMF and EF architectures associated with SJAs/membrane actuators and plasma actuators
respectively. The problem with this approach however is that, in common with electrical machinery,
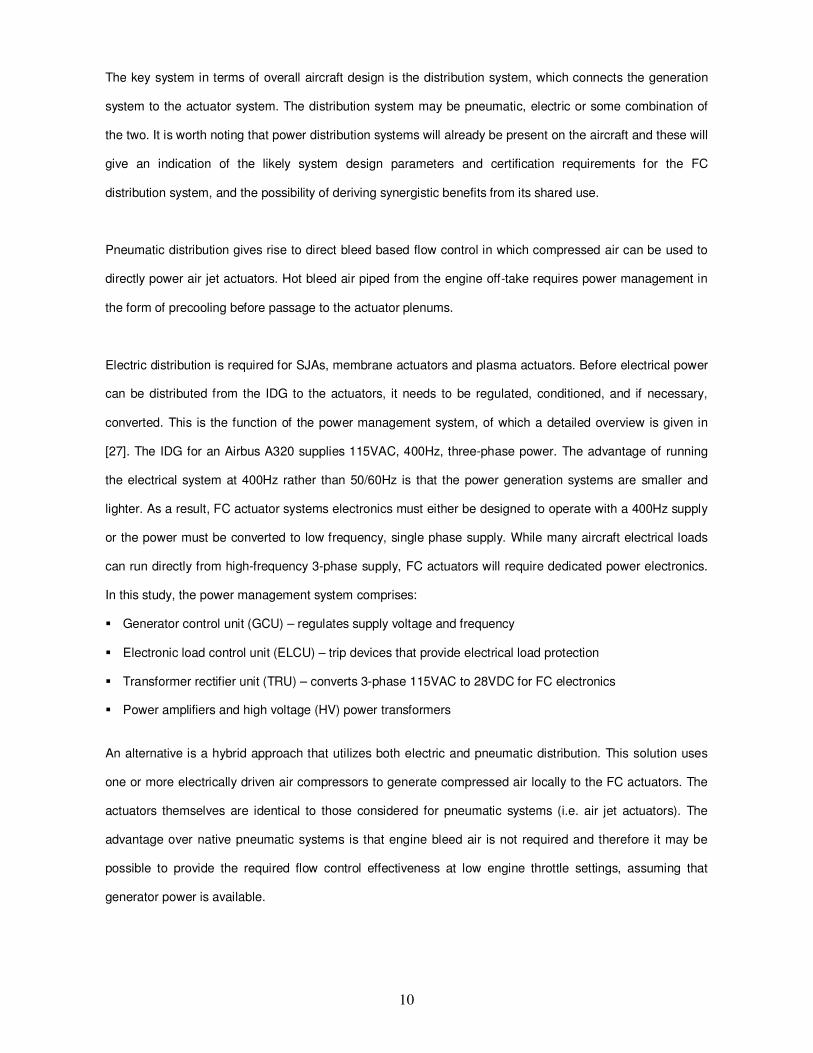
compressor mechanical efficiency scales with physical size, as shown in Table 3. Efficiency is approximately
5% at the scale required to utilize a high compressor-to-actuator ratio, compared to 85% by utilizing a
centralized, ‘macro-scale’ compressor. The efficiency of using a compressor at ‘micro-scale’ is approximately
half that associated with SJAs for high authority flow control. For this reason, the ‘hybrid’ architecture in the
present study is considered in terms of a single, centralized electrical air compressor.
Table 3 Comparison of compressor specifications at different scale
a Example application is for an A320 aircraft trailing edge flap (full span) separation control (2000 actuators;
100g/s mass flow rate).
Size Mass Flow (g/s)
Mechanical Efficiency
Actuators per
compressora
Micro-scale [28] 8mm diameter
0.36 ~5% 7
Meso-scale [29] 25mm diameter
2.4 ~50% 50
Macro-scale [30] 200mm diameter
53 ~85% 1000

12
D. Section Summary
From this work it is possible to identify five distinct FC systems architectures, as summarized in Table 4. For
simplicity, each architecture is referred to by the ID number from hereon.
Table 4 FC systems architecture ID
III. Research Methodology
A. System Modeling Approach Requirements
The type of model used has a significant effect on the type of questions that the model can be used to
answer. A requirement of this work was that the model could be used to understand the effect of using
different FC architectures on the overall system mass. This lead to the choice of a low order, largely physics
based modeling approach which is not necessarily very accurate, but is fast and transparent [3]. This
approach is sufficient to make informed choices between competing architectures for a given application,
with the expectation that this choice is followed up with more engineering analysis using higher order models
at a later stage.
B. Flow Control System Mass Model
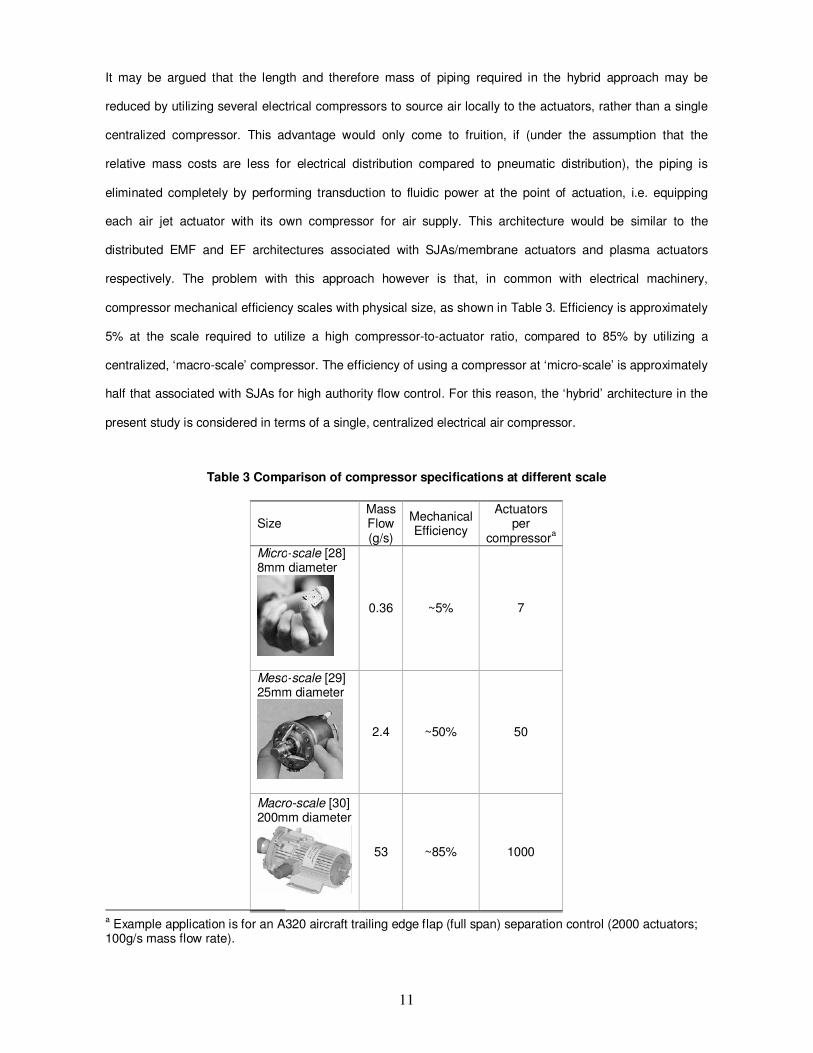
The mass model used for the present work is illustrated by the schematic in Fig. 2. The key model inputs are
related to system hardware, system energy usage and aircraft parameters. The model mathematical
structure is defined in Equation 1. The overall FC systems mass cost is made up of the sum of the mass cost
of the FC system hardware and the mass cost of the energy used by the system. In order to produce a
ID Generation Distribution Actuator
1 Engine bleed Pneumatic
Air jet actuator 2
Electrical air compressor
3
Electrical generator
Electric
Synthetic jet actuator
4 Membrane actuator
5 Plasma actuator
13
scalable model, an assumption is made that mass of cost of the hardware is proportional to the power
flowing through the system. This means that generation, management distribution and actuation systems are
defined by power specific masses mw, with units of kg/kW. The energy usage term is the mass of fuel used
to supply the required power for the duration of operation of the FC system, as calculated from the power
specific fuel consumption of the generator system, Wgm& .
Figure 2 Schematic of flow control mass model system parameters
(1)
WF represents the fluidic output power of the FC system from an array of FC actuators and η is the overall
power efficiency of that system. Changing power efficiency has two different effects in the mass model. The
primary effect is that by increasing efficiency, the overall power flow through the system is reduced (first term
on the RHS in Equation 1), and everything else remaining equal, the overall system mass decreases.
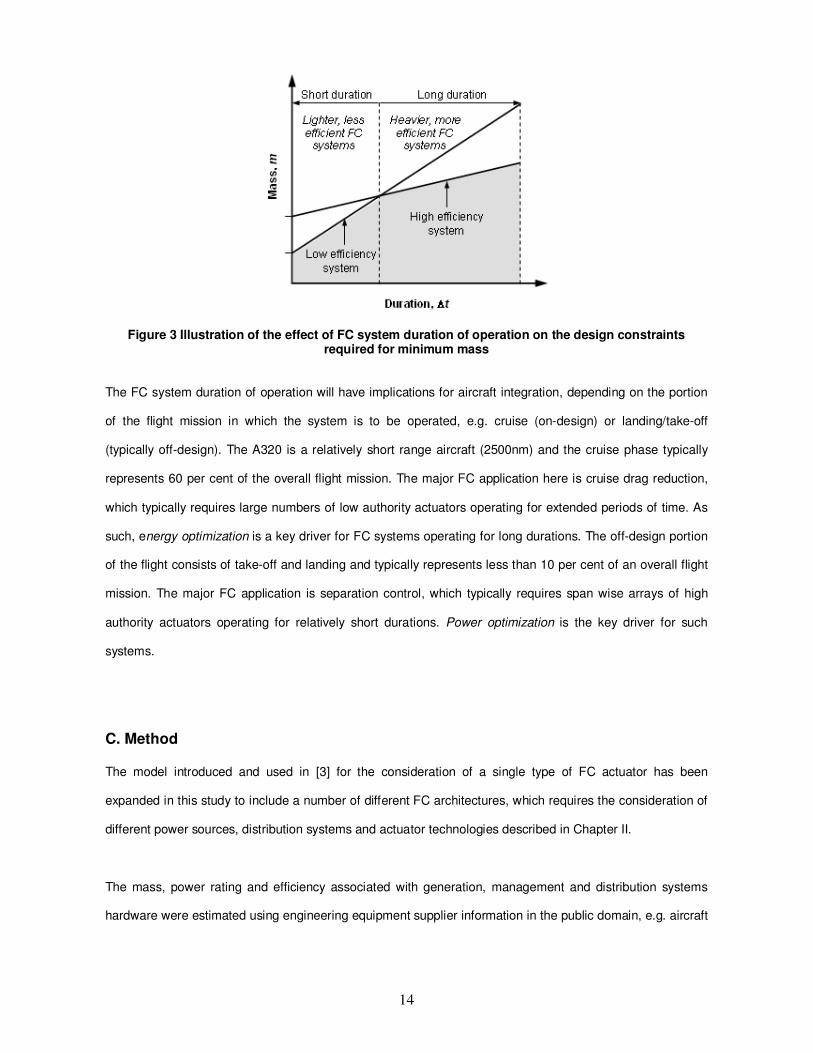
However, it is important to understand how this efficiency is achieved, since typically there is a trade
between system power specific mass and the efficiency (more power efficient systems typically require more
advanced technology and/or higher specification components which are typically heavier). To account for
this, the mass model allows the power specific masses to be functions of efficiency. To illustrate the
implications of this, Fig. 3 shows how the overall mass cost of a FC system varies with the duration of
operation of the system for two different power efficiencies. For short duration operation, minimum mass will
typically be driven by using lighter but less efficient systems, whereas for long duration operation the
minimum mass solution will be obtained by more efficient but heavier systems.
[ ]tmmW
m WgWF ∆+Σ= &)(η
η
FC SYSTEM
MASS MODEL
System hardware
Overall mass, m
Consumed power, WF / η
Drag, D
� Mass
� Power rating
� Efficiency, η
Energy usage
� SFC, mwg
� Duration, ∆t
mfuel
mw
WF
Aircraft parameters
� Free stream conditions
� Chord wise and span wise extent of actuator array
Standalone System
Aircraft Scaled System
Flow control parameters
� Actuator authority
� Non-dimensional orifice diameter and spacing
No. of actuators, n
14
Figure 3 Illustration of the effect of FC system duration of operation on the design constraints required for minimum mass
The FC system duration of operation will have implications for aircraft integration, depending on the portion
of the flight mission in which the system is to be operated, e.g. cruise (on-design) or landing/take-off
(typically off-design). The A320 is a relatively short range aircraft (2500nm) and the cruise phase typically
represents 60 per cent of the overall flight mission. The major FC application here is cruise drag reduction,
which typically requires large numbers of low authority actuators operating for extended periods of time. As
such, energy optimization is a key driver for FC systems operating for long durations. The off-design portion
of the flight consists of take-off and landing and typically represents less than 10 per cent of an overall flight
mission. The major FC application is separation control, which typically requires span wise arrays of high
authority actuators operating for relatively short durations. Power optimization is the key driver for such
systems.
C. Method
The model introduced and used in [3] for the consideration of a single type of FC actuator has been
expanded in this study to include a number of different FC architectures, which requires the consideration of
different power sources, distribution systems and actuator technologies described in Chapter II.
The mass, power rating and efficiency associated with generation, management and distribution systems
hardware were estimated using engineering equipment supplier information in the public domain, e.g. aircraft
15
onboard equipment such as engine electric generators, high pressure pipes, wiring and amplifiers (see
Appendix I for a more detailed overview). Estimates of the mass, power and efficiency of the FC actuators
were made based on existing laboratory technology. To compare the mass costs for different methods of
power distribution, analytical physics of pipe/wire theory is coupled with the engineering constraints of
integrating these distribution systems into an A320 aircraft. Detailed derivations of the power distribution
theory and assumptions on the systems data and constraints are given in Appendix II.
The systems hardware data is required to evaluate the power specific mass, mw for each system. The overall
power specific mass permits relative comparisons between different FC systems architectures in terms of
systems mass per unit power flow through the system (kg/kW). Power specific mass is also an input
parameter of the mass model (Fig. 2), permitting absolute values of overall system mass and power
consumption for different FC systems architectures to be calculated at aircraft full-scale.
D. Case Study Analysis
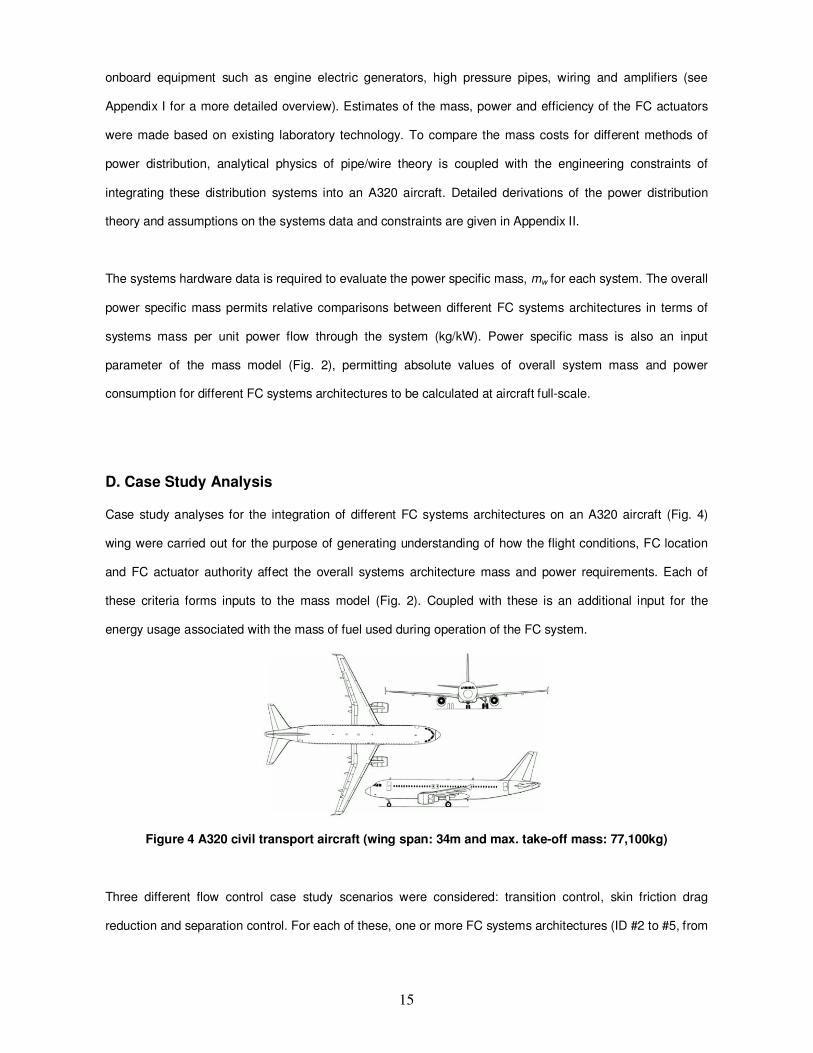
Case study analyses for the integration of different FC systems architectures on an A320 aircraft (Fig. 4)
wing were carried out for the purpose of generating understanding of how the flight conditions, FC location
and FC actuator authority affect the overall systems architecture mass and power requirements. Each of
these criteria forms inputs to the mass model (Fig. 2). Coupled with these is an additional input for the
energy usage associated with the mass of fuel used during operation of the FC system.
Figure 4 A320 civil transport aircraft (wing span: 34m and max. take-off mass: 77,100kg)
Three different flow control case study scenarios were considered: transition control, skin friction drag
reduction and separation control. For each of these, one or more FC systems architectures (ID #2 to #5, from
16
Table 4) were analyzed. The case study scenarios were developed based around high-speed (cruise) and
low-speed (take-off and landing) flight conditions, as defined in [3]. Chord wise location and span wise extent
of FC actuator arrays for the slat, flap and wing main element and the related operating duration are also the
same as those defined in [3]. The power requirement of a specific FC actuator application depends on the
local flow conditions. The actuator layout and equations for the power delivery from each FC actuator system
have been derived, as shown in Appendix III.
To place the quantitative outputs of the case studies into context, FC system power consumption is
represented as a percentage of the available power supplied from a single engine generator. The drag cost
associated with this power off-take is, for cruise flight FC applications, represented as a percentage of the
A320 cruise drag (estimated from an assumed lift-to-drag ratio of 18 in the ‘clean’ configuration). Overall
mass for FC systems applied on the main element are represented as a percentage of the A320 maximum
take-off weight (MTOW). For slat and flap applications, FC system mass is represented as a percentage of
the slat and flap mass respectively. Slat and flap mass were calculated according to an empirical method
[31] coupled with slat and flap configuration data [32], yielding values of 405kg and 638kg respectively.
A number of important assumptions are made for each case study analysis:
� Each case study only takes into account the cost of FC implementation (mass, power consumption and
drag penalty). The impact benefits such as reduced drag and increased maximum lift are not considered.
� Given that all the present case study analyses are considered for aircraft wing application, the reference
length for distribution lines (i.e. pipes and wires) is based on the A320 wingspan, i.e. 34m.
� Redundancy is not accounted for in the present study in that only single power sources and single lanes
of pipes and wires are considered. This will not affect evaluation of the overall system power specific
masses, but it will have an impact on absolute values of overall mass and power consumption subject to
the levels of redundancy that would be required to satisfy system certification.
� Thermal management of electrically powered systems is not accounted for in the present study. However,
in some instances, cooling forms an integrated part of the component, e.g. use of heat sinks.
� Since the energy losses for each FC systems architecture are dominated by losses in the actuator
transduction process, it was decided for reasons of simplicity to set all power efficiency terms apart from
the actuator efficiency to unity. This is a reasonable assumption given that:

17
− Aircraft engine generator (IDG) and electrically-driven compressor efficiencies ~85%
− GCU and TRU systems efficiencies ~95%; power amplifier efficiencies ~75-80%
− Pneumatic pipe and electric cable efficiencies ~85% and ~99% respectively
As such, the overall power efficiency of the system, η, which is required to calculate the overall system
mass (Equation 1), is equal to the actuator efficiency.
� For architecture #2, pulsed jet operation is considered for the actuation system. The duty cycle,
representing the ratio of the jet time ‘on’ to time ‘off’ typically varies between 10% and 50% [7]. A duty
cycle of 25% is assumed in this study.
� For architecture #3, it is assumed that SJAs are capable of achieving sonic output velocities to meet a
target velocity ratio of 1 for high authority separation control applications.
A sensitivity analysis was conducted to investigate the variation of the systems architecture overall mass and
power consumption with variation in overall system (actuator) power efficiency. The effect of a 10%
uncertainty in overall efficiency was considered for each systems architecture. Table 5 summarizes the
sensitivity analysis in terms of the uncertainty generated in overall mass and power consumption for the
different architectures. Power consumption scales directly with system efficiency (first term on the RHS in
Equation 1) and therefore a 10% increase in overall efficiency results in a 10% reduction in the overall power
required by the FC system. The overall system mass also reduces by 10%, plus a smaller gain as shown in
Table 5 due to the relatively reduced actuator mass (recall that the mass model allows power specific
masses to be functions of efficiency and therefore for this study, the actuator power specific mass will also
vary by 10%). A 10% uncertainty in overall system power efficiency yields variations in the overall system
mass between 10% and 12% for the different architectures.
Table 5 Sensitivity analysis of FC system efficiency on overall system mass and power
ID Overall Efficiency
Uncertainty (± 10%)
Mass Power
2 40% ± 4% ± 12.1% ± 10%
3 10% ± 1% ± 12.2% ± 10%
4 60% ± 6% ± 10.3% ± 10%
5 0.1% ± 0.01% ± 10.2% ± 10%
18
IV. Results
A. Comparison of Different Power Distribution Methods
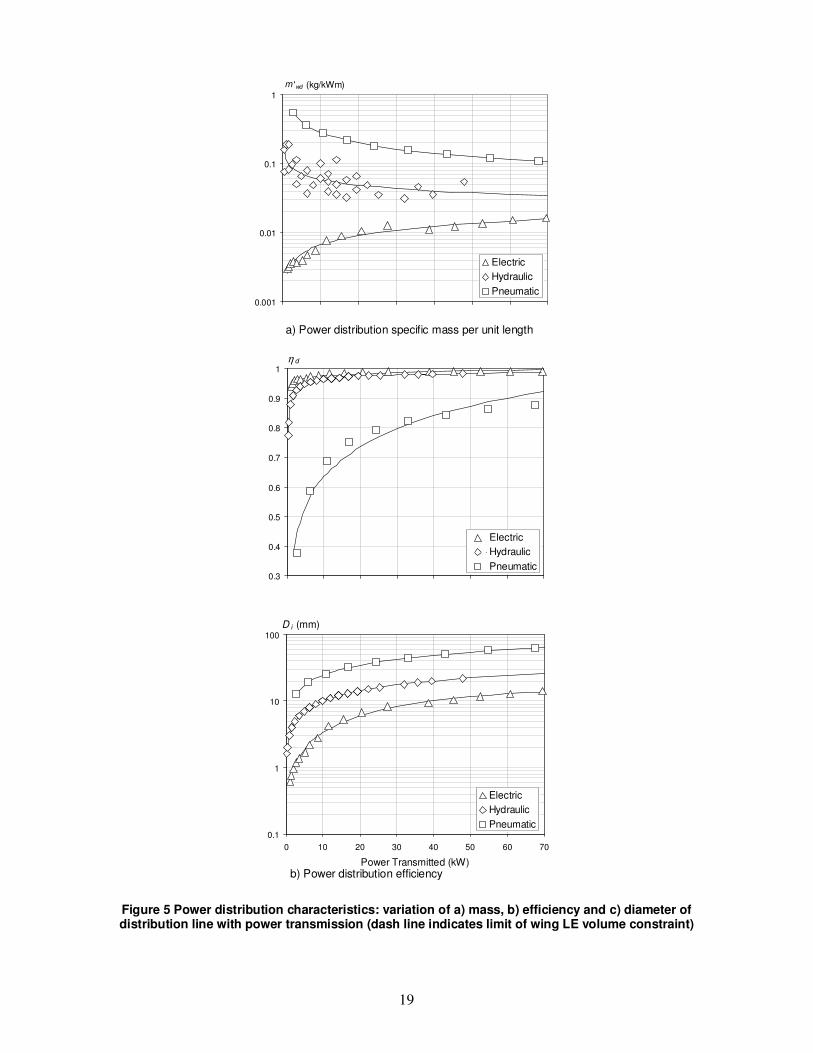
A comparison of the mass costs of electric and pneumatic distribution as a function of transmitted power is
presented in Fig. 5a. Scatter arises in the data from the use of commercially sourced pipes and wires that
are only available in discrete sizes. The mass cost of hydraulic distribution is also included for reference
given their extensive use on commercial aircraft.
The results show that there is a large difference in the mass costs associated with different distribution
systems, especially for transmission of relatively low power. The mass cost of transmitting 5kW of power
pneumatically is approximately two orders of magnitude greater than doing so electrically. This disparity
reduces with increasing power transmitted. For example, the ratio of mass costs between electric, hydraulic
and pneumatic distribution at 10kW is approximately 1:8:35 and at 50kW, the ratio is 1:3:9. For electric
distribution, the mass cost increases with power transmitted. This is due to the weight of the copper wire
increasing (for a higher current carrying capacity) at a faster rate than the power that can be transmitted.
Hydraulic and pneumatic distribution show reducing mass cost trends with power transmitted. For pneumatic
distribution, wall thickness is fixed (constrained by maximum bleed pressure of the system, as detailed in
Appendix II) hence increasing internal pipe diameter improves power transmission relative to pipe mass.
Variation of distribution efficiency with power transmission type is shown in Fig. 5b. All power losses used to
evaluate efficiency are scaled on a distribution length equivalent to the A320 wing span. The efficiencies for
all methods of distribution are relatively high, and increase with the amount of power transmitted. To transmit
high power electrically, a bundle of smaller cables is a more mass efficient approach compared to using a
single large cable due to practical issues of insulation and heat transfer. For pneumatic distribution, it is more
mass efficient to use the largest diameter pipe that can be accommodated in a given volume.
Fig. 5c shows the power transmission capacity of various diameter cables and pipes. The ratio of diameters
between electric, hydraulic and pneumatic distribution for 10kW of power is approximately 1:3:7 and 1:2:4 for
50kW of power. For the present study, maximum power distribution for a 36psi pneumatic system is limited
to 50kW based on the maximum pipe diameter that can be accommodated in the wing leading edge.
19
Figure 5 Power distribution characteristics: variation of a) mass, b) efficiency and c) diameter of distribution line with power transmission (dash line indicates limit of wing LE volume constraint)
0.001
0.01
0.1
1
0 10 20 30 40 50 60 70
m 'wd (kg/kWm)
Electric
Hydraulic
Pneumatic
0.3
0.4
0.5
0.6
0.7
0.8
0.9
1
0 10 20 30 40 50 60 70
η d
Electric
Hydraulic
Pneumatic
0.1
1
10
100
0 10 20 30 40 50 60 70
Power Transmitted (kW)
D i (mm)
Electric
Hydraulic
Pneumatic
a) Power distribution specific mass per unit length
b) Power distribution efficiency
20
Results from this study show that electrical power distribution has clear benefits over pneumatic power
distribution for FC applications in terms of reduced mass, higher overall efficiency and reduced installed
volume for the same power transmitted. These findings are consistent with the perceived move towards the
MEA concept. In particular, decentralization of pneumatic FC systems is in line with future expectations for
decentralization of fluidic systems. For example, existing hydraulic systems utilizing a single centralized
pump and hydraulic pipes are proposed to be replaced with electric wires and localized pumps in the form of
electrohydrostatic actuators close to the point of application, e.g. flight control surfaces [33].
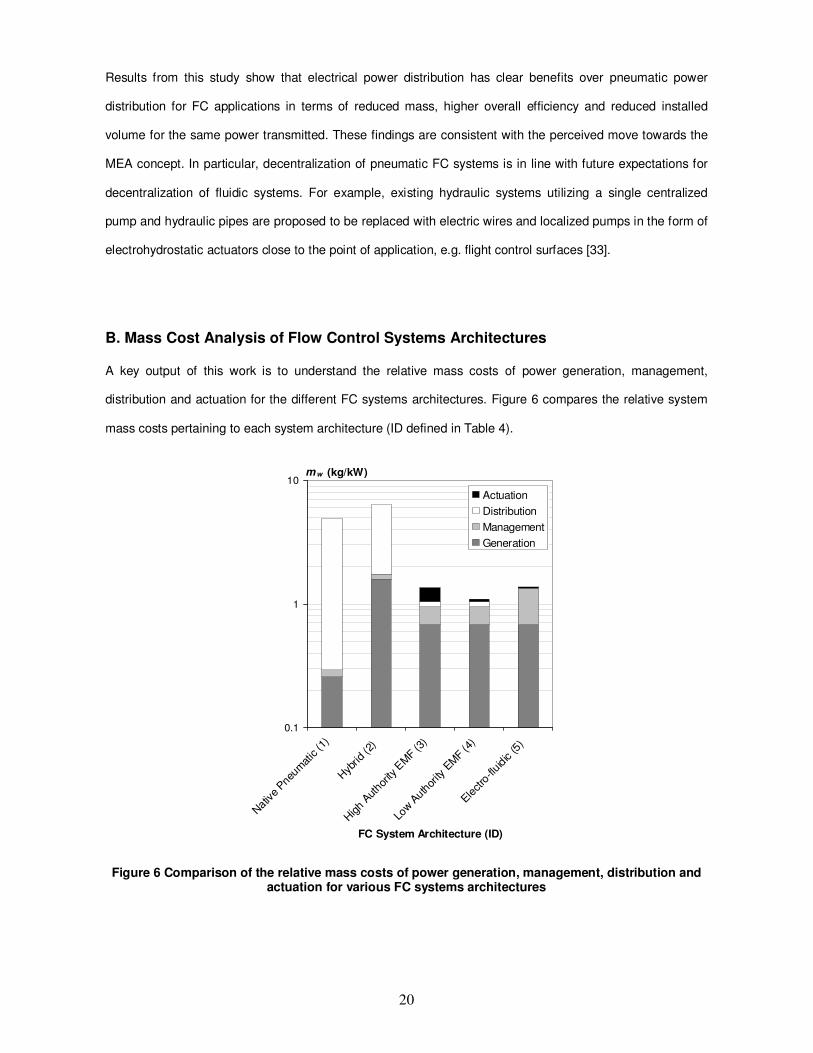
B. Mass Cost Analysis of Flow Control Systems Architectures A key output of this work is to understand the relative mass costs of power generation, management,
distribution and actuation for the different FC systems architectures. Figure 6 compares the relative system
mass costs pertaining to each system architecture (ID defined in Table 4).
Figure 6 Comparison of the relative mass costs of power generation, management, distribution and actuation for various FC systems architectures
0.1
1
10
Nativ
e Pne
umat
ic (1
)
Hyb
rid (2
)
High
Author
ity E
MF
(3)
Low A
uthor
ity E
MF (4
)
Electro
-fluid
ic (5
)
FC System Architecture (ID)
mw (kg/kW)
Actuation
Distribution
Management
Generation
21
The power specific mass for the native pneumatic system (architecture #1) is estimated to be 5kg/kW. That
is, 5kg of system hardware required per 1kW of power flow through that system. To consider the system as
fully pneumatic, continuous blowing is assumed such that electrically operated pulsed microvalves need not
be considered. Of the overall power specific mass, approximately 95% of the mass cost is due to distributing
air from the engine bleed manifold to the actuator orifice exits. In comparison, the mass costs of generating
and managing the bleed air combined with actuation (as continuous blowing is assumed, the actuator
elements consist of very simple passive plenum/nozzle devices) is relatively small (5%).
For the hybrid system (architecture #2), the overall power specific mass cost is approximately 6kg/kW. As
with architecture #1, continuous blowing is assumed and the largest mass cost is incurred in distribution
(75% of the total mass cost). The higher overall systems mass cost relative to architecture #1 is due to the
power generation system, which encompasses the electrically driven air compressor in addition to the IDG.
Fig. 6 shows that the overall power specific mass for the high authority EMF system (architecture #3) is
1.3kg/kW. The smaller cost relative to architectures #1 and #2 is due to the different method of power
distribution, i.e. electric, as opposed to pneumatic distribution. Approximately 50% of the mass cost is due to
the provision of power generation capacity. Power management and actuator systems each contribute 20%
of the overall mass cost.
The power specific mass for the low authority EMF system (architecture #4) is just over 1kg/kW (1.1kg/kW).
The system cost is the lowest of all the FC systems architectures considered. Mass costs of generation,
management and distribution are identical to those for architecture #3. By comparison, the mass cost of
actuation is smaller due to the combination of a much smaller actuator mass and larger power rating
(Appendix I).
Finally, Fig. 6 shows that the overall power specific mass for the electro-fluidic system (architecture #5) is
1.4kg/kW. This value is comparable to the other electrically-based systems architectures (#3 and #4). By
comparison, there is a larger mass penalty to pay in power management for transforming the aircraft supply
voltage to a higher level. This penalty is offset, however, by the lower mass costs associated with distributing
high voltages (tens of kilovolts), since this reduces the current-carrying capacity and hence mass of wire
needed. Fig. 6 shows that architecture #5 has a lower distribution cost than architectures #3 and #4.

22
Architecture #5 also has the lowest actuation mass cost by virtue of the thin sheet nature of the dielectric
layer and plasma electrodes.
Existing systems and components inherent to commercial aircraft typically have values of power specific
mass less than 1kg/kW. Examples for an A320 include the APU (Honeywell GTCP 36-300A; 140kg, 291kW)
= 0.48kg/kW, IDG (Sundstrand 90kVA; 61kg; 90kW) = 0.68kg/kW and fuel boost compressor (Eaton; 9.1kg;
10kW) = 0.91kg/kW. Clearly there is benefit to be gained in reducing the overall power specific mass of a
system in order to reduce absolute mass costs and existing practice would suggest a target power specific
mass kg/kW ~ O(0.1) for FC systems. Fig. 6 shows that each FC architecture has overall power specific
masses of an order of magnitude greater than existing aircraft systems, although those for architectures #3,
#4 and #5 are at unity. On this evidence, electrical power distribution presents the most competitive mass
cost option for FC systems architecture integration on civil transport aircraft.
C. A320 Flow Control Case Studies
1. Overview
Results of three different FC case study scenarios are presented in each of the subsequent sections. Mass
breakdown and power off-take of the systems architectures are presented for each case. In addition, drag
costs associated with the system power off-take for cruise flight FC applications (transition control and skin
friction drag reduction) are included.
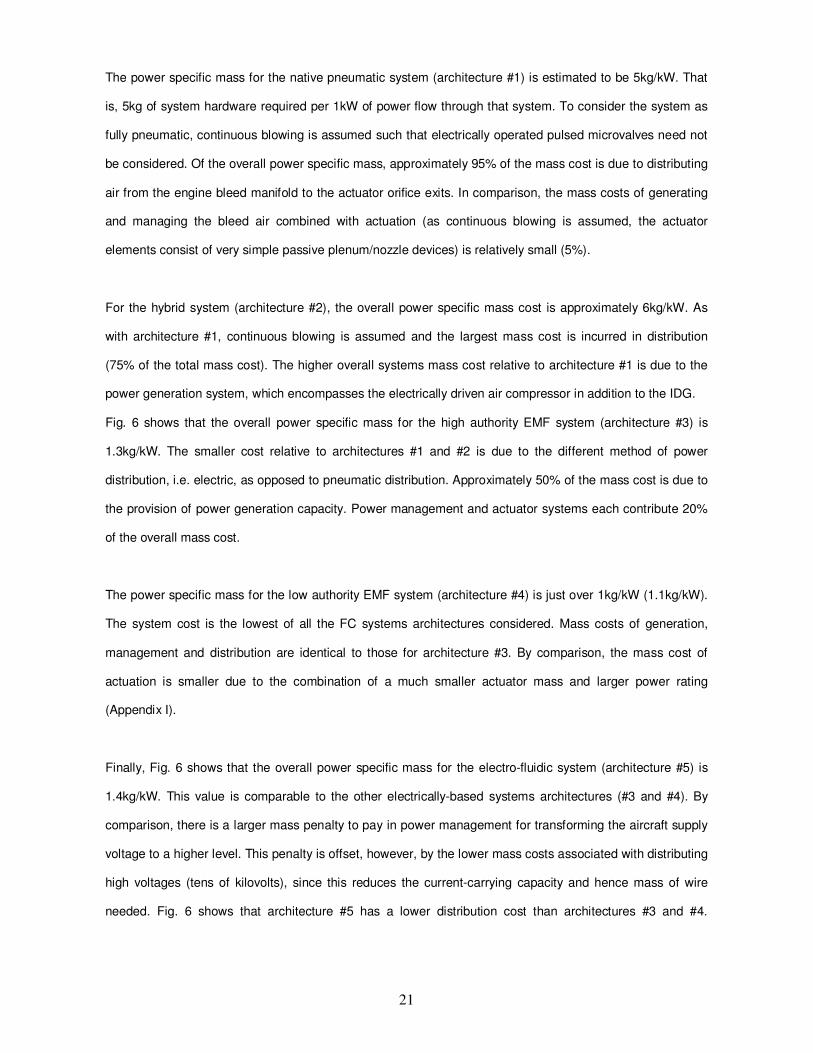
2. Laminar-Turbulent Transition Control: Systems Architecture #4
Fig. 7 shows the mass breakdown of systems architecture #4 for transition control via the use of membrane
actuators. The total systems architecture mass is approximately 10kg, which is equivalent to 0.01% of A320
MTOW. One fifth of this is taken up by the fuel mass required for the duration of operation of the FC system.
Table 6 shows the associated systems architecture power off-take and drag cost. The drag cost establishes
the minimum performance benefit necessary from the FC actuators in order for the overall systems
architecture to break even, i.e. the point at which further improvements in performance can start to have a
23
positive effect on the overall aircraft. Power off-take is equivalent to 6kW or 7% of power supplied from an
IDG off a single engine. The drag cost is 24N or 0.06% of the A320 cruise drag.
A point to note is that the A320 wing is a swept wing with cross flow (CF), as well as Tollmien-Schlichting
(TS) waves dominated transition. Additionally, the transition location for this (turbulent) wing occurs at
approximately 5% of the chord length. Therefore, successful application of this system would realistically
require operation on a low sweep (laminar) wing or operation on the existing swept wing with suction at the
wing leading edge to suppress CF instabilities [16]. The latter, of course, would bring in additional
requirements for vacuum pumps and pneumatic pipes.
0
1
2
3
4
5
Gen
erat
ion
Man
agem
ent
Distri
butio
n
Actua
tion
Fuel
Mass (kg)
Figure 7 Mass breakdown of systems architecture #4 for transition control
Table 6 Systems architecture #4 power off-take and drag cost for transition control
Application Power Drag
Transition control (wing main element) 600 actuators
6kW (7% IDG)
24N (0.06% cruise drag)
SYSTEMS ARCHITECTURE MASS: ~10kg (0.01% MTOW)
24
3. Turbulent Skin Friction Drag Reduction: Systems Architecture #5
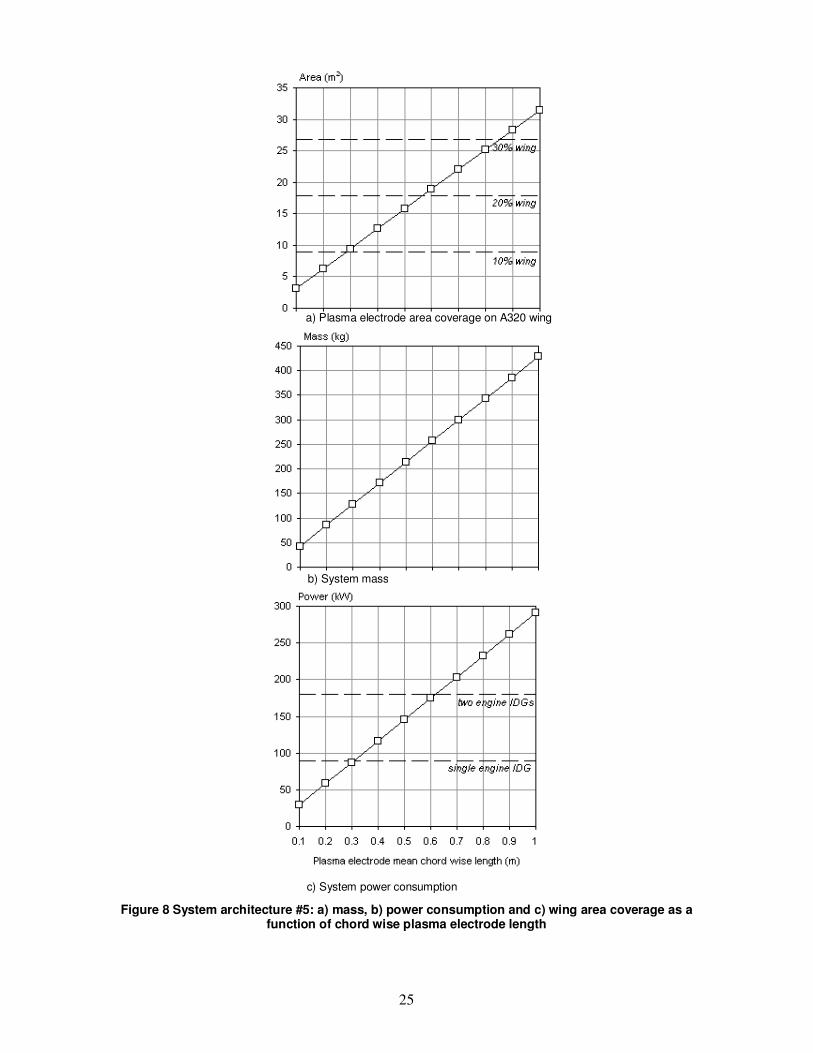
Fig. 8 shows the actuator surface area coverage, system mass and power consumption as a function of the
mean chord wise length of the plasma electrode actuator array. There is some uncertainty of the stream wise
(chord wise) extent over which the plasma electrodes should be applied. In essence, the plasma actuator
behaves as an active riblet and therefore the application of plasma actuators can be considered similar to
that of riblets on the A320 in the late 1980s and early 1990s [Kwing-So, University of Nottingham,
unpublished communication].
The geometry of a practical plasma actuator is defined in detail in Appendix III. Fig. 8a shows that an array of
plasma actuators (750 in total), each with a mean chord wise electrode length of 1m, would cover
approximately 32% of the A320 wing upper surface. This level of coverage equates to a total system mass of
429kg (Fig. 8b). The power consumption associated with this area coverage is in excess of what can be
provided on an A320. For a 1m mean chord wise electrode length, the power consumption is almost 300kW
(Fig. 8c), which is equivalent to the power supplied from three IDGs.
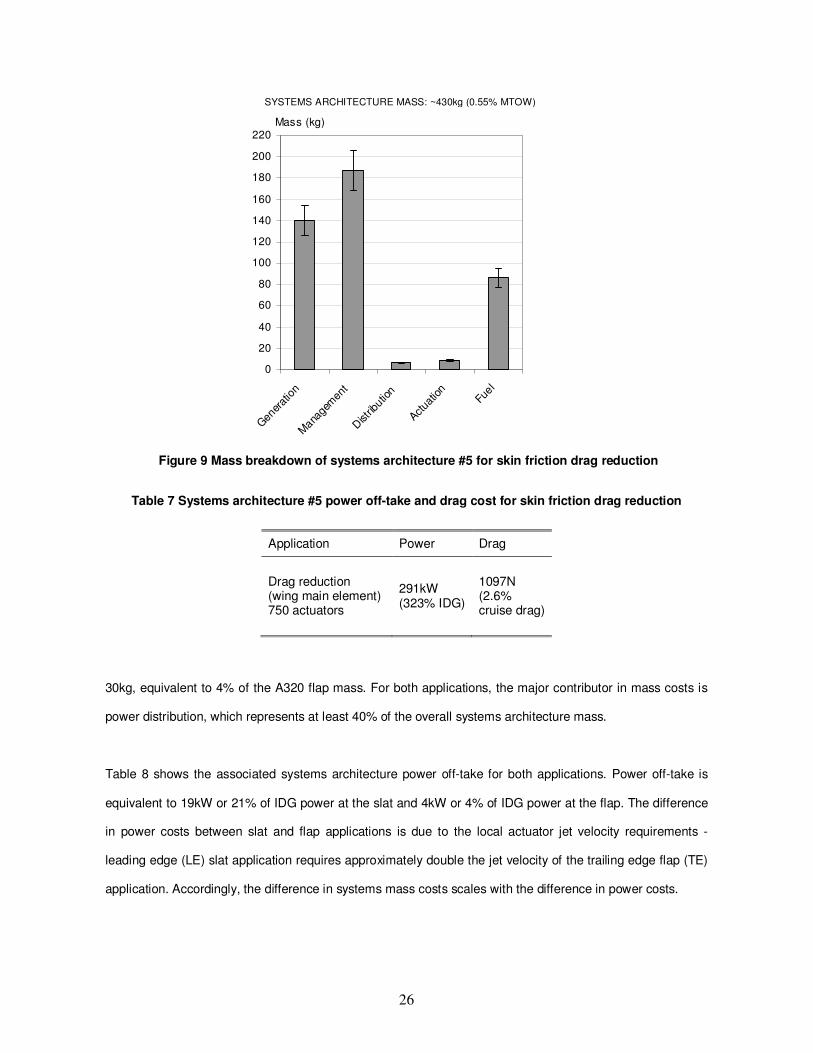
Fig. 9 shows the mass breakdown of systems architecture #5 for skin friction drag reduction using plasma
actuators with a 1m chord wise electrode length. The total systems architecture mass is approximately
430kg, equivalent to 0.55% MTOW. This system mass is split almost evenly between power generation and
management systems. In addition, there is a high fuel cost (~85kg) associated with the operation of this
system. The high systems mass cost is due to the inefficient transduction process relative to other actuator
technologies (plasma actuators with 0.1% electrical-to-fluidic energy conversion efficiency).
Table 7 shows the associated systems architecture power off-take and drag cost. Power off-take is
equivalent to 291kW or 323% of power supplied from a single IDG and the drag cost is 1097N or 2.6% of
cruise drag.
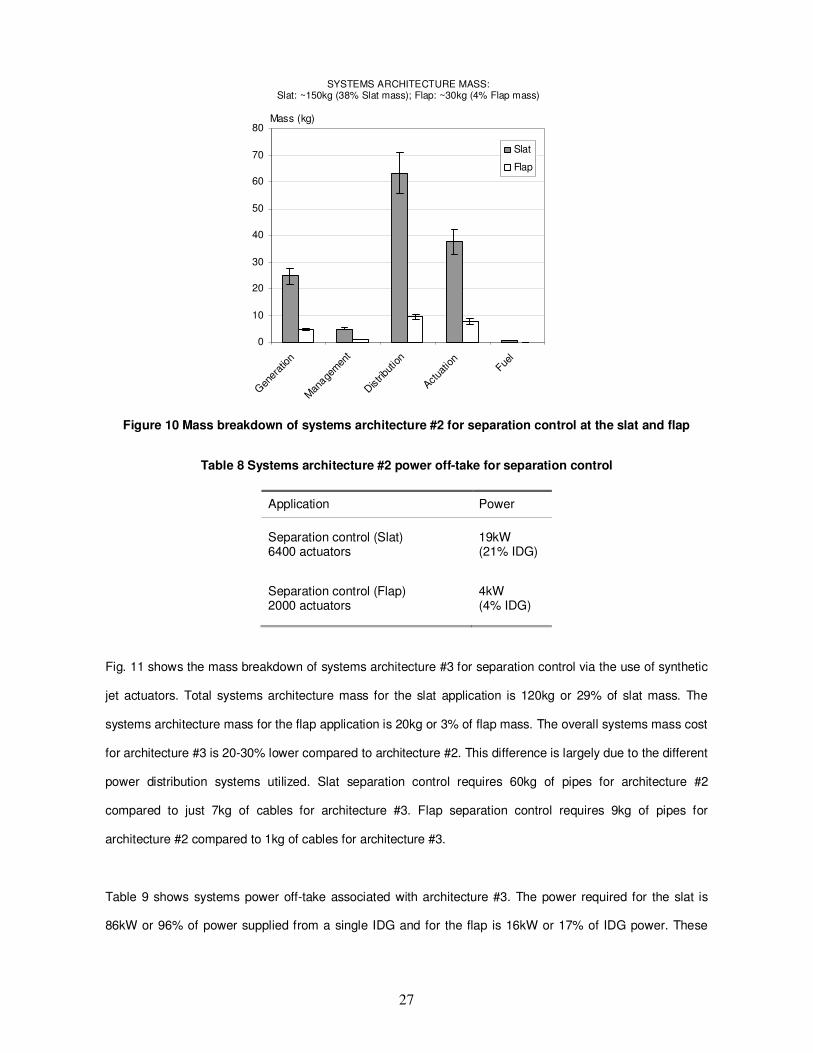
4. Separation Control: Systems Architectures #2 & #3
Fig. 10 shows the mass breakdown of systems architecture #2 for separation control via the use of pulsed air
jet actuators. Mass costs are considered for slat and flap FC applications. Total systems architecture mass
for the slat is 150kg, equivalent to 38% of the A320 slat mass. The systems architecture mass for the flap is
25
Figure 8 System architecture #5: a) mass, b) power consumption and c) wing area coverage as a
function of chord wise plasma electrode length
a) Plasma electrode area coverage on A320 wing
b) System mass
c) System power consumption
26
0
20
40
60
80
100
120
140
160
180
200
220
Gen
erat
ion
Mana
gem
ent
Dist
ribut
ion
Actua
tion
Fuel
Mass (kg)
Figure 9 Mass breakdown of systems architecture #5 for skin friction drag reduction
Table 7 Systems architecture #5 power off-take and drag cost for skin friction drag reduction
30kg, equivalent to 4% of the A320 flap mass. For both applications, the major contributor in mass costs is
power distribution, which represents at least 40% of the overall systems architecture mass.
Table 8 shows the associated systems architecture power off-take for both applications. Power off-take is
equivalent to 19kW or 21% of IDG power at the slat and 4kW or 4% of IDG power at the flap. The difference
in power costs between slat and flap applications is due to the local actuator jet velocity requirements -
leading edge (LE) slat application requires approximately double the jet velocity of the trailing edge flap (TE)
application. Accordingly, the difference in systems mass costs scales with the difference in power costs.
Application Power Drag
Drag reduction (wing main element) 750 actuators
291kW (323% IDG)
1097N (2.6% cruise drag)
SYSTEMS ARCHITECTURE MASS: ~430kg (0.55% MTOW)
27
0
10
20
30
40
50
60
70
80
Gen
erat
ion
Man
agem
ent
Distri
butio
n
Actua
tion
Fuel
Mass (kg)
Slat
Flap
Figure 10 Mass breakdown of systems architecture #2 for separation control at the slat and flap
Table 8 Systems architecture #2 power off-take for separation control
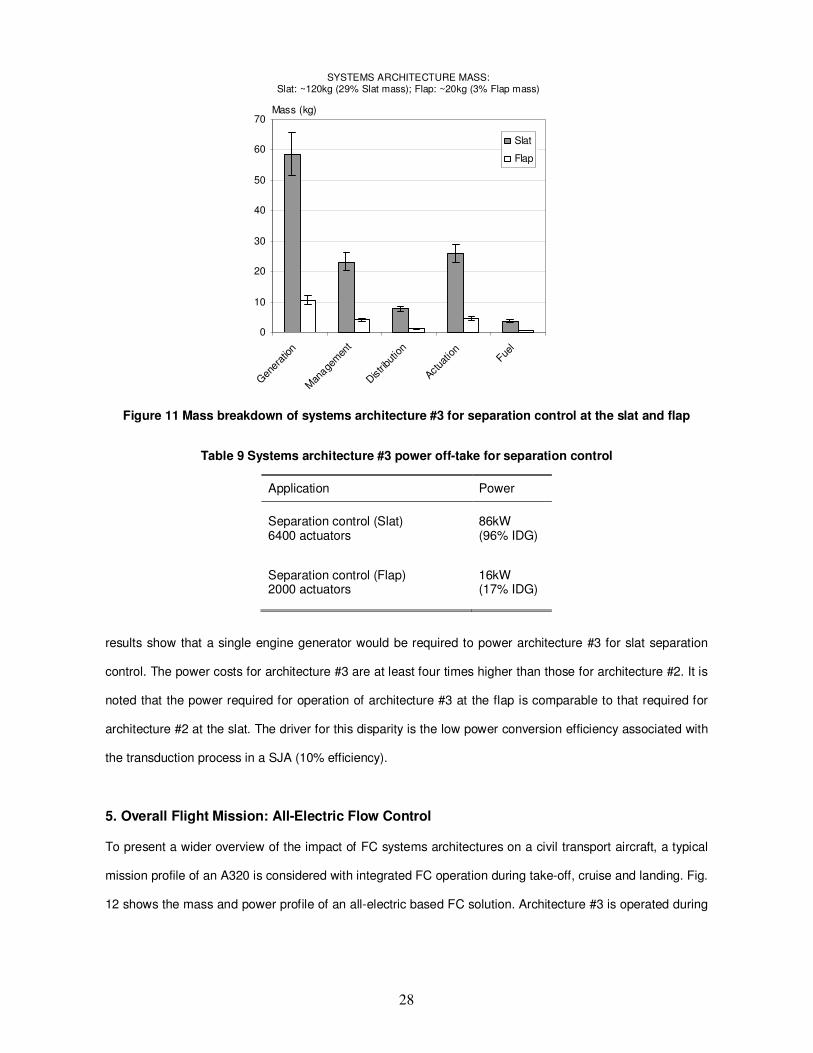
Fig. 11 shows the mass breakdown of systems architecture #3 for separation control via the use of synthetic
jet actuators. Total systems architecture mass for the slat application is 120kg or 29% of slat mass. The
systems architecture mass for the flap application is 20kg or 3% of flap mass. The overall systems mass cost
for architecture #3 is 20-30% lower compared to architecture #2. This difference is largely due to the different
power distribution systems utilized. Slat separation control requires 60kg of pipes for architecture #2
compared to just 7kg of cables for architecture #3. Flap separation control requires 9kg of pipes for
architecture #2 compared to 1kg of cables for architecture #3.
Table 9 shows systems power off-take associated with architecture #3. The power required for the slat is
86kW or 96% of power supplied from a single IDG and for the flap is 16kW or 17% of IDG power. These
Application Power
Separation control (Slat) 6400 actuators
19kW (21% IDG)
Separation control (Flap) 2000 actuators
4kW (4% IDG)
SYSTEMS ARCHITECTURE MASS: Slat: ~150kg (38% Slat mass); Flap: ~30kg (4% Flap mass)
28
0
10
20
30
40
50
60
70
Gen
erat
ion
Man
agem
ent
Distri
butio
n
Actua
tion
Fuel
Mass (kg)
Slat
Flap
Figure 11 Mass breakdown of systems architecture #3 for separation control at the slat and flap
Table 9 Systems architecture #3 power off-take for separation control
results show that a single engine generator would be required to power architecture #3 for slat separation
control. The power costs for architecture #3 are at least four times higher than those for architecture #2. It is
noted that the power required for operation of architecture #3 at the flap is comparable to that required for
architecture #2 at the slat. The driver for this disparity is the low power conversion efficiency associated with
the transduction process in a SJA (10% efficiency).
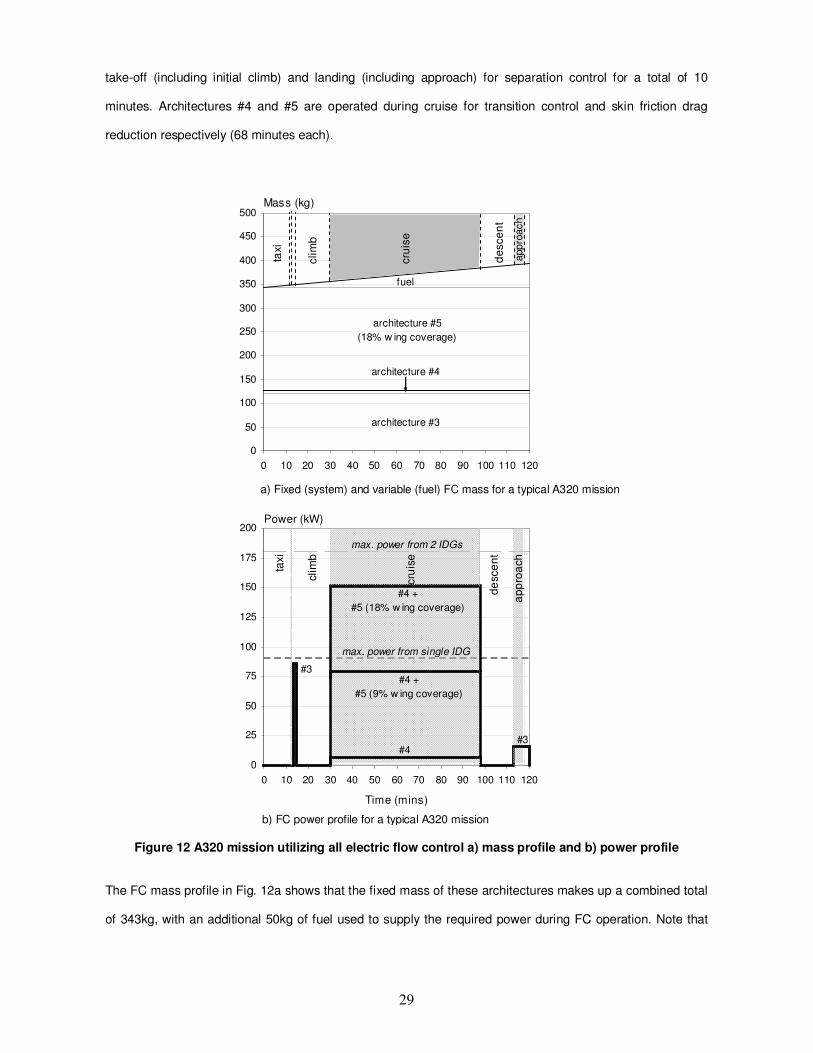
5. Overall Flight Mission: All-Electric Flow Control
To present a wider overview of the impact of FC systems architectures on a civil transport aircraft, a typical
mission profile of an A320 is considered with integrated FC operation during take-off, cruise and landing. Fig.
12 shows the mass and power profile of an all-electric based FC solution. Architecture #3 is operated during
Application Power
Separation control (Slat) 6400 actuators
86kW (96% IDG)
Separation control (Flap) 2000 actuators
16kW (17% IDG)
SYSTEMS ARCHITECTURE MASS: Slat: ~120kg (29% Slat mass); Flap: ~20kg (3% Flap mass)
29
take-off (including initial climb) and landing (including approach) for separation control for a total of 10
minutes. Architectures #4 and #5 are operated during cruise for transition control and skin friction drag
reduction respectively (68 minutes each).
0
50
100
150
200
250
300
350
400
450
500
0 10 20 30 40 50 60 70 80 90 100 110 120
Mass (kg)
cru
ise
de
sce
nt
app
roa
ch
clim
b
taxi
architecture #3
architecture #4
architecture #5
(18% w ing coverage)
fuel
0
25
50
75
100
125
150
175
200
0 10 20 30 40 50 60 70 80 90 100 110 120
Time (mins)
Power (kW)
cru
ise
de
sce
nt
ap
pro
ach
clim
b
taxi
max. power from single IDG
#3
#4 #3
#4 +
#5 (9% w ing coverage)
+
max. power from 2 IDGs
#4 +
#5 (18% w ing coverage)
+
Figure 12 A320 mission utilizing all electric flow control a) mass profile and b) power profile
The FC mass profile in Fig. 12a shows that the fixed mass of these architectures makes up a combined total
of 343kg, with an additional 50kg of fuel used to supply the required power during FC operation. Note that
a) Fixed (system) and variable (fuel) FC mass for a typical A320 mission
b) FC power profile for a typical A320 mission
30
the systems mass of architecture #5 assumes a mean electrode chord wise length of 0.5m, which is
equivalent to 18% wing surface area coverage.
To put this value into context, the total mass is equivalent to 0.6% MTOW or 40% of the combined mass of
the slat and flap. The fuel mass required is equivalent to 16 (US liquid) gallons of kerosene. This can be
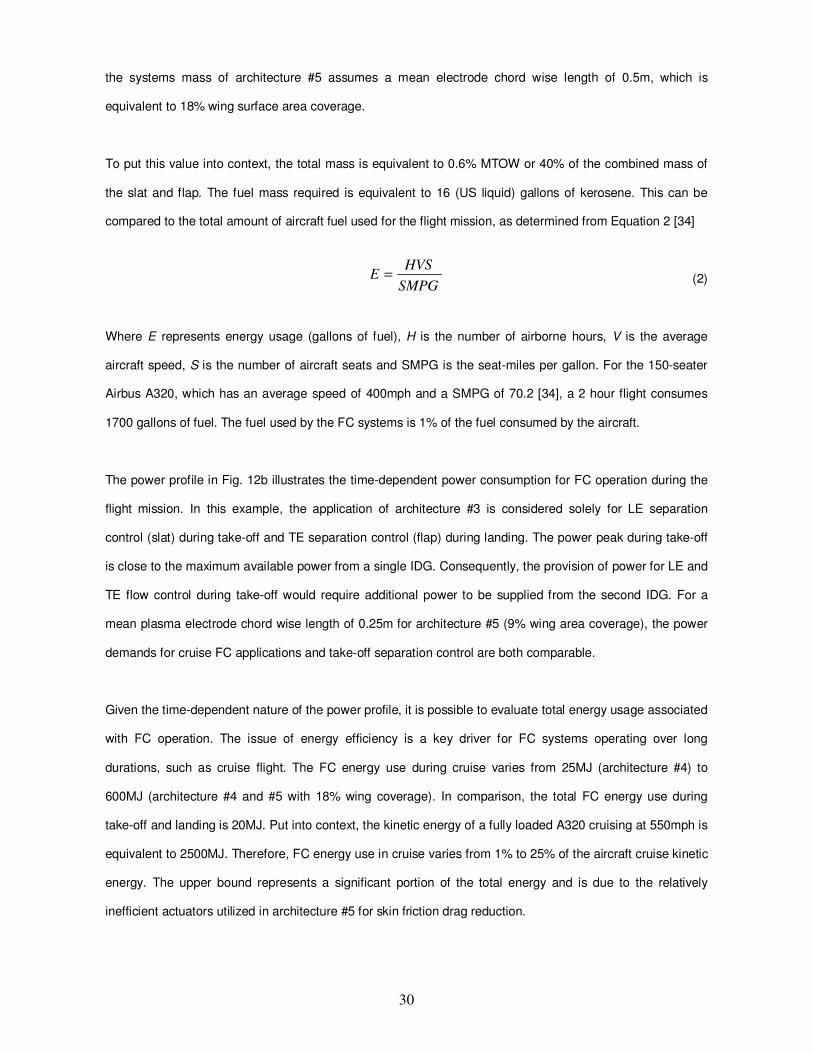
compared to the total amount of aircraft fuel used for the flight mission, as determined from Equation 2 [34]
(2)
Where E represents energy usage (gallons of fuel), H is the number of airborne hours, V is the average
aircraft speed, S is the number of aircraft seats and SMPG is the seat-miles per gallon. For the 150-seater
Airbus A320, which has an average speed of 400mph and a SMPG of 70.2 [34], a 2 hour flight consumes
1700 gallons of fuel. The fuel used by the FC systems is 1% of the fuel consumed by the aircraft.
The power profile in Fig. 12b illustrates the time-dependent power consumption for FC operation during the
flight mission. In this example, the application of architecture #3 is considered solely for LE separation
control (slat) during take-off and TE separation control (flap) during landing. The power peak during take-off
is close to the maximum available power from a single IDG. Consequently, the provision of power for LE and
TE flow control during take-off would require additional power to be supplied from the second IDG. For a
mean plasma electrode chord wise length of 0.25m for architecture #5 (9% wing area coverage), the power
demands for cruise FC applications and take-off separation control are both comparable.
Given the time-dependent nature of the power profile, it is possible to evaluate total energy usage associated
with FC operation. The issue of energy efficiency is a key driver for FC systems operating over long
durations, such as cruise flight. The FC energy use during cruise varies from 25MJ (architecture #4) to
600MJ (architecture #4 and #5 with 18% wing coverage). In comparison, the total FC energy use during
take-off and landing is 20MJ. Put into context, the kinetic energy of a fully loaded A320 cruising at 550mph is
equivalent to 2500MJ. Therefore, FC energy use in cruise varies from 1% to 25% of the aircraft cruise kinetic
energy. The upper bound represents a significant portion of the total energy and is due to the relatively
inefficient actuators utilized in architecture #5 for skin friction drag reduction.
SMPG
HVSE =
31
V. Conclusions
This paper has considered the effect of choice of actuator technology and associated power systems
architecture on the mass cost of implementing active flow control (FC) systems on civil transport aircraft. The
research method employed is based on the use of a simple systems mass model that includes a mass term
due to systems hardware (pertaining to generation, management, distribution and actuation systems) and a
mass term due to the system energy usage (mass of fuel used during FC operation).
The study has involved (a) first principles physical analysis of electric, pneumatic and hydraulic power
distribution systems, combined with (b) collecting hardware data from existing equipment suppliers for the
FC systems architectures considered (FC actuator technologies include air jet actuators, synthetic jet
actuators, membrane actuators and plasma actuators), and (c) application of FC systems architectures for
various flow control case study scenarios on an A320 civil transport aircraft.
Specific conclusions from the top-level FC systems architectures study are as follows:
1. A trade exists between system power efficiency and the system hardware mass required to achieve this
efficiency. For short duration operation the solution is driven towards lighter, less efficient systems,
whereas for long duration operation there is benefit in considering heavier but more efficient systems.
2. A sensitivity analysis shows that a 10% variation in the actuator power efficiency in a FC systems
architecture will result in a 10% variation in overall power consumption and a 10% to 12% variation in
overall system mass, dependent on the specific architecture. As such, the actuator power efficiency is
critical in driving the mass efficiency of the overall system.
3. The mass cost of electric power distribution is shown to be considerably less than that for pneumatic
systems (up to two orders of magnitude smaller), with added benefits of higher efficiency and smaller
volume installation requirements for a given level of power transmission. However, this advantage is
reduced by the requirement for relatively heavy electrical power management systems.
4. Systems architectures utilizing power distributed electromechanical-fluidic actuators with overall power
specific masses of unity, which is similar to the power specific mass of existing systems inherent to
commercial aircraft, are currently the most competitive FC solutions from a mass cost perspective.
32
Specific conclusions from the A320 case study analyses are as follows:
1. Laminar-turbulent transition control (systems architecture #4):
− The total systems architecture mass via the use of a single array of distributed, low authority
membrane actuators along the wing main element is approximately 10kg (0.01% MTOW). The
equivalent power off-take is 6kW (7% of power supplied from a single engine generator IDG) and the
associated drag cost due to this power off-take is 24N (0.06% A320 cruise drag).
− The application of this flow control is best suited to a low sweep (laminar) wing, otherwise, a swept
wing with consideration of LE suction to suppress CF instabilities
2. Turbulent skin friction drag reduction (systems architecture #5):
− The total systems architecture mass via the use of a single array of DBD plasma actuators (with
mean chord wise electrode length of 1m) at the wing main element is approximately 430kg (0.55%
MTOW). The equivalent power off-take is 291kW (323% of power supplied from a single IDG) and
the associated drag cost due to this power off-take is 1097N (2.6% of A320 cruise drag).
− Maximum power supply from a single IDG is sufficient to support a 0.3m mean chord wise length of
plasma electrode array, equivalent to 11% of the wing surface area.
3. Separation control (systems architectures #2 and #3):
− FC systems architectures for LE separation control require greater power than TE applications due
to the greater local velocity at the LE.
− An array of PJAs (#2) consumes less power for LE and TE applications than SJAs (#3) for nominally
the same effectiveness (21% and 4% of IDG power compared to 96% and 17% respectively), due to
the greater inefficiency of SJAs.
− The systems architecture for SJAs confers smaller mass penalties compared to PJAs at the LE (29%
and 38% of slat mass) and TE (3% and 4% of flap mass), due to the higher mass distribution costs
of architecture #2.
4. The provision of an all-electric FC systems architectures for take-off (LE separation control via SJAs),
cruise (transition control via membrane actuators and skin friction drag reduction via plasma actuators on
the main element) and landing (TE separation control via SJAs) for a 2-hour A320 flight profile costs
0.6% MTOW in system mass and requires 1% of the aircraft mission fuel.
33
Acknowledgements
The work reported here was undertaken as part of the AVERT project (Contract No. AST5-CT-2006-030914)
funded by the Sixth European Union Framework Programme. Helpful discussions with Sylvain Boye (Airbus
UK) and Eric Moreau (University of Poitiers) are acknowledged.
References
[1] Kuchemann, D., The Aerodynamic Design of Aircraft, Pergamon, 1978.
[2] Faleiro, L., “Beyond the More Electric Aircraft,” Aerospace America, Sep. 2005, pp. 35-40.
[3] Crowther, W.J., and Gomes, L.T., “An Evaluation of the Mass and Power Scaling of Synthetic Jet
Actuator Flow Control Technology for Civil Transport Aircraft Applications,” Institute of Mechanical
Engineers, Part I: Journal of Systems and Control Engineering, Vol. 222, No. 5, 2008, pp. 357-372.
doi: 10.1243/09596518JSCE519
[4] Ning, S.A., and Kroo, I., “Multidisciplinary Considerations in the Designs of Wings and Wing Tip
Devices,” Journal of Aircraft, Vol. 47, No. 2, 2010, pp. 534-543.
doi: 10.2514/1.41833
[5] Liscouët-Hanke, S., Mare, J-C., and Pufe, S., “Simulation Framework for Aircraft Power System
Architecting,” AIAA Journal, Vol. 46, No. 4, 2009, pp. 1375-1380.
doi: 10.2514/1.41304
[6] Liscouët-Hanke, S., Pufe, S., and Mare, J-C., “A Simulation Framework for Aircraft Power
Management,” Institute of Mechanical Engineers, Part G: Journal of Aerospace Engineering, Vol. 222,
No. 6, 2008, pp. 749-756.
doi: 10.1243/09544100JAERO342
[7] Warsop, C., Hucker, M., Press, A.J., and Dawson, P., “Pulsed-Air Jet Actuators for Flow Separation
Control,” Flow, Turbulence and Combustion, Vol. 78, No. 3-4, 2007, pp. 255-281.
doi: 10.1007/s10494-006-9060-4
[8] Bolzmacher, C., Bauer, K., Schmid, U., Hafez, M., and Seidel, H., “Displacement Amplification of
Piezoelectric Microactuators with a Micromachined Leverage Unit,” Sensors and Actuators A:
Physical, Vol. 157, No. 1, 2010, pp. 61-67.
34
doi:10.1016/j.sna.2009.10.014
[9] Moreau, E., “Airflow Control by Non-Thermal Plasma Actuators,” Journal of Physics D: Applied
Physics, Vol. 40, Feb. 2007, pp. 605-636.
doi: 10.1088/0022-3727/40/3/S01
[10] Crowther, W.J., “Control of Separation on a Trailing Edge Flap Using Air Jet Vortex Generators,”
Journal of Aircraft, Vol. 43, No. 5, 2006, pp. 1589-1592.
doi: 10.2514/1.15755
[11] White, F.M., “Viscous Flow in Ducts,” Fluid Mechanics, McGraw-Hill, 3rd ed., 1979, pp. 356-357.
[12] Crook, A., and Wood, N.J., “Measurements and Visualizations of Synthetic Jets,” AIAA Paper 01-
0145, Jan. 2001.
[13] Glezer, A., and Amitay, M., “Synthetic Jets,” Annual Review of Fluid Mechanics, Vol. 34, Jan. 2002,
pp. 503-529.
doi: 10.1146/annurev.fluid.34.090501.094913
[14] Bridges, A., and Smith, D.R., “Influence of Orifice Orientation on a Synthetic-Jet Boundary-Layer
Interaction,” AIAA Journal, Vol. 41, No. 12, 2003, pp. 2394-2402.
doi: 10.2514/2.6838
[15] Amitay, M., and Glezer, A., “Aerodynamic Flow Control Using Synthetic Jet Actuators,” Control of Fluid
Flow, Lecture Notes in Control and Information Sciences, Springer, New York, 2006, pp. 45-74.
[16] Amitay, M., Smith, D.R., Kibens, V., Parekh, D.E., and Glezer, A., “Aerodynamic Flow Control over an
Unconventional Airfoil using Synthetic Jet Actuators,” AIAA Journal, Vol. 39, No. 3, 2001, pp. 361-370.
doi: 10.2514/2.1323
[17] Rusovici, R., and Lesieutre, G.A., “Design of a Single-Crystal Piezoceramic-Driven Synthetic-Jet
Actuator,” Proceedings of the SPIE - Smart Structures and Materials, Vol. 5390, Nov. 2004, pp. 276-
283.
doi: 10.1117/12.539576
[18] Dearing, S., Lambert, S., and Morrison, J., “Flow Control with Active Dimples,” The Aeronautical
Journal, Vol. 111, No. 1125, 2007, pp. 705-714.
[19] Engert, M., and Nitsche, W., “Active Cancellation of Tollmien-Schlichting Instabilities up to M = 0.40,”
International Congress of the Aeronautical Sciences, Paper 2008-3.10.2, Sep. 2008.
35
[20] Sturzebecher, D., and Nitsche, W., “Active Cancellation of Tollmien-Schlichting Instabilities on a Wing
Using Multi-Channel Sensor Actuator Systems,” International Journal of Heat and Fluid Flow, Vol. 24,
No. 4, 2003, pp. 572-583.
doi: 10.1016/S0142-727X(03)00051-1
[21] Saric, W.S., “Control of Transition in Swept-Wing Boundary Layers Using MEMS Devices as
Distributed Roughness,” Final Technical Report, AFOSR Grant F49620-97-1-0520, Aug. 2001.
[22] Bolzmacher, C., Riedl, X., Leuckert, J., Engert, M., Bauer, K., and Nitsche, W., "Mechanically
Amplified Piezoelectric Microactuators for Laminar-Turbulent Transition Control on Airfoils,” Journal of
Microelectronics and Electronic Packaging, Vol. 6, No. 4, 2009, pp. 211-218.
[23] Jukes, T., Choi, K-S., Johnson, G.A., and Scott, S.J., “Turbulent Drag Reduction by Surface Plasma
Through Spanwise Oscillation,” AIAA Paper 06-3693, Jun. 2006.
[24] Bernard, N., Balcon, N., and Moreau, E., “Electric Wind Produced by a Single Dielectric Barrier
Discharge Actuator Operating in Atmospheric Flight Conditions – Pressure Outcome,” AIAA Paper 08-
3792, Jun. 2008.
[25] Bernard, N., Balcon, N., and Moreau, E., “Electric Wind Produced by a Surface Dielectric Barrier
Discharge Operating Over a Wide Range of Relative Humidity,” AIAA Paper 09-0488, Jan. 2009.
[26] Santin, M., Traverso, A., and Massardo, A., “Technological Aspects of Gas Turbine and Fuel Cell
Hybrid Systems for Aircraft: a Review,” The Aeronautical Journal, Vol. 112, No. 1134, 2008, pp. 459-
467.
[27] Moir, I., and Seabridge, A., “Electrical Systems,” Aircraft Systems: Mechanical, Electrical and Avionics
Subsystems Integration, 3rd ed., Wiley, 2008, pp. 199-202.
[28] Epstein, A., “Millimeter-Scale, Micro-Electro-Mechanical Systems Gas Turbine Engines,” Journal of
Engineering for Gas Turbines and Power, Vol. 126, Apr. 2004, pp. 205-226.
doi:10.1115/1.1739245
[29] Kang, S., “Fabrication of Functional Mesoscopic Ceramic Parts for Micro Gas Turbine Engines,” PhD
Thesis, Stanford University, USA, 2001.
[30] Eaton Boost Compressor [online]
http://www.eatonaerospaceltd.com/air/Resources/044_1_BoostCompressor.pdf [retrieved 5 December
2009]
[31] Rudolph, P.K.C., “High-Lift Systems on Commercial Subsonic Airliners,” NASA CR-4746, Sep. 1996.
36
[32] Wedderspoon, J., “The High-Lift Development of the A320 Aircraft,” International Congress of the
Aeronautical Sciences, Paper 1986-2.3.2, Sep. 1986.
[33] Briére, D., “Overview on Airbus Fly-by-Wire Status,” Air and Space Europe, Vol. 3, Aug. 2001, pp.
178-179.
doi: 10.1016/S1290-0958(01)90087-5
[34] Greene, D.L., “Energy-Efficiency Improvement Potential of Commercial Aircraft,” Annual Review of
Energy Environment, Vol. 17, Nov. 1992, pp. 537-573.
doi: 10.1146/annurev.eg.17.110192.002541
[35] Gardenghi, R.A., Houlne, R.C., Keggins, B.G., Wilson, L.E., and Maerten, K.R., “A High Reliability
Compact Lightweight High Voltage Transformer,” Proceedings of the Twenty-First International Power
Modulator Symposium, The Institute of Electrical and Electronic Engineers, Costa Mesa, CA, 1994,
pp. 210-213.
[36] Jackson., P., “Aero-Engines,” Jane’s All the World’s Aircraft 1998-1999, Jane’s Information Group,
1998, p. 790.
[37] “CFM56-5 Type Certificate Data Sheet E29NE.” Federal Aviation Administration, US Department of
Transportation, Apr. 1998.
[38] “ESDU 66027: Friction Losses for Fully Developed Flow in Straight Pipes,” Sept. 1966, Amendment E
Mar. 2007.
[39] Bent R.D., and McKinley, J.L., “Installation and Maintenance of Electrical Systems,” Aircraft Electricity
and Electronics, 3rd ed., McGraw-Hill, 1981, pp. 174-177.
[40] Hydraulic Supply Company Stock Products, p. 1472 [online]
http://www.hydraulic-supply.com/html/browsecatalog.htm. [retrieved 29 July 2009].
[41] McLean, J.D., Crouch, J.D., Stoner, R.C., Sakurai, S., Seidel, G.E., Fiefel, W.M., and Rush, H.M.,
“Study of the Application of Separation Control by Unsteady Excitation to Civil Transport Aircraft,”
NASA CR-209338, Sep. 1999.
[42] Hunt, E.H., Reid, D.H., Space, D.R., and Tilton, F.E., “Commercial Airliner Environmental Control
System. Engineering Aspects of Cabin Air Quality,” Proceedings of the Sixty-Sixth Aerospace Medical
Association Annual Meeting, Anaheim, CA, May 1995 [online],
http://www.boeing.com/commercial/cabinair/ecs.pdf [retrieved 5 December 2009].
37
[43] Godard, G., and Stanislas, M., “Control of a Decelerating Boundary Layer. Part 3: Optimization of
Round Jets Vortex Generators,” Aerospace Science and Technology, Vol. 10, Sep. 2006, pp. 455-
464.
doi:10.1016/j.ast.2005.11.005
[44] Jabbal, M., and Zhong, S., “The Near Wall Effect of Synthetic Jets in a Boundary Layer,” International
Journal of Heat and Fluid Flow, Vol. 29, No. 1, 2008, pp. 119-130.
doi:10.1016/j.ijheatfluidflow.2007.07.011
[45] Schaeffler, N.W., “The Interaction of a Synthetic Jet and a Turbulent Boundary Layer,” AIAA Paper 03-
0643, Jan. 2003.
[46] Bray, T.P., and Garry, K.P., “Optimization of Air-Jet Vortex Generators with Respect to System Design
Parameters,” The Aeronautical Journal, Vol. 103, No. 1028, 1999, pp. 475-479.
[47] Rathnasingham, R., and Breuer, K.S., ”Active Control of Turbulent Boundary Layers,” Journal of Fluid
Mechanics, Vol. 495, Nov. 2003, pp. 209-233.
doi: 10.1017/S0022112003006177

38
Appendix I. Flow Control Systems Hardware Data
A summary of the engineering equipment supplier information used to evaluate power specific masses of
hardware for FC systems architectures is shown in Table 10.
Table 10 Power specific masses of systems hardware
ID Generation Management Distribution Actuation
1
CFM6-5B Engine Compressor 86kg & 336kW (mwg = 0.26kg/kW)
Liebherr Precooler 25kg & 708kW (mwm = 0.035kg/kW)
SIL2-2001 Silicone coated Fibreglass Duct 250kPa; 0.33kg/s; 43kW (m’wd = 0.066kg/kWm)
Piezoelectric Cantilever-based Microvalve [7] 0.1g & 50mW (mwa = 2.0kg/kW)
2
Sundstrand 90kVA Engine Generator 61kg & 90kW (mwg = 0.68kg/kW) Eaton Boost Compressor 9.1kg & 10kW (mwg = 0.91kg/kW)
IPS CV03-75D-1A GCU (incl. TRU) 9kg & 75kW (mwm = 0.12kg/kW) Leach International WE-X9YN ELCU 2.2kg; 92kW (mwm = 0.02kg/kW)
3
Sundstrand 90kVA Engine Generator 61kg & 90kW (mwg = 0.68kg/kW)
#2 + Apex Amplifier (PA52+EK27) 0.5kg & 4kW (mwm = 0.13kg/kW)
MIL-W-22759/34 XL-ETFE Cable 600V (single end)
(m’wd = 3×10⁻³
kg/kWm)
Synthetic Jet Actuator [3] 1.5g & 5W (mwa = 0.30kg/kW)
4 Membrane Actuator [8] 0.7g & 4.6W (mwa = 0.15kg/kW)
5
#2 + Westinghouse HV Transformer [35] (100kV/1.5A) 75kg & 1.5kW (mwm = 0.5kg/kW)
RS PVS EHT Cable 25kV (single end); 3A; 75kW
(m’wd = 7×10⁻⁴
kg/kWm)
Plasma DBD Actuator [9] 4.6g & 0.15kW/m (mwa = 0.03kg/kW)
Note that calculating the generation power specific mass for systems architecture #1 requires apportioning
the compressor mass as a fraction of the engine dry mass, based on the fraction of bleed air compared to
engine core mass flow. Reference data for the applicable engine (CFM56-5B) mass, total engine inlet airflow
and bypass ratio were obtained from [36]. Variations in throttle settings during take-off and landing will affect
the bleed air mass and hence the effective generation mass. At take-off power, the maximum permissible
bleed extraction from the compressor is 7 per cent of the core airflow [37]. Maximum bleed at landing is
assumed to be half of that at take-off.
39
Appendix II. Power Distribution Systems
A. Theory
Power is distributed around an aircraft primarily in three ways: electrically, hydraulically and pneumatically.
Traditionally, civil transport aircraft have used all of these methods, with different choices for different service
applications. The choice of power distribution will typically depend on the peak power requirement of the
application, the available space (volume) between the source and point of application and the mass cost of
distributing power to that application. The following analysis introduces a low order method for estimating the
power specific mass of electric, hydraulic and pneumatic power distribution systems for aircraft applications.
For fluidic power distribution (hydraulic and pneumatic), there are two components associated with the power
transmitted through a pipe: pressure power, WP (Equation 3) and flow power, WF (Equation 4)
(3)
(4)
Where P is the fluidic pressure, U is the pipe flow velocity, A is the pipe cross-sectional area (based on the
internal diameter) and ρ is the fluid density. For power distribution applications, the pressure power is
typically much larger than the flow power and, therefore, the latter can be ignored. For a given pipe material
with a given mass per unit length, md/L, the power specific mass per unit length, m’wd, or the mass cost
required to deliver a unit of power along a unit length of pipe can be defined as
(5)
For a given pipe length, the distribution efficiency, ηd, can be determined from the power loss based on the
pressure drop down the pipe. The pressure drop due to friction, ∆p, for flow in a pipe of any uniform cross
section is given by Equation 6
(6)
The equivalent power drop and distribution efficiency are given in Equation 7 and Equation 8 respectively
PUAWP
=
AUWF
3
2
1ρ=
22
14 UD
LfP
i
ρ=∆
)/('
Lm
Wm
d
Pwd =
40
(7)
(8)
Where f is the friction factor, L is the pipe length and Di is the internal diameter of the pipe. An approximation
for the friction factor based on the Prandtl law for smooth pipes [38] is given by Equation 9
10
4<Re<10
7 (9)
For electrical power distribution, the electrical power, WE, transmitted through a wire is given by Equation 10
(10)
Where V is the wire voltage and I the current passing through the wire. A given cable with a mass per unit
length (based on the combined mass of the wire and insulation), will allow the power specific mass per unit
length to be determined according to Equation 5.
For a given wire length, the distribution efficiency, ηd, can be determined from the power loss based on the
voltage drop down the wire (analogous to the pressure drop down a pipe). The voltage drop due to
resistance, ∆V, down a wire is given by Equation 11
(11)
The equivalent power drop and efficiency are given in Equations 12 and 13 respectively
(12)
(13)
Where R is the electrical resistance of the wire. Wire manufacturers typically quote the resistance for a given
conducting material in terms of a resistance per unit length, R/L.
B. Engineering Data and Constraints
Placed within the engineering constraints of a given aircraft, the derived power specific masses and
efficiencies can be compared for each method of power distribution. Table 11 lists the specifications and
VIWE =
PUAW p ∆=∆
P
PPd
W
WW ∆−=η
2)]7ln(Re/56.1[
−=f
IRV =∆
RIW V
2=∆
E
VEd
W
WW ∆−=η
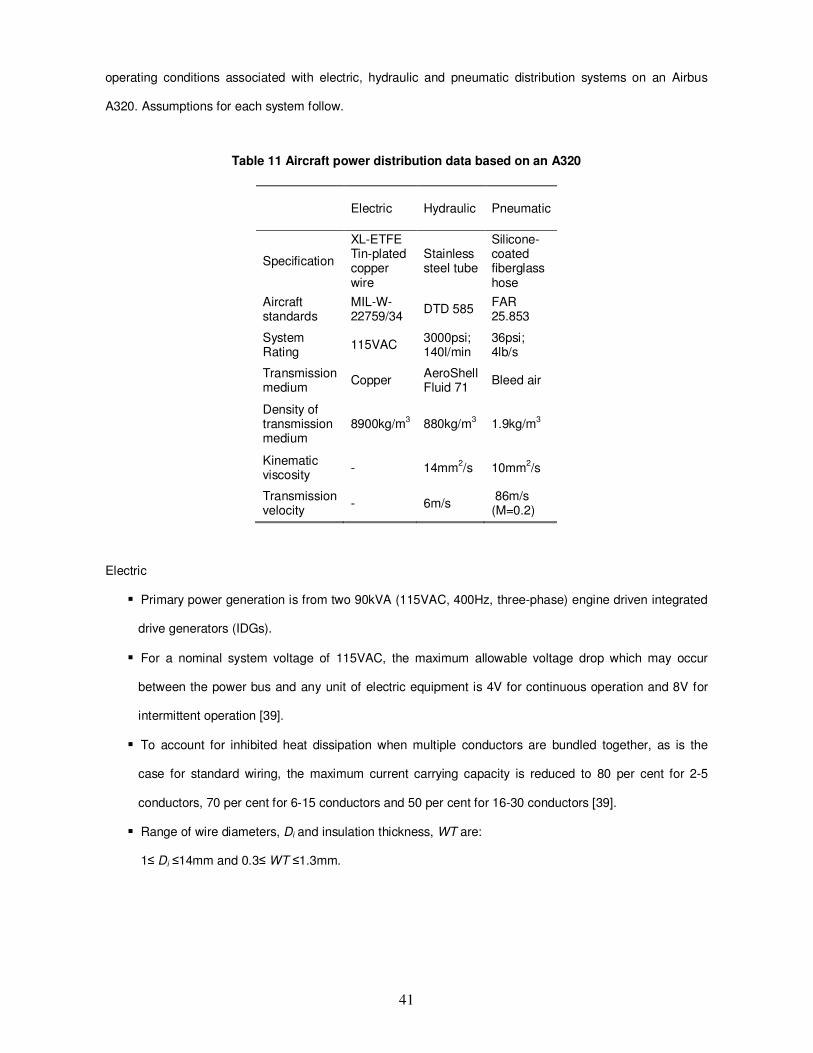
41
operating conditions associated with electric, hydraulic and pneumatic distribution systems on an Airbus
A320. Assumptions for each system follow.
Table 11 Aircraft power distribution data based on an A320
Electric
� Primary power generation is from two 90kVA (115VAC, 400Hz, three-phase) engine driven integrated
drive generators (IDGs).
� For a nominal system voltage of 115VAC, the maximum allowable voltage drop which may occur
between the power bus and any unit of electric equipment is 4V for continuous operation and 8V for
intermittent operation [39].
� To account for inhibited heat dissipation when multiple conductors are bundled together, as is the
case for standard wiring, the maximum current carrying capacity is reduced to 80 per cent for 2-5
conductors, 70 per cent for 6-15 conductors and 50 per cent for 16-30 conductors [39].
� Range of wire diameters, Di and insulation thickness, WT are:
1≤ Di ≤14mm and 0.3≤ WT ≤1.3mm.
Electric
Hydraulic
Pneumatic
Specification
XL-ETFE Tin-plated copper wire
Stainless steel tube
Silicone-coated fiberglass hose
Aircraft standards
MIL-W-22759/34
DTD 585 FAR 25.853
System Rating
115VAC 3000psi; 140l/min
36psi; 4lb/s
Transmission medium
Copper AeroShell Fluid 71
Bleed air
Density of transmission medium
8900kg/m3
880kg/m3
1.9kg/m3
Kinematic viscosity
- 14mm2/s 10mm
2/s
Transmission velocity
- 6m/s 86m/s (M=0.2)
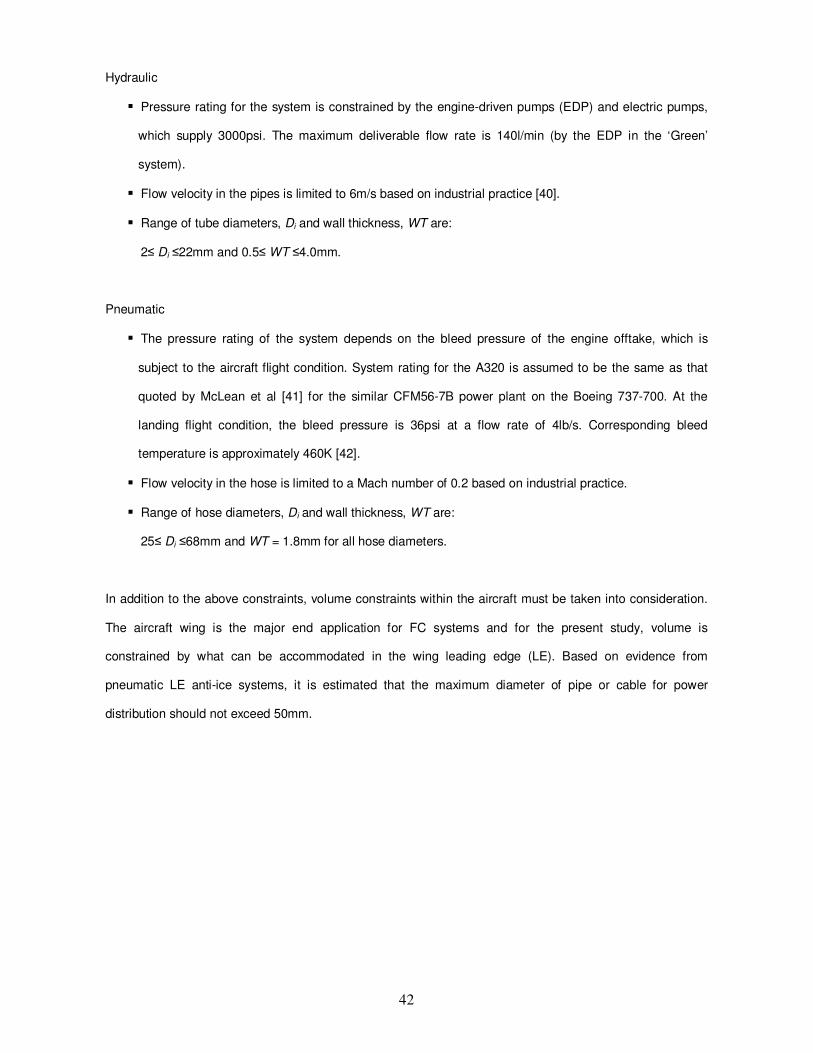
42
Hydraulic
� Pressure rating for the system is constrained by the engine-driven pumps (EDP) and electric pumps,
which supply 3000psi. The maximum deliverable flow rate is 140l/min (by the EDP in the ‘Green’
system).
� Flow velocity in the pipes is limited to 6m/s based on industrial practice [40].
� Range of tube diameters, Di and wall thickness, WT are:
2≤ Di ≤22mm and 0.5≤ WT ≤4.0mm.
Pneumatic
� The pressure rating of the system depends on the bleed pressure of the engine offtake, which is
subject to the aircraft flight condition. System rating for the A320 is assumed to be the same as that
quoted by McLean et al [41] for the similar CFM56-7B power plant on the Boeing 737-700. At the
landing flight condition, the bleed pressure is 36psi at a flow rate of 4lb/s. Corresponding bleed
temperature is approximately 460K [42].
� Flow velocity in the hose is limited to a Mach number of 0.2 based on industrial practice.
� Range of hose diameters, Di and wall thickness, WT are:
25≤ Di ≤68mm and WT = 1.8mm for all hose diameters.
In addition to the above constraints, volume constraints within the aircraft must be taken into consideration.
The aircraft wing is the major end application for FC systems and for the present study, volume is
constrained by what can be accommodated in the wing leading edge (LE). Based on evidence from
pneumatic LE anti-ice systems, it is estimated that the maximum diameter of pipe or cable for power
distribution should not exceed 50mm.
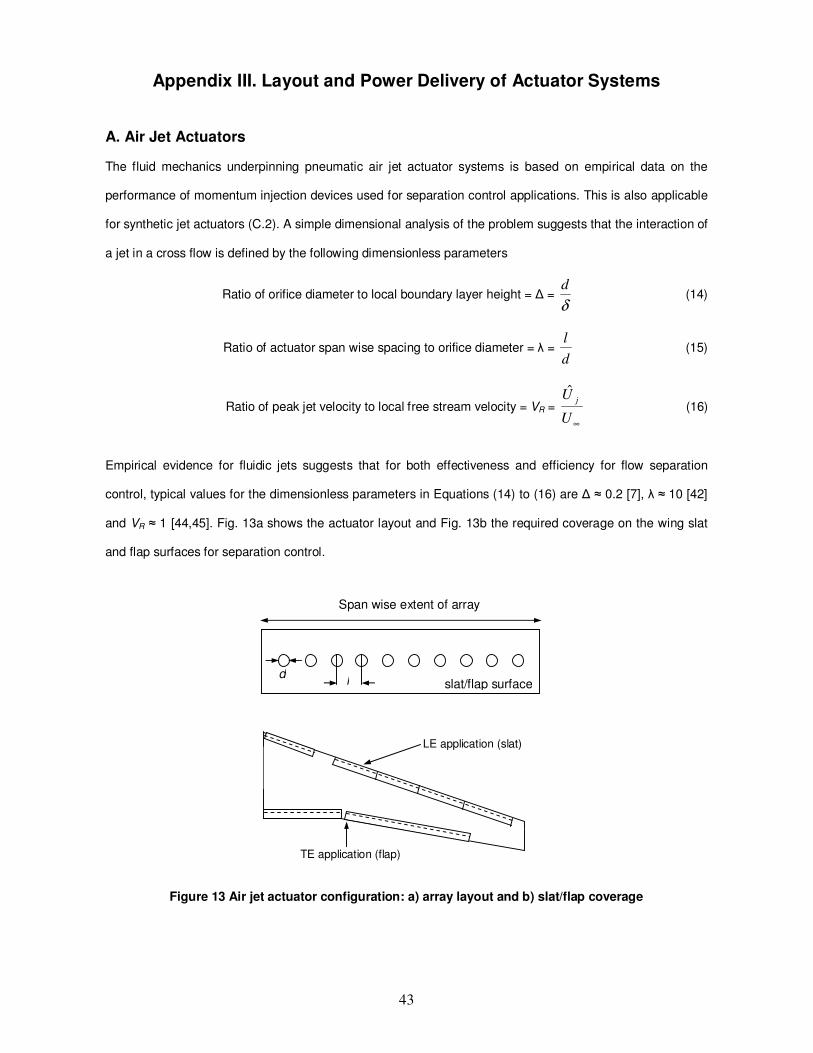
43
Appendix III. Layout and Power Delivery of Actuator Systems
A. Air Jet Actuators The fluid mechanics underpinning pneumatic air jet actuator systems is based on empirical data on the
performance of momentum injection devices used for separation control applications. This is also applicable
for synthetic jet actuators (C.2). A simple dimensional analysis of the problem suggests that the interaction of
a jet in a cross flow is defined by the following dimensionless parameters
Ratio of orifice diameter to local boundary layer height = ∆ = δ
d (14)
Ratio of actuator span wise spacing to orifice diameter = λ = d
l (15)
Ratio of peak jet velocity to local free stream velocity = VR =
∞U
U jˆ
(16)
Empirical evidence for fluidic jets suggests that for both effectiveness and efficiency for flow separation
control, typical values for the dimensionless parameters in Equations (14) to (16) are ∆ ≈ 0.2 [7], λ ≈ 10 [42]
and VR ≈ 1 [44,45]. Fig. 13a shows the actuator layout and Fig. 13b the required coverage on the wing slat
and flap surfaces for separation control.
Figure 13 Air jet actuator configuration: a) array layout and b) slat/flap coverage
LE application (slat)
TE application (flap)
Span wise extent of array
d l slat/flap surface
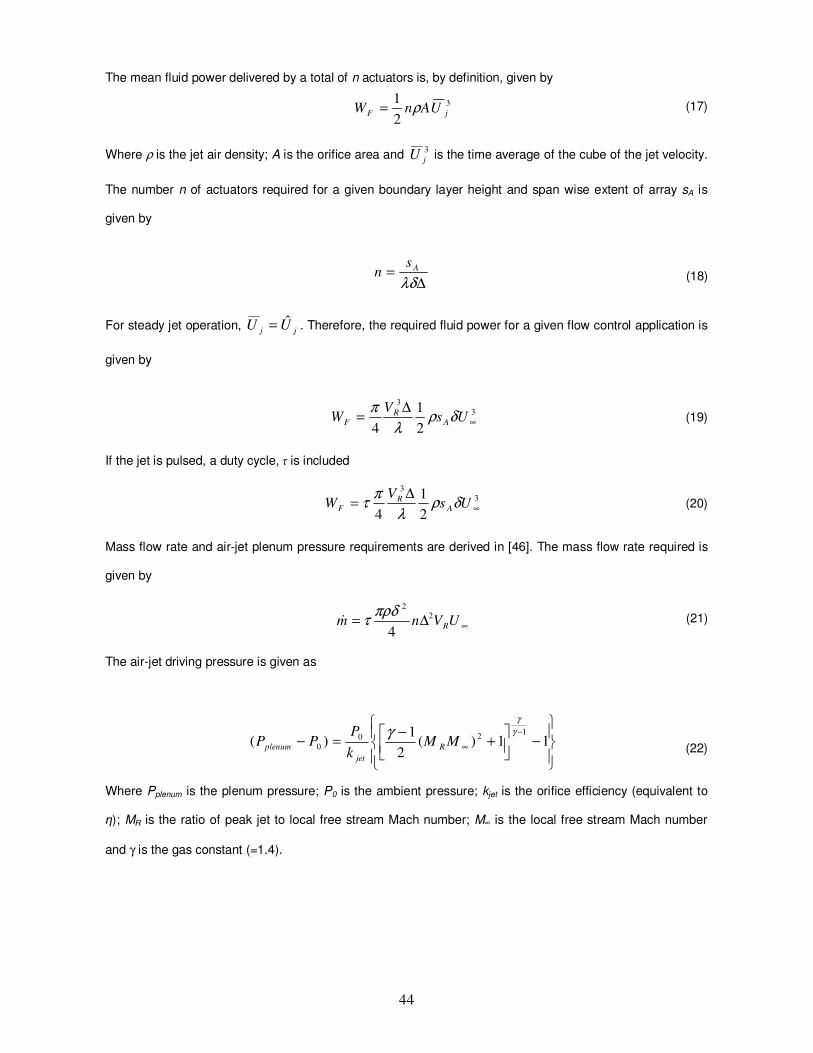
44
The mean fluid power delivered by a total of n actuators is, by definition, given by
(17)
Where ρ is the jet air density; A is the orifice area and 3
jU is the time average of the cube of the jet velocity.
The number n of actuators required for a given boundary layer height and span wise extent of array sA is
given by
(18)
For steady jet operation, jj UU ˆ= . Therefore, the required fluid power for a given flow control application is
given by
(19)
If the jet is pulsed, a duty cycle, τ is included
(20)
Mass flow rate and air-jet plenum pressure requirements are derived in [46]. The mass flow rate required is
given by
(21)
The air-jet driving pressure is given as
(22)
Where Pplenum is the plenum pressure; P0 is the ambient pressure; kjet is the orifice efficiency (equivalent to
η); MR is the ratio of peak jet to local free stream Mach number; M∞ is the local free stream Mach number
and γ is the gas constant (=1.4).
3
3
2
1
4∞
∆= Us
VW A
R
F δρλ
π
3
2
1jF UAnW ρ=
∆=
λδAs
n
3
3
2
1
4∞
∆= Us
VW A
R
F δρλ
πτ
∞∆= UVnm R
22
4
πρδτ&
−
+
−=−
−
∞ 11)(2
1)(
120
0
γ
γ
γMM
k
PPP R
jet
plenum
45
The mass flow rate and air-jet plenum pressure can be used to size the distribution line (pipe area, A) of
pneumatic-based FC systems for a given flow control application, according to
(23)
Where U is the pipe flow velocity, T is the fluid temperature in the pipe and R is the universal gas constant.
B. Synthetic Jet Actuators
The actuator layout for SJAs is the same as that given for the air jet actuator array (Fig. 13). Assuming
sinusoidal oscillation of the SJA diaphragm, the relationship between the time average jet velocity and peak
jet velocity is given by
(24)
Substitutions of Equations 16 and 18 into the equation for required power (Equation 17) and use of the
expression for the mean cube of the jet velocity (Equation 24) gives the following expression for the required
fluid power for a given flow control application
(25)
C. Membrane Actuators
The mean mechanical power delivered by a total of n membrane actuators is, by definition, given by
(26) Where F is the dynamic force of the active surface, given by
(27)
Where f, m and a are the oscillation frequency, mass and peak-to-peak displacement of the active surface
respectively. Assuming sinusoidal oscillation of the active surface
[ ] 333
0
3 ˆ3
1ˆ16
5)(
1jj
T
jj UUdttUT
U ≈== ∫
3
3
2
1
12∞
∆= Us
VW A
R
F δρλ
π
)(0
PPU
RTmA
plenum +=
&
jFUnFW =
mafF
amF
22
2
4π
ω
=
=
46
(28)
Substitutions of Equations 16, 18 and 27 into the equation for required power (Equation 26) and use of the
expression for the mean velocity (Equation 28) gives the following expression for the required output power
for a given flow control application
(29)
From Equation 15, an actuator spacing of λ ≈ 10 is assumed.
D. Plasma Actuators
Fig. 14a shows a proposed layout for the plasma DBD actuator array for skin friction drag reduction [Moreau,
University of Poitiers, unpublished communication] and Fig. 14b the required area coverage on the wing
surface.
A single DBD actuator is made up of one air-exposed electrode and one insulated (ground) electrode
mounted either side of a dielectric layer. The generation of span wise flow oscillations for drag reduction
requires stream wise electrode alignment. The actuator geometry in Fig. 14a is defined by the electrode
stream wise length lx, the air-exposed electrode span wise length ly, the insulated electrode span wise length
ily, the dielectric layer span wise length dly and the gap between successive electrodes, g.
It is anticipated that the electrodes have to cover the entire surface over which skin friction drag reduction is
desired, while avoiding areas with high levels of 3D flow (e.g. leading and trailing edges, wing-fuselage
junction and wing tip). This would equate to a surface area coverage, per wing, of 44.65m2 [Boye, Airbus UK,
unpublished communication]. For the purpose of this study, a mean continuous stream wise electrode
deployment of 1m (lx) is assumed.
3
3
27
1∞= Ums
da
VW A
RF
λ
3ˆ3
12 jj UfaU ≈= π
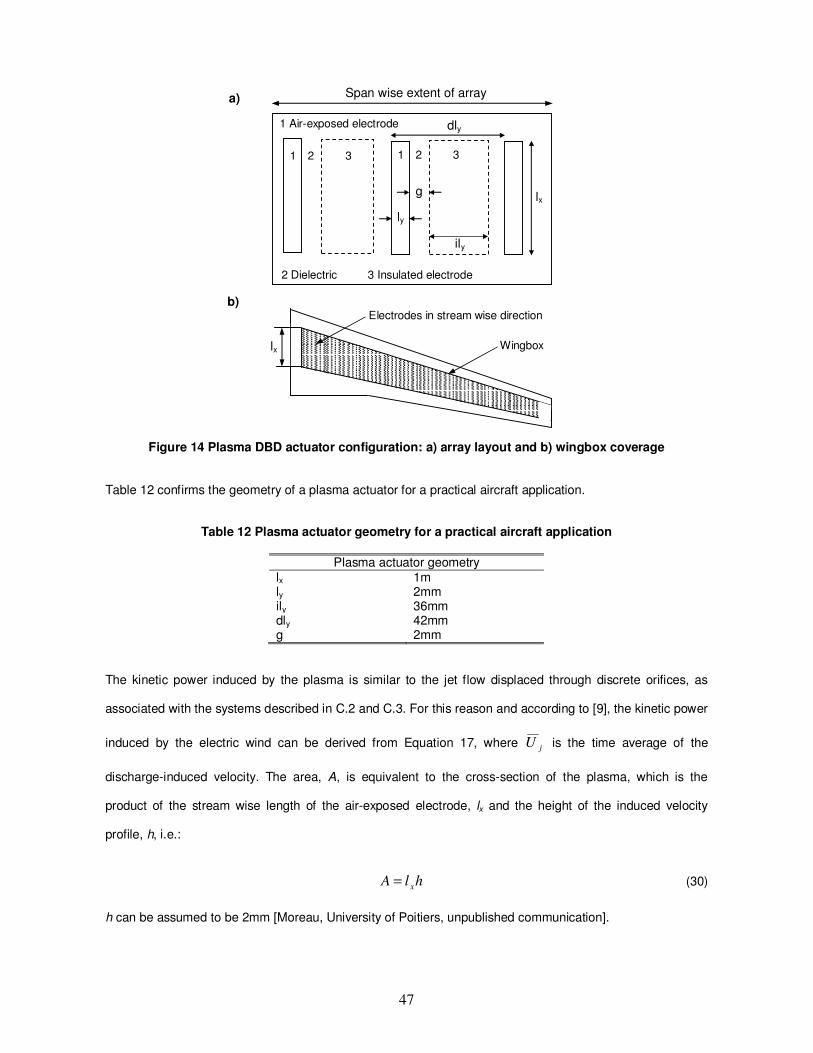
47
Figure 14 Plasma DBD actuator configuration: a) array layout and b) wingbox coverage
Table 12 confirms the geometry of a plasma actuator for a practical aircraft application.
Table 12 Plasma actuator geometry for a practical aircraft application
Plasma actuator geometry lx 1m ly 2mm ily 36mm dly 42mm g 2mm
The kinetic power induced by the plasma is similar to the jet flow displaced through discrete orifices, as
associated with the systems described in C.2 and C.3. For this reason and according to [9], the kinetic power
induced by the electric wind can be derived from Equation 17, where jU is the time average of the
discharge-induced velocity. The area, A, is equivalent to the cross-section of the plasma, which is the
product of the stream wise length of the air-exposed electrode, lx and the height of the induced velocity
profile, h, i.e.:
hlA x= (30)
h can be assumed to be 2mm [Moreau, University of Poitiers, unpublished communication].
lx
Electrodes in stream wise direction
Wingbox
b)
Span wise extent of array
g
ly
ily
dly
lx
1 2 3
1 Air-exposed electrode
2 Dielectric 3 Insulated electrode
a)
1 2 3
48
For sinusoidal operation, the peak discharge velocity is related to the time-averaged velocity by Equation 24.
Note that savings in system power and weight can be achieved by pulsed operation. The ratio of system
overall mass (and power consumption) between sinusoidal and pulsed (25% duty cycle) operation is
approximately 1.3:1.
For turbulent skin friction drag reduction, effectiveness requires the actuator velocity output to be of the order
of the turbulent friction velocity, typically about 5% of the free stream velocity [47]. Hence, VR = 0.05 is
assumed, which gives jU ≈ 10m/s. The total number n of actuators for a given application is:
y
a
l
sn
λ= (31)
Where sa is the span wise extent of the actuator array along the span of the wing and λ is the ratio of
actuator span wise spacing (that is, the span wise spacing between successive air-exposed electrodes) to
the span wise length of the air-exposed electrode, ly. Based on the layout of the actuator array (Figure 14),
λ=20. Full span application on an A320 (sa ≈ 30m) therefore requires a total of 750 actuators (375 per wing).
Substituting Equations 2, 5 and 6 into Equation 1 gives:
3
3
6
1∞= U
l
lhs
VRW
y
x
AF ρλ
(32)
Related Documents