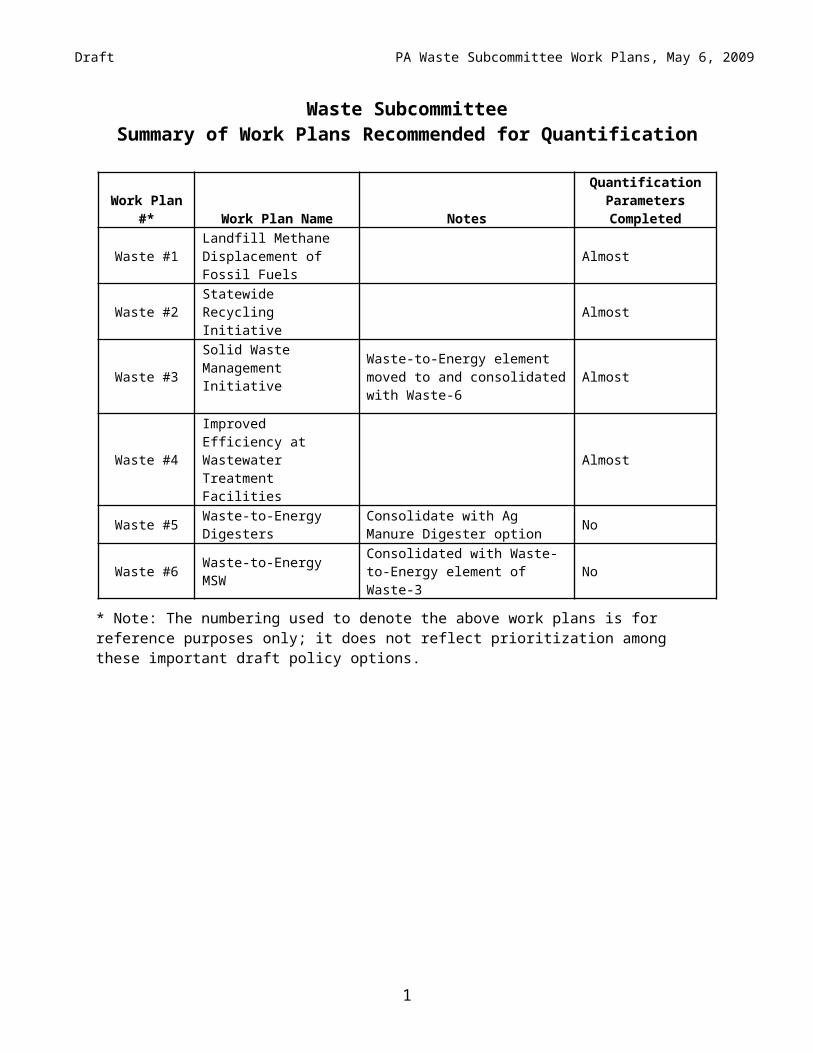
Draft PA Waste Subcommittee Work Plans, May 6, 2009 Waste Subcommittee Summary of Work Plans Recommended for Quantification Work Plan #* Work Plan Name Notes Quantification Parameters Completed Waste #1 Landfill Methane Displacement of Fossil Fuels Almost Waste #2 Statewide Recycling Initiative Almost Waste #3 Solid Waste Management Initiative Waste-to-Energy element moved to and consolidated with Waste-6 Almost Waste #4 Improved Efficiency at Wastewater Treatment Facilities Almost Waste #5 Waste-to-Energy Digesters Consolidate with Ag Manure Digester option No Waste #6 Waste-to-Energy MSW Consolidated with Waste- to-Energy element of Waste-3 No * Note: The numbering used to denote the above work plans is for reference purposes only; it does not reflect prioritization among these important draft policy options. 1

Welcome message from author
This document is posted to help you gain knowledge. Please leave a comment to let me know what you think about it! Share it to your friends and learn new things together.
Transcript
Draft PA Waste Subcommittee Work Plans, May 6, 2009
Waste SubcommitteeSummary of Work Plans Recommended for Quantification
Work Plan #* Work Plan Name Notes
Quantification Parameters Completed
Waste #1Landfill Methane Displacement of Fossil Fuels
Almost
Waste #2 Statewide Recycling Initiative Almost
Waste #3Solid Waste Management Initiative Waste-to-Energy element moved
to and consolidated with Waste-6 Almost
Waste #4Improved Efficiency at Wastewater Treatment Facilities
Almost
Waste #5 Waste-to-Energy Digesters
Consolidate with Ag Manure Digester option No
Waste #6 Waste-to-Energy MSW Consolidated with Waste-to-Energy element of Waste-3 No
* Note: The numbering used to denote the above work plans is for reference purposes only; it does not reflect prioritization among these important draft policy options.
1

Draft PA Waste Subcommittee Work Plans, May 6, 2009
Waste-1
Landfill Methane Displacement of Fossil FuelsWork Plan for Potential GHG Reduction
Lead Staff Contact: Richard Illig (717) 772-5834
Summary: Landfill methane resources and projects will be identified, assessed, and promoted to decrease fossil fuel use in business thermal applications, or otherwise displace the use of commercial natural gas resources. Maximizing the use of landfill methane as a fuel reduces greenhouse gas emission of methane and serves to offset emissions of carbon dioxide from the use of fossil fuels such as coal, oil, and natural gas.
Goals: Require all active and recently closed landfills containing greater than 1 million tons of disposed waste to install gas collection systems. (Mr. Illig has suggested a 35% increase in landfill gas utilization, both through additional collection at current projects and collection at new projects). (Note from subcommittee call on 4.7.09: make goal based on gas generation rather than waste in place.)
Implementation Period: Need to know when controls would be applied (for example: reach 50% of goal by 2015 and 100% of goal by 2025)
Parties Affected/Implementing Parties: DEP, PENNDOT, PUC, & DCED, Landfill owners/operators
Data sources/Assumptions/Methods for GHG:
Landfill gas resources will be assessed to determine the degree to which fossil fuel use for the purpose of generating heat can be displaced. Landfill gas thermal use projects include conversion to commercial grade “pipeline-quality” methane (natural gas) and direct use applications in industrial or commercial equipment.For the purposes of this report landfill gas electricity generation projects will not be addressed.
Operating municipal waste landfills are evaluated annually. Key data collected from DEP Solid Waste Program Landfill Annual Operation Reports includes: site total waste capacity and the volume of disposed waste landfill gas collection rates and gas quality relative to methane content details of landfill gas projects, and thermal energy benefits
Landfill gas collection systems efficiency is estimated between 60 to 85 percent by the U.S. EPA. Efficiencies up to 90 and 95 percent have been calculated using gas measurements taken at modern landfill operations1. For the purposes of this report landfill gas collection efficiency will be estimated at 85 percent for the following reasons:
2

Draft PA Waste Subcommittee Work Plans, May 6, 2009
Landfill gas project investments rely on optimizing landfill gas volume and quality relative to methane content.
PA landfills are well maintained. Installed gas collection systems are relatively new. Improved technologies and operational practices are used in landfill construction. Gas wells
are routinely monitored and calibrated.
Emissions EstimatesCalculation assumptions: Evaluated landfills typically contain at least 1 million tons of disposed municipal waste Municipal waste disposal volume in PA landfills is anticipated to remain static or possibly
decrease through 2025 for the following reasons: Reduced volume of out-of-state waste disposed in Pennsylvania Increased recycling and material recovery and reuse practices Increased waste pick-up and disposal costs Increased numbers of waste-to-energy facilities Decreased disposal of biomass
A 35 percent increase in PA landfill gas utilization from 2008 through 2025. Landfill gas beneficial use – reducing the amount of flared landfill gas - will increase from
the current 69 percent to 90 percent or more. Thermal projects consume 27 percent of beneficially used landfill gas Landfill gas contains 450Btu per cubic foot
Based on 2007 report data Pennsylvania landfills collect over 62,700MMscfy (million standard cubic feet per year) of landfill gas. Currently over 11,700MMscfy - about 19 percent - is used in thermal projects that displace fossil fuel use, over 19,500MMscfy is flared, and about 31,500MMscfy is used to generate electricity.
A 21 percent reduction in the volume of flared landfill gas would allow an additional 4095MMscfy for beneficial use projects. Thermal projects would assume 27 19 percent of 4095MMscfy or 1106 778MMscfy. 1106 778MMscfy + 11,700MMscfy = 12,806 12,478MMscfy of landfill gas used in thermal projects.
At 450Btu per cubic foot of gas, 12,806 12,478MMscfy = 5,762,700 5,615,100MMBtu (million Btu). Given a 35 percent increase in landfill gas generation through 2025 would yield 17,228 16,845MMscfy or 7,779,645 7,580,250MMbtu.
The beneficial use of 17,228 16,845MMscfy of landfill gas yields the following emission reductions: 3.88 3.79MMTCO2E 182,186 178,133tons of methane per year 450,526 440,504tons CO2 per year
7,779,645 7,580,250MMBtu is equivalent to the avoided use of: 7,780 7580MMscfy of natural gas, or 55.6 54.14million gallons of #2 fuel oil, or over 311,185 303,210tons of coalData sources/Assumptions/Methods for Costs:
3

Draft PA Waste Subcommittee Work Plans, May 6, 2009
Estimating direct use project costs at $10/MMBtu, plus $0.45/MMBtu operation & maintenance costs per year. Developing an additional 5,528MMscfy or 2,487,600MMBtu would cost over $24,876,000 plus $3,607,000 or nearly $30 million.
Approximately $1 million per mile of pipeline based on direct use projects in PA. Retrofit costs for burners and boilers to utilize landfill gas for fuel approximately $30,000 -
$300,000 depending on size and type of retrofit. State permitting costs are undetermined but may include:
o Solid Waste beneficial use permit for landfill gas utilizationo Air Quality Program notifications and operational permit for landfill gas processing and
gas end-use equipment.o Storm water permitting and/or erosion and sedimentation controls may be needed.o Historic preservation or endangered species act may apply to pipeline right-of-ways.
Pipeline costs would increase accordingly. Local permitting may also apply.
Other Considerations/Notes: Should not apply to closed landfills. Dependent on landfill permitting. Require all active and recently closed landfills containing greater than 1 million tons of
disposed waste to install gas collection systems. Prioritize right of way access for landfill gas pipeline projects. Work with landfill gas project developers to identify the nearest economical end uses. Prioritize landfill gas projects presenting economic development benefits or that otherwise
enhance the application of renewable energy technologies. Require landfill gas electrical and thermal use projects to incorporate waste heat recovery.
This could help maximize fossil fuel displacement. Encourage projects that utilize all landfill gas generated at a site and/or projects able to grow
with landfill site gas generation. Promote the high reliability of landfill gas projects. Most projects are able to operate
continuously over extended periods of time other than for periodic maintenance. Prioritize self-powered thermal landfill gas projects that include an electric generation
component.
Potential Overlap Solid Waste Work Plan Recycling Work Plan Industrial Natural Gas BMPs Lost and Unaccounted for Natural Gas
4

Draft PA Waste Subcommittee Work Plans, May 6, 2009
Waste-2
Statewide Recycling InitiativeWork Plan for Potential GHG Reduction Measure
Lead Staff Contact: Gregory Harder (717) 787-0114Larry Holley (717) 787-7382
Initiative Summary: Support the expansion of statewide recycling to increase the amount of materials recycled. Achieve GHG reductions equivalent to 86% of the Commonwealth’s total recycling potential. This goal is equivalent to a 52.7% recycling rate, based on interpolation of 2005 baseline data and composition studies of landfilled and recycled waste.
Goals: Achieve 86% of Pennsylvania's recycling potential by 2025.
Implementation Period: YEAR ACTION % OF
GOAL*GHG REDUCTION
GHG REDUCTION
2000 Historical 2.1 MMTCE 7.7 MMTCO22012 Legislation and
Regulations in Place
20% 3.0 MMTCE 11 MMTCO2
2015 Increased Non-regulatory Enhancements
50% 3.8 MMTCE 14 MMTCO2
2020 Program Maintained and Improvement
80% 4.5 MMTCE 17 MMTCO2
2025 Completion 100% 5.0 MMTCE 18 MMTCO2** Total in Pennsylvania, including reductions due to recycling that is already happening. The incremental reduction in 2025 is estimated to be approximately 2.9 MMTCE, or 11 MMTCO2.
Parties Affected/Implementing Parties: DEP
Data Sources/Assumptions/Methods for GHG:
Baseline Recycling Composition Data Source: PA DEP. 2005. “Pennsylvania Recovered Material Composition Study.” Available on-line at: http://www.dep.state.pa.us/dep/deputate/airwaste/wm/RECYCLE/document/Rec_Mat_Comp.pdf
Baseline Landfill Waste Composition Source: PA DEP. 2003. “Statewide Municipal Waste Composition Study.” Section 4. Available on-line at: http://www.dep.state.pa.us/dep/deputate/airwaste/wm/RECYCLE/Waste_Comp/Study.htm.
5

Draft PA Waste Subcommittee Work Plans, May 6, 2009
CCS utilized the landfill and recycling composition studies to determine the percentage of the total waste disposed of in landfills or recycled. These percentages were multiplied by the waste landfilled and waste recycled in 2005 shown in Table 2. After adding 86% of the landfilled recyclables from Attachment 3 (recycling for material types adjusted to 2005 disposal and recycling data) to the baseline recycling, the resulting recycling rate was 52.7%. Assuming that the composition of waste landfilled and recycled does not change through 2025, the recycling rate needed to meet the goals of this Work Plan is 52.7% (recycling proportion of all waste generated).
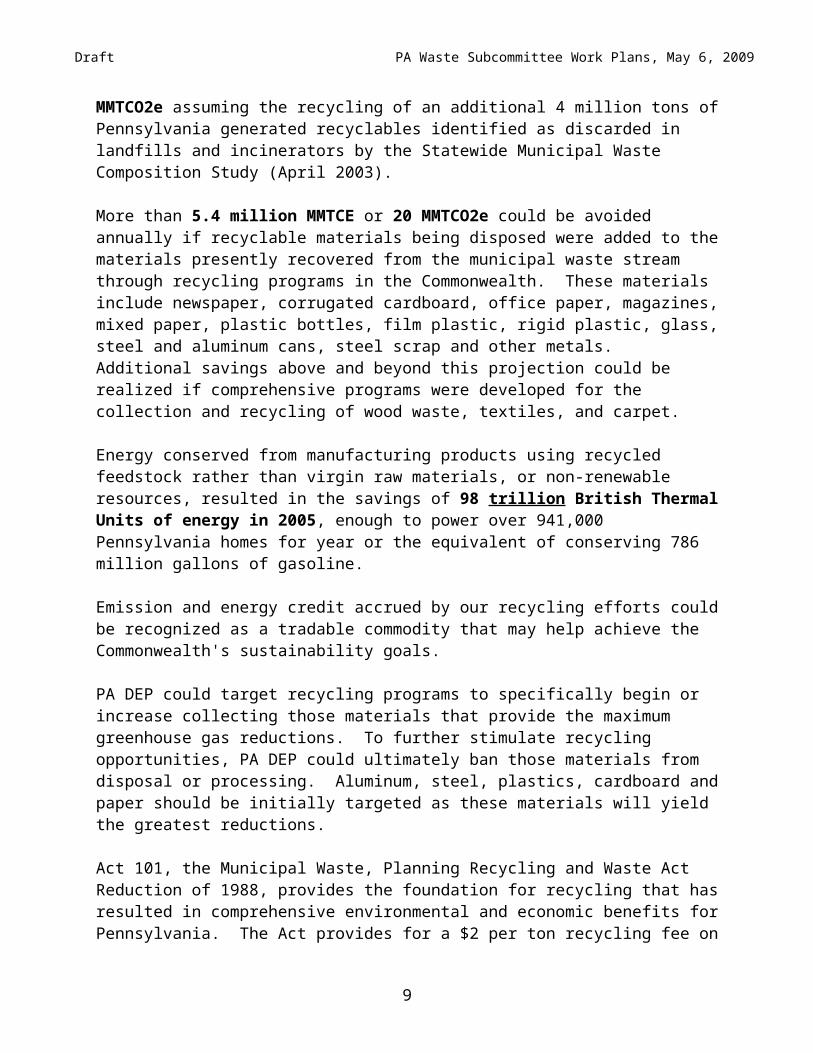
Based on data analyzed by the Northeast Recycling Council’s (NERC) Environmental Benefits Calculator, Pennsylvania saved 2.5 million metric tons of carbon equivalent (MMTCE) or 9 million metric tons of carbon dioxide equivalent (MMTCO2e) as a result of recycling approximately 4.9 million tons of materials in 2005. There is potential to reduce an additional 2.9 MMTCE or 11 MMTCO2e assuming the recycling of an additional 4 million tons of Pennsylvania generated recyclables identified as discarded in landfills and incinerators by the Statewide Municipal Waste Composition Study (April 2003).
More than 5.4 million MMTCE or 20 MMTCO2e could be avoided annually if recyclable materials being disposed were added to the materials presently recovered from the municipal waste stream through recycling programs in the Commonwealth. These materials include newspaper, corrugated cardboard, office paper, magazines, mixed paper, plastic bottles, film plastic, rigid plastic, glass, steel and aluminum cans, steel scrap and other metals. Additional savings above and beyond this projection could be realized if comprehensive programs were developed for the collection and recycling of wood waste, textiles, and carpet.
Energy conserved from manufacturing products using recycled feedstock rather than virgin raw materials, or non-renewable resources, resulted in the savings of 98 trillion British Thermal Units of energy in 2005, enough to power over 941,000 Pennsylvania homes for year or the equivalent of conserving 786 million gallons of gasoline.
Emission and energy credit accrued by our recycling efforts could be recognized as a tradable commodity that may help achieve the Commonwealth's sustainability goals.
PA DEP could target recycling programs to specifically begin or increase collecting those materials that provide the maximum greenhouse gas reductions. To further stimulate recycling opportunities, PA DEP could ultimately ban those materials from disposal or processing. Aluminum, steel, plastics, cardboard and paper should be initially targeted as these materials will yield the greatest reductions.
Act 101, the Municipal Waste, Planning Recycling and Waste Act Reduction of 1988, provides the foundation for recycling that has resulted in comprehensive environmental and economic benefits for Pennsylvania. The Act provides for a $2 per ton recycling fee on waste disposed or processed at municipal waste landfills and resource recovery facilities in the Commonwealth. The Recycling Fee generates approximately $47 million dollars annually to a Recycling Fund administered by Pa. DEP. The Recycling Fund provides support to local governments for
6

Draft PA Waste Subcommittee Work Plans, May 6, 2009
implementation of recycling programs. The Recycling Fee also supports the stimulation of markets for recyclable materials. The Department is focusing Act 101 funds on programs geared towards financial sustainability including those that are targeting new materials that were previously disposed. Increasing the amount of materials recycled will provide direct reduction in greenhouse gas emissions.
Pennsylvania’s recycling program provides annual economic benefits in excess of $23 billion and nearly 82,000 jobs (National Recycling Council, REI Study, 2001). The program also provides extensive environmental benefits. The 2.5 MMTCE eliminated in 2005 by recycling amounted to a savings of approximately 3 percent of all greenhouse gas emissions in the Commonwealth. Also, recycling conserved considerable natural resources. By recycling almost 1.2 million tons of steel cans, appliances and similar materials in 2005, Pennsylvania industries saved almost 1.5 million tons of iron ore, 829,786 tons of coal and 71,124 tons of limestone. Through recycling newspapers, phone books, office paper, cardboard and mixed paper, the Commonwealth saved the equivalent of 78 million tree seedlings grown for 10 years. These trees would sequester carbon dioxide from the atmosphere and store it in their wood.
Listed below in Table 1 is the baseline data that reflects the reduction of carbon equivalent since 2001.
Table 1: GHG Reduction under Historical Recycling
Historically, data reported to PA DEP demonstrates an annual modest increase in the tonnage of materials recycled. In 1989, the first full year of Act 101 recycling reporting, approximately 378,000 tons of materials were recycled. Since then the program has grown to nearly 4.9 million tons of materials recycled in 2005 (Table 2). These annual increases provide a proven track record of quantifiable environmental and economic benefits.
Table 2 Historical Disposal and Recycling Data
YEAR POPULA
TION DISPOSAL
PER CAPITA DISPOSAL PER DAY
RECYCLING
IN TONS IN TONS IN TONS2000 12,281,054 9,324,468 0.76 3,791,4332001 12,281,054 9,477,159 0.77 3,941,9492002 12,281,054 9,613,250 0.78 3,927,0482003 12,281,054 10,201,821 0.83 4,448,9372004 12,281,054 10,373,136 0.84 4,747,3322005 12,440,621 10,181,392 0.82 4,865,923
YEAR GHG REDUCTION2001 2.1 MMTCE2002 1.7 MMTCE2003 2.1 MMTCE2004 1.9 MMTCE2005 2.5 MMTCE
7

Draft PA Waste Subcommittee Work Plans, May 6, 2009
Include average annual growth rate and projected population.
Landfill capacity. PA currently has 16 years capacity. Under review for expansion would add another 7. (as communicated by Rick Illig, quoting Tom Siller?)
Larry Holley - may have data on State waste generation and import/export
Pennsylvania’s recycling data was analyzed in the NERC Environmental Benefits Calculator. The raw 2005 data inputs used for the analysis are displayed in Attachment 1. Attachment 2 shows GHG reductions estimated by the calculator for 2005. Attachment 3 shows GHG reductions based on the recycling of recyclable materials that were identified as disposed in the Statewide Waste Characterization Study (April 2003). Attachment 4 is the NERC Environmental Benefits Calculator in spreadsheet form including five worksheets reflecting 2005 Pa. recycling data.
Total Reduction: 10.3 MMTCO2e
18 MMTCO2e represents 86% of the state’s total recycling potential of 20 MMTCO2e. This has been determined to be a feasible goal. Baseline reductions have been subtracted to reveal the additional reductions gained by this measure (10.3 MMTCO2e).
Waste Management Scenario Projections
NOTE: THE HIGHLIGHTED SECTION BELOW DESCRIBES THE WASTE MANAGEMENT FORECAST THAT WAS PRESENTED AT THE LAST SUBCOMMITTEE MEETING. THE SUBCOMMITTEE ASKED CCS TO RETHINK THE GROWTH ASSUMPTIONS. CCS WILL PRESENT 9 SCENARIOS THAT WILL ALLOW THE SUBCOMMITTEE TO SELECT WHICH RECYCLING BASELINE AND GENERATION GROWTH RATE BEST REPRESENTS THE POTENTIAL BUSINSESS-AS-USUAL SCENARIO FOR PENNSYLVANIA.
Waste disposal data are available on the PA DEP website that display the amount of waste deposited at PA landfills and waste-to-energy / resource recovery facilities (hereafter referred to as WTE).1 This data also provides information on the origin of waste disposed, allowing for the identification of imported waste deposited at landfill and WTE facilities. CCS utilized this disposal data for 2005, in conjunction with the 2005 recycling total from Table 2, to develop the waste management baseline. The amount of MSW exported from PA (600,000 tons) is provided by an article in Biocycle magazine.2
1 PA DEP. “Municipal Waste Disposal Information.” Data available for 1988 through 2008. Available at: http://www.depweb.state.pa.us/landrecwaste/cwp/view.asp?A=1238&Q=464453. 2 Lrsova, Ljupka et al. 2008. “The State of Garbage in America – 16th Nationwide Survey of MSW Management in the U.S.” Biocycle. December 2008. Available for a limited time without subscription at www.biocycle.net.
8
Draft PA Waste Subcommittee Work Plans, May 6, 2009
Table 3 displays the waste management baseline that serves as the basis for the waste management scenario projections. The “MSW In-State Generation” total includes all in-state MSW deposited in PA landfills and WTE facilities that originated in PA, MSW exported from PA, and MSW recycled. The “In-State MSW Disposed in Landfills” is the sum of the “In-State MSW Disposed in PA Landfills” and “Reported MSW Exported.” The baseline recycling rate was calculated by dividing the tonnage of MSW recycled by the in-state MSW generation.
Table 3: 2005 Pennsylvania Baseline Waste Management
Item 2005MSW In-State Generation (tons) 15,547,278
Total MSW Disposed in PA Landfills (tons) 15,385,112
Total MSW Combusted in PA WTE Facilities (tons) 2,728,123
In-state MSW Disposed in PA Landfills (tons) 7,786,913
In-state MSW Combusted PA WTE Facilities (tons) 2,294,442
Reported MSW Exported (tons, assumed landfilled) 600,000
In-State MSW Disposed in Landfills (tons) 8,386,913
MSW Recycled (tons) 4,865,923
MSW Recycling Rate (%, MSW Recycled / In-State Generation)
31.3%
The baseline waste management from 2005 was utilized to project the business-as-usual and policy (implementation goal of 52.7% recycling rate) scenarios through 2025. The growth in waste generation (disposal + recycling) was assumed to follow the average annual growth from the 2000 – 2005 data presented in Table 2 (2.95%). The business-as-usual (BAU) waste management projection was generated by increasing the “In-State MSW Generation” annually by the average annual growth rate of 2.95% and assuming a constant recycling rate of 31.3% of in-state generation. Additional recycling in each year is assumed to reduce in-state waste landfilled, so waste disposed at WTE facilities increases constantly at 2.95%. The results of the BAU projection are displayed in Table 4.
Table 4: BAU Pennsylvania Waste Management, 2005 – 2025
Item 2005 2010 2012 2015 2020 2025MSW In-State Generation (tons)
15,547,278
17,975,616
19,050,025
20,783,238
24,029,384
27,782,548
Total MSW Disposed in PA Landfills (tons)
15,385,112
17,788,122
18,851,324
20,566,459
23,778,746
27,492,762
Total MSW Combusted in PA WTE Facilities (tons)
2,728,123 3,154,230 3,342,759 3,646,891 4,216,501 4,875,078
In-state MSW Disposed in PA Landfills (tons)
7,786,913 9,003,156 9,541,278 10,409,364
12,035,208
13,914,995
In-state MSW 2,294,442 2,652,812 2,811,371 3,067,156 3,546,217 4,100,103
9

Draft PA Waste Subcommittee Work Plans, May 6, 2009
Combusted PA WTE Facilities (tons)Reported MSW Exported (tons, assumed landfilled)
600,000 693,714 735,178 802,066 927,341 1,072,183
In-State MSW Disposed in Landfills (tons)
8,386,913 9,696,870 10,276,455
11,211,430
12,962,550
14,987,178
MSW Recycled (tons) 4,865,923 5,625,934 5,962,199 6,504,652 7,520,618 8,695,267
Table 5 displays the implementation of the Work Plan goal through 2025, including the incremental change in the recycling rate throughout the project period. The “Target Recycling Rate” from Table 5 was multiplied by the “MSW In-State Generation” from each year in Table 4 to yield the total tons recycled under the policy scenario, shown in Table 6. It was assumed that all incremental recycling will offset “In-state MSW Disposed in PA Landfills.”
Table 5: Implementation of Targets, 2010 – 2025.
Goal Implementation 2010 2012 2015 2020 2025Percent Implementation 7% 20% 50% 80% 100%
Target Recycling Rate 32.7% 35.6% 42.0% 48.4% 52.7%Incremental Increase in Recycling Rate 1.4% 4.3% 10.7% 17.1% 21.4%
Table 6: Policy Pennsylvania Waste Management, 2005 – 2025
Item 2005 2010 2012 2015 2020 2025MSW In-State Generation (tons)
15,547,278
17,975,616
19,050,025
20,783,238
24,029,384
27,782,548
Total MSW Disposed in PA Landfills (tons)
15,385,112
17,531,641
18,035,891
18,342,402
19,664,452
21,546,627
Total MSW Combusted in PA WTE Facilities (tons)
2,728,123 3,154,230 3,342,759 3,646,891 4,216,501 4,875,078
In-state MSW Disposed in PA Landfills (tons)
7,786,913 8,746,675 8,725,845 8,185,307 7,920,914 7,968,859
In-state MSW Combusted PA WTE Facilities (tons)
2,294,442 2,652,812 2,811,371 3,067,156 3,546,217 4,100,103
Reported MSW Exported (tons, assumed landfilled)
600,000 693,714 735,178 802,066 927,341 1,072,183
In-State MSW Disposed in Landfills (tons)
8,386,913 9,440,389 9,461,022 8,987,373 8,848,255 9,041,043
MSW Recycled (tons) 4,865,923 5,882,415 6,777,631 8,728,709 11,634,91
214,641,40
3 Incremental MSW Recycled (tons) - 256,481 815,433 2,224,057 4,114,294 5,946,135
WASTE MANAGEMENT PROJECTION SCENARIOS
10

Draft PA Waste Subcommittee Work Plans, May 6, 2009
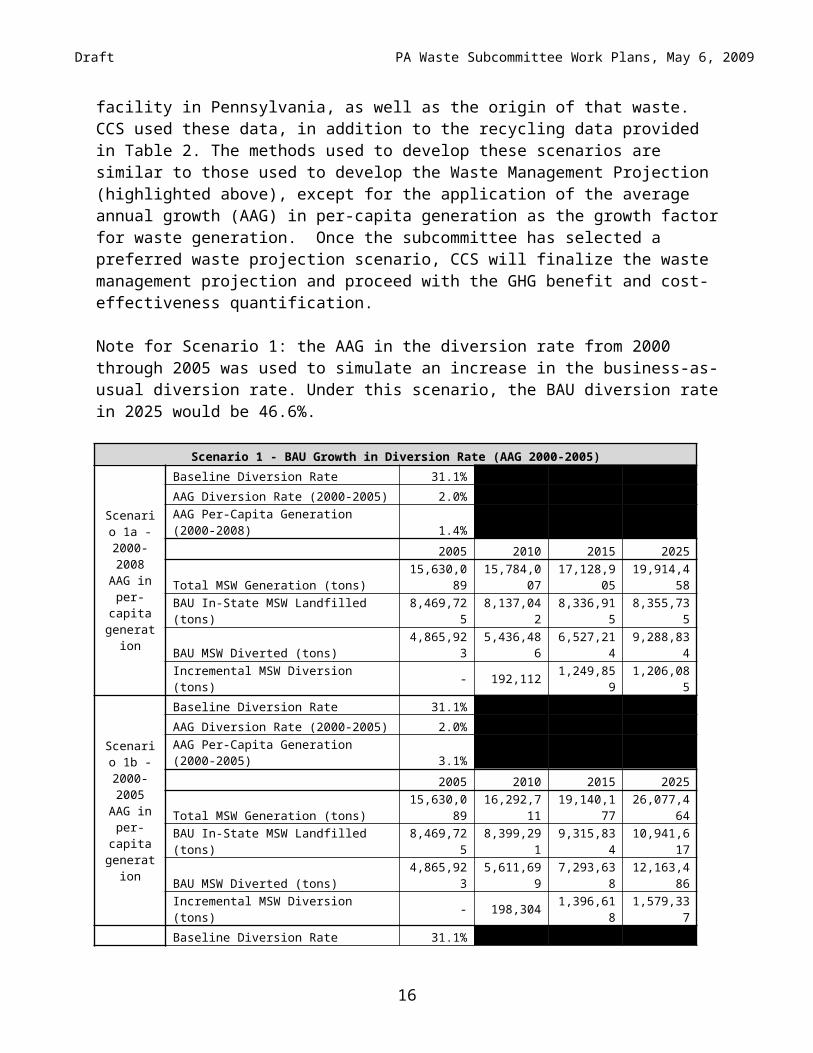
CCS was provided historical disposal data for 1990 through 2008 by PA DEP. These data show the amount of waste disposed at each facility in Pennsylvania, as well as the origin of that waste. CCS used these data, in addition to the recycling data provided in Table 2. The methods used to develop these scenarios are similar to those used to develop the Waste Management Projection (highlighted above), except for the application of the average annual growth (AAG) in per-capita generation as the growth factor for waste generation. Once the subcommittee has selected a preferred waste projection scenario, CCS will finalize the waste management projection and proceed with the GHG benefit and cost-effectiveness quantification.
Note for Scenario 1: the AAG in the diversion rate from 2000 through 2005 was used to simulate an increase in the business-as-usual diversion rate. Under this scenario, the BAU diversion rate in 2025 would be 46.6%.
Scenario 1 - BAU Growth in Diversion Rate (AAG 2000-2005)
Scenario 1a - 2000-2008 AAG
in per-capita
generation
Baseline Diversion Rate 31.1%
AAG Diversion Rate (2000-2005) 2.0%
AAG Per-Capita Generation (2000-2008) 1.4%
2005 2010 2015 2025
Total MSW Generation (tons)15,630,08
915,784,00
717,128,90
519,914,45
8
BAU In-State MSW Landfilled (tons) 8,469,725 8,137,042 8,336,915 8,355,735
BAU MSW Diverted (tons) 4,865,923 5,436,486 6,527,214 9,288,834
Incremental MSW Diversion (tons) - 192,112 1,249,859 1,206,085
Scenario 1b - 2000-2005 AAG
in per-capita
generation
Baseline Diversion Rate 31.1%
AAG Diversion Rate (2000-2005) 2.0%
AAG Per-Capita Generation (2000-2005) 3.1%
2005 2010 2015 2025
Total MSW Generation (tons)15,630,08
916,292,71
119,140,17
726,077,46
4
BAU In-State MSW Landfilled (tons) 8,469,725 8,399,291 9,315,834 10,941,617
BAU MSW Diverted (tons) 4,865,923 5,611,699 7,293,638 12,163,486
Incremental MSW Diversion (tons) - 198,304 1,396,618 1,579,337
Scenario 1c - 2003-2008 AAG
in per-capita
generation
Baseline Diversion Rate 31.1%
AAG Diversion Rate (2000-2005) 2.0%
AAG Per-Capita Generation (2000-2008) 0.1%
2005 2010 2015 2025
Total MSW Generation (tons)15,630,08
915,369,08
615,604,04
915,879,25
2
BAU In-State MSW Landfilled (tons) 8,469,725 7,923,140 7,594,743 6,662,638
BAU MSW Diverted (tons) 4,865,923 5,293,575 5,946,146 7,406,666
Incremental MSW Diversion (tons) - 187,062 1,138,594 961,700
11

Draft PA Waste Subcommittee Work Plans, May 6, 2009
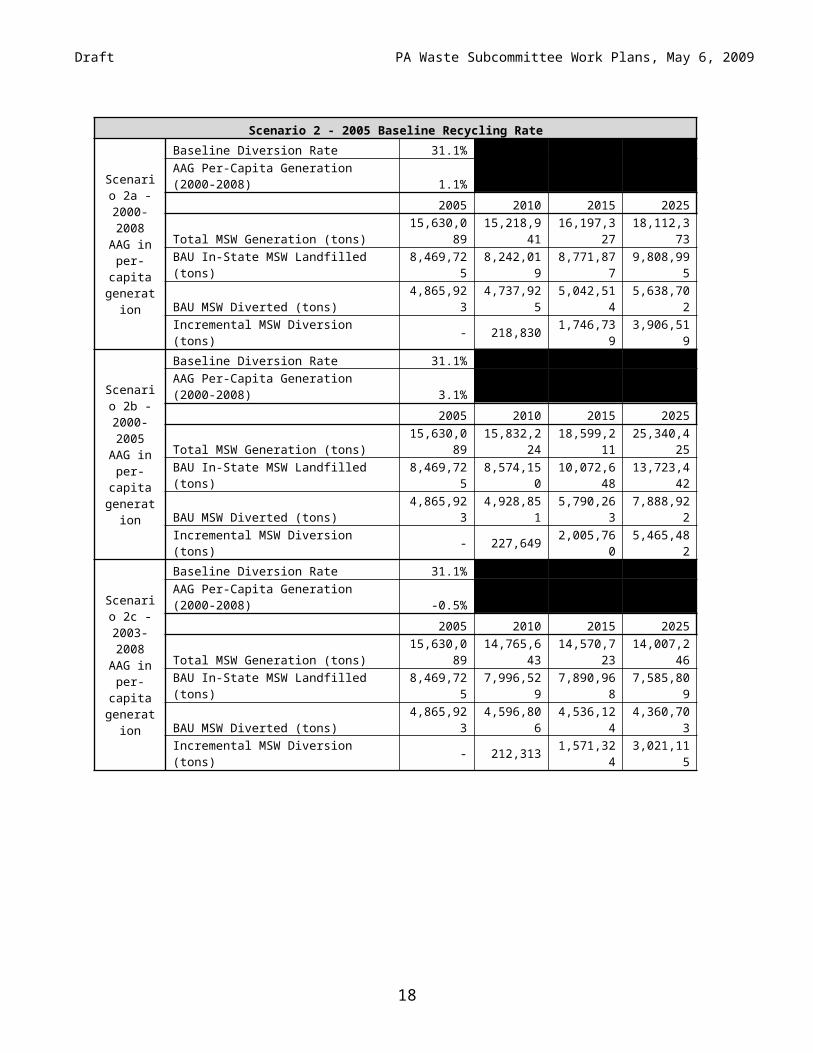
Scenario 2 - 2005 Baseline Recycling Rate
Scenario 2a - 2000-2008 AAG
in per-capita
generation
Baseline Diversion Rate 31.1%
AAG Per-Capita Generation (2000-2008) 1.1%
2005 2010 2015 2025
Total MSW Generation (tons)15,630,08
915,218,94
116,197,32
718,112,37
3
BAU In-State MSW Landfilled (tons) 8,469,725 8,242,019 8,771,877 9,808,995
BAU MSW Diverted (tons) 4,865,923 4,737,925 5,042,514 5,638,702
Incremental MSW Diversion (tons) - 218,830 1,746,739 3,906,519
Scenario 2b - 2000-2005 AAG
in per-capita
generation
Baseline Diversion Rate 31.1%
AAG Per-Capita Generation (2000-2008) 3.1%
2005 2010 2015 2025
Total MSW Generation (tons)15,630,08
915,832,22
418,599,21
125,340,42
5
BAU In-State MSW Landfilled (tons) 8,469,725 8,574,150 10,072,648
13,723,442
BAU MSW Diverted (tons) 4,865,923 4,928,851 5,790,263 7,888,922
Incremental MSW Diversion (tons) - 227,649 2,005,760 5,465,482
Scenario 2c - 2003-2008 AAG
in per-capita
generation
Baseline Diversion Rate 31.1%
AAG Per-Capita Generation (2000-2008) -0.5%
2005 2010 2015 2025
Total MSW Generation (tons)15,630,08
914,765,64
314,570,72
314,007,24
6
BAU In-State MSW Landfilled (tons) 8,469,725 7,996,529 7,890,968 7,585,809
BAU MSW Diverted (tons) 4,865,923 4,596,806 4,536,124 4,360,703
Incremental MSW Diversion (tons) - 212,313 1,571,324 3,021,115
12

Draft PA Waste Subcommittee Work Plans, May 6, 2009
Scenario 3 - 2000 Baseline Recycling Rate
Scenario 3a - 2000-2008 AAG
in per-capita
generation
Baseline Diversion Rate 28.2%
AAG Per-Capita Generation (2000-2008) 0.5%
2005 2010 2015 2025
Total MSW Generation (tons)15,630,08
914,450,12
514,969,01
315,858,07
6
BAU In-State MSW Landfilled (tons) 8,469,725 8,153,398 8,446,178 8,947,827
BAU MSW Diverted (tons) 4,865,923 4,081,804 4,228,377 4,479,515
Incremental MSW Diversion (tons) - 235,561 1,830,146 3,877,691
Scenario 3b - 2000-2005 AAG
in per-capita
generation
Baseline Diversion Rate 28.2%
AAG Per-Capita Generation (2000-2008) 3.1%
2005 2010 2015 2025
Total MSW Generation (tons)15,630,08
915,195,81
617,851,57
824,321,81
6
BAU In-State MSW Landfilled (tons) 8,469,725 8,574,150 10,072,648
13,723,442
BAU MSW Diverted (tons) 4,865,923 4,292,443 5,042,630 6,870,313
Incremental MSW Diversion (tons) - 247,717 2,182,576 5,947,284
Scenario 3c - 2003-2008 AAG
in per-capita
generation
Baseline Diversion Rate 28.2%
AAG Per-Capita Generation (2000-2008) -1.2%
2005 2010 2015 2025
Total MSW Generation (tons)15,630,08
913,949,37
513,230,74
211,750,52
5
BAU In-State MSW Landfilled (tons) 8,469,725 7,870,853 7,465,369 6,630,165
BAU MSW Diverted (tons) 4,865,923 3,940,354 3,737,358 3,319,233
Incremental MSW Diversion (tons) - 227,398 1,617,621 2,873,293
Data Sources/Assumptions/Methods for Costs: The overall cost to the Commonwealth needed to increase recycling to achieve the increased greenhouse gas reductions could be funded partially through the Recycling Fund, provided it is reauthorized by the General Assembly. The Commonwealth should realize an overall economic benefit from avoided waste disposal cost, increased numbers of jobs from an increased recycling industry, taxes from new business and some increased revenues from the sales of the new materials being recycled.
Industry may need to make some capital investments to facilitate increased collection. The capital expenditures should be recouped in a reasonable amount of time based on the avoided disposal costs. The avoided disposal costs in concert with the greenhouse gas reductions make any increased recycling expenditures a solid investment.
Implementation Steps: Pa. DEP has a three-pronged strategy to facilitate increased recycling in the Commonwealth. The separation into distinct areas will allow the Department to better monitor government progress with internal mechanisms. To ensure that industry and the general
13

Draft PA Waste Subcommittee Work Plans, May 6, 2009
public have meaningful input into the new recycling mandates the Department will utilize the regulatory process.
The first prong is focused on ensuring that we as state government are taking a leadership role and maximizing our recycling efforts. These efforts will be initiated with a new comprehensive management directive that will ensure all Commonwealth Agencies, Boards and Commissions are implementing recycling and waste reduction programs, as well as purchasing environmentally preferable products.
Secondly, the Department depends on county governments to report recycling activities within their jurisdiction, as required by Act 101. To facilitate more timely and improved reporting the Department will implement or procure a new or modified reporting system to capture much of the recycling data that currently goes unreported.
The third prong is focused on industry and waste companies. The Department will be making significant changes to the municipal and residual waste regulations that will prevent the disposal of certain materials and require new collection programs for a host of materials. This regulatory reform will take 18-36 months until a final rulemaking is in place. During that time the Department will continue its work in building increased capacity to recycle those materials banned from disposal. The Department will use existing Recycling Fund monies to support the development of infrastructure.
In addition to the three steps identified above, some consideration could be given to the elimination of the Sunset date (December 31, 2011) for the recycling fees. This would increase available funds for this and other related initiatives.
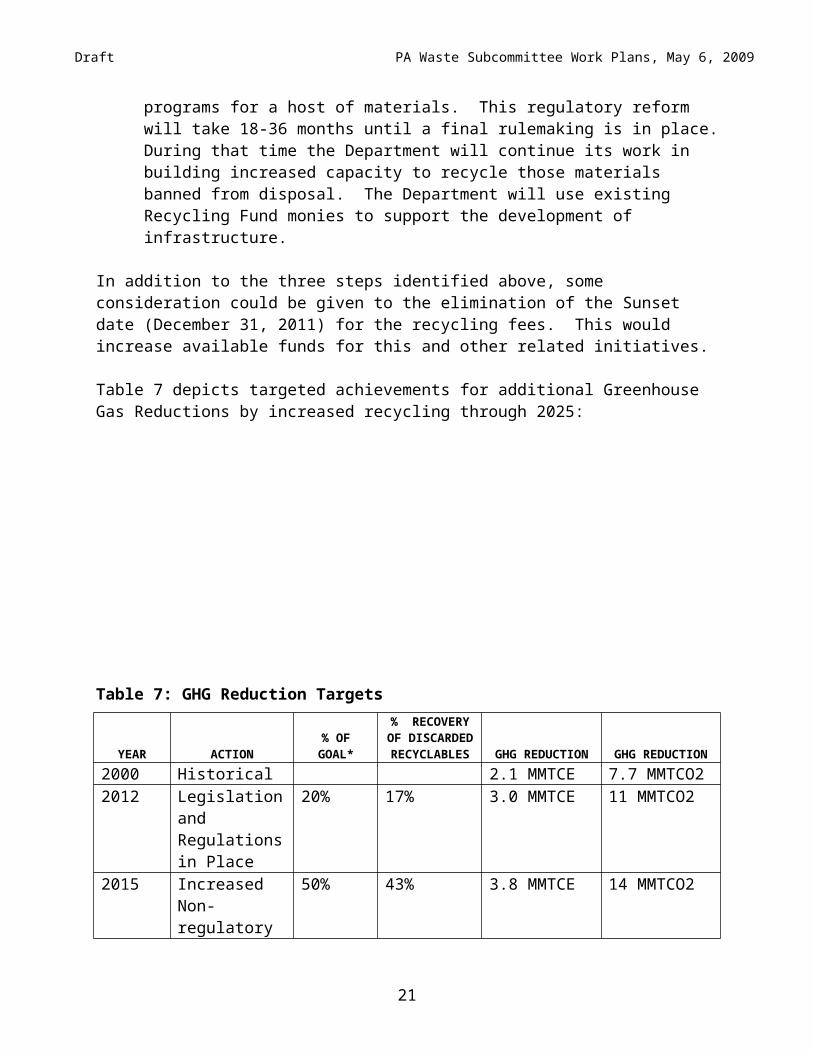
Table 7 depicts targeted achievements for additional Greenhouse Gas Reductions by increased recycling through 2025:
Table 7: GHG Reduction Targets
YEAR ACTION% OF
GOAL*
% RECOVERY OF
DISCARDED RECYCLABLES GHG REDUCTION GHG REDUCTION
2000 Historical 2.1 MMTCE 7.7 MMTCO22012 Legislation and 20% 17% 3.0 MMTCE 11 MMTCO2
14

Draft PA Waste Subcommittee Work Plans, May 6, 2009
Regulations in Place
2015 Increased Non-regulatory Enhancements
50% 43% 3.8 MMTCE 14 MMTCO2
2020 Program Maintained and Improvement
80% 69% 4.5 MMTCE 17 MMTCO2
2025 Completion 100% 86% 5.0 MMTCE 18 MMTCO2*** Assumes achievement of additional reductions of 2.5 MMTCE or 9.2 MMTCO2, 86% of the potential reduction of 2.9 MMTCE or 11 MMTCO2.
**18 MMTCO2e represents 86% of the state’s total recycling potential of 20 MMTCO2e. Baseline reductions have been subtracted to reveal additional reductions gained by this measure.
Potential Overlap: Increased Capture and Use of Landfill Methane Solid Waste Initiative
15
Draft PA Waste Subcommittee Work Plans, May 6, 2009
Other Considerations/Notes:
Attachment 1:
Pa. Materials Recycled, 2005
MATERIAL DEP Code(s) Breakout TONSFOOD WASTE FW1 66,481.70GLASSGLASS: CLEAR GL1 15,577.80GLASS: MIXED GL2 21,866.30GLASS: GREEN GL3 6,311.40GLASS: BROWN GL4 6,681.50GLASS: PLATE GL5 5,153.20GLASS: OTHER GL6 1,929.30
Subtotal Glass 57,519.50BATTERY: LEAD-ACID B01 22,169.90METALSALUMINUM CANS AA1 17,590.00FERROUS F01 580,142.10STEEL & BIMETALLIC (TIN) CANS F02 13,935.90WHITE GOODS F03 56,383.30MIXED METALS MM1 174,797.40MIXED CANS MX2 2,547.00NON FERROUS N01 48,413.40COPPER N02 4,524.60BRASS N03 2,349.60LEAD N04 167.5STAINLESS STEEL N05 203,794.40NICKEL N10 48.7WIRE/CABLE W01 1,455.30
Subtotal Metals 1,106,149.20PAPERPAPER: CARDBOARD C01 713,552.00PAPER: BROWN BAGS & SACKS C02 3,749.60PAPER: MAGAZINE PA1 24,682.80PAPER: NEWSPRINT PA2 244,252.40PAPER: MIX PA3 230,483.50PAPER: OFFICE PAPER PA4 76,303.80PAPER: COMPUTER PA5 3,807.70PAPER: PHONE BOOKS PA6 1,242.50
Subtotal Papers 1,298,074.30PLASTICSDRUM PLASTIC DR1 791.2PLASTIC: PET PL1 6,754.60PLASTIC: HDPE PL2 6,955.40PLASTIC: PVC (POLYVINYL/CHLORIDE) PL3 15,206.50
16

Draft PA Waste Subcommittee Work Plans, May 6, 2009
PLASTIC: LPDE (LOW DENSITY POLYETHYLENE)
PL4 2,598.90
PLASTIC: PP (POLYPROPLENE) PL5 3,236.20PLASTIC: PS (POLYSTYRENE) PL6 1850.2PLASTIC: MIXED PL7 16,225.60PLASTIC: FILM PL8 5,747.40PLASTIC: OTHER PL9 4,594.90
Subtotal Plastics 63,960.90SINGLE STREAM SS1 43,645.80TEXTILES M03 25,182.70TIRES M01 55,416.50WOOD WW1 213,284.90YARD TRIMMAGE Y03 585,681.50OTHER RECYCLABLESCIRCUIT BOARDS CB1 61.6CONSUMER ELECTRONICS CRT 2,900.00FLUORESCENT TUBES FL1 261HOUSEHOLD HAZARDOUS WASTE HHW 1,353.90MATTRESSES MT1 116.6ANTIFREEZE O02 1,342.20OIL FILTERS OL3 798.9COMMINGLED MATERIALS XXX 228,699.80
Subtotal Other Recyclables 235,534.00904 excess 25,929.00Tire excess 72,770.00ISRI excess 51,795.00Lancaster County (RE-Trac) INCORPORATED
TOTAL STANDARD 3,923,594.90TOTAL NON-STANDARD 942,328.10
GRAND TOTAL 4,865,923.00
17
Draft PA Waste Subcommittee Work Plans, May 6, 2009
Attachment 2:
Reductions in Greenhouse Gas Emissions as a Result of 2005 Recycling
Tons Recycled
Greenhouse Gas Emissions
Associated with Recycling (MTCE)
Greenhouse Gas Emissions if
Recyclables Had Been Disposed
(MTCE)
Net Greenhouse
Gas Emissions
from Recycling as Compared to
Disposal (MTCE)Reporting Year 2005
Aluminum Cans 33,619 -124,418 381 -124,799Steel Cans 44,590 -21,817 -2,494 -19,323Glass 201,097 -15,239 2,194 -17,433HDPE 40,115 -15,230 1,923 -17,152LDPE 2,599 -1,201 125 -1,326PET 39,736 -16,667 2,161 -18,828Corrugated Cardboard 714,526 -606,295 46,378 -652,673Magazines/Third-class Mail 25,935 -21,718 -2,313 -19,405Newspaper 276,048 -210,163 -63,883 -146,280Office Paper 76,652 -59,629 32,309 -91,939Phonebooks 1,721 -1,246 -398 -848Textbooks 0 0 0 0Whole Computers 0 0 0 0Food Scraps 66,482 -3,600 10,599 -14,199Yard Trimmings 585,682 -31,717 -35,002 3,286Grass 0 0 0 0Leaves 0 0 0 0Branches 213,285 -11,550 -25,957 14,407Ferrous Scrap Metal 650,458 -318,251 -36,376 -281,875Aluminum Scrap Metal 31,681 -117,246 359 -117,605Copper Wire 0 0 0 0Tires 128,187 -63,783 2,101 -65,884Construction & Demolition 688,211 NA NA NACarpet 0 0 0 0Dimensional Lumber 0 0 0 0Medium-density Fiberboard 0 0 0 0Clay Bricks 0 NA NA NAAggregate 0 0 0 0Fly Ash 0 0 0 0Mixed Paper, Broad Definition 244,234 -235,593 12,891 -248,484Mixed Metals 490,360 -703,102 -17,722 -685,380Mixed Plastics 47,652 -19,418 2,407 -21,825
18

Draft PA Waste Subcommittee Work Plans, May 6, 2009
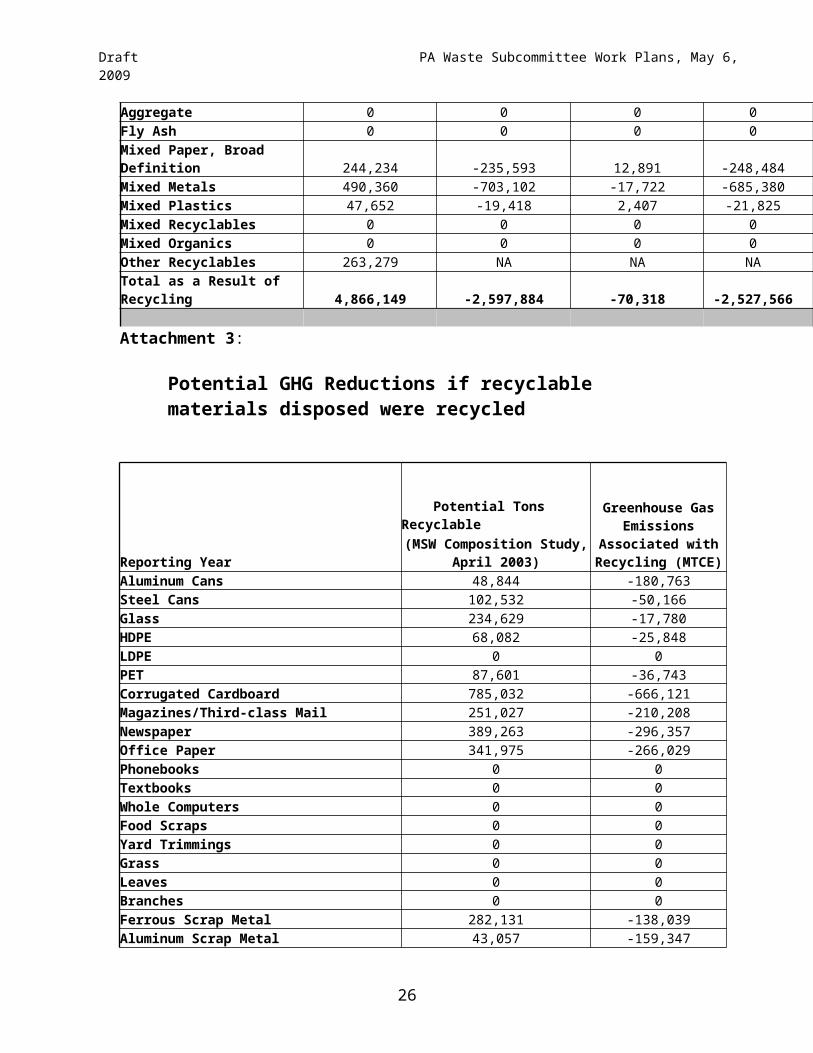
Mixed Recyclables 0 0 0 0Mixed Organics 0 0 0 0Other Recyclables 263,279 NA NA NATotal as a Result of Recycling 4,866,149 -2,597,884 -70,318 -2,527,566 Attachment 3:
Potential GHG Reductions if recyclable materials disposed were recycled
Potential Tons Recyclable
Greenhouse Gas Emissions
Associated with Recycling (MTCE)Reporting Year
(MSW Composition Study, April 2003)
Aluminum Cans 48,844 -180,763Steel Cans 102,532 -50,166Glass 234,629 -17,780HDPE 68,082 -25,848LDPE 0 0PET 87,601 -36,743Corrugated Cardboard 785,032 -666,121Magazines/Third-class Mail 251,027 -210,208Newspaper 389,263 -296,357Office Paper 341,975 -266,029Phonebooks 0 0Textbooks 0 0Whole Computers 0 0Food Scraps 0 0Yard Trimmings 0 0Grass 0 0Leaves 0 0Branches 0 0Ferrous Scrap Metal 282,131 -138,039Aluminum Scrap Metal 43,057 -159,347Copper Wire 0 0Tires 0 0Construction & Demolition 0 NACarpet 0 0Dimensional Lumber 0 0Medium-density Fiberboard 0 0Clay Bricks 0 NAAggregate 0 0Fly Ash 0 0Mixed Paper, Broad Definition 433,821 -418,473
19

Draft PA Waste Subcommittee Work Plans, May 6, 2009
Mixed Metals 32,138 -46,081Mixed Plastics 906,653 -369,457Mixed Recyclables 0 0Mixed Organics 0 0Other Recyclables 0 NATotal as a Result of Recycling 4,006,785 -2,881,412
Attachment 4:
NERC Environmental Benefits Calculator, 2005 Pa. Recycling Data
20
Draft PA Waste Subcommittee Work Plans, May 6, 2009
Waste-3
Solid Waste Management InitiativeWork Plan for Potential GHG Reduction Measure
Lead Staff Contact : Mike Texter (717) 783-6006 or TBD ? (717) 787-2783
Initiative Summary: The Solid Waste Management Initiative is comprised of three (3) strategies:
Alternative Fuels Derived from Waste Waste to Energy (WTE) Reduced Transportation of Waste
These strategies aim to utilize the energy potential of residual and municipal waste and decrease the energy used to transport waste to landfills. Reduction numbers result as conventional energy sources (fossil fuels) are displaced by energy derived from waste, and reductions of transportation energy. Utilizing these waste materials for energy will also prevent a significant amount of material from being disposed of in landfills.
Goals: Need goal for the third element - Reduced Transportation of Waste. Wastae-to-Energy element moved to Waste-6.
Implementation Period: See table for implementation for the first two elements.
Parties Affected/Implementing Parties: DEP
Data Sources/Assumptions/Methods for GHG:
Alternative Fuels: In 2005, Pennsylvania saved ~2.5 Million Metric Tons of Carbon Dioxide Equivalent (MMTCOe) as a result of direct use of 1.26 million tons3 of waste as alternative fuels. The Commonwealth can reduce an additional ~5.4 MMTCOe by using an additional 2.71 million tons of Pennsylvania generated municipal and residual wastes as alternative fuels. These materials include non-recyclable paper, wood, mixed paper, plastic, textiles and carpet. The alternative fuels that would be generated would be solid fuels for use in cement kilns, large industrial boilers or waste coal facilities (any wood waste used at waste coal facilities would be a double count with AEPS Tier I reductions).
3 http://www.dep.state.pa.us/dep/deputate/airwaste/wm/recycle/waste_comp/study.htm1.26 million tons waste as alternate fuel – from April 2003 R. W. Beck “Final Report: Statewide Waste Composition Study.” Used multiplier of 2 to yield 2.5 MMTCO2-e.http://www.dep.state.pa.us//dep/subject/advcoun/solidwst/swac2007.htm2.71 million tons municipal/residual waste - April 11, 2007 meeting – “Presentation on Waste-to-Energy. Link is “PPT.” 22-slide Power Point presentation. Slide 16 “Potential Supply of Alternative Fuels.” Used multiplier of 2 to yield 5.4 MMTCO2-e.
21

Draft PA Waste Subcommittee Work Plans, May 6, 2009
There is potential to reduce an additional ~4.5 MMTCOe assuming the use of an additional 2.23 tons of recyclable materials that are currently being land filled. These materials include cardboard, film plastic, newspaper, office paper and magazines.
Waste Transportation: In 2006, the transportation of waste from the Allentown/Bethlehem/Easton area, New Jersey, New York and Philadelphia to disposal facilities in Pennsylvania outside of these areas consumed 39.2 million4 gallons of fuel. Providing waste management options near the point of generation would save 0.42 MMTCOe.
The GHG reductions assumed that sold waste growth rates would be constant in the future. In actuality we know that solid waste will experience growth, which could possibly increase the GHG reductions realized by these initiatives. The constant growth assumption reduces the GHG reduction potential of this initiative, which appropriately accounts for the overlap effect of the expanded recycling and landfill methane recovery initiatives.
GHG emissions will result from the burning of solid alternative fuel and the operation of waste to energy facilities. However, reductions in GHGs are realized from avoided landfill emissions and the displacement of traditional energy sources with solid waste derived energy sources.
Alternative Fuels: As part of the Waste Futures initiative, the Department identified the current and future market for alternative fuels. The Department is currently working on additional general permits to facilitate the use of alternative fuels. Long-term actions include regulatory changes to further reduce obstacles to use of waste as an energy source. These actions will result in the reduction of 5.4 MMTCOe.
Waste Transportation: Excessive waste disposal capacity and low tipping fees in western Pennsylvania encourage the long distance transportation of waste. The Waste Futures initiative will identify legislative, regulatory and other actions the Department can take to reduce excess waste disposal capacity. These actions will result in the reduction of 0.42 MMTCOe.
Total Reductions: 9.87 MMTCO2e
Data Sources/Assumptions/Methods for Costs: From 2009-2011(?), WTE facilities will be supported by funds already committed to the solid waste program via the Recycling Fund. These funds will not divert dollars away from the expanded recycling initiative because they come from a dedicated funding stream that is separate from
4 Based on 2006 county waste disposal information posted on DEP website.
22

Draft PA Waste Subcommittee Work Plans, May 6, 2009
recycling funding. In 2015, it is assumed that significant market potential will have been created for WTE facilities that will cause counties and private industry to invest in construction to increase WTE capacity. This market potential is a result potential profitability from: sale of electricity generated, funds earned through collection of tipping fees, and savings from avoided landfill construction costs. The Department should work with PA counties to update their solid waste management plans to include waste to energy facilities. Concurrently, the Department should also work on legislative and regulatory changes to reduce or ban the disposal of certain types of materials.
Long-term actions include regulatory changes to further reduce obstacles to use of waste as an energy source. The Waste Futures initiative will identify legislative, regulatory and other actions the Department can take to reduce excess waste disposal capacity.
The following table depicts implementation steps and targeted achievements for additional greenhouse gas reductions from solid waste management through 2025:
23

Draft PA Waste Subcommittee Work Plans, May 6, 2009
YEAR ACTION % OF GOAL
GHG REDUCTION COST ESTIMATE
2009 Alternative Fuels - Increase use of alternative fuels by developing general permits for alternative fuels.
2.5MMTCOe (baseline)
None
WTE – Work with counties to include WTE in their solid waste plans
2.3 MMTCOe (baseline)
The Department reimburses counties for 90% of the cost to revise county plans from the Recycling Fund. Annual costs are $850,000
2010 Alternative Fuels - Increased use of waste as fuels by developing general permits for alternative fuels, start revising regulations to reduce obstacles to the use of waste as fuel.
10% 5.8 MMTCOe None
WTE – Work with counties to include WTE in their solid waste plans. Initiate legislation and regulations to ban disposal of selected materials
The Department reimburses counties for 90% of the cost to revise county plans from the Recycling Fund. Annual costs are $850,000
2012 Alternative Fuels - Increased use of alternative fuels by finalizing regulations to reduce obstacles to the use of waste as fuel.
25% 7.3 MMTCOe None
WTE - Legislation and Regulations in Place, Continue to update county plans. Counties will start process to construct additional WTE
The Department reimburses counties for 90% of the cost to revise county plans from the Recycling Fund. Annual costs are $850,000
2015 WTE - Increased use of Waste to Energy. Additional waste to energy capacity of 2.6 million tons per year in place.
50% 9.8 MMTCOe Approximately $700 - 900 million of public or private funds would be used to construct additional capacity.
Transportation - Reduce excess disposal capacity
None
2020 WTE - Increased use of Waste to Energy. Additional waste to energy capacity of 2.6 million tons per year in place.
80% 12.2 MMTCOe Approximately $700 - 900 million of public or private funds would be used to construct additional capacity.
2025 Completion 100% 14.7 MMTCOe
Potential Overlap: Increased Landfill Methane Capture Work Plan
24

Draft PA Waste Subcommittee Work Plans, May 6, 2009
Fuels for Schools Work Plan Recycling Work Plan AEPS Tier I (@8%, 15%, 20%) Work Plans
Other Considerations/Notes:
25
Draft PA Waste Subcommittee Work Plans, May 6, 2009
Waste-4
Improved Efficiency at Wastewater Treatment Facilities
Work Plan for Potential GHG Reduction Measure
Lead Staff Contact: Nicki Kasi (717) 772-4053
Initiative Summary: Improving Efficiency at Wastewater Treatment Facilities through outreach programs based on Sustainable Infrastructure principals.
Goals: Assist 6-8 treatment plans per year to improve efficiency
Implementation Period: 6-8 treatment plans per year starting in 2010? through 2025?
Parties Affected/Implementing Parties: DEP, Outreach Assistance Provider Program (OAPP), Wastewater system owners/operators
Data sources/Assumptions/Methods for GHG:
The Office of Water Management proposes several methods to improve efficiency in order to maintain sustainable infrastructure (SI) within wastewater treatment systems. The efficient use of energy is crucial for sustaining infrastructure and national security. Electrical energy rate cap expirations set for 2010 further exacerbate this issue.
Wastewater treatment plants typically are the largest consumer of electricity on most municipal bills, often consuming more than 1/3 of the energy consumed for all municipal services. In many instances, opportunities exist to reduce energy consumption at these facilities. In order to assist treatment plants in improving efficiency, DEP provides outreach to these facilities, teaching system operators how to use the system in the most efficient manner for treatment and suggesting ways to reduce the amount of energy required to operate the facility.
There are three basic types of treatment plants in use today, activated sludge, fixed film and lagoon systems. Of the many treatment facilities in Pennsylvania, approximately 70% are activated sludge facilities. These facilities inject diffused air into an aeration basin to sustain a biological growth in order to treat the wastewater. The aeration basins that these facilities require are the largest consumer of electricity in wastewater treatment systems. Opportunities exist to improve efficiency in many of these facilities throughout the state.
The Outreach Assistance Provider Program (OAPP) uses part-time wage payroll instructors who are certified operators or specialists in a given field. These instructors provide on-site technical, managerial, and financial assistance to wastewater system
26

Draft PA Waste Subcommittee Work Plans, May 6, 2009
owners and operators. The program responds to system needs identified by DEP regional staff, local government associations, or system personnel. On-site assistance and training is provided through a combination of videos, classroom and web-based training, and one-on-one assistance to address specific system problems. In the coming fiscal year, OAPP plans on accomplishing the following: Continuing on-site technical assistance for facilities requesting assistance with energy
efficiency. The average activated sludge wastewater treatment plant consumes 6,000 KWH per million gallons of wastewater treated. At approximately $0.08 per KWH, the energy consumption is estimated at $500 per million gallons treated. Using energy audits under the auspices of the OAPP, DEP proposes to assist 6 to 8 wastewater systems in reducing energy consumption in FY 2008-2009, with a focus on doing at least one per DEP region. On average, these audits will result in an estimated annual energy savings of 10 to 15% in the cost of KWH per treatment plant. It must be kept in mind that due to the relatively low cost of electricity in the past, the preference for wastewater treatment has been aerobic treatment processes. This will no longer be the most cost-effective solution once the expected sharp increases in costs per KWHs take place. Therefore, a further focus of this outreach effort will be to encourage and re-educate the owners and operators of wastewater treatment systems on the benefits of more energy efficient and effective wastewater treatment processes related to anaerobic treatment.
Continuing collaboration with Central and Regional staff in providing training opportunities for operators in conjunction with various associations.
Integrating the principles of SI in all technical assistance provided by the Outreach Assistance Provider Program. This would include providing training in regard to all aspects of SI.
Distributing the DVD on energy efficiency and other tools for SI. In conjunction with the Pennsylvania Water Environment Association, another
special Nutrient Reduction Technology conference is scheduled for this fall in the Scranton area on September 10 - 12, 2008. This year’s conference will include energy efficiency, improvements to water quality and other principals of SI.
Enhancements to the operator information center website "Technical Corner" as it relates to SI, energy efficiency and other operational issues.
The DEP Wastewater Outreach Program has provided assistance in energy efficiency since 1993. Unfortunately, in the 1990's energy costs were not high enough to cause a significant amount of interest. While we had several success stories in the past, many people simply were not tuned into the idea of energy efficiency. In one case, we saved a municipality over $100,000 annually (approximately 6.0 MGD system). By today's standards this type of savings would be greatly magnified. With the pending expiration of electrical energy rate caps and the spiraling cost of oil, people are now starting to pay attention and ask questions. Below are examples of our past accomplishments:
27

Draft PA Waste Subcommittee Work Plans, May 6, 2009
On site technical assistance to Ridgeway Borough on energy efficiency and process control. This project utilized the process of denitrification to save energy and chemical costs. This process utilizes the nitrate that is produced in the process of nitrification for facultative organism respiration. This results in improved water quality by reducing total nitrogen released to the receiving stream and saves money. With an investment of $500, Ridgeway was able to document savings of $31,000 annually in energy and chemical costs in addition to improving the quality of their effluent.
On site technical assistance to the City of Warren in regard to energy efficiency. In this system older sparge ring diffusers were used for mixing and aeration. By changing the cycles of mixing and aeration, the system could realize a savings of several thousand dollars per month. This project is still underway.
DEP Central and Regional office staff collaborated to produce a continuing education training program titled "Flush Away High Energy Costs". In conjunction with PA Rural Water, this training session was piloted in the NW region and was well received by operators all over the region. This session provides the operators with the tools they need to reduce energy costs within their system while maintaining or improving water quality.
In 1996, a video was produced jointly between DEP, and the Maryland Center for Environmental Training in regard to energy efficiency in wastewater treatment systems. In the past year, this video was upgraded and digitized to a DVD format so it can be widely distributed.
A training session was held for DEP Central and Regional Office staff on energy efficiency in water/wastewater systems. This session was held in the State College area and followed a format similar to the operator training session known as "Flush Away High Energy Costs". This session will help regional staff to further spread the word in regard to energy efficiency.
A special conference on Total Nutrient Reduction was held in the Lancaster area last fall. This sold out event provided operators and managers with tools needed to improve reduction of nutrients and increase efficiency.
Assistance was provided to program staff involved in a pilot project with Montgomery County Community College to create a certificate program focusing on water and wastewater treatment. Based on the input provided, the pilot program will be modified to include basics of SI with an emphasis on energy efficiency, as well as effective process control.
All treatments plants produce excess solids, often referred to as sludge or biosolids. These excess solids have to be treated before ultimate disposal. There are two basic types of treatment for these solids, aerobic digestion and anaerobic digestion. Anaerobic treatment tends to be more energy neutral or even produce energy as the methane produced through this process can be used as a fuel. Unfortunately, this technology is not used in many instances in Pennsylvania due to past problems with the operation, mostly due to problems in handling the gases produced in the treatment process. Technology in this arena has improved in recent years, making the management of these systems safer and more efficient. PA DEP currently has a pilot project in the works that will use
28

Draft PA Waste Subcommittee Work Plans, May 6, 2009
anaerobic treatment and, depending on the outcome of this project, expects that other facilities may consider this option moving forward.
In the past fiscal year, we had several projects in this arena. These projects are closely tied into the overall goal of SI. In many cases, treatment systems have operated in a fashion set forth by previous generations where energy consumption was not a large concern. Taking a moment and asking why we operate in this fashion can lead to significant opportunities for reduced energy costs and improved water quality. By today's standard, any treatment facility that is required to nitrify should also consider denitrification, as it can lead to reduced operating costs, lower sludge production and improved water quality.
Based on past program performance, treatment facilities visited by this program tend to treat around 1 to 2 million gallons of water per day. By visiting 6 to 8 facilities, it is expected that we will reach facilities that when combined, treat the equivalent of 6 to 7 million gallons of water treated per day. Calculations on savings are as follows:
6,000 KWH/Million gallons treated x 1.5 million gallon/day facility = 9,000 Kwh/day
9,000 KWH x 365 days = 3,285,000 kWH/yr or 3,285 mWH/yr
Savings at these facilities is estimated at 10%, so
3,285 mWH/yr x .10 = 328.5 MWH savings per facility
Converting to CO2 emissions
328.5 MWH x 1278.9 (conversion factor) = 420,120 lbs/yr
Conversion to tons
420,120/2000 = 210 tons/year 210 x .907 (conversion factor) = 190.5 metric tons/yr per facility
By visiting 6 facilities per year we can save 1143 metric tons/year through this program or .001143 million metric tons of CO2e per year.
Data Sources/Assumptions/Methods for Costs:
Need clarification for costs to owners/operators.
Cost to DEP o Energy efficiency is an integral part of the OAPP, where the cost for
implementing this strategy will be minimal. Interest in this program is expected to increase as people start to realize two factors, the first being
29

Draft PA Waste Subcommittee Work Plans, May 6, 2009
that energy prices are rising sharply and second factor is that rate caps expire in 2010. DEP is starting to receive more requests.
Cost to Commonwealth o The cost here would be to do nothing. Rising energy prices will force
utilities to raise prices. The most efficient first step is to use energy wisely.
The savings realized by energy efficient measures could easily be used to fund improved water quality. In fact, in cases where a facility starts using denitrification for the beneficial uptake of NO3, there would be a recovery of 60% of the cost of nitrification and improved water quality at the same time. Cost savings are certain, and the savings could escalate as energy costs continue to rise. It is a goal for systems to be self-sustaining in the water/wastewater industry. The single largest cost for a wastewater system is the cost of aeration. Fine bubble aeration could reduce those costs by 50%. This money could be incorporated into sustainable infrastructure.
Implementation Steps: None. This program is already in existence.
Potential Overlap: Most Electricity Sector Initiatives
Notes/Other Considerations:
30

Draft PA Waste Subcommittee Work Plans, May 6, 2009
Waste-5
Waste-to-Energy DigestersWork Plan for Potential GHG Reduction
Measure Strategy Name: Waste-to-Energy Digesters Lead Staff Contact: Kim Hoover (717-772-5161) Summary: This initiative encourages an expansion of the basic on-farm or sewage treatment plant digester that can offer larger scale and higher technology treatment.
Goals: Need specific goals
Implementation Period: Need to know when goals would be reached (for example: reach 50% of goal by 2015 and 100% of goal by 2025)
Parties Affected/Implementing Parties: DEP, communities and local governments, businesses, food companies
Data sources/Assumptions/Methods for GHG: Need data on digesters - how much they can digest, the amount of biogas produced
From Joe Sherrick:Focusing on thermophilic anaerobic digestion rather than the common mesophilic technologies that predominate on U.S. farms and wastewater treatment plants. Technologies common in Europe provide for mixed feedstocks, yield more gas and are more efficient. The effluent (digestate) is closely monitored and allows for precision agriculture as the participating farmers receive a guaranteed NPK analysis for fertilizer application. Depending on the exact technology/vendor selected for these digesters, about 50% of the input is manure and the remainder is some combination of food residues, crop residues, yard wastes, organic fraction of MSW or sewage sludge.
In the regional model, New feedstocks for digesters include food waste and yard waste as well as conventional
manure and sludge. Waste-to-energy digesters produce electrical power along with high grade solid and
liquid end-products. The business community can participate as both users and investors. Food companies would have an outlet for food waste. Concept expands upon local on-farm digesters that produce power for farm use and
treated solid and liquid fertilizers.
31

Draft PA Waste Subcommittee Work Plans, May 6, 2009
Data Sources/Assumptions/Methods for Costs: Need costs of implementation and costs of energy replaced
Implementation Steps:
Potential Overlap: Notes/Other Considerations:
32

Draft PA Waste Subcommittee Work Plans, May 6, 2009
Waste-6
Waste-to-Energy MSWWork Plan for Potential GHG Reduction
Measure Strategy Name: Waste-to-Energy Municipal Solid Waste Lead Staff Contact: Kim Hoover (717-772-5161) Summary: This initiative encourages more waste-to-energy projects and waste volume in the energy mix.
Goals: 40 % increase in Waste-to-Energy derived from MSW by 2030
From Dave Vallero, York County Solid Waste Authority: Currently PA burns 8,730 tons/day waste in 6 waste-to-energy facilities 30-40% additional capacity over the next 20 years is feasible With the right incentives there could be more growth Some thoughts on incentives-
o Make it easier to flow waste to privately-owned facilitieso Include waste-to-energy in state renewable energy standardso Make waste-to-energy Tier I
Implementation Period: 20% increase by 2020, 40% by 2030
Parties Affected/Implementing Parties: DEP, power stations, private and public WTE facilities
Data sources/Assumptions/Methods for GHG:
Need data on WTE GHG savings once there are specific goals in place Waste to Energy (WTE): In 2006, Pennsylvania saved 2.3 MMTCOe5 as a result of recovering energy from 2.92 million tons of municipal and residual waste. The Commonwealth can reduce an additional 4.1 MMTCOe by recovering energy
5 http://www.dep.state.pa.us//dep/subject/advcoun/solidwst/swac2007.htmMay 10, 2007 meeting – link is at “Waste as an Alternative Fuel” presented by Brian Bahor, Covanta Energy (23-slide Power Point presentation).2.92 million tons of MSW is from slide 10 – 2005 data – EfW (Energy from Waste).2.3 MMTCO2-e is from slide 13 – EfW 2.34 MMTCO2-e/year (Used a multiplier of 0.788 tons CO2-e generated per ton MSW combusted.).
33

Draft PA Waste Subcommittee Work Plans, May 6, 2009
from an additional 5.2 million tons6 of Pennsylvania municipal and residual wastes from metropolitan areas with sufficient waste generation to justify a waste to energy facility. These metropolitan areas include Allegheny, Berks, Chester, Lackawanna, Lehigh, Luzerne, Montgomery, Northampton and Philadelphia counties.
There is potential to reduce an additional 10.1 MMTCOe assuming the recovery of energy from all of the remaining 12.9 million tons of municipal and residual waste with energy value currently being land filled in Pennsylvania. This includes 6.6 MMTCOe from 8.4 million tons of out-of-state waste with energy value that could occur outside of Pennsylvania, which is not included in the 2025 goal.
GHG emissions will result from the burning of solid alternative fuel and the operation of waste to energy facilities. However, reductions in GHGs are realized from avoided landfill emissions and the displacement of traditional energy sources with solid waste derived energy sources.
WTE: The recent Oneida-Herkimer Supreme Court Decision should encourage regional solid waste authorities to revisit the role of waste to energy as a waste management option. As remaining landfill capacity is exhausted in Bucks, Chester, Lehigh, Montgomery and Northampton counties there will be additional incentives for these regions to invest in waste to energy capacity. The Department will work with these counties to update their solid waste management plans to include waste to energy facilities. Concurrently, the Department will also work on legislative and regulatory changes to reduce or ban the disposal of certain types of materials. Subsequent efforts will focus on Allegheny, Berks, Lackawanna, and Luzerne counties as their remaining landfill capacity is exhausted. These actions will result in the reduction of 4.05 MMTCOe.
6 http://www.depweb.state.pa.us/landrecwaste/cwp/view.asp?A=1216&Q=488974link is at “2006 Residual Waste Biennial Report Data” (Excel spreadsheet – 2006_rw.xls).5.3 million tons is probably combustible portion of the total 19.4 million tons of residual waste (“2006 PA RW” tab of spreadsheet).Additional 4.1 MMTCO2-e is 0.788 times 5.2 million tons residual waste (same multiplier as that used by Covanta).
34

Draft PA Waste Subcommittee Work Plans, May 6, 2009
Data Sources/Assumptions/Methods for Costs: Costs of implementing, $ million savings from energy displaced.
Need costs of retrofits of existing WTE facilities.
From 2009-2011(?), WTE facilities will be supported by funds already committed to the solid waste program via the Recycling Fund. These funds will not divert dollars away from the expanded recycling initiative because they come from a dedicated funding stream that is separate from recycling funding. In 2015, it is assumed that significant market potential will have been created for WTE facilities that will cause counties and private industry to invest in construction to increase WTE capacity. This market potential is a result potential profitability from: sale of electricity generated, funds earned through collection of tipping fees, and savings from avoided landfill construction costs. The Department should work with PA counties to update their solid waste management plans to include waste to energy facilities. Concurrently, the Department should also work on legislative and regulatory changes to reduce or ban the disposal of certain types of materials.
Long-term actions include regulatory changes to further reduce obstacles to use of waste as an energy source. The Waste Futures initiative will identify legislative, regulatory and other actions the Department can take to reduce excess waste disposal capacity.
35

Draft PA Waste Subcommittee Work Plans, May 6, 2009
The following table depicts implementation steps and targeted achievements for additional greenhouse gas reductions from solid waste management through 2025:
YEAR ACTION % OF GOAL
GHG REDUCTION COST ESTIMATE
2009 WTE – Work with counties to include WTE in their solid waste plans
2.3 MMTCOe (baseline)
The Department reimburses counties for 90% of the cost to revise county plans from the Recycling Fund. Annual costs are $850,000
2010 WTE – Work with counties to include WTE in their solid waste plans. Initiate legislation and regulations to ban disposal of selected materials
The Department reimburses counties for 90% of the cost to revise county plans from the Recycling Fund. Annual costs are $850,000
2012 WTE - Legislation and Regulations in Place, Continue to update county plans. Counties will start process to construct additional WTE
50% 9.8 MMTCOe The Department reimburses counties for 90% of the cost to revise county plans from the Recycling Fund. Annual costs are $850,000
2015WTE - Increased use of Waste to Energy. Additional waste to energy capacity of 2.6 million tons per year in place.
80% 12.2 MMTCOe Approximately $700 - 900 million of public or private funds would be used to construct additional capacity.
2020 WTE - Increased use of Waste to Energy. Additional waste to energy capacity of 2.6 million tons per year in place.
100% 14.7 MMTCOe Approximately $700 - 900 million of public or private funds would be used to construct additional capacity.
2025 Completion
Potential Overlap: Increased Landfill Methane Capture Work Plan Fuels for Schools Work Plan Recycling Work Plan AEPS Tier I (@8%, 15%, 20%) Work Plans
Implementation Steps:
Potential Overlap:
Notes/Other Considerations:
36
Related Documents