ACOUSTICAL MEASUREMENTS OF THE VORTEX NOISE FOR A ROTATING BLADE OPERATING WITH AND WITHOUT ITS SHED WAKE BLOWN DOWNSTREAM by James Scheiman, David A. Hilton, and James P. Shivers Langley Research Center Hampton, Va, 23365 NATIONAL AERONAUTICS AND SPACE ADMINISTRATION WASHINGTON, D. C. AUGUST 1971 .ii https://ntrs.nasa.gov/search.jsp?R=19710021947 2020-03-16T02:38:09+00:00Z

Welcome message from author
This document is posted to help you gain knowledge. Please leave a comment to let me know what you think about it! Share it to your friends and learn new things together.
Transcript

ACOUSTICAL MEASUREMENTS OF THE VORTEX NOISE FOR A ROTATING BLADE OPERATING WITH A N D WITHOUT ITS SHED WAKE BLOWN DOWNSTREAM
by James Scheiman, David A. Hilton, and James P. Shivers
Langley Research Center Hampton, Va, 23365
NATIONAL AERONAUTICS A N D SPACE ADMINISTRATION WASHINGTON, D. C. AUGUST 1971 .ii
https://ntrs.nasa.gov/search.jsp?R=19710021947 2020-03-16T02:38:09+00:00Z

TECH LIBRARY KAFB, NM
2. Government Accession No. I 1. Report No.
NASA TN D-6364 4. Title and Subtitle
ACOUSTICAL MEASUREMENTS OF THE VORTEX NOISE FOR A ROTATING BLADE OPERATING WITH AND WITHOUT ITS SHED WAKE BLOWN DOWNSTREAM
James Scheiman, David A. Hilton, and James I?. Shivers
~
7. Author(s1
9. Performing Organization Name and Address
NASA Langley Research Center Hampton, Va. 23365
I llllll Ill11 lllll IIHl lllll Ill11 lllll11111111 0 L 3 2 B 5 L
3. Recipient’s Catalog No.
5. Report Date August 1971
6. Performing Organization Code
8. Performing Organization Report No.
L-7715 10. Work Unit No.
760-76-01-04 . - 11. Contract or Grant No.
.. 1 13. Type of Report and Period Covered 12. Sponsoring Agency Name and Address
National Aeronautics and Space Administration Washington, D.C. 20546
I Technical Note 14. Sponsoring Agency Code I
. ~. I k.- Supplementary Notes
- _ - - __.
16. Abstract
Tests to make acoustical measurements of rotating-blade vortex noise were conducted Measurements were made for two different blade sections
The blades were operated in their own shed wake and also with the at the Langley Research Center. with several tip shapes. shed wake blown downstream. The resul ts a r e tabulated and presented as the 1/3-octave- band acoustical amplitude along with the corresponding tes t conditions. Preliminary eval- uation indicates that the tip-shape changes had very little effect on the overall sound pres- sure level. Introducing axial velocity to blow away the blade shed wake for a rotating blade of circular c ros s section resulted in an increase in the overall noise level while the overall noise level decreased for an airfoil-section blade.
The resul ts confirm that the acoustical radiation is related to the form drag.
-- . - 17. Key Words (Suggested by Authoris))
Noise Vortex noise Rotating blade noise
- _. ~
18. Distribution Statement
Unclassified - Unlimited
20. Security Classif. (of this page)
Unclassified I 19. Security Classif. (of this report)
Unclassified _. . _.
F o r sale by t h e National Technical Informat ion Service, Springfield, Virginia 22151
I

ACOUSTICAL MEASUREMENTS OF THE VORTEX NOISE FOR A
ROTATING BLADE OPERATING WITH AND WITHOUT
ITS SHED WAKE BLOWN DOWNSTREAM
By James Scheiman, David A. Hilton, and James P. Shivers Langley Research Center
SUMMARY
An investigation has been made in the Langley full-scale tunnel and in the outdoors to determine some of the characteristics of vortex noise generated by a rotating-blade system, tunnel without wind, and then with wind to impose a small axial velocity which blew the shed wake downstream before passage of the following blade. were made for two configurations. open and with several tip shapes installed, the other was a symmetrical airfoil section. The complete basic data a r e presented in tabular form and a part of the data is plotted for ready examination of a few of the key points for which the investigation was run.
The rotating blade was operated at zero lift, f i r s t in i ts shed wake in the wind
Acoustical measurements One was a round pipe which w a s tested with the ends
A cursory evaluation indicates that the tip-shape changes had very little effect on the overall sound pressure level. The results also indicate that the acoustical radiation is related to the form drag. The introduction of the small axial velocity resulted in an increase in the overall noise level for the circular-cross-section blade while the overall noise level decreased for the airfoil-section blade.
INTRODUCTION
Rotor noise is a major operating problem of helicopter and propeller -driven air - craft. The development of satisfactory methods for predicting so-called vortex noise has been an objective of the helicopter and propeller industry but a lack of experimental data has prevented the achievement of this goal. The origin of vortex noise has been attributed by some scientists to Von K5rmkn vortex shedding and by others to turbulence ahead of the blade. For example, reference 1 assumes that blade surface pressures can be separated into those giving r i s e to normal lift and drag and those associated with the shedding of eddies resulting from pressure oscillations on bluff bodies, namely vortex street effects, whereas, reference 2 indicates that the vortex noise is associated with the random turbulence ahead of the blade which in turn causes surface-pressure oscillations.

A shortage of experimental information on vortex noise has seemed the major impediment to devising a method of correlating theory with test results. The present investigation was performed in order to help overcome this obstacle. It consisted of noise measurements during tests of a rotor at zero lift for two blade configurations with various tip shapes. The tests included rotor operation with the blade rotating in its own shed wake and with the shed wake blown downstream. In order to make the data available to others working in the field at the earliest possible date, the complete data from the tests are presented herein in tabulated form with only a cursory analysis to indicate some of the more obvious characteristics.
SYMBOLS
Values a r e given in both SI and U.S. Customary Units. The measurements and cal- culations were made in U.S. Customary Units.
D rotor diameter, m (ft)
N measured average rotor rotational speed, rpm
nominal rotor rotational speed, rpm NO
R rotor blade radius, m (ft)
r hall radius, m (ft)
V axial velocity, m/sec (ft/sec)
X,Y,Z coordinates of microphone positions, m (ft)
n angular velocity, rad/sec
APPARATUS AND TESTS
The object of the tests was to provide information to show whether the vortex noise of a rotor is related to blade shape, profile drag, or to the turbulence of the air. These factors are important with regard to basic understanding of the problem and relate to basic assumptions of various theoretical treatments. The basic concept of the test pro- gram was to make sound pressure measurements for a two-bladed rotor at zero lift with blades of high-drag and low-drag configurations operating in their own turbulent wake and
2

with the wake blown away. The tests were run mainly in a wind tunnel, with the rotor shaft alined with the direction of the wind so that with wind on the wake could be blown away. The wind speeds used were very low and were intended only to blow the blade wake away before it was encountered by the following blade. The wind tunnel was an open-test-section type with a large test chamber. The measurements were subject to the test-chamber reverberation effects, therefore tests were also made outdoors at zero wind velocity for correlation. These outdoor tests were performed in an attempt to achieve a free-field condition.
Rotor Blades
A two-bladed rotor system was used for the investigation. The blades were 3.05 m (10 f t ) in diameter with a maximum thickness of 5.08 cm (2 in.). Two differently shaped blades were used. One was simply a piece of steel tubing of a circular c ross section. Figure 1 is a photograph of this cylindrical blade and the different blade-tip modifications tested. The second rotor model consisted of two variations of an NACA 0012 airfoil sec- tion fabricated around a 5.08-cm-diameter (2-in.) cylindrical steel spar. chord was approximately 42.5 cm (16.7 in.). cident with the axis of the cylindrical spar. (l-ft) radius to the blade tip. cal twist, such that with the proper combination of rotational speed and axial velocity there would be zero lift on the section throughout the blade span. Photographs of the twisted and untwisted blades are shown in figures 2(a) and 2(b), respectively. ent blade-tip shapes were tested. was a body of revolution with a radius equal to one-half the blade thickness at the chord station. figuration numbers. A rudimentary attempt was made to evaluate vortex-noise varia- tions related to airfoil shape changes. This was accomplished by gluing spoilers on the untwisted airfoil section throughout the span length. The spoilers measured 0.318 cm (1/8 in.) thick by 1.27 cm (1/2 in.). Photographs of the airfoil c ross section without and with the spoilers a r e shown in figures 2(c) and 2(d), respectively. Figure 3 indicates the location of the spoilers on the blade. No. 14 grit was applied to the leading edges of some of the configurations in order to cause the boundary layer to be fully turbulent (see fig. 3).
The blade The airfoil quarter-chord axis was coin-
The airfoil section extended from the 0.305-m One variation had zero blade twist and the other had a heli-
Two differ- One of the tips was a squared-off end and the other tip
Table 1 describes the various configurations of both blades and gives their con-
Test Setup
The rotor was driven by a variable-frequency 746-kW (1000-hp) electric motor with more than adequate torque and good rotational-speed control. The tests in the wind tun- nel were made in the Langley full-scale tunnel, and a photograph of the model setup in the tunnel is shown in figure 4. The rotor rotational axis was in the center of the tunnel and approximately 3.96 m (13 f t ) above the groundboard. The microphone locations for
3

the wind-tunnel tests (indoor) are given in table 2. A photograph of the model setup for the outdoor tests is shown in figure 5. The rotor axis was alined parallel to and approx- imately 2.44 m (8 f t ) above the ground level. The outdoor microphone locations are given in table 2. These outdoor tests were conducted at a near zero wind condition only.
Data Acquisition
The noise measurement equipment used for these tes ts is a commercially available system and certain components of these systems can be seen in the photographs of fig- ure 6. The microphones were a piezo-electric ceramic type having a 2.54-cm-diameter (1-in.) active diaphragm and frequency response that was flat to within *lg dB over the range of 20 to 12 000 Hz. For the indoor tes ts the outputs of 6 microphone channels were recorded on one 7-channel FM magnetic-tape recorder. For the outdoor tes ts 12 micro- phone systems were used and the output of these systems was recorded on two 7-channel FM magnetic-tape recorders. All measurements were made in accordance with the recommendations of reference 3. The entire sound measurement system was calibrated immediately before and after the acoustical measurements by means of discrete frequency calibrators. The acoustical measurements were accepted only when the recorded pre- and post-calibration amplitude was within 1/4 dB. In addition, the acoustical measure- ments were accepted only when the recorder voltages for each microphone were between peak-to-peak root-mean-square values of 1.0 and 2.8 volts.
For both the indoor and outdoor measurements, one of the microphones was oriented so that its diaphragm was parallel to the reflecting surface. For the outdoor tests micro- phone number 11 was so oriented and positioned in the ground. During the indoor tes t s microphone number 2 was so oriented and positioned in the wind-tunnel groundboard. During all tes ts microphone wind screens (see fig. 6(b)) were employed on all microphones except for microphone number 2 in the indoor tests. These wind screens have been shown to have no appreciable effect on the noise measurements below a frequency of about 15 000 Hz.
Data Reduction
The data obtained from these tests were reduced by analog and by digital methods, The analog method was used to cross check data as it was obtained. In order to obtain the detailed 1/3 -octave-band information contained in this report digital computational methods were used. The data from the original analog tapes were played into a 1/3- octave-band parallel filter set. The output of the filter set was digitized and was then sampled every 1/2 second. Thus at each 1/2-second interval a complete 1/3-octave- band listing was obtained. Samples were taken over a 30-second interval and the result was averaged to obtain the 1/3-octave-band amplitude listed in table 6. The corre- sponding overall level was then computed by combining the averaged 1/3 -octave-band
4

amplitude. It should be pointed out that the lowest band does not include the fundamental blade -passage frequency.
Tests
The test conditions and the corresponding run numbers are presented in tables as follows:
Table Subject
3 4 Cylindrical -blade tests 5 NACA 0012 airfoil-blade tests
Ambient-noise tests in wind tunnel
The rotor rotational speed was structurally limited. The cylindrical blade was lim- ited to 950 revolutions per minute which corresponds to a rotational tip speed and tip Reynolds number of approximately 151.2 m/sec (496 ft/sec) and 0.53 X lo6, respectively. The NACA 0012 airfoil-section blade was limited to a rotational speed of 850 revolutions per minute which corresponds to a rotational tip speed and tip Reynolds number of approx- imately 135.6 m/sec (445 ft/sec) and 3.96 X lo6, respectively.
DISCUSSION O F TABULATED DATA
The test operating conditions are given in tables 3, 4, and 5 according to run num- bers. The tabulated noise data a r e given in root-mean-square values in table 6 in accord- ance with the run numbers.
Wind-Tunnel Tests
The ambient noise levels in the wind tunnel were not judged to be time dependent. Table 3 gives the test conditions for which ambient indoor noise data were recorded. Where a rotational speed is listed in table 3 the rotor drive motor was running with the blades removed. The measured data from the indoor tests are presented without correc- tions for reverberation effects. A general indication of the magnitude and significance of reverberation effects is afforded, however, by comparison with the outdoor tests. Also, a preliminary calibration of reverberation effects in the test chamber has been made and some of the results of these tests are presented to assist in evaluation of the indoor-test results.
There is some question about the validity of measurements from microphone num- ber 2 which was located in the surface of the tunnel groundboard in order to obtain reflec- tion effects. During the early part of the tests it was noticed that the microphone was not vibration isolated from the groundboard. Since the microphones are vibration sensitive it is possible that extraneous information ?s given for this microphone. Also, since
5
. .

microphone number 4 was only a few feet from the test-chamber wall the radiated rotor noise at this distance is not appreciably above the ambient level (low signal to noise ratio). Therefore the data for this microphone have been omitted from table 6.
During the wind-tunnel tests of the circular cross-section blade with leading-edge gr i t (model 03) some structural instabilities were encountered. The gr i t was applied throughout the span 1.27 cm (0.5 in.) on each side of the line through the blade tangential- velocity vector (see fig. 3(b)). The purpose of the grit was to evaluate Reynolds number effects. With the introduction of axial velocity the model with the grit became aerody- namically unsymmetrical even though the axial- to tangential -velocity ratio was quite small. It is believed that this small aerodynamic dissymmetry resulted in some aero- dynamic lifting which developed into a blade-flapping flutter instability. As a result of this instability (structural limit) the rotor rotational speeds had to be restricted in runs 55 through 61 (table 4).
Outdoor Tests
The outdoor tests were run in the early morning and the recorded noise data were in some cases time dependent. The test conditions for which ambient outdoor noise data were recorded are given in tables 4(b) and 5(b). These test conditions a r e tabulated chronologically in the order in which the tes ts were performed.
The outdoor tests were performed in near zero wind conditions. As can be seen from the ambient test runs (i.e., runs 74, 80, 101, 106, 111, 112, 117, and 122) the back- ground noise was quite low. The tests were performed over a grassy area. The ground reflection effects can be evaluated by comparing the tabulated sound pressure levels on microphones 10 and 11.
Some difficulties were encountered in reading the revolution-per -minute recorder for the rotor during the outdoor tests of the airfoil-section blade. For these cases the revolutions per minute were determined from records of the blade inplane s t ra in gages (gravity component of bending moments) and are given in table 5 as determined although the listed values a r e perhaps farther away from the nominal values than desired. The nominal values a r e 400, 625, 700, 850, and 900 rpm.
DISCUSSION OF RESULTS
A preliminary evaluation and analysis of a portion of the data have been completed and the resul ts a r e presented herein.
Reverberation Effects
An evaluation of the reverberation effects of the wind-tunnel test chamber is published in reference 4. This evaluation was obtained by making acoustical noise
6

measurements at various distances and directions from a known sound source located above the test platform. In addition, the reverberation time around the test section was also measured. These measurements yielded the so-called hall radius which is defined as the distance from the source where the sound pressure of the direct field equals the space-average sound pressure of the reverberant field. Further, with the reverberant sound pressure equal to the direct-field sound pressure (at one hall radius from the source) 'the resulting measurement will be 3 dB above the corresponding free-field mea- surements and at a distance of one-half a hall radius this difference would be l dB. These results have been extrapolated to determine the hall radius for a few of the models and operating conditions for the tes ts reported herein.
The hall radius var ies with the directivity and frequency of the noise source. directivity and frequency were determined from the outdoor tests which were all run at a near zero-wind condition. without wind in the tunnel. the blade with the NACA 0012 airfoil section, were evaluated for various rotational speeds and 1/3 -octave -band -center frequencies.
The
Therefore, the test-chamber hall radius was determined Both models, the blade with the circular c ross section and
The ratio of hall radius to rotor diameter r/D for different directions from the source showing the effect of source frequency and rotor rotational speed is plotted in fig- ures 7 and 8 for model 01 (circular cross-section blade) and model 10 (airfoil-section blade), respectively. The zero-degree azimuth position is alined with the rotor rota- tional axis (using the right-hand rule). The center-band frequencies weie limited to a range from 125 to 2000 Hz because the original test-chamber acoustical evaluation indi- cated that the 1000-Hz frequency band resulted in the smallest hall radius and that for frequencies less than 125 Hz or greater than 2000 Hz the hall radius is greater than that for a frequency of 250 Hz. This assumes that the directivity of the source is approxi- mately the same for all frequencies, which is a valid assumption. worst reverberation conditions. table 2, it can be seen in figures 7 and 8 that microphones number 1, 2, 3, and 5 w e r e inside of or near the hall radius with the exception of the 1000-Hz frequency band. There- fore the tabulated data are between 1 and 3 dB too high due to the proximity to the rever- berant field (1 dB corresponds to a microphone position located at one-half of the hall radius). f rom the source than one hall radius for all of the plotted data. number 6 is in the reverberant field, and the tabulated data are at least 3 dB too high due to the proximity of the reverberant field.
This range covers the Knowing the nominal locations of the microphones from
Also, figures 7 and 8 indicate that microphone number 6 is a greater distance Therefore, microphone
Comparisons of indoor and outdoor noise frequency spectra are presented in fig-
The comparison is for zero axial velocity and for one microphone position at ures 9 and 10 for model 01 (circular c ross section) and model 10 (airfoil section), respec- tively. 2 rotor diameters' distance and alined along the axis of rotor rotation.

The comparison of the indoor and outdoor resul ts for the cylindrical blade (see fig. 9) denotes quite good agreement in the amplitude of the spectrum distribution. correlation of the amplitude of the spectrum distribution between indoor and outdoor resul ts for the airfoil-section blade (see fig. 10) is also quite good, but not as good as for the cylindrical blade. It appears that there is approximately a 7-dB difference between indoor and outdoor resul ts for the blades having NACA 0012 airfoil sections whereas the tests of the cylindrical blades (see fig. 10) indicate approximately a 2-dB difference. This result does not seem consistent with the computations and discussion of the hall radius in figures 7 and 8.
The
A further attempt was made to evaluate the reverberation characteristics of the test chamber through the use of the inverse square law. Recall that doubling the distance is equivalent to a 6-dB decrease in overall sound pressure level. Figure 11 shows a com- parison of the overall sound pressure level for two microphones with nominal positions of 2 and 6 rotor diameters' distance along the rotor rotational axis. A difference of 9.6 dB in sound pressure level would be expected if the noise source were in a free field, whereas a zero difference would indicate a completely reverberant field. ences in the data shown in figure 11 indicate that the test chamber is a reverberant cham- ber, at least in the direction along the rotor rotational axis.
The 5- to 6-dB differ-
Certainly additional evaluation of the reverberant-field effects is desired before performing a very detailed analysis of the results. Hence, all further preliminary eval- uation in this report is restricted to the use of overall sound pressure levels and is con- fined to the indoor measured data, which covered the most test conditions.
Effect of Tip Shape
Vortex-noise radiation has been shown to be proportional to the blade -tip velocity to the 5.5 power (ref. 5). By far the largest portion of the noise level, therefore, origi- nates from the blade tip. Thus, it is reasoned that changes in the blade-tip fluid-flow conditions might produce large changes in the noise level. Wind-tunnel tests of stationary circular cylinders (refs. 6 and 7) with various tips have shown a significant effect of tip shape. In order to confirm this influence on rotating blades, various geometric tip shapes were tested (see fig. 1). The preliminary results of a portion of these tes ts are shown in figure 12(a) for microphone number 5 and in figure 12(b) for microphone number 1. From both of these figures, it is evident that the various blade-tip shapes tested did not produce any significant differences in the overall sound pressure levels for the two different microphone locations. A cursory review of the tabulated data for the blade with the NACA 0012 airfoil section shows the same results, namely no noticeable noise-radiation differences with blade-tip shape changes.
8

Effect of Reynolds Number
Figure 13 shows the effect of grit on the leading edge of the cylindrical blade. The grit was intended to indicate the effect of Reynolds number by causing the boundary layer to be turbulent at all values of Reynolds number, as is the case at high Reynolds num- ber without the grit. Model 03 is the blade with No. 14 grit applied to the leading edge. The critical Reynolds number for this round section is about 4 X lo5 (ref. 8) which for a 5.08-cm (2-in.) reference length corresponds to a velocity of about 114 m/sec (375 ft/sec). This critical speed is indicated by the tick mark on the abscissa of fig- ure 13. Blade-section speeds above this critical value are associated with turbulent boundary-layer flow whereas speeds less than this critical value are associated with laminar flow for model 01 which does not have the s t r ip of grit. It is evident from fig- ure 13 that at tip speeds below that for critical Reynolds number model 03 with the tur- bulent boundary layer produces a lower sound pressure level than model 01 with a lam- inar boundary layer. Other investigators have shown that the radiated sound pressure level is proportional to the flow velocity to some power. This relationship will appear as a straight line with a slope equal to a power of the velocity on a decibel-velocity plot since the decibel scale is a logarithmic function. parallel straight lines (same power) can be drawn through the data, one line through the laminar data and another through the turbulent data. These resul ts are consistent with those in reference 9.
From figure 13 it appears that two
Effect of Form Drag
Figure 14 presents a comparison of the sound pressure level for the two different blade c ross sections (circular and NACA 0012 airfoil) with and without axial velocity and for two different microphone locations. The results indicate that even though the frontal areas for the two blades a r e the same, the blade with the circular section makes a significantly larger noise level both with and without axial fluid flow. This conclusion is in agreement with the conclusions in reference 10, where it is stated that the inten- sity of vortex sound increases in proportion to the form drag. However, Yudin (ref. 10) encountered difficulty separating rotational and vortex noise with the commencement of axial flow. did not produce lift. Acoustically, it is concluded that although they have the same fron- tal area the cylindrical and airfoil blades behave differently and that this difference exists when the rotor operates with or without axial velocity.
This difficulty is not believed present in this investigation because the blades
Effect of Turbulence
An attempt was made to determine more explicitly the origin of vortex noise. A preliminary evaluation of the results is presented in figure 15 which depicts the effect,
9

for two different microphone positions, of imposing a small axial velocity on the rotating blades to blow their shed wake away before the passage of the following blade. Recall that the rotor with the airfoil section had a helical twist (model 20) and required precise combinations of rotational and axial velocity to keep zero lift on the entire blade span. Therefore the axial velocity for this model varied continuously with each change in rota- tional speed. The resul ts in figure 15 indicate that the introduction of axial velocity on the cylindrical blade increases the overall sound pressure level, whereas, the introduc- tion of axial velocity on the airfoil-bladed rotor resulted in a decrease in the overall sound pressure level.
The reason for the foregoing results cannot be definitely established in this pre- liminary analysis, but the fact that model 20 with the NACA 0012 airfoil section produced less noise with a small axial velocity than when rotating in its own shed wake might be explained as follows. An airfoil rotating in its own wake produces some "rotational noise" due to lift. This lift will fluctuate because of velocity fluctuations in the shed wake. These fluctuations in lift do not occur when the shed wake is blown downstream thus resulting in a decreased noise level. Small axial-velocity fluctuations (present when the blade rotates in its own shed wake) produce relatively large lift fluctuations on an airfoil section because of its high lift-curve slope but produce zero lift on a cylindrical blade.
On the other hand, the fact that model 01 with a circular c ross section produced more noise when its shed wake was blown away by the axial velocity cannot be explained. Introducing axial velocity certainly increases the dynamic pressure on the blades. How- ever, the addition of the axial- and tangential-velocity vectors will not produce a sufficient increase in dynamic pressure to explain the 2- to 3-dB increase in sound level. In other words, for a straight line through the zero-axial-velocity data (recalling Reynolds num- ber effects and therefore neglecting the two highest speed points) a 2- to 3-dB increase corresponds to an increase in the velocity vector of 1.8 m/sec (6 ft/sec). (See fig. 13.) This is an order of magnitude larger than what was actually achieved with the introduction of axial velocity.
CONCLUDING REMARKS
The investigation was conducted at the Langley Research Center to define further the characteristics of vortex noise generated by a rotating blade system. Tests were made in a wind tunnel and also outdoors for two differently shaped blades with various end tips. One was of circular c ross section and the other an airfoil section. The test-chamber hall radius was determined for these two blades in a wind-off condition. The complete basic data are presented in tabular form in 1/3-octave bands to make them available to others working on the same problem. A part of the data is plotted for examination of a few of the key points. This preliminary analysis of the data shows the following results:
10

1. A comparison of the 1/3-octave-band spectrum distribution for two models tested in the wind tunnel and outdoors is favorable. Evaluation of the wind-tunnel reverberation from the inverse-square law of the overall sound pressure levels is also relatively good.
2. The tip shapes tested did not show any appreciable difference in overall sound pressure level.
3. Even though the frontal a r e a of both blades w a s the same, the radiated noise levels were quite different. confirms previously found resul ts indicating a direct relationship between increased noise level and increased form drag.
The cylindrical blade is much the noisier of the two which
4. The addition of grit to the leading edges of the blades to obtain a turbulent flow and decrease the section drag reduced the overall sound pressure level. This result also confirms the effect of form drag.
5. The introduction of axial velocity to blow away the turbulent shed wake of one blade before the passage of the following blade caused a decrease in the noise level of the airfoil-section blade and an increase in the noise level of the cylindrical blade. The rea- son for this increased noise level is presently unexplained.
Langley Research Center, National Aeronautics and Space Administration,
Hampton, Va., June 23, 1971.
11

REFERENCES
1. Sadler, S. Gene; and Loewy, Robert G.: A Theory for Predicting the Rotational and Vortex Noise of Lifting Rotors in Hover and Forward Flight. NASA CR-1333, 1969.
2. Lowson, M. V.; and Ollerhead, J. B.: A Theoretical Study of Helicopter Rotor Noise. J. Sound Vib., vol. 9, no. 2, Mar. 1969, pp. 197-222.
3. Anon.: Measurements of Aircraft Exterior Noise in the Field. ARP 796, SOC. Automot. Eng., Inc., June 15, 1965.
4. VGr, I s t v h L.; Malme, Charles I.; and Meyer, Eugene B.: Acoustical Evaluation of the NASA Langley Full-scale Wind Tunnel. Bolt Beranek and Newman, Inc., Jan. 22, 1971. (Available as NASA CR-111868.)
Rep. No. 2100 (Contract No. NAS 1-9559),
5. Stowell, E. Z.; and Deming, A. F.: Vortex Noise From Rotating Cylindrical Rods. NACA TN 519, 1935.
6. Keefe, R. T.: An Investigation of the Fluctuating Forces Acting on a Stationary Cir- cular Cylinder in a Subsonic Stream and of the Associated Sound Field. UTIA Rep. No. 76, Inst. Aerophys., Univ. of Toronto, Sept. 1961.
7. Gerrard, J. H.: Measurements of the Fluctuating Pressure on the Surface of a Cir- cular Cylinder. Pt. 1. Cylinder of 1" Diameter. F.M.2637, Brit. A.R.C., Jan. 29, 1958.
8. Welsh, C. J.: The Drag of Finite-Length Cylinders Determined From Flight Tests at High Reynolds Numbers for a Mach Number Range From 0.5 to 1.3. NACA TN 2941, 1953.
9. Rimskiy-Korsakov, A. V., ed.: Physics of Aerodynamic Noise. NASA TT F-538, 1969.
10. Yudin, E. Y.: On the Vortex Sound From Rotating Rods. NACA TM 1136, 1947.

TABLE 1. - MODEL CONFIGURATION NUMBER AND DESCRIPTION
Same as configuration 12 with aft chord spoilers (see figs. 2(d) and 3(a))
Same as configuration 13 with forward chord spoilers (see figs. 2(d) and 3(a))
Configuration Blade description Blade-tip description
Squared off
Squared off
~~
00 5.08 -cm -diameter (2 -in.) cylinder Open end of pipe
01 5.08 -cm -diameter (2 -in.) cylinder Squared tip
02 5.08-cm-diameter (2-in.) cylinder 5.08-cm-diameter (2-in.) semisphere
I 03 Same as configuration 01 with No. 14 grit Squared tip added to leading edge (see fig. 3(b))
r-- 10
1 20
I 12
13
14
5.08-cm-diameter (2-in.) cylinder 10.16-cm-diameter (4-in.) end plate
Untwisted NACA 0012 airfoil Squared off
Untwisted NACA 0012 airfoil Body of revolution
Twisted NACA 0012 airfoil Squared off
Twisted NACA 0012 airfoil Body of revolution
Same as configuration 10 with No. 14 grit Squared off added to leading edge (see fig. 3(a))
~

TABLE 2. - MICROPHONE LOCATIONS
~
1 -4.47 -14.67 4.3 14.08 -0.61 2 0 0 -.lo -.33 -4.07 3 4.32 14.17 4.32 14.17 -.30 4 -.23 -.75 -15.2 -49.75 0 5 -6.1 -20.00 0 0 .05 6 -16.84 -55.25 0 0 m.20
t z
-2.00 2 -13.33 1.6 -1.00 2 0 5
.17 2 -.67 5.5
Drive motor 7 f X
Rotor plane A
- - _ - ~~ _ _
Actual lo cations Nominal location
Distance from rotor center, Degrees frorr
X-axis X Y 2 Microphone
number ft in rotor diameters
7 8 9
10 11 12 13 14 15 16 17 18
-16.7 -11.8
12.00 -5.85 -6.61 -5.51 -4.2 -2.24
.10 2.47 4.42 5.67
-54.83 -38.67 39.33 19.17
-21.67 - 18.08 -13.75 -7.33
.33 8.08
14.5 18.58
0 10.9 11.9 0 0 2.32 4.3 5.62 6.1 5.62 4.30 2.78
- ~ _ _
0 38.92 39.00 0 0 7.58
14.08 18.42 20.00 18.42 14.08 9.08 -
0 0 0 0
-2.44 0 0 0 0 0 0 0
. .
0 0 0 0
-8.00 0 0 0 0 0 0 0
5.5 5.5 5.5 2 2 2 2 2 2 2 2 2
135 90 45 90
0 0
0 13 5 45 0 0
157.5 135 112.5 90 67.5 45 22.5
14

TABLE 3.- AMBIENT NOISE IN WIND TUNNEL
\I/
RUn
1 2 3 4 5 6 7 8 9
10 11 12
847 847 700 84 8
m/sec
V
ft/sec
0
5.0 20.0 20.0

TABLE 4.- CYLINDRICAL-BLADE TESTS
(a) Wind-tunnel tes ts
Model configuration
00
Run number of identical
V Model N, V Run number N, of identical
rpm mfsec I f t /sec ambient conditions Run rpm m/sec I ft/sec ambient conditions confitFration Run
13 403 0 0 1 , 02 43 1
1 33 34 35
628 700 850 900 952 399 627 700 849 902 948 400 626 698 851 899 950 400 624 700 851 900 850 903 401 626 701 850 900
1.52
j .
I: 1 1.52
1.52
i 3 3
5.0 10 a'
I
" 20.0
i
1 5.0
5.0 20.0
I
1
2 2
10 10
44 I :: I 41
48 49 50 51 52 53
.# 54 03 55
56 57 58 59 60 61
L 62 63 64 65 66 67 68 69 70 71 72
,
402 624 701 852 899 849 899 403 624 699 848 900 401 626 698 625 701 628 699 400 624 700 850 901 848 901 402 626 700 850 897
0
1 1 1.52 1.52
l l
1 1 1.52 1.52 6.1 6.1
1.52 1.52 6.1
1 .L
5.0 5.0
20.0
1 5.0 5.0
20.0 20.0
0
5.0 5.0
20.0
1
2 2 3
2 2 5
9
\# 73 ----
(b) Outdoor tes ts
01 0 1 0 ;
I 1 ' 1 1 75 1 403 76 620 77 703 78 850 79 907 80 0 \, 1 ' I --

TABLE 5.- NACA 0012 AIRFOIL-BLADE TESTS
V
(a) Wind-tunnel tests
V
Model Run N, configuration rPm
11 I 1 I 1
10
21
20
81 82 83 84 85 86 87 88 89 90 91 92 93 94 95 96 97 98 99
LOO -
177 403 624 701 849 175 401 626 701 852 175 406 627 700 8 50 177 402 625 700 850 -
n/sec
v ft/sec
Run number of identical
imbient conditions
(b) Outdoor tests
Model Run N, v :onfiguration rpm m/sec ' ft/sec
10
12 I 13 1 14 i I
10 1 102 103 104 105 106 107 108 109 110 111 112 113 114 115 116 117 118 119 120 121 122 -
0 400 630 715 86 2 0
379 6 30 709 87 3 0 0
410 646 715 870 0
413 640 720 870 0 -

Micro- phone
position
1 2 3 4 5 6
Micro- phone
position
1 2
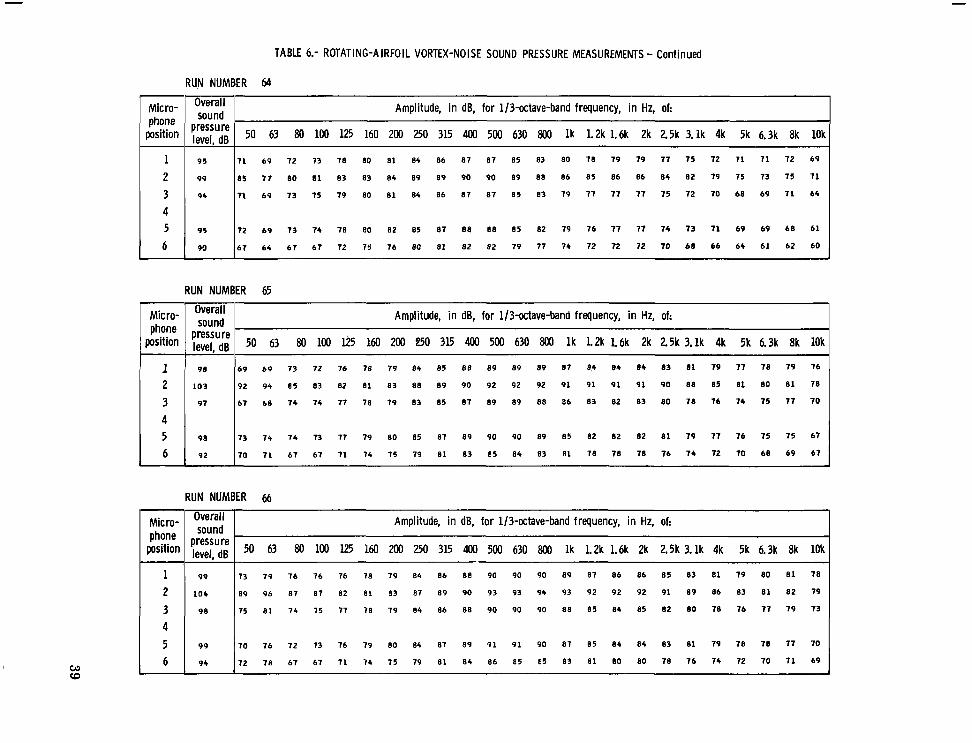
TABLE 6.- ROTATING-AIRFOIL VORTEX-NOISE SOUND PRESSURE MEASUREMENTS
Amplitude, in dB, for 1/3-octave-band frequency, in Hz, of: Overall sound
pressure level, dB 50 63 8o loo 125 160 200 250 315 400 500 630 800 - l k 1.2k 1.6k 2k 2.5k 3.lk 4k 5k 6.3k 8k 10k
6 7 5 8 5 5 54 5 3 56 5 3 52 57 53 5 3 5 4 53 54 47 44 59 57 3 1 3 1 25 17 1 4 20 50
6 9 57 5 1 57 57 58 5 6 5 5 60 5 5 55 56 5 3 54 50 47 59 5 8 40 34 31 25 18 23 22
RUN NUMBER 1
3 1 6 9
Amplitude, in dB, for 1/3-octave-band frequency, in Hz, of:
50 63 80 100 125 160 200 250 315 400 500 630 800 l k 1.2k 1.6k 2k 2.5k 3. l k 4k 5k 6.3k 8k 10k
overall sound
pressure level, dB
~ 61 5 8 5 5 55 61 5 5 5 5 59 56 5 5 55 5 3 55 48 43 56 55 37 33 30 25 2 2 23 20
4 9 5 5 52 49 51 46 46 5 1 46 46 42 4 1 40 36 32 30 30 24 1 6 20 22 20 29 20
b7 I
RUN NUMBER 2
sound Amplitude, in dB, for U3-octave-band frequency, in Hz, of: 1 50 63 80 100 125 160 200 250 315 400 500 630 800 l k 1.2k 1.6k 2k 2.5k 3.1k 4k 5k 6.3k 8k 10k I
57 5 R 5 0 58 57 56 5 4 59 55 54 5 4 51 52 47 43 55 53 35 3 1 22 18 16 20 57
57 61 59 59 60 58 56 60 56 5 5 56 5 3 5 4 50 47 6 1 59 37 34 20 2 1 25 35 2 1
5 5 59 56 56 58 57 5 5 56 56 54 54 52 50 46 42 5 5 53 3 5 33 27 24 2 1 22 38
5b 5 9 57 56 59 57 5 4 57 5 5 5 4 54 51 51 47 42 58 56 34 3 1 23 2 1 10 1 7 15
~ ~ ~ 6 7 54 57 56 56 58 57 5 3 5 5 53 53 54 5 0 5 1 47 43 5 0 56 3 1 32 26 20 15 12 25

Micro- phone
position
6 4
TABLE 6.- ROTATING-AIRFOIL VORTEX-NOISE SOUND PRESSURE MEASUREMENTS - Continued
RUN NUMBER 4
45 5 6 56 50 52 34 46 60 56 46 45 37 37 29 29 26 31 25 22 17 20 2 4 30 39
Amplitude, in dB, for U3-octave-band frequency, in Hz, of:
50 63 80 100 125 160 200 250 315 400 500 630 800 l k 1.2k 1.6k 2k 2.5k 3. l k 4k 5k 6.3k 8k 10k
Overall sound
pressure level, dB
Overall sound
pressure level. dB
Amplitude, in dB, for U3-octave-band frequency, in Hz, of:
50 63 80 100 125 160 200 250 315 400 500 630 800 l k 1.2k 1.6k 2k 2.5k 3. l k 4k 5k 6.3k 8k 10k
RUN NUMBER 5
65
11
7 2
70
52 5 6 56 51 55 40 47 61 50 49 47 40 39 34 29 25 30 24 23 17 21 24 30 29
69
69
Amplitude, in dB, for 1/3-octave-band frequency, in Hz, of:
50 63 80 100 125 160 200 250 315 400 500 630 800 l k 1.2k 1.6k 2k 2.5k 3.lk 4k 5k 6.3k 8k 10k
62 6 5 60 59 60 56 54 61 57 5 4 55 52 52 49 47 5 1 56 36 34 26 25 25 25 24
63 6 6 61 50 61 57 5 1 64 50 56 51 54 55 52 49 61 60 40 3 9 32 26 27 27 25
5 0 62 64 60 60 5 5 5 5 61 57 54 54 53 52 48 44 56 5 5 36 3 4 28 23 20 23 24
5 5 59 61 59 5 1 5 5 53 5 1 57 53 54 5 1 53 40 45 5 0 57 35 33 25 26 26 27 3 5
57 60 b Q 57 57 54 53 61 53 52 54 5 0 50 40 45 59 5 0 37 34 27 24 19 22 19
Micro- phone r position

Micro- phone
position
1 2 3 4 5 6
Micro- phone
position
1 2 3
TABLE 6.- ROTATING-AIRFOIL VORTEX-NOISE SOUND PRESSURE MEASUREMENTS - Continued
RUN NUMBER 7
Amplitude, in dB, for 1/3-octave-band frequency, in Hz, of: Overall sound
pressure level, dB 50 63 80 100 125 200 250 315 400 500 630 800 l k 1.2k 1.6k 2k 2.5k 3. l k 4k 5k 6.3k 8k 10k
67 59 57 57 55 57 50 51 60 58 5 1 51 49 46 42 39 39 38 33 30 31 31 31 36 29
Overall sound
pressure level, dB
66
Amplitude, in dB, for 113-octave-band frequency, in Hz, of:
50 63 80 100 125 160 200 250 315 400 500 630 800 l k 1.2k 1.6k 2k 2.5k 3. l k 4k 5k 6.3k 8k 10k
51 56 57 52 55 40 41 62 60 49 47 40 39 33 30 25 30 2 4 2 1 16 2 1 25 3 1 27
RUN NUMBER 9
1 Amplitude, in dB, for 113-octave-band frequency, in Hz, of:
50 63 80 100 125 160 200 250 315 400 500 630 800 l k 1.2k 1.6k 2k 2.5k 3.1k 4k 5k 6.3k 8k 10k
58 60 61 57 6 1 54 5 3 60 57 57 54 52 54 54 49 47 45 41 4 2 42 39 35 34 21
b l 6 5 60 59 64 57 60 62 59 57 57 57 57 60 56 55 52 49 49 49 43 40 37 38
56 5R 64 59 66 55 5 4 62 58 5 5 53 5 1 53 61 54 48 49 47 44 41 46 40 38 2 4
57 59 59 57 57 54 53 61 56 53 52 5 1 53 5 5 50 48 44 39 39 39 35 31 25 27
56 60 59 54 57 52 5 1 57 53 51 5 1 49 5 1 50 46 46 4 3 38 37 37 34 25 28

Micro- phone
position
TABLE 6.- ROTATING-AIRFOIL VORTEX-NOISE SOUND PRESSURE MEASUREMENTS - Continued
RUN NUMBER 10
Overall sound
pressure level, dB
12
15
13
10
6 9
50 63 80 100 125 160 200 250 315 400 500 630 800 l k 1.2k 1.6k 2k 2.5k 3. l k 4k 5k 6.3k 8k 10k
59 61 61 50 60 56 5 5 60 59 61 54 52 53 5 3 50 4 1 44 40 41 42 30 34 33 24
63 6 1 6 1 61 11 40 60 63 61 61 51 51 51 6 2 51 55 52 50 49 49 45 40 39 25
5 5 51) 64 60 60 56 56 64 59 59 54 52 52 5 0 52 41 40 41 44 41 46 41 39 25
51 59 6 1 60 63 5 5 56 6 3 50 50 5 4 51 51 5 3 49 4 1 44 30 39 39 37 33 2 1 2 9
51 61 61 56 64 53 52 50 5 5 55 52 50 50 50 41 44 43 30 3 1 31 34 24 2 3 20
RUN NUMBER 11
Micro- phone L position
Amplitude, in dB, for U3-octave-band frequency, in Hz, of: I
50 63 80 100 125 160 200 250 315 400 500 630 800 l k 1.2k 1.6k 2k 2.5k 3.lk 4k 5k 6.3k 8k 10k ~~~ ~~~
63 64 61 59 66 56 56 60 57 50 62 50 56 5 2 4 1 41 k5 30 41 40 36 36 32 2 1
66 66 6 1 65 7 0 60 61 65 61 60 66 62 59 59 52 56 53 4 1 40 50 42 30 3 3 20
65 61 6 3 63 69 51 5 1 62 59 51 64 60 56 53 46 40 46 42 43 43 40 31 32 59
55 51) 63 62 6 5 55 56 51 56 5 5 6 3 59 53 50 46 46 44 38 30 36 29 25 13 51
54 57 61 5 1 62 5 4 5 3 51 55 54 60 5 1 54 49 4 5 44 43 37 35 33 30 29 34 39
Overall sound
pressure level, dB
Amplitude, in dB, for 1/3-octave-band frequency, in Hz, of:
RUN NUMBER 12
Amplitude, in dB, for U3-octave-band frequency, in Hz, of: ~~ ~ ~ ~~
50 63 80 100 125 160 200 250 315 400 500 630 800 l k 1.2k 1.6k 2k 2.5k 3.lk 4k 5k 6.3k 8k 10k
63 64 6 2 60 66 56 5 5 60 50 50 60 50 5 5 54 4 0 46 44 30 41 40 3 1 36 32 24
66 66 6 1 66 11 6 1 61 65 60 50 6 5 6 3 5 0 59 5 5 5 5 52 49 49 49 47 39 31 27
62 6 7 64 64 70 50 5 0 62 59 56 63 6 1 5 3 6 0 52 41 46 44 4 3 41 46 41 39 36
55 5 0 64 6 3 6 5 5 5 5 5 51 56 5 5 62 59 54 5 3 40 46 44 39 30 30 34 29 24 2 1
55 58 62 50 62 5 3 52 59 55 5 5 59 5 1 54 50 46 44 43 30 37 31 34 24 21 14

Micro- phone
position
RUN NUMBER lA
Amplitude, in dB, for 1/3-octave-band frequency, in Hz, of: Overall sound
pressure level, dB 50 63 80 IO0 125 160 200 250 315 400 500 630 800 l k 1.2k 1.6k 2k 2.5k 3. l k 4k 5k 6.3k 8k 10k
Amplitude, in dB, for U3-octave-band frequency, in Hz, of:
50 63 80 100 125 160 200 250 315 400 500 630 800 l k 1.2k 1.6k 2k 2.5k 3.lk 4k 5k 6.3k 8k 10k
b6 60 1 1 13 71 00 81 04 05 06 8 5 82 00 1 8 77 11 1 6 1 3 69 68 66 67 68 6 4
14 1 6 80 01 83 83 84 88 09 09 0 0 06 85 8 4 04 84 02 7 9 1 6 1 4 71 69 69 64
65 68 1 3 1 5 79 80 8 1 84 05 8 5 85 82 79 1 6 75 76 75 7 1 6 8 66 64 64 66 58
1 Rb
2 R9
3 86
4 5 n7
1 6 81
64 6 8 1 2 1 3 11 80 82 05 06 06 85 01 1 0 1 6 1 5 75 75 11 69 67 65 65 6 4 55
60 6 3 6 1 67 1 2 1 5 1 6 80 00 0 1 80 1 6 13 7 2 1 1 11 10 66 6 4 62 60 58 58 5 5
64 h 5 6 9 11 76 10 7 0 70 1 5 13 12 69 68 67 64 66 6 5 50 5 1 54 53 53 5 4 50
69 1 1 7 4 76 70 10 19 81 00 1 9 11 1 5 1 4 13 7 2 1 4 72 66 6 5 6 2 59 57 58 53
62 6 5 11 12 16 78 7 8 1 9 16 73 11 60 68 65 6 3 65 64 5 1 5 4 53 52 5 2 53 58
62 66 1 1 1 2 7 1 80 80 7 9 1 5 7 3 11 61 61 65 6 2 6 5 6 4 51 56 54 52 51 5 1 56
5 0 61 65 66 11 14 1 4 14 1 0 6 0 66 62 62 61 5 0 60 59 52 50 49 47 4 3 45 41
Micro- phone
P s i t i o n
1 2 ' I 3 1 94 170 6 8 7 3 1 4 79 80 81 84 05 06 07 85 e2 7 9 7 8 19 78 14 71 6 9 6 1 60 70
4 !
Amplitude, in dB, for U3-octave-band frequency, in Hz, of: Overall sound
pressure level,dB 50 63 80 100 125 160 200 250 315 4oO 500 630 800 l k 1.2k 1.6k 2k 2.5k 3. l k 4k 5k 6.3k 8k 10k
95 69 b7 7 2 73 78 00 81 04 85 07 87 85 83 80 0 0 80 19 1 6 1 3 7 1 7 0 70 1 1 6 8
99 05 1 7 00 81 03 83 8 4 08 0 9 90 90 08 81 0 6 87 00 86 0 2 0 0 17 7 4 1 2 1 3 69
5 95 10 6 R 1 2 1 4 7 8 80 0 2 85 06 8 7 08 85 82 7 9 1 8 1 9 70 74 1 2 10 69 68 6 1 60
6 9') 66 6 7 67 67 72 7 5 76 80 8 1 0 2 82 19 77 7 4 1 4 74 73 10 67 65 63 61 62 60 , --

TABE 6.- ROTATING-AIRFOIL VORTEX-NOISE SOUND PRESSURE MEASUREMENTS - Continued
Overall '
position , ~ ~ ~ ~ ; u d r g e Amplitude, in dB, for U3-octave-band frequency, in Hz, of: I
50 63 80 100 125 160 200 250 315 400 500 630 800 l k 1.2k 1.6k 2k 2.5k 3.1k 4k 5k 6.3k 8k 10k 'Mlcro-' phone sound
1 98 6 1 6 1 13 1 2 16 18 7 9 83 85 8 1 89 89 89 8 1 8 5 86 8 1 82 19 7 7 16 7 7 7 8 1 5
2 103 91 9 2 83 81 8 1 8 1 83 81 88 90 91 91 91 91 92 93 94 90 86 83 80 1 9 80 11
3 9 1 65 66 13 14 11 18 1 9 83 85 8 1 89 88 88 86 84 8 5 85 81 11 15 13 1 4 1 6 70
4 5 98 12 7 3 1 2 13 1 6 1 9 80 84 86 88 90 90 88 85 84 8k 85 81 1 8 l b 15 15 1 4 6 1
6 91 68 69 6 1 6 1 11 1 4 15 79 8 1 83 85 04 83 8 1 79 80 81 1 6 1 3 1 1 69 68 69 66
RUN NUMBER 17
I
Amplitude, in dB, for U3-octave-band frequency, in Hz, of:
50 63 80 100 125 160 200 250 315 400 500 630 800 l k 1.2k 1.6k 2k 2.5k 3.lk 4k 5k 6.3k 8k 10k
12 11 1 4 1 4 16 1 8 1 8 83 85 88 90 90 90 89 8.7 88 89 86 81 1 9 1 8 7 9 80 11
88 94 84 84 81 a0 82 87 88 90 92 92 93 93 93 94 95 92 87 84 8 1 1 9 81 7 1
1 4 80 1 3 1 4 11 18 79 83 85 8 1 90 90 90 8 8 86 8 1 88 84 1 9 11 1 6 16 1 8 7 2
10 1 5 1 2 13 1 6 19 80 84 86 89 91 91 90 01 86 86 81 84 80 18 11 1 7 1 6 70
11 11 6 1 66 70 14 1 5 19 80 83 86 e 5 e5 83 0 2 82 83 80 1 5 1 3 7 1 70 7 1 6 9
RUN NUMBER 18 7
Micro- Overall sound
phone , pressure Amplitude, in dB, for U3-octave-band frequency, in Hz, of:
position I level. dB 50 63 80 100 125 160 200 250 315 400 500 630 800 l k 1.2k 1.6k 2k 2.5k 3. l k 4k 5k 6.3k 8k 10k I 69 80 1 6 18 7 1 18 79 8 3 86 8 8 91 91 92 91 90 90 91 89 84 81 80 81 83 7 9
83 96 8 9 92 83 19 8 1 81 88 90 93 93 $4 S 5 95 96 91 96 90 86 83 82 83 80
12 86 1 8 80 76 18 79 83 86 88 91 91 91 90 88 89 90 86 81 1 9 77 7 8 80 74
61 1 8 1 4 16 11 19 80 8 5 8 1 a9 92 93 92 90 8 8 89 89 8 1 82 80 1 9 7 9 7 9 7 1
64 7 6 1 0 12 11 74 15 19 8 1 84 81 8 1 e7 8 5 84 84 85 83 7 7 15 13 7 2 1 3 7 1

TABLE 6.- ROTATING-AIRFOIL VORTEX-NOISE SOUND PRESSURE MEASUREMENTS - Continued
Micro- phone
position
1 2 3 4
6
RUN NUMBER 19 Overall sound
~ ~ ~ ; u d r g e 50 63
Amplitude, i n dB, for 1/3-octave-band frequency, i n Hz, of:
80 100 125 160 200 250 315 400 500 630 800 l k 1.2k 1.6k 2k 2.5k 3.1k 4k 5k 6.3k 8k 10k
Rb 66 6 1 1 0 12 11 78 11 17 1 5 1 3 7 1 69 68 6 1 66 7 2 1 1 60 58 5 5 54 53 55 49
91 12 1 4 1 8 79 81 80 80 82 80 1 8 11 15 15 1 4 1 5 80 1 9 1 0 61 64 6 1 58 59 52 ~
86 6 5 66 7 2 7 4 18 7 8 7 8 1 0 1 5 1 3 1 1 68 61 6 5 6 4 11 10 58 5 1 55 53 5 1 5 2 44 !
8 6 63 6 1 11 1 2 78 79 7 9 1 8 1 4 7 2 10 6 1 66 6 5 6 3 71 70 58 56 5 3 51 49 50 3 4
8 1 60 62 6 1 66 12 14 14 13 69 6 8 66 62 62 61 59 66 65 55 52 50 47 43 45 3 9
1
Amplitude, in dB, for U3-octave-band frequency, in Hz, of:
50 63 80 100 125 160 200 250 315 400 500 630 800 l k 1.2k 1.6k 2k 2.5k 3.1k 4k 5k 6.3k 8k 1Ok
68 1 0 7 5 1 8 81 8 3 83 05 86 86 85 8 2 80 1 8 38 80 1 8 1 4 11 68 6 1 61 b0 64
1 6 80 84 86 88 81 8 1 90 90 90 89 8 1 85 8 5 86 88 86 82 7 9 1 6 1 3 11 1 2 61
RUN NUMBER 20
'
Ove ra I I
Micro- phone
position
Overall sound
pressure
Amplitude, i n dB, for 1/3-octave-band frequency, i n Hz, of:
level. dB 50 63 80 100 125 160 250 315 400 500 630 800 - l k 1.2k 1.6k 2k 2.5k 3. l k 4k 5k 6.3k 8k 10k
66 1 0 1 5 16 80 e2 8 4 86 87 8 1 8 5 82 18 1 6 1 6 1 8 18 12 69 61 65 6 5 b5 56
62 65 1 0 10 15 11 1 9 81 81 82 81 1 6 lk 1 2 1 2 1 3 1 2 68 64 62 60 5 1 5 8 5+
3 4 5 6
96
96
91
11 69 11 1 8 8 1 83 83 86 87 8 8 8 1 0 5 84 81 80 82 81 76 7 4 11 70 7 0 7 1 6 1
84 79 84 85 81 e6 e l 91 91 91 90 8 9 8 8 8 1 09 90 89 84 8 1 1 9 1 6 1 4 1 5 1 0
11 17 1 6 1 8 83 82 83 86 8 1 8 1 81 8 5 83 80 7 9 80 19 74 1 1 1 1 b8 68 69 6 1
11 1 1 1 5 16 80 82 83 86 8 8 8 8 88 8 5 82 1 9 1 8 80 80 1 4 12 10 60 68 60 58
66 64 1 0 1 1 15 11 1 8 82 82 83 83 80 18 1 5 1 4 1 6 15 1 0 6 1 65 6 3 60 61 5 1 '

TABLE 6.- ROTATING-AIRFOIL VORTEX-NOISE SOUND PRESSURE MEASUREMENTS - Continued
99
94
RUN NUMBER 22
Amplitude, in dB, for 1/3-octave-band frequency, in Hz, of:
50 63 80 100 125 160 200 250 315 400 500 630 800 l k 1.2k 1.6k 2k 2.5k 3.1k 4k 5k 6.3k 8k 10k
l a 1 0 1 5 15 19 E l 82 85 0 1 8 8 90 89 89 87 86 88 88 84 1 9 11 1 6 7 1 1 8 14
91 92 85 84 a6 85 a6 90 90 91 92 92 92 92 93 94 95 92 87 84 81 7 9 80 76
70 11 76 11 81 8 1 8 2 85 81 8 8 90 89 88 86 8 5 86 86 81 1 8 11 1 4 75 1 6 10
73 1 4 1 5 16 79 81 82 86 08 89 91 90 89 85 84 86 8 1 8 3 1 8 16 1 5 1 5 1 5 61
6 8 6 8 69 10 14 1 6 11 81 82 8 5 86 85 84 8 2 80 81 83 7 8 1 3 71 69 6 1 68 65
3 4
RUN NUMBER 9.1
102
107
101
-- Overall Micro-
phone position
1 2 3 4 5 6
sound pressure level, dB
100
106
99
130
95
LJ
Amplitude, in dB, for 1/3-octave-band frequency, in Hz, of:
50 63 80 100 125 160 200 250 315 400 500 630 800 l k 1.2k 1.6k 2k 2.5k 3.lk 4k 5k 6.3k 8k 10k
1 2 7 8 76 ii 79 8 1 02 85 87 8 9 9 1 91 90 89 39 90 91 88 82 79 78 i a 80 76
88 94 86 86 85 8 5 86 90 90 9 1 93 93 93 94 95 9 1 9 8 9 1 E9 66 83 81 82 1 8
15 8 1 1 6 7 1 81 82 8 2 85 81 8 9 90 90 90 88 81 88 89 85 80 1 8 16 1 6 1 8 1 2
72 1 0 1 4 15 19 81 82 86 88 90 92 92 90 8 1 81 89 89 81 80 18 1 6 11 17 10
11 11 1 0 69 13 16 11 8 1 0 2 85 81 86 E5 84 83 84 85 82 1 5 13 11 69 1 0 6 8
RUN NUMBER 74
-
5 1 101
96
Amplitude, in dB, for 1/3-xtave-band frequency, in Hz, of: I 50 63 80 100 125 160 200 250 315 400 500 630 800 I k 1.2k 1.6k 2k 2.5k 3.Ik 4k 5k '6.3k 8k 10k 1

TABLE 6.- ROTATING-AIRFOIL VORTEX-NOISE SOUND PRESSURE MEASUREMENTS - Continued
Micro- phone
position
1 2 3
RUN NUMBER 25
Overal I sound
pressure level, dB 50 63 80 100 125 160 200 259 315 400 500 630 800 l k 1.2k 1.6k 2k 2.5k 3. l k 4k 5k 6.3k 8k 10k
Amplitude, in .dB, for 1/3-octave-band frequency, in Hz, of:
0 1 66 66 67 68 77 02 81 7 5 70 1 0 69 66 66 6 5 6 2 6 2 62 59 5 0 5 5 54 54 55 50
n7 60 66 70 71 76 80 79 77 1 5 1 5 7 4 7 2 12 7 1 70 1 1 70 68 6 1 64 bQ 50 50 53
06 65 66 67 69 17 02 81 1 5 70 69 69 66 6 5 6 3 bQ 6 2 6 1 56 57 55 52 52 53 45
Overall sound
59 6 3 60 69 79 e5 03 75 70 60 60 64 64 62 5 0 60 60 5 5 56 54 5 1 49 50 37 ~
59 62 6 3 63 1 3 79 70 71 6 5 6 5 6 5 61 60 59 56 56 56 52 52 49 46 4 2 44 37 6
Amplitude, in dB, for 1/3-octave-band frequency, in Hz, of:
RUN NUMBER 26
pressure level, dB 99
1 0 4
9 R
71 71 7 5 16 I 1 84 86 09 8 1 07 0 5 02 01 00 02 64 04 1 5 1 4 71 70 70 7 1 67
101 1 0 79 83 04 06 8 7 00 92 91 91 09 8 1 07 07 90 9 2 93 0 5 03 80 71 75 7 5 70
50 63 80 100 125 160 200 250 315 400 500 630 8OC I k 1.2k 1.6k 2k 2.5k 3. I k 4k 5k 6.3k 8k 10k
13 1 2 1 6 77 82 04 86 89 09 09 00 06 € 4 82 86 0 8 89 82 77 74 1 3 74 7 4 70
87 8 1 84 0 5 a i 07 8 9 9 3 93 92 92 90 89 89 94 95 97 9 2 85 03 80 77 70 72 I 1 1 2 7 2 1 6 7 9 83 04 86 09 90 89 09 86 83 81 8 5 8 1 87 00 76 1 5 12 1 2 7 3 66
69 70 7 5 7 1 81 03 85 89 88 0 1 05 82 00 70 01 83 02 13 72 11 69 68 69 62
90 1 4 7 3 1 7 11 01 e5 0 1 90 90 09 88 05 02 00 0 3 87 06 80 7 5 13 71 71 70 62
94 71 6 7 1 1 71 1 6 79 82 86 85 05 0k 80 78 16 19 0 2 02 76 71 69 66 64 64 61
i 5 1 96 , 68 71 7 5 1 5 80 04 07 91 00 06 0 4 01 79 11 00 82 02 7 4 1 2 70 60 67 61 58
1 6 1 91 1 63 6 4 69 69 1 4 79 82 86 83 82 00 76 7 5 7 3 7 6 1 8 1 8 69 67 65 63 60 60 56
I
Micro- phone
position
1 2 3 4 5 6
RUN NUMBER 27

TABLE 6.- ROTATING-AIRFOIL VORTEX-NOISE SOUND PRESSURE MEASUREMENTS - Continued
4 5 6
RUN NUMBER 28
Amplitude, in dB, for 1/3-octave-band frequency, in Hz, of:
50 63 80 100 125 160 200 250 315 400 500 630 800 l k 1.2k 1.6k 2k 2.5k 3. l k 4k 5k 6.3k 8k 10k
15 1 5 19 80 8 3 € 5 86 09 90 91 92 90 90 81 93 95 96 94 03 79 11 10 1 9 14
92 93 a i 06 a8 a8 8 9 93 93 93 94 93 93 92 101 102 103 103 9 s e7 03 a i 02 75
102
9 1
1 2
4
6
3
5
73 1 4 1 0 00 83 e4 05 89 90 91 91 90 89 86 92 94 94 91 02 10 16 1 6 11 69
104
112
104
104
99
15 1 R 80 80 83 0 5 86 90 9 1 91 92 91 89 05 0 9 96 9 4 92 01 11 1 5 1 5 1 5 65
11 1 2 1 3 1 4 18 00 8 1 8 5 85 81 81 85 84 02 06 90 09 0 1 16 12 10 60 68 64 ~~
RUN NUMBER 29
Amplitude, in dB, for U3-octave-band frequency, in Hz, of:
50 63 80 100 125 160 200 250 315 400 500 630 800 l k 1.2k 1.6k 2k 2.5k 3.Ik 4k 5k 6.3k 8k 1Ok
i s ao 79 a0 a3 e 5 86 a9 90 91 92 91 91 89 95 97 97 96 09 00 79 00 a i 76
90 96 08 89 89 8 0 8 9 93 94 94 95 94 94 93 103 104 105 105 101 09 86 83 04 1 9
70 R+ i a 00 03 e4 a 5 89 90 91 92 91 90 a i 9 3 96 96 93 a i 00 -18 70 7 9 7 2
1 4 1 9 10 19 82 e5 8 6 90 91 92 93 92 90 01 91 90 9 1 94 0 1 19 11 11 1 6 60
1 3 1 0 1 3 13 11 19 0 1 05 05 8 1 08 06 86 0 3 8 1 92 9 2 09 02 14 12 69 1 0 66
RUN NUMBER 20
Amplitude, in dB, for 1/3-octave-band frequency, in Hz, of:
50 63 80 100 125 160 200 250 315 400 500 630 800 l k 1.2k 1.6k 2k 2.5k 3. l k 4k 5k 6.3k 8k 10k

TABLE 6.- ROTATING-AIRFOIL VORTEX-NOISE SOUND PRESSURE MEASUREMENTS - Continued
RUN NUMBER 31
64 66 6 9 7 2 76 78 78 78 7 5 7 3 71 69 68 6 5 62 61 60 57 57 54 53 53 54 50
63 bb 70 72 75 75 7 4 75 75 7 1 68 64 64 62 58 56 54 50 49 45 40 36 40 2 8
62 65 70 72 76 78 7 8 70 75 73 71 60 67 6 4 60 60 59 56 55 53 50 50 52 44
Micro- phone
position
1 2 3 4 5 6
~
Overall sound
pressure level, dB
85
8 3
85
R6
fl1
Micro- phone
position
~ ~~~ ~ ~
Amplitude, i n dB, for 1/3-octave-band frequency, i n Hz, of:
Amplitude, in dB, for 1/3-octave-band frequency, in Hz, of: Overall sound
pressure level, dB 50 63 80 100 125 160 200 250 315 4M) 500 630 800 l k 1.2k L 6 k 2k 2.5k 3. l k 4k 5k 6.3k 8k 10k
50 63 80 100 125 160 200 250 315 400 500 630 800 l k 1.2k 1.6k 2k 2.5k 3.1k 4k 5k 6.3k 8k l O k l
9 3
9n
9 3
93
R R
66 60 1 2 73 78 00 0 1 84 05 8 6 85 82 8Q 77 7 4 7 4 13 11 69 61 66 67 6 8 64
66 69 12 14 77 11 71 01 85 8 3 8 1 7 1 15 7 3 10 69 67 6 3 62 57 52 49 5 1 37
6 5 bR 73 75 79 80 81 05 86 86 e 5 82 79 15 73 1 3 12 69 bl 66 64 b4 66 5 9
64 6 0 72 13 7 8 00 8 2 06 06 06 85 81 70 1 5 72 72 72 69 6 8 66 65 64 63 54
60 62 67 67 72 76 77 80 80 81 80 76 73 71 69 6 6 6 7 64 6 3 62 59 5 1 58 55
RUN NUMBER 32
70 6 7 7 2 73 70 80 0 1 84 06 07 01 8 5 83 00 71 17 16 14 13 71 69 70 7 1 68
11 7 0 73 15 77 7 7 17 82 05 0 4 03 81 70 76 13 7 2 70 66 65 61 51 54 56 45 .
~ ~ ~~
RUN NUMBER 33
9 5
97
9 4
9 5
90
Amplitude, in dB, for 1/3-octave-band frequency, in Hz, of:
50 63 80 100 125 160 200 250 315 400 500 630 800 l k 1.2k 1.6k 2k 2.5k 3. l k 4k 5k ‘6.3k 8k 10k
I 10 68 73 74 18 80 82 86 07 88 88 8 5 82 10 15 1 5 75 7 2 7 1 70 60 6 8 67 59
66 67 67 68 12 7 5 76 00 01 82 82 19 17 74 7 1 7 1 10 68 66 65 63 61 6 2 59 I

Micro- phone
position
5 6
Overall sound
pressure level. dB
TABLE 6.- ROTATING-AIRFOIL VORTEX-NOISE SOUND PRESSURE MEASUREMENTS - Continued
RUN NUMBER 34
Amplitude, in dB, for U3-octave-band frequency, in Hz, of: ,
50 63 80 100 125 160 200 250 315 400 500 630 800 I k 1.2k 1.6k 2k 2 5 k 3. I k 4k 5k 6.3k 8k 10k
Overall sound
pressure level. dB
97
93
96
Amplitude, in dB, for 1/3-octave-band frequency, in Hz, of:
50 63 80 100 125 160 200 250 315 4oO 500 630 800 I k 1.2k 1.6k 2k 2.5k 3.lk 4k 5k 6.3k 8k 10k
9a
92
94
9 a
99
6a 60 13 12 76 l a 19 a 3 85 a7 09 a 9 a a 86 a 3 a2 a 2 Bo 79 77 it, i i 7a 1 4
76 16 1 2 13 16 1 5 7 5 80 0 5 05 86 84 84 8 3 7 9 7 1 16 73 11 61 63 61 62 53
66 61 13 7 4 -11 79 7 9 a 3 a5 a 7 89 a 9 a0 a5 a i a i a i l a 76 1 5 13 14 76 69
74 14 13 7 3 77 1 9 00 a5 a 7 a9 9 1 go a0 8 5 a i 01 a i 19 l a 16 75 75 1 4 6 1
68 68 60 67 71 7 ) 75 79 01 8 3 85 84 83 8 1 11 77 16 1 4 1 2 11 69 67 6 8 66
10 7 5 13 1 4 76 15 7 5 ao a5 a 5 a6 86 e6 e s a 2 ao l a 16 7 3 69 65 63 64 5 1
1 3 19 7 4 74 77 78 79 a 3 06 0a 90 90 90 e l a4 a3 a 3 ao 1 8 17 15 76 7a 1 2
i o 15 73 73 7 1 79 ao a5 a 7 a 9 92 91 90 8 7 a4 a3 a 3 a i ao 18 17 77 76 i o
RUN NUMBER 35
Micro- phone
position
I 1 I 9 0 171 17 14 74 76 l a 7 9 a 3 a5 a a 90 9o 90 a a a 5 a4 a4 82 a i 19 7a 19 ao 71
1 6 I 93 170 16 61 66 71 7 5 7 5 79 8 1 8 4 86 85 E5 83 a0 79 78 16 14 73 71 69 7 1 6 8
phone position
RUN NUMBER 36
Overall sound
pressure level, dB
9a
9 4
91
9 a
93
Amplitude, in dB, for 1/3-octave-band frequency, in Hz, of:
50 63 80 100 125 160 200 250 315 400 500 630 800. I k 1.2k 1.6k 2k 2.5k 3.lk 4k 5k 6.3k 8k 10k
71 71 75 75 79 a i 01 a5 a6 8 9 90 9o 09 a6 a 3 83 a2 ao 19 17 it, 76 10 74
76 7 6 1 5 16 79 7 0 78 82 06 86 86 85 e5 83 80 l a 16 1 4 72 6 8 64 62 63 54
6a 76 77 01 a i 02 a5 87 a a 90 a9 a a a 5 02 8 1 a i l a 76 15 73 1 4 16 10
14 7 5 7 5 7 5 79 a i 02 ab a 7 a 9 91 90 a9 a 5 0 2 8 1 a i 79 18 16 74 75 74 66
61 6 8 69 69 74 7 6 77 81 8 2 04 86 84 83 e l 1 7 77 76 1 4 72 11 69 61 68 66

w 0
Micro- phone
position
1
RUN NUMBER 37
overal sound I
pressure level, dB 50 63 80 100 125 160 200 250 315 400 500 630 800 l k 1.2k 1.6k 2k 2.5k 3. l k 4k 5k 6.3k 8k 10k
Amplitude, in dB, for 1/3-octave-band frequency, in Hz, of:
1 3 1 0 1 9 19 82 0 3 04 06 80 90 91 91 91 09 06 05 04 02 8 1 79 70 1 9 80 76 99
TABLE 6.- ROTATING-AIRFOIL VORTEX-NOISE SOUND PRESSURE MEASUREMENTS - Continued
9 6
99
loo
72 1 6 7 8 1 9 02 8 1 7 9 84 8 1 8 7 00 86 86 8 5 02 80 79 76 7 4 10 6 5 63 64 5 5
70 85 1 7 79 83 e4 84 07 80 90 91 91 90 08 04 83 83 80 1 0 17 1 6 76 1 9 7 2
71 76 76 11 01 03 84 87 09 90 9 2 92 91 81 84 8 3 0 3 81 80 1 0 76 77 76 6 9
9 5 6 72 7 9 71 71 76 70 7 9 02 8 3 86 87 86 86 8 3 80 1 9 1 8 1 6 7 4 13 7 1 69 1 0 68
RUN NUMBER 38 overall sound
pressure level d~
Micro- phone
position
Amplitude, in dB, for 1/3-octave-band frequency, in Hz, of:
50 63 80 100 125 160 200 250 315 400 500 630 800 l k 1.2k 1.6k 2k 2.5k 3.lk 4k 5k 6.3k 8k 10k
Overall sound
pressure level, dB
64 66 67 69 77 82 0 1 14 1 0 1 0 6 8 66 66 6 4 6 2 62 61 50 50 55 53 53 54 48
7 8 1 7 7 5 7 4 7 1 79 7 7 71 70 67 66 6 3 63 62 59 5@ 57 5 1 52 47 43 40 43 39
6 5 64 67 69 17 8 2 81 1 5 70 69 6 9 66 6 5 6 4 60 6 1 61 57 5 1 54 5 2 52 54 4 1
R R 59 6 3 60 70 7 8 04 8 3 15 69 60 6 8 64 64 62 59 59 60 55 56 54 52 50 49 36
R2 5 1 61 62 6 3 72 79 11 10 64 6 4 6 4 60 60 5 9 56 56 56 52 52 49 47 43 45 39
Amplitude, in dB, for 1/3-octave-band frequency, in Hz, of:
50 63 80 100 125 160 200 250 315 400 50(1 630 800 - l k 1.2k 1.6k 2k 2.5k 3. l k 4k 5k 6.3k 8k 10k
RUN NUMBER 39
96
93
96
96
91
phone position
-
10 1 1 7 4 16 01 e4 8 6 89 00 8 1 05 02 01 1 9 17 11 11 1 4 1 3 71 70 1 0 71 6 1
7 8 11 7 8 1 0 01 00 02 86 07 84 02 70 7 6 1 5 1 3 7 2 71 68 66 6 2 57 54 56 43
69 1 0 7 5 7 1 0 1 0 3 0 6 09 00 07 8 5 02 80 7 0 1 5 76 15 1 2 71 69 6 1 60 7 0 62
60 1 1 7 4 1 5 00 84 9 1 90 00 8 7 e5 01 79 17 1 4 1 4 75 12 12 70 60 67 66
63 6 5 69 10 74 19 02 05 0 3 02 80 76 15 1 3 7 1 1 0 1 0 6 0 67 65 63 60 61

TABLE 6.- ROTATING-AIRFOIL VORTEX-NOISE SOUND PRESSURE MEASUREMENTS - Continued
74 1 3 17 1 8 82 € 5 86 89 8 9 90 89 86 0 5 82 80 79 79 1 7 1 6 74 13 1 3 7 4 10
80 7 8 7 9 79 82 82 82 86 89 87 8 5 81 80 79 1 6 15 13 1 0 69 65 60 57 5 8 41
1 3 12 11 19 83 04 8 6 89 90 89 89 86 04 8 1 78 78 1 8 76 7 4 73 11 7 1 73 66
1 9R
I 2 95
3 98
4 5 98
6
15 1 3 77 77 81 € 5 07 91 90 90 89 8 5 e3 80 77 11 78 76 7 5 73 1 1 11 1 0 62
93 71 6 7 11 11 76 80 82 85 85 8 5 84 80 78 76 1 3 1 3 73 7 1 70 68 66 64 65 6 1 -
40 RUN NUMBER
1 I 2
3 4
6 5
1 Amplitude, in dB, for 1/3-octave-band frequency, in Hz, of: I Overall 1
position 1 ~~~~~u~~ ~ 50 63
' Micro- sound l phone
80 100 125 160 200 250 315 400 500 630 800 l k 1.2k 1.6k 2k 2.5k 3. l k 4k 5k 6.3k 8k 10k
73 74 1 8 79 83 € 5 e6 89 90 91 9 1 90 09 87 84 83 83 8 1 80 18 11 78 7 9 15 ' 81 81 8 1 8 1 03 82 82 86 89 88 88 8 5 e5 84 80 79 77 75 73 69 65 63 64 56
72 7 4 7 8 80 83 04 86 89 90 9 1 9 1 90 09 86 83 82 82 1 9 70 11 7 5 76 1 8 7 2
99
97
99
100 15 1 8 79 7 9 03 85 8 7 90 91 9 1 92 90 89 85 82 81 8 1 80 79 11 1 6 76 1 5 68
70 1 2 12 13 77 80 82 85 85 87 87 8 5 84 8 1 78 17 17 1 5 7 4 12 70 6 8 1 0 61 95
100
101
96
75 1 9 80 80 84 85 86 89 90 91 92 9 1 9 1 8 9 86 85 8 5 83 82 80 1 9 80 8 1 11
80 81 81 01 82 82 82 86 89 8 9 89 87 e7 06 82 81 19 77 1 5 71 61 65 66 58
78 R4 79 80 83 e 5 86 89 90 9 1 92 91 9 1 8 8 85 84 04 8 1 80 1 9 7 1 1 8 80 14
1 3 19 19 80 83 E5 87 90 91 92 93 92 91 01 04 83 03 82 8 1 19 78 18 11 11
12 7R 7 2 13 7 1 80 82 85 86 81 8 8 86 86 8 4 8 0 79 79 11 75 1 4 72 1 0 12 70
RUN NUMBER 42

i
Micro- phone
position
RUN NUMBER 43
Amplitude, in dB, for U3-octave-band frequency, in Hz, of: Overal I sound
pressure level, dB 50 63 80 100 125 160 200 250 315 400 500 630 800 l k 1.2k 1.6k 2k 2.5k 3.lk 4k 5k 6.3k 8k 10k
?
TABLE 6.- ROTATING-AIRFOIL VORTEX-NOISE SOUND PRESSURE MEASUREMENTS - Continued
3 4 5
R 6
06
I ; I : : 63 65 71 12 16 78 18 10 15 13 71 60 61 64 60 60 59 54 54 53 50 49 52 43
6 R 1 59 61 64 66 11 15 74 13 10 60 66 62 62 60 56 55 55 5 1 50 49 46 42 45 40 ; 1
1 2 3 4 5 6
RUN NUMBER 44
93
91
9 1
9 3
R B
Amplitude, in 'dB, for 1/3-octave-band frequency, in Hz, of:
50 63 80 100 125 160 200 250 315 400 500 630 800 l k 1.2k 1.6k 2k 2.5k 3.lk 4k 5k 6.3k 8k 10k ~~ ~~ ~
61 68 12 13 10 00 0 1 04 05 06 0 5 02 19 16 14 13 13 10 69 61 65 66 61 63
15 71 00 01 03 83 04 00 00 09 00 86 04 02 80 00 19 71 16 73 70 60 69 65
6 5 6 P 13 15 79 80 0 1 04 05 0 5 e 5 01 10 15 12 12 12 60 66 65 63 63 65 50
64 69 13 13 7 0 0 1 02 05 06 86 e 5 01 18 15 72 11 11 60 60 66 64 64 63 54
61 65 61 61 12 15 71 00 00 01 00 16 73 70 60 61 67 64 63 61 59 56 5 0 54
RUN NUMBER 45
I MicI-0- I Overall .-,..,-A 1 Amplitude, in dB, for U3-octave-band frequency, in Hz, of: I >UUIIU
50 63 80 100 125 160 200 250 315 400 500 630 800 - l k 1.2k 1.6k 2k 2.5k 3. l k 4k 5k 6.3k 8k 10k
94 70 68 13 14 18 00 01 04 06 07 01 0 5 03 19 16 16 16 13 12 10 69 69 70 61
9 R 05 11 00 01 03 02 0 4 00 09 09 90 00 el 05 03 03 e2 00 19 17 74 72 73 69
11 69 13 75 7 9 00 00 04 06 06 87 0 5 02 18 15 15 15 72 10 69 61 67 69 62 j : I q 4 j ~ 5 1 95 170 10 14 74 19 E 1 02 05 07 01 01 0 5 02 10 74 14 74 12 71 b9 60 67 66 59
, 6 1 0 9 166 64 60 60 72 16 11 00 0 1 02 02 19 11 13 10 10 10 61 66 64 62 60 61 5 0 t
I

TABLE 6.- ROTATING-AIRFOIL VORTEX-NOISE SOUND PRESSURE MEASUREMENTS - Continued
96
97
RU,N NUMBER 46
6 5 67 73 74 77 70 79 03 85 07 89 09 08 0 5 02 00 00 78 76 75 73 74 76 69
73 74 13 13 77 79 80 05 06 09 90 90 08 05 01 00 00 1 8 77 76 lk 14 74 66
W W
6
Amplitude, in dB, for 1/3-octave-band frequency, in Hz, of:
50 63 80 100 125 160 200 250 315 400 500 630 800 1k 1.2k 1.6k 2k 2.5k 3.1k 4k 5k 6.3k 8k 10k
60 60 13 13 77 70 7 9 03 05 07 09 89 09 06 03 8 2 02 80 78 l h 75 l h 71 74
92 9 3 83 82 01 81 03 07 8 8 90 91 91 91 90 09 00 07 86 05 02 80 78 79 76
92 69 10 60 67 11 14 75 79 01 03 05 04 03 01 77 l h 76 73 7 2 71 69 67 68 66
3 4 5
Overall sound
pressure level. dB
Amplitude, in dB, for 1/3-octave-band frequency, in Hz, of:
50 63 80 100 125 160 200 250 315 400 500 630 800 - l k 1.2k 1.6k 2k 2.5k 3. l k 4k 5k 6.3k 8k 10k
1 2 3 4 5 6
RUN NUMBER 47
97
102
97
90
92
Micro- phone
position
Overall sound
pressure level, dB
90
103
98
99
93
Amplitude, in dB, for 1/3-octave-band frequency, in Hz, of:
50 63 80 100 125 160 200 250 315 400 500 630 800 l k 1.2k 1.6k 2k 2.5k 3.1k 4k 5k 6.3k 8k 10k
7 2 70 74 13 76 10 79 03 05 00 90 90 90 80 85 04 84 02 00 79 17 18 00 l b
00 95 06 8 5 01 00 02 07 00 90 92 92 93 92 90 90 09 07 06 84 81 80 81 76
72 70 73 74 77 78 1 9 03 05 00 90 90 90 07 0k 02 02 80 70 77 75 76 1 0 71
69 74 7 2 13 77 79 00 05 07 09 9 1 91 90 07 04 02 82 00 19 70 76 76 76 b9
71 76 6 1 66 71 74 1 5 79 81 0k 06 0 5 05 03 00 70 70 76 14 73 71 69 70 68
RUN NUMBER 48
Micro- phone
position
6 9 69 74 7 3 77 7 9 80 04 06 08 89 89 09 86 83 82 02 00 78 71 16 76 77 lk
92 93 04 82 03 82 04 00 09 90 92 92 91 90 89 8 0 0 1 86 05 02 00 70 79 76
66 6 1 74 15 70 79 80 04 06 00 09 89 80 86 02 00 00 70 76 75 73 74 76 h9
74 75 73 74 10 79 01 05 07 09 91 90 89 0 5 82 00 00 70 77 76 74 74 74 66
60 68 60 68 12 75 76 00 81 04 05 84 03 81 70 16 76 73 7 2 71 69 6 1 68 66

w rp
Overall sound
pressure level. dB
TABLE 6.- ROTATING-AIRFOIL VORTEX-NOISE SOUND PRESSURE MEASUREMENTS - Continued
Amplitude, in dB, for U3-octave-band frequency, in Hz, of:
50 63 80 100 125 160 200 250 315 400 500 630 800 l k 1.2k 1.6k 2k 2.5k 3. lk 4k 5k 6.3k 8k 10k
RUN NUMBER 49
Micro- phone
position
Micro- phone
position
Overall sound
pressure level, dB 50 63 80 100 125 160 200 250 315 400 500 630 800 l k 1.2k 1.6k 2k 2.5k 3. l k 4k 5k 6.3k 8k 10k
Amplitude, i n dB, for 1/3-octave-band frequency, in Hz, of:
overall sound
pressure level. dB
88 95 86 86 82 80 82 81 88 90 92 92 93 92 90 89 89 81 86 84 81 80 83 16
12 18 14 14 16 18 19 83 85 88 90 90 90 89 86 84 84 82 80 19 18 18 80
l6 I
Amplitude, in dB, for 1/3-octave-band frequency, in Hz, of:
50 63 80 100 125 160 200 250 315 400 500 630 800 - l k 1.2k 1.6k 2k 2.5k 3. l k 4k 5k 6.3k 8k 10k
13 18 73 14 11 18 19 83 85 88 90 90 90 81 84 83 82 80 18 11 15 16 18
10 14 12 13 11 19 80 85 01 89 91 91 91 81 84 83 82 80 19 18 11 11 16 69
11 16 66 66 12 14 15 19 81 84 86 85 85 83 80 18 18 16 14 13 11 69 11 68
RUN NUMBER 51
Micro- phone
position
5 96
6 91
11 11 15 16 81 84 86 89 88 81 85 82 81 19 11 16 16 14 13 11 69 69 10 66
18 80 83 85 81 81 89 93 92 91 90 88 01 86 0 5 85 84 03 82 19 16 13 14 69
69 10 15 18 82 83 86 89 89 81 8 5 82 80 18 15 16 15 12 11 10 61 60 70 62
I 68 11 15 16 80 84 81 90 89 81 8 5 81 19 11 14 14 15 12 12 10 68 61 66 51
63 6 5 69 10 15 19 81 05 83 82 80 16 15 13 10 10 70 68 61 65 63 60 6 1 5 8

w Ln i
4 5 6
TABLE 6.- ROTATING-AIRFOIL VORTEX-NOISE SOUND PRESSURE MEASUREMENTS - Continued
i n 0
95
RUN NUMBER 52
Amplitude, in dB, for 1/3-octave-band frequency, in Hz, of: !
50 63 80 100 125 160 200 250 315 400 500 630 800 l k 1.2k 1.6k 2k 2.5k 3.1k 4k 5k 6.3k 8k 10k
12 72 11 10 02 e 5 06 09 09 09 09 06 05 02 00 19 19 11 16 14 13 73 74 70
01 8 1 04 05 01 80 90 93 93 93 92 90 90 00 80 01 01 86 05 02 79 16 7 1 74 1 : I : : 92
13 12 17 79 03 e4 06 09 90 09 09 06 04 0 1 10 18 18 76 14 13 11 12 14 66
75 14 11 10 02 8 5 07 90 90 90 09 e5 03 80 11 17 11 76 75 13 11 11 70 62
11 66 71 11 76 80 02 05 04 05 04 00 10 16 13 73 13 11 10 60 66 64 b5 62
RUN NUMBER 53
Amplitude, in dB, for 113-octave-band frequency, in Hz, of:
50 63 80 100 125 160 200 250 315 400 500 630 800 l k L 2 k 1.6k 2k 2.5k 3.lk 4k 5k 6.3k 8k 10k
13 14 19 19 03 $ 5 06 09 90 91 9 1 90 90 00 0 5 03 03 01 00 10 77 11 19 15
93 94 01 01 00 80 90 93 94 93 94 93 93 92 91 91 90 89 08 05 02 02 05 11
11 16 19 00 03 04 06 09 90 9 1 91 90 09 06 03 02 02 79 18 11 15 16 10 11
16 1R 79 19 03 8 5 07 90 91 91 92 91 09 06 02 01 0 1 79 78 11 16 15 15 60
70 11 12 13 71 00 02 85 05 06 01 05 04 02 10 71 16 14 13 12 10 68 69 66
RUN NUMBER 54
100
105
i o n
100
9 5
75 RO 00 00 03 0 5 06 09 90 91 92 91 9 1 09 06 05 05 02 02 00 79 80 0 1 11
90 91 00 00 00 08 0s 93 93 94 95 94 94 93 92 92 92 91 90 81 04 02 84 00
10 RC 10 00 03 e4 0 5 09 90 91 92 91 90 00 0 5 04 03 01 19 19 17 10 00 13
13 19 10 79 02 E4 06 90 91 92 93 92 9 1 87 04 03 03 01 00 79 11 71 76 69
13 19 12 12 16 19 0 1 04 05 01 00 06 05 03 00 79 18 16 15 14 12 10 11 69

I
Amplitude, in dB, for 1/3-octave-band frequency, in Hz, of: Overall sound Micro-
phone pressure position level, dB 50 63 80 100 125 160 200 250 315 400 500 630 800 l k 1.2k 1.6k 2k 2.5k 3. l k 4k 5k 6.3k 8k 10k
1 83 61 62 66 6 1 12 14 7 5 7 1 1 4 1 1 6 8 65 6 5 62 59 58 5 1 54 54 51 50 50 52 47
2 A 5 6 5 66 68 70 72 13 1 5 18 76 1 4 13 11 10 69 66 65 64 61 61 58 55 53 54 50
!
3 4 5 6
TABLE 6.- ROTATING-AIRFOIL VORTEX-NOISE SOUND PRESSURE MEASUREMENTS - Continued
n3 59 61 61 68 12 14 15 11 1 4 10 6 8 6 5 64 61 5 8 57 56 52 53 50 48 47 50 42 1 1
84 60 63 68 68 13 15 11 78 14 10 6 1 6 4 63 61 5 1 56 55 51 53 50 49 4 1 46 36
7 8 51 59 6 2 61 66 10 11 13 69 6 5 62 59 58 51 5 3 52 51 48 48 45 43 40 41 3 1
Overall Micro- sound phone pressure
position level, dB
1 89
2 92
3 A 9
4 5 90
6 85
Amplitude, in.dB, for 1/3-octave-band frequency, in Hz, of:
50 63 80 100 125 160 200 250 315 400 500 630 800 l k 1.2k 1.6k 2k 2.5k 3.lk 4k 5k 6.3k 8k 10k
64 6 5 6 8 69 13 15 1 6 80 81 82 82 19 11 13 71 11 11 6 8 6 1 65 64 65 66 63
11 11 1 2 13 14 1 5 11 81 82 83 83 81 80 18 18 1 8 11 16 1 4 12 69 6 1 6 8 65
62 64 6 9 10 14 16 11 80 81 82 82 19 16 12 69 69 69 6 1 65 64 62 62 64 58
63 6 6 1 0 10 74 16 18 81 83 84 83 19 15 11 69 69 69 61 66 64 6 3 63 6 2 54
60 62 6 4 64 68 11 13 16 11 18 18 1 4 11 6 1 65 65 65 62 61 60 58 56 5 1 55
RUN NUMBER 57 I Micro- I Overall sound phone pressure
Ps i t ion level. dB
Amplitude, in dB, for U3-octave-band frequency, in Hz, of:
50 63 80 100 125 160 200 250 315 400 500 630 800 - l k 1.2k 1.6k 2k 2.5k 3.lk 4k 5k 6.3k 8k 10k
1 2 3
i 5 93
6 , 81
9 2
9 5
92
68 65 1 0 71 15 16 11 91 83 84 8 5 83 8 1 78 1 5 15 15 12 12 10 69 69 7 1 61
84 1 3 1 4 1 4 15 16 11 82 84 8 5 86 8 5 84 82 81 8 1 81 79 78 16 13 7 1 72 70
68 65 71 12 1 5 16 11 8 1 83 84 85 83 81 16 1 3 1 3 1 3 70 69 68 66 6 1 69 62
69 6 1 1 2 13 16 11 1 9 83 84 86 06 84 80 16 13 1 3 13 11 1 0 69 61 61 66 59
65 61 6 5 65 69 12 13 11 1 8 80 8 1 18 15 12 6 8 68 68 66 65 64 61 59 61 58 I
- I

1 2 3 4
n9
9 2
8 9
1 2
4 5 6
3
92
95
92
93
81
TABLE 6.- ROTATING-AIRFOIL VORTEX-NOISE SOUND PRESSURE MEASUREMENTS - Continued
RllN NUMBER 58 ~
Amplitude, in dB, for U3-octave-band frequency, in Hz, of: phone pressure psition level, dB 50 63 80 100 125 160 200 250 315 400 500 630 800 I k 1.2k 1.6k 2k 2.5k 3.1k 4k 5k 6.3k 8k 10k
64 65 68 69 14 15 16 80 81 82 82 19 16 12 11 11 10 60 67 65 64 65 66 62
69 11 12 14 16 15 11 81 02 83 83 81 80 19 18 19 18 16 lb 12 69 68 69 66
61 63 69 11 15 16 11 80 01 82 82 19 16 12 69 69 69 67 65 64 62 62 64 50
63 66 10 11 14 11 10 81 03 83 83 19 15 71 69 69 69 61 66 64 63 62 62 54
50 61 64 64 10 11 12 16 71 18 17 13 10 66 6 5 65 64 62 61 59 51 55 56 54
RUN NUMBER 59 ~~
Amplitude, in dB, for 1/3-octave-band frequency, in Hz, of:
50 63 80 100 125 160 200 250 315 400 500 630 800 l k 1.2k 1.6k 2k 2.5k 3.lk 4k 5k 6.3k 8k 10k
69 66 10 11 15 16 11 8 1 03 84 85 82 80 17 74 75 15 72 71 69 68 69 70 66
84 74 15 15 18 11 78. 82 84 85 86 85 84 82 82 03 82 81 80 17 lk 72 13 70
11 65 10 12 16 11 18 81 83 84 85 83 80 16 13 13 13 10 69 68 66 61 69 61
10 61 11 12 15 11 19 03 84 85 86 83 80 76 12 13 13 11 10 68 67 61 66 58
63 62 65 65 69 12 13 11 18 80 80 11 15 11 68 68 68 66 65 63 61 59 60 50
RUN NUMBER 60
level, dB
Amplitude, in dB, for U3-octave-band frequency, in Hz, of:
50 63 80 100 125 160 200 250 315 400 500 630 800 l k 1.2k 1.6k 2k 2.5k 3.lk 4k 5k 6.3k 8k 10k
60 69 10 11 16 71 16 81 82 03 82 79 11 14 12 12 12 10 10 68 66 61 68 64
11 72 13 14 11 16 11 82 83 84 84 82 82 81 80 81 80 19 18 75 72 70 11 60
65 65 10 11 16 11 16 00 82 83 e2 80 71 14 11 11 12 69 68 61 65 65 61 60
64 61 12 12 11 18 18 82 83 84 02 78 15 12 70 10 11 68 68 66 64 64 63 54
60 62 66 65 11 13 12 16 18 18 11 73 10 68 66 66 66 64 63 62 59 51 50 55

W 03
1 2 3 4 5 6
TABLE 6.- ROTATING-AIRFOIL VORTEX-NOISE SOUND PRESSURE MEASUREMENTS - Continued
RUJ NUMBER 61
90
94
90
9 1
86
1 2 3 4
6 5
50 63 80 100 125 160 200 250 315 400 500 630 800 l k 1.2k 1.6k 2k 2.5k 3. l k 4k 5k 6.3k 8k 10k
86
89
85
06
8 1
RUN NUMBER 62
Amplitude, i n dB, for U3-octave-band frequency, in Hz, of:
50 63 80 100 125 160 200 250 315 400 500 630 800 l k 1.2k 1.6k 2k 2.5k 3.1k 4k 5k 6.3k 8k 10k
68 69 1 2 13 7 8 80 81 84 85 86 8 5 82 80 7 8 76 76 1 5 7 3 12 69 68 68 69 65
7 5 76 80 8 1 83 03 8 5 88 89 09 80 06 85 04 8 3 83 82 80 79 76 72 70 11 60
Overall
3 4 5 6
93
94
88
Amplitude, in dB, for 113-octave-band frequency, in Hz, of: 1 50 63 80 100 125 160 200 250 315 400 5W 630 800 l k 1.2k 1.6k 2k 2.5k 3.1k 4k 5k 6.3k 8k 10k I
65 66 69 71 76 7 8 7 8 7 8 1 5 13 11 69 68 66 6 3 62 62 59 59 56 55 55 55 49
70 7 1 7 4 75 7 1 78 79 8 1 80 79 17 75 74 73 7 1 1 0 69 67 61 bk 60 51 5 1 51
63 65 70 1 2 76 70 7 8 7 8 1 5 7 3 11 60 67 6 5 6 1 61 60 56 56 54 5 1 50 5 1 42
6 2 66 71 7 2 77 79 00 79 75 7 2 10 67 bb 6 4 60 60 59 5 5 56 54 52 50 48 34
59 61 65 65 71 7 5 7 4 14 10 68 66 6 2 62 60 5 6 56 56 52 52 50 40 44 45 40
Overall sound Micro-
Amplitude, in dB, for U3-octave-band frequency, in Hz, of:
70 66 69 70 1 5 17 77 19 80 82 0 2 81 80 17 7 4 7 4 14 73 1 2 10 69 70 7 1 60
84 1 3 7 4 74 77 17 7 1 80 82 83 84 83 03 82 02 82 82 81 81 18 1 5 73 7 4 1 2
69 6 5 6 9 70 7 5 78 7 7 79 81 82 83 82 00 76 7 3 73 13 71 10 69 67 68 1 0 6 3
70 66 71 71 76 79 7 9 80 82 8 3 83 82 79 1 5 7 1 7 2 72 71 11 69 67 67 61 59
66 60 65 65 70 14 73 7 5 7 6 17 7 8 16 74 71 67 b8 68 66 66 64 62 60 6 2 59
RUN NUMBER 63
62 64 6 0 68 72 16 7 7 80 80 81 80 76 74 11 69 69 69 66 64 63 61 58 59 56
64 68 7 3 7 3 7 8 80 82 05 06 8 6 8 5 8 1 7 8 76 7+ 74 73 71 10 60 66 65 65
1 2 3 4
99
101
90
TABLE 6.- ROTATING-AIRFOIL VORTEX-NOISE SOUND PRESSURE MEASUREMENTS - Continued
RUN NUMBER 64
Amplitude, in dB, for 1/3-octave-band frequency, in Hz, of:
50 63 80 100 125 160 200 250 315 400 500 630 800 l k 1.2k 1.6k 2k 2.5k 3. l k 4k 5k 6.3k 8k 10k
71 69 72 13 78 80 8 1 84 86 87 87 85 83 80 78 79 79 77 75 72 71 71 72 69
85 7 7 80 81 83 83 84 89 89 90 90 89 88 06 85 86 86 84 82 79 75 73 75 71
71 69 73 75 79 80 81 84 86 87 87 85 83 79 77 77 77 75 72 70 68 69 71 64
72 69 1 3 74 7 8 80 82 85 87 88 88 05 82 79 76 77 77 74 73 71 69 69 68 6 1
67 61 67 67 72 75 76 80 81 82 82 79 77 74 72 72 72 70 68 66 61 61 62 60
95
RUN NUMBER 65
Overall sound
pressure level, dB
98
103
97
98
92
Amplitude, in dB, for U3-octave-band frequency, in Hz, of: Micro- phone
position 50 63 80 100 125 160 200 250 315 400 500 630 800 l k 1.2k 1.6k 2k 2.5k 3.lk 4k 5k 6.3k 8k 10k
69 69 73 72 76 78 79 84 85 8 8 89 89 89 87 8k 8k 84 83 81 79 77 78 79 76
92 94 8 5 83 82 81 83 88 89 90 92 92 92 91 91 91 91 90 88 85 E 1 80 81 78
67 68 7 4 74 77 18 79 83 85 87 89 89 88 86 83 82 83 80 78 76 74 75 77 70
73 74 7 4 73 77 79 80 85 87 89 90 90 89 85 82 82 82 81 79 77 76 75 75 67
70 71 67 67 71 14 75 79 81 83 e5 81 83 81 78 78 78 76 74 72 70 68 69 67
RUN NUMBER 66
Amplitude, in dB, for 1/3-octave-band frequency, in Hz, of: I 50 63 80 100 125 160 200 250 315 400 500 630 800 I k 1.2k 1.6k 2k 2.5k 3.lk 4k 5k 6.3k 8k 10k I
~~~~~~~~
73 79 76 76 76 18 79 84 86 88 90 90 90 8 9 87 86 86 85 83 81 79 80 8 1 7 8
89 96 07 87 82 E 1 83 E7 89 90 93 93 94 93 92 92 92 91 89 86 83 8 1 82 19
75 81 7 4 1 5 17 1 8 7 9 04 86 88 90 90 90 88 85 84 85 82 80 78 76 77 79 73
70 76 72 73 76 79 80 84 87 89 9 1 91 90 8 1 0 5 84 8 4 83 8 1 79 78 78 77 70
72 7 8 67 67 71 14 7 5 19 81 84 86 85 € 5 83 0 1 80 80 78 76 74 72 70 71 69 w W

1
- Micro- phone
position
1 2 3
RUN NUMBER 67
Overall sound
pressure level, dB
Amplitude, in dB, for U3-octave-band frequency, in Hz, of:
50 63 80 100 125 160 200 250 315 4oG 500 630 800 I k 1.2k 1.6k 2k 2 5 k 3.Ik 4k 5k 6.3k 8k 10k
98 70 70 75 74 78 79 80 84 86 88 90 89 89 87 84 84 85 83 8 1 1 9 7 1 78 7 9 16
67 60 1 5 76 79 80 8 1 84 86 88 89 89 88 86 83 82 83 80 78 11 15 75 71 70
103 93 94 86 84 84 83 84 89 90 9 1 92 92 93 92 9 1 9 1 9 1 90 88 85 82 80 8 1
97
TABLE 6.- ROTATING-AIRFOIL VORTEX-NOISE SOUND PRESSURE MEASUREMENTS - Continued
Micro- phone
position
Overall sound
pressure ,-
Amplitude, i n dB, for U3-octave-band frequency, i n Hz, of:
level, dB 50 63 80 100 125 160 200 250 315 400 500 630 800 l k 1.2k 1.6k 2k 2.5k 3. l k 4k 5k 6.3k 8k 10k
1 1 9 8 1 7 5 7 5 7 4 74 78 80 8 1 85 87 89 9 1 90 89 85 83 82 83 8 1 1 9 77 76 1 5 75 6 8 '
06
87
86
88
03
68 68 6 9 68 73 1 5 76 80 8 1 84 85 84 83 I 1 78 7 8 78 16 14 72 70 68 69 67 I
67 69 66 69 17 82 8 1 74 10 70 69 67 66 65 62 62 63 60 59 5 1 56 56 57
68 6 8 69 7 1 78 80 79 76 75 7 5 14 72 72 72 71 7 1 7 1 70 69 66 62 60 60
63 62 68 69 76 82 8 2 75 70 69 69 66 65 64 6 1 62 62 58 56 55 54 54 55 46 I I
60 63 6 8 70 78 85 83 75 69 68 68 6 4 64 62 59 60 60 57 58 55 5 4 53 50 35
60 62 62 63 72 19 78 70 b5 64 64 60 60 59 56 56 56 53 53 51 50 47 46 40 1
RUN NUMBER 68
99
104
98
99
94
Amplitude, in dB, for 1/3-octave-band frequency, in Hz, of:
50 63 80 100 125 160 200 250 315 400 500 630 8oc l k 1.2k 1.6k 2k 2.5k 3.lk 4k 5k 6.3k 8k 10k
73 79 76 76 77 18 7'7 84 86 E8 90 90 90 89 8.1 86 86 85 83 81 80 80 8 1 7 8
89 96 87 8 7 83 81 83 - 88 8 9 90 93 93 94 93 92 92 92 9 1 90 06 83 8 1 82 19
74 BO 7 6 75 17 19 19 84 86 88 90 90 90 8 8 85 84 85 83 80 79 7 1 77 7 9 73
70 76 13 73 77 19 80 85 87 89 9 1 9 1 90 88 85 84 85 83 82 80 78 78 77 70
72 78 67 67 1 2 1 4 1 5 19 8 1 84 86 8 5 85 83 8 1 BO 80 78 76 75 72 70 1 2 69
RUN NUMBER 69

TABLE 6.- ROTATING-AIRFOIL VORTEX-NOISE SOUND PRESSURE MEASUREMENTS - Continued
phone pressure position dB t.
RUN NUMBER 70
Amplitude, in dB, for 1/3m;tave-band frequency, in Hz, of:
50 63 80 100 125 160 200 250 315 400 500 630 800 l k 1.2k 1.6k 2k 2.5k 3.1k 4k 5k 6.3k 8k 10k
I- Overall
70 71 75 16 81 8 4 86 89 88 07 8 5 82 81 7 9 77 77 77 75 14 71 70 70 72 67
78 79 83 84 86 81 89 92 92 91 90 88 87 86 83 86 85 84 83 80 76 13 75 71
69 71 76 78 82 84 86 89 88 87 85 82 80 78 76 76 76 73 72 70 68 69 71 63
50 63 80 100 125 160 200 250 315 400 500 630 800 l k 1.2k 1.6k 2k 2.5k 3.lk 4k 5k 6.3k 8k 10k
1 1 96 1 68 71 75 16 80 84 87 90 88 87 8 5 81 79 77 74 75 75 73 12 70 68 68 67 58
1 2 3 4 5 6
I 6 I 91 I 63 65 69 70 74 79 81 85 83 82 80 76 75 13 10 71 71 68 67 65 63 60 62 58
100 73 74 7 8 79 83 e5 86 89 90 91 s i 90 89 87 a 5 84 85 83 82 80 78 79 80 76
105 93 94 a8 87 88 Ea 90 93 93 93 94 93 93 92 92 92 93 92 90 87 84 8 1 82 19
99 71 13 78 80 a3 E4 86 89 90 91 91 90 89 86 84 83 83 81 80 78 76 77 79 12
100 76 7 8 7 8 79 82 85 87 90 91 91 91 90 89 86 83 82 83 81 80 18 16 76 76 69
94 70 11 1 2 12 17 80 81 85 85 86 86 84 84 81 79 78 18 76 75 13 71 69 70 68
RUN NUMBER 71
Amplitude, in dB, for 1/3-octave-band frequency, in Hz, of:
50 63 80 100 125 160 200 250 315 400 500 630 800 l k 1.2k 1.6k 2k 2.5k 3. l k 4k 5k 6.3k 8k 10k
Overall Micro- sound ,-
74 77 76 78 82 85 86 89 89 89 89 86 85 83 BO 80 80 18 77 75 74 74 15 71
88 81 84 85 88 88 90 94 93 93 92 91 90 89 89 89 89 88 86 83 80 77 7 8 76
74 72 76 79 83 6 4 86 89 90 89 89 86 84 81 79 79 79 77 7 5 74 72 72 7 4 67
4 1 5 1 98 1 75 73 77 77 81 85 87 91 90 90 89 85 83 80 78 18 78 76 76 74 72 71 71 63 I 6 I 93 1 71 66 70 71 I5 80 82 85 85 8 5 84 80 78 7 6 7 4 7 4 74 72 71 69 67 64 65 63

TABLE 6.- ROTATING-AIRFOIL VORTEX-NOISE SOUND PRESSURE MEASUREMENTS - Continued
Amplitude, in dB, for 1/3-octave-band frequency, in Hz, of: Overal I Micro- sound phone pressure position level, dB 50 63 80 100 125 160 200 250 315 400 500 630 800 l k 1.2k 1.6k 2k 2.5k 3.1k 4k 5k 6.3k 8k 10k
1 101 75 79 7 8 79 83 8 5 86 E9 90 91 92 91 91 89 87 86 86 85 84 81 80 EO 02 78
2 106 90 96 89 E 9 08 88 90 93 93 93 94 94 94 93 93 94 94 93 92 89 E5 83 E 4 81
75 80 7 8 79 83 84 8 5 89 90 91 92 91 90 E 8 85 85 85 83 81 EO 70 78 80 73 ~ 1 loo
4 5 i 100
1 6 1 9 5
RUN NUMBER
7 4 7 9 7 8 79 02 e 5 86 90 91 92 93 9 2 90 07 8 5 E 4 84 83 82 80 70 78 7 8 71
71 7 7 7 2 73 76 79 81 84 85 E7 87 86 85 83 81 80 80 78 77 1 5 73 71 72 70
1 2 3
4 l
I 6 i
Micro- phone
position
1 2 3 4 5 6
Amplitude, in dB, for 113-octave-band frequency, in Hz, of:
50 63 80 100 125 160 200 250 315 400 500 630 800 l k 1.2k 1.6k 2k 2.5k 3. lk 4k 5k 6.3k 8k 10k
Amplitude, in dB, for U3-octave-band frequency, in Hz, of: Overall sound
pressure level, dB 50 63 80 100 125 160 200 250 315 400 500 630 800 - l k 1.2k 1.6k 2k 2.5k 3. l k 4k 5k 6.3k 8k 1Ok

TABLE 6.- ROTATING-AIRFOIL VORTEX-NOISE SOUND PRESSURE MEASUREMENTS - Continued
RUN NUMBER 74
Amplitude, i n dB, for U3-octave-band frequency, in Hz, of: phone
50 63 80 100 125 160 200 250 315 400 500 630 800 l k 1.2k 1.6k 2k 2.5k 3.lk 4k 5k 6.3k 8k 10k; I
15 5 4
16 54
17 5 4
45
46
46
46
4 1
48 43 42 42
45 42 45 46
41 45 44 44
46 45 45 44
48 4 9 5 1 51
46 45 46 41
45 44 46 47
44 43 45 47
46 4 4 46 41
45 44 45 46
47 44 45 45
5 0 44 45 46
35 38 4 3 40
38 3 9 44 40
39 38 4 3 40
40 39 44 41
44 4 1 44 37
4 1 39 43 40
4 1 39 43 3 9
31 3 1 43 40
4 1 38 43 40
43 40 4 3 40
40 38 44 41
42 40 43 40
39
39
39
40
3 3
39
39
39
39
39
3 9
39
39 33 29
31 30 29
38 35 31
40 3 5 31
33 29 21
39 34 30
39 35 32
38 33 31
38 3 3 31
38 34 31
38 34 31
39 35 33
30
32
30
3 0
21
30
30
29
29
31
30
31
22 24 21
24 2 4 22
24 28 26
23 25 25
19 23 23
24 25 25
24 25 26
25 25 26
26 2 1 26
26 2 1 21
21 28 26
2 1 2 8 21
18 20 12 1
19 1 5 10 3
20 21 14 1
19 I 1 12 5
18 18 18 13
20 20 16 1
20 20 13 5
22 23 18 11
20 20 18 14
22 22 18 12
20 21 18 12
2 4 2 3 2 1 1 1
5
-0
3
5
8
5
5
9
11
1 1
11
1 6
1 0 7
4 20
7 43
11 14
13
12 13
11 6 I
1 5 11
15 8
1 1 10
16 9
17 1 1
RUN NUMBER 75 I iMicro-lm- ~
Amplitude, in dB, for 1/3-octave-band frequency, in Hz, of:
Phone pressure position level, d~ I 50 63 80 100 125 160 200 250 315 400 500 630 800 l k 1.2k 1.6k 2k 2.5k 3.lk 4k 5k 6.3k 8k 10k -
I 7 1 4 5 1 59 6 1 62 64 66 6 6 6 1 6 5 60 51 54 52 50 46 48 46 40 4Q 41 39 38 38 2 9
8 7 2 , 55 51 6 0 60 63 63 6 3 64 62 60 58 5 5 53 51 46 48 4 1 42 42 39 38 32 28 22
9 , 1 2 56 57 60 61 63 t 3 63 64 62 60 58 5 5 5 3 51 414 45 41 43 39 41 36 32 28 20
13 14 :5 16 17 18 -
82
19
17
R!l
R2
R4
60 62 6 5 6 1 13 17 18 77 1 4 70 66 62 61 58 52 53 54 49 45 49 46 4 4 39 6 1
65 60 1 3 1 4 16 81 81 79 1 6 10 6 1 64 6 3 63 5 8 59 59 5 5 51 51 5 5 5 3 49 41
61 6 3 66 68 7 4 11 7 1 18 1 4 1 0 6 1 6 3 62 59 5 5 56 56 51 50 51 48 43 40 39
60 63 65 6 1 12 75 15 16 13 1 0 61 63 62 59 54 55 56 50 5 1 50 45 42 4 2 39
59 6 1 64 65 60 10 10 72 1 1 68 65 t 2 61 59 56 56 56 50 5 3 52 49 46 41 45
60 6 1 65 65 67 6 1 66 69 6 9 68 66 63 t 2 60 51 51 55 52 52 51 49 48 4 1 42
61 6 2 66 6 1 10 72 12 72 11 10 68 65 6 3 61 59 59 58 5 5 5 5 53 50 48 48 42
61 6 2 65 61 12 15 1 4 15 1 3 10 6 1 6 3 63 60 56 56 56 53 5 1 5 1 51 5 1 52 50
60 62 65 6 1 14 11 1 7 11 1 3 70 61 63 62 59 54 55 5 5 50 50 50 41 45 45 39

Micro- phone m i t i o n
7 8 9
10 11 12 13 14 15 16
17 18
14 15 16 17 18
TABLE 6.- ROTATING-AIRFOIL VORTEX-NOISE SOUND PRESSURE MEASUREMENTS - Continued
RUN NUMBER 76
0 1
86
8 9
91
97.
Overall sound
iressu re evel, dB
02
00
80
91
93
91
89
86
n4
07
I39
90
Amplitude, in dB, for 1/3-octave-band frequency, in Hz, of:
50 63 80 100 125 160 200 250 315 400 500 630 800 l k 1.2k 1.6k 2k 2.5k 3.lk 4k 5k 6.3k 8k 10k
59 61 6 3 64
58 6 1 6 3 64
58 60 6 4 65
63 6 5 6 8 70
69 7 2 16 76
64 66 69 71
63 6 6 60 1 0
62 6 5 6 0 69
62 6 5 69 1 0
63 66 70 71
64 66 6 9 1 1
63 6 5 6 8 10
6 5
66
6 5
15
79
76
14
7 2
7 2
7 4
74
7 5 I
RUN NUMBER 77
6 1 6 9 7 4 76 7 5 7 4 69 6 4 61 5 8 59 58 53 53 54 51 51 52 45
65 6 6 70 1 2 1 3 1 2 69 6 5 61 59 60 59 56 5 5 5 2 5 1 48 46 38
65 6 6 71 13 1 3 1 2 69 65 61 5 1 5 0 59 57 5 2 53 50 4 1 41 35
79 8 1 03 85 0 4 82 7 1 72 6 8 65 66 6 1 64 61 62 59 59 57 46
82 83 06 86 06 84 80 15 1 3 7 1 1 2 72 70 70 1 0 6 9 6 1 65 60
1 9 81 84 84 8 4 82 78 1 4 70 6 1 6 8 68 65 64 64 61 57 5 1 54
7 1 7 8 01 82 82 81 77 7 4 6 9 67 6 8 68 6 4 6 3 63 59 51 55 50
13 7 4 7 8 7 8 10 76 7 4 71 68 67 68 6 8 62 6 5 64 61 58 59 51
1 2 1 2 76 1 6 76 1 4 1 2 11 69 68 6 9 6 1 6 4 6 4 62 6 0 60 59 54
7 5 76 7 8 7 9 79 70 7 5 13 71 1 0 71 70 67 66 6 4 6 2 60 60 54
17 7 7 00 82 82 81 7 1 7 4 71 6 8 &8 68 66 64 62 61 59 59 5 4
79 80 82 03 83 82 17 74 6 9 6 1 67 67 6 3 6 4 62 60 58 58 52
Amplitude, in dB, for 1/3-octave-band frequency, in Hz, of:
50 63 80 100 125 160 200 250 315 400 500 630. 800 l k 1.2k 1.6k 2k 2.5k 3.1k 4k 5k 6.3k 8k 10k
59 61 6 4 65 66 68 6 9 1 5 7 1 77 77 7 5 70 65 6 2 6 4 6 3 59 59 59 57 51 58 5 2
60 61 6 4 65 67 66 6 6 70 73 7 4 7 5 1 3 70 66 62 6 3 6 3 59 59 56 55 52 50 41
59 61 64 6 5 66 6 5 66 71 1 4 1 4 15 13 70 6 5 60 61 63 60 56 5 1 54 51 4 5
63 6 5 6 0 70 16 80 8 1 84 85 8 6 0 5 82 18 72 68 70 1 0 67 65 65 6 3 63 6 1 49 ' 6 9 77 77 77 79 0 3 04 86 8 1 07 0 7 05 81 1 8 76 76 76 1 5 75 1 4 13 1 2 1 1 66
65 6 7 69 11 1 6 00 81 84 85 86 8 5 83 80 7 4 71 7 2 12 69 6 8 6 8 65 62 61 58 ' 66 66 68 70 1 4 17 7 9 82 83 83 03 81 79 7 3 7 0 7 1 7 2 67 67 67 6 3 60 59 54 ~
70 6 5 6 0 69 72 74 1 5 1 8 1 9 79 7 8 7 1 15 7 2 70 71 72 6 6 6 9 67 65 62 6 3 61 I 12 6 6 6 9 1 0 72 12 13 76 77 76 76 7 4 74 1 2 7 1 1 2 71 68 6 8 66 6 4 64 63 58
70 6 6 10 7 1 74 7 5 76 1 9 80 00 00 79 11 1 4 13 75 74 71 70 69 6 6 6 4 6 4 58
66 6 6 69 71 15 11 10 81 83 83 0 3 81 1 9 1 5 71 72 12 70 67 66 65 63 63 58
6 4 6 4 6 8 10 15 79 00 83 84 84 04 02 19 7 3 70 71 71 67 67 66 6 4 62 6 2 56
39 1

TABLE 6.- ROTATING-AIRFOIL VORTEX-NOISE SOUND PRESSURE MEASUREMENTS - Continued
RUN NUMBER 78
7 8 9
10 11
13 14
16
17 18
12
15
87
. 85
85
96
98
96
94
91
93
94
90
95
Amplitude, in dB, for 1/3-octave-band frequency, in Hz, of:
7 8 9
10 11 12
13 14 15 16
18 17
~ ~ ~ _ _ _ _ _ ~~
50 63 80 100 125 160 200 250 315 400 500 630 800 l k 1.2k 1.6k 2k 2.5k 3.lk 4k 5k 6.3k 8k 10k
89
87
87
97
101
98
96
93
92
95
96
97
59
67
6 5
6 2
69
67
73
80
82
80
73
66
6 1 63 64 64
67 62 6 2 63
6 5 62 63 63
63 67 69 74
7 1 75 75 77
67 67 70 74
73 66 68 72
80 10 69 69
83 1 3 71 68
80 70 69 71
73 66 6 8 73
66 66 6 8 74
6 6 67 74
63 64 70
6 3 64 71
79 01 04
01 8 2 86
78 00 84
76 78 81
71 73 77
69 71 75
73 75 78
76 77 8 1
78 79 83
78 7 9 80 80
7 4 76 78 78
75 76 78 78
07 80 89 00
8 0 8 9 91 91
86 87 89 08
83 85 87 87
79 80 01 81
76 77 79 79
80 82 84 83
83 85 87 86
85 87 88 88
77 72 60 69
76 74 69 69
77 73 67 67
86 80 16 76
89 86 82 82
87 8 2 70 78
8 5 82 70 78
81 79 77 79
79 77 76 78
83 81 80 81
86 83 79 78
86 81 77 77
68 65 65
69 66 66
68 67 63
77 75 72
82 8 1 81
79 16 75
78 75 75
79 74 76
77 75 74
80 78 77
79 77 75
77 74 74
65 63 64 65
62 62 59 58
64 60 5 8 53
73 71 71 70
81 80 79 78
74 72 70 70
74 71 69 69
74 73 70 72
73 71 71 71
76 74 72 72
73 72 71 72
73 71 71 71
59
50
47
60
7 4
6 1
65
70
67
b7
68
66
RUN NUMBER 79
Amplitude, in dB, for 1/3-cctave-band frequency, in Hz, of: Overall Micro- sound phone Dressure
50 63 80 100 125 160 200 250 315 400 500 630 800 l k 1.2k 1.6k 2k 2.5k 3. l k 4k 5k 6.3k 8k 10k
57 60 62 6 3 6 5 66 67 74 78 80 82 8 3 81 75 71 72 71 68 68 68 66 67 68 63
62 70 62 62 63 t 3 64 70 75 76 79 80 79 76 72 72 72 69 69 66 65 62 6 2 54
62 70 6 2 63 63 63 6 5 71 75 77 80 80 80 77 71 70 72 70 66 61 64 62 5 8 53
62 67 65 6 8 73 78 00 84 87 09 91 91 89 04 713 70 79 77 75 75 74 7 4 73 63
69 7 4 75 7 5 77 81 02 06 88 90 9 3 94 92 8 9 85 85 85 84 85 84 83 82 81 77
6 2 67 66 60 74 78 79 84 86 88 90 9 1 90 8 5 81 80 81 78 78 77 75 73 73 70
11 78 66 67 71 76 77 81 84 86 88 89 08 85 8 1 80 81 77 77 77 73 72 71 67
77 0 5 73 74 60 71 7 2 77 7 9 8 1 83 83 03 0 2 80 81 82 77 79 78 76 74 75 74
7 9 87 77 77 60 67 6 8 74 75 77 7 9 79 00 70 76 70 77 75 7 4 74 73 72 73 68
77 05 74 7 5 70 7 3 74 78 00 03 85 05 05 04 82 03 83 80 80 78 77 75 75 71
70 77 67 6 9 72 75 76 0 1 84 06 08 08 09 86 82 0 1 01 00 78 76 75 74 75 71
6 4 69 66 60 73 7 8 7 9 8 3 05 88 90 90 89 0 5 00 80 79 77 77 16 74 74 74 69

i
Micro- phone msition
7 8 9
10 11 12 13 14 15 16 17 18
TABLE 6.- ROTATING-AIRFOIL VORTEX-NOISE SOUND PRESSURE MEASUREMENTS - Continued
RUN NUMBER 80 Overall sound
pressure level, dB
50
50
50
50
62
5 9
5 8
59
5 0
59
58
5 0
~ ~ ~
Amplitude, in dB, for 1/3-cctave-band frequency, in Hz, of:
50 63 80 100 125 160 200 250 315 400 500 630 800 l k 1.2k 1.6k 2k 2.5k 3. l k 4k 5k 6.3k 8k 10k
50 51 49 50 49 43 41 48 45 42 40 34 34 32 20 25 26 21 13 13 1 8
49 50 50 49 40 44 42 49 46 42 40 34 34 32 22 25 2 1 22 1 5 13 7 4
50 5 1 50 50 49 45 42 50 41 42 42 36 34 32 23 24 20 21 15 14 0 4
50 50 50 50 50 45 42 49 46 43 41 35 34 32 23 25 20 22 16 15 0 6
53 5 4 54 52 52 51 46 49 44 31 35 20 29 20 15 22 23 19 -0 1 1 10 0
SO 52 51 50 40 44 4 2 40 46 42 40 35 34 32 23 24 20 23 9 10 12 0
50 51 50 49 40 45 42 47 45 42 4 1 37 H 31 24 26 29 24 20 10 11 1
50 52 50 50 50 44 41 41 45 42 41 35 34 31 22 24 29 24 21 19 12 10
49 50 50 50 40 43 41 49 46 42 41 35 35 31 25 26 20 23 15 20 15 11
50 51 50 50 49 46 44 50 47 43 41 31 35 32 25 21 29 26 20 20 14 11
49 50 50 50 49 43 41 49 47 43 41 36 35 32 26 27 20 24 11 20 13 12
49 4 9 50 49 49 44 42 40 .4b 43 41 37 36 33 21 21 30 2 1 21 22 16 13
13
8
6
12
1 4
14
12
11
1 1
19
19
20
19
22
11
13
15
41
15
29
14
RUN NUMBER
Amplitude, in dB, for 113-octave-band frequency, in Hz, of: ~ ~~~~ ~~
50 63 80 100 125 160 200 250 315 400 500 630 800 l k 1.2k 1.6k 2k 2.5k 3.1k 4k 5k 6.3k 8k 10k

TABLE 6.- ROTATING-AIRFOIL VORTEX-NOISE SOUND PRESSURE MEASUREMENTS - Continued
Overal I sound
pressure level, dB
66
6 9
RqN NUMBER 81
Amplitude, in dB, for U3-octave-band frequency, in Hz, of:
50 63 80 100 125 160 200 250 315 400 500 630 800 I k 1.2k 1.6k 2k 2.5k 3.1k 4k 5k 6.3k 8k 10k
57 57 54 53 57 5 5 53 5 1 54 54 53 51 49 46 43 48 42 3 1 31 21 17 16 2 1 50
56 51 56 51 59 51 56 63 5 6 57 54 52 52 50 47 52 45 33 35 26 25 43 50 28
Micro- phone
position
3 4 5 6
67 56 5 1 5 5 55 60 56 5 5 59 56 56 53 50 53 47 42 48 43 31 32 28 25 22 19
66 55 57 53 54 60 54 54 57 54 5 4 53 51 51 46 43 47 41 30 32 26 21 12 19 16
64 51 52 52 5 2 55 53 52 56 5 1 52 5 1 48 49 45 41 47 42 30 30 20 22 22 26 28
RUN NUMBER 82 I-- Ove ral I Micro-
phone pressure psition , level. dB , - ; I ;
7a
Amplitude, in dB, for 1/3-octave-band frequency, in Hz, of:
50 63 80 100 125 160 200 250 315 400 500 630 800 I k 1.2k 1.6k 2k 2.5k 3.lk 4k 5k 6.3k 8k 10k
56 59 5 1 5 1 61 t 2 6 2 66 65 65 6 2 58 56 5 3 48 4 1 48 48 50 41 32 29 31 30
56 64 60 58 64 t l 6 0 67 65 64 62 57 57 56 48 46 47 45 50 43 3 1 60 7 3 39
56 59 59 59 62 62 6 2 6 1 66 6 5 62 58 51 53 4 1 4 6 48 41 48 41 33 31 31 40
54 60 5 8 58 64 6 3 6 4 68 67 66 6 4 59 56 5 3 48 46 48 49 49 41 34 21 31 20
51 5 6 5 5 54 59 59 59 62 6 1 61 59 54 52 49 45 44 44 43 43 36 24 21 22 20
RUN NUMBER 83
Micro- Overall sound
phone pressure Amplitude, in dB, for U3-octave-band frequency, in Hz, of:
position level, dB 50 63 80 100 125 160 200 250 315 400 500 630 800 l k 1.2k 1.6k 2k 2.5k 3.lk 4k 5k 6.3k 8k 10k 1
4 5 6
62 5 1 59 59 63 6 6 61 13 7 5 15 1 5 12 10 61 62 59 57 53 5 5 56 59 55 48 38
15 7 1 66 6 3 64 63 6 4 12 74 1 5 15 71 70 60 61 59 57 50 58 56 57 67 7 3 40
59 5 8 6 1 61 6 5 66 67 13 7 5 7 6 15 72 71 61 61 58 58 54 54 55 56 50 4 5 41
61 5 8 61 61 66 69 71 15 7 1 18 17 13 70 61 62 59 51 53 56 59 58 52 44 32
56 5 3 56 56 M) 6 2 65 10 70 7 2 1 1 67 6 5 62 56 54 53 48 4 9 52 51 44 3 1 30

TABLE 6.- ROTATING-AIRFOIL VORTEX-NOISE SOUND PRESSURE MEASUREMENTS - Continued
Micro- phone
position
1 2
Overall sound
pressure level, dB
Amplitude, in dB, for U3-wtave-band frequency, in Hz, of:
50 63 80 100 125 160 200 250 315 400 500 630 800 l k 1.2k 1.6k 2k 2.5k 3.1k 4k 5k 6.3k 8k 10k
85 1 4 5 9 6 2 62 66 6 8 1 0 1 5 11 18 18 1 6 1 4 1 1 6 1 64 62 58 58 58 60 6 2 58 4 4
9 3 92 1 9 1 8 1 0 64 6 3 66 74 1 6 7 1 18 15 74 12 6 1 65 62 54 59 51 58 65 1 0 4 1
86 ~ 1 4 6 4 6 4 64 67 6 8 1 0 15 11 1 8 1 9 7 6 15 12 6 5 63 61 5 5 56 56 58 58 52 46
Micro- Overall sound
phone pressure
i 5 8 1 I 18 61 63 63 68 70 1 3 11 1 9 80 80 11 15 11 6 1 64 62 5 8 58 60 6 1 59 54 3 1
1 6 ~ 8 2 1 1 4 57 5 1 51 61 t 4 66 11 1 2 1 4 1 4 11 69 66 6 2 59 5 1 52 52 53 54 52 45 3 1
Amplitude, in dB, for 1/3-wtave-band frequency, in Hz, of:
RUN NUMBER 85
position
1
level, dB , 50 63 80 100 125 160 200 250 315 400 500 630 800 l k 1.2k 1.6k 2k 2.5k 3.lk 4k 5k 6.3k 8k 10k I
91 1 9 80 1 9 16 68 69 1 2 11 80 8 2 83 81 80 1 8 1 4 1 2 10 64 63 6 1 62 6 5 69 60
RUN NUMBER 86 I Micro- I Overall sound phone pressure
position dB
Amplitude, in dB, for 1/3-wtave-band frequency, in Hz, of:
50 63 80 100 125 160 200 250 315 400 500 630 800. l k 1.2k 1.6k 2k 2.5k 3. l k 4k 5k '6.3k 8k 10k
2 ~ 7 1
l I b 8 3
51 57 59 58 58 51 5 5 60 5 5 5 4 51 50 5 3 4 1 4 3 41 42 29 30 18 1 5 15 18 58
61 6 5 6 2 61 61 59 5 1 59 56 5 5 54 5 3 55 4 9 48 51 46 3 5 3 4 21 22 1 16 29
6 1 60 58 59 58 5 5 56 5 5 5 3 52 54 49 46 43 48 42 29 3 3 21 21 24 24 38 1 57

TABLE 6.- ROTATING-AIRFOIL VORTEX-NOISE SOUND PRESSURE MEASUREMENTS - Continued
1 2 3 4 5 6
RUN NUMBER 87
12 54 5 1 51 5 1 59 61 61 66 64 64 6 1 5 1 51 53 48 47 48 41 49 41 48 48 42 3 5
13 55 59 59 59 62 61 60 65 64 6 4 62 58 58 5 1 5 1 50 SO 49 51 49 49 45 42 38
12 55 5 8 60 58 60 62 6 1 65 65 63 6 1 50 55 53 41 46 41 44 48 47 48 45 39 39
14 53 58 60 59 62 63 64 61 66 66 63 58 55 5 2 48 4 1 48 46 4 9 47 49 45 38 25
69 5 1 5 5 56 55 50 58 5 8 62 61 60 58 53 51 48 45 44 44 42 43 42 42 39 29 21
I Micro-
RUN NUMBER 88
'--I Amplitude, in dB, for 1/3-octave-band frequency, in Hz, of:
Pressure phone msition
1 2 3 4 5 6
50 63 80 100 125 160 200 250 315 400 500 630 800 l k 1.2k 1.6k 2k 2.5k 3.lk 4k 5k 6.3k 8k 10k level, dB 82
83
82
n4
18
61 58 60 bQ 63 66 68 12 14 1 5 1 4 12 10 6 1 62 60 59 56 5 1 5 1 58 60 63 61
1 5 1 5 66 6 3 64 62 6 4 11 14 15 7 4 10 10 60 62 61 60 55 59 5 1 51 61 68 59
58 60 61 61 64 66 61 12 14 1 5 1 4 11 70 61 60 5 8 58 55 54 56 56 58 61 54
59 59 61 62 66 6 0 11 1 5 11 11 16 13 10 6 1 62 59 58 54 51 51 51 60 62 52
56 5 5 56 5 1 61 t 3 65 69 10 1 1 11 67 65 62 5 1 5 5 54 49 5Q 51 50 5 1 5 5 5 1
RUN NUMBER 89
Amplitude, in dB, for 1/3-octave-band frequency, in Hz, of:
50 63 80 100 125 160 200 250 315 400 500 630 800. l k 1.2k 1.6k 2k 2.5k 3.lk 4k 5k 6.3k 8k 10k
71 58 63 62 6 5 6 0 bq 14 1 6 11 10 15 14 11 66 64 62 5 8 59 58 59 62 6 5 63
91 11 11 6 8 64 64 6 5 13 1 6 17 11 14 74 12 61 65 64 59 62 60 60 65 1 2 62
3 R5
4 5 07
68 62 6 3 64 66 61 6 9 14 16 7 1 11 1 5 1 3 11 6 5 63 62 51 58 58 58 60 6 3 58
18 62 6 3 64 60 10 12 11 19 80 19 11 14 11 61 64 62 58 59 59 60 61 64 5 1
I 6 1 01 I 10 55 5 1 50 61 64 66 11 12 14 14 10 68 6 6 62 60 58 54 53 53 53 53 58 56 I

Micro- phone
position
1 2 3 4
, 5
L
Overall sound
pressure level. dB
TABLE 6.- ROTATING-AIRFOIL VORTEX-NOISE SOUND PRESSURE MEASUREMENTS - Continued
RUN NUMBER 90
Amplitude, i n dB, for U3-octave-band frequency, i n Hz, of:
50 63 80 100 125 160 200 250 315 400 500 630 800 l k 1.2k 1.6k 2k 2.5k 3. l k 4k 5k 6.3k 8k 10k
overall sound
pressure level. dB
90
103
90
Amplitude, in dB, for U3-octave-band frequency, in Hz, of:
50 63 80 100 125 160 200 250 315 400 500 630 800 l k 1.2k 1.6k 2k 2.5k 3. l k 4k 5k 6.3k 8k 10k
1 5 16 1 9 16 68 10 7 2 11 1 9 81 82 8 1 00 1 0 1 4 12 10 65 64 6 3 6 3 66 7 0 6 1
99 100 90 01 19 69 1 0 16 1 9 8 1 82 80 00 1 9 15 1 4 11 66 6 8 66 6 5 6 3 6 1 6 1
00 8 1 1 3 11 68 10 1 1 11 1 9 81 02 80 19 11 1 3 1 1 69 64 6 3 62 62 6 4 6 1 62
61 5 6 59 58 64 5 1 5 6 62 5 8 60 57 54 53 5 1 48 46 41 4 1 49 46 42 39 31 2 1
5 9 5 4 59 59 6 3 5 5 5 3 51 5 5 5 5 5 5 51 54 5 0 46 44 43 40 43 41 35 30 23 24
91 66 66 60 6 1 11 12 1 4 1 9 81 0 3 84 82 80 11 1 4 12 b9 65 65 63 63 65 66 6 3
06 ( I 5
7 b 66 65 63 66 68 1 3 15 11 1 9 16 1 4 12 69 6 1 65 59 5 0 51 56 56 60 60 A
,
RUN NUMBER 91
sound
3 4 5
1 4
6 0
Amplitude, in dB, for 1/3-octave-band frequency, in Hz, of:
50 63 80 100 125 160 200 250 315 400 500 630 800 l k 1.2k 1.6k 2k 2.5k 3.1k 4k 5k 6.3k 8k 10k
54 53 5 5 59 13 56 54 51 58 51 5 3 52 52 40 4 1 50 4 3 28 30 25 28 30 29 25
56 5 1 5 8 60 69 51 5 6 63 61 61 56 54 5 5 52 53 54 48 36 36 28 21 45 5 1 25
55 5 5 5 5 59 12 56 54 61 50 58 54 52 51 48 41 48 43 3 1 34 2 1 23 23 25 22
54 5 4 54 5 5 63 55 54 59 51 59 53 51 52 40 46 41 42 31 31 24 19 11 21 25
51 5 1 5 3 5 5 64 54 53 54 5 3 5 5 52 50 50 47 48 40 42 32 29 20 16 14 15 19
RUN NUMBER 92
Micro- phone
position
64 5 9 6 1 63 1 4 59 5 6 61 59 58 51 53 54 52 48 46 41 46 50 48 43 43 1 I :: I 6 6 60 6 3 63 73 60 5 8 65 61 61 60 54 56 51 50 50 48 44 53 48 38 59 65 42
I : 1 4
28 I 65 5 8 b5 6 4 10 50 56 63 60 58 58 54 56 53 46 46 46 43 49 4 1 40 38 33

TABLE 6.- ROTATING-AIRFOIL VORTEX-NOISE SOUND PRESSURE MEASUREMENTS - Continued
Micro- phone
position
1 2 3
Amplitude, in dB, for 1/3-octave-band frequency, in Hz, of:
50 63 80 100 125 160 200 250 315 400 500 630 800 l k 1.2k 1.6k 2k 2.5k 3. l k 4k 5k 6.3k 8k 10k
Overall sound
~~~~~~~
15 63 59 59 60 12 59 59 62 60 61 59 5 3 56 5 5 52 53 5 5 53 55 56 58 5 8 50 39
82 11 11 6 1 65 1 4 60 60 65 60 66 63 52 59 59 41 55 56 49 51 56 55 67 1 3 52
1 4 62 61 60 62 10 58 5 9 62 59 6 3 61 52 55 55 49 52 53 49 53 55 56 5 3 46 31
5 1 3 63 62 60 61 66 5 8 59 61 59 61 61 53 55 5 5 5 1 52 54 52 54 56 51 55 46 36
~ 6 1 6 9 I 59 55 5 5 55 64 5 5 5 5 5 0 54 58 51 49 5 1 50 46 48 49 47 48 50 51 47 3 1 30
Overall Micro- sound phone pressure
position level, dB
1 18
2 92
RUN NUMBER 94 ~
~~ ~
Amplitude, in dB, for 1/3-octave-band frequency, in Hz, of:
50 63 80 100 125 160 200 250 315 400 500 630 800 l k 1.2k 1.6k 2k 2.5k 3.lk 4k 5k 6.3k 8k 10k
1 4 61 62 63 11 62 51 61 59 61 6 4 54 51 56 53 54 51 54 51 51 59 62 59 43
, 92 1 9 18 1 1 72 62 5 5 6 4 59 6 3 65 49 58 60 48 56 51 48 58 56 56 6 8 1 4 46
RUN NUMBER 5 ~ ~ ~~~~
Amplitude, in dB, for 1/3-octave-band frequency, in Hz, of: >UUIIU
phone pressure position level, d~ 50 63 80 100 125 160 200 250 315 400 500 630 800 I k 1.2k 1.6k 2k 2.5k 3. I k 4k 5k 6.3k 8k IOk
1 86 80 81 19 16 69 64 6 4 64 6 3 62 6 3 61 59 60 5 8 60 61 60 61 61 62 65 68 62
2 I 105 (100 101 93 90 81 11 66 6 8 62 63 66 56 61 6 5 56 60 60 54 59 5 8 58 89 9 4 63
3 a3 1 1 1 1 80 11 70 6 5 6 4 65 63 62 6 3 56 5 8 61 5 5 5 1 60 5 5 58 59 60 62 66 55
4
5 85 81 8 1 12 69 69 66 63 6 5 62 61 64 59 59 59 56 5 8 60 59 59 60 60 6 4 62 56
6 78 1 3 1 3 1 1 6 8 6 3 5 9 5 8 60 56 56 59 5 1 5 4 54 48 52 54 5 1 53 53 54 54 55 51 ' ,-I
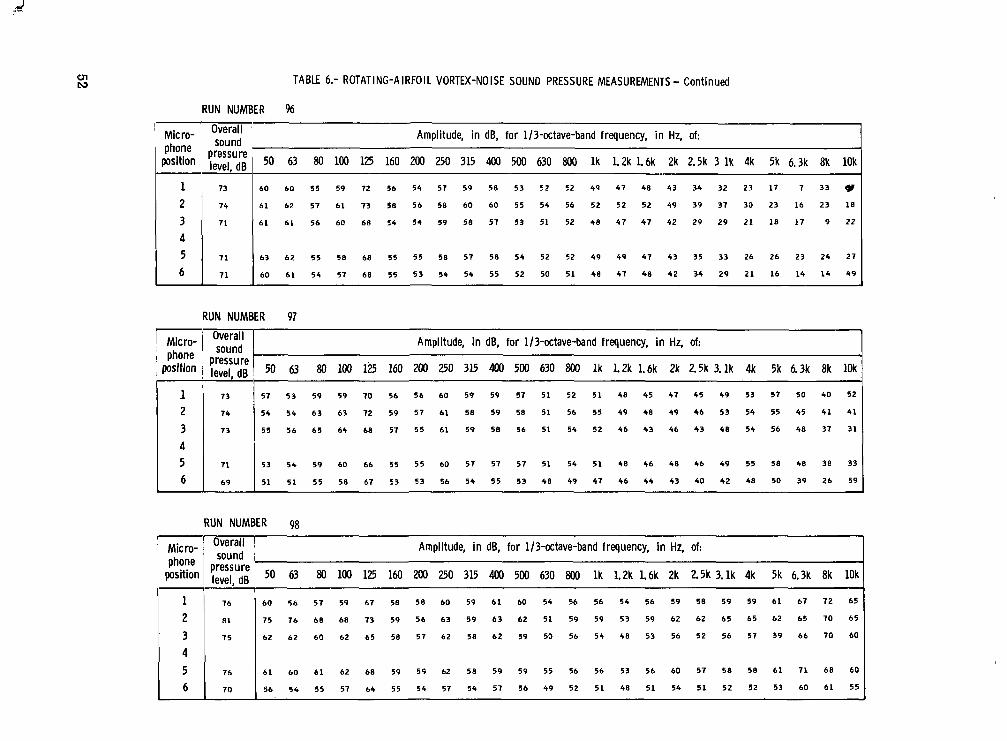
TABLE 6.- ROTATING-AIRFOIL VORTEX-NOISE SOUND PRESSURE MEASUREMENTS - Continued
1 2 3 4 5 6
RUN NUMBER 96
73 60 60 55 59 72 56 54 57 59 50 53 52 52 49 47 40 43 34 32 23 17 7 33 (r
74 61 62 57 61 73 50 56 50 60 60 55 54 56 52 5 2 52 49 39 31 30 23 16 23 10
r i 61 61 56 60 60 54 54 59 50 51 53 5 1 52 4 0 47 47 42 29 29 21 10 17 9 22
71 63 62 55 5 0 60 55 55 58 57 50 54 52 52 49 49 47 43 35 33 26 26 23 24 27
71 60 61 54 57 60 55 53 54 54 55 52 50 5 1 40 47 40 42 34 29 21 16 14 1 4 49
Amplitude, in dB, for U3-octave-band frequency, in Hz, of: Overall sound
‘ G L ~ i!:::n , ~~~~~~~ 1 50 63 80 100 125 160 200 250 315 400 500 630 800 l k 1.2k 1.6k 2k 2.5k 3 l k 4k 5k 6.3k 8k 10k
Overall I Micro- 1 sound I phone pressure
Amplitude, in dB, for U3-octave-band frequency, in Hz, of:
RUN NUMBER 97
I 1 73 , 2 74
3 73
4 5 71
6 69
57 53 59 59 70 56 56 60 59 59 57 5 1 5 2 5 1 40 45 47 45 49 53 57 50 40 52
54 54 63 63 72 59 51 61 50 59 50 5 1 56 55 49 40 49 46 53 54 55 45 41 41
55 56 65 64 60 57 5 5 61 59 50 56 5 1 54 52 46 43 46 43 40 54 56 40 37 31
53 54 59 60 66 55 5 5 60 57 57 57 5 1 54 5 1 40 46 40 46 49 55 50 40 30 33
51 5 1 5 5 50 b7 53 53 56 54 55 53 48 49 47 46 +4 43 40 42 40 50 39 26 59
Micro- phone I position
RUN NUMBER 98
Overall sound I j
pressure
Amplitude, in dB, for U3-octave-band frequency, in Hz, of:
level. dB ! 50 63 80 100 125 160 200 250 315 400 500 630 800 l k 1.2k 1.6k 2k 2.5k 3. l k 4k 5k 6.3k 8k 10k
60 5 h 51 59 67 50 5 0 60 59 61 60 54 56 56 54 56 59 50 59 59 61 67 7 2 65
75 7h 6 0 60 73 59 56 63 59 63 62 5 1 59 59 53 59 62 62 65 65 62 65 70 6 5
1 5 62 62 60 62 6 5 50 57 62 50 62 59 50 56 54 40 53 56 52 56 57 59 66 70 60
4 1 5 1 76 1 61 60 6 1 62 60 59 59 62 5 0 59 59 55 56 56 53 56 60 57 50 50 61 71 6 0 6 0
1 6 1 70 I 56 5 4 55 57 64 55 54 57 54 57 56 49 52 5 1 40 5 1 54 5 1 52 52 53 60 6 1 55

cn w
Overal I Micro- sound phone
position ~~~~~u~~
Amplitude, in dB, for 1/3-octave-band frequency, in Hz, of:
50 63 80 100 125 160 200 250 315 400 500 630 800 l k 1.2k 1.6k 2k 2.5k 3. l k 4k 5k 6.3k 8k 10k ~~ ~ _ _ _ _ ~ ~
I 1 I 19 1 1 4 59 63 64 68 58 56 61 61 60 64 53 56 57 5 3 5 5 57 55 58 5 7 59 67 72
phone position
1
1 2 ' 92 1 91 18 7 1 71 1 3 59 55 64 59 61 64 51 59 60 51 57 60 57 64 62 59 62 69 6 0
7 8 7 4 62 6 4 64 66 60 56 61 59 58 64 51 56 5 5 50 52 56 52 57 5 8 58 67 71 6 8 3 4 5 6
01 1 9 63 61 61 69 63 59 62 59 59 62 53 56 56 54 56 5 0 56 5 8 58 59 66 1 3 65
1 5 1 3 5 1 51 59 64 57 53 5 0 5 5 54 5 0 49 53 51 40 51 5 2 50 5 2 52 52 57 64 62
bUUllU
pressure level, dB 50 63 80 100 125 160 200 250 315 400 500 630 800 l k 1.2k 1.6k 2k 2.5k 3.1k 4k 5k 6.3k 8k 10k
86 7 9 80 7 1 73 69 64 65 65 63 63 63 62 62 62 62 63 6 5 65 67 67 67 71 75 75
RUN NUMBER 100
2 103
Amplitude, in dB, for 1/3-octave-band frequency, in Hz, of: Overall I I Micro- 1 --..-A
99 ,100 90 66 61 69 70 68 64 65 66 58 6 4 66 61 65 6 8 68 73 72 70 70 7 4 73
Overall sound
pressure level, dB
phone position
Amplitude, i n dB, for 1/3-octave-band frequency, in Hz, of:
50 63 80 100 125 160 200 250 315 400 500 630 800 l k 1.2k 1.6k 2k 2.5k 3. I k 4k 5k 6.3k 8k 10k
RUN NUMBER

TABLE 6.- ROTATING-AIRFOIL VORTEX-NOISE SOUND PRESSURE MEASUREMENTS - Continued
RUN NUMBER 101 ~~ ~~ ~
Amplitude, in dB, for 1/3-octave-band frequency, in Hz, of: Overall Micro- sound phone pressure
position ,,R 50 63 80 100 125 160 200 250 315 400 500 630 800 l k 1.2k 1.6k 2k 2.5k 3.1k 4k 5k 6.3k 8k 10k ,
7 8 9
10 11 12 13 14 15 16
17
55
54
56
55
5 1
55
54
5 5
55
54
54
65
48 48 4 1 4 1 41 39 3 6 35
4 1 4 1 46 4 1 46 42 3 6 35
40 52 46 41 46 45 3 1 34
48 47 46 48 4 1 41 38 34
49 49 51 51 49 45 42 39
48 49 4 1 48 41 40 3 1 36
4 1 47 4 1 48 41 4 1 36 36
4 1 47 46 41 41 42 3 8 34
41 48 4 1 48 41 41 36 35
40 47 46 41 46 42 3 1 34
45 45 46 41 41 41 31 35
5 8 64 48 48 48 43 4 3 36
36
35
35
3 5
33
36
35
35
3 5
34
35
31
34
34
34
34
29
35
34
3 5
34
34
34
35
34
34
34
33
25
33
33
3 4
34
33
34
34
29
20
21
28
1 1
28
30
31
31
28
31
30
30
29
29
29
20
29
30
30
31
29
31
30
26
21
26
2 1
21
26
28
28
28
2 1
28
28
1 1 20 21
1 1 21 22
1 8 21 21
1 1 22 21
10 12 12
1 1 21 21
23 22 21
23 23 23
23 24 23
1 8 22 22
24 25 24
22 23 23
15 1
16 6
18 6
16 6
4 -1
13 6
16 11
16 15
16 9
13 3
1 8 16
19 19
10
10
12
10
-4
11
13
12
12
12
14
13
7 3
4 -1
6 1
5 2
-4 1
5 1
5 2
3 2
6 2
6 3
12 8
13 8
9
5
1
8
1
5
10
9
10
9
14
1 1
21
1
8
19
13
-1
-1
-1
5
1 1
RUN NUMBER 102
Amplitude, in dB, for U3-octave-band frequency, in Hz, of: Overall Micro- sound phone pressure
position level, dB 50 63 80 100 125 160 200 250 315 400 500 630 800 l k 1.2k 1.6k 2k 2.5k 3.1k 4k 5k 6.3k 8k 10k P
7 5 9 48 4 1 4 1 46 46 41 4 1 5 1 52 5 1 41 43 39 35 30 31 33 33 29 32 32 2 3 18 8
8 5 1 46 41 46 46 45 46 44 41 49 40 45 41 38 36 29 32 32 30 32 29 30 25 18 9
9 5 8
10 67
48 57 46 46 45 41 44 41 49 46 4 5 40 38 34 21 3 1 32 30 3 1 30 30 23 16 11
48 4 1 48 49 52 56 58 61 61 59 56 50 46 4 3 3 1 3 9 39 39 36 40 40 29 25
50 52 56 51 56 60 61 6 3 63 61 58 53 49 46 43 44 44 45 45 46 46 36 28 22
48 49 48 49 53 51 51 61 6 1 59 56 50 48 43 31 40 41 39 3P 42 41 32 25 17
47 46 4 1 48 51 5 5 5 5 58 58 56 53 49 4 1 44 36 38 39 31 40 40 41 35 29
46 46 45 45 48 5 1 5 1 5 5 53 52 49 45 43 42 35 41 39 36 39 40 38 33 29 15
46 45 44 44 44 45 42 46 42 42 4 1 34 39 39 30 40 33 29 27 30 27 19 23 4
46 45 45 45 48 50 50 54 53 52 50 45 44 44 35 40 40 39 39 39 39 34 29 21
44 45 46 4 1 52 56 5 4 58 58 5 1 54 50 41 45 39 42 41 40 41 41 42 38 30 18
56 6 3 49 49 55 59 58 60 60 59 56 51 48 4 3 3 0 40 40 39 41 40 40 33 30 20

m a
Overall sound
pressure level, dB
TABLE 6.- ROTATING-A IRFOIL VORTEX-NOISE SOUND PRESSURE MEASUREMENTS - Continued
RUN NUMBER 103
Amplitude, in dB, for 1/3-octave-band frequency, in Hz, Of:
50 63 80 100 125 160 200 250 315 400 500 630 800 l k 1.2k 1.6k 2k 2.5k 3 . lk 4k 5k 6.3k 8k 10k phone
position
8 9
10 11 12 13 14 15 16
17 18 ,
Micro- phone position
7
Amplitude, i n dB, for 1/3-octave-band frequency, i n Hz, of: Ove ra I I sound
pressure level, dB 50 63 80 100 125 160 200 250 315 400 500 630 800 l k 1.2k 1.6k 2k 2.5k 3. I k 4k 5k 6.3k 8k 10k
72 50 50 50 50 51 53 5 3 60 64 6 5 6 5 63 59 55 5 1 48 41 43 39 43 42 43 50 43
67 69 I ;: 67 49
71 50
A0 55
17 50
14 50
70 53
61 55
70 51
75 48
77 51
8 69
50 50 49 51
4A 49 49 49
57 48 49 49
57 5 2 53 56
51 62 61 61
5 3 5 2 53 51
50 50 5 1 54
41 48 49 50
44 45 45 42
45 47 49 50
48 49 5 1 54
63 52 53 57
60 50 49 49 49 48 50 57 61 62 62 60 58 55 49 41 46 40 40 40 40 40 42 31
53 52 58 62
49 49 55 59
50 49 55 59
6 1 64 68 71
6 5 61 10 12
61 63 68 70
58 60 65 61
53 56 61 63
41 44 50 49
5 2 5 5 60 62
58 59 6 5 68
t2 64 68 70
63
60
61
11
13
71
68
63
53
63
69
71
61 59 56
59 57 55
59 56 54
69 66 63
12 69 66
70 61 64
67 64 t3
62 59 59
52 47 50
63 60 59
68 65 63
70 67 63
5 1
5 1
49
59
63
60
58
55
49
56
59
59
46 44 44 41 38 42 39 43
45 44 43 30 39 38 39 39
43 43 42 38 38 39 39 31
54 52 50 47 45 49 40 51
59 57 56 54 53 55 54 56
54 53 53 48 48 52 49 50
5 1 49 49 45 45 48 49 48
47 48 48 43 45 49 46 43
31 45 45 33 31 39 34 32
46 48 49 45 42 49 48 46
54 53 52 48 48 50 50 52
54 52 51 47 50 50 48 51
47 34
41 34
36 32
53 35
58 49
52 42
5 1 41
41 43
40 20
52 49
54 41
53 42
:
i i i
i 1 i
! i I
1 I i i
I
I
i
I
I
I i : I I

TABLE 6.- ROTATING-AIRFOIL VORTEX-NOISE SOUND PRESSURE MEASUREMENTS - Continued
I Micro- I phone 1 position
RUN NUMBER 105
Amplitude, in dB, for 1/3-octave-band frequency, in Hz, of:
50 63 80 100 125 160 200 250 315 400 500 630 800 l k 1.2k 1.1% 2k 2.5k 3.1k 4k 5k 6.3k 8k 10k
Ove rat 1 sound
pressure level, dB iI 1 7 ' 1 6
8 ~ 76
61 6 1 62 60 61 65 69 13 1 6 11 18 16 1 3 1 0 67 65 62 51 53 54 54 56 56 55
61 61 61 65 65 68 1 1 1 5 11 18 80 19 16 13 11 68 66 62 60 60 59 60 6 3 6 1 '
62 62 5 8 55 53 55 5 1 63 6 1 68 69 69 66 62 5 8 56 54 49 44 46 46 41 50 53
68 bA 58 5 5 51 50 52 59 64 66 67 65 64 62 56 5 5 54 41 45 44 43 43 46 40
66 66 59 56 52 51 52 60 64 61 6 1 6 5 64 60 55 54 5 3 46 45 45 44 42 41 40
1 13 1 ~4
I l4
69 69 b0 59 61 65 6 8 12 15 1 7 78 16 1 4 70 66 65 64 56 5 5 56 54 54 56 5 5
1 6 16 60 58 59 62 6 4 69 12 1 4 1 5 13 7 3 10 64 b 3 62 54 54 5 5 54 55 5 1 53 1 86
88
84
83
84
Micro- Phone position
7
82 82 7 1 61 5 1 5 1 60 65 6 1 69 11 68 68 66 62 62 59 32 54 55 52 51 54 50
84 84 1 4 10 58 45 48 55 54 59 61 59 60 5 8 50 53 53 45 31 48 45 43 49 42
80 80 6 8 6 4 56 5 1 59 64 6 1 69 1 1 69 69 61 62 6 1 61 54 50 5 5 54 54 58 56
1 1 1 1 62 59 59 62 6 4 69 1 3 1 4 16 14 13 10 6 6 b4 63 5 8 56 5 5 56 51 60 55
68 68 6 2 60 62 6 5 68 12 15 11 18 16 13 69 66 64 62 56 51 55 54 55 58 56
Amplitude, in dB, for 1/3-octave-band frequency, in Hz, of: Overall sound
pressure level, dB 50 63 80 100 125 160 200 250 315 400 500 630 800 l k 1.2k 1.6k 2k 2.5k 3. l k 4k 5k 6.3k 8k 10k
5 3 48 4 A 45 44 42 38 31 30 30 30 31 28 28 25 16 18 19 8 5 11 5 3 9 5
'
8 1 1'0
15 53 , 40 41 46 45 43 40 32 30 29 30 30 21 21 25 16 20 20 1 4 9 3 3 9 -6
16 53 41 4b 44 43 4 3 42 34 30 28 30 30 26 21 26 16 21 21 9 3 13 1 5 11 1
17 5 2 44 44 44 43 44 43 33 30 28 30 30 28 28 26 19 21 22 15 11 12 11 8 16 13
18 6 4 51 63 4 1 45 46 43 42 31 33 31 31 29 29 26 19 22 22 15 20 14 13 9 18 12 A
53
56
53
47 47 45 44 43 42 3 3 30 30 30 31 21 21 25 16 20 20 12 6 10 4 0 6 11 I 49 53 46 44 42 45 35 31 30 31 31 26 28 24 16 20 21 12 6 12 5 1
48 4 1 45 44 43 40 3 4 30 29 30 31 27 28 26 16 20 20 8 4 8 4 3 9 1
48 50 46 45 43 k0 34 32 30 31 30 26 21 24 16 20 20 1 6 12 6 1 5
56 49 49 50 48 45 44 38 33 21 25 24 11 19 21 9 1 9 4 0 -2 -4 0 6 i :: I 54 I 41 46 45 45 4 3 4 1 3 3 30 28 30 30 21 21 26 18 19 20 8 12 10 4 5 11
41 41 45 44 44 42 3 4 29 28 31 31 28 28 26 16 20 20 8 12 8 2 4 10 5

TABLE 6.- ROTATING-AIRFOIL VORTEX-NOISE SOUND PRESSURE MEASUREMENTS - Continued
Amplitude, i n dB, for 1/3-octave-band frequency, in Hz, of: Overall Micro- sound phone pressure
position level, dB 50 63 80 100 125 160 200 250 315 400 500 630 800 l k 1.2k 1.6k 2k 2.5k 3. l k 4k 5k 6.3k 8k 1Ok I
I1 7 I 59
~ 8 ! 5 7 I ' 9 58
10 68
49 40 46 46 46
47 46 45 45 45
40 52 45 45 45
49 47 47 49 53
46 47 51 52 50
44 43 47 49 40
46 43 47 49 40
56 5 8 6 1 61 59
59 61 64 63 61
57 5 0 61 61 60
5 5 5 5 59 50 57
51 5 1 54 54 52
45 42 47 43 43
49 50 53 53 52
56 54 58 50 57
50 5 0 60 .60 59
Overall Micro- sound phone pressure
position level, dB
7 70
a 68
47 41 30 35
45 39 37 35
45 30 37 33
5 5 49 45 42
57 52 48 46
56 49 47 43
53 48 46 43
49 44 42 41
42 37 39 30
49 44 43 44
54 48 46 45
56 50 46 43
Amplitude, in dB, for U3-octave-band frequency, in Hz, of: . 50 63 80 100 125 160 200 250 315 40Q 500 630 800 l k 1.2k 1.6k 2k 2.5k 3. l k 4k 5k 6.3k 8k 10k
51 49 49 49 51 52 53 60 6 4 6 4 62 60 56 51 47 45 44 40 37 41 30 43 45 32
49 40 48 48 49 40 50 57 61 61 60 57 55 51 45 44 43 30 39 38 30 30 39 32
27 30 31 20 22 31 20 15
26 30 30 20 29 20 27 18
24 27 29 20 22 29 26 16
37 39 39 37 35 39 30 25
42 43 93 44 43 45 43 33
37 40 41 31 30 41 39 27
39 40 40 30 38 39 40 33
30 41 39 37 39 38 30 3 1
32 35 34 34 35 31 30 25
30 50 40 40 39 38 30 32
39 40 40 40 39 40 41 35
39 4 1 40 38 39 39 30 31
17 14
14 11
26 51
31 27 I
27 16
29 20
21 23 I
25 21
3 1 27
31 22
29 21
l3 76
17 i 77 I 79
52 52 51 52 50 61 62 60 69 70 69 66 64 59 5 4 53 52 46 47 40 48 50 52 45 !
52 49 40 49 54 56 5 0 6 3 64 6 5 64 6 1 60 56 5 1 5 1 50 45 47 40 47 45 49 45 1 52 43 44 45 45 43 47 5 3 52 5 5 53 50 51 50 30 45 45 36 31 40 36 32 4 1 2 3 '
50 46 47 49 53 56 57 62 64 65 6 4 61 60 56 5 1 51 51 47 46 49 40 47 52 5 0 '
48 40 49 51 57 60 6 2 67 70 70 69 66 63 60 5 5 53 52 50 49 49 50 52 54 47
57 6 3 52 53 60 64 6 5 69 7 2 73 7 1 67 64 59 54 52 51 47 49 40 47 50 52 41

Micro- phone
position
7 8 9
10 11 12 13 14 15 16
17 18
Micro-
TABLE 6.- ROTATING-AIRFOIL VORTEX-NOISE SOUND PRESSURE MEASUREMENTS - Continued
RUN NUMBER 109
Amplitude, in dB, for U3-octsve-band frequency, in Hz, of: sound
Ove ral I sound
iressure level, dB
13
1 1
1 1
a 1
84
81
19
1 6
1 4
1 5
1 9
01
Amplitude, in dB, for U3-octave-band frequency, in Hz, of:
50 63 80 100 125 160 200 250 315 400 500 630 800 l k 1.2k 1.6k 2k 2.5k 3.1k 4k 5k 6.3k 8k 10k
5 3
58
51
55
58
60
6 5
71
13
60
60
61
5 4
5 4
56
56
62
56
5 6
5 1
5 1
5 3
5 3
6 4
50
50
50
52
62
53
54
5 3
50
50
5 1
54
50
50
50
55
62
55
54
51
46
50
53
5 5
51
50
51
60
6 3
61
bo
54
46
5 3
50
6 2
53
40
50
65
61
65
6 3
50
45
51
62
66
5 5
51
5 1
6 0
10
6 1
64
59
41
59
6 3
67
62
50
50
1 1
14
11
60
6 3
54
63
60
i o
66
63
63
14
16
1 3
11
65
54
65
1 1
1 3
67
6 4
6 4
1 5
11
15
1 2
61
5 1
66
1 2
1 5
6 1
6 4
6 4
1 5
11
1 5
1 2
6 1
50
6 1
12
75
6 4
62
61
1 1
14
1 1
10
65
56
65
70
11
60
60
59
68
11
69
60
64
51
64
60
69
56
56
55
6 3
6 1
65
6 4
61
5 4
61
6 5
6 4
5 1
50
4 0
59
6 3
59
59
5 5
43
5 5
59
59
49
40
45
58
61
58
51
5 5
41
54
5 1
51
40
46
45
55
59
5 1
56
53
41
54
56
56
43
40
41
48
56
50
51
4 1
41
49
52
51
40
42
40
44
5 5
50
50
47
39
40
5 1
52
43
40
39
50
56
52
51
50
4 4
50
52
5 1
4 1 43 49 4 3
40 40 41 3 1
39 31 36 35
49 50 55 4 3
5 5 56 61 5 5
50 49 53 40
51 53 54 53
40 48 50 41
42 40 44 30
49 49 53 53
52 54 56 52
50 5 2 5 5 5 1
RUN NUMBER 110
phone position
_._ .-
ressure level, dB 50 63 80 100 125 160 200 250 315 400 500 630 800 l k 1.2k 1.6k 2k 2.5k 3. l k 4k 5k 6.3k 8k 10k
11
1 7
1 6
85
80
8 6
04
8 1
00
85
134
85
b l 62 50 56 53 56 5 1 64 60 10 1 1 70 6 1 63 59 50 55 50 45 4 1 45 41 50 53
b 9 10 59 57 52 50 5 3 60 6 5 6 1 60 6 1 6 5 6 3 58 56 55 40 4 0 45 44 44 45 40
6 1 60 59 51 52 51 53 61 66 68 69 66 65 62 5 6 5 4 53 48 46 45 45 42 4 1 39
50 50 61 60 61 65 6 9 7 3 16 1 0 10 11 1 3 10 6 1 6 5 62 5 1 5 3 54 54 5 5 55 54
63 6 4 61 66 65 6 9 1 1 1 6 1 0 00 8 1 00 11 75 12 69 6 7 6 3 61 61 59 60 62 61
6 9 6 9 61 60 62 65 6 0 14 16 18 7 9 11 15 11 6 0 66 65 51 56 56 54 53 56 54
15 1 6 61 59 60 63 6 5 10 14 75 11 15 74 1 1 6 6 65 63 55 55 5 5 54 5 5 51 54
02 R 3 12 69 50 5 0 61 66 6 0 10 72 10 69 6 1 63 6 3 60 52 55 5 5 52 5 1 5 4 50
04 85 15 12 59 46 49 56 56 60 62 61 62 60 53 54 54 4 1 45 49 46 43 49 41
00 81 6 0 65 56 5 1 6 0 6 5 60 10 12 10 70 60 6 3 62 6 1 5 5 53 55 54 5 4 5 0 55
1 1 12 6 0 59 59 6 3 6 4 10 1 4 1 6 11 1 5 14 7 1 61 65 6 3 59 51 56 56 58 60 54
60 bq 62 60 62 66 6 0 73 1 6 10 1 9 11 1 4 1 1 6 1 6 5 6 3 51 5 1 55 54 5 5 50 5 5

TABLE 6.- ROTATING-AIRFOIL VORTEX-NOISE SOUND PRESSURE MEASUREMENTS - Continued
Micro- phone
position
Amplitude, in dB, for 1/3-octave-band frequency, in Hz, of: Overall sound
pressure level. dB 50 63 80 100 125 160 200 250 315 400 500 630 800 l k 1.2k 1.6k 2k 2.5k 3.lk 4k 5k 6.3k 8k 10k
52
52
55
51
53
53
l3 51
14 51
l5 52
16 50
48 47 4 2 42 40 35 27 25 25 27 29 26 28 25 15 18 19 5 4 9 4 5 11 7
46 4h 42 42 42 39 29 26 25 27 28 24 26 25 16 20 20 10 5 7 1 -0 6 10
48 52 4 3 42 41 42 33 27 26 28 29 23 26 24 15 19 20 10 6 11 9 6 12 27
47 46 42 42 41 35 2 9 25 24 26 28 23 26 25 15 18 18 6 2 3 -1 2 8
48 47 46 45 43 39 33 29 22 23 2 3 15 19 18 7 6 9 0 -1 0 -2 -0 6 9
47 49 42 42 42 37 30 27 25 27 28 23 26 24 15 19 19 5 6 11 5 2 7 15
47 45 41 42 42 38 29 25 23 27 28 25 25 25 17 18 18 7 1 2 0 2 6 12 ,
46 46 42 42 43 3 8 30 25 2 4 2 8 29 26 26 25 16 20 20 11 12 8 2 4 10 11
46 46 42 43 42 36 2 8 25 24 27 28 25 26 25 15 20 20 11 7 11 5 3 9 -1
46 44 41 h0 41 38 3 1 25 23 26 27 25 25 25 15 20 20 6 4 13 6 6 13 4
Micro-
Phone position
17 50
18 6 5
Amplitude, in dB, for U3-octave-band frequency, in Hz, of: Ove ra I I sound
pressure level. dB 50 63 80 100 125 160 200 250 315 400 500 630 800 l k 1.2k 1.6k 2k 2.5k 3 . lk 4k 5k 6.3k 8k 10k
57 h4 45 43 45 41 41 28 32 28 30 28 27 26 19 2 2 22 14 19 1 5 13 10 18
43 43 40 41 43 37 30 27 25 27 29 29 28 26 20 21 21 15 16 15 14 9 15
7 8 9
10
RUN NUMBER 112
53 48 48 44 43 41 37 33 34 33 32 32 28 29 26 17 20 21 12 6 9 4 3 9 3
53 47 46 44 44 44 41 35 34 3 4 33 33 28 28 26 18 21 22 14 6 8 3 1 7 10
5 5 48 52 44 4 3 42 43 36 35 34 33 32 29 29 27 18 22 21 15 6 10 14 12 18 31
53 48 47 44 43 42 36 33 33 32 31 32 28 28 26 17 20 20 12 5 1 2 1 7
11 12
13 14
55
53
53
53
49 4 9 49 48 45 41 37 35 3 1 28 27 19 21 23 10 13 15 4 0 0 -3 -0 6 8
48 48 4 4 44 44 39 35 34 33 32 32 28 28 25 18 22 21 11 6 10 5 1 6 36
48 46 44 43 43 40 34 34 33 33 32 29 28 26 20 2 1 21 11 12 8 2 6 12 '
47 46 44 44 45 40 35 34 33 33 32 29 29 27 19 22 22 11 13 9 3 5 1 1 15
47 47 44 44 44 39 33 34 33 32 32 29 29 27 19 23 22 12 6 10 4 2
47 4 5 43 42 4 3 39 3 5 34 32 31 31 28 28 27 18 22 22 12
43 49 42 42 45 38 3 3 33 33 32 32 31 30 28 22 23 23 16 17 12 10 0 15 12
58 64 46 44 46 42 43 35 37 33 33 31 30 28 23 25 24 17 20 13 11 8 18 1 1
6 12 6 7 1;
~
l8 6 5
d
I

ua 0
Amplitude, i n dB, for 1/3-octave-band frequency, in Hz, of: ' Overall ' Micro- sound phone I pressure
TABLE 6.- ROTATING-AIRFOIL VORTEX-NOISE SOUND PRESSURE MEASUREMENTS - Continued
67
RUN NUMBER 113
13 82
~ 14 ' 7 8
15 60
16 77
17 0 2
18 84
54 53 55 59 66 10 7 1 7 4 7 5 7 4 7 2 69 67 64 61 59 59 56 5 8 59 58 57 57 52
5 5 5 0 52 5 5 61 64 65 70 7 1 10 67 6 5 64 62 59 60 60 58 59 61 50 56 57 52
5 0 45 46 47 50 5 2 54 61 58 59 5 8 56 96 54 48 53 54 51 52 53 50 48 49 44
5 3 48 51 54 60 64 65 6 8 6 9 69 67 64 64 62 59 60 61 59 60 60 59 57 59 57
49 49 53 57 65 70 7 0 74 7 6 7 5 72 70 6 8 6 4 61 60 60 59 60 59 59 50 59 5 2
58 6 3 56 60 6 8 72 74 16 77 77 74 70 67 64 61 60 57 55 59 51 55 55 56 50
7 8 9
10 11 12 13 14 15 16
17 18
64 49 50 5 1 52 53 5 3 53 56
62 48 49 50 50 51 50 50 53
62 49 5 3 50 50 51 51 50 53
7 1 50 5 1 54 56 61 65 66 66
53 5 6 6 3 6 4 64 67 6 8 68
50 52 54 56 62 6 4 65 66
49 5 0 52 55 60 62 6 2 6 3
40 49 50 51 56 57 57 59
43 4 3 42 41 44 43 42 45
48 48 48 50 54 56 51 58
46 48 50 53 59 62 62 6 3
57 6 4 5 4 56 62 65 65 65
57
5 3
5 4
6 5
67
6 5
62
58
42
56
63
6 4
54 5 1
5 2 50
52 50
6 3 59
6 4 6 2
6 3 60
60 58
56 54
42 41
56 54
6 2 59
6 3 60
47
47
47
5 5
58
56
55
51
38
5 1
56
56
44
46
45
52
5 5
54
54
51
39
50
54
54
42
42
42
50
53
50
50
49
40
5 1
51
50
36
37
37
44
50
45
48
47
36
47
48
47
37
40
4 1
45
51
47
49
49
4 1
50
50
48
38
41
41
46
51
49
50
5 1
43
52
51
47
36
39
39
44
51
45
4 1
49
40
50
49
46
34
3 8
37
42
50
47
47
48
38
49
48
47
36
35
36
44
50
46
46
49
38
47
47
45
34
35
3 5
42
49
44
45
46
36
46
46
43
32
30
30
40
46
40
43
4 3
33
44
45
41
33
2 1
24
39
46
38
41
42
34
45
43
41
31
23
23
32
42
35
37
38
30
42
37
37
RUN NUMBER 114

Micro- phone
position
Overall sound
pressure level. dB
7 8 9
10 11 12 13 14 15 16
17 18
Amplitude, i n dB, for 1/3-octave-band frequency, in Hz, of:
50 63 80 100 125 160 200 250 315 400 500 630 800 l k 1.2k 1.6k 2k 2.5k 3.lk 4k 5k 6.3k 8k 10k
~~~~ ~~
TABLE 6.- ROTATING-AIRFOIL VORTEX-NOISE SOUND PRESSURE MEASUREMENTS - Continued
RUN NUMBER 115
Micro-
Phone position
Amplitude, in dB, for U3-octave-band frequency, in Hz, of: Overall sound
pressure level dR 50 63 80 100 125 160 200 250 315 400 500 630 800 l k 1.2k 1.6k 2k 2.5k 3. lk 4k 5k 6.3k 8k 101
10
15
16
n i
09
01
0 5
0 1
1 6
00
05
0 1
7 8
12
13 14 15 16
18
52
60
51
54
60
62
65
11
1 4
69
60
61
60 60 60 59 59 64 66 1 3 11 11 1 5 12 10 6 5 61 59 59 55 51 53 53 56 50 56
69 69 60 50 51 50 62 10 1 3 1 4 13 10 69 6 5 60 60 60 55 5 5 53 53 52 52 45
66 6 1 60 59 50 59 62 10 1 3 1 4 73 69 60 64 6 0 60 59 56 56 55 5 5 54 50 41
5 0 5b 6 2 6 4 69 15 10 83 05 0 5 e4 00 11 1 3 69 60 66 62 59 62 62 6 4 6 4 50
64 6k 10 10 12 11 0 1 05 01 01 06 02 00 11 1 4 13 12 69 60 69 60 69 1 0 66
69 69 62 64 10 15 18 03 05 0 5 04 00 10 1 4 10 10 69 6 3 64 64 64 63 6 4 61
15 1 6 61 62 60 12 15 00 02 02 02 10 11 13 10 10 69 64 6 4 6 5 65 66 66 63
02 03 12 69 64 6 1 10 15 11 10 11 1 4 14 11 69 10 69 66 65 6 1 65 64 64 61
04 85 15 12 59 5 5 59 66 6 5 6 1 61 66 6 1 63 60 62 62 50 50 60 50 56 57 54
00 01 60 66 62 61 10 14 16 11 1 1 1 4 13 1 1 69 10 10 6 1 6 1 6 1 67 61 60 66
1 1 12 6 1 62 6 1 12 1 4 00 03 03 03 19 10 14 11 10 69 6 1 60 66 6 1 6 1 60 62
69 69 6 3 64 10 15 1 0 02 04 05 0 4 00 11 13 11 1 0 61 64 66 65 64 6 5 66 62
5 4 5 5 56
52 53 54
54 53 5 5
5 1 5 8 61
b3 6 1 60
5 6 5 1 61
56 51 60
56 55 56
56 53 50
53 53 56
53 55 50
6 4 58 61
59
51
51
6 1
i o
68
66
62
52
60
65
68
62 6 4 10
51 60 66
50 60 66
13 16 19
16 1 0 02
73 75 act
11 12 11
6 5 6 1 12
53 51 63
65 6 1 11
11 12 16
13 16 19
1 3
69
69
81
03
01
10
1 3
61
12
1 9
BO
12 69 61
69 6 1 6 5
69 6 1 64
00 i i 74
02 19 11
81 11 1 4
10 7 5 13
1 3 1 1 60
63 62 60
12 11 60
19 16 13
ma 70 1 4
63 59 54 53
63 59 5 5 54
62 5 0 54 54
10 6 1 6 3 62
l3 1 1 60 6 1
11 61 63 63
11 61 64 63
68 6 5 63 64
60 5 0 54 56
61 6 5 6 3 64
11 60 6 5 M
11 61 65 63
53 49 46 50
54 50 si 50
53 50 5 1 5 1
60 56 5 5 50
65 6 4 6 3 65
63 51 59 60
63 59 $0 61
63 61 61 63
50 55 55 56
64 62 6 3 63
63 62 6 3 61
61 50 6 1 60
49 5 1 53
50 4 1 41
50 41 43
51 59 59
64 6 4 65
59 51 5 0
6 1 61 60
61 59 59
5 5 52 54
62 61 63
62 61 62
59 59 60
50
41
40
51
61
54
51
56
50
6 1
56
55
RUN NUMBER 116

Micro- phone msition
7 8 9
10 11 12 13 14 15 16
17 18
TABLE 6.- ROTATING-AIRFOIL VORTEX-NOISE SOUND PRESSURE MEASUREMENTS - Continued
RUN NUMBER
Overall sound
iressu re evel, dB
53
5 3
56
53
55
53
53
54
54
53
5 1
67
Amplitude, in dB, for 1/3-octave-band frequency, in Hz, of:
50 63 80 100 125 160 200 250 315 400 500 630 800 l k 1.2k 1.6k 2k 2.5k 3 . lk 4k 5k 6.3k 8k 10k
40 40 46 45 43 35 3 1 28 25 25 26 20 23
40 47 46 46 kk 39 3 1 29 25 25 25 19 2 1
48 51 46 46 43 42 37 30 20 20 27 22 24
48 47 46 46 kk 37 32 29 25 26 25 19 22
48 40 49 49 45 40 36 31 23 23 21 10 16
47 40 46 45 44 30 34 30 27 26 26 19 22
47 46 46 45 43 38 33 30 26 26 25 22 22
48 47 46 46 kk 39 33 29 26 27 26 22 23
48 47 46 kb kk 30 32 30 27 26 25 20 2 i
47 4h 45 43 42 39 33 29 25 25 24 20 21
43 43 44 44 kk 37 32 30 27 26 25 23 23
59 66 40 46 46 45 47 32 34 28 28 24 25
22
23
23
23
17
23
24
24
24
24
24
25
13
12
14
12
9
11
13
13
12
12
17
10
13
17
10
16
7
17
16
17
18
17
20
21
19
19
20
20
10
20
19
20
20
20
21
22
12
0
16
14
4
12
9
0
7
10
13
13
7
6
6
6
2
6
12
12
6
4
17
19
12
6
12
9
2
11
7
9
11
12
12
13
6 0
2 4
0 4
4 6
-1 1
5 3
1 5
3 6
5 3
6 0
8 8
10 9
15
10
9
12
6
9
11
11
9
14
15
19
6
23
20
7
7
10
7
-7
-1
14
10
RUN NUMBER 118
Amplitude, in dB, for 1/3-octave-band frequency, in Hz, of: Overall Micro- sound 1 Phone pressure posltlon level, dB
7 8 9
10 11 12
13 14 15 16 17 18
65
6 3
63
73
7 7
74
71
60
64
68
72
74
50 63 80 100 125 160 200 250 315 400 500 630 800 l k 1.2k 1.6k 2k 2.5k 3.1k 4k 5k 6.3k 8k 10k
50 51 53 53 54 55 5 5 56 56 54 50 40 46 43 30 39 52 40 37 37 34 36 39 36
50 50 53 52 33 51 52 53 53 52 50 49 40 46 42 44 46 45 42 40 31 36 33 26
50 53 53 53 53 52 5 2 53 53 52 50 40 47 45 42 45 46 44 44 42 30 35 31 29
52 53 56 57 62 6 5 66 66 65 6 3 60 56 54 52 47 49 50 47 44 47 44 46 46 39
54 5 0 64 64 6 5 60 69 69 67 64 62 59 57 56 54 55 56 56 54 53 5 1 50 5 1 47
5 1 53 56 56 63 66 66 61 65 64 61 50 56 53 49 52 54 51 50 50 46 45 46 42
5 1 52 55 56 60 62 63 64 62 60 58 57 36 54 5 1 32 54 52 50 40 47 46 45 41
49 50 53 53 56 57 50 59 50 57 55 54 55 54 53 55 56 56 55 50 49 45 43 40
49 49 5 1 50 51 49 49 52 51 5 1 5 1 50 5 1 51 50 53 54 50 49 49 44 42 42 39
49 49 5 2 52 55 5 1 50 58 57 56 55 54 54 54 53 56 57 55 54 53 50 48 49 47
47 40 53 55 b0 63 63 64 63 62 59 57 56 54 53 55 56 54 54 50 49 40 40 42
50 64 55 57 62 65 66 66 64 62 60 57 55 5 1 50 52 52 5 1 5 1 46 45 44 45 42

0) W
62 68 1 1 69 65 62 59 56 52 51 54 52 50 51 49 5 1 53 50
59 65 61 66 64 61 60 5 8 5 5 56 58 56 5 5 54 5 1 5 1 49 42
59 65 68 6 1 64 61 60 5 1 5 5 5 1 58 56 58 56 52 50 41 45
1 5 18 79 11 14 10 68 6 5 61 61 62 60 58 60 59 60 60 53
7 1 8 1 81 19 16 12 10 69 66 66 6 1 67 66 66 65 64 6 4 60
1 5 19 80 18 1 4 11 69 66 62 6 3 65 63 63 63 60 59 60 56
1 1 15 16 1 5 1 2 69 68 66 63 65 66 6 3 63 62 62 60 60 5 5
66 10 11 10 68 66 66 6 4 64 6 1 68 6 1 67 64 62 59 51 52
66 69 1 0 10 68 66 65 6 5 6 5 68 69 66 6 1 66 64 62 6 3 6 1
50 56 62 62 6 3 62 60 61 60 59 63 64 59 60 60 56 54 5 4
1 1 1 5 11 1 6 1 3 10 69 6 1 6 5 86 6 1 66 6 1 64 64 62 6 3 51
TABLE 6.- ROTATING-AIRFOIL VORTEX-NOISE SOUND PRESSURE MEASUREMENTS - Continued
RUN NUMBER
I ~
7 8 9
10 11 12 13 14 15 16
17 18
7 8 9
10 11 12
13 ' 14
1 6
1 4
1 4
85
8 1
86
8 2
1 9
73
Ra
84
85
Amplitude, in dB, for 1/3-octave-band frequency, in Hz, of:
50 63 80 100 125 160 200 250 315 400 500 630 800 I k 1.2k 1.6k 2k 2.5k 3.lk 4k 5k 6.3k 8k 10k
53 53
51 5 1
5 1 5 3
56 56
60 61
56 56
5 5 5 5
56 50
58 46
54 59
51 51
60 64
56 56 59 61
5 4 54 56 5 1
54 55 51 51
59 61 68 12
60 68 11 1 5
60 62 69 73
5 1 59 66 69
53 55 61 64
48 49 52 53
53 55 60 6 4
56 58 66 69
59 6 1 69 13
RUN NUMBER 120
1 9
11
11
88
90
n9
8 5
83
1 8
83
8 1
Amplitude, in dB, for 1/3-octave-band frequency, in Hz, of:
50 63 80 100 125 160 200 250 315 400 500 630 800 l k 1.2k 1.6k 2k 2.5k 3.lk 4k 5k 6.3k 8k 10k
54 56 56 58 60 63 6 4 10 1 4 1 3 69 66 62 59 5 5 54 56 55 53 54 53 54 5 1 54
61 54 55 56 58 58 6 1 61 1 0 1 0 6 1 65 63 61 5 8 59 61 59 59 58 55 5 5 52 45
58 55 55 56 58 59 6 1 68 1 1 1 1 68 6 5 63 6 0 5 8 6 1 62 60 61 59 51 54 5 1 48
56 59 60 6 3 69 14 11 80 83 81 1 8 7 4 11 6 8 64 64 65 6 2 59 6 3 62 6 3 63 56
62 6 5 6 9 69 12 17 1 9 83 84 83 80 16 13 1 2 10 10 1 0 1 0 6 9 69 68 68 68 64
62 58 60 64 10 14 16 81 83 82 78 1 4 12 69 6 5 66 68 65 65 66 64 63 6 4 59
6 1 57 58 61 61 11 1 2 17 1 9 1 0 1 6 12 12 69 66 68 69 66 66 65 65 63 63 58
1 3 56 56 51 62 66 6 1 1 2 1 4 1 4 1 1 69 69 6 8 6 1 1 0 10 70 10 6 1 66 6 3 61 5 1
15 5 6 5 3 51 54 54 57 64 64 66 66 6 4 64 6 3 62 66 61 62 6 3 64 60 51 58 53
1 0 5 4 54 51 61 66 6 1 11 13 1 3 12 68 68 6 1 6 8 1 1 12 6 9 10 10 67 6 5 6 1 64
60 5 4 5 1 60 6 1 11 1 2 11 80 80 11 13 72 10 6 8 1 0 10 68 1 0 6 8 61 66 66 60
18 nn 6 2 65 60 6 3 10 14 16 80 82 81 19 1 4 11 6 8 66 6 1 67 66 6 1 6 5 63 63 64 60

. ..---- .. . .-
Q)
Micro- phone
position
7 8 9
10 11 12 13 14 15 16
17 18
Micro- phone
position
7 8 9
10 11 12
13 14 15 16 17 18
TABLE 6.- ROTATING-AIRFOIL VORTEX-NOISE SOUND PRESSURE MEASUREMENTS - Conch led
RUN NUMBER 12’
Overall sound
i ressu re level, dB
8 4
0 3
03
93
95
9 3
91
90
90
90
91
9 3
~~ ~~
Amplitude, in dB, for 1/3-octave-band frequency, in Hz, of:
50 63 80 100 125 160 200 250 315 400 500 630 800 l k 1.2k 1.6k 2k 2.5k 3. l k 4k 5k 6.3k 8k 10k
60 6 1 60 61 62 65 6 1 74 70 70 76 7 3
70 7 2 62 61 60 60 6 3 71 7 4 75 7 5 71
60 70 6 1 61 60 61 6 3 71 75 76 7 5 71
58 5 8 6 4 66 71 76 7 9 03 06 07 0 5 81
67 b8 72 12 74 79 8 1 06 08 00 8 7 8 3
6 9 70 6 5 60 72 76 7 9 04 07 00 06 81
76 7 8 6 5 65 69 7 3 7 5 80 03 03 0 3 7 9
03 05 7 4 72 65 60 70 7 5 77 70 70 75
05 87 76 74 61 56 60 60 60 7 1 71 70
01 83 70 60 64 60 70 74 77 70 70 7 5
71 72 6 1 64 b6 13 7 5 00 6 4 85 04 00
69 7 0 6 4 66 71 76 7 s 0 3 05 87 06 01
Ove ral I sound
r e s s u r e level, dB
5 5
56
57
56
87
56
55
56
56
55
53
60
70
70
69
70
00
79
70
76
70
75
78
70
66
67
66
74
7 8
7 5
75
7 4
67
7 3
15
7 4
61 60 62
6 3 6 4 66
63 66 60
7 1 69 70
77 76 76
7 1 72 74
72 73 75
7 2 7 5 76
64 69 70
7 3 76 77
7 3 75 76
12 73 7 3
6 1
6 5
66
67
75
7 1
73
76
65
75
7 4
72
5 0
63
66
bb
75
71
71
76
66
76
76
73
5 9
64
64
69
75
72
12
7 3
67
75
73
70
59
61
63
6 8
75
70
71
73
63
73
7 3
69
61
6 3
59
7 1
7 5
70
71
70
61
7 1
72
70
64
60
57
7 1
7 5
7 1
7 1
67
6 2
72
7 3
7 1
60
53
54
64
70
60
67
62
59
70
67
67
RUN NUMBER 122
Amplitude, in dB, for 1/3-octave-band frequency, in Hz, of:
50 63 80 100 125 160 200 250 315 400 500 630 800 l k 1.2k 1.6k 2k 2.5k 3.lk 4k 5k 6.3k 8k lob 50 51 49 45 43 37 34 34 2 9 29 20 20 25 23 13 12 17 - 1 0 4 3 6 12 0
51 50 49 45 43 30 3 3 36 31 29 28 2 1 25 25 16 13 20 11 7 6 1 3 9 13
5 1 53 50 46 44 42 42 35 31 30 29 23 26 26 15 14 22 15 10 15 18 10 24 31
51 50 49 45 44 30 33 36 30 30 28 22 25 26 14 15 20 12 10 10 5 5 11 39
8 1 A 1 8 2 78 75 71 67 67 59 58 55 41 49 49 42 40 43 39 36 33 31 35 41 42
50 51 49 45 44 39 3 0 35 3 1 3 1 20 22 25 25 14 17 20 10 9 11 0 7 13 29
50 50 40 45 43 37 34 35 31 30 20 2 4 24 25 17 19 21 11 12 11 5 6 12
50 50 49 46 44 39 3 5 36 32 31 29 25 25 25 15 19 20 10 14 12 5 5 11 10
50 50 49 46 44 39 34 37 32 31 20 23 25 25 15 21 21 9 7 14 7 4 10 -2
50 49 40 44 43 38 3 5 36 31 30 27 22 24 25 1 4 20 21 13 7 15 8 6 13 4
46 47 47 44 43 38 34 36 32 3 1 29 26 26 25 19 21 22 1 5 I7 14 12 7 16 17
bO bh 5 1 46 44 52 5 5 37 36 32 32 27 27 2 5 18 22 22 13 20 14 12 9 10 0

L-70-2679.1 Figure 1. - Photograph of cylindrical blade end and various tip configurations.

L-'70-2682 (b) Untwisted blade.
Figure 2.- Photograph of airfoil test models.
i
66

L-70-2687.1 ( c ) Plain NACA 0012 airfoil section.

4 38.10 (15.0) c
22.86(9.0) T C
(a) NACA 0012 airfoil-section blade.
2.54 (1.0)
(b) Cylindrical blade.
Figure 3.- Blade c ross section indicating the location of the grit and the spoilers. All dimensions are in centimeters (inches).

Q, W
.- -EX.

4 0
L-7 1-633 Figure 5.- Photograph of the model setup for outdoor tests.

(a) Microphone. (b) Wind screen.
Figure 6.- Photograph of microphone and wind screen.

1 / 3-Octave-band-center frequency, Hz
0 125 2 250 I
180" 0 500 180"
4
2
r - 0 D
2
4
'\
i '.\
0" 0"
(a) NO = 400 rpm. (b) NO = 700 rpm.
Figure 7. - Estimated wind-tunnel hall radius for various azimuth positions and for a 1/3-octave-band- center frequency. Data for model 01 operating at four rotor rotational speeds. The zero azimuth position is alined with the rotor rotational axis.

1 / 3-Octave-band-center frequency, Hz
4 W
1800
,
(c) No = 850 rpm.
0 125 C 250 0 500 A 1000 @. 2000 1800 I
6
4
2
r D O
2
4
6
Figure 7 . - Concluded.
,*---- -
v - \ /450
00 2\ (d) NO = 900 rpm.

1800
1/3-0ctave-band-center frequency, Hz
0 125 0 250 0 500 6 n 1000 c 2000
r D -
t/ .\ 6 . 22.5O
00
4
2
r - 0 D
2
4
6
1800
(a) NO = 400 rpm. (b) No = 625 rpm.
Figure 8.- Estimated wind-tunnel hall radius for various azimuth positions and for a 1/3-octave-band- center frequency. Data for model 10 operating at four rotor rotational speeds. The zero azimuth position is alined with the rotor rotational axis.

1 / 3-Octave- ba nd-cente r frequency, Hz
0 125 250
6 00
(c) No = 700 rpm. (d) No = 850 rpm.
Figure 8. - Concluded.

loo - loo -
- 40 '-
i L
40 +
i t I
No = 900 rpm I I I 1
31 lOOx lo2 "E - No = 850 rpm
0 - ' I Over- .5 1.0 3.15 10 i1 l d x lo2 Over- ' 5 i . 0 A.15 ;O all all
1/3-0ctave-bandcenter frequency, Hz
2o E Figure 9.- Comparison of indoor and outdoor noise data for the same microphone position and
different rotor rotational speeds of model 01 with zero axial velocity.

0 0
I t
No = 400 rpm
I I I I I I
Microphone number
0 5(lndoor) 17 lO(0utdoor)
2ol No = 700 rpm
t No = 625 rpm
o h . - 1 I I I I I
20 '-
- No = 850 rpm
,L, L 1 I I I L I I
Over- .5 1.0 3.15 10 31 1 0 0 ~ 1 0 ~ -O&- l.5 i.0 i. 15 ;O 31 l00x 102 al l al l
1 / 3-Octave-band-center frequency, Hz
Figure 10.- Comparison of indoor and outdoor noise spectrum for the same microphone position and different rotor rotational speeds for model 10 with zero axial velocity.

120
100
m
-- 80 s -0
W
- W L 2 v)
L
-0 c 3
% 60 n
s: = 40 % m L
0
20
0
0
0 0 a m
0
V = 0 mlsec ( O f t l s e c )
00 ai3
Microphone number
5 6
I f I , 1 1 30 60 90 120 150
RR, m/sec
0 El
, 0 30 60 90 120 150
RR, m/sec I
0 100 200 300 400 500 R R, ft I sec
i
Figure 11.- Evaluation of test-chamber reverberation by means of the inverse square law from the overall sound pressure level of model 01 for different axial velocities and rotational speeds.

1 2 0 r
- m U
- 4 o L al ! 0 i L
>
20 - F
V = 0 mlsec (Oft lsec)
r
Model 0 00
01 0 02
Q
t I I V = 6.1 mlsec (20 ft /sec) r
RR, ft /sec RR, ft lsec
(a) Microphone number 5.
Figure 12.- Comparison of the overall sound pressure level for the cylindrical blade for different blade tip shapes. Data for two different microphones and two axial velocities.

03 0
120
100
m -0
-- Q) 80 > Q)
a L 3 v)
-
L 60 CT U c 3 0 v)
40 L
0
20
Model 0 00
01
h04 0 02
v = 0 mlsec ( O f t l s e c ) t 0 30 60 90 120 150
I RR, mlsec I I I 1 I
0 100 200 300 400 500
RR. f t l sec
(b) Microphone number 1.
Figure 12. - Concluded.

120 r
I
60 -
- 40 -
I -
20 -
Model
0 01 03
!+ I I i
i
V = 6.1 mlsec (20 ftlsec) ._
(a) Microphone number 5.
Figure 13.- Comparison of the overall sound pressure level of the cylindrical blade to evaluate Reynolds number effects for two different microphones and axial velocities.

120 "-
Q) L
U
=I 0 I v)
c ,_
V = 0 m lsec ( O f t l s e c )
0 30 60 90 120 150 RR, m lsec
Model
0 01 0 03
i t I-
I I- I
I r
II
I I--
(b) Microphone number 1.
Figure 13. - Concluded.

!
03 0
0
El 0
G
Model V
0 01 0 0 10 0
!3
0 0
00 0 0
I3
Model V
01 6.1 mlsec (20 f t l sec ) 20 Variable
(a) Microphone number 5.
Figure 14.- Comparison of the overall sound pressure level for two different blades with variations in axial velocities for two microphones.

120 - -
100 - -
M U
z- 80- > 0,
al - L =I m m
P U c 3 0 v)
-
2 60-
- z? al > 0
20
- 401 Model V
0 01 0 0 10 0
L3
0
I
00 0 0
0 E l
0 G
O
Model V
01 6.1 m/sec (20 f t /sec) 20 Variable
120 r
, I I I
L 3 0 VI 40 -
20 k-
8 0 8
Model V
0 01 0 0 01 6.1 m/sec (20 f t /sec)
I I I , I
0 30 60 90 120 150 RR. m/sec
c !!--
I
0 0
0 0 El
Model V
0 10 0 20 Variable
RR, mlsec
0 100 200 300 400 500 0 100 200 300 400 500
RR, ft /sec RR, f t l sec
(a) Microphone number 5.
Figure 15. - Comparison of the overall sound pressure level with variations in axial velocity for two microphones.
A

B
Model V
0 01 0 01 6.1 m/sec (20 f t / sec)
0 0 I3
0 0 El
0
Model V
0 10 0 I7 20 Variable -
0 30 60 90 120 150
RR, mlsec
0 100 200 300 400 500
RR, f t l sec
(b) Microphone number 1.
Figure 15. - Concluded.

NATIONAL AERONAUTICS AND SPACE ADMINISTRAI ION WASHINGTON, D. C. 20546
OFFICIAL BUSINESS PENALTY FOR PRIVATE USE $300
FIRST CLASS MAIL
POSTAGE AND FEES P) NATIONAL AERONAUTICS
SPACE ADMINISTRATK
012 Or31 C 1 U O E P T OF T H E A I R FORCE WEAPONS LABORATORY / W l O b /
KIRTLANn AFB NM 57117
23 73.0723 S0090’3r?S
bTTN: f LOU RC’WMANp C H I E F T E C H L I B R A R Y
‘ T h e aeronautical and space activities of the United States shall be conducted so as to contribute . . . to the expansion of human knowl- edge of phenomena in the at?iiosphere and space. T h e Administration shall provide for the widest practicable and appropriate dissemination of inforiiiation concerning its activities and the results thereof.”
-NATIONAL AERONAUTICS AND SPACE ACT OF 1958
NASA SCIENTIFIC A N D TECHNICAL PUBLICATIONS
TECHNICAL REPORTS: Scientific and technical information considered important, complete, and a lasting contribution to existing knowledge.
TECHNICAL NOTES: Information less broad . in scope but nevertheless of importance as a
contribution to existing knowledge.
TECHNICAL MEMORANDUMS : Information receiving limited distribution because of preliminary data, security classifica- tion, or other reasons.
TECHNICAL TRANSLATIONS: Information published in a foreign language considered to merit NASA distribution in English.
SPECIAL PUBLICATIONS: Information derived from or of value to NASA activities. Publications include conference proceedings, monographs, data compilations, handbooks, sourcebooks, and special bibliographies.
TECHNOLOGY UTILIZATION PUBLICATIONS: Information on technology used by NASA that may be of particular interest in commercial and other non-aerospace applications. Publications include Tech Briefs, Technology Utilization Reports and Technology Surveys.
CONTRACTOR REPORTS: Scientific and technical information generated under a NASA contract or grant and considered an important contribution to existing knowledge.
Details on the availability of fhese publications may be obtained from:
SCIENTIFIC AND TECHNICAL INFORMATION OFFICE
NATIONAL AERONAUTICS AND SPACE ADMINISTRATION Washington, D.C. PO546
...
Related Documents