Abstract — Research work on audible noise emitted from overhead line conductors is reviewed, and a unique experimental set up employing a semi-anechoic chamber and corona cage is described. Acoustically, this facility isolates undesirable background noise and provides a free-field test space inside the anechoic chamber. Electrically, the corona cage simulates a 3 m section of 400 kV overhead line conductors by achieving the equivalent surface gradient. UV imaging, acoustic measurements and a partial discharge detection system are employed as instrumentation. The acoustic and electrical performance is demonstrated through a series of experiments. One conductor sample is used as an example to illustrate results under various spray conditions. Index Terms — audible noise, overhead line conductor, transmission line, high voltage conductor, anechoic chamber, corona discharge, partial discharge measurement, hum noise, sound pressure level. I. I NTRODUCTION Audible noise is critical design consideration for overhead lines. Power utilities have carried out plenty of experimental measurements to evaluate the noise level emitted from high voltage conductors. Not only outdoor measurements, which a re carried out close to whole spans of overhead line, but also indoor measurements which employ cage configurations to simulate sections of overhead line have been reviewed. Processes for measuring audible noise, particularly in lower frequency ranges, will be summarized in the following. The term „hum noise‟ refers to tonal emission which has a key component of twice the power frequency. Since „hum noise‟ produced from overhead lines was noticed by Taylor, Chartier and Rice [1] in 1969, its physical mechanism remains a mystery. Although a number of scientific hypotheses [2-11] were introduced to explain the nature of these phenomena, relevant experimental work is still insufficient to identify the primary cause. The difficulty for experimental verification is due to the fact that the 100Hz or 120Hz (depending on the supply frequency) content cannot be readily measured in the laboratory environment. This is because first of all, the frequency spectrum of the background noise in laboratory Manuscript received February 28, 2013. This work was supported by National Grid UK. The author s are with The School of Electrical and Electronic Engineering, The University of Manchester, Manchester M60 1QD, UK. (E-mail: s.rowland@ma nchester.ac.uk). environment contains peaks at 100 Hz (or 120 Hz) and its harmonics; and secondly, due to the „magnetostriction effect‟ [12] on transformer windings, the level of „hum noise‟ produced by transformer increases significantly with the level of the leakage current. In order to mitigate the influence of these, an anechoic chamber was designed and built inside the high voltage laboratory in the University of Manchester. The transformer is outside the chamber eliminating this as a source of noise. This paper introduces various aspects of the design issues including: the electrical design for the cage, the acoustic design for the anechoic chamber and the design of the spray system. The instrumentation of the testing facility includes sound detection, partial discharge measurement, visual corona observation and high speed imaging. Sound Pressure Level is measured through a commercial integrated acoustic detecting platform. This enables accurate detection of time signals and FFT analysis of the frequency spectrum. Partial discharge measurement is carried out through a separate commercial platform which enables the detection of apparent ch arge and the plot of phase resolved diagrams. High sensitivity ultra violet cameras are employed for visual observation of corona discharge. A high speed camera is used to record the dynamic motion of water droplets on the conductor under the AC electric field. The sound measurements reported are considered to be the first trials to accurately measure the acoustic emission from conductors within a well controlled laboratory environment. These data will be utilized to help power utilities evaluate various types of conductors and predict the noise level of overhead line structures. The associated electrical measurements, visual and high speed imaging also contribute to the mechanism study of the 'hum noise'. II. LITERATURE R EVIEW The first systematic paper on „audible noise from transmission lines‟ was published in 19 69 by Taylor, Chartier and Rice [1]. During the following 40 years, sequential works have been carried on by various utilities and universities. An intensive period of publications can be found around the 1980s when EHV transmission lines were in t he testing stage. Testing lines for audible noise after 1990 tended to evaluate the noise emission level for novel configurations such as asymmetrical Acoustic Noise Evaluation for Overhead Line Conductors Q. Li 1 , R. Shuttleworth 1 , G. Zhang, 1 I. Dupere 2 and S. M. Rowland 1 1 School of Electrical & Electronic Engineering 2 School of Mechanical, Aerospace and Civil Engineering The University of Manchester Manchester, United Kingdom [email protected] 119 2013 Electrical Insulation Conference, Ottawa, Ontario, Canada, 2 to 5 June 2013 978-978-1-4673-4744-0/13/$31.00 ©2013 IEEE

Welcome message from author
This document is posted to help you gain knowledge. Please leave a comment to let me know what you think about it! Share it to your friends and learn new things together.
Transcript

8/12/2019 Acoustic Noise Taylor
http://slidepdf.com/reader/full/acoustic-noise-taylor 1/5

8/12/2019 Acoustic Noise Taylor
http://slidepdf.com/reader/full/acoustic-noise-taylor 2/5
bundles, non-parallel bundles etc. Most recent work can be
found from China‟s HVDC testing lines.
Taylor, Chartier and Rice were the first to measure noise
level from transmission lines. Their results were obtained from
both outdoor and indoor tests under or after rainy conditions.
Outdoor tests were carried out at the Apple Grove 750 kV test
site [13], while indoor tests were made on “very small dry wires
and tubes in the shielded room of the Westinghouse RI Lab”.
The voltage level for their indoor experiment was 80 kV. The
authors concluded that “the major effect of voltage gradient on
the sound level occurs in the high range of the frequency
spectrum”. However, because no effort had been made to
mitigate the background noise (especially the 80 kV
transformer „hum‟), Teich and Weber queried this conclusion
in 2002 [4]. Within Taylor‟s publication, authors were trying to
relate the audible noise level with surface field gradient.
However, the method employed for calculating surface gradient
is not an accurate method which affects the results and
conclusions. There is also no field control method within the
indoor test set-up within this early work such as an earthed
cage.
Cage experiments have been well proven to be an effective
way to study the environmental impact of transmission lines.
With the help of an 'Experts' Noise Seminar' in the
University of Manchester in June 2011, the design criterions for
cage experiments have been reviewed in detail. Table I
summarizes the design parameters provided by attendees from
four leading research institutes.
III. EXPERIMENTAL DESIGN AND CONSTRUCTION
A. Design Criterion for the Anechoic Chamber
There are two factors creating background low frequency
noise inside a high voltage laboratory:
Electrical switching, such as contactors, produces 100 Hz
noise and its harmonics.
High voltage transformers produce „hum‟ (mainly 100 Hz
and its harmonics) due to the „magnetostriction effect‟.
In order to insulate the system from the background noise,
the first challenge for an anechoic chamber is to effectively
reduce low frequencies. This is achieved by constructing an
enclosure using acoustic insulation material.
The second objective is to prevent sound reflections inside
the chamber, thereby create a „free field‟ for sound
measurements. Wedges with sound absorbing material are
employed to address this. The overview of the anechoic
chamber construction is shown in Figure 2.
B. Design Criterion for the HV Supply
The design criterion for the HV feed into the chamber is to
reduce unwanted corona discharges while maintaining the
adequate voltage level for experimental needs. Any protrusions
on the high voltage body would initiate corona discharges,
especially for joints and terminations, and so must be avoided.
As shown in Fig 3, two corona rings and spheres are
introduced to mitigate corona discharge from joints and
terminations in the chamber. These stress release devices aretested to ensure they are corona free under high potential.
Corona activities are visually detected by UV camera.
The surface gradient distribution for overhead line conductor
is reviewed in a recent paper [14]. The voltage level within the
experiment is designed to reproduce typical surface gradient
values under service.
Fig. 2. Sound proofing and anechoic wedges
TABLE I. A COMPARISON OF TEST FACILITIES
Tsinghua (China)
ETH (Swiss)
JPS (Japan)
Manchester (UK)
Length of
Conductor 4m (overall) 3m (effective) 6m (overall) 7.5m
(overall) 4m (overall)
Cage Size Square
1.7m*1.7m 12 edge shape ~1.5m radius
Cylinder 1m radius
Cylinder 0.75 m radius
Voltage Level 90~130kV 166.6kV Max 150kV 90~150kV Surface Stress 23~32kV/cm 17.6kV/cm 10~17kV/cm 16~25kV/cm Acoustic Noise
Control Indoor with no
specific noise
control Indoor with
correction
(background) Outdoor with
no specific
noise control
Anechoic
chamber with
22.5dBA(100Hz)
reduction Tensioning
Design Maximum 2
tons No tension
force for
straighten Load cell unit
for tension Maximum 1 ton
Electrical
Measurements PD, RIV Leakage
current No PD, RIV, Leakage
current
Acoustic
Measurements Sound level
meter Sound level
meter with FFT Microphone
with FFT Brüel & Kjær
PULSE platform
for analysis
Fig. 1. Various corona cage experiments: a) Tsinghua University; b) JPS; c)
University of Manchester; d) ETH.
a) b)
c) d)
120

8/12/2019 Acoustic Noise Taylor
http://slidepdf.com/reader/full/acoustic-noise-taylor 3/5
The diameter of the corona cage is 1.5 meters. Given a 32 mm
diameter conductor sample, the voltage required for an 18
kV/cm surface gradient is around 110 kV.
C. Bushing
As introduced previously, in order to achieve the sound
insulation, a chamber enclosed with sound proof panels is
essential. This enclosed chamber is at ground potential and
requires a bushing to lead the high voltage through the sound
proof panel without violating the acoustic insulation of the
anechoic chamber (Fig 4).
D. Spray Conditions
There are three wetting conditions used within the
experimental facility routinely:
1) manual spray
Uses a bottle sprayer to manually wet the conductor
sample on a one-off basis, to apply excessive water
droplets on the whole surface of conductor sample (both
sessile and pendent drops are formed).
2) continuous light spray
Containers are filled with water and pre-pressurized
before experiment. Four nozzles are arranged to provide
spray to cover the whole length of conductor sample.
The spray can last consistently for ten minutes. The
precipitation rate is 21 mm per hour.
3) continuous heavy spray
Pressurized water feeds four nozzles, covering the
whole length of conductor sample. The precipitation rate
is 50-60 mm per hour.
E. Instrumentation
As highlighted in Fig 5, measurement devices employed in
cage experiment include:
Two ultra violet cameras
Two free field microphones
A high speed camera
A partial discharge detecting system
The UV cameras are employed to visually detect the corona
discharges. They are also important tools when mitigating
unwanted corona from joints and high voltage terminations.
The two microphones are introduced for acoustic
measurements. This set-up allows not only sound pressure level
measurements but also sound intensity measurements. Signals
are integrated by a data processing front-end which enables
FFT analysis and sound intensity computation.
The high speed camera (up to 2000 frames per second for a
resolution of 1024x768) produces slow motion video of water
droplets behavior within the AC electric field.
The partial discharge detection system is introduced for two
functions:
1. To detect the discharge level of the bushing and supply
circuit (an undesired noise source).
2. To quantify the apparent charge QIEC of corona discharges.
Fig. 4. 250kV HV bushing: a) outside view of bushing; b) inside view ofushing.
a) b)
Fig. 3. UV images for corona detection: a) corona inception on sphere-1 at170kV; b) stable corona on sphere-1 at 200kV; c) corona inception on stress
release ring-1 at 167kV; d) corona inception on stress release ring-1 at 200kV;
e) corona inception on stress release ring-2 at 150kV; f) corona inception on
stress release ring-2 at 200kV; g) corona inception on sphere-2 at 140kV; h)
stable corona on sphere-2 at 200kV.
a) b) c) d)
e) f) g) h)
Fig. 5. Instrumentation for the complete cage experiment
121
8/12/2019 Acoustic Noise Taylor
http://slidepdf.com/reader/full/acoustic-noise-taylor 4/5
IV. PERFORMANCE OF THE TEST FACILITY
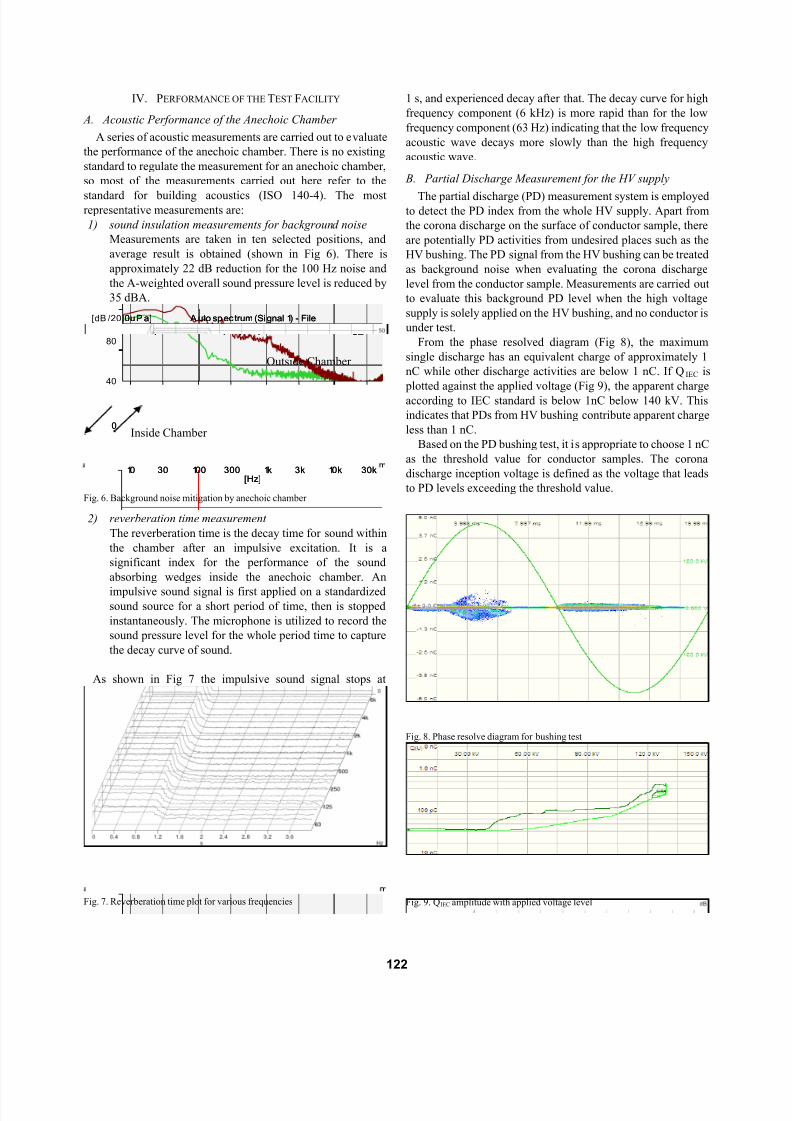
A. Acoustic Performance of the Anechoic Chamber
A series of acoustic measurements are carried out to evaluate
the performance of the anechoic chamber. There is no existing
standard to regulate the measurement for an anechoic chamber,
so most of the measurements carried out here refer to the
standard for building acoustics (ISO 140-4). The mostrepresentative measurements are:
1) sound insulation measurements for background noise
Measurements are taken in ten selected positions, and
average result is obtained (shown in Fig 6). There is
approximately 22 dB reduction for the 100 Hz noise and
the A-weighted overall sound pressure level is reduced by
35 dBA.
2) reverberation time measurement
The reverberation time is the decay time for sound within
the chamber after an impulsive excitation. It is a
significant index for the performance of the sound
absorbing wedges inside the anechoic chamber. An
impulsive sound signal is first applied on a standardizedsound source for a short period of time, then is stopped
instantaneously. The microphone is utilized to record the
sound pressure level for the whole period time to capture
the decay curve of sound.
As shown in Fig 7 the impulsive sound signal stops at
1 s, and experienced decay after that. The decay curve for high
frequency component (6 kHz) is more rapid than for the low
frequency component (63 Hz) indicating that the low frequency
acoustic wave decays more slowly than the high frequency
acoustic wave.
B. Partial Discharge Measurement for the HV supply
The partial discharge (PD) measurement system is employedto detect the PD index from the whole HV supply. Apart from
the corona discharge on the surface of conductor sample, there
are potentially PD activities from undesired places such as the
HV bushing. The PD signal from the HV bushing can be treated
as background noise when evaluating the corona discharge
level from the conductor sample. Measurements are carried out
to evaluate this background PD level when the high voltage
supply is solely applied on the HV bushing, and no conductor is
under test.
From the phase resolved diagram (Fig 8), the maximum
single discharge has an equivalent charge of approximately 1
nC while other discharge activities are below 1 nC. If Q IEC is
plotted against the applied voltage (Fig 9), the apparent charge
according to IEC standard is below 1nC below 140 kV. This
indicates that PDs from HV bushing contribute apparent charge
less than 1 nC.
Based on the PD bushing test, it is appropriate to choose 1 nC
as the threshold value for conductor samples. The corona
discharge inception voltage is defined as the voltage that leads
to PD levels exceeding the threshold value.
Fig. 9. QIEC amplitude with applied voltage level
Fig. 8. Phase resolve diagram for bushing test
Fig. 7. Reverberation time plot for various frequencies
Fig. 6. Background noise mitigation by anechoic chamber
A uto spectrum (Signal 1) - File
rem ent\D es kto p\F ro m D ELL lapt o p\Experim ental R es ults \B ig_C ha
10 30 100 300 1k 3k 10k 30k
0
40
80
[Hz]
[dB /20.0u P a] A uto spectrum (Signal 1) - File
rem ent\D es kto p\F ro m D ELL lapt o p\Experim ental R es ults \B ig_C ha
10 30 100 300 1k 3k 10k 30k
0
40
80
[Hz]
[dB /20.0u P a]
Inside Chamber
Outside Chamber
122

8/12/2019 Acoustic Noise Taylor
http://slidepdf.com/reader/full/acoustic-noise-taylor 5/5
V. R ESULTS AND DISCUSSION
To demonstrate the measurement capability, results are
given for one conductor sample.
A. Acoustic Measurement Results
The A-weighted overall level of sound pressure level (SPL)
is plotted against voltage gradient in Fig 10. Three types of
spray conditions are compared, and conclusions are:
below surface stresses of 10 kV/cm, the noise is
generated mainly from the spray system: no noise from
manual spray, 44 dBA from the light spray and 60 dBA
from the heavy spray
SPLs for manual spray and light spray increase rapidly
after the voltage gradient exceeds 10 kV/cm (noise
inception)
when the voltage gradient is above 15 kV/cm, manual
spray and light spray produce similar noise levels due to
corona discharge and droplets vibration
B. Corona Inception and Extinction
As introduced previously, the corona threshold (1 nC) is
selected above the bushing PD level (0.8 nC). PD detection is
carried out through the following procedure:
1) Gradually increase the voltage level until the standardized
apparent charge (QIEC) exceeds the threshold value and
stable corona discharge is established.
2) Keep the voltage level constant for approximately one
minute.
3) Gradually reduce the voltage level until Q IEC drops below
the threshold value.
In order to maintain reproducibility, this set of tests isrepeated ten times and the average value is obtained as
shown in Table II.
VI. CONCLUSION
A test facility has been engineered which is capable ofcomparing conductor performance under wet and dry
conditions. Results are extremely consistent. Uniquely both
high frequency and low frequency acoustic emissions can be
compared.
VII. ACKNOWLEDGMENT
The support of National Grid UK in providing the funding
for this work is gratefully acknowledged by the authors.
R EFERENCES
[1] E. R. Taylor, V. L. Chartier, D. N. Rice, “Audible Noise and Visual
Corona from HV and EHV Transmission Lines and SubstationConductors —Laboratory Tests”, IEEE Trans. PAS Vol. 88 (1969), no. 5,
pp. 666-679.[2] EPRI AC Transmission Line Reference Book — 200 kV and Above/ Third
Edition, Electric Power Research Institute (EPRI), Palo Alto, CA, 2005.
[3] P. S. Maruvada, Corona Performance of High-Voltages Transmission
Lines, Ch. 6.6. Baldock, Herts.: Research Studies Press Ltd., 2000, pp.
164-165.
[4] T. H. Teich, H. J. Weber, “Tonal emission from high voltage lines”, Proc
of 14th Int. Conf on Gas Discharges and Their Appl., Liverpool, UK, Vol.1, pp. 259-262, 2002.
[5] U. Straumann and M. Semmler, “About the mechanism of tonal emission
from high voltage lines”, Proc. of 15th Int. Conf. on Gas Discharges andTheir Applications, Toulose, France, 2004, Vol. 1, 363-366
[6] U. Ingard, “Acoustic wave generation and amplification in a plasma”,
Phys. Rev., Vol. 145, No. 1, pp. 41-46, 1966.[7] F. Bastien, “Acoustics and gas discharges: applications to loudspeakers”,
J. Phys. D: Appl. Phys., Vol. 20, No. 12, pp. 1547-1557 1987.
[8] U. Straumann and J. Fan, “Audible Noise from AC -UHV TransmissionLines —Theoretical Comparison of Broadband and Tonal Components”,
International Conference on UHV Transmission, Beijing, 2009[9] U. Straumann, “Mechanism of the tonal emission from ac high voltage
overhead transmission lines”, J. Phys. D: Appl. Phys., Vol. 44, pp. 75501
-75501 2011
[10] U. Straumann, “Simulation of the space charge near coronating
conductors of AC overhead transmission lines”, J. Phys. D: Appl. Phys.,
Vol. 44, pp. 075502 -075502, 2011[11] Q. Li, R. Shuttleworth, I. Dupere, G. Zhang, S. M. Rowland, R. S. Morris,
"FEA modelling of a water droplet vibrating in an electric field",
International Symposium on Electrical Insulation (ISEI), pp. 449-453,2012
[12] R. B. George, “Power transformer noise: Its characteristics and
reduction”, A.I.E.E., Trans. March 1931[13] N. Kolcio, B. J. Ware, R. L. Zagier, V. L. Chartier, F. M. Dietrich, “The
Apple Grove 750 kV Project Statistical Analysis of Audible Noise
Performance of Conductors at 775 kV”, IEEE Trans. Power Apparatusand Systems, Vol. PAS-93, pp. 831-840, May 1974.
[14] Q. Li, R. Shuttleworth, G. Zhang, S. M. Rowland, R. S. Morris, "Oncalculating surface potential gradient of overhead line conductors",
International Symposium on Electrical Insulation (ISEI), pp. 540-544,2012
TABLE II. CORONA I NCEPTION AND EXTINGUISHING R ESULTS
Dry Wet
Inception
(kV/cm)
Extinction
(kV/cm)
Inception
(kV/cm)
Extinction
(kV/cm)
Conductor Sample 21.6 19.8 10.1 11.4
20
25
30
35
40
45
50
55
60
65
70
75
6 7 8 9 10 11 12 13 14 15 16 17 18 19 20 21 22
Overall SPL Inside Chamber_Manual Spray
Overall SPL Inside Chamber_Light Spray
Overall SPL Inside Chamber_Heavy Spray
Fig. 10. Overall sound pressure levels plotted against voltage gradient
Surface Gradient (kV/cm)
O v e r a l l S o u n d P r e s s u r e L e v e l ( k
V / c m )
123
Related Documents