Int. J. Appl. Math. Comput. Sci., 2015, Vol. 25, No. 3, 631–643 DOI: 10.1515/amcs-2015-0046 ACOUSTIC ANALYSIS ASSESSMENT IN SPEECH PATHOLOGY DETECTION DARIA PANEK a, ∗ ,ANDRZEJ SKALSKI a ,JANUSZ GAJDA a ,RYSZARD TADEUSIEWICZ b a Department of Measurement and Electronics AGH University of Science and Technology, Al. Mickiewicza 30, 30-059 Krak´ ow, Poland e-mail: {dpanek,skalski,jgajda}@agh.edu.pl b Department of Automatics and Biomedical Engineering AGH University of Science and Technology, Al. Mickiewicza 30, 30-059 Krak´ ow, Poland e-mail: [email protected] Automatic detection of voice pathologies enables non-invasive, low cost and objective assessments of the presence of disorders, as well as accelerating and improving the process of diagnosis and clinical treatment given to patients. In this work, a vector made up of 28 acoustic parameters is evaluated using principal component analysis (PCA), kernel principal component analysis (kPCA) and an auto-associative neural network (NLPCA) in four kinds of pathology detection (hyperfunctional dysphonia, functional dysphonia, laryngitis, vocal cord paralysis) using the a, i and u vowels, spoken at a high, low and normal pitch. The results indicate that the kPCA and NLPCA methods can be considered a step towards pathology detection of the vocal folds. The results show that such an approach provides acceptable results for this purpose, with the best efficiency levels of around 100%. The study brings the most commonly used approaches to speech signal processing together and leads to a comparison of the machine learning methods determining the health status of the patient. Keywords: linear PCA, non-linear PCA, auto-associative neural network, validation, voice pathology detection. 1. Introduction Despite the highly developed digital technology used in acoustic analysis, there is still the problem of extracting useful information about the state of a patient’s health. Voice is dynamic and complex, whilst speech can be conducted in different languages, intonations and with different emotions. In the last few years, voice pathology detection has been studied intensively in the signal processing research community using various digital signal processing methods (Arroyave et al., 2012; Fong et al., 2013). Because of this, the reliability of the developed software which is currently being used to automatically detect pathology in the vocal folds and the underlying variability of speech has increased (Fraile et al., 2009). It depends on the language analysed and the kind of pathologies and techniques used in the analysis. The researchers are still working on the development of different tools for automatic evaluation of pathological voices. Due to this fact, the calculations in this work are provided separately for women and men. ∗ Corresponding author In speech clinical practice, the patient’s voice quality is assessed using sustained vowel phonations and/or conversational speech. Sustained vowels are particularly useful because they circumvent linguistic artefacts and are thus considered sufficient for many voice assessment applications (Tsanas, 2013). During speech examination, the patient is asked to maintain the phonation of sustained vowels for as long as possible and as steady as possible (in terms of pitch and amplitude). In order to make quantitative voice evaluation, acoustic, aerodynamic, endoscopic, perceptual or patient-self assessment examination may be needed. If the diagnosis is not ambiguous, the methods can be combined (Godino-Llorente et al., 2006b). There are different acoustic features being analysed, with a different focus. Closer attention can be given to measuring instabilities in the voice signal or the noise content and general articulatory problems. The most commonly used measures are fundamental frequency (Manfredi et al., 2000), jitter (frequency perturbation), shimmer (amplitude perturbation) (Farrus et al., 2007; Lieberman, 1963; Horii, 1980; Steinecke

Welcome message from author
This document is posted to help you gain knowledge. Please leave a comment to let me know what you think about it! Share it to your friends and learn new things together.
Transcript

Int. J. Appl. Math. Comput. Sci., 2015, Vol. 25, No. 3, 631–643DOI: 10.1515/amcs-2015-0046
ACOUSTIC ANALYSIS ASSESSMENT IN SPEECH PATHOLOGY DETECTION
DARIA PANEK a,∗, ANDRZEJ SKALSKI a, JANUSZ GAJDA a, RYSZARD TADEUSIEWICZ b
aDepartment of Measurement and ElectronicsAGH University of Science and Technology, Al. Mickiewicza 30, 30-059 Krakow, Poland
e-mail: dpanek,skalski,[email protected]
bDepartment of Automatics and Biomedical EngineeringAGH University of Science and Technology, Al. Mickiewicza 30, 30-059 Krakow, Poland
e-mail: [email protected]
Automatic detection of voice pathologies enables non-invasive, low cost and objective assessments of the presence ofdisorders, as well as accelerating and improving the process of diagnosis and clinical treatment given to patients. Inthis work, a vector made up of 28 acoustic parameters is evaluated using principal component analysis (PCA), kernelprincipal component analysis (kPCA) and an auto-associative neural network (NLPCA) in four kinds of pathology detection(hyperfunctional dysphonia, functional dysphonia, laryngitis, vocal cord paralysis) using the a, i and u vowels, spoken ata high, low and normal pitch. The results indicate that the kPCA and NLPCA methods can be considered a step towardspathology detection of the vocal folds. The results show that such an approach provides acceptable results for this purpose,with the best efficiency levels of around 100%. The study brings the most commonly used approaches to speech signalprocessing together and leads to a comparison of the machine learning methods determining the health status of the patient.
Keywords: linear PCA, non-linear PCA, auto-associative neural network, validation, voice pathology detection.
1. Introduction
Despite the highly developed digital technology used inacoustic analysis, there is still the problem of extractinguseful information about the state of a patient’s health.Voice is dynamic and complex, whilst speech can beconducted in different languages, intonations and withdifferent emotions. In the last few years, voice pathologydetection has been studied intensively in the signalprocessing research community using various digitalsignal processing methods (Arroyave et al., 2012; Fonget al., 2013). Because of this, the reliability of thedeveloped software which is currently being used toautomatically detect pathology in the vocal folds andthe underlying variability of speech has increased (Fraileet al., 2009). It depends on the language analysed and thekind of pathologies and techniques used in the analysis.The researchers are still working on the development ofdifferent tools for automatic evaluation of pathologicalvoices. Due to this fact, the calculations in this work areprovided separately for women and men.
∗Corresponding author
In speech clinical practice, the patient’s voice qualityis assessed using sustained vowel phonations and/orconversational speech. Sustained vowels are particularlyuseful because they circumvent linguistic artefacts andare thus considered sufficient for many voice assessmentapplications (Tsanas, 2013). During speech examination,the patient is asked to maintain the phonation of sustainedvowels for as long as possible and as steady as possible(in terms of pitch and amplitude).
In order to make quantitative voice evaluation,acoustic, aerodynamic, endoscopic, perceptual orpatient-self assessment examination may be needed.If the diagnosis is not ambiguous, the methods canbe combined (Godino-Llorente et al., 2006b). Thereare different acoustic features being analysed, witha different focus. Closer attention can be given tomeasuring instabilities in the voice signal or thenoise content and general articulatory problems.The most commonly used measures are fundamentalfrequency (Manfredi et al., 2000), jitter (frequencyperturbation), shimmer (amplitude perturbation) (Farruset al., 2007; Lieberman, 1963; Horii, 1980; Steinecke

632 D. Panek et al.
and Herzel, 1995), harmonic-to-noise ratio (Yumotoet al., 1982) and mel-frequency coefficients (Rabinerand Juang, 1993; Godino-Llorente et al., 2006a;Godino-Llorente and Gomez-Vilda, 2004; Steinecke andHerzel, 1995; Jothilakshmi, 2014; Saldanha et al., 2014).
The detection of voice impairments in vocal foldpathology reviews the excitation of the signal (Wonget al., 1979). Non-parametric approaches use a magnitudespectrum of speech, where short-term mel-frequencycepstral coefficients (MFCCs) are used for representingthe magnitude spectrum. It is still a challenge toattain high accuracy and an automatic, robust andinexpensive approach in voice pathology detection andclassification. Automatic detection of voice pathologiesenables non-invasive, low cost and objective assessmentof the presence disorders and speed-up, and improvesthe process of diagnosis and clinical treatment given topatients.
In the past few years, researchers have paid a lot ofattention to automatic systems assessing voice disordersdue to their non-invasiveness and low cost implementationcompared with traditional diagnostic approaches. Theaccuracy detection levels of voice and speech disordershas increased during the last few years (Arroyave et al.,2012). Unfortunately, no universal solution has yetbeen found to detect the condition of the voice. Mostof the features and algorithms are trained using limiteddatabases, including few types of disorders. One hundredpercent of accuracy in voice pathology detection wasachieved by Eadie and Doyle (2005) using long-termaverage spectral measures, glottal noise measures, andmeasures based on linear prediction modelling, which inturn formed the inputs into conditional logistic regressionanalysis. This research included only 24 patients.
Hadjitodorov and Mitev (2002) also report the levelof 100% accuracy in the detection for well-manifestedvoice pathologies, and 96,1% accuracy of weaklymanifested pathologies were achieved for the K-nearestneighbours using turbulent noise in voice signals(turbulent noise index, TNI) and for breathy voicecharacterization (normalized first harmonic energy,NFHE). The database contained 744 patients, of whom638 suffered from various functional and organic larynxdisorders. Usage of a few parameters (mel-frequencycepstral coefficients, harmonics to noise ratio, normalisednoise energy and glottal to noise excitation) and principalcomponent analysis ensured an 89.3% accuracy levelin pathology detection of only one disease—asthenia(Saenz-Lechon et al., 2006). The accuracy of93,4% was achieved with the use of an adaptivetime-frequency transform algorithm and several features,such as the octave max, octave mean, energy ratio,length ratio and frequency ratio, which were classifiedusing linear discriminant analysis (Umapathy et al.,2005). An identification accuracy of 96% was achieved
using a neural network: a multilayer perceptronand learning vector quantization fed using short-termvectors calculated according to mel-frequency coefficients(Godino-Llorente et al., 2006b).
In the literature, there are different ways ofclassifying vocal disorders for clinical applications. Oneof the most commonly used is principal componentanalysis (Saenz-Lechon et al., 2006), which helps inextracting the most useful information regarding thesignal and reduces the number of parameters. Reductionin parameters may cause a smoothed distribution of voiceswith an inferior classification (Matassini et al., 2000).Goddard et al. (2009) present reduction in dimensionalityfor visualization of normal and pathological speech datausing PCA and kernel PCA methodology. Anothermethod used for reducing the dimensionality is non-linearPCA based on a neural network. It has beendemonstrated that NLPCA, which minimizes the meansquare reconstruction error from a reduced dimensionalityspace, can be very effective for representing the datawhich lie in a curved subspace, and may be very effectivein voice pathology detection (Hu and Zahorian, 2008).
Moreover, there are studies combining acousticalsignal and imaging of the vocal folds. There are alreadytechniques available such as kymography and high-speeddigital videoendoscopy (HSV) that enable the clinicianto record the oscillating vocal folds in real time duringthe phonation. What is more, HSV enables one tovisualise and quantify pathologies that affect the dynamicbehaviour of the vocal folds (Skalski et al., 2008).Acoustic analysis and a system visualizing vocal foldvibrations enable direct correlations to be establishedbetween acoustic parameters and measurements of glottalclosure and vibratory symmetry (Mehta et al., 2010).
In this paper we tackle the pathology detectionchallenges, by creating a feature vector made up of 28different parameters derived from voice signal analysis.The parameters are used for analysis, because they areincreasingly being adopted and understood by physiciansdue to the adjunctive programs used in the diagnosismaking process. Other parameters, such as mel-frequencycepstrum coefficients, formants or zeroth-, first-, second-,and third-order moments, are used due to their widefunctionality (Rabiner and Juang, 1993; Imai, 1983).Based on the vector made up of 28 parameters, wecompare pathology detection accuracy, precision andspecificity using machine learning methods such asprincipal component analysis, kernel principal componentanalysis and an auto-associative neural network. Thisprovides a conceptual basis for the development of thecurrent state of biomedical speech signal processingand mathematical methodology, highlighting the mostclinically valuable information from the recorded speechsignals which may not be adequately quantified usingthe currently available algorithmic tools contained in the
Acoustic analysis assessment in speech pathology detection 633
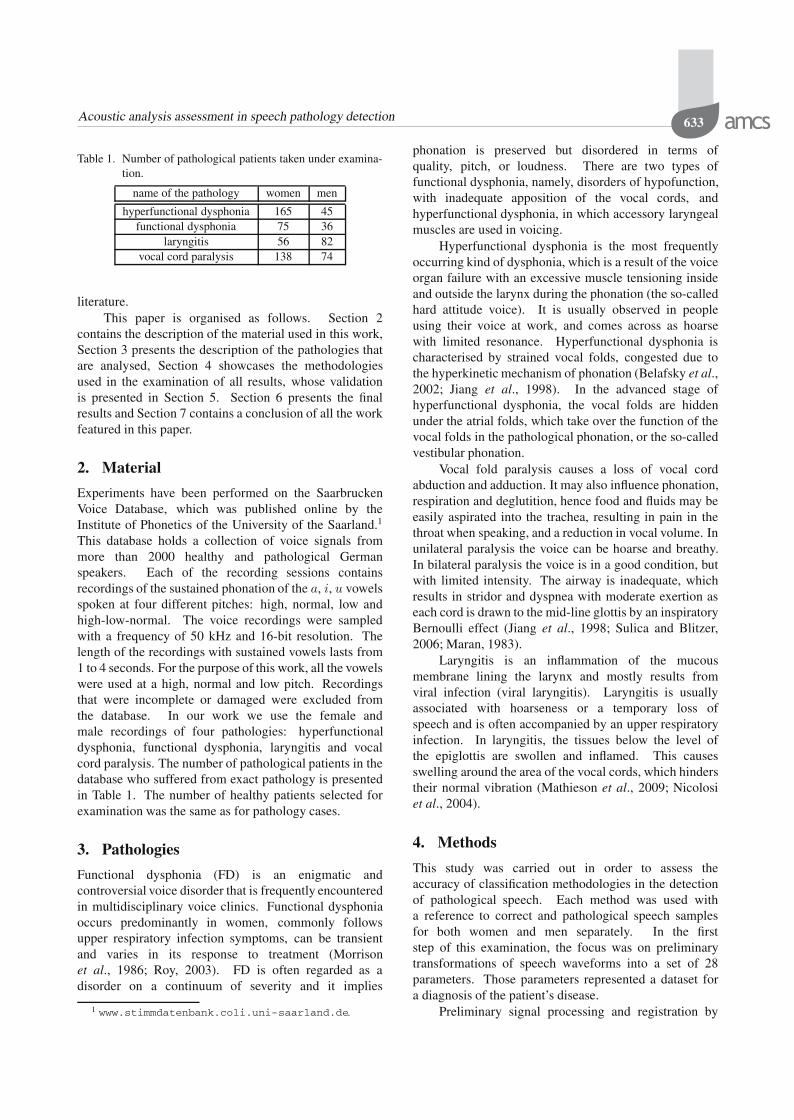
Table 1. Number of pathological patients taken under examina-tion.
name of the pathology women men
hyperfunctional dysphonia 165 45functional dysphonia 75 36
laryngitis 56 82vocal cord paralysis 138 74
literature.This paper is organised as follows. Section 2
contains the description of the material used in this work,Section 3 presents the description of the pathologies thatare analysed, Section 4 showcases the methodologiesused in the examination of all results, whose validationis presented in Section 5. Section 6 presents the finalresults and Section 7 contains a conclusion of all the workfeatured in this paper.
2. Material
Experiments have been performed on the SaarbruckenVoice Database, which was published online by theInstitute of Phonetics of the University of the Saarland.1
This database holds a collection of voice signals frommore than 2000 healthy and pathological Germanspeakers. Each of the recording sessions containsrecordings of the sustained phonation of the a, i, u vowelsspoken at four different pitches: high, normal, low andhigh-low-normal. The voice recordings were sampledwith a frequency of 50 kHz and 16-bit resolution. Thelength of the recordings with sustained vowels lasts from1 to 4 seconds. For the purpose of this work, all the vowelswere used at a high, normal and low pitch. Recordingsthat were incomplete or damaged were excluded fromthe database. In our work we use the female andmale recordings of four pathologies: hyperfunctionaldysphonia, functional dysphonia, laryngitis and vocalcord paralysis. The number of pathological patients in thedatabase who suffered from exact pathology is presentedin Table 1. The number of healthy patients selected forexamination was the same as for pathology cases.
3. Pathologies
Functional dysphonia (FD) is an enigmatic andcontroversial voice disorder that is frequently encounteredin multidisciplinary voice clinics. Functional dysphoniaoccurs predominantly in women, commonly followsupper respiratory infection symptoms, can be transientand varies in its response to treatment (Morrisonet al., 1986; Roy, 2003). FD is often regarded as adisorder on a continuum of severity and it implies
1 www.stimmdatenbank.coli.uni-saarland.de.
phonation is preserved but disordered in terms ofquality, pitch, or loudness. There are two types offunctional dysphonia, namely, disorders of hypofunction,with inadequate apposition of the vocal cords, andhyperfunctional dysphonia, in which accessory laryngealmuscles are used in voicing.
Hyperfunctional dysphonia is the most frequentlyoccurring kind of dysphonia, which is a result of the voiceorgan failure with an excessive muscle tensioning insideand outside the larynx during the phonation (the so-calledhard attitude voice). It is usually observed in peopleusing their voice at work, and comes across as hoarsewith limited resonance. Hyperfunctional dysphonia ischaracterised by strained vocal folds, congested due tothe hyperkinetic mechanism of phonation (Belafsky et al.,2002; Jiang et al., 1998). In the advanced stage ofhyperfunctional dysphonia, the vocal folds are hiddenunder the atrial folds, which take over the function of thevocal folds in the pathological phonation, or the so-calledvestibular phonation.
Vocal fold paralysis causes a loss of vocal cordabduction and adduction. It may also influence phonation,respiration and deglutition, hence food and fluids may beeasily aspirated into the trachea, resulting in pain in thethroat when speaking, and a reduction in vocal volume. Inunilateral paralysis the voice can be hoarse and breathy.In bilateral paralysis the voice is in a good condition, butwith limited intensity. The airway is inadequate, whichresults in stridor and dyspnea with moderate exertion aseach cord is drawn to the mid-line glottis by an inspiratoryBernoulli effect (Jiang et al., 1998; Sulica and Blitzer,2006; Maran, 1983).
Laryngitis is an inflammation of the mucousmembrane lining the larynx and mostly results fromviral infection (viral laryngitis). Laryngitis is usuallyassociated with hoarseness or a temporary loss ofspeech and is often accompanied by an upper respiratoryinfection. In laryngitis, the tissues below the level ofthe epiglottis are swollen and inflamed. This causesswelling around the area of the vocal cords, which hinderstheir normal vibration (Mathieson et al., 2009; Nicolosiet al., 2004).
4. Methods
This study was carried out in order to assess theaccuracy of classification methodologies in the detectionof pathological speech. Each method was used witha reference to correct and pathological speech samplesfor both women and men separately. In the firststep of this examination, the focus was on preliminarytransformations of speech waveforms into a set of 28parameters. Those parameters represented a dataset fora diagnosis of the patient’s disease.
Preliminary signal processing and registration by

634 D. Panek et al.
itself does not make it completely useful for the processof identifying and assessing changes in the deformationand pathology. Thus one needs to develop and explainphonetic recordings using set parameters and an accurateclassification method. In this paper, the analysis ofthe speech signal is performed with the use of 28parameters, namely, fundamental frequency, jitter andshimmer coefficients, energy, zeroth-, first-, second-,third-order moment, kurtosis, power factor, 1-, 2- and3-formant amplitude, 1-, 2- and 3-formant frequency,maximum and minimum values of the signal and 10mel-frequency ceptrum coefficients (MFCCs). The latterare commonly used in speech recognition because theysimulate the subjective human perception of voice pitchby enhancing audible frequency and are less sensitiveto noise (Rabiner and Juang, 1993). Cepstral analysiswas used to estimate the fundamental frequency and wasperformed using a Fourier transformation of the soundspectrum.
In order to facilitate the extraction of the maincomponents of the spectrum, before the transformationfrom the time domain to the frequency domain, thesignal was subjected to the windowing operation using aHamming window. In this paper we use a window with awidth of w = 384 samples. Hence, knowing the positionof the maximum frequency means, we can determine thebasic frequency of the analysed sound using the followingformula:
f0 =lsz
wm, (1)
where ls is the number of elements of the spectrum,z is the audio sample rate, w is the width of theanalysed window (number of samples) and m representsthe position of maximum cepstrum.
The sounds of laryngeal stimulation should have arelatively constant amplitude and frequency of the basictone. When there are pathological changes to the larynx,the level of signal and its fundamental frequency change.Jitter (relative) is the average absolute difference betweenconsecutive periods, divided by the average period, andis expressed as a percentage. The jitter coefficient (J) iscalculated using
J =
1
N − 1
N−1∑
i=1
|Ti − Ti+1|1
N
N−1∑
i=1
Ti
100%, (2)
where Ti are extracted F0 period lengths and N isthe number of extracted F0 periods. The amplitudeperturbation known as shimmer (relative) S is defined asthe average absolute difference between the amplitudesof consecutive periods, divided by the average amplitude,
expressed as
S =
1
N − 1
N−1∑
i=1
|Ai −Ai+1|1
N
N∑
i=1
Ai
100%, (3)
where Ai is the extracted peak-to-peak amplitude dataand N represents the number of extracted fundamentalfrequency periods. A measure of the energy carried bythe signal x is achieved by integrating the square of thesignal Ex:
Ex =
∫ t1
t2
x2(t) dt (4)
Ex =
n2∑
n=n1
x2(n), (5)
where n1 and n2 are the boundaries of intervals of time,x(n) means the signal value of the n-th moment of time,i.e.,
x(n) = x(nΔt). (6)
Having defined the signal time-frequency domainG(t, f), the shape of the signal spectrum can be describedas the zeroth-order spectral moment (Fujinaga, 1996):
M0(t) =
∞∑
i=0
G(t, fi), (7)
where G(t, f) represents the time-frequency spectrumconsidering the centre frequency of the i-th bandhighlighted in frequency analysis.
The first-order moment is the centre of gravity of thespectrum (frequency-weighted average),
M1(t) =
∞∑
i=0
G(t, fi)fi
M0(t)(8)
The second-order moment is defined as the square ofthe spectrum width,
M2(t) =
∞∑
i=0
G(t, fi)[fi −M1(t)]2
M0(t). (9)
The third-order moment is described as theasymmetry of the spectrum and means skewness,
M3(t) =
∞∑
i=0
G(t, fi)[fi −M1(t)]3
M0(t). (10)
Due to correlation, the standardised higher-orderspectral moments are less suitable. Further calculationswere made to obtain kurtosis, which is interpreted as

Acoustic analysis assessment in speech pathology detection 635
flattening the spectrum measurement (Joanes and Gill,1998):
kurtosis =M4(t)
M2(t)2. (11)
The next parameter calculated was the so-calledcoefficient of relative power, which means the ratio of thepower of the signal in the desired frequency wide-bandf ∈ [fd, fg] to signal power across the bandwidth [f0,f∞] (Engel et al., 2007),
Wm(t) =
tg∑
t=tb
fg2∑
f=fd2
G(t, fi)
tg∑
t=tb
fg1∑
f=fd1
G(t, fi)
, (12)
where fg1, fd1 represent the lower and upper frequenciesof the power wide-band, fg2, fd2 are the upper and lowerfrequency ranges of the selected frequency wide-band andtb, tg are the beginning and the end of the recorded voicesample. The power factor was calculated for the firstpower coefficient describing the ratio of signal power inthe first band to the overall signal power.
Other computed parameters were the formants.Formant frequencies reflect the size and shape ofthe supraglottal filter system, whereas the formant’samplitudes provide information pertaining to vocalintensity levels as well as coupling between thesupraglottal cavities and subglottal spaces (Rachida andAmar, 2009). In order to determine the formantparameters, we needed spectral envelope, which wascomputed using linear predictive coding (LPC). It is aspeech signal analysis technique which consists in thepresentation of the speech signal as a response to theall-pole filter on the signal pitch (Atal and Hanauer, 1971).Linear prediction treats the signal as if it were generatedby a signal of minimum energy, which was passed througha purely recursive IIR filter. An important thing whencalculating formant frequencies from the filter is to findthe locations of the resonances that make up the filter. Todo this, we adopted the filter coefficients as a polynomialand solved the roots of the polynomial (Makhoul, 1975).
The formant amplitudes are influenced by theintensity of the signal source, frequency and dampingwithin the vocal folds. Formants can be defined fromthe envelope which can be drawn to smoothly embracethe harmonics within the spectral maximum, i.e., thesound pressure level in dB of the envelope peak. Theformant’s frequency is related to the frequency positionof the envelope maximum (F1, F2, F3, respectively).The formants calculated for five women, of whom foursuffered from four voice pathologies and one was ahealthy individual are presented in Fig. 1. Many authorsshow interest in cepstral factors in diagnostic evaluationof pathological changes in the glottis (Huber et al., 1999;
0 500 1000 1500 2000 2500 3000 3500 4000 4500 50000
5
10
15
20
25
30
35
40
45
50
Frequency (Hz)
Am
plitu
de [d
B]
Hyperfunctional DysphoniaFunctional DysphoniaLaryngitisVocal Fold ParalysisHealthy
Fig. 1. Formant representation of five women: one sufferingfrom functional dysphonia (age 41), one suffering fromhyperfunctional dysphonia (age 48), one suffering fromlaryngitis (age 59), one who had vocal fold paralysis (age54) and a healthy individual (age 21).
Fong et al., 2013; Brinca et al., 2014). The cepstrum isdefined as the power spectrum of the logarithm of thepower spectrum. It has a strong peak corresponding to thepitch period of the voiced-speech segment (Noll, 1967).The cepstral coefficients in this project are extendedto the so-called Melow filtration, which consists of anadditional non-linear frequency scale signal spectrumtransformation. As a result, we achieved 10 MFCCs.
Since the feature vector was composed of a largenumber of parameters, we needed to use a method thatwould extract the most significant information. In order toperform reduction in the number of essential parameterswe needed to organise their features according to thediscriminant ability and in the final analysis obtain stableand consistent results, which better reflected the overallsystem performance.
The first method used for preserving the mostrelevant information from the data was the mathematicaltechnique called principal component analysis (PCA).The significance of PCA has been discussed by Oja(2002) and Bishop (2006). It is a powerful tool forfeature extraction based on minimizing the mean squareerror between original data vectors and other data vectorsthat could be estimated from the reduced dimensionality.PCA has two distinct versions: linear and non-linear.The objective of linear PCA is to find t orthogonalvectors (principal components) from the set of data ina lower dimensional data space that exhibit the largestvariance. PCA has been proved to be the optimal lineartransformation of the dataset and provides for efficientreduction of the initial dataset.
Theoretically, non-linear mathematical techniqueshave the potential to be more “efficient” than linearmethods as they provide better representations withfewer dimensions. Non-linear transformation methodspresented in this paper are non-linear PCA (NLPCA)
636 D. Panek et al.
(Scholz et al., 2008) and kernel PCA (kPCA) (Scholkopfet al., 1999). The aim of NLPCA is to minimize themean square error between the features estimated fromthe reduced dimensionality featured and the original ones.In other words, NLPCA determines a non-linear mappingfunction that projects N -dimensional features ontotheir corresponding highly informative M -dimensionalrepresentation (Tadeusiewicz et al., 2013; Makki et al.,2010; Zahorian and Hu, 2011).
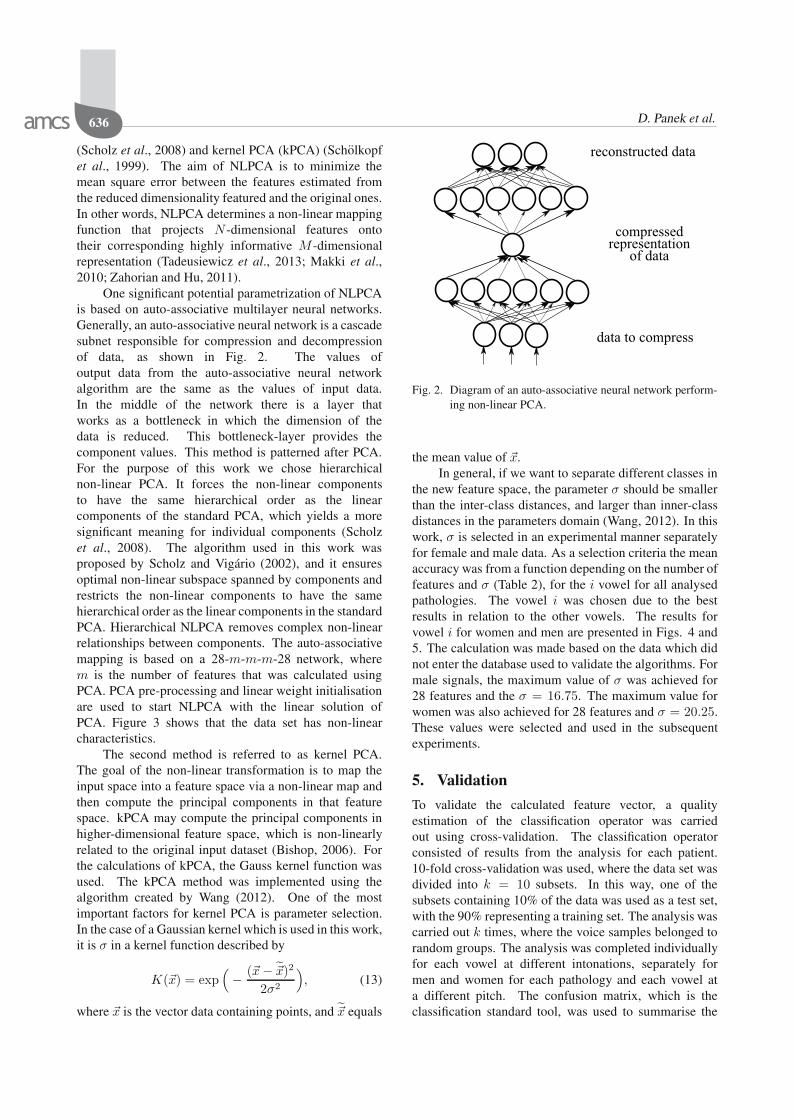
One significant potential parametrization of NLPCAis based on auto-associative multilayer neural networks.Generally, an auto-associative neural network is a cascadesubnet responsible for compression and decompressionof data, as shown in Fig. 2. The values ofoutput data from the auto-associative neural networkalgorithm are the same as the values of input data.In the middle of the network there is a layer thatworks as a bottleneck in which the dimension of thedata is reduced. This bottleneck-layer provides thecomponent values. This method is patterned after PCA.For the purpose of this work we chose hierarchicalnon-linear PCA. It forces the non-linear componentsto have the same hierarchical order as the linearcomponents of the standard PCA, which yields a moresignificant meaning for individual components (Scholzet al., 2008). The algorithm used in this work wasproposed by Scholz and Vigario (2002), and it ensuresoptimal non-linear subspace spanned by components andrestricts the non-linear components to have the samehierarchical order as the linear components in the standardPCA. Hierarchical NLPCA removes complex non-linearrelationships between components. The auto-associativemapping is based on a 28-m-m-m-28 network, wherem is the number of features that was calculated usingPCA. PCA pre-processing and linear weight initialisationare used to start NLPCA with the linear solution ofPCA. Figure 3 shows that the data set has non-linearcharacteristics.
The second method is referred to as kernel PCA.The goal of the non-linear transformation is to map theinput space into a feature space via a non-linear map andthen compute the principal components in that featurespace. kPCA may compute the principal components inhigher-dimensional feature space, which is non-linearlyrelated to the original input dataset (Bishop, 2006). Forthe calculations of kPCA, the Gauss kernel function wasused. The kPCA method was implemented using thealgorithm created by Wang (2012). One of the mostimportant factors for kernel PCA is parameter selection.In the case of a Gaussian kernel which is used in this work,it is σ in a kernel function described by
K(x) = exp(− (x− x)2
2σ2
), (13)
where x is the vector data containing points, and x equals
data to compress
compressedrepresentation
of data
reconstructed data
Fig. 2. Diagram of an auto-associative neural network perform-ing non-linear PCA.
the mean value of x.In general, if we want to separate different classes in
the new feature space, the parameter σ should be smallerthan the inter-class distances, and larger than inner-classdistances in the parameters domain (Wang, 2012). In thiswork, σ is selected in an experimental manner separatelyfor female and male data. As a selection criteria the meanaccuracy was from a function depending on the number offeatures and σ (Table 2), for the i vowel for all analysedpathologies. The vowel i was chosen due to the bestresults in relation to the other vowels. The results forvowel i for women and men are presented in Figs. 4 and5. The calculation was made based on the data which didnot enter the database used to validate the algorithms. Formale signals, the maximum value of σ was achieved for28 features and the σ = 16.75. The maximum value forwomen was also achieved for 28 features and σ = 20.25.These values were selected and used in the subsequentexperiments.
5. Validation
To validate the calculated feature vector, a qualityestimation of the classification operator was carriedout using cross-validation. The classification operatorconsisted of results from the analysis for each patient.10-fold cross-validation was used, where the data set wasdivided into k = 10 subsets. In this way, one of thesubsets containing 10% of the data was used as a test set,with the 90% representing a training set. The analysis wascarried out k times, where the voice samples belonged torandom groups. The analysis was completed individuallyfor each vowel at different intonations, separately formen and women for each pathology and each vowel ata different pitch. The confusion matrix, which is theclassification standard tool, was used to summarise the

Acoustic analysis assessment in speech pathology detection 637
Table 2. σ value which characterised the highest accuracy result for each vowel.
vowel a i u
gender women men women men women men
number of features 28 28 28 28 28 28σ 20,5 17,5 20,25 16,75 21,25 18,00
Fig. 3. Hierarchical non-linear PCA applied to a 28-feature vec-tor for women for the vowel a at a low pitch sufferingfrom laryngitis showing non-linear behaviour. The firstthree non-linear components are visualised in the spaceof the first three PCA components, where the grids repre-sent the new coordinate system of the component space.
results of the work. To achieve a quality assessment,parameters such as accuracy, precision and specificityfor healthy and pathological detection were calculated.Sensitivity relates to the test’s ability to detect positiveresults, whereas specificity relates to the identification ofnegative results. Definitions of the parameters placed inthe proposed confusion matrix are shown in Table 3 andEqns. 14–16.
An accuracy (ACC) is defined as the ratio of theparameters from a test set that were properly classifiedto all the parameters from a test set, as presented inEqn. (14). The accuracy of the results achieved usingthe proposed confused matrix analysing each of thementioned voice pathologies is presented in Table 6.Calculations were made separately for men and women:
ACC =TP + TN
TP + FN + TN + FP. (14)
In pattern recognition and data mining, precision isthe fraction of relevantly classified cases. It is definedas the number of all the cases that were classified into aparticular class, and how many of them actually belongedto that class. In other words, it is defined as the ratio ofcases that have been classified by the system correctly
30252015σ
1055Number of features10
1520
25
0.6
0.4
0
0.8
0.2Mea
n ac
cura
cy
0.2
0.4
0.6
0.8
Fig. 4. Graph presenting the mean σ distribution in relation tothe number of parameters and detection accuracy forvowel i for women after PCA.
30252015
σ1055Number of features
1015
2025
0.8
0.6
0.4
0.2
0
Mea
n ac
cura
cy
0.2
0.4
0.6
0.8
Fig. 5. Graph presenting the mean σ distribution in relation tothe number of parameters and detection accuracy forvowel i for men after PCA.
to the corresponding class to all results taken into theclassification. Precision was calculated separately forhealth
HD =TP
TP + FP, (15)
where TP and FP respectively mean true and falsepositive, and pathology detection
PD =TN
FN + TN, (16)
where TN and FN respectively mean true and falsenegative.
6. Experimental results
Recordings for 1342 patients from the Saarbruecken VoiceDatabase were used to evaluate the pathology detectionand classification models. After signal processinganalysis, the feature vector made up of 28 parameters

638 D. Panek et al.
Table 3. Confusion matrix used in the analysis
Results from classificationhealthy pathology
Dia
gnos
ed heal
thy
true positive(TP)
false positive(FP)
path
olog
y false negative(FN)
true negative(TN)
Sensitivity Specificity=TP/(TP+FN) =TN/(TN+FP)
was created, (cf. Section 4). These parameters werecalculated automatically, by characterizing the clinicallyuseful properties of the speech signals. The objectiveof our experiments is to compare the performance of 3machine learning methods on 4 kinds of pathologies andrelate them to the origin feature vector. Performanceevaluation covers 5 main aspects: accuracy, healthyand pathology precision and sensitivity in a healthy andpathology state. The accuracy results of each method arepresented in Table 6.
In the overall analysis, PCA enabled dimensionreduction of up to 14 parameters from a 28-dimensionalspace, depending on the vowel and its pitch, as presentedin Tables 4 and 5. The required number of parameters waschosen to cover at least 90% of the information containedin the signal, in order to make calculations faster (a lowerdimensional space). This method showed mostly the sameresult as the initial 28-parameter vector, and in many caseseven improved the effectiveness of the detection.
In general, the highest pathology detection accuracyrate is shown using the kPCA method and NLPCA, whichmeans that the analysed data are non-linear and bothmethods deal with detection giving promising results,as shown in Table 6. What is more, NLPCA ensureddimension reduction to the same number of parameters(Tables 4 and 5). Going further, usage of kernelprincipal component analysis yielded a visibly higherlevel of accuracy than the initial 28-parameter vectorand linear principal component analysis. There was noresult that was worse than that provided by principalcomponent analysis. The non-linear PCA based on anauto-associative neural network also showed the sametrend as kernel PCA, and it enabled detection of voiceimpairments at the same level as kPCA. The maindifference between kPCA and NLPCA is calculation time,as kPCA was four times shorter than NLPCA.
After analysing the mean accuracy of women for allthe methods for all the vowels and their pitches, the bestresult was achieved by kernel PCA, whereas for men itwas kernel PCA and non-linear PCA. While analysing
which vowel and pitch could detect with the highestaccuracy all the pathologies presented in this paper, it wasnoted that there are vowel i at a normal pitch, u at a lowand normal pitch using the kernel PCA method, voweli at a low pitch and u at a normal pitch using kPCA,and vowel u at a low pitch using NLPCA. The poorestaccuracy for all the analysed methods showed vowel a ata low pitch. Keeping all the vowels and their pitches inthe analysis of laryngitis showed that the highest accuracyof voice pathology detection was by the 28-parameterfeature vector, the PCA method, kPCA for women andby the 28-parameter feature vector, kPCA and NLPCA.In fact, the analysis for which voice pathology showedthe highest level of accuracy is very difficult, because thedifferences between the mean accuracies were up to 1.5%.The results of precision for women (HD) for the initial 28parameters vector, kPCA and NLPCA were between 94and 100% and for PCA between 87 and 100%. For men,all of the methods showed HD of between 90 and 100%.The precision of pathological cases (PD) for women waskept between 94 and 100% for the 28-parameter vector,kPCA and NLPCA and for PCA from between 86 and100%, whilst for men it was between 88 and 100%.The sensitivity for women ranged from 89 and 100%,where the lowest value belonged to PCA. The sensitivitycalculated for men was located between 87 and 100% withthe same trend for PCA. The specificity for women wasbetween 90 and 100% and for men between 90 and 100%.
7. Conclusion
Traditional classification algorithms require the input ofinitial data to be formatted in a data matrix, where thecolumns represent the parameters describing the signal,and the rows represent the observations. We can find in theliterature many types of proposed features describing thehuman voice, which are analysed further using differentprocessing techniques that concentrate on covering moreinformation (Bishop, 2006). Those analysis techniquesprovide a lot of advantages in transforming voice data.Extracting information about the state of a patient’shealth might be challenging while gathering significantinformation from many features.
The goal of this paper was to form amulti-dimensional feature vector with a properclassification that could discriminate between healthyand pathological voices. We created a vector thatconsisted of 28 features and used it for different machinelearning methods such as principal component analysis,kernel principal component analysis and non-linearPCA based on an auto-associative neural network. Thedata set consists of 1342 patients of which half werehealthy individuals. The database included patientssuffering from 4 voice pathologies: functional dysphonia,hyperfunctional dysphonia, laryngitis and vocal fold

Acoustic analysis assessment in speech pathology detection 639
Table 4. Number of principal components covering up to 90% variance for women taken under examination.
number of principal components a h a l a n i h i l i n u h u l u n
functional dysphonia 16 16 16 14 14 14 15 14 15hyperfunctional dysphonia 16 16 16 15 15 14 15 14 14
laryngitis 16 16 16 15 14 14 15 14 14vocal cord paralysis 16 16 16 15 14 14 15 14 14
Table 5. Number of principal components covering up to 90% variance for men taken under examination.
number of principal components a h a l a n i h i l i n u h u l u n
functional dysphonia 16 16 16 14 14 14 15 14 15hyperfunctional dysphonia 16 16 16 15 15 14 15 14 14
laryngitis 16 16 16 15 14 14 15 14 14vocal cord paralysis 16 16 16 15 14 14 15 14 14
paralysis. The analysis was completed separately forrecordings of 3 vowels: a, i, u spoken at 3 differentpitches: high, low and normal, by both women and men.The results from different techniques were subjected to10-fold cross-validation. Results from all the analysiswere put in the confusion matrix, which enabled us tosummarise the detection process.
Principal component analysis was used to extractrelevant information from a huge dataset, by excludinga correlation between the parameters and as a resultobtain reduced dimensions of data. In the end,classification based on a reduced number of principalcomponents showed the very similar level of accuracyto the classification based on the 28 feature vector. Theexperimental results show that the PCA methodologyhelped to reduce the data in an efficient manner and westill had 90% of the variance data. The results did notlose significant signal information. The proof for this isthat PCA achieved an optimal feature subset with a similarclassification accuracy for most analysed vowels at all thevocal pitches for both female and male recordings havinga reduced number of principal components in comparisonwith the 28 parameters vector.
By adding the “kernel trick” with non-linearityand proper sigma to PCA, we scaled the non-linearuncorrelated components to the unit variance. By thisprocess we obtained a complex non-linear whitening(sphering transformation), which was a useful stepfor further classification. The results of kPCA wereslightly better than of PCA analysis and the classificationcompleted for a 28-parameter feature vector. Thedisadvantage of adding the “kernel trick” is still having aninitial number of parameters (28), which required a muchlonger calculation time compared with the PCA method.
In addition, as illustrated through the last experiment,the hierarchical NLPCA method detected pathology invoice analysis with a similar accuracy, precision andsensitivity to kernel PCA, and in a few cases it was even
higher. It enabled us to decompose the data non-linearlyto distinguish application of dimensionality. The ideabehind this approach is that the NLPCA method locatesand eliminates linear and non-linear relationships in thedata and ensures non-linear components have the samehierarchical order as linear components in the standardPCA (Wang, 2012).
The contribution presented in this paper shows thatthe chosen classifying methodology is relevant to thepathology detection process. Acoustic analysis usingproposed parameters can be a useful, objective tool forconfirming the pathological changes of the glottis inthe analysed four types of voice pathology: functionaldysphonia, hyperfunctional dysphonia, laryngitis andvocal fold paralysis.
Acknowledgment
This work was funded by the Ministry of Science andHigher Education in Poland under the Diamond Grantprogram, no. 0136/DIA/2013/42 (AGH 68.68.120.364).
References
Arroyave, J.R.O., Bonilla, J.F.V. and Trejos, E.D. (2012).Acoustic analysis and non linear dynamics applied to voicepathology detection: A review, Recent Patents on SignalProcessing 2(2): 1–11.
Atal, B.S. and Hanauer, S.L. (1971). Speech analysisand synthesis by linear prediction of the speech wave,The Journal of the Acoustical Society of America50(2B): 637–655.
Belafsky, P.C., Postma, G.N., Reulbach, T.R., Holland, B.W. andKoufman, J.A. (2002). Muscle tension dysphonia as a signof underlying glottal insufficiency, Otolaryngology—Headand Neck Surgery 127(5): 448–451.
Bishop, C.M. (2006). Pattern Recognition and Machine Learn-ing, Vol. 1, Springer, New York, NY.

640 D. Panek et al.
Table 6. Detection accuracy of voice pathology for four diseases (functional dysphonia, hyperfunctional dysphonia (hyperfunc. dys-phonia), laryngitis and vocal fold paralysis) for three vowels spoken at three pitches for women and men, based on the initialfeature vector (28 param.) and three machine learning methods expressed as a [%]. The results are compared separately foreach vowel at a different pitch, where a h represents the vowel a at a high pitch, a l is the vowel a at a low pitch, a n is thevowel a at a normal pitch, i h is the vowel i at a high pitch, i l is the vowel i at a low pitch, i n is the vowel i at a normal pitch,u h is the vowel u at a high pitch, u l is the vowel u at a low pitch, u n is the vowel u at a normal pitch.
WOMEN MENfunctional hyperfunc. vocal fold functional hyperfunc. vocal folddysphonia dysphonia laryngitis paralysis dysphonia dysphonia laryngitis paralysis
a h
28 param 93 93 99 95 94 95 96 98PCA 93 92 97 92 91 93 96 98
kPCA 93 93 100 95 92 94 97 98NLPCA 93 100 100 94 95 93 96 98
a l
28 param 92 93 93 94 88 90 90 90PCA 91 89 90 94 87 87 88 91
kPCA 92 99 93 95 88 87 89 91NLPCA 93 100 93 100 93 93 90 95
a n
28 param 94 94 94 93 95 92 93 93PCA 92 92 95 90 95 89 90 92
kPCA 94 97 98 95 98 90 93 94NLPCA 94 94 100 100 96 95 97 94
i h
28 param 94 96 93 94 98 97 93 92PCA 92 96 93 96 99 97 90 90
kPCA 94 100 97 99 100 98 91 92NLPCA 93 93 96 96 96 94 96 96
i l
28 param 97 93 95 95 97 98 98 97PCA 99 92 95 95 97 96 98 95
kPCA 100 93 97 96 99 98 99 96NLPCA 93 93 96 96 96 94 97 95
i n
28 param 95 95 99 97 96 95 96 94PCA 94 95 99 96 95 94 96 92
kPCA 97 99 100 98 96 94 97 94NLPCA 99 93 95 96 97 95 97 94
u h
28 param 97 92 99 96 96 91 95 94PCA 98 93 97 96 97 89 96 93
kPCA 100 95 98 98 97 90 98 95NLPCA 99 95 96 97 97 94 97 94
u l
28 param 99 97 97 97 96 98 94 97PCA 98 98 99 98 93 98 92 97
kPCA 100 100 100 100 94 100 94 99NLPCA 99 98 97 97 97 98 97 98
u n
28 param 97 99 96 98 95 98 99 99PCA 99 99 95 98 94 97 98 97
kPCA 100 100 98 97 95 97 98 97NLPCA 99 99 97 97 94 98 98 97
Brinca, L.F., Batista, A.P.F., Tavares, A.I., Goncalves, I.C.and Moreno, M.L. (2014). Use of cepstral analysesfor differentiating normal from dysphonic voices: Acomparative study of connected speech versus sustainedvowel in European Portuguese female speakers, Journal ofVoice 28(3): 282–286.
Eadie, T.L. and Doyle, P.C. (2005). Classification of dysphonicvoice: Acoustic and auditory-perceptual measures, Journalof Voice 19(1): 1–14.
Engel, Z.W., Klaczynski, M. and Wszolek, W. (2007). Avibroacoustic model of selected human larynx diseases,International Journal of Occupational Safety and Er-gonomics 13(4): 367.
Farrus, M., Hernando, J. and Ejarque, P. (2007). Jitterand shimmer measurements for speaker recognition, An-nual Conference of the International Speech Communi-cation Association (Interspeech 2007), Antwerp, Belgium,pp. 778–781.

Acoustic analysis assessment in speech pathology detection 641
Fong, S., Lan, K. and Wong, R. (2013). Classifying humanvoices by using hybrid SFX time-series preprocessingand ensemble feature selection, BioMed Research Interna-tional 2013:1–27, DOI: 10.1155/2013/720834.
Fraile, R., Saenz-Lechon, N., Godino-Llorente, J., Osma-Ruiz,V. and Fredouille, C. (2009). Automatic detection oflaryngeal pathologies in records of sustained vowels bymeans of mel-frequency cepstral coefficient parametersand differentiation of patients by sex, Folia phoniatrica etlogopaedica 61(3): 146–152.
Fujinaga, I. (1996). Adaptive Optical Music Recognition, Ph.D.thesis, McGill University, Montreal.
Goddard, J., Schlotthauer, G., Torres, M. and Rufiner, H. (2009).Dimensionality reduction for visualization of normal andpathological speech data, Biomedical Signal Processingand Control 4(3): 194–201.
Godino-Llorente, J.I. and Gomez-Vilda, P. (2004). Automaticdetection of voice impairments by means of short-termcepstral parameters and neural network based detectors,IEEE Transactions on Biomedical Engineering51(2): 380–384.
Godino-Llorente, J.I., Gomez-Vilda, P. and Blanco-Velasco, M.(2006a). Dimensionality reduction of a pathological voicequality assessment system based on Gaussian mixturemodels and short-term cepstral parameters, IEEE Trans-actions on Biomedical Engineering 53(10): 1943–1953.
Godino-Llorente, J.I., Saenz-Lechon, N., Osma-Ruiz, V.,Aguilera-Navarro, S. and Gomez-Vilda, P. (2006b). Anintegrated tool for the diagnosis of voice disorders, Medi-cal Engineering & Physics 28(3): 276–289.
Hadjitodorov, S. and Mitev, P. (2002). A computer systemfor acoustic analysis of pathological voices and laryngealdiseases screening, Medical Engineering & Physics24(6): 419–429.
Horii, Y. (1980). Vocal shimmer in sustained phonation,Journal of Speech, Language, and Hearing Research23(1): 202–209.
Hu, H. and Zahorian, S.A. (2008). A neural network basednonlinear feature transformation for speech recognition,9th Annual Conference of the International Speech Com-munication Association (Interspeech 2008), Brisbane, Aus-tralia, pp. 1533–1536.
Huber, J.E., Stathopoulos, E.T., Curione, G.M., Ash, T.A. andJohnson, K. (1999). Formants of children, women, andmen: The effects of vocal intensity variation, The Journalof the Acoustical Society of America 106(3): 1532–1542.
Imai, S. (1983). Cepstral analysis synthesis on the melfrequency scale, IEEE International Conference on Acous-tics, Speech, and Signal Processing, ICASSP’83, Boston,MA, USA, Vol. 8, pp. 93–96.
Jiang, J.J., Diaz, C.E. and Hanson, D.G. (1998). Finite elementmodeling of vocal fold vibration in normal phonationand hyperfunctional dysphonia: Implications for thepathogenesis of vocal nodules, Annals of Otology, Rhinol-ogy and Laryngology 107(7): 603–610.
Joanes, D. and Gill, C. (1998). Comparing measures of sampleskewness and kurtosis, Journal of the Royal Statistical So-ciety: Series D (The Statistician) 47(1): 183–189.
Jothilakshmi, S. (2014). Automatic system to detect the type ofvoice pathology, Applied Soft Computing 21: 244–249.
Lieberman, P. (1963). Some acoustic measures of thefundamental periodicity of normal and pathologiclarynges, The Journal of the Acoustical Society of America35(3): 344–353.
Makhoul, J. (1975). Linear prediction: A tutorial review, Pro-ceedings of the IEEE 63(4): 561–580.
Makki, B., Hosseini, M.N. and Seyyedsalehi, S.A. (2010). Anevolving neural network to perform dynamic principalcomponent analysis, Neural Computing and Applications19(3): 459–463.
Manfredi, C., D’Aniello, M., Bruscaglioni, P. and Ismaelli, A.(2000). A comparative analysis of fundamental frequencyestimation methods with application to pathologicalvoices, Medical Engineering & Physics 22(2): 135–147.
Maran, A. (1983). Description of specific diseases of the larynx,in R. Harden and A. Marcus (Eds.), Otorhinolaryngology,Vol. 4, Springer, Dordrecht, pp. 99–104.
Matassini, L., Hegger, R., Kantz, H. and Manfredi, C. (2000).Analysis of vocal disorders in a feature space, Medical En-gineering & Physics 22(6): 413–418.
Mathieson, L., Hirani, S., Epstein, R., Baken, R., Wood, G.and Rubin, J. (2009). Laryngeal manual therapy: Apreliminary study to examine its treatment effects in themanagement of muscle tension dysphonia, Journal ofVoice 23(3): 353–366.
Mehta, D.D., Deliyski, D.D., Zeitels, S.M., Quatieri, T.F. andHillman, R.E. (2010). Voice production mechanismsfollowing phonosurgical treatment of early glottic cancer,The Annals of Otology, Rhinology, and Laryngology119(1): 1.
Morrison, M.D., Nichol, H. and Rammage, L.A. (1986).Diagnostic criteria in functional dysphonia, The Laryngo-scope 96(1): 1–8.
Nicolosi, L., Harryman, E. and Kresheck, J. (2004). Termi-nology of Communication Disorders: Speech–Language–Hearing, Lippincott Williams & Wilkins, Philadelphia,PA.
Noll, A.M. (1967). Cepstrum pitch determination, The Journalof the Acoustical Society of America 41(2): 293–309.
Oja, E. (2002). Unsupervised learning in neural computation,Theoretical Computer Science 287(1): 187–207.
Rabiner, L.R. and Juang, B.-H. (1993). Fundamentals of SpeechRecognition, Vol. 14, PTR Prentice Hall, EnglewoodCliffs, NJ.
Rachida, D. and Amar, D. (2009). Effects of acousticinteraction between the subglottic and supraglottic cavitiesof the human phonatory system, Canadian Acoustics37(2): 37–43.
Roy, N. (2003). Functional dysphonia, Current Opinion in Oto-laryngology & Head and Neck Surgery 11(3): 144–148.

642 D. Panek et al.
Saenz-Lechon, N., Godino-Llorente, J.I., Osma-Ruiz, V.,Blanco-Velasco, M. and Cruz-Roldan, F. (2006).Automatic assessment of voice quality according tothe GRBAS scale, 28th Annual International Conferenceof the IEEE Engineering in Medicine and Biology Society,EMBS’06, New York, NY, USA, pp. 2478–2481.
Saldanha, J.C., Ananthakrishna, T. and Pinto, R. (2014). Vocalfold pathology assessment using mel-frequency cepstralcoefficients and linear predictive cepstral coefficientsfeatures, Journal of Medical Imaging and Health Informat-ics 4(2): 168–173.
Scholkopf, B., Smola, A. and Muller, K.-R. (1999). Kernelprincipal component analysis, in B. Scholkopf, C.J.C.Burges and A.J. Smola (Eds.), Advances in Ker-nel Methods—Support Vector Learning, MIT Press,Cambridge, MA.
Scholz, M., Fraunholz, M. and Selbig, J. (2008). Nonlinearprincipal component analysis: Neural network models andapplications, in A.N. Gorban et al. (Eds.), Principal Man-ifolds for Data Visualization and Dimension Reduction,Springer, Berlin/Heidelberg, pp. 44–67.
Scholz, M. and Vigario, R. (2002). Nonlinear PCA: Anew hierarchical approach, 10th European Symposium onArtificial Neural Networks (ESANN), Bruges, Belgium,pp. 439–444.
Skalski, A., Zielinski, T. and Deliyski, D. (2008). Analysis ofvocal folds movement in high speed videoendoscopy basedon level set segmentation and image registration, Interna-tional Conference on Signals and Electronic Systems, IC-SES’08, Krakow, Poland, pp. 223–226.
Steinecke, I. and Herzel, H. (1995). Bifurcations in anasymmetric vocal-fold model, The Journal of the Acous-tical Society of America 97(3): 1874–1884.
Sulica, L. and Blitzer, A. (Eds.) (2006). Vocal Fold Paralysis,Springer, Berlin/Heidelberg.
Tadeusiewicz, R., Korbicz, J., Rutkowski, L. and Duch, W.(Eds.) (2013). Neural Networks in Biomedical Engineer-ing, Inzynieria biomedyczna. Podstawy i zastosowania,Vol. 9, Akademicka Oficyna Wydawnicza EXIT, Warsaw,(in Polish).
Tsanas, A. (2013). Acoustic analysis toolkit for biomedicalspeech signal processing: Concepts and algorithms, Mod-els and Analysis of Vocal Emissions for Biomedical Appli-cations 2: 37–40.
Umapathy, K., Krishnan, S., Parsa, V. and Jamieson, D.G.(2005). Discrimination of pathological voices using atime-frequency approach, IEEE Transactions on Biomed-ical Engineering 52(3): 421–430.
Wang, Q. (2012). Kernel principal component analysis and itsapplications in face recognition and active shape models,ARXIV 1207.3538.
Wong, D., Markel, J. and Gray Jr, A. (1979). Least squaresglottal inverse filtering from the acoustic speech waveform,IEEE Transactions on Acoustics, Speech and Signal Pro-cessing 27(4): 350–355.
Yumoto, E., Gould, W.J. and Baer, T. (1982).Harmonics-to-noise ratio as an index of the degreeof hoarseness, The Journal of the Acoustical Society ofAmerica 71(6): 1544–1550.
Zahorian, S. and Hu, H. (2011). Nonlinear Dimensionality Re-duction Methods for Use with Automatic Speech Recogni-tion, Vol. 06, Speech Technologies Source: InTech, Rijeka.
Daria Panek received her diploma in biomedi-cal engineering from the AGH University of Sci-ence and Technology in Cracow in 2013. Atpresent, she is a Ph.D. student of biocybernet-ics and biomedical engineering at AGH. Her re-search includes signal processing, pattern recog-nition, biomedical imaging, medicine and biocy-bernetics.
Andrzej Skalski is an assistant professor at theAGH University of Science and Technology inCracow, Poland. His principal research interestsare in the field of image processing and analysis,in particular segmentation, registration and track-ing algorithms. He has participated in a num-ber of research projects in the biomedical signaland imaging area. He has published about 50 re-search papers.
Janusz Gajda received his M.Sc., Ph.D. andD.Sc. degrees in electrical engineering at theAGH University of Science and Technology, Cra-cow (Poland), in 1978, 1985 and 1993, respec-tively. He is currently a full professor with theDepartment of Measurement and Electronics atAGH and the head of this department. Since 2008he has been a member of the International Soci-ety of Weigh in Motion. Currently he is a topiceditor of the journal Metrology and Measurement
Systems. Professor Gajda’s fields of expertise are electrical metrology,object identification, signal processing, biomedical measurements, mea-surements of road traffic parameters.
Ryszard Tadeusiewicz studied at the Electri-cal Engineering Department of the AGH Univer-sity of Science and Technology in Cracow, fromwhich he graduated (with honours) in 1971. Ad-ditionally, after receiving his degree in automaticcontrol engineering, he studied at the Faculty ofMedicine of the Medical Academy in Cracow,and undertook studies in the field of mathemat-ical and computer methods in economics. Since1971 he has been conducting research in the ar-
eas of bio-cybernetics, automatic control engineering, and computer sci-ence. In 1975 he was awarded the Ph.D. degree, and in 1981 the D.Sc.(habilitation) degree. In 1986 he became a professor and in 1991 a fullprofessor at AGH. His research interests cover neural networks, com-puter vision, biomedical engineering, and distance learning. He haswritten and published over 950 scientific papers, which have appeared

Acoustic analysis assessment in speech pathology detection 643
in prestigious Polish and foreign scientific journals, as well as numer-ous conference presentations, both national and international. Profes-sor Tadeusiewicz has also authored over 90 scientific monographs andbooks, including highly popular, frequently reprinted textbooks. The to-tal number of Ph.D. graduate students supervised: 58, the total number ofgraduate students he has advised as the principal advisor: 228. Electedthree times as the rector of the AGH University, and several times asa member of the Governmental Central Committee for Scientific De-grees and Titles as well as the Ministry Council for Scientific Research.Awarded honorary doctorates by twelve Polish and foreign universities.
Received: 13 June 2014Revised: 23 December 2014Re-revised: 23 March 2015
Related Documents