Welcome message from author
This document is posted to help you gain knowledge. Please leave a comment to let me know what you think about it! Share it to your friends and learn new things together.
Transcript


iii
© MUJAHID OMER SEED AHMED ELOBEID
2016

iv
This thesis is dedicated to my dearest parents, brothers, my beloved fiancée
and my friends
v
ACKNOWLEDGMENTS
Starting in the name of Allah, the most beneficent, the Most Merciful. All the praises glory
and thanks are due to Almighty Allah for bestowing me with the blessings, health,
knowledge, opportunity, courage, guidance and patience to accomplish this work.
Thereafter, acknowledgements are due to King Fahd University of Petroleum and Minerals
(KFUPM) for the support given to pursue my graduate studies.
During this work, my parents were a constant and important source of motivation and
support. My Mother: a strong and gentle soul who taught me to trust in Allah, believe in
hard work and that so much could be done with little. My Father: for earning an honest
living for us and for supporting and encouraging me to believe in myself. Second, special
thanks to my beloved fiancée, words cannot describe how lucky I am to have her in my life
and I look forward to our lifelong journey. Also acknowledges are due to my grandmother
and my aunts for their sacrifice and their financial and moral support for me and my
brothers throughout of our educational journeys.
This work would not have been complete without the support of many people. I would like
to thank my thesis advisor and the director of the Center for Engineering Research Dr. Luai
M. Alhems, for his supervision; his patience, help and support; and for introducing me to
the world of risk assessment. The members of my thesis committee, Dr. Abdelsalam M.
Al-Sarkhi and Dr. Haitham M. Bahaidarah, have generously given their time and expertise
to better my work. I thank them for their contribution and their good-natured support.
Furthermore, many thanks and appreciation to professor Dr. AbdelSalaam M. Al-Sarkhi

vi
for persevering with me as my advisor through out the time it took me to complete this
research and write the thesis.
I gratefully wish to acknowledge the support provided by Saudi Aramco, Dhahran, Saudi
Arabia, for funding this work through project No. CER02386. Also the Center of
Engineering Research (CER) at the Research Institute of King Fahd University of
Petroleum and Minerals, Dhahran, Saudi Arabia is acknowledged, for their technical
supporting to complete this research work.
My thanks must go also to my teamwork members, Mr. Aftab Ahmad, Mr. Syed M.
Shaahid, Mr. Mehaboob Basha and Mr. Mansoor Alam for their continuous technical
support and help received in the experimental work. Especially, I need to express my
gratitude and deep appreciation to Mr. Aftab Ahmad for his continuous and generous help
and support since the beginning of this work. Also for good-natured support and for his
time while persevering with me as his son.
Lastly, but not the least, sincere thanks to my best and dearest of friends Abubakar Mahjoub
and Mohamed Kamal Eldin. Every challenging work needs self-efforts as well as
encouragement, support and guidance of friends especially those who are very close to our
heart. Their example kept me working when I wanted to give up. Abubakar and Mohamed
facilitated my research by assisting my family in my home country when they were in need
of any kind of help. They gave me a new appreciation for the meaning and importance of
friendship. They have consistently helped me keep perspective on what is important in life
and shown me how to deal with reality. The greatest gift I have received in this life is their
unconditional friendship. A friendship, I deeply appreciate, honor and forever proud of.

vii
TABLE OF CONTENTS
ACKNOWLEDGMENTS ................................................................................................ V
TABLE OF CONTENTS ..............................................................................................VII
LIST OF TABLES ............................................................................................................ X
LIST OF FIGURES ........................................................................................................ XI
LIST OF ABBREVIATIONS ..................................................................................... XIX
ABSTRACT XXI
XXIII
CHAPTER 1 INTRODUCTION ......................................................................................1
1.1 Background ..................................................................................................................................... 1
1.2 Thesis Objectives .......................................................................................................................... 10
1.3 Outline of the Thesis .................................................................................................................... 11
CHAPTER 2 LITERATURE REVIEW ........................................................................12
2.1 Two phase (Oil-Water) flow ......................................................................................................... 14
2.2 Two Phase (Liquid-Gas) Flow through Venturi Meter ............................................................... 17
CHAPTER 3 EXPERIMENTAL SETUP AND PROCEDURE .................................25
3.1 Experimental Setup ....................................................................................................................... 25
3.2 Experimental Procedure ................................................................................................................ 38
CHAPTER DATA ANALYSIS AND UNCERTAINTY ANALYSIS ......................45
4.1 Validation of the Experimental Results .......................................................................................... 45

viii
4.2 Determination of Modified Venturi Discharge Coefficient, k ......................................................... 51
4.3 Determination of Venturi Discharge Coefficient, Cd ....................................................................... 53
4.4 Correlations of Venturi Pressure Coefficient, Cpm .......................................................................... 54
4.5 Uncertainty Analysis ...................................................................................................................... 58
CHAPTER 5 RESULTS AND DISCUSSIONS ............................................................73
5.1 Effect of Fluid Mixture Flow Rate on Venturi Pressure Drop for Different Water Cuts for Oils D80 and D130 ................................................................................................................................ 73
5.2 Effect of Water Cut on Venturi Pressure Drop for Different Fluid Mixture Flow Rates for Oils D80 and D130 ................................................................................................................................ 83
5.3 Effect of Flow Loop Inclination on Venturi Pressure Drop for Different Fluid Mixture Flow Rates for Oils D80 and D130 .......................................................................................................... 92
5.4 ................. 100
5.5 Effect of Oil Viscosity on Venturi Pressure Drop Measurements .................................................. 102
5.6 Calculations of Modified Venturi Discharge Coefficient, k, for Oils D80 and D130 ....................... 104
5.7 Calculations of Venturi Discharge Coefficient, Cd, for Oils D80 and D130 ..................................... 112
5.8 Correlations for Venturi Pressure Coefficient, Cpm....................................................................... 117
5.8.1 Results of Correlations Input Variables Reduction ....................................................................... 125
CHAPTER 6 CONCLUSIONS AND RECOMMENDATIONS ...............................132
6.1 Conclusios ................................................................................................................................... 132
6.2 Recommendations ...................................................................................................................... 135
REFERENCES 137
APPENDICES 141
APPENDIX A UNCERTAINTY ANALYSIS .............................................................142
APPENDIX B RESULTS OF THE MODIFIED VENTURI DISCHARGE COEFFICIENT, K ..............................................................................163
ix
APPENDIX C RESULTS OF THE VENTURI DISCHARGE COEFFICIENT, CD ..........................................................................................................172
VITAE 178

x
LIST OF TABLES
Table 3.1: List of instruments used in the oil-water flow experiments. ........................... 27
Table 3.2: Specifications of the inclinable flow loop test section pipe. ........................... 33
Table 3.3: Specifications of Tercom flanged machined venturi meters. .......................... 35
Table 3.4: Physical properties of the mineral oils D80 and D130 (ExxonMobil chemical 2014) [21]. ....................................................................................... 36
Table 3.5: Physical properties of the potable water. ......................................................... 37
Table 3.6: Matrix of multiphase flow experiments conducted for oil D80. ..................... 41
Table 3.7: Matrix of multiphase flow experiments conducted for oil D130. ................... 42
Table 4.1: Coverage factor versus confidence level (CL) 62
Table 5.1: Average modified discharge coefficient and percentage error in the fluid mixture flow of oil D80 for the three venturi meters .108
Table 5.2: Average modified discharge coefficient and percentage error in the fluid mixture flow of oil D130 for the three venturi meters. ................................. 112
Table 5.3: The statistical analyses for oils (D80 and D130) correlations. ...................... 118
Table 5.4: Comparison between measured and predicted average values of the mixture venturi pressure coefficient Cpm for homogeneous fluid mixture density of oil D80 data ..............................................................................122
Table 5.5: Comparison between measured and predicted average values of the mixture venturi pressure coefficient Cpm for homogeneous fluid mixture density of oil D130 data. .............................................................................. 124
Table 5.6: The statistical analyses for oils (D80 and D130) correlation, (5.3). .............. 126

xi
LIST OF FIGURES
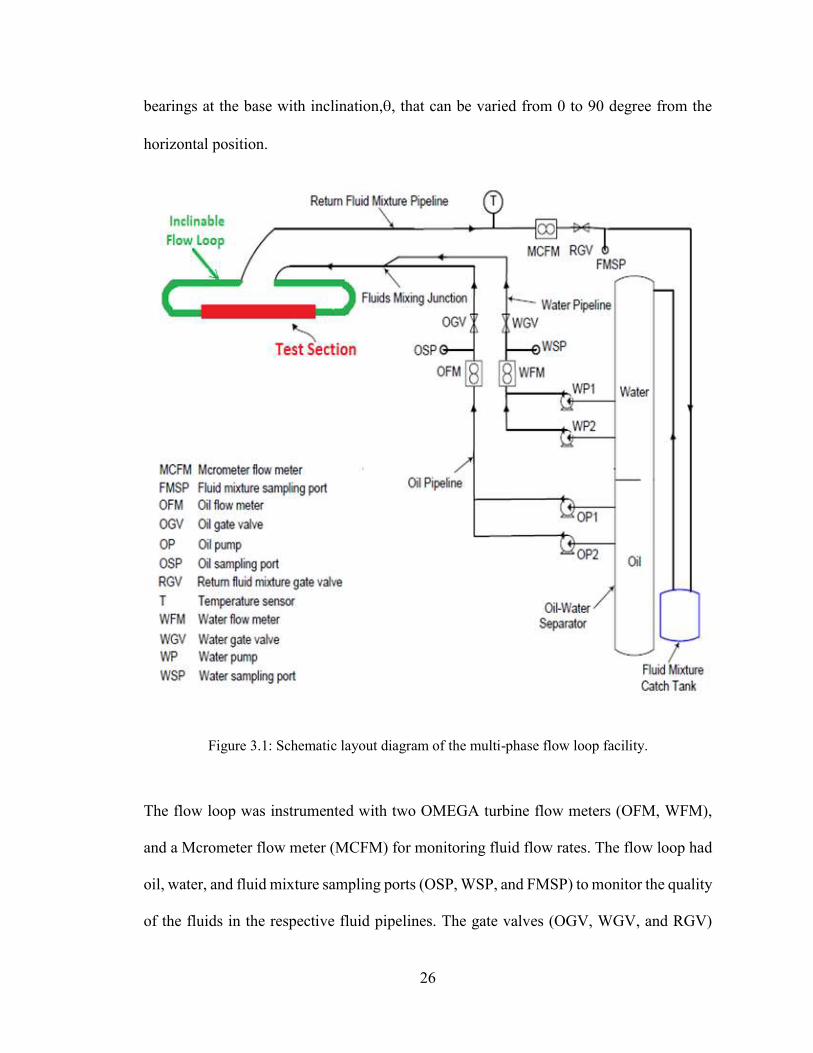
Figure 3.1: Schematic layout diagram of the multi-phase flow loop facility. .................. 26
Figure 3.2: Oil-water cylindrical gravity separator. .......................................................... 28
Figure 3.3: Oil and water pumps with induction motors. ................................................. 28
Figure 3.4: Close-up view for the catch tank to suppress the fluid momentum. .............. 29
Figure 3.5: Close-up view for the rectangular channel. .................................................... 29
Figure 3.6: Oil and water turbine flow meters (blue colored) used in the experimental work. .............................................................................................................. 30
Figure 3.7: Mcrometer flow meter (MCFM) for monitoring of the fluids flow rate, and the return gate valve (RGV) to avoid suction at the venturi throat. ....... 30
Figure 3.8: Close- ........................ 31
Figure 3.9: Close- ............................ 31
Figure 3.10: Control room of the multiphase flow loop. .................................................. 32
Figure 3.11: Control panel of the multiphase flow loop. .................................................. 32
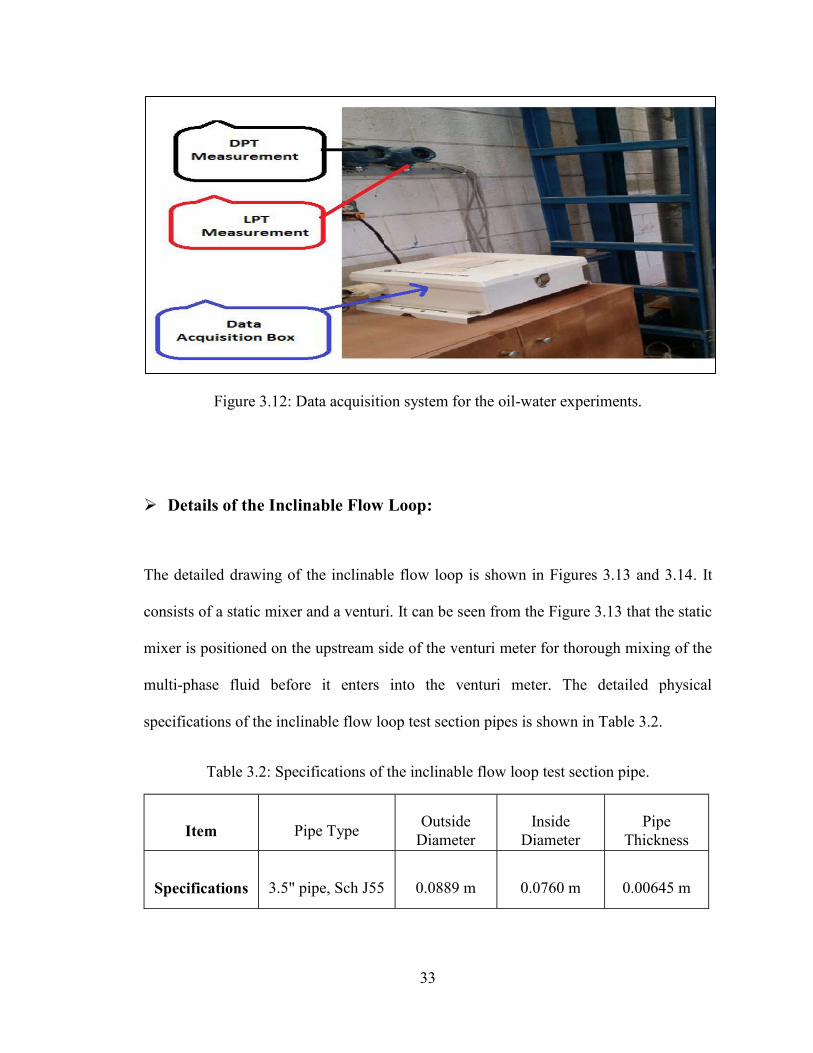
Figure 3.12: Data acquisition system for the oil-water experiments. ............................... 33
J55and a venturi meter. ................................................................................ 34
Figure 3.14: Side - and a venturi meter....................................................................................... 34
Figure 3.15: Details of the test section showing the venturi meter. .................................. 35 Figure 3.16a: Close-up view of the transparent widow when the emulsion of (oil and
water) formed. ............................................................................................ 43
Figure 3.16b: Close-up view of the gravity separator (Inside of the tank) when the emulsion formed at temperature (T= 24 ºC)............................................... 44
Figure 3.16c: Close-up view of the emulsion samples at glass flasks when formed at temperature (T= 27 ºC). ............................................................................ 44
xii
Figure 4.1a: Validation of single phase oil D80 and water experiments for venturi 0.4 for horizontal position of the flow loop. ...................................................... 48
Figure 4.1b: Validation of single phase oil D80 and water experiments for venturi 0.5 for horizontal position of the flow loop. ...................................................... 48
Figure 4.1c: Validation of single phase oil D80 and water experiments for venturi 0.6 for horizontal position of the flow loop. ...................................................... 49
Figure 4.1d: Validation of single phase oil D130 and water experiments for venturi 0.4 for horizontal position of the flow loop. ...................................................... 49
Figure 4.1e: Validation of single phase oil D130 and water experiments for venturi 0.5 for horizontal position of the flow loop. ...................................................... 50
Figure 4.1f: Validation of single phase oil D130 and water experiments for venturi 0.6 for horizontal position of the flow loop. ...................................................... 50
Figure 4.2a: Aphotograph of the main window of the DataFit software. ......................... 55
Figure 4.2b: Aphotograph of the window of detailed numerical results of the DataFit software. ....................................................................................................... 56
Figure 4.3a: Random uncertainty versus water cut for different fluid mixture flow rates
0.4, oil D80 and potable water). ................................................. 64
Figure 4.3b: Random uncertainty versus water cut for different fluid mixture flow rates for 90 ............................................... 64
Figure 4.3c: Random uncertainty versus water cut for different fluid mixture flow rates ................................................. 65
Figure 4.3d: Random uncertainty versus water cut for different fluid mixture flow rates ............................................... 65
Figure 4.3e: Random uncertainty versus water cut for different fluid mixture flow rates ............................................... 66
Figure 4.3f: Random uncertainty versus water cut for different fluid mixture flow rates ............................................... 66
Figure 4.3g: Random uncertainty versus water cut for different fluid mixture flow rates ................................................. 67
Figure 4.3h: Random uncertainty versus water cut for different fluid mixture flow rates ............................................... 67

xiii
Figure 4.4a: Random uncertainty versus water cut for different fluid mixture flow rates ............................................... 68
Figure 4.4b: Random uncertainty versus water cut for different fluid mixture flow rates ............................................. 69
Figure 4.4c: Random uncertainty versus water cut for different fluid mixture flow rates ............................................... 69
Figure 4.4d: Random uncertainty versus water cut for different fluid mixture flow rates ............................................. 70
Figure 4.4e: Random uncertainty versus water cut for different fluid mixture flow rates ............................................... 70
Figure 4.4f: Random uncertainty versus water cut for different fluid mixture flow rates ............................................. 71
Figure 5.1a: Venturi pressure drop versus fluid mixture flow rate for different water
.................................. 74
Figure 5.1b: Venturi pressure drop versus fluid mixture flow rate for different water d potable water). ................................ 75
Figure 5.1c: Venturi pressure drop versus fluid mixture flow rate for different water = 0.5, oil D80 and potable water). .................................. 75
Figure 5.1d: Venturi pressure drop versus fluid mixture flow rate for different water ................................ 76
Figure 5.1e: Venturi pressure drop versus fluid mixture flow rate for different water ................................ 76
Figure 5.1f: Venturi pressure drop versus fluid mixture flow rate for different water ................................ 77
Figure 5.1g: Venturi pressure drop versus fluid mixture flow rate for different water .................................. 77
Figure 5.1h: Venturi pressure drop versus fluid mixture flow rate for different water ................................ 78
Figure 5.1i: Venturi pressure drop versus fluid mixture flow rate for different water ................................ 79
Figure 5.1j: Venturi pressure drop versus fluid mixture flow rate for different water .............................. 79
xiv
Figure 5.1k: Venturi pressure drop versus fluid mixture flow rate for different water ................................ 80
Figure 5.1l: Venturi pressure drop versus fluid mixture flow rate for different water ter). .............................. 80
Figure 5.1m: Venturi pressure drop versus fluid mixture flow rate for different water D130 and potable water). ............................... 81
Figure 5.1n: Venturi pressure drop versus fluid mixture flow rate for different water .............................. 81
Figure 5.2a: Venturi pressure drop versus water cut for different fluid mixture flow
................................. 84
Figure 5.2b: Venturi pressure drop versus water cut for different fluid mixture flow ............................... 84
Figure 5.2c: Venturi pressure drop versus water cut for different fluid mixture flow ................................. 85
Figure 5.2d: Venturi pressure drop versus water cut for different fluid mixture flow ............................... 85
Figure 5.2e: Venturi pressure drop versus water cut for different fluid mixture flow ............................... 86
Figure 5.2f: Venturi pressure drop versus water cut for different fluid mixture flow ............................... 86
Figure 5.2g: Venturi pressure drop versus water cut for different fluid mixture flow ). ................................. 87
Figure 5.2h: Venturi pressure drop versus water cut for different fluid mixture flow and potable water). ............................... 87
Figure 5.2i: Venturi pressure drop versus water cut for different fluid mixture flow ................................. 88
Figure 5.2j: Venturi pressure drop versus water cut for different fluid mixture flow ............................... 89
Figure 5.2k: Venturi pressure drop versus water cut for different fluid mixture flow ............................. 90
Figure 5.2l: Venturi pressure drop versus water cut for different fluid mixture flow ............................... 90
xv
Figure 5.2m: Venturi pressure drop versus water cut for different fluid mixture flow ............................ 91
Figure 5.3a: Venturi pressure drop versus flow loop inclination for different fluid
, oil D130 and potable water). ... 93
Figure 5.3b: Venturi pressure drop versus flow loop inclination for different fluid mixture flo 94
Figure 5.3c: Venturi pressure drop versus flow loop inclination for different fluid
water). .......................................................................................................... 94
Figure 5.3d: Venturi pressure drop versus flow loop inclination for different fluid
water).. ........................................................................................................... 95
Figure 5.3e: Venturi pressure drop versus flow loop inclination for different fluid
water).. ......................................................................................................... 95
Figure 5.3f: Venturi pressure drop versus flow loop inclination for different fluid
water).. ......................................................................................................... 96
Figure 5.3g: Venturi pressure drop versus flow loop inclination for different fluid
water). .......................................................................................................... 96
Figure 5.3h: Venturi pressure drop versus flow loop inclination for different fluid mixture ................ 97
Figure 5.3i: Venturi pressure drop versus flow loop inclination for different fluid .... 98
Figure 5.3j: Venturi pressure drop versus flow loop inclination for different fluid ... 98
Figure 5.3k: Venturi pressure drop versus flow loop inclination for different fluid ... 99
Figure 5.4a: Venturi pressure drop for different beta ratios for a fixed flow rate of
6000 bpd for different and potable water). ....................................................................................................... 101
Figure 5.4b: Venturi pressure drop for different beta ratios for a fixed flow rate of
water). ........................................................................................................ 101
xvi
Figure 5.5: Variation of kinematic viscosity for Exxsol (D80 & D130) oils against
temperature, [47] (Measurement done at Research Institute, RI in KFUPM). ................................................................................................. 103
Figure 5.6a: Experimental values of k versus water cuts for different fluid mixture
.......................... 105
Figure 5.6b: Percentage error in the total flow rate using single value of k = 3.73 m2 .................. 105
Figure 5.6c: Experimental values of k versus water cuts for different fluid mixture .......................... 106
Figure 5.6d: Percentage error in the total flow rate using single value of k = 5.93 m2 ater). .................. 106
Figure 5.6e: Experimental values of k versus water cuts for different fluid mixture oil D80 and potable water)............................. 107
Figure 5.6f: Percentage error in the total flow rate using single value of k = 8.75 m2 .................. 107
Figure 5.6g: Experimental values of k versus water cuts for different fluid mixture ........................ 109
Figure 5.6h: Percentage error in the total flow rate using single value of k = 3.75 m2 ................ 109
Figure 5.6i: Experimental values of k versus water cuts for different fluid mixture ........................ 110
Figure 5.6j: Percentage error in the total flow rate using single value of k = 5.90 m2 ................ 110
Figure 5.6k: Experimental values of k versus water cuts for different fluid mixture .......................... 111
Figure 5.6l: Percentage error in the total flow rate using single value of k = 8.78 m2 .............. 111
Figure 5.7a: Experimental venturi discharge coefficient, Cd, versus water cut for
.. 113
Figure 5.7b: Experimental venturi discharge coefficient, Cd, versus water cut for water). .. 114

xvii
Figure 5.7c: Experimental venturi discharge coefficient, Cd, versus water cut for high fluid mixture flow rate . 114
Figure 5.7d: Experimental venturi discharge coefficient, Cd, versus water cut for 115
Figure 5.7e: Experimental venturi discharge coefficient, Cd, versus water cut for ....... 115
Figure 5.7f: Experimental venturi discharge coefficient, Cd, versus water cut for . 116
Figure 5.8a: Comparison between measured and calculated mixture venturi pressure
coefficient based on correlation of oil D80. ............................................... 119
Figure 5.8b: Comparison between measured and calculated mixture venturi pressure coefficient based on correlation of oil D130. ............................................. 119
Figure 5.9a: Measured and calculated mixture venturi pressure coefficient versus
mixture Re and potable water]. ..................................................................................... 120
Figure 5.9b: Measured and calculated mixture venturi pressure coefficient versus
and potable water]. ..................................................................................... 121
Figure 5.9c: Measured and calculated mixture venturi pressure coefficient versus
and potable water]. ..................................................................................... 121
Figure 5.9d: Measured and calculated mixture venturi pressure coefficient versus mixture Reynolds number [Correlation (5.2 and potable water]. ...................................................................................... 122
Figure 5.9e: Measured and calculated mixture venturi pressure coefficient versus
and potable water]. ...................................................................................... 123
Figure 5.9f: Measured and calculated mixture venturi pressure coefficient versus mixture Reyno and potable water]. ...................................................................................... 123
Figure 5.10a: Comparison between measured and calculated mixture venturi pressure
coefficient for complete data sets of oils (D80 and D130) for WC0%. ... 127
Figure 5.10b: Comparison between measured and calculated mixture venturi pressure coefficient for complete data sets of oils (D80 and D130) for WC20%. . 128
xviii
Figure 5.10c: Comparison between measured and calculated mixture venturi pressure coefficient for complete data sets of oils (D80 and D130) for WC40%. . 128
Figure 5.10d: Comparison between measured and calculated mixture venturi pressure coefficient for complete data sets of oils (D80 and D130) for WC60%. . 129
Figure 5.10e: Comparison between measured and calculated mixture venturi pressure coefficient for complete data sets of oils (D80 and D130) for WC80%. 129
Figure 5.10f: Comparison between measured and calculated mixture venturi pressure coefficient for complete data sets of oils (D80 and D130) for WC100%. 130

xix
LIST OF ABBREVIATIONS
k Modified venturi discharge coefficient, m2.s/h
Venturi beta ratio
At Venturi throat cross sectional area, m2
Ap Pipe cross-sectional area, m2
D or Dh Hydraulic diameter, m
Cd Venturi discharge coefficient
Cpm Mixture venturi pressure coefficient
Water volume fraction or water cut
Qm Mixture flow rate, m3/h
Qmeas Measured fluid mixture flow rate, m3/h
Qcal Calculated fluid mixture flow rate, m3/h
Inclination angle, degrees
Vm Mixture average velocity at venturi inlet, m/s
Rem Mixture Reynolds number
xx
Greek Symbols
Venturi pressure drop, Pa
Mixture kinematic viscosity, m2/s
Mixture dynamic viscosity, Pa.s
Water dynamic viscosity, Pa.s
Oil dynamic viscosity, Pa.s
m Fluid (or Liquid) mixture density, kg/m3
Subscripts
o Oil
w Water
m Mixture
t Venturi throat
p Pipe

xxi
ABSTRACT
Full Name : MUJAHID OMER SEED AHMED ELOBEID
Thesis Title : EFFECT OF INCLINATION, WATER CUT, BETA RATIO AND VISCOSITY ON VENTURI PRESSURE DROP MEASUREMENTS FOR OIL-WATER FLOW EXPERIMENTS
Major Field : MECHANICAL ENGINEERING
Date of Degree : December 2016
The performances of the venturi meters for oil-water flow under real oil well operating
conditions were investigated in the present experimental investigation. The pressure drop
measurements were studied in Tercom flanged machined venturi meters with a beta ratio
-water two-phase flow experiments in a 0.0762 m (3-inch) pipe.
The experimental data for different fluid mixture flow rates and water cuts was acquired
using a two-phase, large-scale inclinable flow loop. Potable water and Exxsol mineral oils
(D80 and D130) were used for the single-phase and two-phase oil-water experiments for
the three venturi meters. The experiments were conducted for water cuts varying from 0%
to 100% in steps of 20%, flow rates ranging from 2,000 barrels per day (bpd) to 12,000
bpd, and for different flow loop inclinations from horizontal to vertical positions (0°, 40º,
60º and 90°). Field flow rates were matched by selecting test liquid flow rates
representative of those in real oil wells.
The experimental results showed that the venturi pressure drop varies parabolically with
fluid flow rate for given water cut through the venturi meters studied. For given flow rate
and water cut, the venturi pressure drop is inversely proportional to the venturi ; however,
the venturi pressure drop varies almost linearly with the water cut for a given fluid flow
rate. Within the range of test fluid flow rates, the venturi pressure drop measurements were
xxii
unaffected by the oils (D80 and D130) viscosities and the inclination of the three venturi
meters studied in the flow loop. This is very important from an application standpoint. A
new modified venturi coefficient, k, which is a function of pressure losses and geometry,
was defined and its value obtained from the oil-water two-phase flow experiments.
Furthermore, different empirical correlations were developed to predict the mixture venturi
pressure coefficient Cpm. The correlations showed very high accuracy and low discrepancy
in predictions. In this study, attention was focused on the variables affecting the
performance of the venturi meter for oil-water flow under real oil wells operating
conditions.

xxiii
TERCOM
0.40.50.6
D80D130
Exxsol
º60º
D80D
k
Cpm

xxiv
.

1
CHAPTER 1
INTRODUCTION
1.1 Background
The term of multiphase flow is used to refer to flow of any fluid consisting of more than
one phase or component with different chemical properties through a pipe or channel
simultaneously. Lately Professor Shao Lee Soo of the University of Illinois (1965) coined
the term multiphase flow and it comprises of fluid dynamics motion of multiple phases.
In fact, this can be defined as the concurrent phase flow of different materials, the
numerous phases of the same material or the same material phase, but with varying
materials, or particle sizes with different chemical characteristics, Maksimovic (2005) [1].
Multi-phase flow is to be distinguished from multi-
formulation when all components of various materials are mixed at the same molecular
level, velocity and temperature" (Maksimovic 2005) [1].
Multi-phase flows are of large practical attention in a huge number of different
engineering disciplines, including the mechanical, chemical, nuclear, petroleum and civil
fields. Multiphase flows are commonly came across during all the production and
processing stages in the oil and gas industry fields. The complex nature of two-phase flow
is due to the existence of multiple, deformable and moving interface (s). The main
difference between single phase and multiphase flow through pipes exist in the being of

2
diverse flow configurations or flow patterns, which differ from each other in the spatial
distribution of the interface. For a given two-phase flow system the existing of flow
pattern depends on the operational parameters (liquid and gas flow rates, temperature and
pressure), the geometrical variables (pipe diameter, roughness and inclination angle), and
the physical properties of the two phases (gas and liquid densities, viscosities and surface
tension).
Liquid-Liquid Two-Phase Flows:
Liquid-liquid flows have many important applications in a diverse range of process
industries in the petroleum production particularly, where oil and water are often produced
and transported together. Two-phase flow of oil and water is commonly monitored in
wellbores, and its behavior under an extensive range of flow conditions and angles of
inclination constitutes a pertinent unresolved issue for the petroleum industry. However,
despite their importance, such flows have not been explored to the same extent of the gas-
liquid flows. The flow oil and water is a limiting case of the more general case of three-
phase flow, and is usually associated with wells producing from under saturated reservoirs
with water-flooding operations and with active aquifers. As a result, the most common
predictive theories for pressure gradient that are used in liquid-liquid flows are
developments of models created for gas-liquid flows. A pressure drop in horizontal and
inclinable wells will always occur as a necessity for flow. Although the main application
of such flows has been in the transport of oil-water mixtures in steel pipelines, most of the
experimental work has been carried out in glass or acrylic pipes. These of course have

3
many advantages of being transparent, allowing the flow to be observed, their wall
properties (roughness and wettability) may be very different to those of steel tubes and
this may affect the design parameters such as the pressure drop. In the literature evidence
found indicates that precise knowledge of the patterns of oil-water flow, their ranges of
existence as a function of phases flow rates and inclination angles of the pipe, and values
for their associated hydrodynamic parameters (holdup and pressure gradient).
Oil-Water Two-Phase Flow:
Multiphase flow is commonly seen in industrial processes such as pipeline transportation,
fluidized beds and power plants. A typical multiphase oil water two-phase flow is often
encountered in petroleum industries, and measuring their process parameters (especially
individual flow rate of oil and water) is an important issue in oil exploitation and
transportation. The process parameters of the most interests in oil water two phase flow
are the flow rate (by volume or mass) of each individual phase, especially of oil. Accurate
and cost-effective means for measuring gas flows is a matter of concern for a wide range
of upstream oil and gas measurement applications. While measuring dry gas flow rate is
a well-served application for a wide range of gas flow metering technologies, accurate and
cost-effective measurement of wet gas flow remains a long-standing multiphase flow
measurement challenge for the upstream oil and gas industry. Differential pressure flow
meters such as the Venturi, standard concentric orifice plate, V-cone, and wedge are
popular for these Compared with other kinds of differential pressure (DP) devices, Venturi
has little influence on flow patterns, the smallest pressure loss, and the shortest straight

4
pipe upstream and downstream. Considering the great technical importance as well as
pure scientific interest, the Venturi meter has been widely used in gas liquid two-phase
flow measurement applications.
Venturi Flow Meter (VFM):
A flow meter is an instrument for measuring rate of flow of a fluid. The study of flow
meters and their capabilities for measuring mass flow rates for single-phase flows has
been the subject of research for the past two hundred years. In response to there being an
increased need for accurate flow measurements of viscous fluids through various types of
differential pressure flow meters, experimental study was conducted to more accurately
define the characteristics of the discharge coefficient, (Cd) at high Reynolds numbers.
Accurate flow measurement is one of the greatest concerns among many industries,
because uncertainties in product flows can cost companies considerable profits.
Differential pressure meters are popular for these applications because they are relatively
inexpensive and produce reliable results.
The venturi is a device that allows determination of flow rate by measurement of a
pressure differential brought about by a velocity change due to a change in area. Mr.
Clemens M. Herschel (1881) used venturi's concept of conical reducing and expanding
tubes for measuring water flow rates [2]. The venturi flow meter obtains a pressure
differential by constricting the flow area and therefore increasing the velocity at the

5
meter measurement has become a key technology in the oilfield development especially
in a downhole.
In many difference scientific research and industrial fields, a venturi meter was applied
successfully in the single-phase flow as a measurement device. The venturi meter device
can easily be considered for measurement of two-phase flow applications, just according
to its successful applications in the cases of single-phase flows. Multiphase flow is
common occurrence in venture meters specifically in downhole and upstream pipelines.
Pressure is the main key parameter for assessing individual phase (oil-water) flow rates in
pipelines, which include venturi meters for the pressure measurements.
Pressure Drop:
Pressure drop is the difference in static pressure between two location points of the fluid
flow and it called pressure gradient when represents the pressure drop per unit length along
the pipe. A pressure drop in horizontal and inclinable wells will always occur as a flow
necessity.
Analogously in multiphase flow, probably the key toward understanding the phenomena
of pressure drop behavior in oil field industries in order to optimize between the huge
costs of production and transportation. There remain many challenges associated with an
understanding of multiphase flow pressure drop in production wells and transportation
pipelines. Therefore, it is more important to study behavior of pressure drop measurement
6
response to characterize the flow of two immiscible liquids (oil-water) through venturi
meter in upstream and inclined production pipelines.
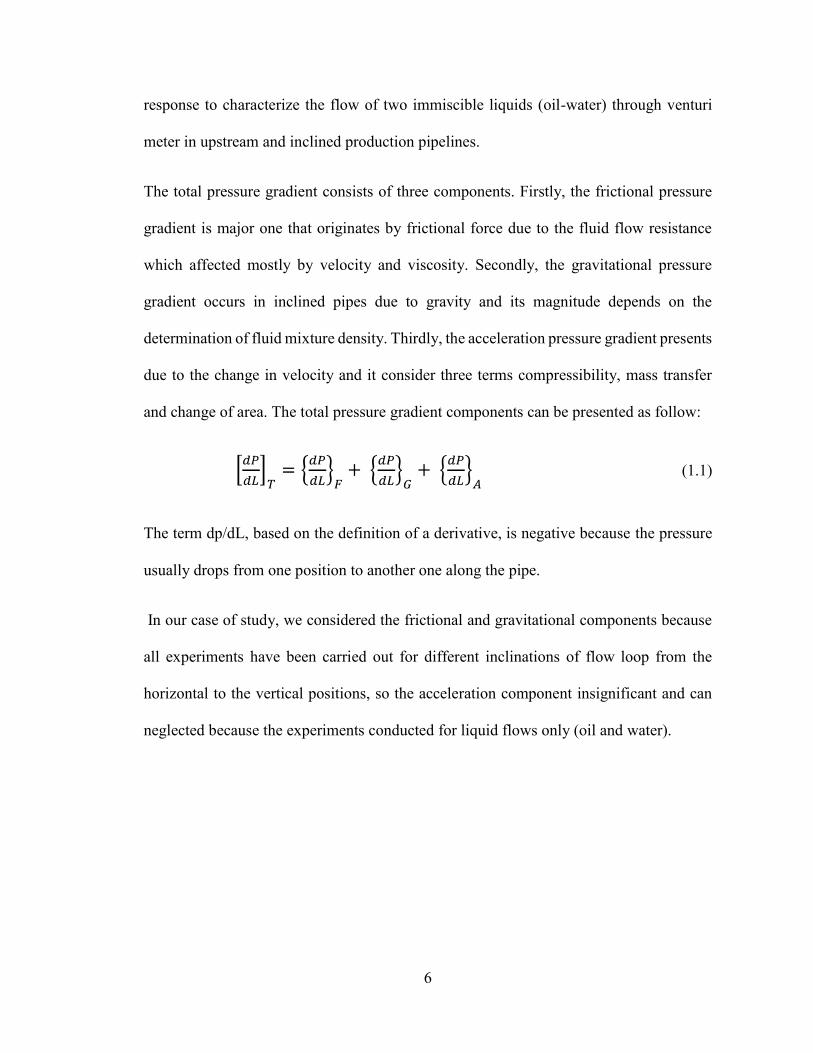
The total pressure gradient consists of three components. Firstly, the frictional pressure
gradient is major one that originates by frictional force due to the fluid flow resistance
which affected mostly by velocity and viscosity. Secondly, the gravitational pressure
gradient occurs in inclined pipes due to gravity and its magnitude depends on the
determination of fluid mixture density. Thirdly, the acceleration pressure gradient presents
due to the change in velocity and it consider three terms compressibility, mass transfer
and change of area. The total pressure gradient components can be presented as follow:
(1.1)
The term dp/dL, based on the definition of a derivative, is negative because the pressure
usually drops from one position to another one along the pipe.
In our case of study, we considered the frictional and gravitational components because
all experiments have been carried out for different inclinations of flow loop from the
horizontal to the vertical positions, so the acceleration component insignificant and can
neglected because the experiments conducted for liquid flows only (oil and water).

7
Problem Definition and Study Motivation:
Multiphase flow is a complex phenomenon involving simultaneous flow of two or more
physically immiscible fluids (such as: oil and water) in pipelines. Oil-water two-phase
flows are often encountered in petroleum, chemical and petrochemical industries. The
physical understanding of two-phase flow characteristics in pipes is of importance since
significant savings in pumping power can be derived from the water-lubricated
transportation of crude oil. The process parameters of most interest in oil water two-phase
flow is the flow rate (by volume or mass) of each individual phase. Measurement of the
process parameters (especially individual flow rate of oil and water) is important in oil
exploitation and transportation.
The accurate flow measurement of multi-phase flows is an important task in oil industries.
Unlike the measurement of single-phase flows using differential pressure meters, multi-
phase flow behavior poses difficulties in accurate measurement. The measurement of
phase flow rates is of particular importance for managing oil production, water disposal
and/or water reinjection. Also, the widespread occurrence of multiphase flows in pipelines
has motivated extensive research in this area. Knowledge of the friction loss (associated
with especially individual flow rate of oil and water) in oil-water flows in pipelines is
essential in order to specify the size of the pump required to pump the emulsions. Pressure
drop is the key parameter for assessing individual phase (oil and water) flow rates in
8
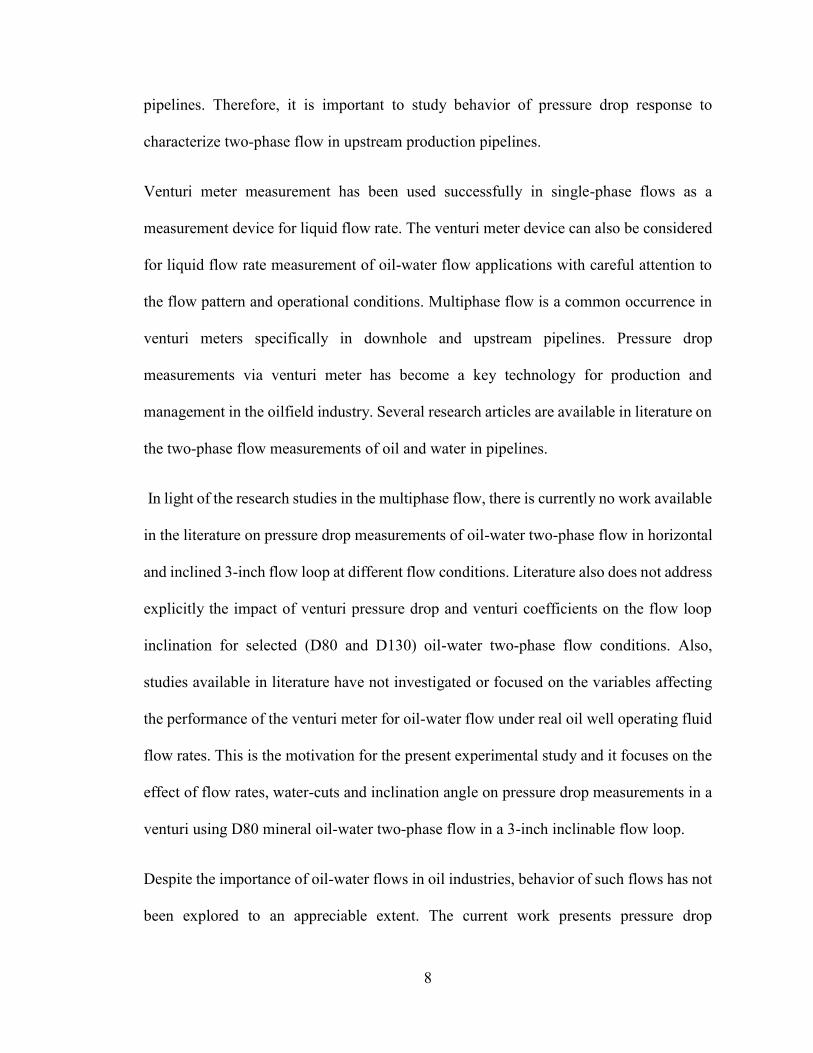
pipelines. Therefore, it is important to study behavior of pressure drop response to
characterize two-phase flow in upstream production pipelines.
Venturi meter measurement has been used successfully in single-phase flows as a
measurement device for liquid flow rate. The venturi meter device can also be considered
for liquid flow rate measurement of oil-water flow applications with careful attention to
the flow pattern and operational conditions. Multiphase flow is a common occurrence in
venturi meters specifically in downhole and upstream pipelines. Pressure drop
measurements via venturi meter has become a key technology for production and
management in the oilfield industry. Several research articles are available in literature on
the two-phase flow measurements of oil and water in pipelines.
In light of the research studies in the multiphase flow, there is currently no work available
in the literature on pressure drop measurements of oil-water two-phase flow in horizontal
and inclined 3-inch flow loop at different flow conditions. Literature also does not address
explicitly the impact of venturi pressure drop and venturi coefficients on the flow loop
inclination for selected (D80 and D130) oil-water two-phase flow conditions. Also,
studies available in literature have not investigated or focused on the variables affecting
the performance of the venturi meter for oil-water flow under real oil well operating fluid
flow rates. This is the motivation for the present experimental study and it focuses on the
effect of flow rates, water-cuts and inclination angle on pressure drop measurements in a
venturi using D80 mineral oil-water two-phase flow in a 3-inch inclinable flow loop.
Despite the importance of oil-water flows in oil industries, behavior of such flows has not
been explored to an appreciable extent. The current work presents pressure drop

9
measurements in a Tercom flanged machined venturi meter with beta ratios of 0.4, 0.5
and 0.6. The oils (D80 and D130)-water two-phase flow was run in a 0.0762 m (3-inch)
diameter inclinable flow loop for different water cuts and fluid mixture flow rates. The
present study considers investigation of effect of four parameters including: (mixture
viscosity, venturi beta ratio, inclination and water cut) on the venturi discharge coefficient,
Cd. The findings of the study will be helpful in mitigating the pressure drop measurement
problems of petroleum industries.

10
1.2 Thesis Objectives
The main objective of this research is to investigate the multiphase flow of oil and water
through venturi meter.
Oil and water flow in venturi meter were analyzed experimentally to investigate the
following parameters:
1. Effect of water fraction (water cut) on the venturi pressure drop measurements.
2. Effect of mixture viscosity on the venturi pressure drop measurements.
3. Effect of venturi beta ratios on the pressure drop measurements.
4. Effect of orientation on the venturi pressure drop measurements.
To meet the above objectives:
1. To present the effect of water fraction, a ranging from 0 to 100% in step of 20%, was
applied for flow rates varying between 2000 and 12000 bpd with step of 2000 bpd.
2. Two different types of mineral oils were used (D80 and D130) to study the effect of
mixture viscosity on the venturi pressure drop measurements and its behavior.
3.
to show the effect beta size on the pressure drop measurements.
4. The flow loop was installed with associated electrical induction motor as a prime
mover to provide the required inclination form horizontal to vertical situation.

11
1.3 Outline of the Thesis
The thesis is organized into six chapters. The introductory part and the objectives of
present work are given in chapter 1. In addition, it includes background about multiphase
flow and information about liquid-liquid two-phase flows, oil-water two-phase flow,
venturi flow meter (VFM), pressure drop, and study motivation and problem definition.
The descriptions of the remaining five chapters are as follows:
Chapter 2: Review of the research carried out in the field of two-phase flows through
venturi meters and researches related to the present work.
Chapter 3: Description of the experimental setup, the instrumentations used and
experimental procedure.
Chapter 4: Methodology of pressure calculations and validation results, data analysis and
uncertainty analysis.
Chapter 5: Experimental results and discussions.
Chapter 6: Reports the conclusions and provides the recommendations for future research
based on the findings of this experimental study.

12
CHAPTER 2
LITERATURE REVIEW
There remain many challenges associated with an understanding of multiphase flow
pressure drop in venturi meters commonly used in production wells and transportation
pipelines. With the rapid development of measurement techniques, experimental
investigation has become an important and more reliable method to solve practical
engineering problems. A substantial number of research articles are available in literature
on the two-phase flow measurements of oil and water in pipelines via venturi meters.
In many different scientific research and industrial fields, venturi meters have been
applied successfully as measurement devices in single-phase flows. Venturi meters can be
easily considered for two-phase flow measurements, due to their successful applications
in single-phase flows. Multiphase flows are a common occurrence, specifically in
downhole and upstream pipelines. Pressure drop is the key parameter for assessing
individual phase (oil-water) flow rates in pipelines, which include venturi meters for the
pressure measurements.
In the present age, wet gas measurement is playing an increasingly significant role in the
oil and gas industry. Venturi, a classic single-phase flow meter, has proved to be a reliable
and accurate wet gas flow meter. In recent years, Venturi has become a hotspot in two-
phase flow measurement. This has paved way for considerable/significant research on

13
Venturi multiphase flow. With the rapidly development of measurements techniques,
experimental investigation has become an important and more reliable method to solve
practical engineering problems. A substantial amount of research articles are available in
literature on the two-phase flow measurements of oil and water in pipelines via venturi
meters.
The main objective of this literature review is to understand the exiting work pertaining
to the classification of two-phase flow measurement and prediction in oil-water flow
measurement with particular focus on the flows through the venturi flow meter (VFM).
This literature review was divided into two main parts. The first main part presented the
measurement of two-phase (oil-water) flow. Moreover, this section consist of two
branches:
1. Two-phase (oil-water) flow through a venturi meter.
2. Alternative measurement techniques of two-phase (oil-water) flow, such as: U-tube,
ANN, CRCC and V-cone.
The second main part showed the two-phase (liquid-gas) flow in a Venturi meter. No
studies to date have addressed the two-phase (oil-water) flow in a venturi meter in a large
size pipes (3 inches) with consideration for the following parameters:
I. The effect of water fraction in the mixture (water cut) on the venturi pressure drop
measurements.
II. The effect of mixture viscosity on the venturi pressure drop measurements.
III. The effect of venture beta ratio or on the pressure drop measurements.
IV. The effect of venture orientation on the pressure drop measurements.

14
2.1 Two phase (Oil-Water) flow
I. Two phase (Oil-Water) flow through venturi meter:
Conventional orifice and venturi meters were used by Pal (1993) to investigate their
applicability in monitoring the emulsions of two-phase (oil-water) flow [3]. A single
venturi and a single orifice were used to determine the discharge coefficients of different
emulsions of oil-in-water (surfactant-stabilized and unstable). Based on the experimental
data, empirical correlations of discharge coefficients within ±5% accuracy were
developed for the Venturi and orifice meters. The metering results indicated that orifice
and venturi meters were feasible flow measuring devices for emulsions.
Zhiyao Huang et al. (2009) conducted an experiment on two phase oil-water
measurements [4]. They proposed a new hybrid system to estimate the differential
pressure drop of the two phase (oil-water) flow and the total volume flow rate by using an
oval gear flow meter and Venturi meter, respectively. The research results showed that
the proposed system was effective in measuring oil-water two-phase flow and
measurement accuracy was satisfactory. Li et al. (2009) used three horizontal pipes having
15mm, 25mm, and 40mm diameters with a two phase flow loop to investigate
experimentally, the performance of a hybrid flow meter system [5]. This system consisted
of an oval gear flow meter and venturi meter for two-phase (oil-water) flow
measurements. They found that the hybrid flow meter was feasible for measurement of
oil-water two-phase flow in terms of total volume flow rate, total mass flow rate, and

15
density. Also, they found that the measurement results were affected significantly by the
chosen venturi meter coefficient and oil fraction.
Si et al. (2012) conducted a study on a two-phase oil-water flow model in a downhole
venturi meter by theoretical calculation, numerical simulation and experimental testing
[6]. They investigated flow field and pressure characteristics with different flow and oil-
water ratios in a venturi tube. Stratified flow was observed as a flow pattern in the venturi
tube. Also they found an increase in the pressure gradient with increase in total flow rate.
Ding Feng et al. (2012) used venturi meter for the flow measurement of two phase (liquid-
liquid) [7]. They developed new measurement method for oil-water two phase using
homogeneous model and phase fraction templates. Phase fraction templates data was
verified with the Qinhuangdao 32-6-A31 oil field data. Measurement errors remained
under ±5%, which assures this method to be a feasible for two phase flow measurement
in presence of water and oil.
Brinkhorst et al. (2015) numerically analyzed two different venturi meter nozzles as a
liquid flow meter [8]. Herschel venturi meter was found to be more accurate than the ISO
9300 toroid Nozzle due to more stable mass flow with little deviation of only 0.00027%,
and the cavitation point was identified geometrically. They showed that oscillating cavity
has no influence on the mass flow rate unless cavity length is no less than twice the length
of Herschel venture meter cylinder length. In future work they suggested simulations
should be compared with the experimental results.
16
II. Two phase (Oil-Water) flow measurement by U-tube, ANN, CRCC and V-cone:
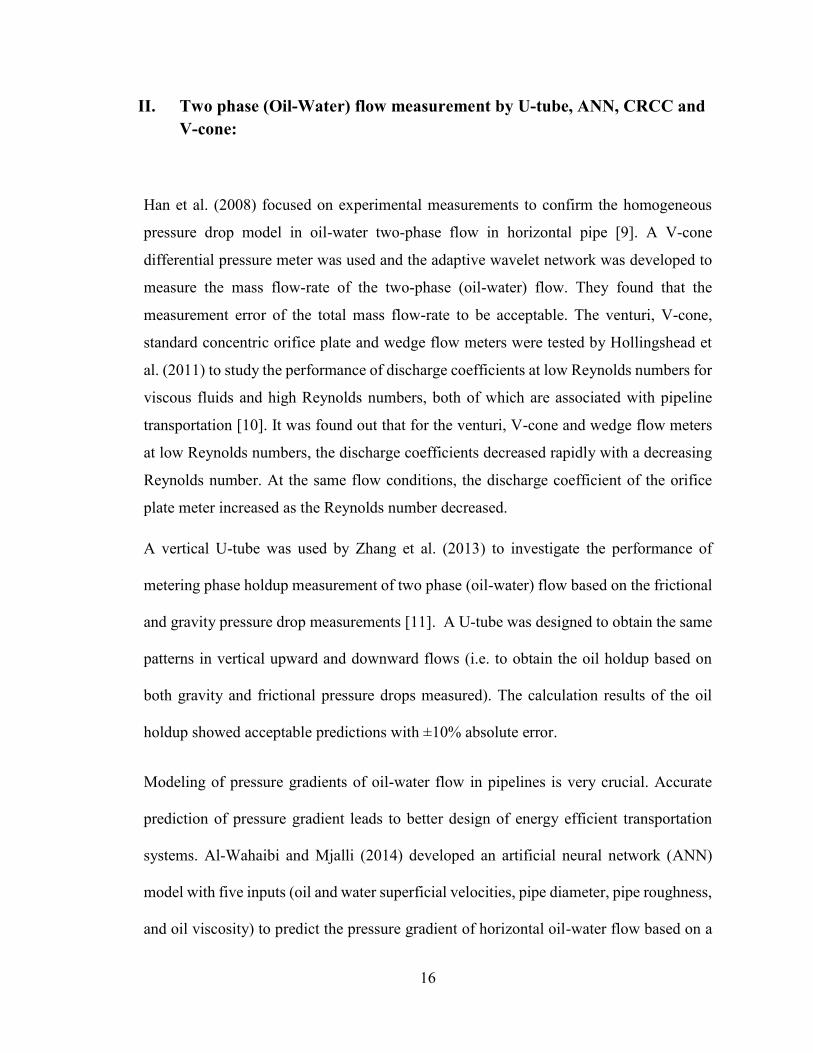
Han et al. (2008) focused on experimental measurements to confirm the homogeneous
pressure drop model in oil-water two-phase flow in horizontal pipe [9]. A V-cone
differential pressure meter was used and the adaptive wavelet network was developed to
measure the mass flow-rate of the two-phase (oil-water) flow. They found that the
measurement error of the total mass flow-rate to be acceptable. The venturi, V-cone,
standard concentric orifice plate and wedge flow meters were tested by Hollingshead et
al. (2011) to study the performance of discharge coefficients at low Reynolds numbers for
viscous fluids and high Reynolds numbers, both of which are associated with pipeline
transportation [10]. It was found out that for the venturi, V-cone and wedge flow meters
at low Reynolds numbers, the discharge coefficients decreased rapidly with a decreasing
Reynolds number. At the same flow conditions, the discharge coefficient of the orifice
plate meter increased as the Reynolds number decreased.
A vertical U-tube was used by Zhang et al. (2013) to investigate the performance of
metering phase holdup measurement of two phase (oil-water) flow based on the frictional
and gravity pressure drop measurements [11]. A U-tube was designed to obtain the same
patterns in vertical upward and downward flows (i.e. to obtain the oil holdup based on
both gravity and frictional pressure drops measured). The calculation results of the oil
holdup showed acceptable predictions with ±10% absolute error.
Modeling of pressure gradients of oil-water flow in pipelines is very crucial. Accurate
prediction of pressure gradient leads to better design of energy efficient transportation
systems. Al-Wahaibi and Mjalli (2014) developed an artificial neural network (ANN)
model with five inputs (oil and water superficial velocities, pipe diameter, pipe roughness,
and oil viscosity) to predict the pressure gradient of horizontal oil-water flow based on a

17
databank of around 765 measurements collected from open literature [12]. Statistical
analysis showed that the ANN model has an average error of 0.30%. Hasanvand and
Berneti (2015) have also used artificial neural networks (based on 600 data set of Persian
Gulf oil) in their study to obtain oil flow rate as an output measurement [13]. The input
variables included temperatures and line pressures.
The measurement of individual phase flow rates of oil water two-phase flow is an
important issue in process industries. Tan et al. (2015) used a Conductance Ring Coupled
Cone (CRCC) meter for this purpose and compared the obtained results with those from
a Conductance Ring Array (CRA) that was installed in front of the Conductance Ring
Coupled Cone (CRCC). The CRCC provided multiple outputs for the flow rate and water
holdup [14].
2.2 Two Phase (Liquid-Gas) Flow through Venturi Meter
Silvao et al. (1991) conducted experiments of air, water and oil flow in a multiphase flow
loop facility consisting of a vertical pipe of a Perspex type having internal diameter of 50
mm and length of 7 m approximately [15]. They used conductance probes to measure the
local holdup and found out that the mean liquid holdup before the nozzle and in the throat
depended only on the flow quality.
Peixiang and Alimonti (2007) proposed a new method of measuring two-phase mass
flowrates in a venturi meter based on the ideas that pressure drop fluctuations are
symptomatic of the flow pattern exist, and that the downstream and upstream pressure
drops ratio of the throat depend on the air and water individual mass flow rates [16]. They

18
concluded that it is possible to deduce the individual mass flow rates of air and water in a
two-phase mixture from measured pressure drops in a venturi meter with acceptable
residual errors ranged from 6 to 13%.
Based on an Eulerian - Eulerian approach for the multi-phase mixture, the Two-Fluid
model is used by Paladino Emilio and Maliska Clovis (1999) [17]. Their work focused on
the study of dispersed flows. In the designing stage of metering systems, they considered
two-dimensional structure knowledge which includes the distribution of gas and liquid.
They obtained several results using the proposed model then compared with both the
homogeneous model and experimental data. For the calculation of differential pressure, a
good agreement has been showed by the two-fluid model than the homogeneous model
and the experimentally obtained constant M, to compute the gas mass flow rate in a two-
phase flow in a venturi meter at different qualities [18]. The results obtained were not
satisfactory. Then, they adjust the constant M to fit the data and found that the constant M
is not universal.
Steven (2002) [19] compared five correlations based on orifice meter and two correlations
based on venturi meter with the data of NEL wet gas loop and came out with his own
correlation. Results suggested orifice meter correlations should not be used for venturi
meter. De Leeuw (1997) [20] correlation gave best results when tested on Nel wet gas
loop data compare to the other venturi meter correlation. As the De Leeuw correlation was
include a venturi meter (0.55 beta ratio) with 6 inch Standard specification and could
affect the metering, so he modified this correlation to include the effect of these

19
parameters. From his correlation gas mass flow rate could be calculated with ±3%
accuracy. He recommended his correlation to be tested on other reliable field data.
Hall et al. (2000) investigate the performance of different venturi meters in multiphase
flows [21]. The meters were tested using a mixture of stabilized crude oil, magnesium
sulfate solution and nitrogen gas with the gas void fraction ranging from 10 to 97.5% and
atios tested were 0.4, 0.6 and 0.75. Based on the mass flow
rate from the reference metering system, the discharge coefficient was evaluated for each
test condition. Measurements of differential pressure between the venturi throat and the
upstream tapping and of the density from a gamma ray densitometer were made to
complete the calculation. The calculated discharge coefficient showed a significant
variation with reference gas volume fraction and a smaller effect with reference water cut.
21° cone angle Venturi was selected for the final evaluation.
Zhiyao et al. (2005) used a horizontal loop with a 50 mm diameter pipe to conduct
experiments on gas oil two phase flow to measure the flow rate [22]. Furthermore, the
electrical capacitance tomography (ECT) was used to determine the cross-sectional void
fraction. A venturi meter and void fraction meter were installed by Zhang et al. (2005) to
investigate two-phase flow measurement of oil-air flows [23]. They developed a new
correlation to measure the flow rate with a consideration for the velocity ratio effect
between the gas and liquid phases.
Experiments were conducted by Gysling et al. (2006) to validate the ability of the
-on SONAR-based meters to
measure liquid and gas flow rates of wet gas using wetness sensitivity coefficients [24].

20
The experimental results show acceptable measurement accuracy to within ±2% and
±10% of gas and liquid flow rates, respectively.
Arun Kumar et al. (2008) studied the effect of venturi meter in two phase flow [25]. They
reported, presence of venturi meter effects the phase distribution mainly in the upstream
section. While at lower velocities, pattern transitions were recorded at downstream
section. Inverted dispersed flow occurred in the downstream side for the studies flow rates.
The mass flow rate can be measured using homogeneous/drift-
densities closer to water. For heavy/high viscosity oil new calibrations should be
performed. The value of CD for two phase flow remained almost equivalent to CD for
single phase water flow through the venturi meter. Based on the homogeneous and
separated (H-S) flow model, a new metering method for wet gas flow in a venturi tube
was presented Lide et al. (2008) [26]. The friction and acceleration venturi pressure drops
were considered in a newly developed correlation, and its validity confirmed
experimentally.
Three venturi me
horizontally in low-pressure wet gas flow by Lide and Tao (2008) to study their
performances systematically [27]. The effects of the following five operational parameters
to the venturi tube were analyzed with new independent data under different varied ranges:
the pressure (0.15, 0.20 and 0.25) MPa, the densiometric gas Froude number ranges (0.6
to 2.0), the mass flow rate ratio of gas to liquid (0.5 to 0.99) and the modified Lockhart-
Maretinelli parameter (0.0022 to 0.06). Finally, they compared the performance of low-
pressure wet gas flow with that under high pressure. Their study showed that under high-

21
pressure the over-reading of a venturi was dependent on the gas Froude number, Lockhart-
An experimental work was done by Meng et al. (2010) for air-water two-phase flow using
a venturi meter and an Electrical Resistance Tomography (ERT) sensor [28]. The two-
the Venturi meter and the mass quality. Seraj et.al. (2010) introduced an application of
VFM for wet gas measurement [29]. A tracer injection method was introduced as a tool
to measure water and condensate flow rate manually, and radioactive measuring tool as
an automated method to measure the gas, water and condensate ratio in the wet gas fluid.
Seraj et al. (2010) [29] also elaborated different methods in order to correct over-read
values acquired using the Bernoulli equation.
The measurement of fluid flow rates often arises in industrial fields. The most common
differential pressure measurement device is the Venturi meter. A vertical universal
Venturi tube was used by Hasan et al. (2012) to study the bubbly gas-water two phase
flows [30]. The upward bubbly flow of gas-water was assumed homogenous with the
same moving velocity for both two phases (i.e. with a unity slip ratio). Differential
pressure technique (flow density meter) was used to measure gas volume fraction and
mixture flow rate. They concluded that, due to the bubbly-slug transition flow, the
homogenous flow model begins to break when the gas volume fraction increased beyond
17.48%.
An experimental analysis was carried out by Gajan et al. (2013) on an annular two phase
liquid-gas flow, where the liquid phase contained simultaneous water and oil flow through
22
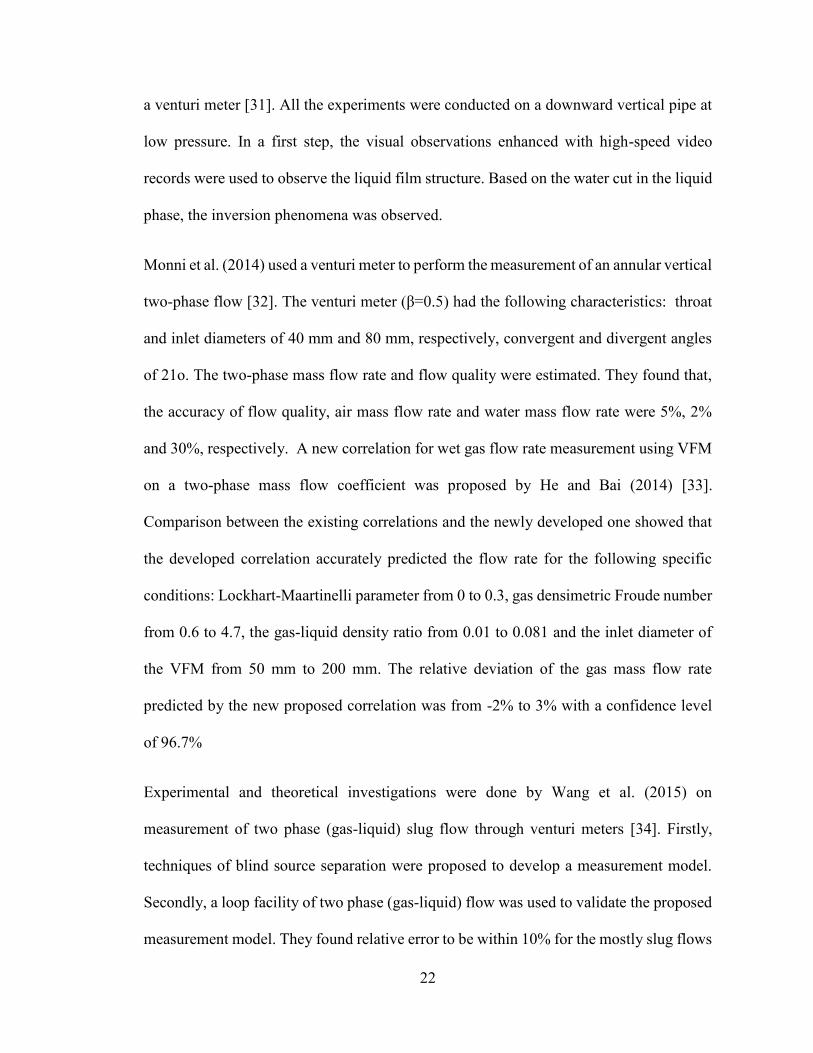
a venturi meter [31]. All the experiments were conducted on a downward vertical pipe at
low pressure. In a first step, the visual observations enhanced with high-speed video
records were used to observe the liquid film structure. Based on the water cut in the liquid
phase, the inversion phenomena was observed.
Monni et al. (2014) used a venturi meter to perform the measurement of an annular vertical
two-phase flow [32]. The v
and inlet diameters of 40 mm and 80 mm, respectively, convergent and divergent angles
of 21o. The two-phase mass flow rate and flow quality were estimated. They found that,
the accuracy of flow quality, air mass flow rate and water mass flow rate were 5%, 2%
and 30%, respectively. A new correlation for wet gas flow rate measurement using VFM
on a two-phase mass flow coefficient was proposed by He and Bai (2014) [33].
Comparison between the existing correlations and the newly developed one showed that
the developed correlation accurately predicted the flow rate for the following specific
conditions: Lockhart-Maartinelli parameter from 0 to 0.3, gas densimetric Froude number
from 0.6 to 4.7, the gas-liquid density ratio from 0.01 to 0.081 and the inlet diameter of
the VFM from 50 mm to 200 mm. The relative deviation of the gas mass flow rate
predicted by the new proposed correlation was from -2% to 3% with a confidence level
of 96.7%
Experimental and theoretical investigations were done by Wang et al. (2015) on
measurement of two phase (gas-liquid) slug flow through venturi meters [34]. Firstly,
techniques of blind source separation were proposed to develop a measurement model.
Secondly, a loop facility of two phase (gas-liquid) flow was used to validate the proposed
measurement model. They found relative error to be within 10% for the mostly slug flows

23
obtained from the experimental results. An experimental measurement of wet gas obtained
from Colorado Experiment Engineering Station Inc. (CEESI) on a horizontal Venturi
(2015) [35]. They developed a correlation which gave satisfactory accuracy of about 2%
when compared with other models. Nevertheless, the inversion point value obtained from
their analyses did not correspond to that predicted by the formula of Odozi (2000) [36].
Experiments were conducted by Bertoldi et.al. (2015) on two-phase flashing flows in a
venturi tube to study the effect of mass flow rate and concentration of the volatile
components present in the liquid phase [37]. The experiments were conducted using R-
134a as a volatile component and POE ISO 10 lubricating oil as a nonvolatile component.
They concluded that the liquid phase viscosity has a major effect on the pressure
difference and recovery in the diverging section. They also concluded that occurrence of
two-phase flow in the throat and downstream are sensitive to changes in the operation
conditions of the flow. A new correlation was developed by Yuan et.al (2015) to
accurately measure the flow of a wet gas flow in a double differential pressure VFM [38].
Data sets were generated using experimental data and dimensionless analysis of several
parameters such as differential pressure ratio, gas Froude number, Lockhart-Martinelli
parameter and gas-liquid density ratio. The study concluded that the relative deviations of
this newly introduced correlation is better than ±1% with a standard deviation of 0.34%.
Currently, no work is available in the literature on pressure drop measurements of mineral
oils (D80 and D130) water two-phase flow in horizontal and inclined 0.0762 m (3-inch)
flow loop at different flow conditions for different sizes of venturi meters. Literature also
24
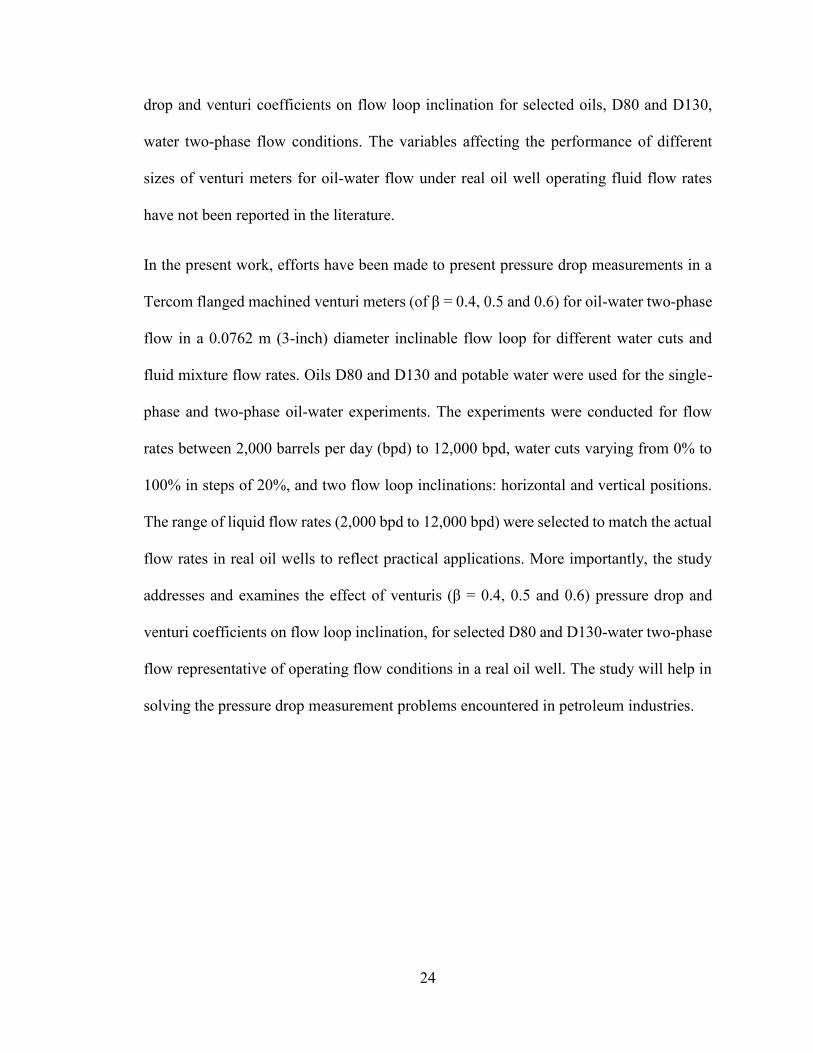
drop and venturi coefficients on flow loop inclination for selected oils, D80 and D130,
water two-phase flow conditions. The variables affecting the performance of different
sizes of venturi meters for oil-water flow under real oil well operating fluid flow rates
have not been reported in the literature.
In the present work, efforts have been made to present pressure drop measurements in a
Tercom flanged m -water two-phase
flow in a 0.0762 m (3-inch) diameter inclinable flow loop for different water cuts and
fluid mixture flow rates. Oils D80 and D130 and potable water were used for the single-
phase and two-phase oil-water experiments. The experiments were conducted for flow
rates between 2,000 barrels per day (bpd) to 12,000 bpd, water cuts varying from 0% to
100% in steps of 20%, and two flow loop inclinations: horizontal and vertical positions.
The range of liquid flow rates (2,000 bpd to 12,000 bpd) were selected to match the actual
flow rates in real oil wells to reflect practical applications. More importantly, the study
rop and
venturi coefficients on flow loop inclination, for selected D80 and D130-water two-phase
flow representative of operating flow conditions in a real oil well. The study will help in
solving the pressure drop measurement problems encountered in petroleum industries.

25
3 CHAPTER 3
EXPERIMENTAL SETUP AND PROCEDURE
3.1 Experimental Setup
The experiments were conducted to investigate the oil-water two-phase flow through a
Tercom flanged machined venturi meter device. The schematic layout of the multi-phase
flow loop is shown in Figure 3.1. The flow loop mainly consists of four centrifugal
variable speed pumps (water and oil pumps), horizontal oil-water cylindrical gravity
separator, fluid mixture catching tank, rectangular channel, and an inclinable flow loop.
The two water pumps (WP) and two oil pumps (OP) were used for pumping fluids to the
flow loop. Each pump can deliver fluid at a maximum flow rate of 5000 bpd with a
delivery pressure of 8 bar gage. The horizontal oil-water separation tank consists of oil
and water portions separated by a weir of 0.675 m height. The overall length of the
cylindrical separator is 9.55 m and its inner diameter is 1.0 m. The length of the oil portion
is 4.102 m, whereas the water section length is 5.448 m. The fluid mixture catch tank is
of rectangular cross-section and is used to dump the return fluid mixture to suppress the
fluid momentum. A transparent Plexiglas window is provided on the water side of the oil-
water separator for visual observation of the multi-phase fluid mixture when it enters from
the rectangular channel into the separator tank. The inclinable test section toggles on roller
26
bearings at the base with inclination, , that can be varied from 0 to 90 degree from the
horizontal position.
Figure 3.1: Schematic layout diagram of the multi-phase flow loop facility.
The flow loop was instrumented with two OMEGA turbine flow meters (OFM, WFM),
and a Mcrometer flow meter (MCFM) for monitoring fluid flow rates. The flow loop had
oil, water, and fluid mixture sampling ports (OSP, WSP, and FMSP) to monitor the quality
of the fluids in the respective fluid pipelines. The gate valves (OGV, WGV, and RGV)

27
were provided in the flow loop for controlling line pressure and flow. The return fluid
mixture temperature was monitored by the dial gauge type temperature sensor (TS).
Flow - Loop Instrumentations:
The details of the instrumentation used in the experimental work are presented in Table
3.1.
Table 3.1: List of instruments used in the oil-water flow experiments.
28
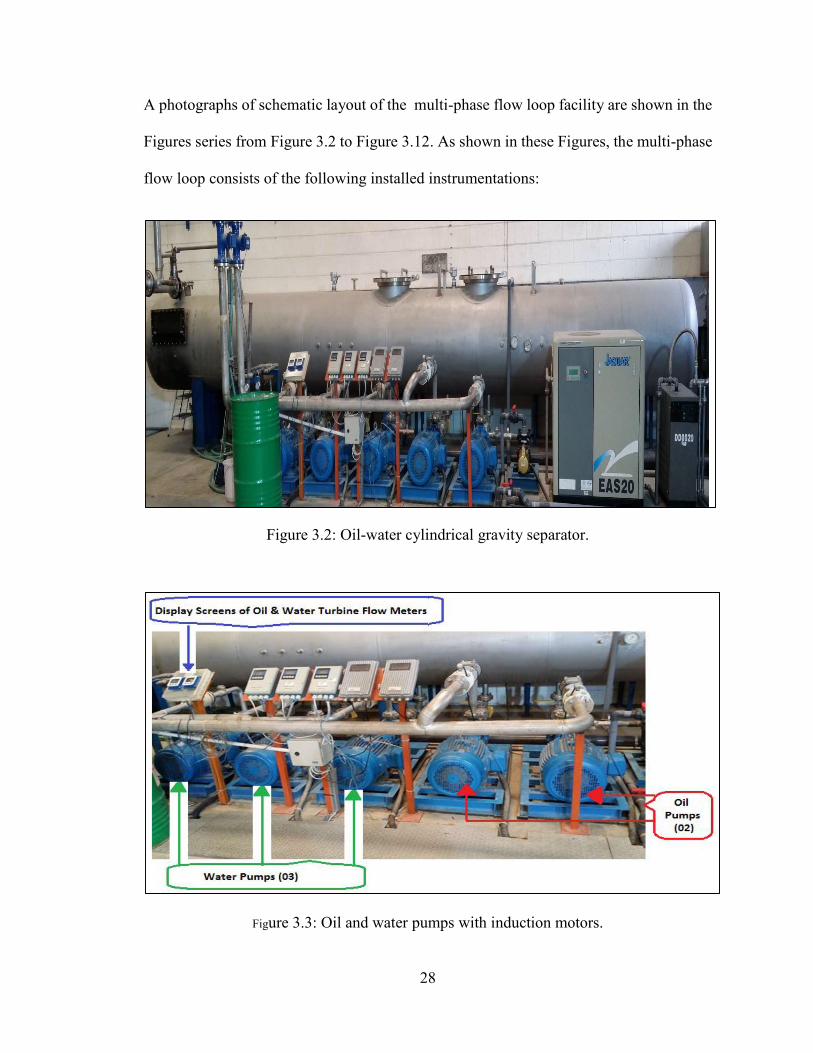
A photographs of schematic layout of the multi-phase flow loop facility are shown in the
Figures series from Figure 3.2 to Figure 3.12. As shown in these Figures, the multi-phase
flow loop consists of the following installed instrumentations:
Figure 3.2: Oil-water cylindrical gravity separator.
Figure 3.3: Oil and water pumps with induction motors.
29
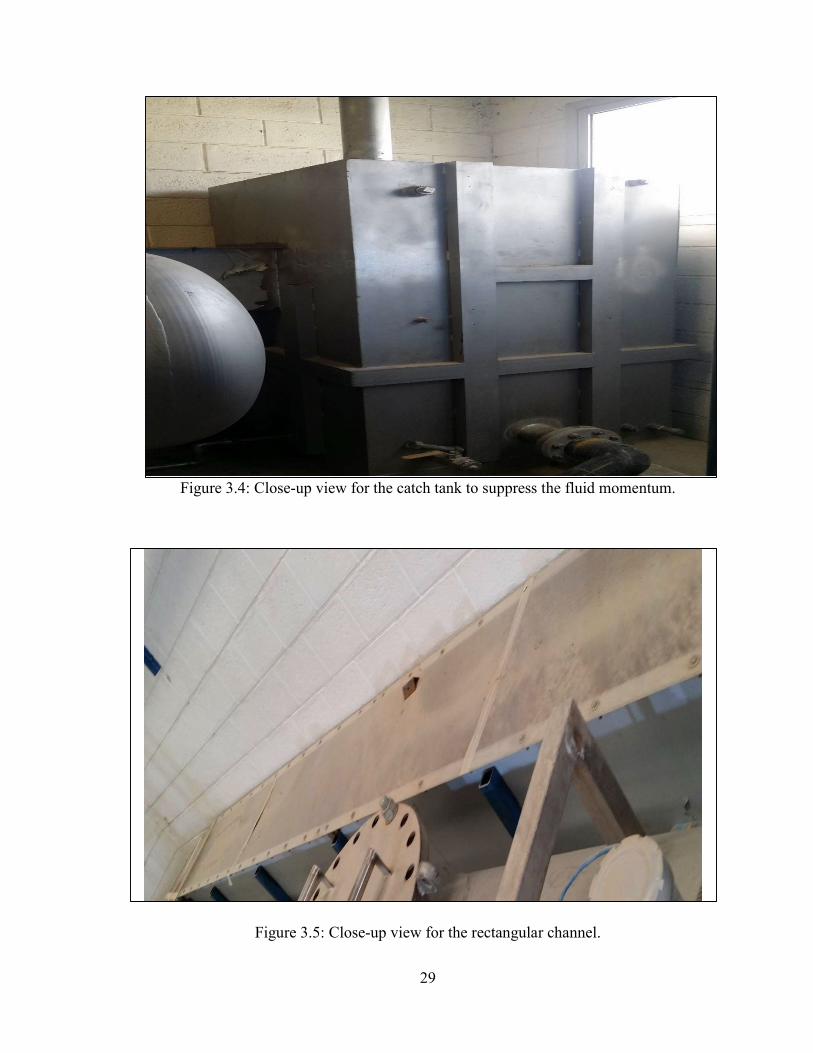
Figure 3.4: Close-up view for the catch tank to suppress the fluid momentum.
Figure 3.5: Close-up view for the rectangular channel.

30
Figure 3.6: Oil and water turbine flow meters (blue colored) used in the experimental
work.
Figure 3.7: Mcrometer flow meter (MCFM) for monitoring of the fluids flow rate, and the return gate valve (RGV) to avoid suction at the venturi throat.

31
Figure 3.8: Close- = 0.5) at horizontal position.
Figure 3.9: Close-
32
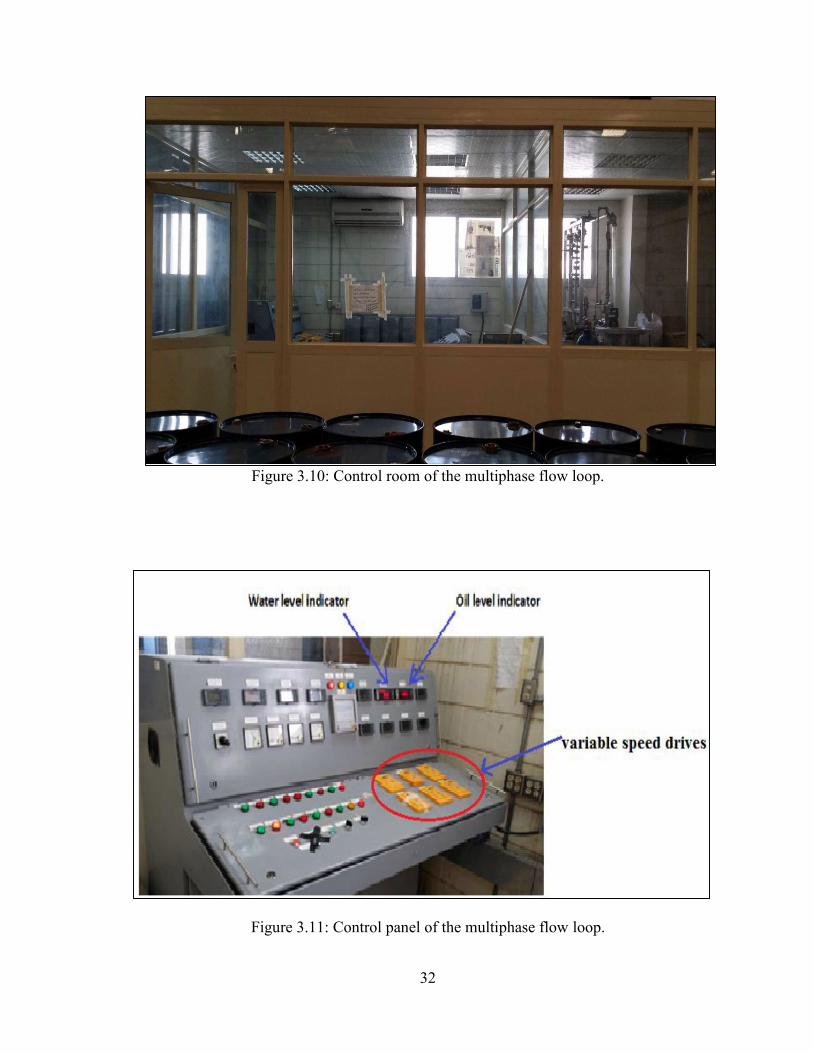
Figure 3.10: Control room of the multiphase flow loop.
Figure 3.11: Control panel of the multiphase flow loop.
33
Figure 3.12: Data acquisition system for the oil-water experiments.
Details of the Inclinable Flow Loop:
The detailed drawing of the inclinable flow loop is shown in Figures 3.13 and 3.14. It
consists of a static mixer and a venturi. It can be seen from the Figure 3.13 that the static
mixer is positioned on the upstream side of the venturi meter for thorough mixing of the
multi-phase fluid before it enters into the venturi meter. The detailed physical
specifications of the inclinable flow loop test section pipes is shown in Table 3.2.
Table 3.2: Specifications of the inclinable flow loop test section pipe.
Item Pipe Type Outside
Diameter Inside
Diameter Pipe
Thickness
Specifications 3.5" pipe, Sch J55 0.0889 m 0.0760 m 0.00645 m

34
Figure 3.13: Detailed drawing of the inclinable flow ch J55and a venturi meter.
Figure 3.14: Side - view of the inclinable flow ch J55and a venturi meter.
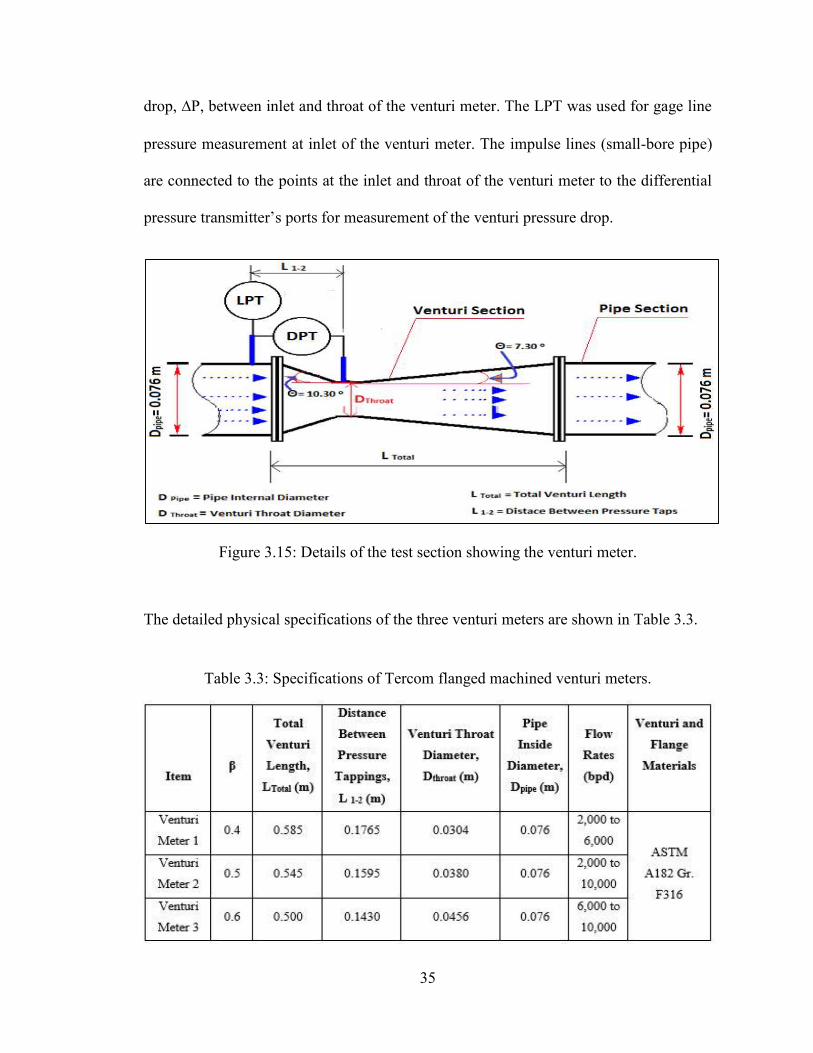
The test section of the inclinable flow loop is presented in Figure 3.15. The positions of
the installed differential pressure transmitter (DPT) and the line pressure transmitter (LPT)
on the venturi meter are shown in Figure 3.15. The DPT was used to measure pressure
35
drop, P, between inlet and throat of the venturi meter. The LPT was used for gage line
pressure measurement at inlet of the venturi meter. The impulse lines (small-bore pipe)
are connected to the points at the inlet and throat of the venturi meter to the differential
t of the venturi pressure drop.
Figure 3.15: Details of the test section showing the venturi meter.
The detailed physical specifications of the three venturi meters are shown in Table 3.3.
Table 3.3: Specifications of Tercom flanged machined venturi meters.

36
Physical properties of the Mixture Fluids:
The physical properties of mineral oils D80 and D130 used in the experimental work are
presented in Table 3.4 [21]. The oils Exxsol D80 and Exxsol D130 were procured from
ExxonMobil Company. There are dearomatized fluids with low odor, low levels of
toxicity, broad evaporation range and narrow boiling range. However, the measurements
tests of the physical properties (density and viscosity) for both oils were confirmed again
in the laboratories at the Center for Engineering Research (CER) at the Research Institute
of King Fahd University of Petroleum and Minerals, Dhahran.
The density test of the potable water was done in the Center of Petroleum and Minerals
(CPM) at the Research Institute. Meanwhile its viscosity test was measured at the
laboratories of Petroleum Department at King Fahd University of Petroleum and Minerals,
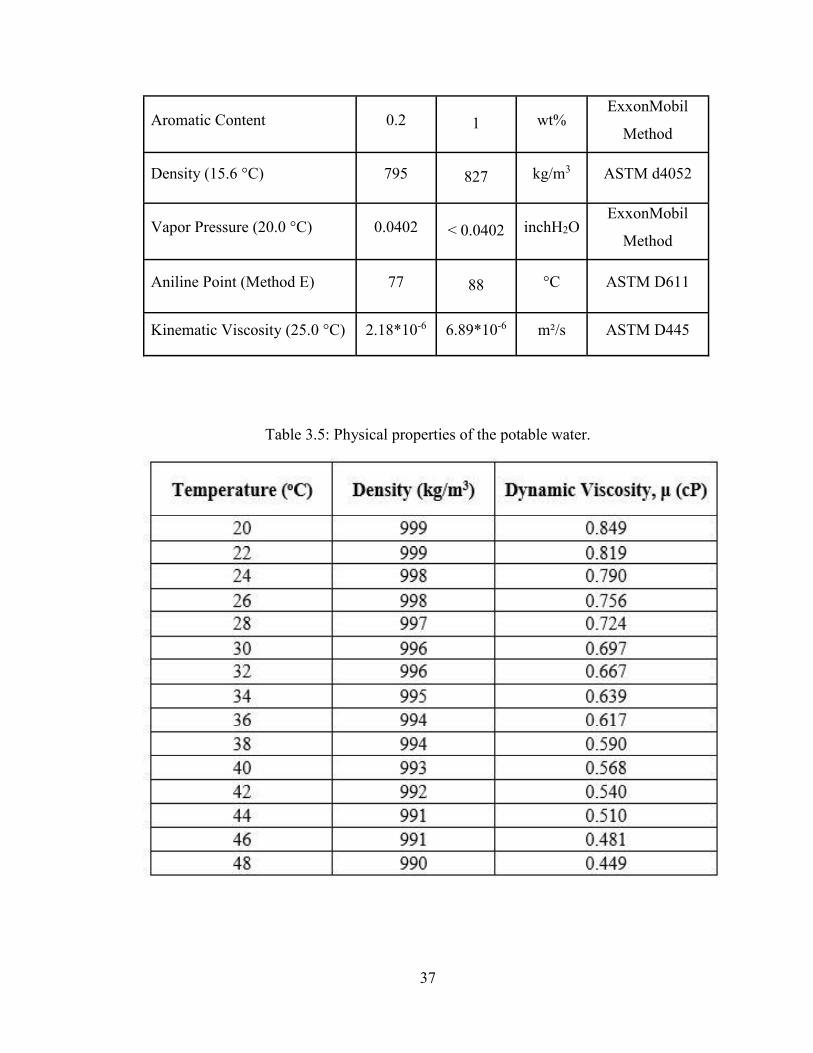
Dhahran. The physical properties of used potable water have summarized in Table 3.5.
Table 3.4: Physical properties of the mineral oils D80 and D130 (ExxonMobil chemical 2014) [39].
Properties EXXSOL
D80
EXXSOL
D130 Units Test Based On
Initial Boiling Point (IBP) 208 279 °C N/A
Dry Point (DP) 236 313 °C N/A
Flash Point (Method A) 82 140 °C ASTM D93
37
Aromatic Content 0.2 1 wt% ExxonMobil
Method
Density (15.6 °C) 795 827 kg/m3 ASTM d4052
Vapor Pressure (20.0 °C) 0.0402 < 0.0402 inchH2O ExxonMobil
Method
Aniline Point (Method E) 77 88 °C ASTM D611
Kinematic Viscosity (25.0 °C) 2.18*10-6 6.89*10-6 m²/s ASTM D445
Table 3.5: Physical properties of the potable water.

38
3.2 Experimental Procedure
Initially, the experiments were conducted for horizontal position of the flow loop test
section for single-phase oils (mineral oil D80 and D130) and water (portable) using a
nd 0.6. The fluid
flow rates varied from 2000 to 120000 bpd to validate the measurements against available
models, and also calibrate the pressure transmitters and flow meters in the loop. The
single-phase fluid (water or oils) was pumped in the pipeline using pumps powered by
induction motors. The required fluid flow rate was attained by varying the speed of the
induction motors through variable speed drives. The Omega inline water and oil turbine
flow meters installed downstream of the pumps were used for measuring the single-phase
flow rates manually. The pressure drop ( P) across the venturi was measured by the
differential pressure transmitter, DPT, and the line pressure (LP) by the line pressure gage
transmitter, LPT. These pressure transmitters were connected to a Campbell Scientific
data acquisition system CR1000. The data acquired from the pressure transmitters were
logged automatically every 5 seconds by the data acquisition system and was stored in a
predefined file in text format. The collected data was checked for errors and accuracy and
then processed further to obtain the required parameters. If the collected data was not
satisfactory, the experiment was repeated until high quality data was obtained.
After validation of the single phase oils and water experiments, the multi-phase flow
experiments were conducted for fluid mixture flow rates ranging from 2000 to 120000
bpd by using both the oils and water pumps. For a fixed fluid mixture flow rate and
inclination of the inclinable flow loop, the experiments were conducted for water cuts
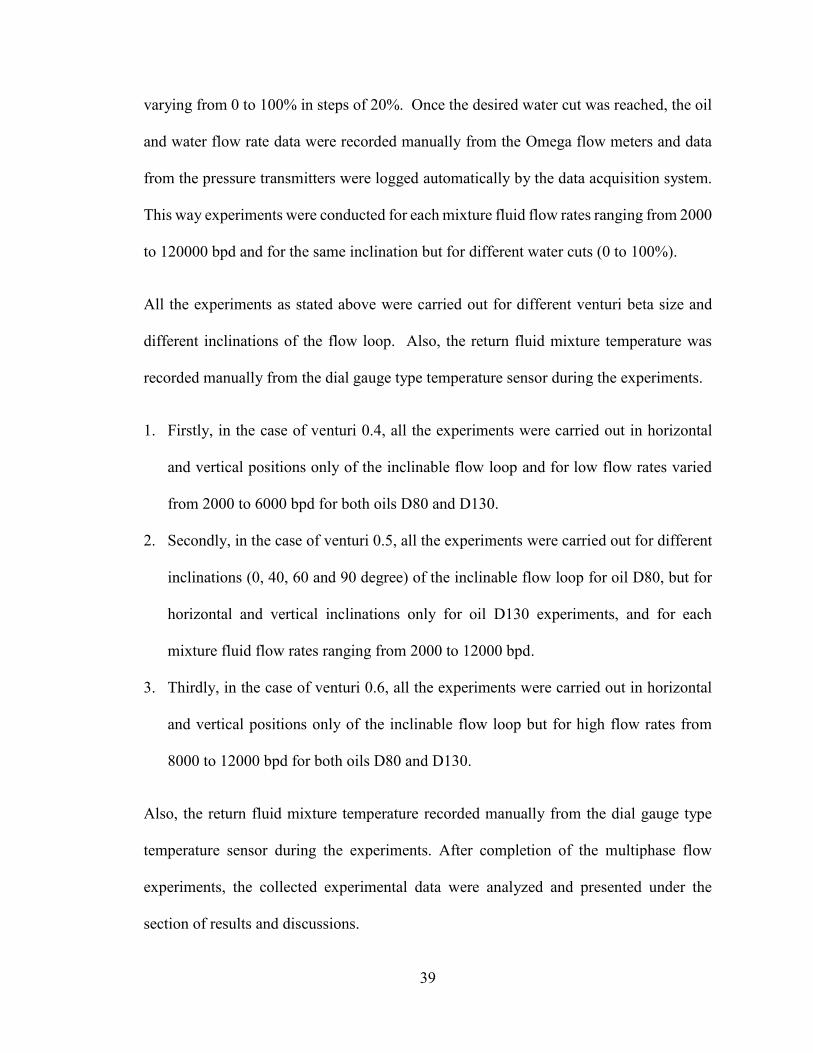
39
varying from 0 to 100% in steps of 20%. Once the desired water cut was reached, the oil
and water flow rate data were recorded manually from the Omega flow meters and data
from the pressure transmitters were logged automatically by the data acquisition system.
This way experiments were conducted for each mixture fluid flow rates ranging from 2000
to 120000 bpd and for the same inclination but for different water cuts (0 to 100%).
All the experiments as stated above were carried out for different venturi beta size and
different inclinations of the flow loop. Also, the return fluid mixture temperature was
recorded manually from the dial gauge type temperature sensor during the experiments.
1. Firstly, in the case of venturi 0.4, all the experiments were carried out in horizontal
and vertical positions only of the inclinable flow loop and for low flow rates varied
from 2000 to 6000 bpd for both oils D80 and D130.
2. Secondly, in the case of venturi 0.5, all the experiments were carried out for different
inclinations (0, 40, 60 and 90 degree) of the inclinable flow loop for oil D80, but for
horizontal and vertical inclinations only for oil D130 experiments, and for each
mixture fluid flow rates ranging from 2000 to 12000 bpd.
3. Thirdly, in the case of venturi 0.6, all the experiments were carried out in horizontal
and vertical positions only of the inclinable flow loop but for high flow rates from
8000 to 12000 bpd for both oils D80 and D130.
Also, the return fluid mixture temperature recorded manually from the dial gauge type
temperature sensor during the experiments. After completion of the multiphase flow
experiments, the collected experimental data were analyzed and presented under the
section of results and discussions.

40
The return gate valve (RGV, see Figures 3.1 and 3.7) of the loop is throttled to set the
required pressure at the venturi inlet to avoid suction at the venturi throat. The return fluid
mixture coming out of the inclinable flow loop is discharged back into the fluid mixture
catch tank. The fluid mixture from the catch tank flows through the rectangular channel
of cross-section 0.5 meter wide and 0.45 meter high and length equal to that of the oil-
water separator i.e. 9.55 meter. The fluid mixture from the rectangular channel enters into
the oil-water separation tank where oil and water separates by gravity. The fluid
continuously flows through the loop until the experimental data is obtained satisfactorily.
During the multiphase flow experiments, the oil and water samples were collected through
the fluid sampling ports (OSP, WSP) to check the quality of oil and water pumped by the
respective fluid pumps.
Experimental Matrices:
The experimental work was carried out for oils (D80 and D130) and venturi of beta ratios
of (0.4, 0.5, and 0.6) for different water cuts ranging from 0 to 100% in step of 20%, flow
rates varying between 2000 to 12000 bpd, a horizontal and vertical inclinations of the
inclinable flow loop were considered for all venturi meters, and four different inclination
of the inclinable flow loop from horizontal to vertical positions were consider for the
venturi meter of beta ratio of 0.5 in case of oil D80 only . The detailed information about
the test conditions are mentioned as follows:

41
I. Experiments for Oil D80:
Test conditions: Oil: Exxsol D80 Venturi beta ratio: 0.4, 0.5, and 0.6
Flow loop inclination: 0º and 90º Water cut: 0, 20, 40, 60, 80 & 100%.
*Note: Except for the venturi 0.5, the experiments conducted for four additional
inclinations (0, 40, 60 and 90 degrees).
Table 3.6 shows the matrix of multiphase flow experiments conducted for oil D80 for
different venturi of beta ratios (0.4, 0.5 and 0.6) and for different inclinations of the flow
loop.
Table 3.6: Matrix of multiphase flow experiments conducted for oil D80.

42
II. Experiments for Oil D130:
Test conditions: Oil: Exxsol D130 Venturi beta ratio: 0.4, 0.5, and 0.6
Flow loop inclination: 0º and 90º Water cut: 0, 20, 40, 60, 80 & 100%.
Table 3.7 shows the matrix of multiphase flow experiments conducted for oil D130 for
different venturi of beta ratios (0.4, 0.5 and 0.6) and for different inclinations of the flow
loop.
Table 3.7: Matrix of multiphase flow experiments conducted for oil D130.

43
Notes:
The Total number of clean experiments conducted for all venturi meters for both oils
(D80 and D130) are: (360) experiments
In some cases, when the emulsion is formed. Emulsion is a mixture of two immiscible
fluids (oil and eater); one of the fluids is dispersed in the other fluid in form of droplets.
In our study we have a dual dispersion: (oil in water) at high water cuts experiments,
and (water in oil) in case of low water cuts experiments. In the case of emulsion
formation, the experiments were repeated until satisfactory results were obtained.
Some of photos were captured for emulsions at different temperature as shown in
figures 3.16.
Figure 3.16a: Close-up view of the transparent widow when the emulsion of (oil and water) formed.

44
Figure 3.16b: Close-up view of the gravity separator (Inside of the tank) when the emulsion formed at temperature (T= 24 ºC).
Figure 3.16c: Close-up view of the emulsion samples at glass flasks when formed at temperature (T= 27 ºC).

45
4 CHAPTER
DATA ANALYSIS AND UNCERTAINTY ANALYSIS
4.1 Validation of the Experimental Results
To validate the single-phase oil and water experiments for the three venturi meters, the
calculated and measured venturi pressure drop were plotted in Figures 4.1a to 4.1f. The
following equation was used to calculate the venturi pressure drop for single-phase and
two-phase flow experiments:
(4.1)
Where,
Qm = Fluid mixture flow rate, m3/h
Cd = Venturi discharge coefficient (Cd = 0.995 from manufacturer)
0.6)
At = Venturi throat area, m2
P = Calculated venturi pressure drop, Pa
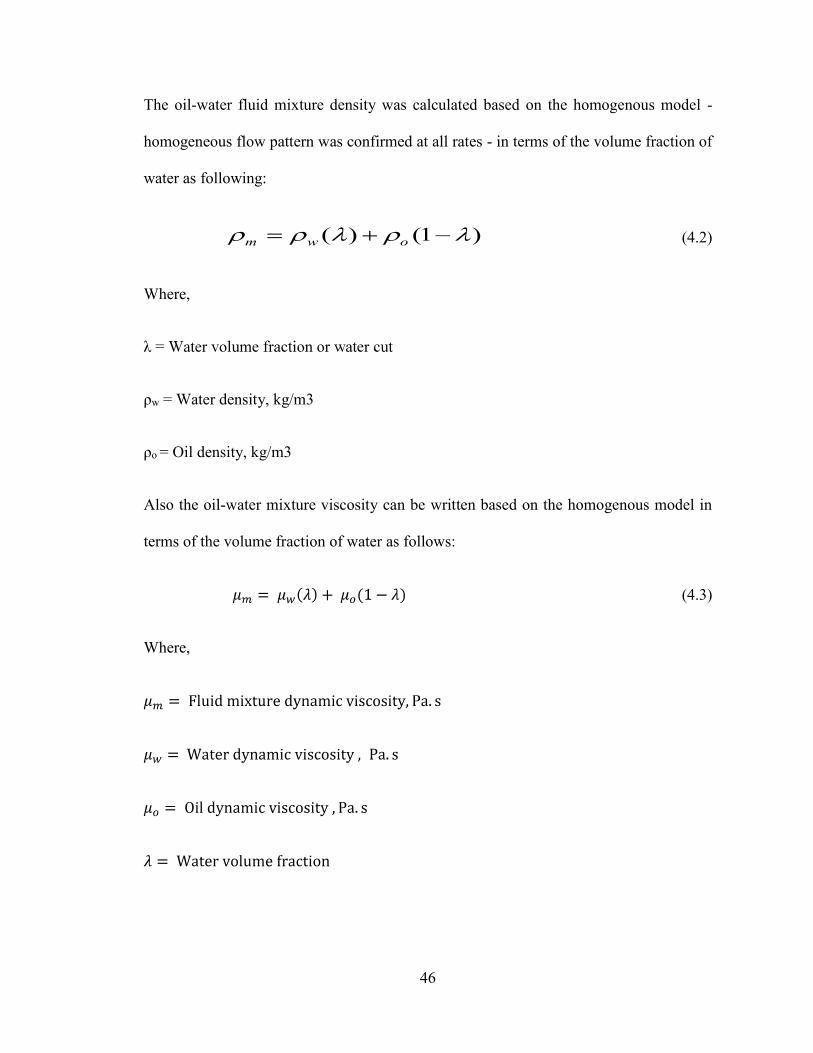
46
The oil-water fluid mixture density was calculated based on the homogenous model -
homogeneous flow pattern was confirmed at all rates - in terms of the volume fraction of
water as following:
(4.2)
Where,
w = Water density, kg/m3
o = Oil density, kg/m3
Also the oil-water mixture viscosity can be written based on the homogenous model in
terms of the volume fraction of water as follows:
(4.3)
Where,
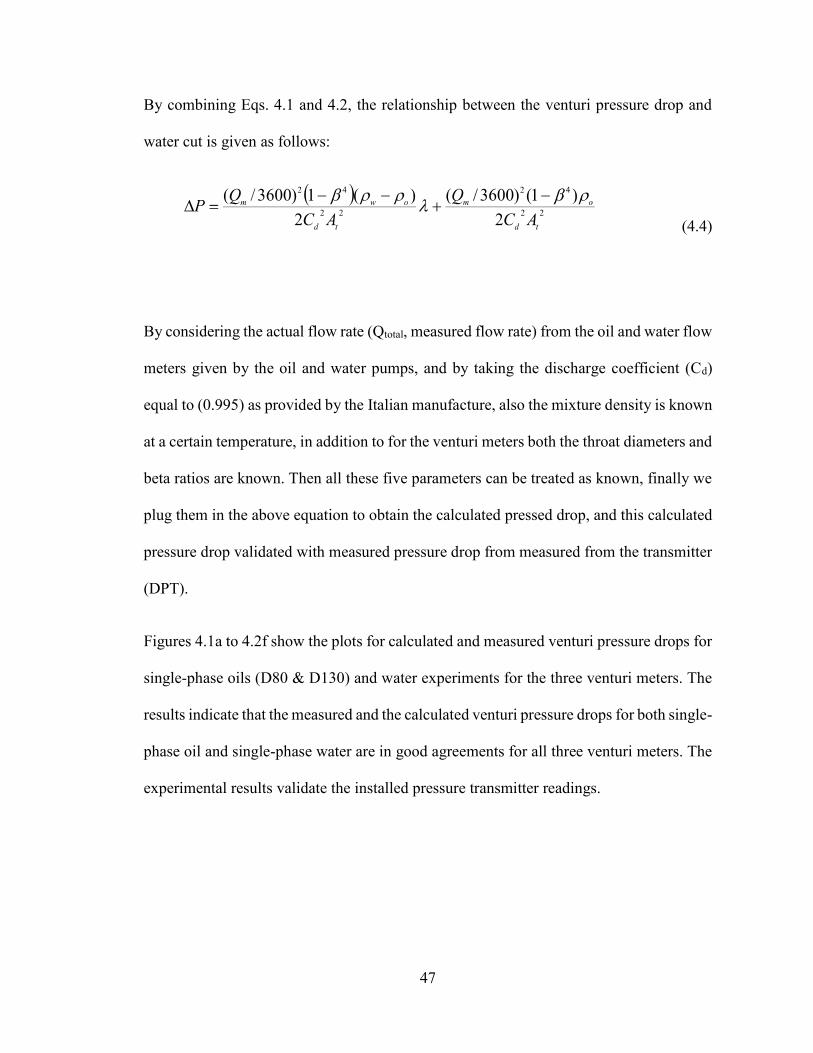
47
By combining Eqs. 4.1 and 4.2, the relationship between the venturi pressure drop and
water cut is given as follows:
(4.4)
By considering the actual flow rate (Qtotal, measured flow rate) from the oil and water flow
meters given by the oil and water pumps, and by taking the discharge coefficient (Cd)
equal to (0.995) as provided by the Italian manufacture, also the mixture density is known
at a certain temperature, in addition to for the venturi meters both the throat diameters and
beta ratios are known. Then all these five parameters can be treated as known, finally we
plug them in the above equation to obtain the calculated pressed drop, and this calculated
pressure drop validated with measured pressure drop from measured from the transmitter
(DPT).
Figures 4.1a to 4.2f show the plots for calculated and measured venturi pressure drops for
single-phase oils (D80 & D130) and water experiments for the three venturi meters. The
results indicate that the measured and the calculated venturi pressure drops for both single-
phase oil and single-phase water are in good agreements for all three venturi meters. The
experimental results validate the installed pressure transmitter readings.

48
Validation Results for Oil D80:
Figure 4.1a: Validation of single phase oil D80 and water experiments for venturi 0.4 for horizontal position of the flow loop.
Figure 4.1b: Validation of single phase oil D80 and water experiments for venturi 0.5 for horizontal position of the flow loop.
0
100
200
300
400
500
600
700
800
0 2000 4000 6000 8000 10000 12000
Pres
sure
Dro
p, in
ch H
2O
Flow rate, bpd
Calculated DP - WC0 - D80 - 0 Measured DP - WC0 - D80 -
Calculated DP - WC100 - 0 Measured DP - WC100 - 0
0
100
200
300
400
500
600
700
800
0 2000 4000 6000 8000 10000 12000 14000
Pres
sure
Dro
p, in
ch H
2O
Flow rate, bpd
Calculatd DP - WC0 - D80 - Measured DP - WC0 - D80 -
Calculatd DP - WC100 - 0 Measured DP - WC100 -

49
Figure 4.1c: Validation of single phase oil D80 and water experiments for venturi 0.6 for horizontal position of the flow loop.
Validation Results for Oil D130:
Figure 4.1d: Validation of single phase oil D130 and water experiments for venturi 0.4 for horizontal position of the flow loop.
0
100
200
300
400
500
600
700
800
0 2000 4000 6000 8000 10000 12000
Pres
sure
Dro
p, in
ch H
2O
Flow Rate, bpd
Calculated DP - WC0 - D80 - Measured DP - WC0 - D80 - 0Calculated DP - WC100 - Measured DP - WC100 -
0
100
200
300
400
500
600
700
800
0 2000 4000 6000 8000 10000 12000
Pres
sure
Dro
p, in
ch H
2O
Flow rate, bpd
Calculated DP - WC0 - D130 - 0 Measured DP - WC0 - D130 - 0
Calculated DP - WC100 - Measured DP - WC100 - 0
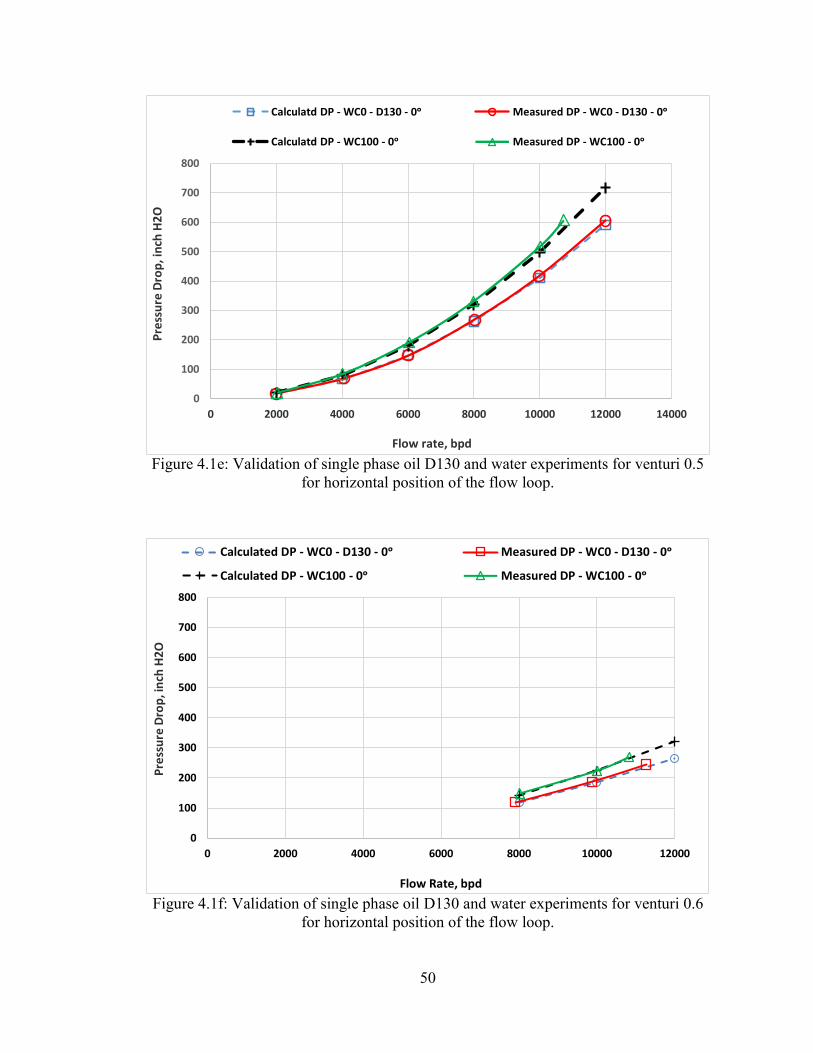
50
Figure 4.1e: Validation of single phase oil D130 and water experiments for venturi 0.5 for horizontal position of the flow loop.
Figure 4.1f: Validation of single phase oil D130 and water experiments for venturi 0.6 for horizontal position of the flow loop.
0
100
200
300
400
500
600
700
800
0 2000 4000 6000 8000 10000 12000 14000
Pres
sure
Dro
p, in
ch H
2O
Flow rate, bpd
Calculatd DP - WC0 - D130 - 0 Measured DP - WC0 - D130 -
Calculatd DP - WC100 - 0 Measured DP - WC100 - 0
0
100
200
300
400
500
600
700
800
0 2000 4000 6000 8000 10000 12000
Pres
sure
Dro
p, in
ch H
2O
Flow Rate, bpd
Calculated DP - WC0 - D130 - Measured DP - WC0 - D130 -
Calculated DP - WC100 - 0 Measured DP - WC100 -
51
From the above figures, it can be concluded that the validation results showed a good
agreement between the measured and calculated pressure drop measurements. Also from
the same figures for both oils and water single phase which corresponding to 0 % and
100% water cut respectively, it can be observe that the maximum flow rate does not reach
12000 bpd due to the using half power of the pumping system in the cases of single phases,
because of each single pump can deliver up to 5000 bpd and maximum single-phase flow
rated can be obtain is less than 12000 bpd.
4.2 Determination of Modified Venturi Discharge Coefficient, k
For oil-water two-phase flow conditions, the determination of conventional venturi
discharge coefficient (Cd) requires the measurement of parameters, such as the fluid
throat area. A modified venturi discharge coefficient, k, which is a function of pressure
losses and venturi geometry, is introduced in the present study. The value of k can be
obtained by simplifying the venturi governing Eq. 4.1 as:
(4.5)
Where,
Qm = Fluid mixture flow rate, m3/h
P = Venturi pressure drop, Pa

52
m = Fluid mixture density, kg/m3
k = Modified venturi discharge coefficient, m2.s/h
The experimental results of the modified venturi discharge coefficient, k, are plotted
against the water cut for different fluid mixture flow rates in Figures 5.6a to 5.6l.
Determination of Error Percentages, %:
Based on the average value of k, the percentage error in the total fluid flow rate was
calculated for all inclinations of the flow loop and are presented in Figures 5.6b to 5.6l.
The percentage error in fluid mixture flow rate is calculated from the following equation:
(4.6)
Where,
Qmeas = Measured fluid mixture flow rate, m3/h
Qcal = Calculated fluid mixture flow rate, m3/h.
The results of percentages of the error are presented graphically 5.6b to 5.6l.

53
4.3 Determination of Venturi Discharge Coefficient, Cd
The following relation between the coefficient k and Cd can be obtained by combining
Eqs. 4.1 and 4.5:
(4.7)
Where,
Ap is the inlet pipe cross-sectional area.
Then, Cd can be written in
(4.8)
Eq. 4.8 was used to calculate the Cd using the average k values of each of the three venturi
meters, as discussed in the previous section. The obtained Cd is plotted against the water
cut for different fluid mixture flow rates and for horizontal inclination of the flow loop for
the three venturi meters. The results of Cd are presented graphically in Figures 5.7a to
5.7f.
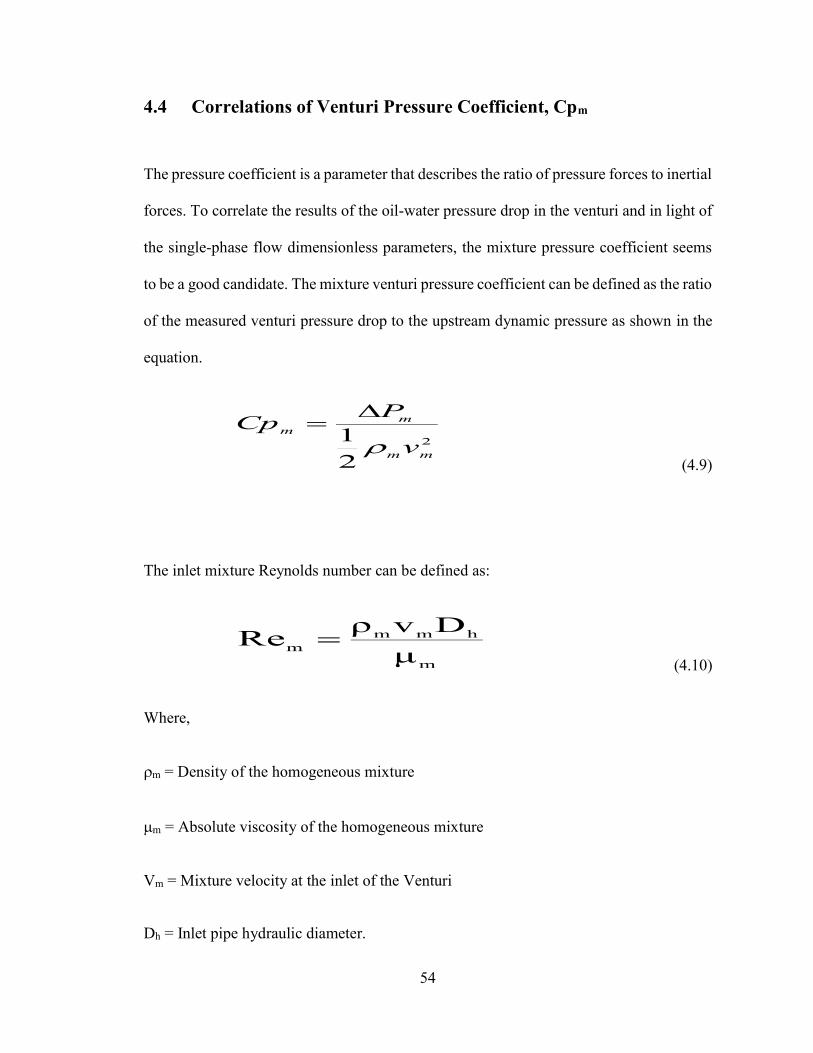
54
4.4 Correlations of Venturi Pressure Coefficient, Cpm
The pressure coefficient is a parameter that describes the ratio of pressure forces to inertial
forces. To correlate the results of the oil-water pressure drop in the venturi and in light of
the single-phase flow dimensionless parameters, the mixture pressure coefficient seems
to be a good candidate. The mixture venturi pressure coefficient can be defined as the ratio
of the measured venturi pressure drop to the upstream dynamic pressure as shown in the
equation.
(4.9)
The inlet mixture Reynolds number can be defined as:
(4.10)
Where,
m = Density of the homogeneous mixture
m = Absolute viscosity of the homogeneous mixture
Vm = Mixture velocity at the inlet of the Venturi
Dh = Inlet pipe hydraulic diameter.

55
Generally, to analyze and plot the experimental data for generating a new formula to
correlate the different operational parameters, any curve fitting softwares and regression
programs could be used for handling the dependent and independent parameters.
In this study, a new software called DataFit [40] was used to find a relationship for all
experimental data. DataFit is an engineering tool can be utilized to simplify the statistical
and regression analyses, and data plotting. The images of some screen samples of DataFit
program are shown in Figures 4.2a and 4.2b.
Figure 4.2a: Aphotograph of the main window of the DataFit software.

56
Figure 4.2b: Aphotograph of the window of detailed numerical results of the DataFit software.
To study the effect of the mixture Reynolds numbers on the mixture venturi pressure
coefficient, the completely experimental data of each oil have been used to develop several
correlations for the mixture pressure coefficient based on the following parameters:
1. Venturi beta ratio.
2. Flow loop inclination.
3. Mixture Reynolds number.
4. Water cut percentage.
Therefore, two exponential empirical correlations have been developed to predict the
mixture pressure coefficient for the complete data set of both oils D80 and D130,

57
individually. In order to study the behavior of the mixture venturi pressure coefficient with
the mixture Reynolds numbers, the measured values obtained from Eq. 4.9 and the
predicted values are plotted in Figures 5.9a to 5.9f for the three venturi meters and for
different operational condition.
Reduction of Correlations Input Variables:
To accomplish which inputs contribute most to output variability, we need to identify
relationships between input parameters and the output parameters. When the four in puts
parameters were examined by excluding each parameter and to see its effect on the
predicted values of venturi pressure coefficient, we end up with: the water cut and
inclination have not too much effect and relative contribution on the correlation
predictions. Based on the previous assumptions, two input parameters are not correlated
which include: water cut and inclination.
Moreover, due to the very small difference between viscosities of oil D80 and oil D130,
the complete set of data under the same experimental conditions of both oils was used to
develop a new powered correlation for each oil-water ratio.
The generated correlation correlated the mixture Reynolds number and venturi beta ratio
as input parameters for each certain water cut. However, the imperial power correlation
showed a great potential in predicting of the mixture pressure coefficient when compared
with those obtained for each individual oil data when both inclination and water cut were
considered.

58
4.5 Uncertainty Analysis
Uncertainty analysis is a tool utilized to estimate the limits of unknown errors and to
describe the reliability of the experimental data.
Generally, according to Morgan and Henrion (1990) [41], Isukapalli (1999) [42], Yen
(2002) [43] and U.S. EPA (2003) [44] the uncertainty analysis can be classified as follow:
I. Scenario Uncertainty
II. Parameter Variability
III. Parameter Uncertainty
IV. Model Uncertainty
Firstly, scenario uncertainty is the uncertainty associated with the process of applying a
model wherein a petroleum release situation is reduced to a scenario that can be modeled
by a numerical model. Some assumptions should be applied in order to introduce and to
describe the scenario uncertainty Isukapalli (1999) [42] and U.S. EPA (2003) [44].
Secondly, parameter variability is also mentioned to as natural uncertainty. Regarding to
U.S. EPA (1996) [45], numerous of quantities are variable over time, number or space of
samples and variability refers to this essential statistical variance.
Thirdly, parameter uncertainty is the uncertainty because of parameters estimations.
These comprise what are typically named data uncertainties, which are:
a) Measurement errors
b) Inconsistency and non-homogeneity of data.
c) Data handling and transcription errors.

59
d) Inadequate representativeness of data sample due to the limitations of time and space.
Finally, model uncertainty is used to describe uncertainties associated with the use of the
numerical models in coding processes and is sometimes extended to contain scenario
uncertainty.
In this experimental work, the pressure drop observations were measured. Nevertheless,
there are errors associated with the pressure drop measurements; therefore, in order to
estimate the limits of these errors the Uncertainty analysis (Measurement error) was
performed. Uncertainty analysis requires careful planning and implementation to improve
the quality measurements and ensure that the study objectives are met.
In this section, the main focusing and concentration were placed on the parameter
uncertainty, specifically on measurement errors of the venture pressure drop. Moreover,
these measurement uncertainties can be classified into two main types:
1. Random Uncertainty, Ur
2. Systematic Uncertainty, Us
Random Uncertainty, Ur:
Random (or Type A) uncertainty, Ur, is a statistical determination of error in the
experimental measurements, R. H. Dieck (2000) [46]. It is also called the precision error.
Based on the standard deviation this type of errors can be expressed mathematically as
follow:

60
Standard deviation, Sx, of N samples is given as:
(4.11)
Pooled standard deviation is obtained from the following equation:
(4.12)
Where,
Sx1 , Sx2 ,and Sx3 are the standrard deviations of different sets, having the same number of
samples, of the same experiment.
Random uncertainty, Ur, which is also called the standard error is as follows:
(4.13)
Where Ur is the random uncertainty, the coverage factor K (Table 4.1) is used to estimate
this error within 95% confidence level.
(4.14)

61
Systematic Uncertainty, Us:
Systematic (or Type B) uncertainty, Us, refers to the measurement error associated with
the equipment, operator, physical conditions, etc. The systematic uncertainty is given by
the following equation:
(4.15)
Where,
a1, a2 and a3 are the systematic (or Type B) uncertainties.
Commonly this error occurs due to the experimental conditions and physical conditions.
In our experiments systematic errors mainly comes from calibration errors. Due to that, to
avoid this kind of uncertainty, all the measuring instrumentations used for the experiments
were calibrated. Because of this reason the pressure drop of single phase experiments of
oil (WC0%) and water (WC100%) were conducted as shown in Figures 4.1a to 4.1f, and
then compared with calculated pressure drop measurements with enhancement of venture
discharge coefficient provided by the manufacture to confirm the accuracy of these
instrumentations (especially, pressure drop transmitters DPT and LPT).

62
Expanded Uncertainty, Ue:
The combination of these errors (Random and systematic) is known as expanded
uncertainty, it can be given by the following equation, Ue, for a coverage factor of K:
(4.16)
Where,
K is a coverage factor. The value of K depends on the confidence level, which is given in
the table below:
Table 4.1: Coverage factor versus confidence level (CL)
Generally, the uncertainty in the experimental data is calculated at 95% confidence level,
i.e. for a coverage factor of K = 2
Therefore, for coverage factor, K = 2 (CL = 95%), expanded uncertainty is given by the
following equation, Ue:
(4.17)
Coverage Factor, K Confidence Level (CL), %
1 68
2 95
3 99

63
Microsoft excel program was used to run the correlations from 4.11 to 4.17, to calculate
the uncertainty analyses calculations which include the random, systematic and expended
uncertainties for the all measured data. The measured data of two oils (D80 and D130) for
ions have been
used for the uncertainty analysis. The following figures have been plotted for the random
uncertainty of venturi pressure drops for all flow rates.
Uncertainty Results for Oil D80 Data:
For the three venturi metes and all flow loop inclinations for measured experimental data
of oil D80, the random uncertainty has been plotted in Figures 4.3a to 4.3h. As can be
seen from the Figures, the random uncertainty is less than 0.25% for the measured venturi
pressure drops for all: flow rates, water cuts and configurations of the flow loop. In
addition, the plots showed that the higher values of the random uncertainty associated with
single-phase (WC0% and WC100%) experiments of flow rate (12000 bpd) for the venturi
of beta ratio of 0.5. That is because of inability to take exactly the same calculated
measurement of the pressure drop at this flow rate (12000 bpd) due to the limitations in
the pumping system.
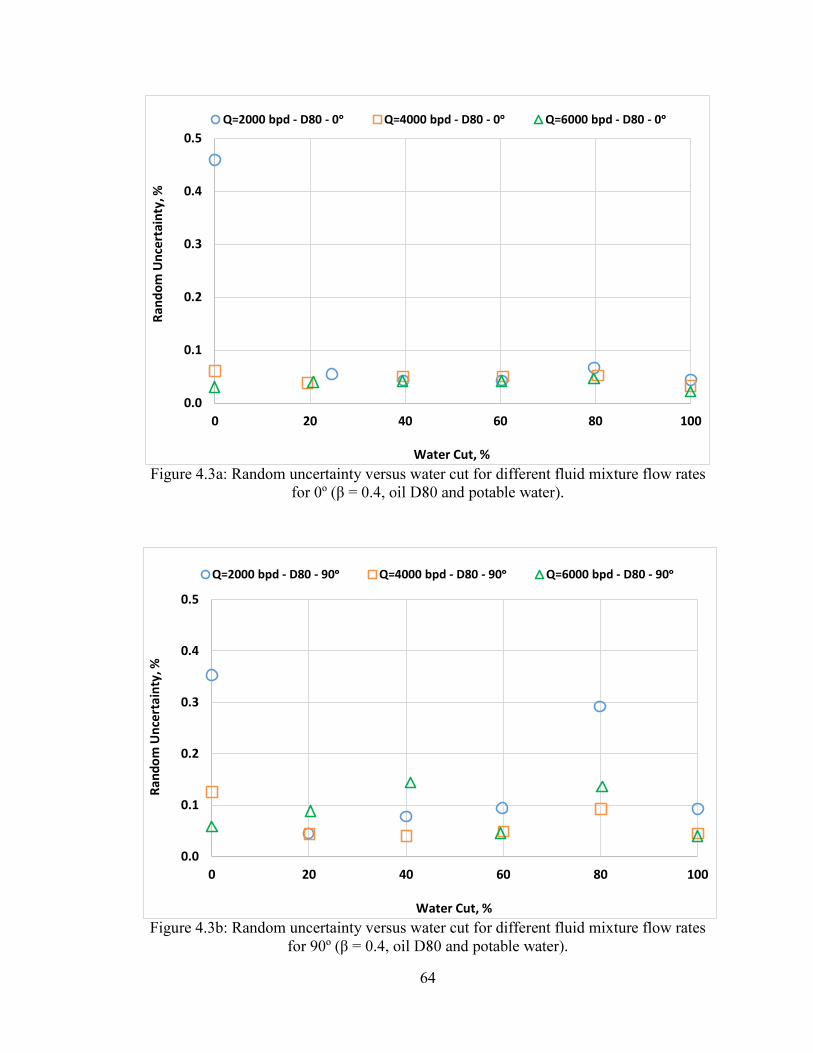
64
Figure 4.3a: Random uncertainty versus water cut for different fluid mixture flow rates
Figure 4.3b: Random uncertainty versus water cut for different fluid mixture flow rates
0.0
0.1
0.2
0.3
0.4
0.5
0 20 40 60 80 100
Rand
om U
ncer
tain
ty, %
Water Cut, %
Q=2000 bpd - D80 - Q=4000 bpd - D80 - 0 Q=6000 bpd - D80 -
0.0
0.1
0.2
0.3
0.4
0.5
0 20 40 60 80 100
Rand
om U
ncer
tain
ty, %
Water Cut, %
Q=2000 bpd - D80 - 90 Q=4000 bpd - D80 - 90 Q=6000 bpd - D80 - 90

65
Figure 4.3c: Random uncertainty versus water cut for different fluid mixture flow rates
Figure 4.3d: Random uncertainty versus water cut for different fluid mixture flow rates
0.0
0.1
0.2
0.3
0.4
0.5
0 20 40 60 80 100
Rand
om U
ncer
tain
ty, %
Water Cut, %
Q=2000 bpd - D80 - Q=4000 bpd - D80 - 0 Q=6000 bpd - D80 - 0
Q=8000 bpd - D80 - 0 Q=10000 bpd - D80 - Q=120000 bpd - D80 -
0.0
0.1
0.2
0.3
0.4
0.5
0 20 40 60 80 100
Rand
om U
ncer
tain
ty, %
Water Cut, %
Q=2000 bpd - D80 - Q=4000 bpd - D80 - 40Q=6000 bpd - D80 - 40 Q=8000 bpd - D80 - 40Q=10000 bpd - D80 - Q=120000 bpd - D80 -
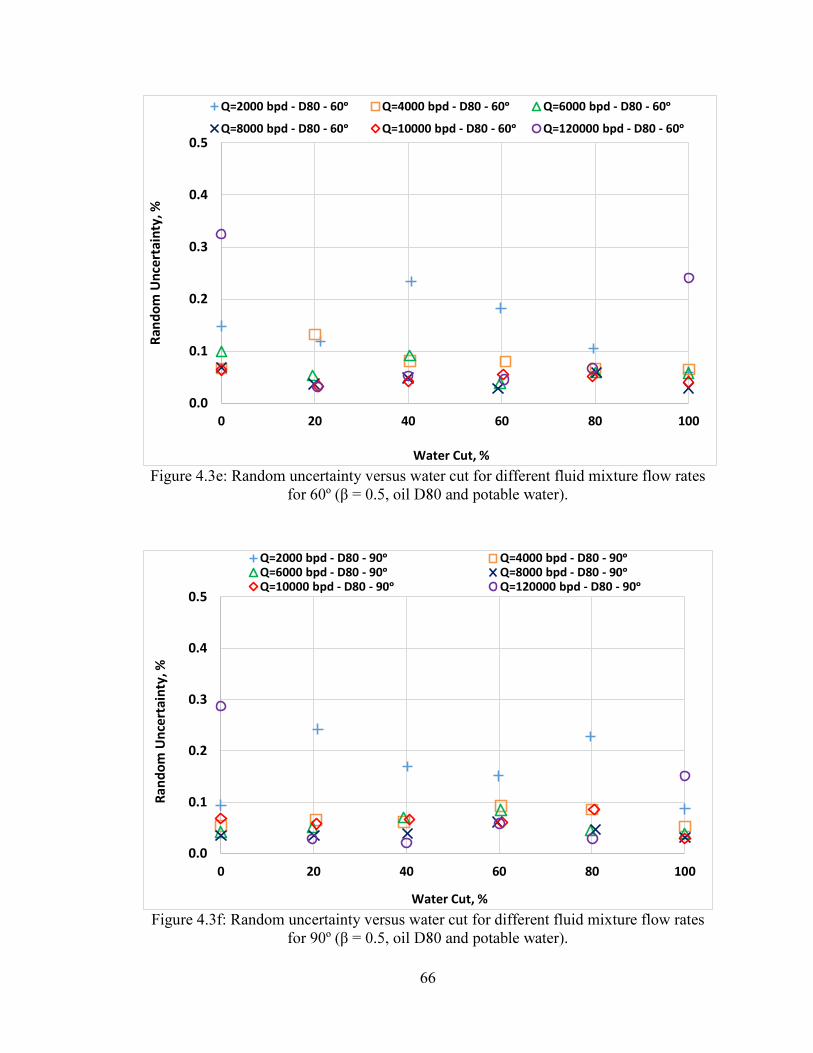
66
Figure 4.3e: Random uncertainty versus water cut for different fluid mixture flow rates
Figure 4.3f: Random uncertainty versus water cut for different fluid mixture flow rates
0.0
0.1
0.2
0.3
0.4
0.5
0 20 40 60 80 100
Rand
om U
ncer
tain
ty, %
Water Cut, %
Q=2000 bpd - D80 - 60 Q=4000 bpd - D80 - 60 Q=6000 bpd - D80 - 60
Q=8000 bpd - D80 - Q=10000 bpd - D80 - Q=120000 bpd - D80 - 60
0.0
0.1
0.2
0.3
0.4
0.5
0 20 40 60 80 100
Rand
om U
ncer
tain
ty, %
Water Cut, %
Q=2000 bpd - D80 - 90 Q=4000 bpd - D80 - 90Q=6000 bpd - D80 - 90 Q=8000 bpd - D80 -Q=10000 bpd - D80 - Q=120000 bpd - D80 - 90
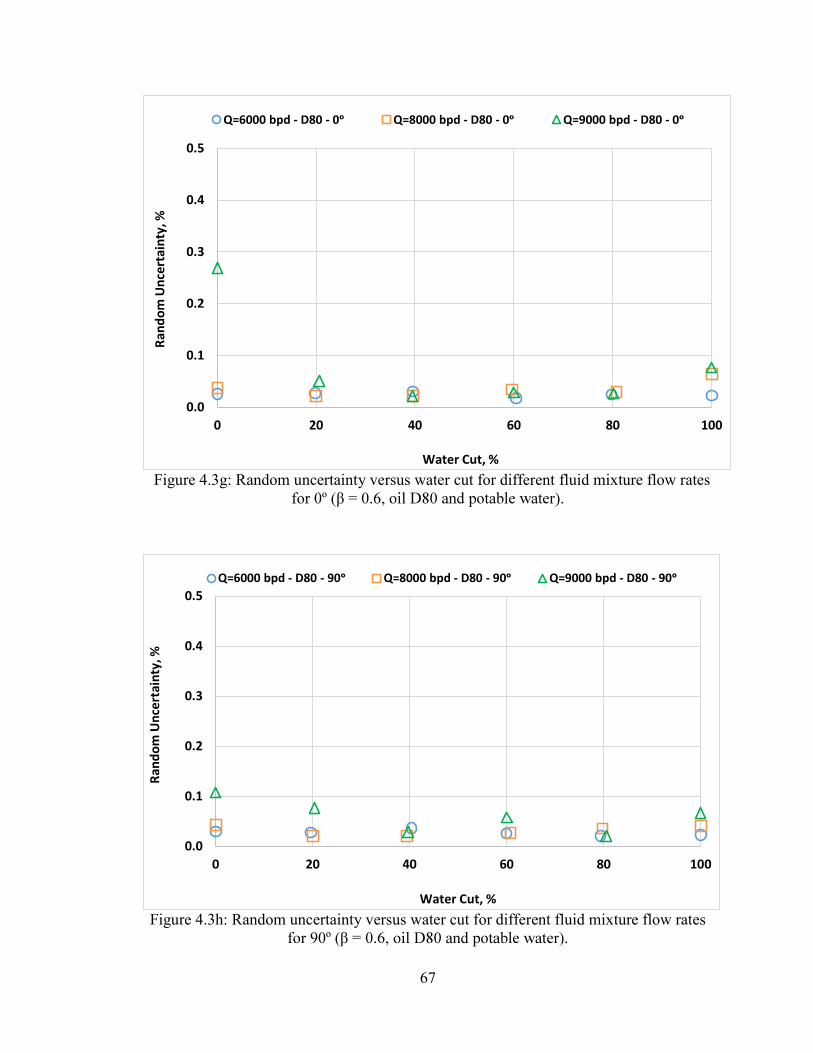
67
Figure 4.3g: Random uncertainty versus water cut for different fluid mixture flow rates
Figure 4.3h: Random uncertainty versus water cut for different fluid mixture flow rates
0.0
0.1
0.2
0.3
0.4
0.5
0 20 40 60 80 100
Rand
om U
ncer
tain
ty, %
Water Cut, %
Q=6000 bpd - D80 - Q=8000 bpd - D80 - 0 Q=9000 bpd - D80 - 0
0.0
0.1
0.2
0.3
0.4
0.5
0 20 40 60 80 100
Rand
om U
ncer
tain
ty, %
Water Cut, %
Q=6000 bpd - D80 - Q=8000 bpd - D80 - 90 Q=9000 bpd - D80 -

68
Uncertainty Results for Oil D130 Data:
All uncertainty analysis (random, systematic and expanded) of oil D130 data of the three-
orientations, have been evaluated. The random uncertainty plotted in Figures 4.4a to 4.4f.
Similar behavior was observed as shown in the following Figures. Correspondingly, the
highest values displayed at single phase experiments of the highest flow rate (12000 bpd)
with random uncertainty exceed 0.3%, due to the incapability of the pumping system in
the single phase experiments.
Figure 4.4a: Random uncertainty versus water cut for different fluid mixture flow rates
0.0
0.1
0.2
0.3
0.4
0.5
0 20 40 60 80 100
Rand
om U
ncer
tain
ty, %
Water Cut, %
Q=2000 bpd - D130 - Q=4000 bpd - D130 - Q=6000 bpd - D130 - 0

69
Figure 4.4b: Random uncertainty versus water cut for different fluid mixture flow rates
Figure 4.4c: Random uncertainty versus water cut for different fluid mixture flow rates
0.0
0.1
0.2
0.3
0.4
0.5
0 20 40 60 80 100
Rand
om U
ncer
tain
ty, %
Water Cut, %
Q=2000 bpd - D130 - Q=4000 bpd - D130 - Q=6000 bpd - D130 - 90
0.0
0.1
0.2
0.3
0.4
0.5
0 20 40 60 80 100
Rand
om U
ncer
tain
ty, %
Water Cut, %
Q=2000 bpd - D130 - 0 Q=4000 bpd - D130 - 0 Q=6000 bpd - D130 -
Q=8000 bpd - D130 - Q=10000 bpd - D130 - Q=120000 bpd - D130 - 0

70
Figure 4.4d: Random uncertainty versus water cut for different fluid mixture flow rates
Figure 4.4e: Random uncertainty versus water cut for different fluid mixture flow rates
0.0
0.1
0.2
0.3
0.4
0.5
0 20 40 60 80 100
Rand
om U
ncer
tain
ty, %
Water Cut, %
Q=2000 bpd - D130 - Q=4000 bpd - D130 -Q=6000 bpd - D130 - 90 Q=8000 bpd - D130 - 90Q=10000 bpd - D130 - Q=120000 bpd - D130 - 90
0.0
0.1
0.2
0.3
0.4
0.5
0 20 40 60 80 100
Rand
om U
ncer
tain
ty, %
Water Cut, %
Q=8000 bpd - D130 - Q=10000 bpd - D130 - Q=12000 bpd - D130 - 0

71
Figure 4.4 f: Random uncertainty versus water cut for different fluid mixture flow rates
Error analyses were carried out on the venturi pressure drop measurements in the
experiments and flow rates from 2,000 bpd to 12,000 bpd. The results yielded standard
errors (random errors) between 0.022% to 0.459%, 0.034% to 0.187% and 0.044% to
The random uncertainty plots do not show any high values which less than 0.5% due to
very low standard error. As stated earlier, the highest errors associated with highest flow
rate especially at the single phases (WC= 0 and 100%) because of pumps limitations. To
avoid the precision limitations measurement of the single-phase experiments, two pumps
should be installed one of them in the oil line and the other at the water section.
Further deatails for the random, systematic and expanded uncertainties are presented
Appendix A.
0.0
0.1
0.2
0.3
0.4
0.5
0 20 40 60 80 100
Rand
om U
ncer
tain
ty, %
Water Cut, %
Q=8000 bpd - D130 - 90 Q=10000 bpd - D130 - 90 Q=12000 bpd - D130 -
72
Based on the analyses presented in this part it can be concluded that a parametric
uncertainty analysis (random, systematic and expanded) of all experimental data of both
oils (D80 and 130) can be accurately and efficiently undertaken.
73
5 CHAPTER 5
RESULTS AND DISCUSSIONS
At the completion of the all experiments, the experimental investigations for oil D80 and
oil D130 were carried out to study the effect of different water cut, venturi beat ratio, fluid
mixture flow rate and flow loop inclinations on venturi pressure drop measurements for
0.6) for different water cuts ranging from 0 to
100% in step of 20%, flow rates varying between 2000 to 12000 bpd, and horizontal and
vertical of the inclinable flow loop. The experimental results are presented as follow.
5.1 Effect of Fluid Mixture Flow Rate on Venturi Pressure Drop for
Different Water Cuts for Oils D80 and D130
The effect of fluid mixture flow rate on venturi pressure drop for different water cuts are
presented in Figures 5.1a to 5.1n for horizontal and vertical flow loop inclinations for the
venturi pressure drop varies parabolically with fluid mixture flow rates for a given water
cut.
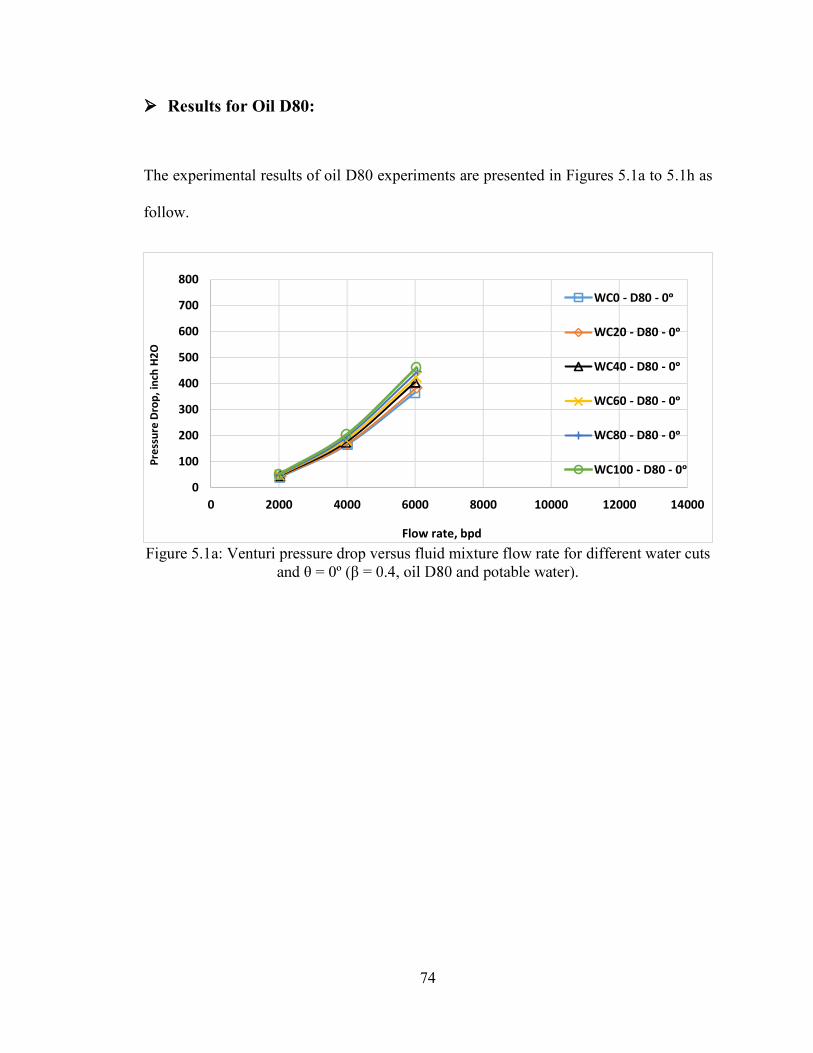
74
Results for Oil D80:
The experimental results of oil D80 experiments are presented in Figures 5.1a to 5.1h as
follow.
Figure 5.1a: Venturi pressure drop versus fluid mixture flow rate for different water cuts = 0º
0
100
200
300
400
500
600
700
800
0 2000 4000 6000 8000 10000 12000 14000
Pres
sure
Dro
p, in
ch H
2O
Flow rate, bpd
WC0 - D80 - 0
WC20 - D80 -
WC40 - D80 - 0
WC60 - D80 -
WC80 - D80 - 0
WC100 - D80 -

75
Figure 5.1b: Venturi pressure drop versus fluid mixture flow rate for different water cuts
Figure 5.1c: Venturi pressure drop versus fluid mixture flow rate for different water cuts
0
100
200
300
400
500
600
700
800
0 2000 4000 6000 8000 10000 12000 14000
Pres
sure
Dro
p, in
ch H
2O
Flow rate, bpd
WC0 - D80 -
WC20 - D80 - 90
WC40 - D80 -
WC60 - D80 - 90
WC80 - D80 -
WC100 - D80 - 90
0
100
200
300
400
500
600
700
800
0 2000 4000 6000 8000 10000 12000 14000
Pres
sure
Dro
p, in
ch H
2O
Flow rate, bpd
WC0 - D80 -
WC20 - D80 - 0
WC40 - D80 -
WC60 - D80 - 0
WC80 - D80 -
WC100 - D80 - 0

76
Figure 5.1d: Venturi pressure drop versus fluid mixture flow rate for different water cuts
Figure 5.1e: Venturi pressure drop versus fluid mixture flow rate for different water cuts er).
0
100
200
300
400
500
600
700
800
0 2000 4000 6000 8000 10000 12000 14000
Pres
sure
Dro
p, in
ch H
2O
Flow Rate, bpd
WC0 - D80 - 40 WC20 - D80 - WC40 - D80 - 40
WC60 - D80 - WC80 - D80 - WC100 - D80 - 40
0
100
200
300
400
500
600
700
800
0 2000 4000 6000 8000 10000 12000 14000
Pres
sure
Dro
p, in
ch H
2O
Flow Rate, bpd
WC0 - D80 - 60 WC20 - D80 - WC40 - D80 - 60
WC60 - D80 - WC80 - D80 - WC100 - D80 - 60

77
Figure 5.1f: Venturi pressure drop versus fluid mixture flow rate for different water cuts
Figure 5.1g: Venturi pressure drop versus fluid mixture flow rate for different water cuts
0
100
200
300
400
500
600
700
800
0 2000 4000 6000 8000 10000 12000 14000
Pres
sure
Dro
p, in
ch H
2O
Flow Rate, bpd
WC0 - D80 - WC20 - D80 - 90 WC40 - D80 -
WC60 - D80 - 90 WC80 - D80 - 90 WC100 - D80 -
0
100
200
300
400
500
600
700
800
0 2000 4000 6000 8000 10000 12000 14000
Pres
sure
Dro
p, in
ch H
2O
Flow Rate, bpd
WC0 - D80 - WC20 - D80 - 0 WC40 - D80 -
WC60 - D80 - 0 WC80 - D80 - 0 WC100 - D80 -

78
Figure 5.1h: Venturi pressure drop versus fluid mixture flow rate for different water cuts d potable water).
Results for Oil D130:
The effect of fluid mixture flow rate on venturi pressure drop for different water cuts for
oil D130 are presented in Figures 5.1i to 5.1n for horizontal and vertical inclinations flow
loop. Also, it is obviously from the graphical results that the venturi pressure drop varies
parabolically with fluid mixture flow rates for given water cut.
0
100
200
300
400
500
600
700
800
0 2000 4000 6000 8000 10000 12000 14000
Pres
sure
Dro
p, in
ch H
2O
Flow Rate, bpd
WC0 - D80 - 90 WC20 - D80 - WC40 - D80 - 90
WC60 - D80 - WC80 - D80 - 90 WC100 - D80 -
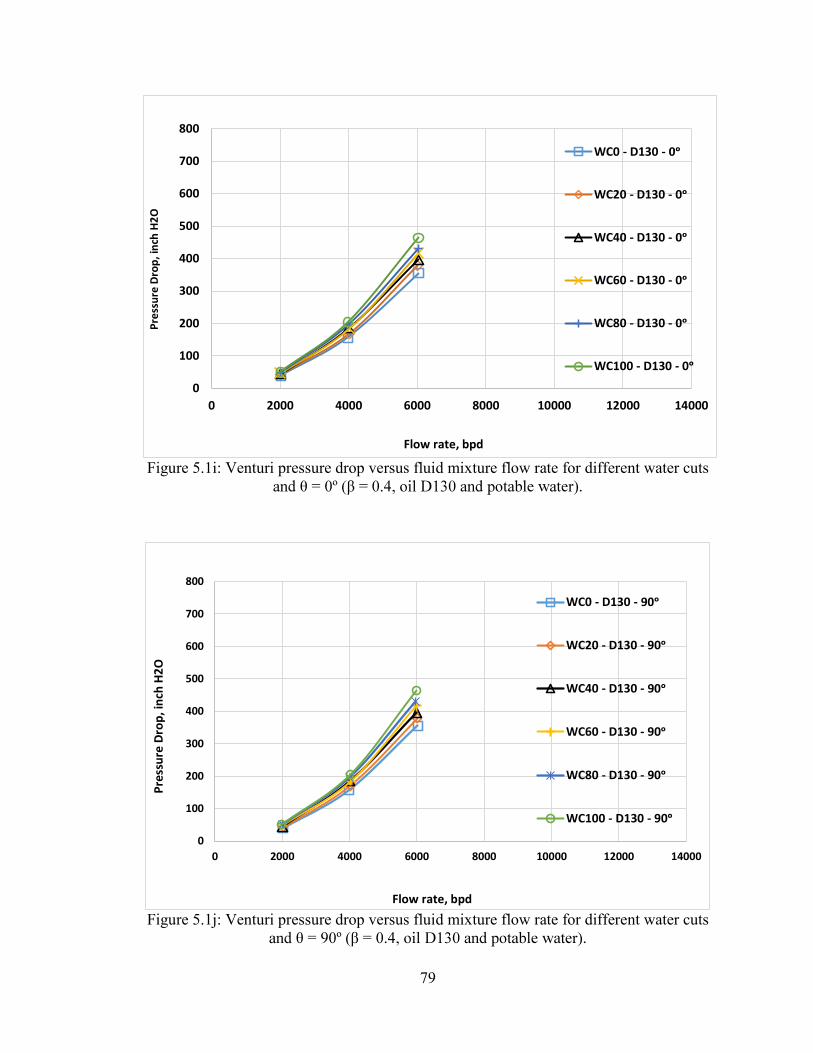
79
Figure 5.1i: Venturi pressure drop versus fluid mixture flow rate for different water cuts
Figure 5.1j: Venturi pressure drop versus fluid mixture flow rate for different water cuts
0
100
200
300
400
500
600
700
800
0 2000 4000 6000 8000 10000 12000 14000
Pres
sure
Dro
p, in
ch H
2O
Flow rate, bpd
WC0 - D130 -
WC20 - D130 - 0
WC40 - D130 -
WC60 - D130 - 0
WC80 - D130 -
WC100 - D130 - 0
0
100
200
300
400
500
600
700
800
0 2000 4000 6000 8000 10000 12000 14000
Pres
sure
Dro
p, in
ch H
2O
Flow rate, bpd
WC0 - D130 -
WC20 - D130 - 90
WC40 - D130 -
WC60 - D130 - 90
WC80 - D130 -
WC100 - D130 - 90
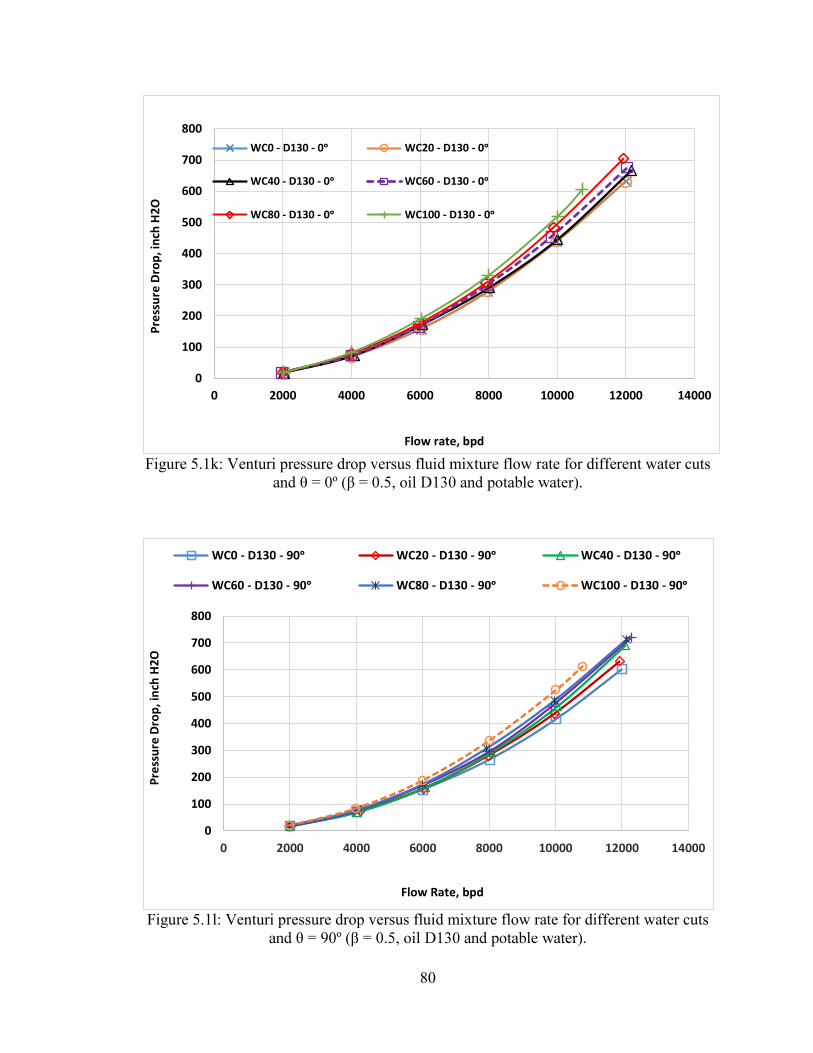
80
Figure 5.1k: Venturi pressure drop versus fluid mixture flow rate for different water cuts
Figure 5.1l: Venturi pressure drop versus fluid mixture flow rate for different water cuts
0
100
200
300
400
500
600
700
800
0 2000 4000 6000 8000 10000 12000 14000
Pres
sure
Dro
p, in
ch H
2O
Flow rate, bpd
WC0 - D130 - 0 WC20 - D130 -
WC40 - D130 - 0 WC60 - D130 -
WC80 - D130 - WC100 - D130 - 0
0
100
200
300
400
500
600
700
800
0 2000 4000 6000 8000 10000 12000 14000
Pres
sure
Dro
p, in
ch H
2O
Flow Rate, bpd
WC0 - D130 - 90 WC20 - D130 - WC40 - D130 - 90
WC60 - D130 - WC80 - D130 - WC100 - D130 - 90
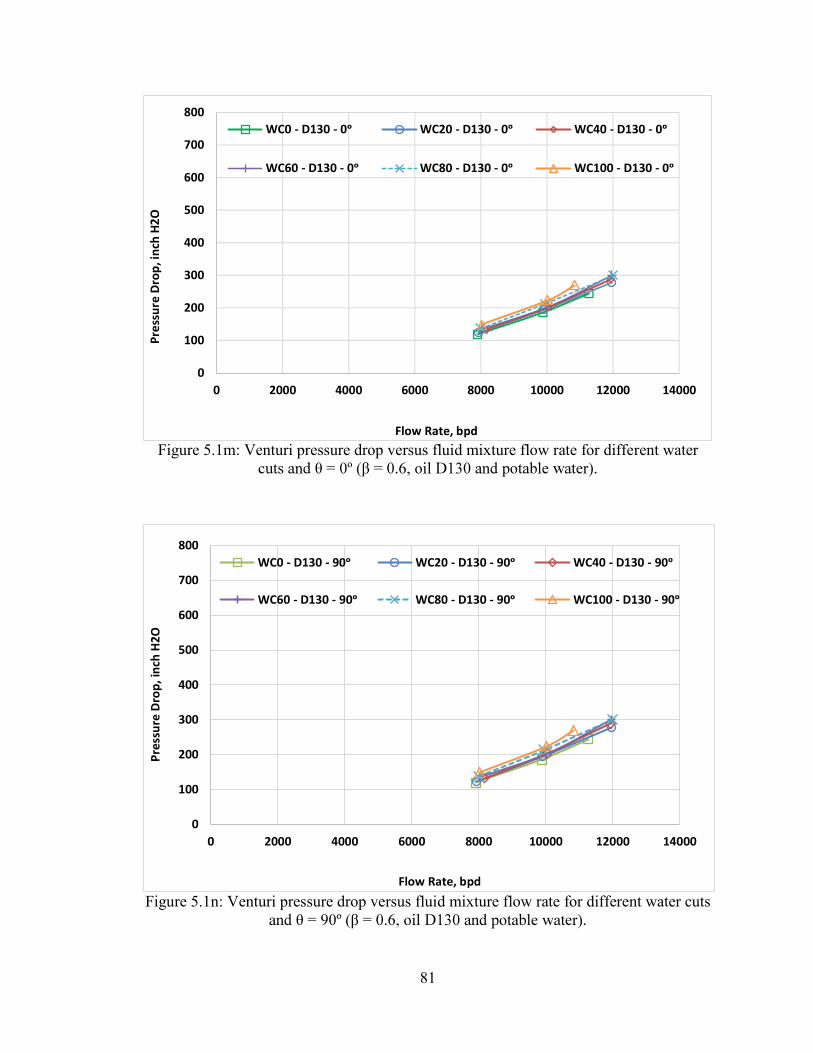
81
Figure 5.1m: Venturi pressure drop versus fluid mixture flow rate for different water
Figure 5.1n: Venturi pressure drop versus fluid mixture flow rate for different water cuts
0
100
200
300
400
500
600
700
800
0 2000 4000 6000 8000 10000 12000 14000
Pres
sure
Dro
p, in
ch H
2O
Flow Rate, bpd
WC0 - D130 - WC20 - D130 - 0 WC40 - D130 -
WC60 - D130 - 0 WC80 - D130 - 0 WC100 - D130 -
0
100
200
300
400
500
600
700
800
0 2000 4000 6000 8000 10000 12000 14000
Pres
sure
Dro
p, in
ch H
2O
Flow Rate, bpd
WC0 - D130 - WC20 - D130 - 90 WC40 - D130 -
WC60 - D130 - 90 WC80 - D130 - 90 WC100 - D130 -

82
In all cases of single phase (WC0% and WC100%), it can be observe that the points of
maximum flow rate 12000 bpd were not obtained due to of using half of the pumping
system.
In conclusion, the same trend in venturi pressure drop is observed for results of oil D80
and oil D130 in Figures 5.1i to 5.1n for all water cuts ranging from 0% to 100% and for
the two inclinations of the flow loop. The experimental results show that the fluid mixture
flow rates have a significant effect on venturi pressure drop for the given water cut - or
fluid mixture density. For a given flow rate and water cut, the venturi pressure drop is
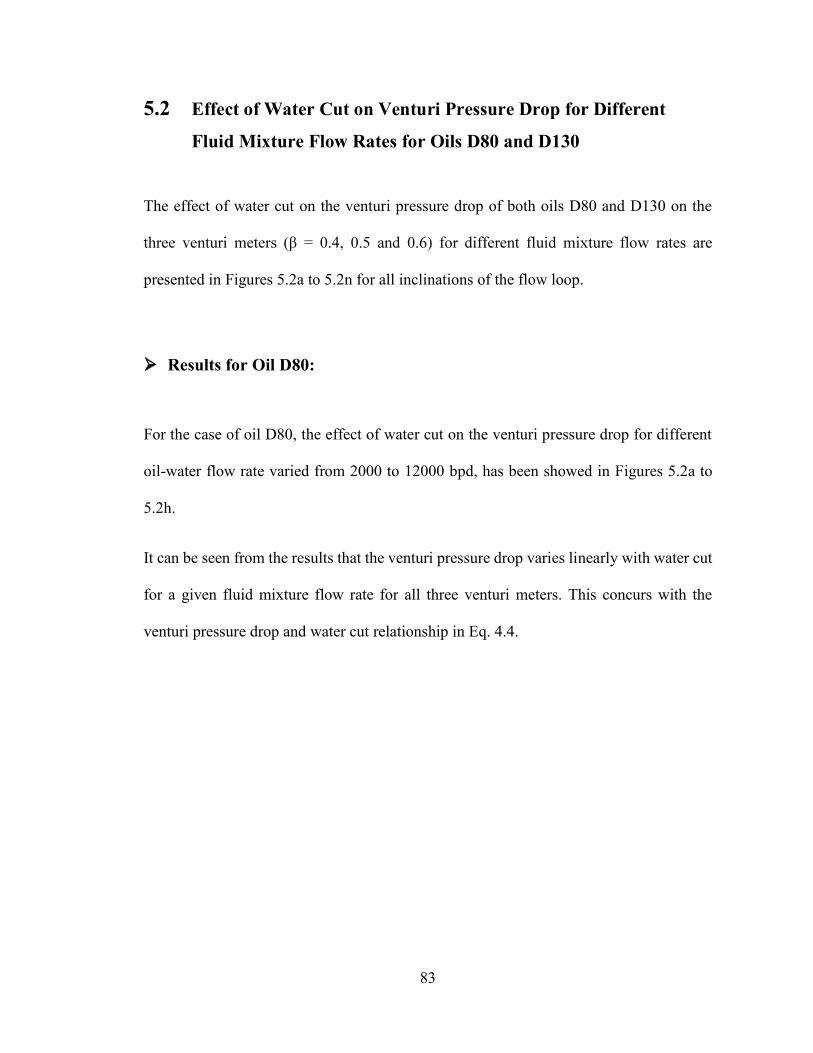
83
5.2 Effect of Water Cut on Venturi Pressure Drop for Different
Fluid Mixture Flow Rates for Oils D80 and D130
The effect of water cut on the venturi pressure drop of both oils D80 and D130 on the
rates are
presented in Figures 5.2a to 5.2n for all inclinations of the flow loop.
Results for Oil D80:
For the case of oil D80, the effect of water cut on the venturi pressure drop for different
oil-water flow rate varied from 2000 to 12000 bpd, has been showed in Figures 5.2a to
5.2h.
It can be seen from the results that the venturi pressure drop varies linearly with water cut
for a given fluid mixture flow rate for all three venturi meters. This concurs with the
venturi pressure drop and water cut relationship in Eq. 4.4.

84
Figure 5.2a: Venturi pressure drop versus water cut for different fluid mixture flow rates
Figure 5.2b: Venturi pressure drop versus water cut for different fluid mixture flow rates able water).
0
100
200
300
400
500
600
700
800
0 20 40 60 80 100
Pres
sure
Dro
p, in
ch H
2O
Water Cut, %
Q=2000 bpd - D80 - 0
Q=4000 bpd - D80 -
Q=2000 bpd - D80 - 0
0
100
200
300
400
500
600
700
800
0 20 40 60 80 100
Pres
sure
Dro
p, in
ch H
2O
Water Cut, %
Q=2000 bpd - D80 -
Q=4000 bpd - D80 -
Q=6000 bpd - D80 - 90

85
Figure 5.2c: Venturi pressure drop versus water cut for different fluid mixture flow rates
Figure 5.2d: Venturi pressure drop versus water cut for different fluid mixture flow rates
0
100
200
300
400
500
600
700
800
0 20 40 60 80 100
Pres
sure
Dro
p, in
ch H
2O
Water Cut, %
Q=2000 bpd - D80 - 0 Q=4000 bpd - D80 - 0 Q=6000 bpd - D80 -
Q=8000 bpd - D80 - Q=10000 bpd - D80 - Q=12000 bpd - D80 - 0
0
100
200
300
400
500
600
700
800
0 20 40 60 80 100
Pres
sure
Dro
p, in
ch H
2O
Water Cut, %
Q=2000 bpd - D80 - 40 Q=4000 bpd - D80 - 40 Q=6000 bpd - D80 -
Q=8000 bpd - D80 - Q=10000 bpd - D80 - Q=12000 bpd - D80 - 40

86
Figure 5.2e: Venturi pressure drop versus water cut for different fluid mixture flow rates
Figure 5.2f: Venturi pressure drop versus water cut for different fluid mixture flow rates
0
100
200
300
400
500
600
700
800
0 20 40 60 80 100
Pres
sure
Dro
p, in
ch H
2O
Water Cut, %
Q=2000 bpd - D80 - Q=4000 bpd - D80 - Q=6000 bpd - D80 - 60
Q=8000 bpd - D80 - 60 Q=10000 bpd - D80 - 60 Q=12000 bpd - D80 -
0
100
200
300
400
500
600
700
800
0 20 40 60 80 100
Pres
sure
Dro
p, in
ch H
2O
Water Cut, %
Q=2000 bpd - D80 - Q=4000 bpd - D80 - Q=6000 bpd - D80 - 90
Q=8000 bpd - D80 - 90 Q=10000 bpd - D80 - 90 Q=120000 bpd - D80 -
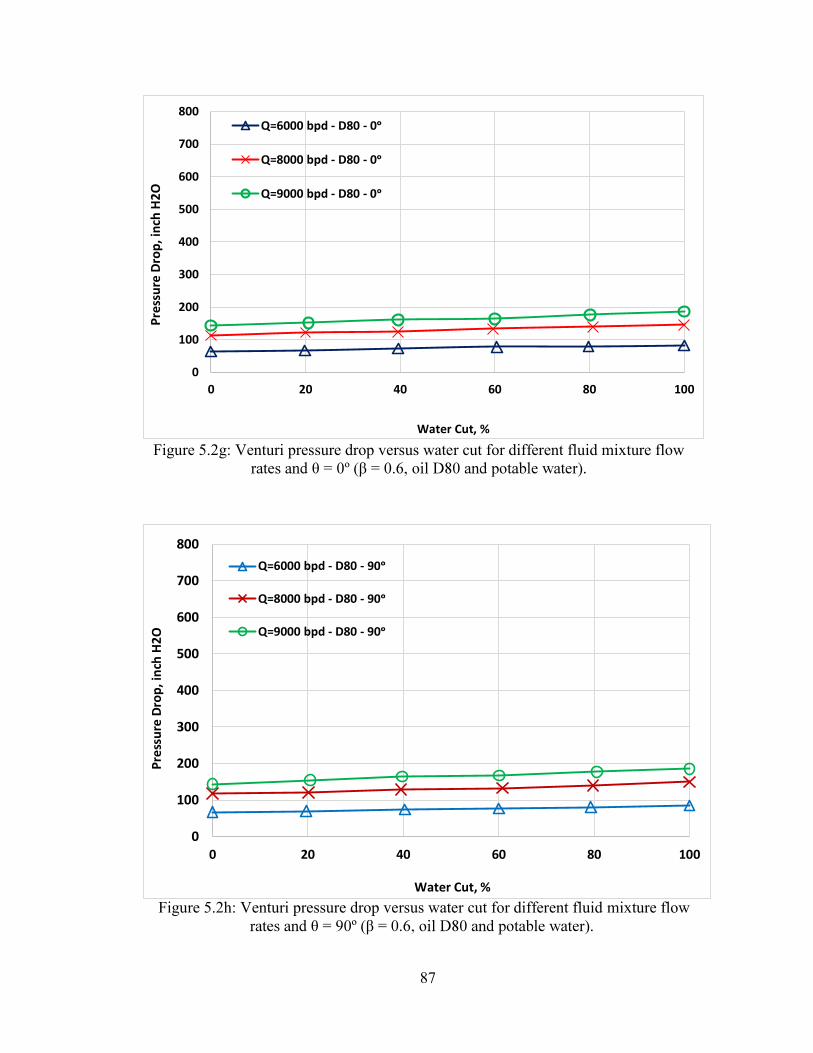
87
Figure 5.2g: Venturi pressure drop versus water cut for different fluid mixture flow
Figure 5.2h: Venturi pressure drop versus water cut for different fluid mixture flow
0
100
200
300
400
500
600
700
800
0 20 40 60 80 100
Pres
sure
Dro
p, in
ch H
2O
Water Cut, %
Q=6000 bpd - D80 - 0
Q=8000 bpd - D80 - 0
Q=9000 bpd - D80 -
0
100
200
300
400
500
600
700
800
0 20 40 60 80 100
Pres
sure
Dro
p, in
ch H
2O
Water Cut, %
Q=6000 bpd - D80 -
Q=8000 bpd - D80 -
Q=9000 bpd - D80 - 90

88
Results for Oil D130:
For a given oil D130, the effect of water cut for different flow rates on venturi pressure
drop is shown in Figures 5.2i to 6.2n. In general, as it can be seen from Figure6.2i to 6.2n,
for a given flow rate the pressure drop increases linearly from WC = 20 to WC 80 %.
Further increase in WC, venturi pressure drop has been found to increase rapidly. This
could be due to phase inversion or change in flow pattern regime. However, for WC =
100%, venturi pressure drop we expect to be higher as compared to venturi pressure drop
at WC = 0%. This is due to higher density of water.
Figure 5.2i: Venturi pressure drop versus water cut for different fluid mixture flow rates
0
100
200
300
400
500
600
700
800
0 20 40 60 80 100
Pres
sure
Dro
p, in
ch H
2O
Water Cut, %
Q=2000 bpd - D130 - 0
Q=4000 bpd - D130 - 0
Q=2000 bpd - D130 -

89
Figure 5.2j: Venturi pressure drop versus water cut for different fluid mixture
flow rates and = 90 oil D130 and potable water).
Figure 5.2k: Venturi pressure drop versus water cut for different fluid mixture flow rates
0
100
200
300
400
500
600
700
800
0 20 40 60 80 100
Pres
sure
Dro
p, in
ch H
2O
Water Cut, %
Q=2000 bpd - D130 - 90
Q=4000 bpd - D130 -
Q=6000 bpd - D130 -
0
100
200
300
400
500
600
700
800
0 20 40 60 80 100
Pres
sure
Dro
p, in
ch H
2O
Water Cut, %
Q=2000 bpd - D130 - 0 Q=4000 bpd - D130 - Q=6000 bpd - D130 - 0
Q=8000 bpd - D130 - 0 Q=10000 bpd - D130 - Q=12000 bpd - D130 -

90
Figure 5.2l: Venturi pressure drop versus water cut for different fluid mixture flow rates ater).
Figure 5.2m: Venturi pressure drop versus water cut for different fluid mixture flow
0
100
200
300
400
500
600
700
800
0 20 40 60 80 100
Pres
sure
Dro
p, in
ch H
2O
Water Cut, %
Q=2000 bpd - D130 - 90 Q=4000 bpd - D130 - 90 Q=6000 bpd - D130 -
Q=8000 bpd - D130 - 90 Q=10000 bpd - D130 - 90 Q=120000 bpd - D130 -
0
100
200
300
400
500
600
700
800
0 20 40 60 80 100
Pres
sure
Dro
p, in
ch H
2O
Water Cut, %
Q=8000 bpd - D130 - 0
Q=10000 bpd - D130 - 0
Q=12000 bpd - D130 -

91
Figure 5.2n: Venturi pressure drop versus water cut for different fluid mixture flow rates = 0.6, oil D130 and potable water).
Therefore, it can be seen from all Figures 5.2a to 5.2n, for any given flow rate, the venturi
pressure drop increases linearly with increase of water cut for all inclinations of the flow
loop, three venturi meters, and all flow rates.
The same trend is observed for all fluid mixture flow rates ranging from 2,000 bpd to
10,000 bpd and for the different inclinations of the flow loop. The exception of this
behavior that for maxim flow rate (12000 bpd) at water cuts 0% and 100%, due to the
pumps limitation and the actual values of the maximum flow rate were reported: 11500
and 10900 bpd for oil and water single phases respectively.
Also, the pressure drop slope is increasing with the fluid mixture flow rate. This result is
very important from a practical standpoint as a check to verify that the mixture flow is in
fact in a dispersed homogeneous flow pattern.
0
100
200
300
400
500
600
700
800
0 20 40 60 80 100
Pres
sure
Dro
p, in
ch H
2O
Water Cut, %
Q=8000 bpd - D130 - 90
Q=10000 bpd - D130 -
Q=12000 bpd - D130 - 90
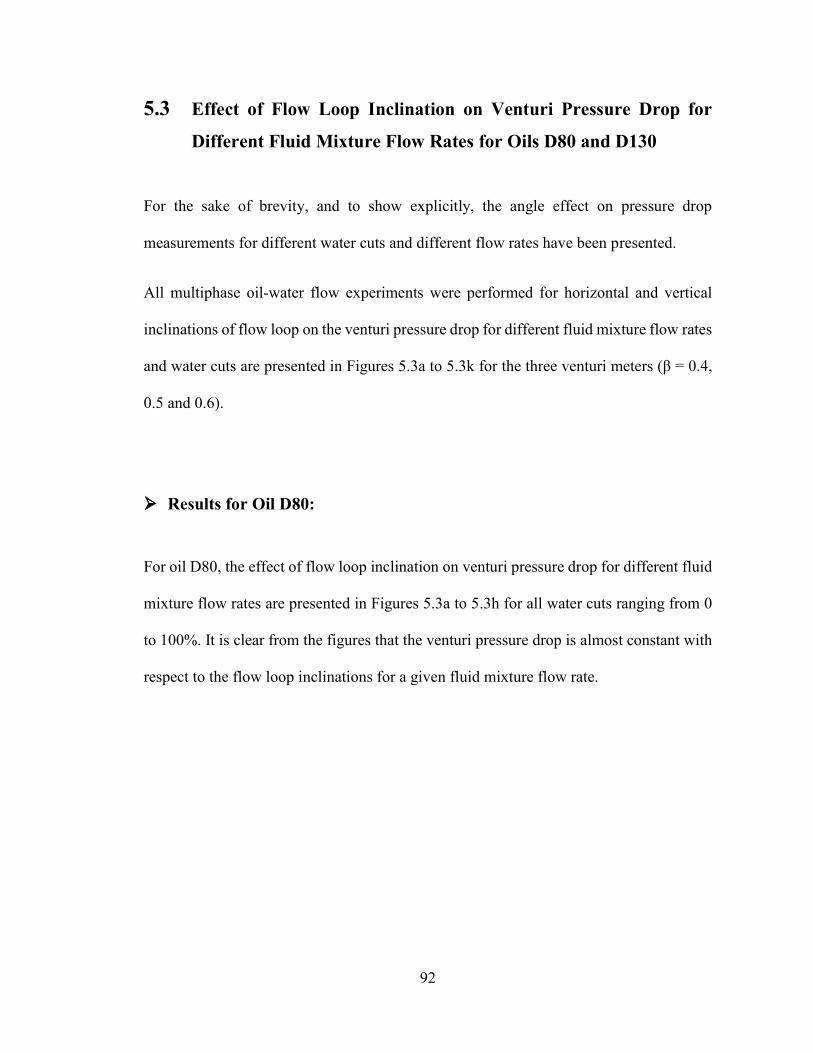
92
5.3 Effect of Flow Loop Inclination on Venturi Pressure Drop for
Different Fluid Mixture Flow Rates for Oils D80 and D130
For the sake of brevity, and to show explicitly, the angle effect on pressure drop
measurements for different water cuts and different flow rates have been presented.
All multiphase oil-water flow experiments were performed for horizontal and vertical
inclinations of flow loop on the venturi pressure drop for different fluid mixture flow rates
and water cuts are presented in Figures 5.3a to 5.3k for the three
0.5 and 0.6).
Results for Oil D80:
For oil D80, the effect of flow loop inclination on venturi pressure drop for different fluid
mixture flow rates are presented in Figures 5.3a to 5.3h for all water cuts ranging from 0
to 100%. It is clear from the figures that the venturi pressure drop is almost constant with
respect to the flow loop inclinations for a given fluid mixture flow rate.
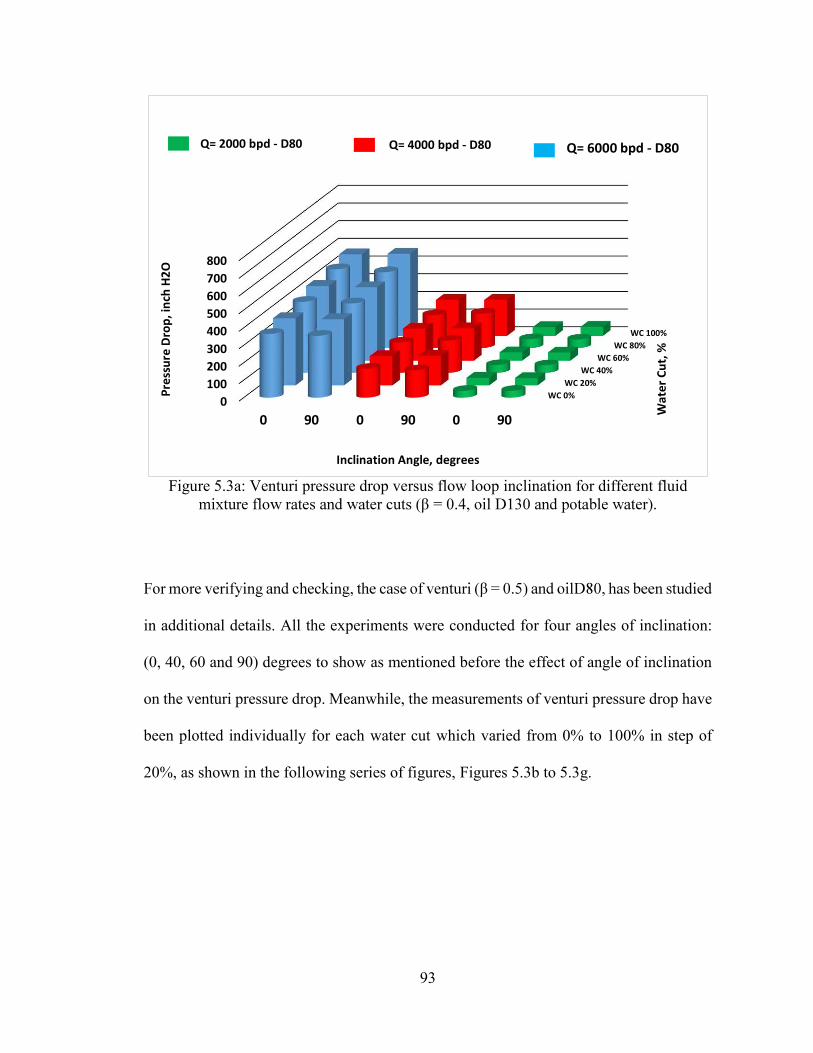
93
Figure 5.3a: Venturi pressure drop versus flow loop inclination for different fluid
in additional details. All the experiments were conducted for four angles of inclination:
(0, 40, 60 and 90) degrees to show as mentioned before the effect of angle of inclination
on the venturi pressure drop. Meanwhile, the measurements of venturi pressure drop have
been plotted individually for each water cut which varied from 0% to 100% in step of
20%, as shown in the following series of figures, Figures 5.3b to 5.3g.
WC 0%WC 20%
WC 40%WC 60%
WC 80%WC 100%
0100200300400500600700800
0 90 0 90 0 90
Wat
er C
ut, %
Pres
sure
Dro
p, in
ch H
2O
Inclination Angle, degrees
Q= 2000 bpd - D80 Q= 4000 bpd - D80 Q= 6000 bpd - D80
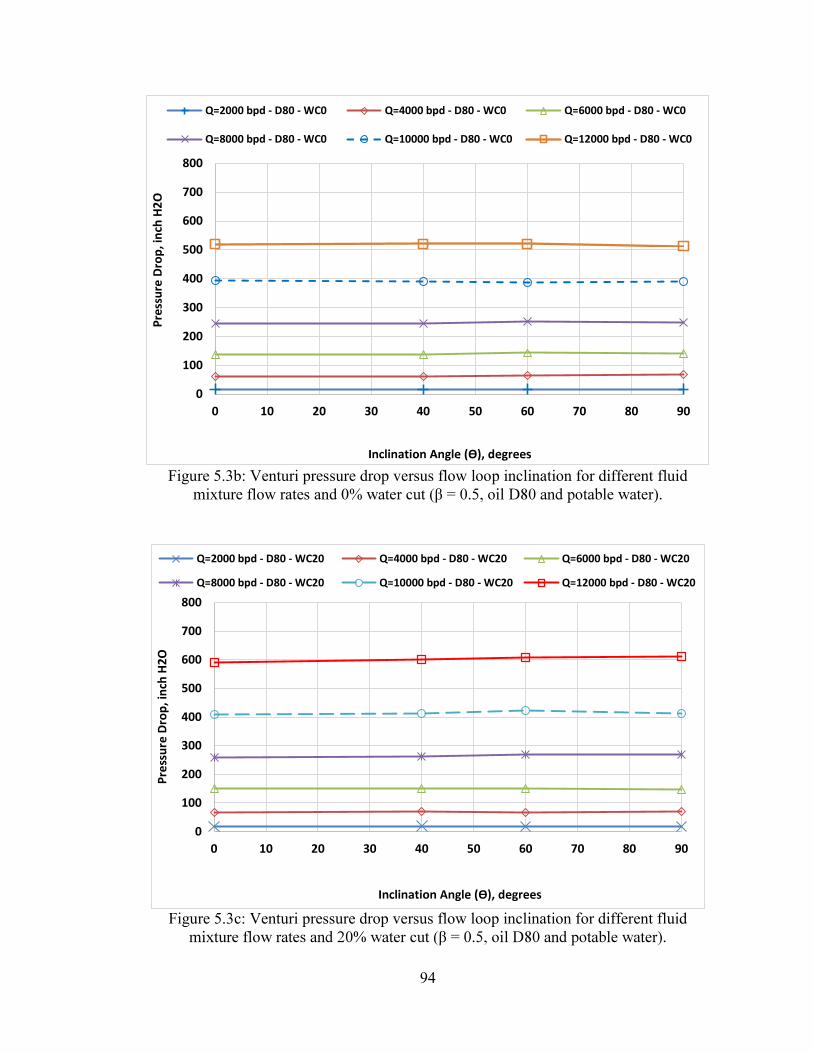
94
Figure 5.3b: Venturi pressure drop versus flow loop inclination for different fluid mixture flow rates and 0%
Figure 5.3c: Venturi pressure drop versus flow loop inclination for different fluid
0
100
200
300
400
500
600
700
800
0 10 20 30 40 50 60 70 80 90
Pres
sure
Dro
p, in
ch H
2O
Q=2000 bpd - D80 - WC0 Q=4000 bpd - D80 - WC0 Q=6000 bpd - D80 - WC0
Q=8000 bpd - D80 - WC0 Q=10000 bpd - D80 - WC0 Q=12000 bpd - D80 - WC0
0
100
200
300
400
500
600
700
800
0 10 20 30 40 50 60 70 80 90
Pres
sure
Dro
p, in
ch H
2O
Q=2000 bpd - D80 - WC20 Q=4000 bpd - D80 - WC20 Q=6000 bpd - D80 - WC20
Q=8000 bpd - D80 - WC20 Q=10000 bpd - D80 - WC20 Q=12000 bpd - D80 - WC20

95
Figure 5.3d: Venturi pressure drop versus flow loop inclination for different fluid
Figure 5.3e: Venturi pressure drop versus flow loop inclination for different fluid
0
100
200
300
400
500
600
700
800
0 10 20 30 40 50 60 70 80 90
Pres
sure
Dro
p, in
ch H
2O
Q=2000 bpd - D80 - WC40 Q=4000 bpd - D80 - WC40 Q=6000 bpd - D80 - WC40
Q=8000 bpd - D80 - WC40 Q=10000 bpd - D80 - WC40 Q=12000 bpd - D80 - WC40
0
100
200
300
400
500
600
700
800
0 10 20 30 40 50 60 70 80 90
Pres
sure
Dro
p, in
ch H
2O
Q=2000 bpd - D80 - WC60 Q=4000 bpd - D80 - WC60 Q=6000 bpd - D80 - WC60
Q=8000 bpd - D80 - WC60 Q=10000 bpd - D80 - WC60 Q=12000 bpd - D80 - WC60
96
Figure 5.3f: Venturi pressure drop versus flow loop inclination for different fluid mixture flow rat
Figure 5.3g: Venturi pressure drop versus flow loop inclination for different fluid
0
100
200
300
400
500
600
700
800
0 10 20 30 40 50 60 70 80 90
Pres
sure
Dro
p, in
ch H
2O
Q=2000 bpd - D80 - WC80 Q=4000 bpd - D80 - WC80 Q=6000 bpd - D80 - WC80
Q=8000 bpd - D80 - WC80 Q=10000 bpd - D80 - WC80 Q=12000 bpd - D80 - WC80
0
100
200
300
400
500
600
700
800
0 10 20 30 40 50 60 70 80 90
Pres
sure
Dro
p, in
ch H
2O
Q=2000 bpd - D80 - WC100 Q=4000 bpd - D80 - WC100 Q=6000 bpd - D80 - WC100
Q=8000 bpd - D80 - WC100 Q=10000 bpd - D80 - WC100 Q=12000 bpd - D80 - WC100
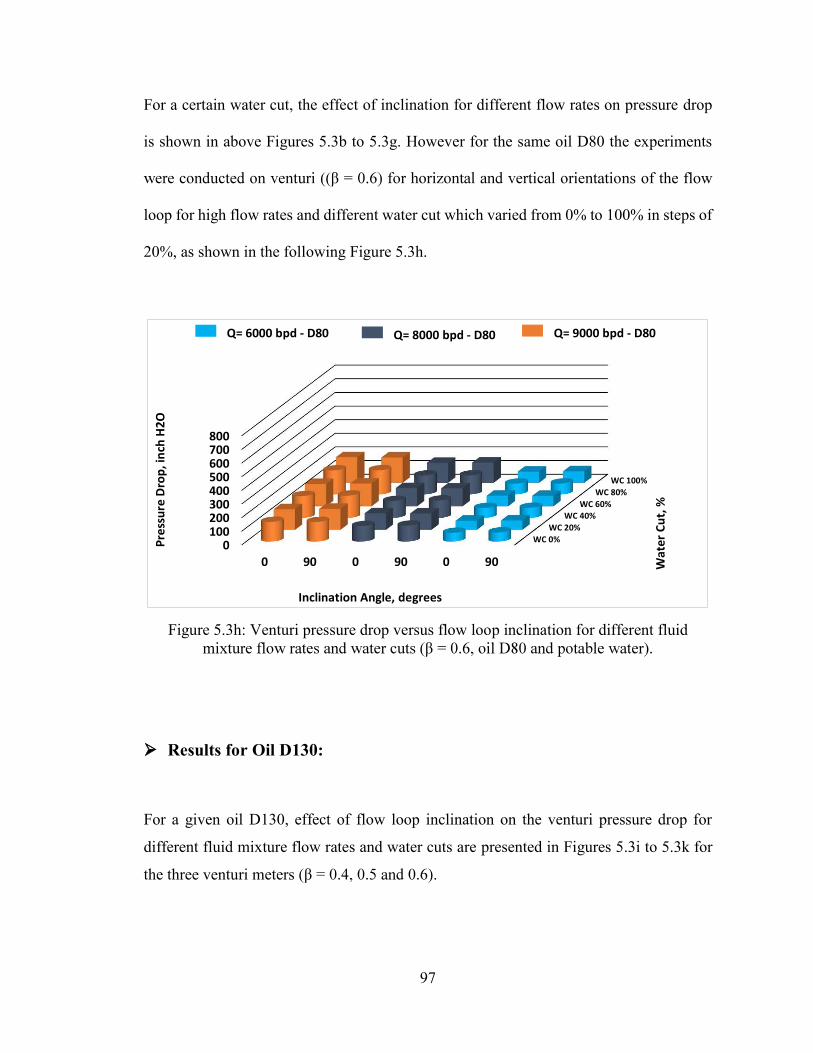
97
For a certain water cut, the effect of inclination for different flow rates on pressure drop
is shown in above Figures 5.3b to 5.3g. However for the same oil D80 the experiments
of the flow
loop for high flow rates and different water cut which varied from 0% to 100% in steps of
20%, as shown in the following Figure 5.3h.
Figure 5.3h: Venturi pressure drop versus flow loop inclination for different fluid
Results for Oil D130:
For a given oil D130, effect of flow loop inclination on the venturi pressure drop for
different fluid mixture flow rates and water cuts are presented in Figures 5.3i to 5.3k for
the three venturi meters .
WC 0%WC 20%
WC 40%WC 60%
WC 80%WC 100%
0100200300400500600700800
0 90 0 90 0 90 Wat
er C
ut, %
Pres
sure
Dro
p, in
ch H
2O
Inclination Angle, degrees
Q= 6000 bpd - D80 Q= 8000 bpd - D80 Q= 9000 bpd - D80
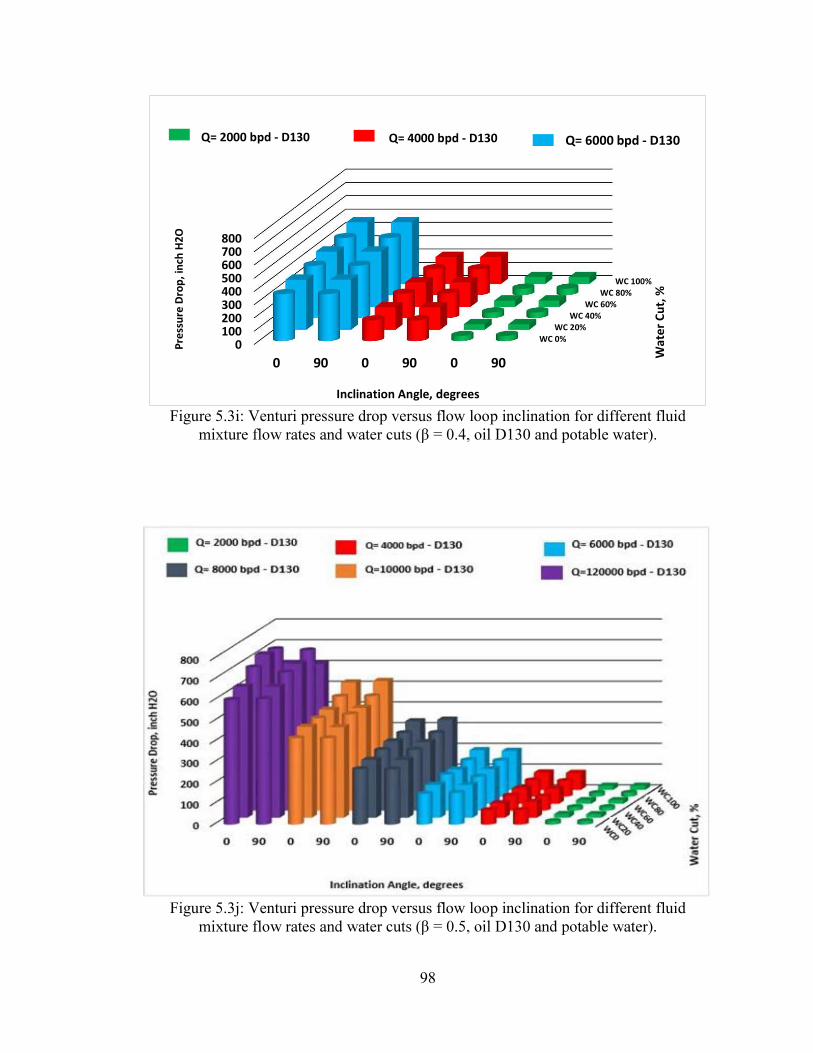
98
Figure 5.3i: Venturi pressure drop versus flow loop inclination for different fluid 30 and potable water).
Figure 5.3j: Venturi pressure drop versus flow loop inclination for different fluid
WC 0%WC 20%
WC 40%WC 60%
WC 80%WC 100%
0100200300400500600700800
0 90 0 90 0 90 Wat
er C
ut, %
Pres
sure
Dro
p, in
ch H
2O
Inclination Angle, degrees
Q= 2000 bpd - D130 Q= 4000 bpd - D130 Q= 6000 bpd - D130
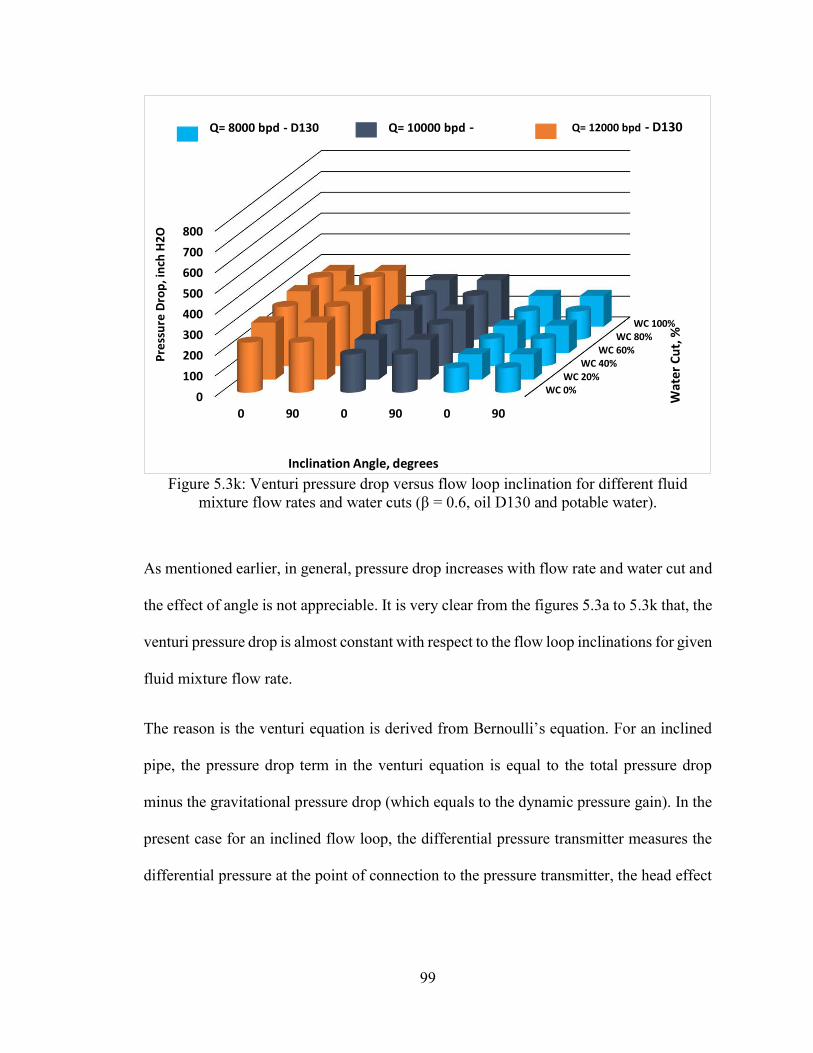
99
Figure 5.3k: Venturi pressure drop versus flow loop inclination for different fluid
As mentioned earlier, in general, pressure drop increases with flow rate and water cut and
the effect of angle is not appreciable. It is very clear from the figures 5.3a to 5.3k that, the
venturi pressure drop is almost constant with respect to the flow loop inclinations for given
fluid mixture flow rate.
The reason is the ventur
pipe, the pressure drop term in the venturi equation is equal to the total pressure drop
minus the gravitational pressure drop (which equals to the dynamic pressure gain). In the
present case for an inclined flow loop, the differential pressure transmitter measures the
differential pressure at the point of connection to the pressure transmitter, the head effect
WC 0%WC 20%
WC 40%WC 60%
WC 80%WC 100%
0
100
200
300
400
500
600
700
800
0 90 0 90 0 90
Wat
er C
ut, %
Pres
sure
Dro
p, in
ch H
2O
Inclination Angle, degrees
Q= 8000 bpd - D130 Q= 10000 bpd - Q= 12000 bpd - D130

100
is neutralized i.e. the measured total pressure drop in fact is the dynamic pressure gain
which is independent of the flow loop inclination.
This is a very important conclusion, which expands the applicability of venturi meters to
measurement operations of different inclination angles. The same trend in venturi pressure
drop is observed for all two-phase oil-water flow rates ranging from 2000 to 12000 bpd
and for all water cuts.
5.4 Effect of Venturi on Pressure Drop for Different Water Cuts
for Oils D80 and D130
fixed fluid flow rate
of 6,000 bpd are presented in Figures 5.4a and 5.4b for horizontal and vertical flow loop
inclinations. The experiments were performed on oil D80 only to prove that by
considering a common flow rate.
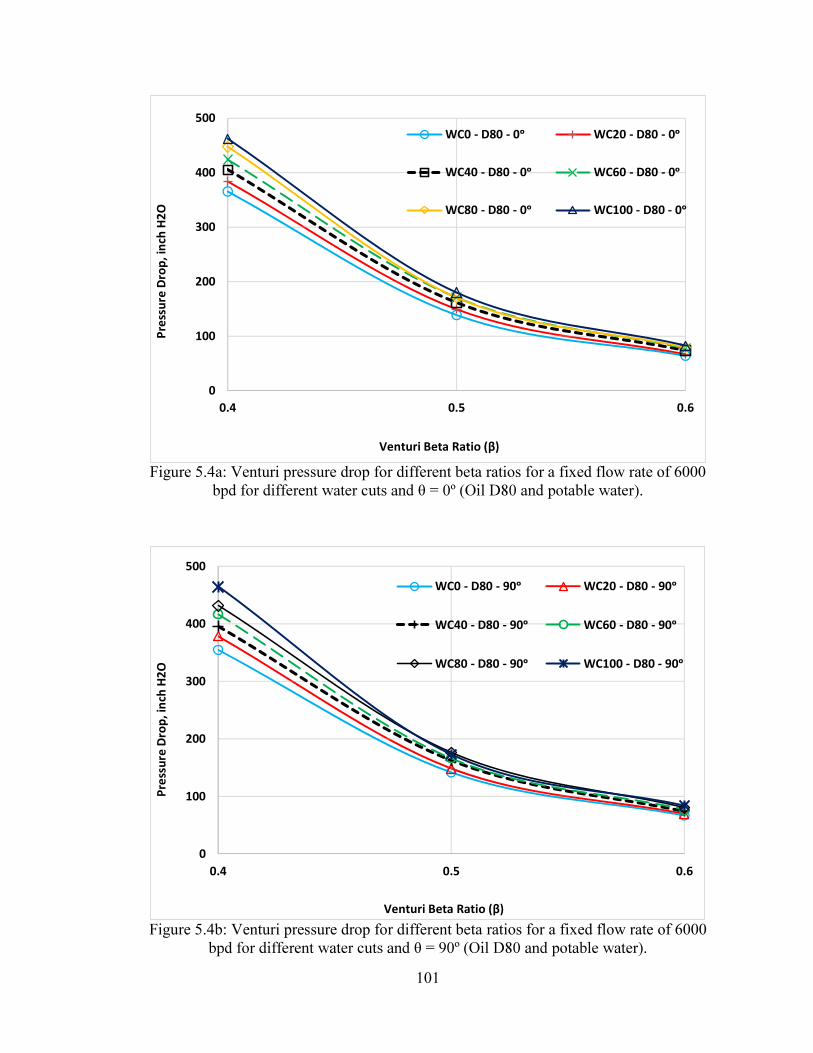
101
Figure 5.4a: Venturi pressure drop for different beta ratios for a fixed flow rate of 6000
Figure 5.4b: Venturi pressure drop for different beta ratios for a fixed flow rate of 6000
0
100
200
300
400
500
0.4 0.5 0.6
Pres
sure
Dro
p, in
ch H
2O
Venturi Beta Ratio (
WC0 - D80 - WC20 - D80 - 0
WC40 - D80 - 0 WC60 - D80 - 0
WC80 - D80 - 0 WC100 - D80 - 0
0
100
200
300
400
500
0.4 0.5 0.6
Pres
sure
Dro
p, in
ch H
2O
Venturi Beta Ratio (
WC0 - D80 - WC20 - D80 - 90
WC40 - D80 - 90 WC60 - D80 - 90
WC80 - D80 - 90 WC100 - D80 - 90

102
It is clear from the figures that the venturi pressure drop decreases nonlinearly with an
Interestingly, the highest pressure drop is for pure water and the lowest is for pure oil, and
5.5 Effect of Oil Viscosity on Venturi Pressure Drop Measurements
In order to study the effect of viscosity on the venture pressure drop measurements, two
mineral oils (D80 and D130) were consider. The measured kinematic viscosities of them
were plotted against the temperature that within the testing ranges as shown in Figure 5.5.
It can be seen that the viscosity decreases with the increase of temperature, as a scientific
fact the expected behavior was obtained. Because of the high turbulence of the flow and
the minor difference between the oils viscosities, the comparison is almost non-existent
and the experiments that conducted under the same conditions showed nearly typical
measurements for venturi pressure drop

103
Figure 5.5: Variation of kinematic viscosity for Exxsol (D80 & D130) oils against temperature, [47] (Measurement done at Research Institute, RI in KFUPM).
Finally, the comparison was placed on experimental results of venturi pressure drop
between oil D80 and oil D130, and we concluded with that, the effect of viscosity is
noticeable at low flow rates only due to the small difference between the kinematic
viscosities (T= 25.0 °C) of both oils (oil D80, 2.18*10-6 m²/s) and (D130, 6.89*10-
6 m²/s). This minor difference in viscosity (4.71*10-6 m²/s) does not show in remarked
variation on pressure drop measurements because all the experiments were carried for a
high flow rate similar to that on real oil wells fluid flow which having turbulent flow
conditions.
0
1
2
3
4
5
6
7
8
9
10
22 25 27 30 32 35 37 40 42 45
Kine
mat
ic V
isco
sity
, cps
Oil D80
Oil D130

104
5.6 Calculations of Modified Venturi Discharge Coefficient, k, for
Oils D80 and D130
A modified venturi discharge coefficient, k, which is a function of pressure losses and
venturi geometry, is introduced in the present study. The value of k was obtained from the
simplified venturi governing Eq. 4.5.
The k value is determined from the single-phase and oil-water two-phase flow
experiments of both oils D80 and D130 for all orientations of the flow loop and for the
-water experiments for
different fluid mixture flow rates and water cuts are used to determine the k by using the
same Eq. 4.5 for each of the three venturi meters. The obtained experimental values of k
are plotted against the water cut for different fluid mixture flow rates as showed in Figures
5.6a to 5.6l, for horizontal cases only.
Modified Venturi Discharge Coefficient k, for Oil 80:
For oil-water two-phase flow conditions of oil D80 experiments, the average values of
and 0.6, respectively.
However, the percentage error in the total flow was calculated based on the average value
of (k) for all configurations of the flow loop. As mentioned earlier the angle of inclination
is not very much affecting on the venturi results. Due to that, we present the result for the
horizontal inclinations only. The following Figures 5.6a to 5.6f show the variation of k
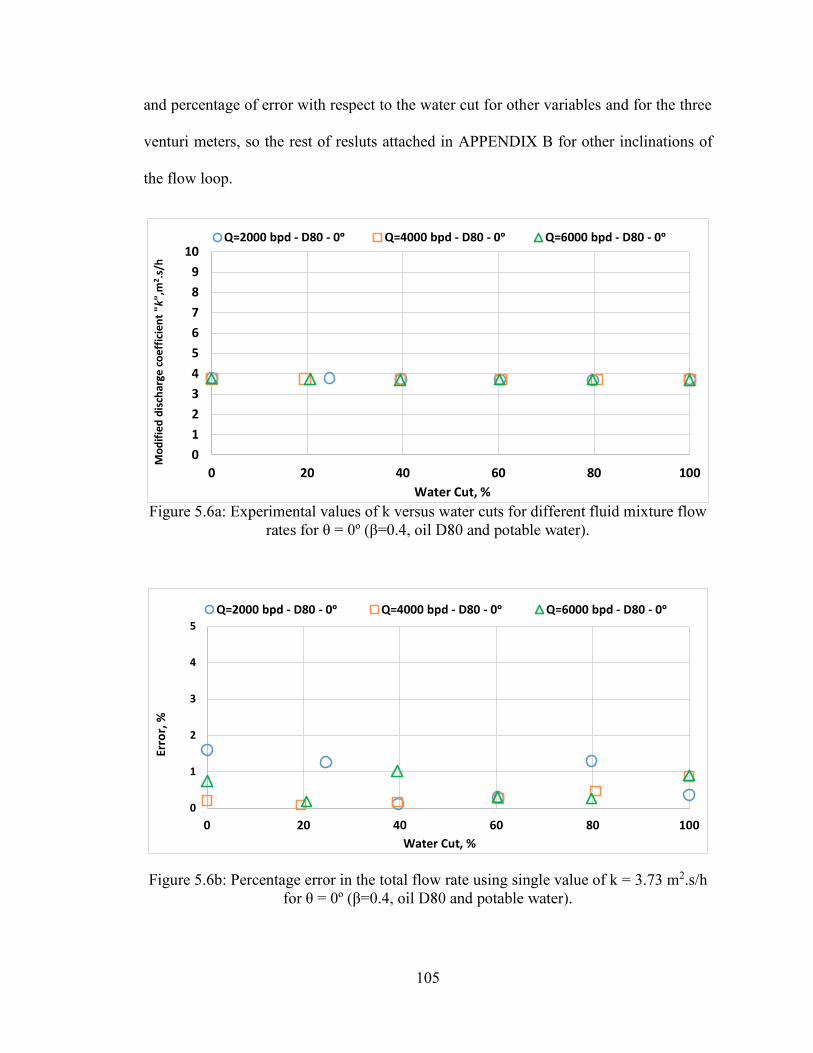
105
and percentage of error with respect to the water cut for other variables and for the three
venturi meters, so the rest of resluts attached in APPENDIX B for other inclinations of
the flow loop.
Figure 5.6a: Experimental values of k versus water cuts for different fluid mixture flow
Figure 5.6b: Percentage error in the total flow rate using single value of k = 3.73 m2.s/h
0123456789
10
0 20 40 60 80 100
Mod
ified
dis
char
ge c
oeff
icie
nt "
k",m
2 .s/h
Water Cut, %
Q=2000 bpd - D80 - 0 Q=4000 bpd - D80 - Q=6000 bpd - D80 -
0
1
2
3
4
5
0 20 40 60 80 100
Erro
r, %
Water Cut, %
Q=2000 bpd - D80 - 0 Q=4000 bpd - D80 - 0 Q=6000 bpd - D80 - 0

106
Figure 5.6c: Experimental values of k versus water cuts for different fluid mixture flow
Figure 5.6d: Percentage error in the total flow rate using single value of k = 5.93 m2.s/h
1
2
3
4
5
6
7
8
9
10
0 20 40 60 80 100
Mod
ified
dis
char
ge c
oeff
icie
nt "
k", m
2 .s/h
Water Cut, %
Q=2000 bpd - D80 - 0 Q=4000 bpd - D80 - 0 Q=6000 bpd - D80 - 0
Q=8000 bpd - D80 - 0 Q=10000 bpd - D80 - Q=120000 bpd - D80 - 0
0
1
2
3
4
5
0 20 40 60 80 100
Erro
r, %
Water Cut, %
Q=2000 bpd - D80 - 0 Q=4000 bpd - D80 - 0 Q=6000 bpd - D80 - 0
Q=8000 bpd - D80 - 0 Q=10000 bpd - D80 - Q=12000 bpd - D80 - 0
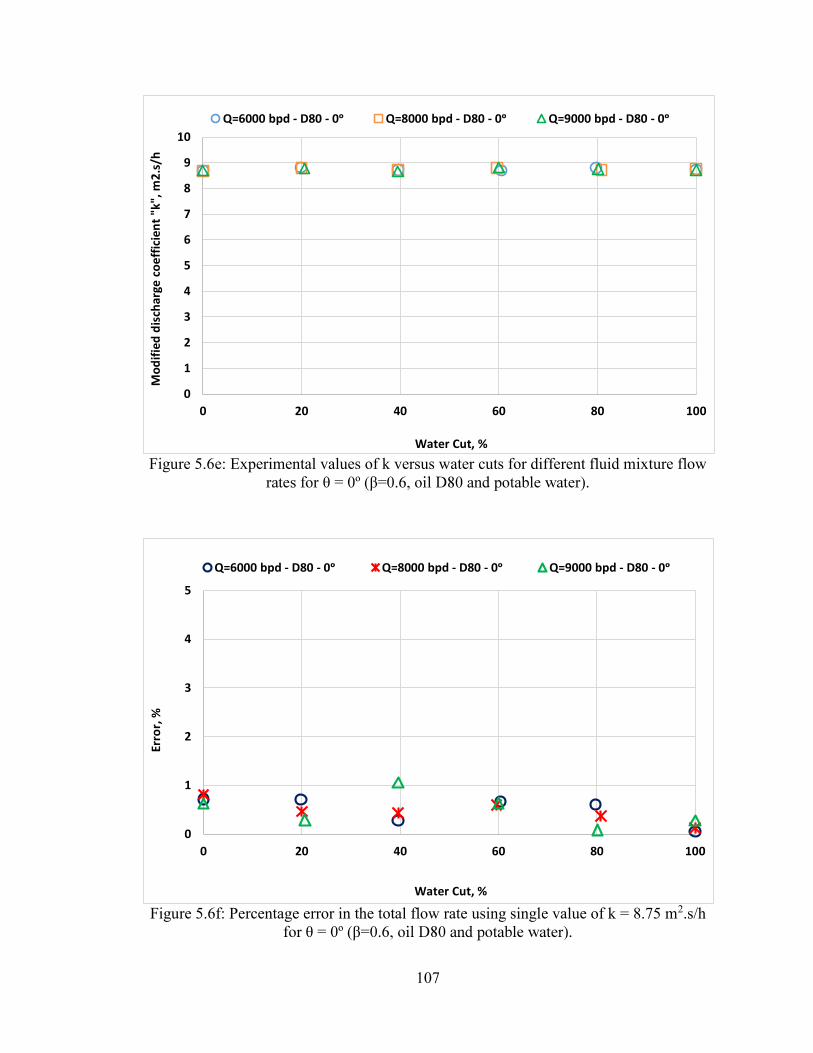
107
Figure 5.6e: Experimental values of k versus water cuts for different fluid mixture flow
Figure 5.6f: Percentage error in the total flow rate using single value of k = 8.75 m2.s/h
0
1
2
3
4
5
6
7
8
9
10
0 20 40 60 80 100
Mod
ified
dis
char
ge c
oeff
icie
nt "
k", m
2.s/
h
Water Cut, %
Q=6000 bpd - D80 - 0 Q=8000 bpd - D80 - 0 Q=9000 bpd - D80 - 0
0
1
2
3
4
5
0 20 40 60 80 100
Erro
r, %
Water Cut, %
Q=6000 bpd - D80 - Q=8000 bpd - D80 - 0 Q=9000 bpd - D80 -
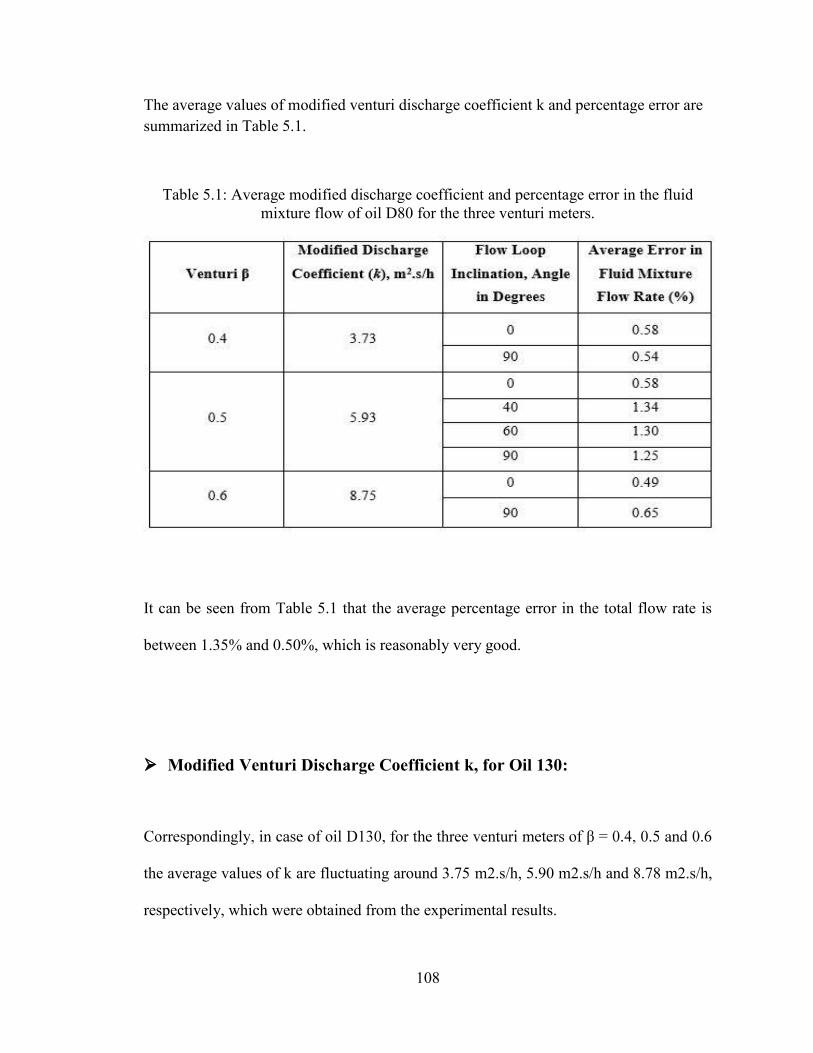
108
The average values of modified venturi discharge coefficient k and percentage error are summarized in Table 5.1.
Table 5.1: Average modified discharge coefficient and percentage error in the fluid mixture flow of oil D80 for the three venturi meters.
It can be seen from Table 5.1 that the average percentage error in the total flow rate is
between 1.35% and 0.50%, which is reasonably very good.
Modified Venturi Discharge Coefficient k, for Oil 130:
the average values of k are fluctuating around 3.75 m2.s/h, 5.90 m2.s/h and 8.78 m2.s/h,
respectively, which were obtained from the experimental results.
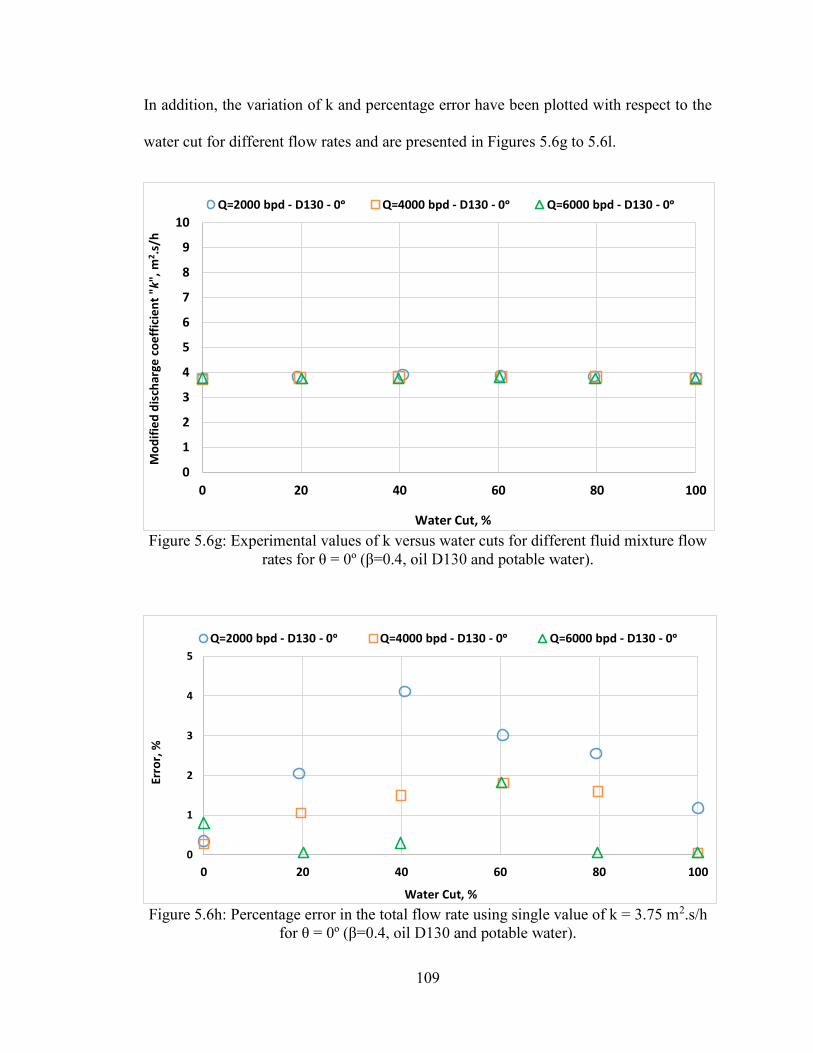
109
In addition, the variation of k and percentage error have been plotted with respect to the
water cut for different flow rates and are presented in Figures 5.6g to 5.6l.
Figure 5.6g: Experimental values of k versus water cuts for different fluid mixture flow
Figure 5.6h: Percentage error in the total flow rate using single value of k = 3.75 m2.s/h for
0
1
2
3
4
5
6
7
8
9
10
0 20 40 60 80 100
Mod
ified
dis
char
ge c
oeff
icie
nt "
k", m
2 .s/h
Water Cut, %
Q=2000 bpd - D130 - 0 Q=4000 bpd - D130 - Q=6000 bpd - D130 - 0
0
1
2
3
4
5
0 20 40 60 80 100
Erro
r, %
Water Cut, %
Q=2000 bpd - D130 - Q=4000 bpd - D130 - 0 Q=6000 bpd - D130 - 0
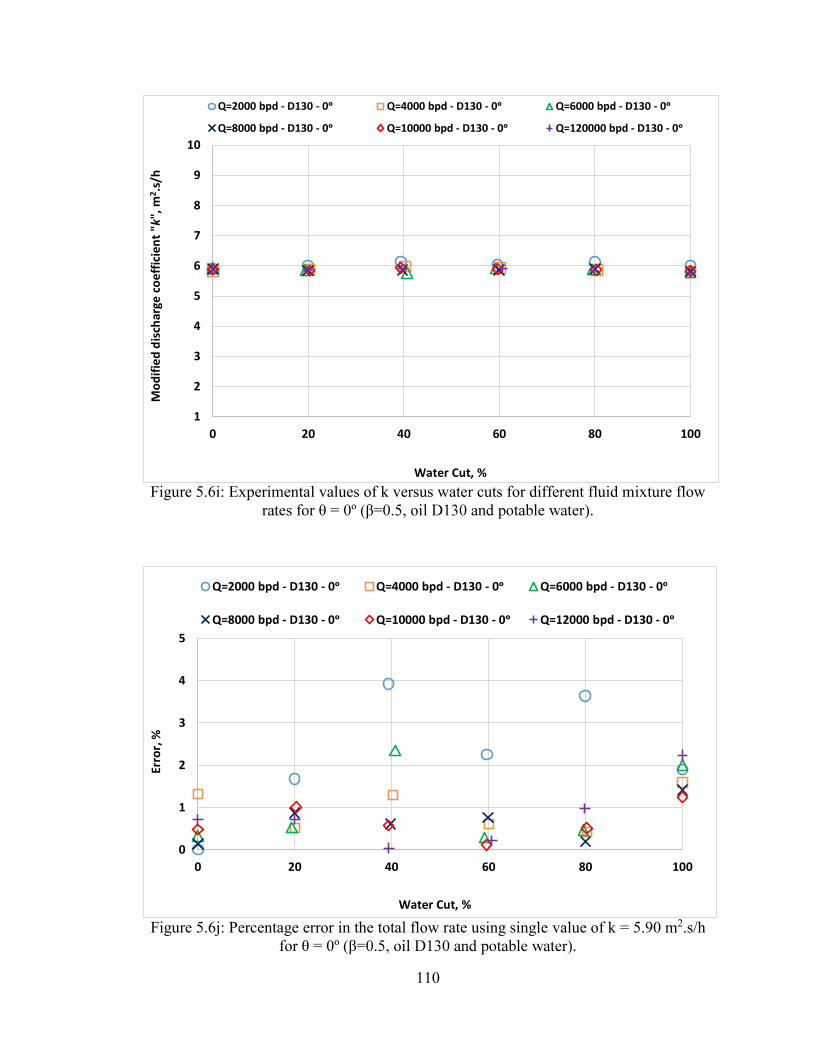
110
Figure 5.6i: Experimental values of k versus water cuts for different fluid mixture flow
Figure 5.6j: Percentage error in the total flow rate using single value of k = 5.90 m2.s/h
1
2
3
4
5
6
7
8
9
10
0 20 40 60 80 100
Mod
ified
dis
char
ge c
oeff
icie
nt "
k", m
2 .s/
h
Water Cut, %
Q=2000 bpd - D130 - 0 Q=4000 bpd - D130 - 0 Q=6000 bpd - D130 - 0
Q=8000 bpd - D130 - Q=10000 bpd - D130 - Q=120000 bpd - D130 - 0
0
1
2
3
4
5
0 20 40 60 80 100
Erro
r, %
Water Cut, %
Q=2000 bpd - D130 - 0 Q=4000 bpd - D130 - 0 Q=6000 bpd - D130 - 0
Q=8000 bpd - D130 - Q=10000 bpd - D130 - Q=12000 bpd - D130 - 0
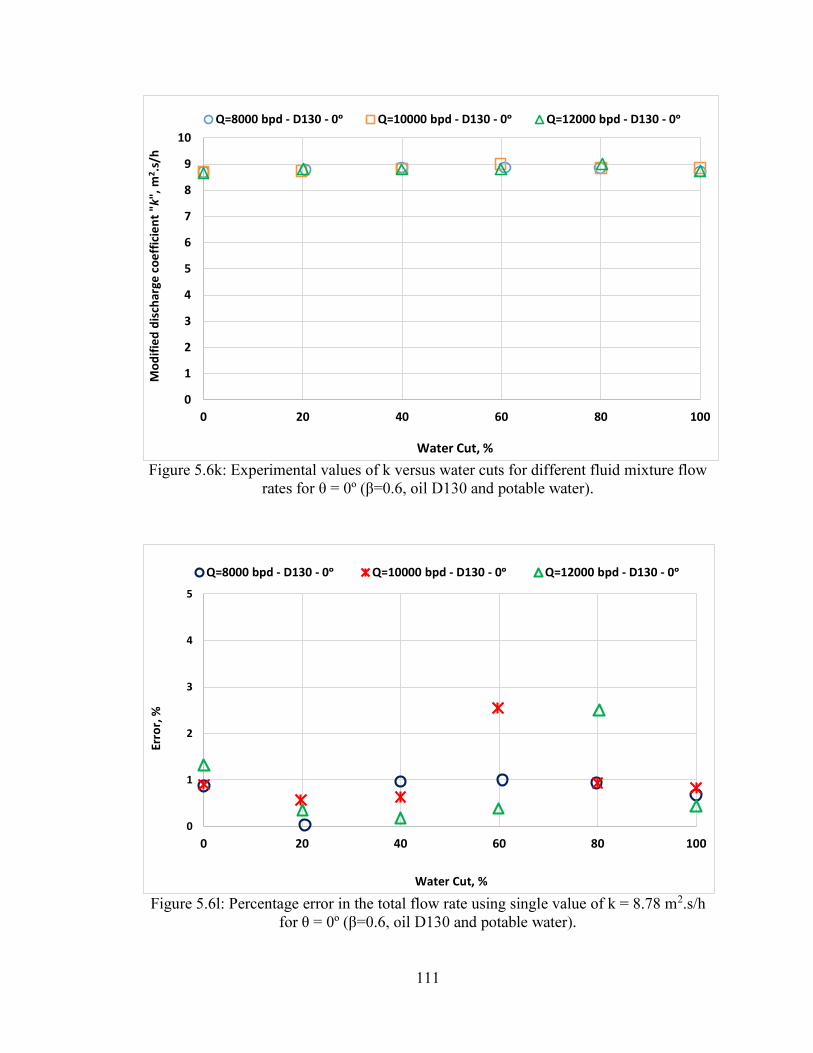
111
Figure 5.6k: Experimental values of k versus water cuts for different fluid mixture flow
Figure 5.6l: Percentage error in the total flow rate using single value of k = 8.78 m2.s/h
0
1
2
3
4
5
6
7
8
9
10
0 20 40 60 80 100
Mod
ified
dis
char
ge c
oeff
icie
nt "
k", m
2 .s/
h
Water Cut, %
Q=8000 bpd - D130 - Q=10000 bpd - D130 - 0 Q=12000 bpd - D130 - 0
0
1
2
3
4
5
0 20 40 60 80 100
Erro
r, %
Water Cut, %
Q=8000 bpd - D130 - Q=10000 bpd - D130 - 0 Q=12000 bpd - D130 -

112
Table 5.2 can summarize the average values of modified venturi discharge coefficient k
and percentage error.
Table 5.2: Average modified discharge coefficient and percentage error in the fluid mixture flow of oil D130 for the three venturi meters.
Modified Discharge
Coefficient (k), m2.s/h
Flow Loop
Inclination, Angle
in Degrees
Average Error in
Fluid Mixture
Flow Rate (%)
0.4 3.75 0 1.26
90 1.42
0.5 5.90 0 1.05
90 1.04
0.6 8.78 0 0.89
90 0.52
In conclusion, it can be seen clearly a very reasonable accuracy between 0.53% and
1.43%, that was obtained without any impact for the flow loop inclination on the total
flow rate calculated by venturi.
5.7 Calculations of Venturi Discharge Coefficient, Cd, for Oils D80
and D130
Venturi discharge coefficient, Cd, was calculate by Eq. 4.8, by considering the average
values of the modified venturi discharge coefficient, which were obtained experimentally.
The experimental results of Cd that obtained are plotted against the water cut for different

113
fluid mixture flow rates and for the three venturi meters for the horizontal inclinations of
the flow loop, and the results of other inclinations are plotted and presented in APPENDIX
C.
Venturi Discharge Coefficient Cd for Oil 80:
For oil D80 experiments and horizontal orientations of the flow loop, the results of Cd are
presented graphically in Figures 5.7a to 5.7c.
Figure 5.7a: Experimental venturi discharge coefficient, Cd, versus water cut for low
0.95
0.97
0.99
1.01
1.03
1.05
0 20 40 60 80 100
Vent
uri D
isch
arge
Coe
ffic
ien,
Cd
Water Cut, %
Q=2000 bpd - D80 - Q=4000 bpd - D80 - Q=6000 bpd - D80 - 0

114
Figure 5.7b: Experimental venturi discharge coefficient, Cd, versus water cut for low
Figure 5.7c: Experimental venturi discharge coefficient, Cd, versus water cut for high
0.95
0.97
0.99
1.01
1.03
1.05
0 20 40 60 80 100
Vent
uri D
isch
arge
Coe
ffic
ien,
Cd
Water Cut, %
Q=2000 bpd - D80 - Q=4000 bpd - D80 - Q=6000 bpd - D80 - 0
Q=8000 bpd - D80 - 0 Q=10000 bpd - D80 - 0 Q=120000 bpd - D80 - 0
0.95
0.97
0.99
1.01
1.03
1.05
0 20 40 60 80 100
Vent
uri D
isch
arge
Coe
ffic
ien,
Cd
Water Cut, %
Q=6000 bpd - D80 - Q=8000 bpd - D80 - Q=9000 bpd - D80 - 0
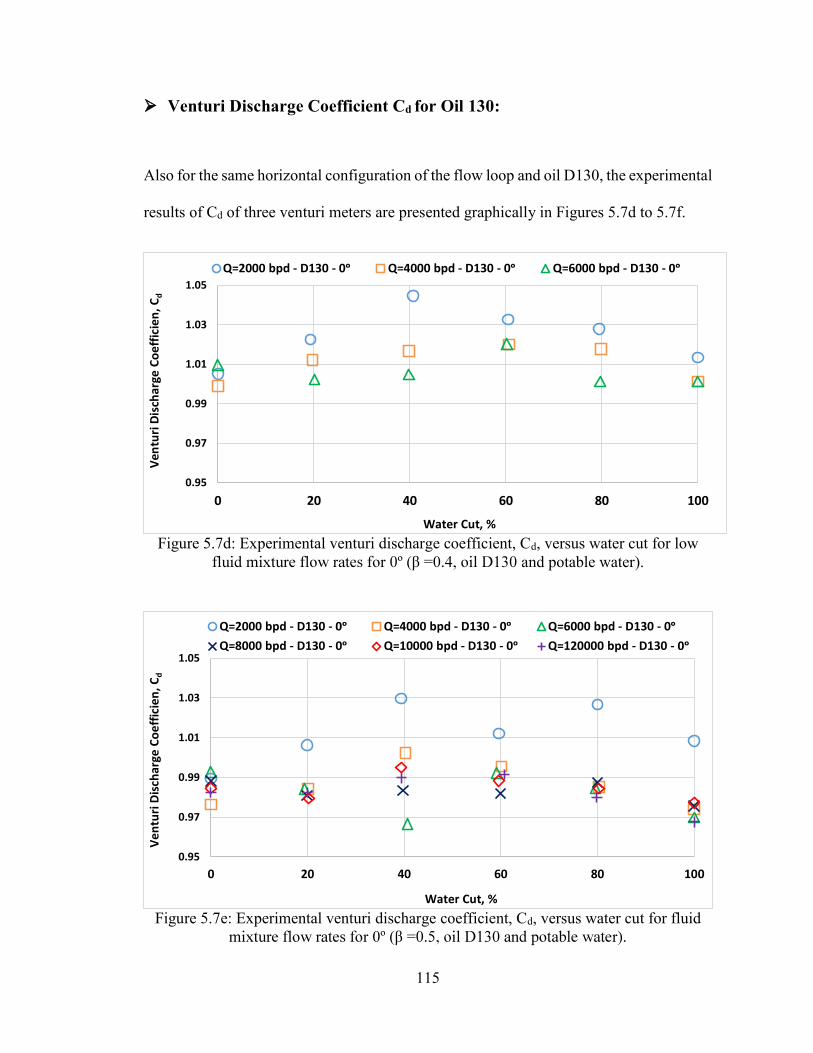
115
Venturi Discharge Coefficient Cd for Oil 130:
Also for the same horizontal configuration of the flow loop and oil D130, the experimental
results of Cd of three venturi meters are presented graphically in Figures 5.7d to 5.7f.
Figure 5.7d: Experimental venturi discharge coefficient, Cd, versus water cut for low and potable water).
Figure 5.7e: Experimental venturi discharge coefficient, Cd, versus water cut for fluid
0.95
0.97
0.99
1.01
1.03
1.05
0 20 40 60 80 100
Vent
uri D
isch
arge
Coe
ffic
ien,
Cd
Water Cut, %
Q=2000 bpd - D130 - 0 Q=4000 bpd - D130 - 0 Q=6000 bpd - D130 -
0.95
0.97
0.99
1.01
1.03
1.05
0 20 40 60 80 100
Vent
uri D
isch
arge
Coe
ffic
ien,
Cd
Water Cut, %
Q=2000 bpd - D130 - Q=4000 bpd - D130 - 0 Q=6000 bpd - D130 - 0Q=8000 bpd - D130 - 0 Q=10000 bpd - D130 - 0 Q=120000 bpd - D130 -

116
Figure 5.7f: Experimental venturi discharge coefficient, Cd, versus water cut for high
The scatter plots show that most of the Cd values lie in the range 0.98 to 1.0 except for
single phase and WC 40% experiments with values greater than 1.0 and maximum of 1.05.
At water cur 40%, this water cut is close to the inversion point at WC 50%, where more
energy developed between the two phases of oil and water in the pipe, because of that, the
pressured drop measurement was affected.
It can be concluded that the venturi discharge coefficient, Cd, variation at the flow
conditions under consideration is minor.
0.95
0.97
0.99
1.01
1.03
1.05
0 20 40 60 80 100
Vent
uri D
isch
arge
Coe
ffic
ien,
Cd
Water Cut, %
Q=8000 bpd - D130 - 0 Q=10000 bpd - D130 - 0 Q=12000 bpd - D130 - 0

117
5.8 Correlations for Venturi Pressure Coefficient, Cpm
Statistical software called DADTFIT [40] was used for performing nonlinear regression
and generating new empirical correlations of exponential- form to describe the ratio of the
measured venturi pressure drop to the upstream dynamic pressure that can be defined by
a parameter knows a mixture venturi pressure coefficient, Cpm.
Based on the analogous methods those used in two-phase flow, specifically (oil-water)
flow, tow correlations were developed for the mixture venturi pressure coefficient, Cpm,
for each oil D80 and D130 under consideration of four main parameters: mixture Reynolds
number (Rem
mixture venturi pressure coefficient, Cpm as independent variable with the four parameters
as dependent variables. The proposed correlations of oil D80 and oil D130 are expressed
in Eq. (5.1) and Eq. (5.2), respectively, as follow:
(5.1)
(5.2)
Where,

118
WC = Water cut ratio
Rem = Mixture Reynolds number
Then, the above correlation were tested using different statistical parameters such as, R-
squared, variance, average absolute error, and standard deviation. The newly proposed
correlations showed a good performance in terms of accuracy as summarized in Table 5.3.
Table 5.3: The statistical analyses for oils (D80 and D130) correlations.
The testing results of correlation each oil are plotted in Figures 5.8a and 5.8b. Correlations
showed high performance in the prediction results of venturi pressure coefficient when
compared with the measured values of Cpm, which were obtained by Eq. (4.9) from the
experimental results based on the measured venturi pressure drop.
Items Oil D80
Correlation
Oil D130
Correlation
Residual Sum of Squares
( Absolute & Relative) 58.723 51.029
Standard Error of the Estimate 0.5275 0.6059
Coefficient of Multiple Determination
(R2) 0.9971 0.9973
Adjusted coefficient of multiple
determination (Ra2) 0.9971 0.9972
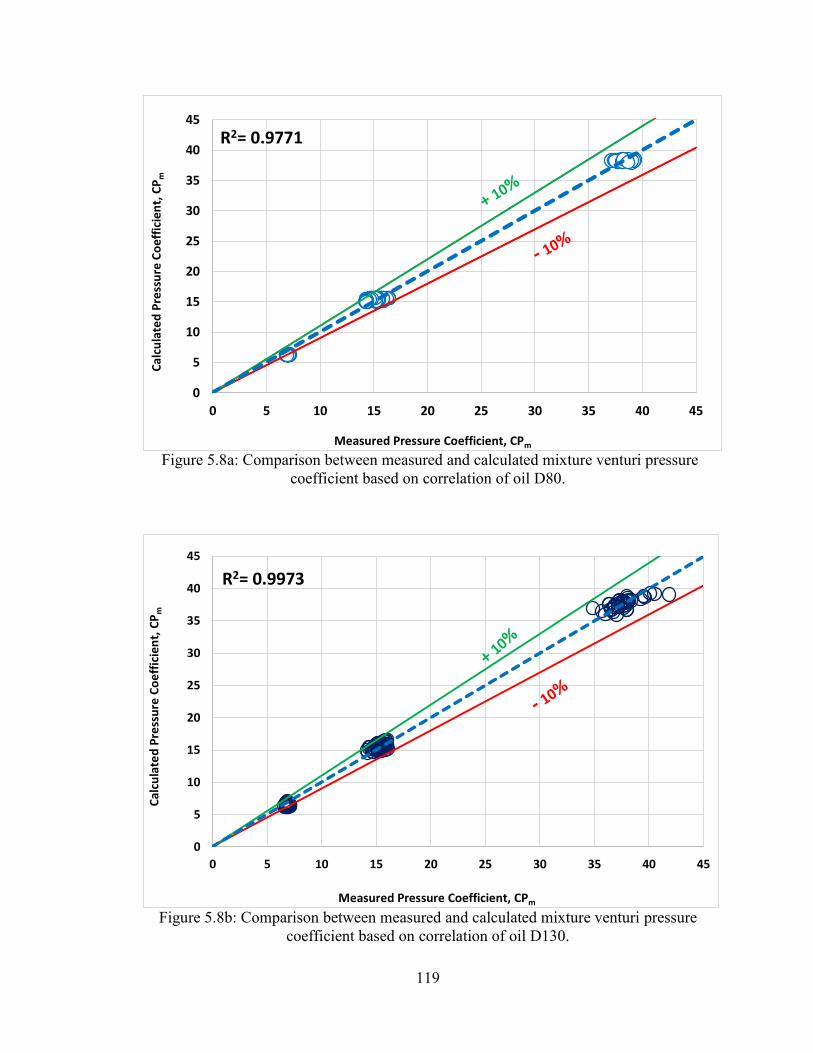
119
Figure 5.8a: Comparison between measured and calculated mixture venturi pressure coefficient based on correlation of oil D80.
Figure 5.8b: Comparison between measured and calculated mixture venturi pressure coefficient based on correlation of oil D130.
0
5
10
15
20
25
30
35
40
45
0 5 10 15 20 25 30 35 40 45
Calc
ulat
ed P
ress
ure
Coef
ficie
nt, C
P m
Measured Pressure Coefficient, CPm
R2= 0.9771
0
5
10
15
20
25
30
35
40
45
0 5 10 15 20 25 30 35 40 45
Calc
ulat
ed P
ress
ure
Coef
ficie
nt, C
P m
Measured Pressure Coefficient, CPm
R2= 0.9973

120
As shown in Figures 5.8a and 5.8b, when the mixture venturi pressure coefficient that have
been calculated using the proposed correlations (5.1 &5.2) were plotted against the measured
experimental data calculated by Eq. 4.9, they showed a well closed match around the straight
line with an angle of 45 degree which indicts the good performance of the new proposed
correlations in estimating of the mixture venturi pressure coefficient, Cpm.
In addition, it can be seen from the Figures 5.8a and 5.8b that mixture venturi pressure
and 0.6, respectively. The predicted venturi pressure coefficient by the correlations (5.1) and
(5.2) were plotted against mixture Reynolds number, and then compared with measured
values obtained from Eq. 4.9, for each venturi meter and for each oil individually. The
comparison was held as shown in Figures 5.9a to 5.9c and Table 5.3a for oil D80 data,
moreover in Figures 5.9d to 5.9f and Table 5.3b for oil D130 experiments data.
1. Results of Venturi Pressure Coefficient, Cpm for Oil D80:
Figure 5.9a: Measured and calculated mixture venturi pressure coefficient versus
05
1015202530354045
0 50000 100000 150000 200000 250000
Pres
sure
Coe
ffic
ient
, CP m
Mixture Reynolds Number, Rem
Measured Data ( D80) Cpm=exp(a* b* c*WC+d*Rem+e)
a= 6.737*10-4 rad-1
b= -8.982149c= 8.297198*10-3
d= -9.766761*10-8
e= 7.241938

121
Figure 5.9b: Measured and calculated mixture venturi pressure coefficient versus D80 oil and potable water].
Figure 5.9c: Measured and calculated mixture venturi pressure coefficient versus
0
2
4
6
8
10
12
14
16
18
20
0 100000 200000 300000 400000 500000 600000
Pres
sure
Coe
ffic
ient
, CP m
Mixture Reynolds Number, Rem
Measured Data ( 0.5 & D80) Cpm=exp(a* b* c*WC+d*Rem+e)
a= 6.737*10-4 rad-1
b= -8.982149c= 8.297198*10-3
d= -9.766761*10-8
e= 7.241938
0
1
2
3
4
5
6
7
8
9
10
0 100000 200000 300000 400000 500000 600000
Pres
sure
Coe
ffic
ient
, CP m
Mixture Reynolds Number, Rem
Measured Data ( D80) Cpm=exp(a* b* c*WC+d*Rem+e)
a= 6.737*10-4 rad-1
b= -8.982149c= 8.297198*10-3
d= -9.766761*10-8
e= 7.241938

122
Table 5.4: Comparison between measured and predicted average values of the mixture venturi pressure coefficient Cpm for homogeneous fluid mixture density of oil D80 data.
Size
Flow Loop
Inclination
Average of Measured
Cpm by Equation (4.9)
Average of Predicted
Cpm by Correlation
(5.1)
0.4 0º 38.40
38.27 90º 38.38
0.5
0º 15.22
15.42 40 15.21
60º 15.40
90º 15.28
0.6
0º 6.98 6.28
90º 7.02
2. Results of Venturi Pressure Coefficient, Cpm for Oil D130:
Figure 5.9d: Measured and calculated mixture venturi pressure coefficient versus
0
5
10
15
20
25
30
35
40
45
0 50000 100000 150000 200000 250000
Pres
sure
Coe
ffic
ient
, CP m
Mixture Reynolds Number, Rem
Measured Data ( 0.4 & D130) Cpm=exp(a* b* c*WC+d*Rem+e)
a= 0.017721 rad-1
b= -9.051945c= -7.419862*10-2
d=3.320343*10-7
e= 7.255804
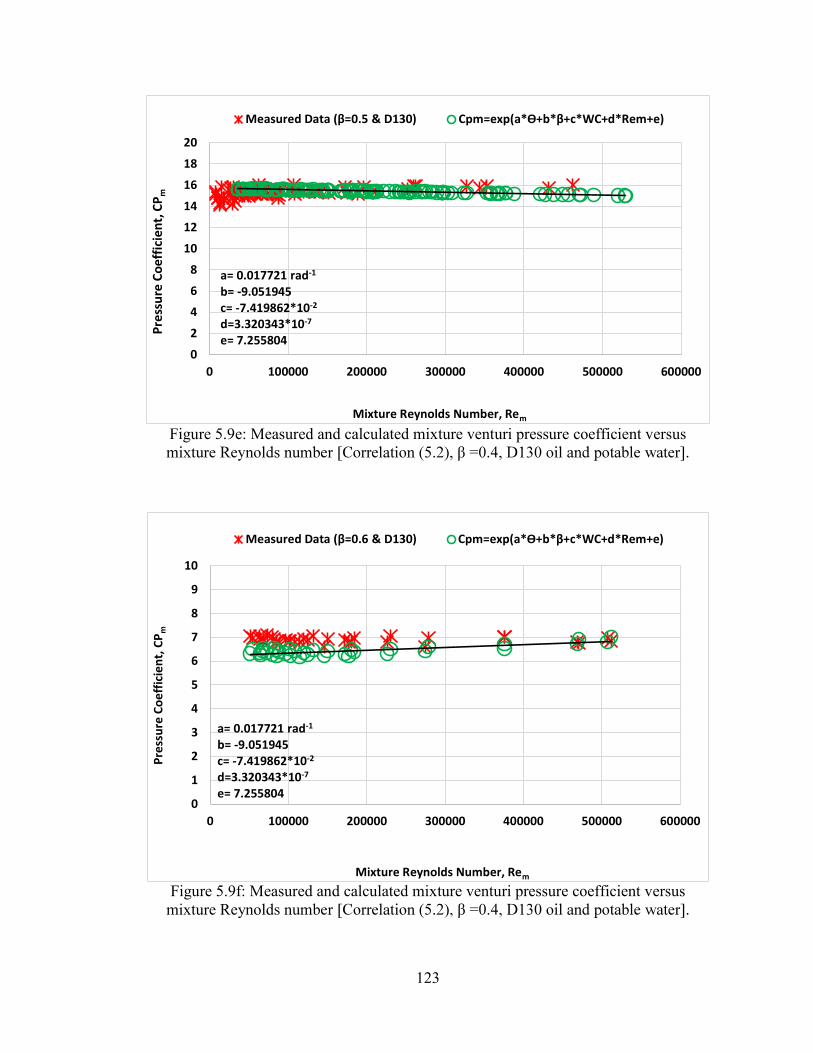
123
Figure 5.9e: Measured and calculated mixture venturi pressure coefficient versus
Figure 5.9f: Measured and calculated mixture venturi pressure coefficient versus mixture Reynold
0
2
4
6
8
10
12
14
16
18
20
0 100000 200000 300000 400000 500000 600000
Pres
sure
Coe
ffic
ient
, CP m
Mixture Reynolds Number, Rem
Measured Data ( 0.5 & D130) Cpm=exp(a* b* c*WC+d*Rem+e)
a= 0.017721 rad-1
b= -9.051945c= -7.419862*10-2
d=3.320343*10-7
e= 7.255804
0
1
2
3
4
5
6
7
8
9
10
0 100000 200000 300000 400000 500000 600000
Pres
sure
Coe
ffic
ient
, CP m
Mixture Reynolds Number, Rem
Measured Data ( 0.6 & D130) Cpm=exp(a* b* c*WC+d*Rem+e)
a= 0.017721 rad-1
b= -9.051945c= -7.419862*10-2
d=3.320343*10-7
e= 7.255804

124
Table 5.5: Comparison between measured and predicted average values of the mixture venturi pressure coefficient Cpm for homogeneous fluid mixture density of oil D130 data.
Size
Flow Loop
Inclination
Average of Measured Cpm
by Equation (4.9)
Average of Predicted
Cpm by Correlation
(5.2)
0.4 0º 37.03
37.65 90º 38.41
0.5
0º 15.36 15.52
90º 15.31
0.6
0º 6.87 6.43
90º 6.90
In conclusion, it can be clearly seen from Tables (5.4 &5.5) and Figures (5.9a to 5.9f) that
the average values of both measure and predicted mixture venturi pressure coefficient
fluctuate around 38.39, 15.55 and 7.00 for all orientations of the loop for the venturi meters
In Figures 5.8a and 5.8b, the closeness of between the measured and predicted Cpm plots for
the data of oil D80 and oil D130 experiments, implies that the output responses are not
sensitive to the inclination and water cut.
Therefore, from the experimental results discussed so far, it can be concluded that the flow
loop inclination does not affect the venturi meters result. The behavior of Cpm vs. Rem at
high flow rate considered in this work is similar to the behavior of the venturi with a single-
phase flow in the venturi regardless of the inclination angles.

125
5.8.1 Results of Correlations Input Variables Reduction
It is of interest to reduce the number of variables as much as possible to find the variables
that contribute most to the mixture venturi pressure coefficient, Cpm. Some of the variables
used in the previous regression models of oils (D80 &D130) are closely correlated. As
already mentioned, the effect of inclination on pressure drop behavior is not appreciable. So
that, for this reason the inclination has no effect on the mixture venturi pressure coefficient,
Cpm. Because of that, the effect of inclination
In addition, variations in oils viscosities were included in this study, but variations between
the oils viscosities is very small. Meanwhile, the experimental observations were made at
very high-pressure gradients and high flow rates similar to that in real oil field industries,
therefore no attempt being made to detect the viscosity variations of the both mineral oils
with high-pressure drops and turbulent flows.
It could be pointed out also that since all data were performed on mineral oils only with near
closed densities and viscosities, it can only be assumed at present that changes and difference
in oils viscosities would produce no fundamental change in the correlation.
Therefore, new powered imperial correlations were built for a certain water cut for the
completely sets of data for both oils (D80 &D130). The resultant correlations were fitted
using the same regression software DataFit to build good correlations at a certain water cut
for the mixture venturi pressure coefficient, Cpm, based on mixture Reynolds number, Rem,
dimensionless form as follows:

126
(5.3)
Where,
Rem = Mixture Reynolds number
a, b and c = Regression Variables, their values listed in Table 5.6 for each individual water
cut.
Table 5.6: The statistical analyses for oils (D80 and D130) correlation, (5.3).
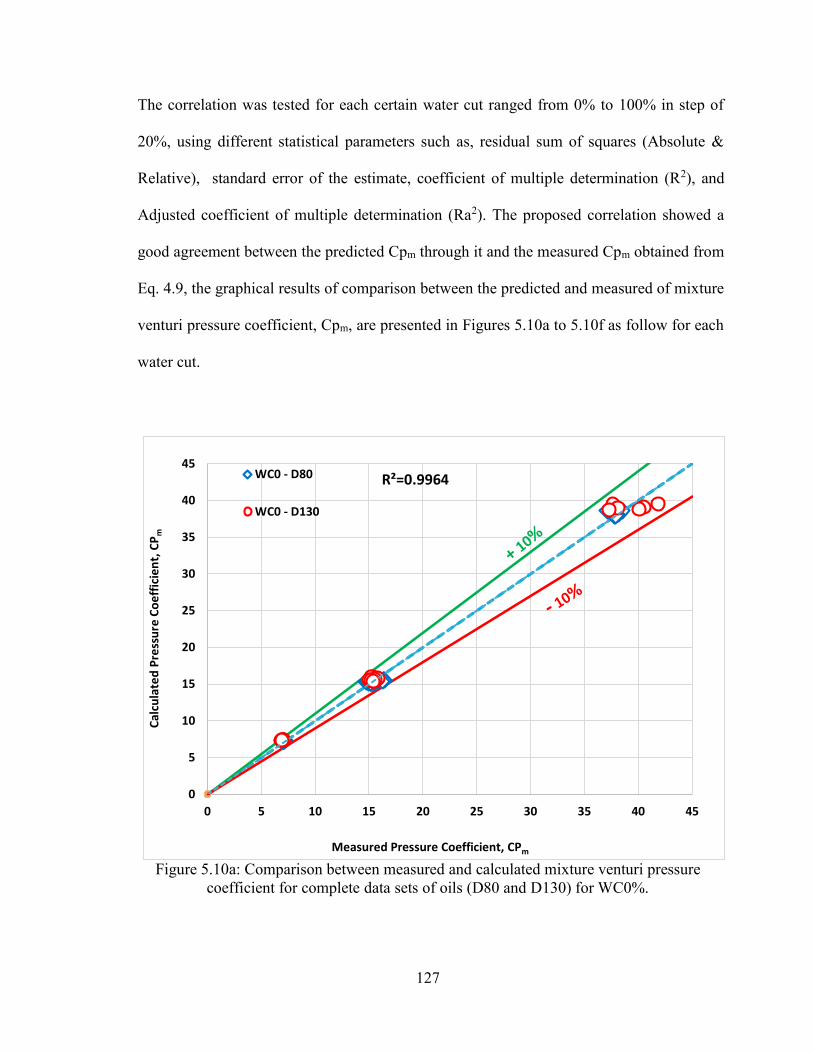
127
The correlation was tested for each certain water cut ranged from 0% to 100% in step of
20%, using different statistical parameters such as, residual sum of squares (Absolute &
Relative), standard error of the estimate, coefficient of multiple determination (R2), and
Adjusted coefficient of multiple determination (Ra2). The proposed correlation showed a
good agreement between the predicted Cpm through it and the measured Cpm obtained from
Eq. 4.9, the graphical results of comparison between the predicted and measured of mixture
venturi pressure coefficient, Cpm, are presented in Figures 5.10a to 5.10f as follow for each
water cut.
Figure 5.10a: Comparison between measured and calculated mixture venturi pressure coefficient for complete data sets of oils (D80 and D130) for WC0%.
0
5
10
15
20
25
30
35
40
45
0 5 10 15 20 25 30 35 40 45
Calc
ulat
ed P
ress
ure
Coef
ficie
nt, C
P m
Measured Pressure Coefficient, CPm
WC0 - D80
WC0 - D130
R²=0.9964
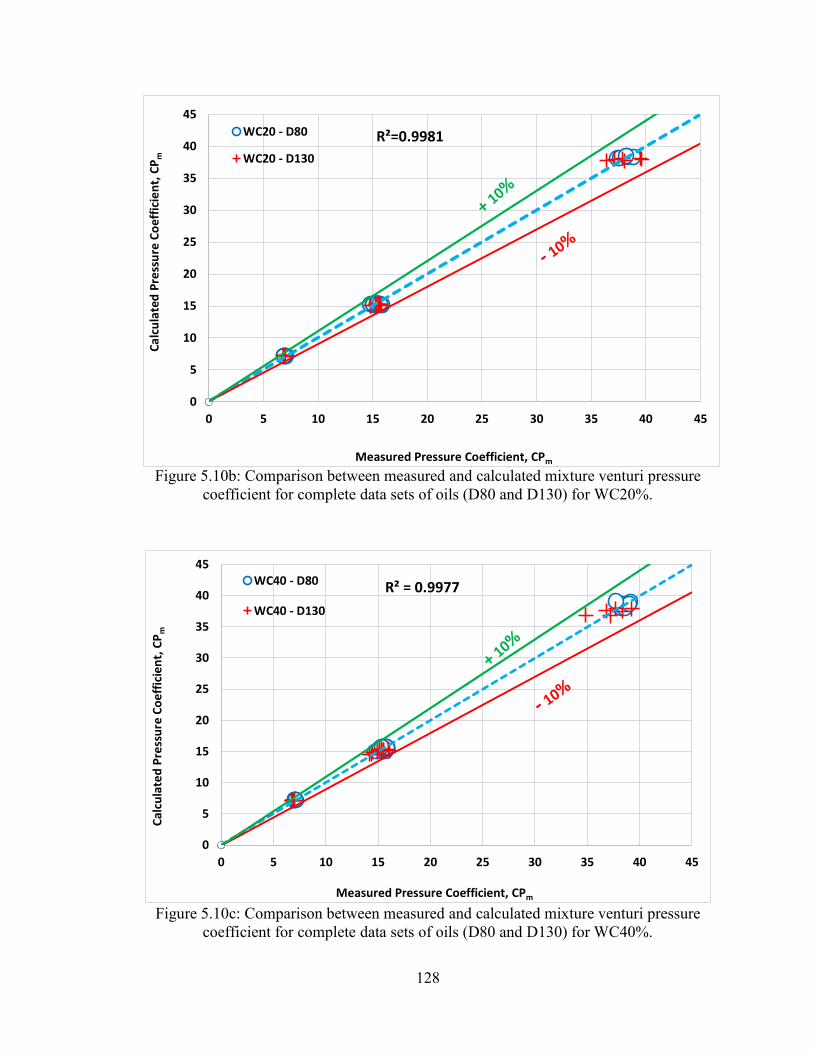
128
Figure 5.10b: Comparison between measured and calculated mixture venturi pressure coefficient for complete data sets of oils (D80 and D130) for WC20%.
Figure 5.10c: Comparison between measured and calculated mixture venturi pressure coefficient for complete data sets of oils (D80 and D130) for WC40%.
0
5
10
15
20
25
30
35
40
45
0 5 10 15 20 25 30 35 40 45
Calc
ulat
ed P
ress
ure
Coef
ficie
nt, C
P m
Measured Pressure Coefficient, CPm
WC20 - D80
WC20 - D130
R²=0.9981
0
5
10
15
20
25
30
35
40
45
0 5 10 15 20 25 30 35 40 45
Calc
ulat
ed P
ress
ure
Coef
ficie
nt, C
P m
Measured Pressure Coefficient, CPm
WC40 - D80
WC40 - D130
R² = 0.9977
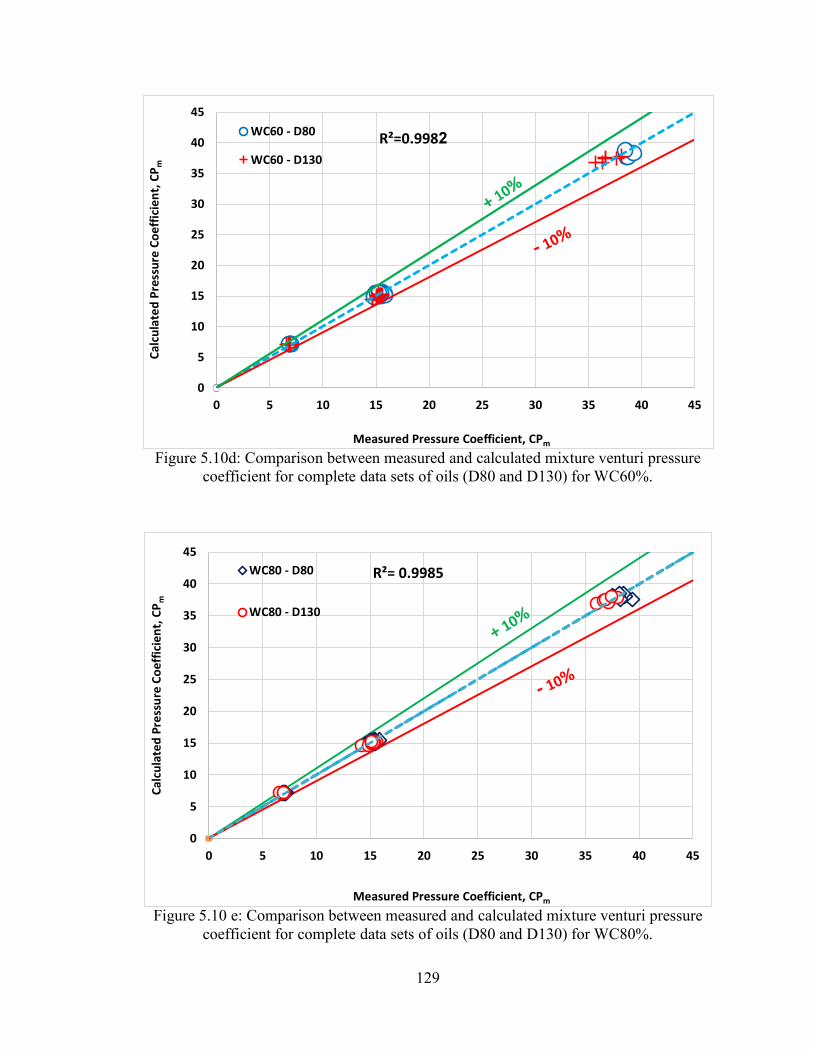
129
Figure 5.10d: Comparison between measured and calculated mixture venturi pressure coefficient for complete data sets of oils (D80 and D130) for WC60%.
Figure 5.10 e: Comparison between measured and calculated mixture venturi pressure coefficient for complete data sets of oils (D80 and D130) for WC80%.
0
5
10
15
20
25
30
35
40
45
0 5 10 15 20 25 30 35 40 45
Calc
ulat
ed P
ress
ure
Coef
ficie
nt, C
P m
Measured Pressure Coefficient, CPm
WC60 - D80
WC60 - D130
R²=0.998
0
5
10
15
20
25
30
35
40
45
0 5 10 15 20 25 30 35 40 45
Calc
ulat
ed P
ress
ure
Coef
ficie
nt, C
P m
Measured Pressure Coefficient, CPm
WC80 - D80
WC80 - D130
R²= 0.9985

130
Figure 5.10 f: Comparison between measured and calculated mixture venturi pressure coefficient for complete data sets of oils (D80 and D130) for WC100%.
inclination and water cut (WC) parameters are not significantly like mixture Reynolds
rrelated to venturi pressure coefficient, Cpm.
The empirical power correlation for the Cpm, responses were plotted against the
corresponding Cpm obtained from Eq. 4.9.
Figures 5.10a to 5.10f show that the generated Cpm using the empirical power correlation,
match up very closely for all water cuts. The deviation between the Cpm plots at the higher
probabilities are largely negligible and it can be reasonably concluded that the exclusion of,
venturi orientation and mixture water cut from the Cpm correlation does not significantly
affect the accuracy of the Correlation predictions. Also due the high turbulent of flow, the
0
5
10
15
20
25
30
35
40
45
0 5 10 15 20 25 30 35 40 45
Calc
ulat
ed P
ress
ure
Coef
ficie
nt, C
P m
Measured Pressure Coefficient, CPm
WC100 - D80
WC100 - D130
R² = 0.9970
131
mineral oil type (oil density and viscosity) does not affecting considerably on the predictions
of venturi pressure coefficient, Cpm.
In conclusion, from the score plots, predicted values of mixture venturi pressure coefficient,
Cpm, seem to be closely correlated to Cpm results as measured by the Eq. 4.9 based on the
real measured experimental data for both oils (D80& D130) for the three venturi meters

132
CHAPTER 6
CONCLUSIONS AND RECOMMENDATIONS
The multiphase flow loop was constructed at King Fahd University of Petroleum and
Minerals (KFUPM) in Northern Compound to perform and to characterize experimentally
different observations on the multiphase (two and three phases) flow in a large-scale loop for
different inclination and flow conditions similar to that one in the real oil and gas field
industries.
This chapter was divided into two main sections. Firstly, conclusions section, which presents
the main conclusions of this experimental work reported in this thesis. Secondly,
recommendations section, which presents the important recommendations and advisements,
can be taken into under consideration for the future researches and activities for more
improvement and perfection in the quality of research in this area.
6.1 Conclusios
The investigation of pressure drop measurements were studied in Tercom flanged machined
-water two-phase flow experiments in a 0.0762 m
(3-inch) pipe. The experimental data was acquired using a large-scale, inclinable two-phase
flow loop for different fluid mixture flow rates and water cuts. Potable water and two mineral
oils (D80 & D130) were used for the single-phase and two-phase oil-water experiments for
133
the three venturi meters. The experiments were conducted for water cuts varying from 0% to
100% in steps of 20%, flow rates ranging from 2,000 bpd to 12,000 bpd, and for different
inclinations of the flow loop, from horizontal to vertical positions.
The experimental results showed that the venturi pressure drop varied parabolically with
fluid flow rate for a given water cut for the venturi meters studied. For given flow rate and
the venturi pressure drop varied linearly with the water cut for a given fluid flow rate
confirming the existence of the homogenous flow pattern. The venturi pressure drop
measurements were unaffected by the flow loop inclination for the three venturi meters and
test fluid flow rates studied. Also the minor difference between the physical properties (e.g.
oils densities and viscosities) of the two mineral oils (D80 &D130) which considered does
not affecting on the venturi pressure drop measurements, that is because high flow
turbulence.
A modified venturi discharge coefficient, k, which is a function of pressure losses and
geometry, was determined separately for the three venturi meters from the oils-water flow
experimental data. The average values of (3.73 m2.s/h, 5.93 m2.s/h and 8.75 m2.s/h) of k in
oil D80 experiments and (3.75 m2.s/h, 5.90 m2.s/h and 8.78 m2.s/h) in case oil D130, for the
experimental results. The experimental and theoretical results of fluid flow rates were
compared and were found to be in very good agreement.
The conventional Cd was obtained using the average k values of each of the three venturi
meters. The results showed that the Cd values lie mainly in the range of 0.98 to 1.0 with the

134
exception of 0.96 and 1.03 for a single-phase of oil D80 and D130 experiments for venturi
measurement uncertainty.
New empirical correlations were developed to calculate the mixture venturi pressure
coefficient, Cpm. The correlations showed high accuracy in predictions with coefficient of
multiple determination (R-squared) ranged between 0.9964 and 0.9985. The developed
correlations were further verified using the experimental data obtained from the three venturi
= 0.4, 0.5 and 0.6) using the oils (D80 & D130).
The measured and predicted values of the mixture venturi pressure coefficient fluctuated
0.4, 0.5 and 0.6, respectively. The experimental results show that the venturi pressure drop
and the venturi coefficients obtained for the three venturi meters were unaffected by the flow
loop inclination for oil-water two phase flow conditions.
Error analysis for the pressure drop measurements for all water cuts and all fluid mixture
flow rates was also performed. The results of the error analysis, which shows that the error
band of the random uncertainty lies in the range of 0.007% to 0.498% for mineral oils D80
and D130 and for the three venturi meters, and are presented graphically. However, the
systematic and expanded uncertainties are implemented accurately. The systematic
uncertainty is ± 0.025% of Full Scale, and the expanded uncertainty lies in the range of
0.498% to 0.996%. The highest errors observed at the highest flow rate (12,000 bpd) case
and associated with single phase experiments (WC0 & 100%), due to the limitations of the
pumping system.

135
In conclusion, this study focuses on the variables affecting the performance of the venturi
meter for oil-water flow under real oil well fluid flow conditions.
6.2 Recommendations
Based on the results presented in this experimental study is an important first step in
simulations to that happen for oil wells in real field industries and to fill the existing gaps in
two-phase flow in large-scale inclinable loops. The conclusion of this study and the
measuring tools developed in this study are important for undertaking further research on
pressure drop in venture meters. The following recommendations with respect to further
research are made from the experiences gained through this experimental study to improve
the quality of the measured data and to extend the scope of the research area:
1. In order to avoid the quick formation of oil-water emulsion, a new big separator tank
can be mounted next to this old one. Otherwise two medium separators can be installed
individually, one for the oil phase and the other for water phase.
2. The purging process is method of clearing the pressure transmitters from the emulsion
droplets. However, this method have several disadvantages such as time consumption,
and the risk of falling for the person conducting the experiments especially when
performing the inclinable and vertical experiments. It recommend that, a new modern
way can be followed by bringing any flexible tools to clean the pressure transmitters or
safety tools can be offered like a hydraulic lift.
3. Modifying the multiphase flow loop and adding two more pumps of higher power type
to reach high flow rates in the cases of single (oil/water) phase experiment. Then, all

136
experiments at WC0% and WC100% for high flow rates will be carry out. As a result
of that, the probability of measurement errors can be minimized.
4. Because of the high flow rates, many parameters can be investigated in the turbulent
regimes such as the performance of polymers in turbulent drag reduction and the
performance of nanomaterials.
5. Useful models can be developed based on this rare clear set of data to predict many
parameters in multiphase flow in large-scale inclinable pipes for mineral oils at different
conditions.
6. As flow loop laboratory already enhanced with air compressor and tow air storage tanks
with the controlled pressure capacity of 7.9 bar for each one. Therefore, the gas phase
can be injected to the mixture of oil and water to study the behavior of three phases (oil,
water and gas) flow in future researches.
7. Visualization techniques (e.g. high-speed camera, transparent pipes and tomographic
measurements) can be applied to flow loop in order to characterize more observations
8. In order to observe the mixture temperature accurately, extra temperature sensor should
be mounted on the gravity-settling tank of oil-water mixture.
137
References
[1] Maksimovic, P. (2005), \multi-phase Flow modeling", Technical report, St John's Conference Center.
[2] Method of Gauging Water; Applicable to the Cases of Very Large Tubes, and of a
Am. Soc. Civ. Eng., vol. XVII, 1887.
[3] ow of oil-in- Ind. Eng. Chem. Res., vol. 32, no. 6, pp. 1212 1217, 1993.
[4] -water two-phase flow measurement based on a hybrid flowmeter and dominant phase
Int. Instrum. Meas. Technol. Conf., vol. 2, no. May, pp. 711 714, 2009.
[5] -Water Two-Phase Flow Chem. Eng.
Commun., vol. 197, no. 2, pp. 223 231, 2009.
[6] -water Two- 287, 2012.
[7] H. Z. Ding Feng, Yu Xie, Zuojie Liao, Jiawe
Information and Control Engineering, 2012, vol. 03, pp. 559 562.
[8] S. Brinkhorst, E. Von Lavante, G. Wendt, and H. Venturi-investigation of cavitating Herschel Venturi-Tubes applied to liquid fl ow
25, 2015.
[9] -rate measurement of oil-water two-phase flow based on differential pressure and adaptive wavelet
712817 6, 2008.
[10] Petroleum Science and Engineering Discharge coef fi cient performance of Venturi , standard concentric ori fi ce plate , V-cone and wedge fl ow meters at low
566, 2011.
[11] calculation of phase holdup for an oil-water two-phase vertical flow based on the
Flow Meas. Instrum., vol. 31, pp. 96 101, 2013.
[12] T. Al- -Water Flow Pressure

138
Chem. Eng. Commun., vol. 201, no. 2, pp. 209 224, 2014.
[13] Energy Sources, Part A
Recover. Util. Environ. Eff., vol. 37, no. 8, pp. 840 845, 2015.
[14] water two- Int. J. Multiph. Flow, vol. 72, pp. 306317, 2015.
[15] MEASUREMENT IN MULTIPHASE FLOW BY MEANS OF A VENTURI
155, 1991.
[16] -
[17] -0070 MULTI-PHASE FLOW
[18]
[19] Flow Meas. Instrum., vol. 12, no. 5 6, pp. 361 372, 2002.
[20]
1997, p. 1997.
[21] M. J. R.-Second North Am. Conf. Multiph. Technol., 2000.
[22] oil two-phase flow measurement Flow
Meas. Instrum., vol. 16, pp. 177 182, 2005.
[23] -air two-phase mass flow rate measurement using Venturi and void fractio J. Zhejiang Univ. Sci., vol. 6A, no. 6, pp. 601 606, 2005.
[24] 24th Int. North Sea Flow Meas.
Work., no. October, pp. 1 20, 2006.
[25] hydrodynamics of liquid Int. J. Multiph. Flow, vol. 34, no. 12, pp. 1119 1129, 2008.

139
[26] F. Lide, Z. Tao, and X. Ying,
[27] Chinese J. Chem. Eng., vol. 16, no. 2, pp. 320 324, 2008.
[28] -water two-phase flow measurement using a Venturi meter and an electrical resistance tomography
Flow Meas. Instrum., vol. 21, no. 3, pp. 268 276, 2010.
[29] H. Seraj, M. Khaled, R. YusInt. J. Smart Sens.
Intell. Syst., vol. 3, no. 4, pp. 672 689, 2010.
[30] A.-W. Y. Abbas H. A. M. Hasan1, A. Hadawey1 and and K. F. A.-R. Waleed Abdul- - water Two
58, 2012.
[31] behaviour Flow Meas. Instrum., vol. 33, pp. 160 167, 2013.
[32] -phase flow measurements at high Prog. Nucl. Energy, vol. 77, pp. 167 175, 2014.
[33] Venturi meter based on two- Measurement, vol. 58, pp. 61 67, 2014.
[34] nt of gas-liquid two-phase slug flow Chinese J. Chem. Eng.,
vol. 23, no. 9, pp. 1447 1452, 2015.
[35] gas flow metering Flow Meas. Instrum., vol. 44, pp. 126131, 2015.
[36] -phase gas-liquid- UK Univ. London, vol. 0, no. 0, 2000.
[37] nvestigation of two-phase flashing flows of a binary mixf infinite relative volatility in a Venturi
Exp. Therm. Fluid Sci., vol. 64, pp. 152 163, 2015.
[38] gas over re Exp. Therm. Fluid Sci., vol. 66, pp. 63 71, 2015.
[39]
140
[40] Software, 2016. from http://www.oakdaleeng Visited website in October 2016.
[41] Morgan, M.G., and M. Henrion. 1990. Uncertainty: A Guide to Dealing with Uncertainty in Quantitative Risk and Policy Analysis, Cambridge University Press. 332 pp.
[42] Isukapalli, S. S. 1999. Uncertainty Analysis of Transport-Transformation Models. Ph.D. Thesis, The State University of New Jersey.
[43] Yen, B. C. 2002. System and Component Uncertainties in Water Resources.In Risk, Reliability, Uncertainty and Robustness o f Water Resources Systems (Bogardi, Janos J.,Kundzewicz, Zbigniew W., eds), Cambridge University Press, Cambridge, pp. 133-142.
[44] U.S. EPA. 2003. Multimedia, Multipathway, and Multireceptor Risk Assessment
(3MRA) Modeling System. Volume IV: Evaluating Uncertainty and Sensitivity. EPA 530-D-03-001d. July 2003.
[45] U.S. EPA. 1996. Summary report for the Workshop on Monte Carlo Analysis, Superfund Today, September. EPA 630-R-96-010, 1-1.
[46] <http://www.engnetbase.c
[47] Measurements of kinematic viscosity for Exxsol D80 and Exxsol D130 oils were

141
APPENDICES

142
APPENDIX A
UNCERTAINTY ANALYSIS
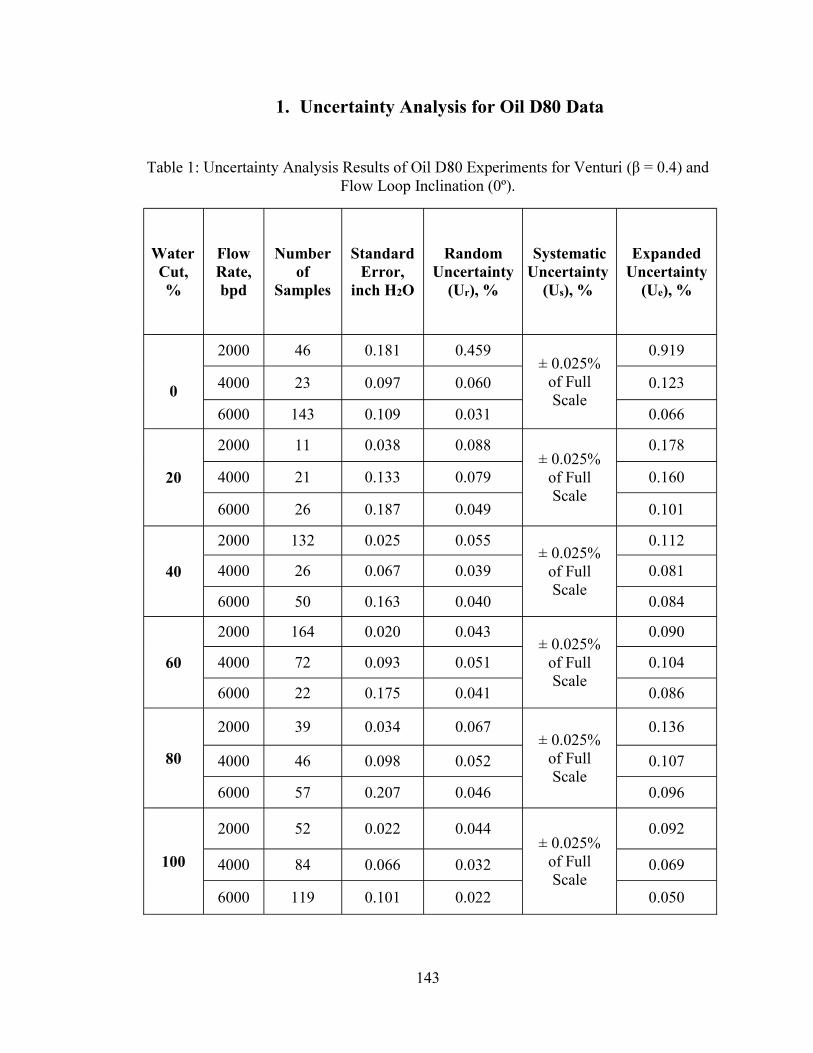
143
1. Uncertainty Analysis for Oil D80 Data
Table Flow Loop Inclination (0º).
Water Cut, %
Flow Rate, bpd
Number of
Samples
Standard Error,
inch H2O
Random Uncertainty
(Ur), %
Systematic Uncertainty
(Us), %
Expanded Uncertainty
(Ue), %
0
2000 46 0.181 0.459 ± 0.025%
of Full Scale
0.919
4000 23 0.097 0.060 0.123
6000 143 0.109 0.031 0.066
20
2000 11 0.038 0.088 ± 0.025%
of Full Scale
0.178
4000 21 0.133 0.079 0.160
6000 26 0.187 0.049 0.101
40
2000 132 0.025 0.055 ± 0.025%
of Full Scale
0.112
4000 26 0.067 0.039 0.081
6000 50 0.163 0.040 0.084
60
2000 164 0.020 0.043 ± 0.025%
of Full Scale
0.090
4000 72 0.093 0.051 0.104
6000 22 0.175 0.041 0.086
80
2000 39 0.034 0.067 ± 0.025%
of Full Scale
0.136
4000 46 0.098 0.052 0.107
6000 57 0.207 0.046 0.096
100
2000 52 0.022 0.044 ± 0.025%
of Full Scale
0.092
4000 84 0.066 0.032 0.069
6000 119 0.101 0.022 0.050

144
Table 2Flow Loop Inclination (90º).
Water Cut, %
Flow Rate, bpd
Number of
Samples
Standard Error,
inch H2O
Random Uncertainty
(Ur), %
Systematic Uncertainty
(Us), %
Expanded Uncertainty
(Ue), %
0
2000 125 0.139 0.353 ± 0.025% of Full Scale
0.707
4000 117 0.196 0.126 0.252
6000 52 0.208 0.059 0.120
20
2000 110 0.019 0.045 ± 0.025% of Full Scale
0.093
4000 54 0.074 0.043 0.090
6000 11 0.333 0.088 0.178
40
2000 52 0.034 0.078 ± 0.025% of Full Scale
0.159
4000 40 0.052 0.028 0.062
6000 10 0.570 0.144 0.289
60
2000 43 0.044 0.094 ± 0.025% of Full Scale
0.190
4000 61 0.090 0.049 0.101
6000 34 0.192 0.046 0.095
80
2000 12 0.145 0.292
± 0.025% of Full Scale
0.585
4000 14 0.184 0.093 0.188
6000 5 0.589 0.137 0.274
100
2000 29 0.048 0.093
± 0.025% of Full Scale
0.187
4000 62 0.091 0.045 0.093
6000 50 0.187 0.040 0.084
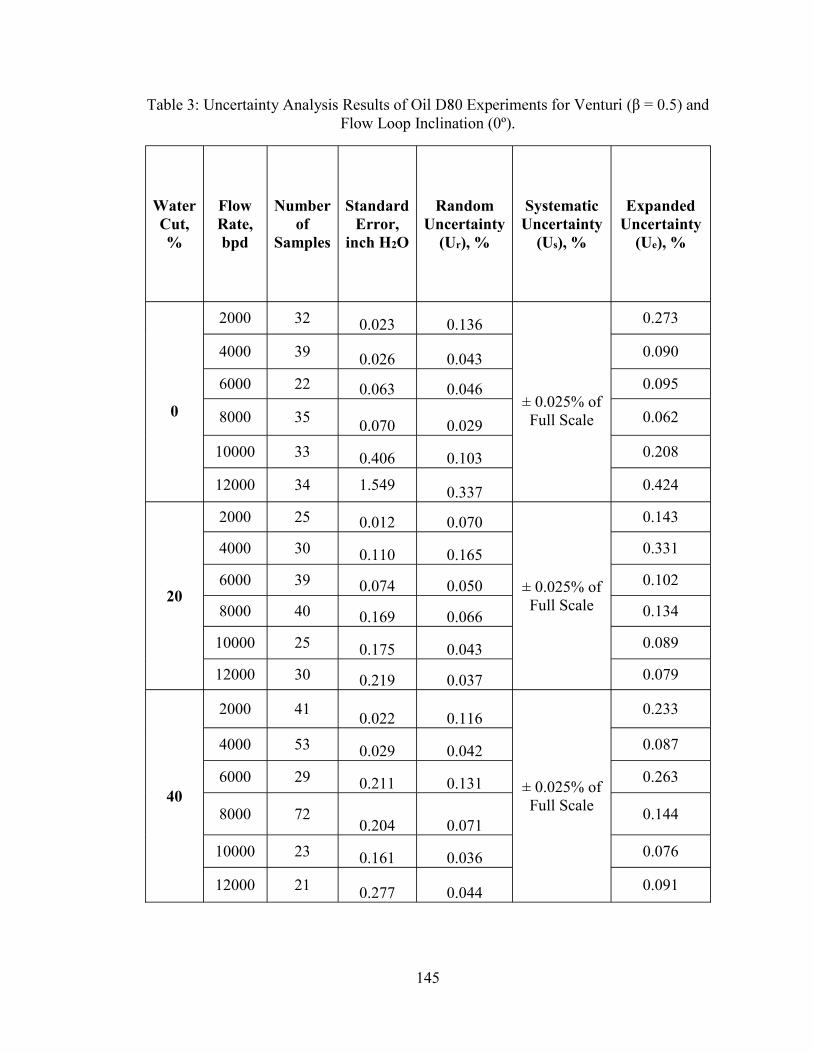
145
Table 3: Uncertainty Analysis Flow Loop Inclination (0º).
Water Cut, %
Flow Rate, bpd
Number of
Samples
Standard Error,
inch H2O
Random Uncertainty
(Ur), %
Systematic Uncertainty
(Us), %
Expanded Uncertainty
(Ue), %
0
2000 32 0.023 0.136
± 0.025% of Full Scale
0.273
4000 39 0.026 0.043 0.090
6000 22 0.063 0.046 0.095
8000 35 0.070 0.029 0.062
10000 33 0.406 0.103 0.208
12000 34 1.549 0.337 0.424
20
2000 25 0.012 0.070
± 0.025% of Full Scale
0.143
4000 30 0.110 0.165 0.331
6000 39 0.074 0.050 0.102
8000 40 0.169 0.066 0.134
10000 25 0.175 0.043 0.089
12000 30 0.219 0.037 0.079
40
2000 41 0.022 0.116
± 0.025% of Full Scale
0.233
4000 53 0.029 0.042 0.087
6000 29 0.211 0.131 0.263
8000 72 0.204 0.071
0.144
10000 23 0.161 0.036 0.076
12000 21 0.277 0.044 0.091

146
Cont-Table 3: Uncertainty Analysis Results of Oil D80 Experiments for Venturi
Water Cut, %
Flow Rate, bpd
Number of
Samples
Standard Error,
inch H2O
Random Uncertainty
(Ur), %
Systematic Uncertainty
(Us), %
Expanded Uncertainty
(Us), %
60
2000 51 0.018 0.100
± 0.025% of Full Scale
0.201
4000 28 0.061 0.085 0.173
6000 21 0.090 0.053 0.109
8000 14 0.295 0.100 0.201
10000 12 0.910 0.195 0.391
12000 14 0.409 0.062 0.126
80
2000 43 0.018 0.094
± 0.025% of Full Scale
0.190
4000 21 0.143 0.189 0.380
6000 22 0.147 0.086 0.173
8000 17 0.173 0.059 0.120
10000 11 0.473 0.101 0.203
12000 10 1.019 0.149 0.298
100
2000 45 0.018 0.084
± 0.025% of Full Scale
0.170
4000 17 0.130 0.162 0.325
6000 22 0.136 0.075 0.153
8000 12 0.145 0.045
0.094
10000 24 0.169 0.034 0.072
12000 21 0.141 0.024 0.053
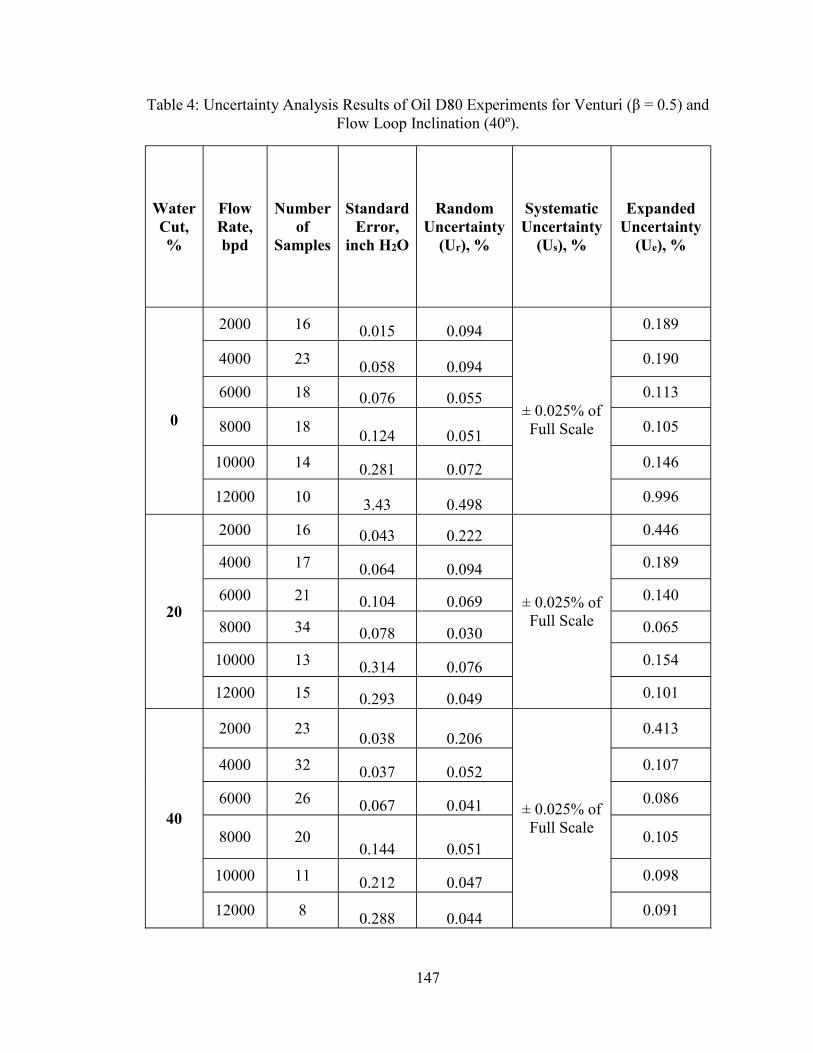
147
Table 4: Uncertainty Analysis Results of Oil Flow Loop Inclination (40º).
Water Cut, %
Flow Rate, bpd
Number of
Samples
Standard Error,
inch H2O
Random Uncertainty
(Ur), %
Systematic Uncertainty
(Us), %
Expanded Uncertainty
(Ue), %
0
2000 16 0.015 0.094
± 0.025% of Full Scale
0.189
4000 23 0.058 0.094 0.190
6000 18 0.076 0.055 0.113
8000 18 0.124 0.051
0.105
10000 14 0.281 0.072 0.146
12000 10 3.43 0.498 0.996
20
2000 16 0.043 0.222
± 0.025% of Full Scale
0.446
4000 17 0.064 0.094 0.189
6000 21 0.104 0.069 0.140
8000 34 0.078 0.030 0.065
10000 13 0.314 0.076 0.154
12000 15 0.293 0.049 0.101
40
2000 23 0.038 0.206
± 0.025% of Full Scale
0.413
4000 32 0.037 0.052 0.107
6000 26 0.067 0.041 0.086
8000 20 0.144 0.051
0.105
10000 11 0.212 0.047 0.098
12000 8 0.288 0.044 0.091
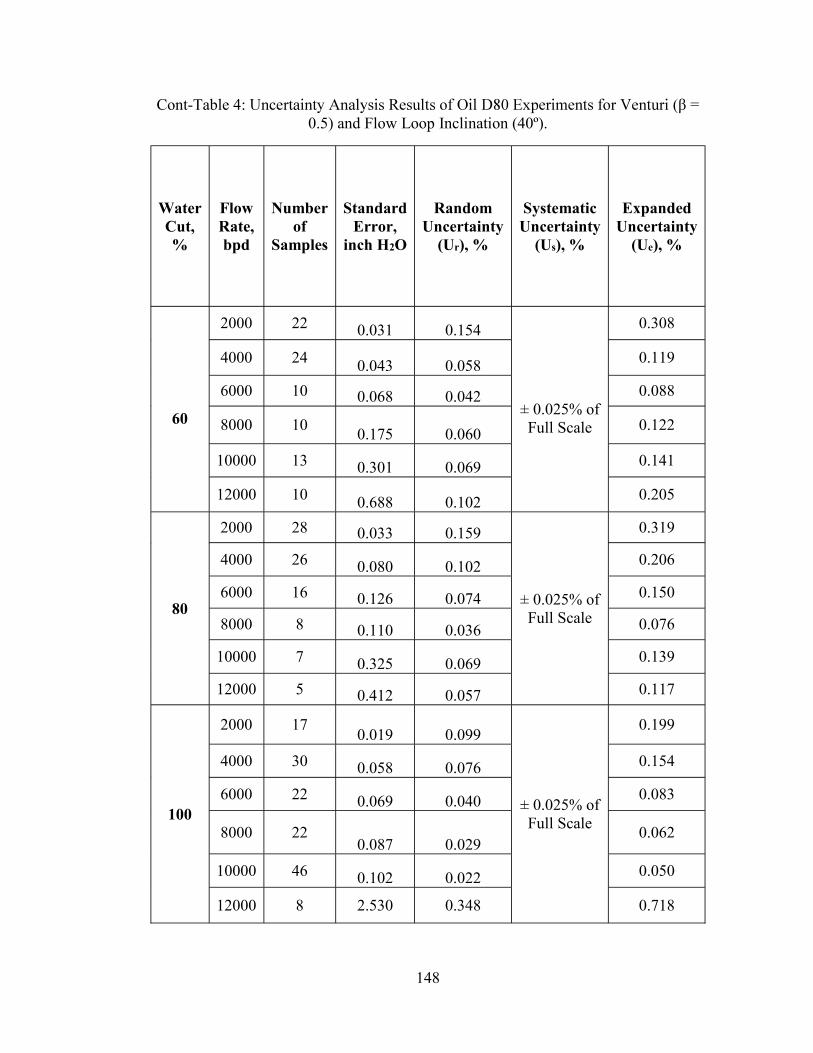
148
Cont-Table 40.5) and Flow Loop Inclination (40º).
Water Cut, %
Flow Rate, bpd
Number of
Samples
Standard Error,
inch H2O
Random Uncertainty
(Ur), %
Systematic Uncertainty
(Us), %
Expanded Uncertainty
(Ue), %
60
2000 22 0.031 0.154
± 0.025% of Full Scale
0.308
4000 24 0.043 0.058 0.119
6000 10 0.068 0.042 0.088
8000 10 0.175 0.060
0.122
10000 13 0.301 0.069 0.141
12000 10 0.688 0.102 0.205
80
2000 28 0.033 0.159
± 0.025% of Full Scale
0.319
4000 26 0.080 0.102 0.206
6000 16 0.126 0.074 0.150
8000 8 0.110 0.036 0.076
10000 7 0.325 0.069 0.139
12000 5 0.412 0.057 0.117
100
2000 17 0.019 0.099
± 0.025% of Full Scale
0.199
4000 30 0.058 0.076 0.154
6000 22 0.069 0.040 0.083
8000 22 0.087 0.029
0.062
10000 46 0.102 0.022 0.050
12000 8 2.530 0.348 0.718

149
Table 5: Uncertainty Analysis Results of Oil D80 Experiments for Venturi Flow Loop Inclination (60º).
Water Cut, %
Flow Rate, bpd
Number of
Samples
Standard Error,
inch H2O
Random Uncertainty
(Ur), %
Systematic Uncertainty
(Us), %
Expanded Uncertainty
(Ue), %
0
2000 15 0.025 0.148
± 0.025% of Full Scale
0.298
4000 17 0.043 0.067 0.135
6000 11 0.142 0.099 0.201
8000 15 0.171 0.068
0.139
10000 16 0.247 0.064 0.130
12000 16 0.676 0.325 0.702
20
2000 27 0.020 0.118
± 0.025% of Full Scale
0.238
4000 31 0.088 0.132 0.266
6000 14 0.079 0.053 0.109
8000 28 0.098 0.037 0.077
10000 19 0.139 0.033 0.070
12000 9 0.188 0.031 0.067
40
2000 71 0.045 0.233
± 0.025% of Full Scale
0.467
4000 27 0.058 0.082 0.165
6000 21 0.150 0.091 0.184
8000 24 0.145 0.048
0.100
10000 18 0.188 0.042 0.087
12000 15 0.333 0.052 0.108

150
Cont-Table 50.5) and Flow Loop Inclination (60º).
Water Cut, %
Flow Rate, bpd
Number of
Samples
Standard Error,
inch H2O
Random Uncertainty
(Ur), %
Systematic Uncertainty
(Us), %
Expanded Uncertainty
(Ue), %
60
2000 22 0.037 0.182
± 0.025% of Full Scale
0.366
4000 22 0.063 0.081 0.163
6000 25 0.067 0.039 0.081
8000 14 0.083 0.028
0.062
10000 12 0.254 0.055 0.112
12000 9 0.291 0.046 0.094
80
2000 25 0.021 0.105
± 0.025% of Full Scale
0.211
4000 18 0.051 0.066 0.134
6000 7 0.104 0.059 0.121
8000 9 0.186 0.059 0.121
10000 12 0.245 0.051 0.106
12000 8 0.478 0.067 0.136
100
2000 24 0.013 0.059
± 0.025% of Full Scale
0.122
4000 19 0.053 0.065 0.132
6000 17 0.103 0.058 0.119
8000 26 0.090 0.029
0.063
10000 32 0.195 0.041 0.085
12000 45 1.719 0.241 0.489

151
Table 6Flow Loop Inclination (90º).
Water Cut, %
Flow Rate, bpd
Number of
Samples
Standard Error,
inch H2O
Random Uncertainty
(Ur), %
Systematic Uncertainty
(Us), %
Expanded Uncertainty
(Ue), %
0
2000 19 0.016 0.094
± 0.025% of Full Scale
0.190
4000 22 0.036 0.053 0.109
6000 15 0.060 0.042 0.087
8000 12 0.0869 0.035
0.074
10000 11 0.264 0.068 0.138
12000 19 1.720 0.287 0.623
20
2000 19 0.043 0.242
± 0.025% of Full Scale
0.485
4000 26 0.045 0.066 0.134
6000 18 0.076 0.051 0.106
8000 7 0.094 0.035 0.074
10000 9 0.237 0.057 0.117
12000 10 0.176 0.029 0.063
40
2000 40 0.031 0.170
± 0.025% of Full Scale
0.340
4000 20 0.044 0.062 0.126
6000 18 0.114 0.070 0.143
8000 13 0.113 0.039
0.082
10000 7 0.297 0.066 0.135
12000 9 0.129 0.020 0.048

152
Cont-Table 6: Uncertainty Analysis Results of Oil D80 Experiments for Venturi
Water Cut, %
Flow Rate, bpd
Number of
Samples
Standard Error,
inch H2O
Random Uncertainty
(Ur), %
Systematic Uncertainty
(Us), %
Expanded Uncertainty
(Ue), %
60
2000 37 0.030 0.151
± 0.025% of Full Scale
0.304
4000 18 0.072 0.092 0.186
6000 16 0.140 0.084 0.170
8000 8 0.176 0.061
0.125
10000 7 0.281 0.060 0.123
12000 13 0.383 0.058 0.120
80
2000 25 0.045 0.228
± 0.025% of Full Scale
0.457
4000 15 0.070 0.086 0.174
6000 12 0.078 0.044 0.092
8000 9 0.145 0.047 0.097
10000 9 0.412 0.086 0.173
12000 7 0.197 0.029 0.063
100
2000 9 0.018 0.087
± 0.025% of Full Scale
0.175
4000 31 0.040 0.053 0.108
6000 30 0.067 0.039 0.082
8000 25 0.094 0.031
0.067
10000 16 0.138 0.029 0.064
12000 12 1.026 0.151 0.227

153
Table 7Flow Loop Inclination (0º).
Water Cut, %
Flow Rate, bpd
Number of
Samples
Standard Error,
inch H2O
Random Uncertainty
(Ur), %
Systematic Uncertainty
(Us), %
Expanded Uncertainty
(Ue), %
0
6000 35 0.017 0.026 ± 0.025% of Full Scale
0.058
8000 63 0.042 0.037
0.078
9000 44 0.388 0.269 0.538
20
6000 75 0.018 0.027 ± 0.025% of Full Scale
0.060
8000 73 0.027 0.022 0.051
9000 32 0.077 0.050 0.104
40
6000 35 0.022 0.030 ± 0.025% of Full Scale
0.066
8000 52 0.027 0.022 0.050
9000 54 0.035 0.021 0.050
60
6000 57 0.014 0.017 ± 0.025% of Full Scale
0.043
8000 25 0.046 0.035 0.073
9000 25 0.047 0.028 0.062
80
6000 53 0.020 0.025
± 0.025% of Full Scale
0.055
8000 27 0.041 0.029 0.064
9000 31 0.047 0.027 0.059
100
6000 66 0.019 0.023
± 0.025% of Full Scale
0.052
8000 12 0.095 0.065 0.132
9000 5 0.144 0.077
0.155
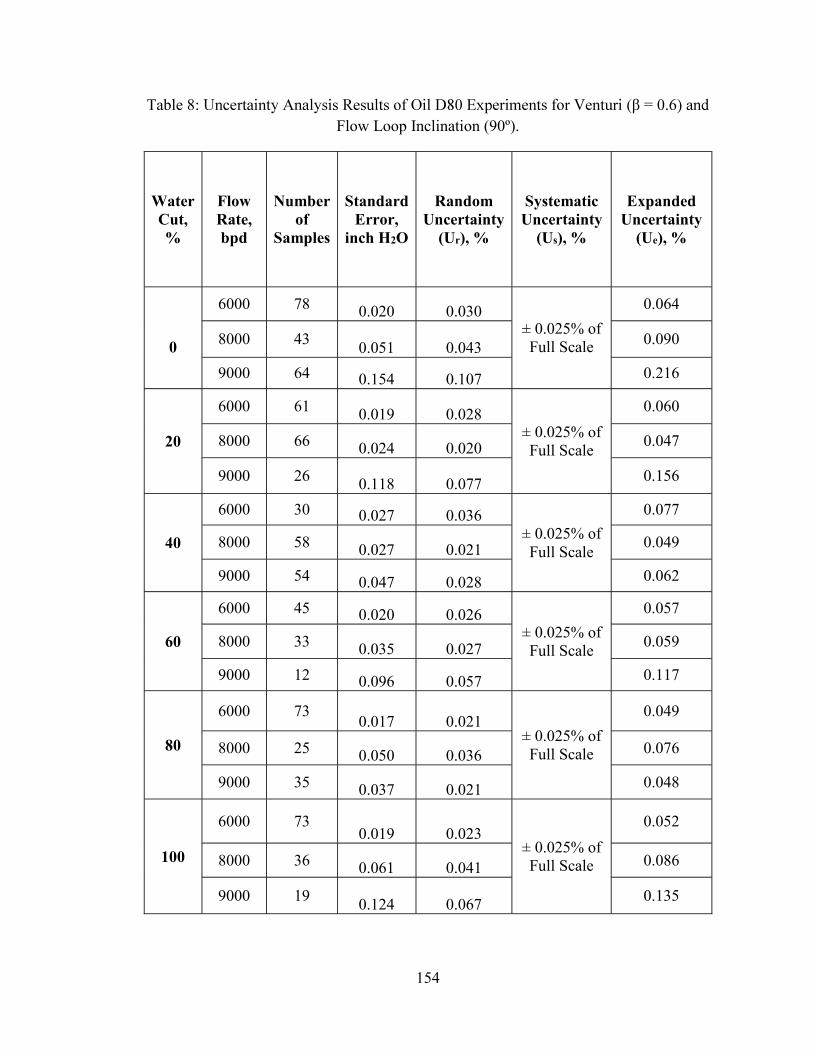
154
Table 8Flow Loop Inclination (90º).
Water Cut, %
Flow Rate, bpd
Number of
Samples
Standard Error,
inch H2O
Random Uncertainty
(Ur), %
Systematic Uncertainty
(Us), %
Expanded Uncertainty
(Ue), %
0
6000 78 0.020 0.030 ± 0.025% of Full Scale
0.064
8000 43 0.051 0.043 0.090
9000 64 0.154 0.107 0.216
20
6000 61 0.019 0.028 ± 0.025% of Full Scale
0.060
8000 66 0.024 0.020 0.047
9000 26 0.118 0.077 0.156
40
6000 30 0.027 0.036 ± 0.025% of Full Scale
0.077
8000 58 0.027 0.021 0.049
9000 54 0.047 0.028 0.062
60
6000 45 0.020 0.026 ± 0.025% of Full Scale
0.057
8000 33 0.035 0.027 0.059
9000 12 0.096 0.057 0.117
80
6000 73 0.017 0.021
± 0.025% of Full Scale
0.049
8000 25 0.050 0.036 0.076
9000 35 0.037 0.021 0.048
100
6000 73 0.019 0.023
± 0.025% of Full Scale
0.052
8000 36 0.061 0.041 0.086
9000 19 0.124 0.067 0.135

155
2. Uncertainty Analysis for Oil D130 Data
Table 9and Flow Loop Inclination (0º).
Water Cut, %
Flow Rate, bpd
Number of
Samples
Standard Error,
inch H2O
Random Uncertainty
(Ur), %
Systematic Uncertainty
(Us), %
Expanded Uncertainty
(Ue), %
0
2000 38 0.017 0.040 ± 0.025% of Full Scale
0.083
4000 32 0.044 0.026 0.058
6000 21 0.132 0.036 0.075
20
2000 57 0.026 0.062 ± 0.025% of Full Scale
0.127
4000 56 0.043 0.025 0.056
6000 37 0.134 0.034 0.073
40
2000 54 0.029 0.068 ± 0.025% of Full Scale
0.139
4000 18 0.053 0.030 0.065
6000 39 0.119 0.029 0.063
60
2000 30 0.025 0.056 ± 0.025% of Full Scale
0.114
4000 25 0.080 0.044 0.091
6000 40 0.162 0.040 0.083
80
2000 75 0.029 0.063 ± 0.025% of Full Scale
0.128
4000 26 0.106 0.057 0.116
6000 40 0.257 0.059 0.120
100
2000 51 0.018 0.035
± 0.025% of Full Scale
0.075
4000 33 0.072 0.036 0.076
6000 19 0.183 0.040 0.084

156
Table 10: Uncertainty Analysis and Flow Loop Inclination (90º).
Water Cut, %
Flow Rate, bpd
Number of
Samples
Standard Error,
inch H2O
Random Uncertainty
(Ur), %
Systematic Uncertainty
(Us), %
Expanded Uncertainty
(Ue), %
0
2000 36 0.032 0.072 ± 0.025% of Full Scale
0.146
4000 55 0.051 0.031
0.067
6000 34 0.133 0.035 0.074
20
2000 54 0.019 0.044 ± 0.025% of Full Scale
0.092
4000 41 0.075 0.042 0.088
6000 35 0.153 0.039 0.083
40
2000 55 0.019 0.044 ± 0.025% of Full Scale
0.091
4000 43 0.057 0.032 0.069
6000 48 0.098 0.024 0.054
60
2000 59 0.018 0.041 ± 0.025% of Full Scale
0.087
4000 25 0.081 0.043 0.090
6000 27 0.227 0.055 0.113
80
2000 51 0.030 0.063
± 0.025% of Full Scale
0.128
4000 41 0.116 0.062 0.127
6000 72 0.176 0.042 0.087
100
2000 112 0.020 0.041
± 0.025% of Full Scale
0.086
4000 56 0.082 0.041 0.086
6000 97 0.101 0.022
0.051

157
Table 11and Flow Loop Inclination (0º).
Water Cut, %
Flow Rate, bpd
Number of
Samples
Standard Error,
inch H2O
Random Uncertainty
(Ur), %
Systematic Uncertainty
(Us), %
Expanded Uncertainty
(Ue), %
0
2000 21 0.018 0.109
± 0.025% of Full Scale
0.220
4000 36 0.017 0.024 0.055
6000 57 0.030 0.020 0.048
8000 30 0.057 0.021
0.050
10000 34 0.102 0.025 0.055
12000 16 1.660 0.271 0.678
20
2000 30 0.018 0.103
± 0.025% of Full Scale
0.208
4000 32 0.031 0.044 0.092
6000 33 0.030 0.019 0.045
8000 105 0.031 0.011 0.033
10000 65 0.066 0.015 0.039
12000 35 0.098 0.016 0.040
40
2000 62 0.015 0.086
± 0.025% of Full Scale
0.174
4000 76 0.020 0.028 0.061
6000 56 0.026 0.015 0.039
8000 36 0.108 0.037
0.078
10000 11 0.090 0.020 0.048
12000 33 0.132 0.020 0.047

158
Cont-Table 11: Uncertainty Analysis Results of Oil D130 Experiments for Venturi
Water Cut, %
Flow Rate, bpd
Number of
Samples
Standard Error,
inch H2O
Random Uncertainty
(Ur), %
Systematic Uncertainty
(Us), %
Expanded Uncertainty
(Ue), %
60
2000 41 0.011 0.064
± 0.025% of Full Scale
0.129
4000 39 0.023 0.031 0.066
6000 43 0.044 0.027 0.059
8000 52 0.056 0.019
0.045
10000 29 0.183 0.040 0.084
12000 7 0.504 0.075 0.151
80
2000 21 0.015 0.086
± 0.025% of Full Scale
0.174
4000 72 0.025 0.032 0.069
6000 37 0.115 0.065 0.133
8000 36 0.088 0.029 0.063
10000 53 0.107 0.022 0.051
12000 14 0.548 0.078 0.157
100
2000 40 0.026 0.132
± 0.025% of Full Scale
0.265
4000 59 0.023 0.027 0.060
6000 72 0.032 0.017 0.042
8000 46 0.061 0.019
0.045
10000 54 0.069 0.013 0.037
12000 16 1.237 0.176 0.194
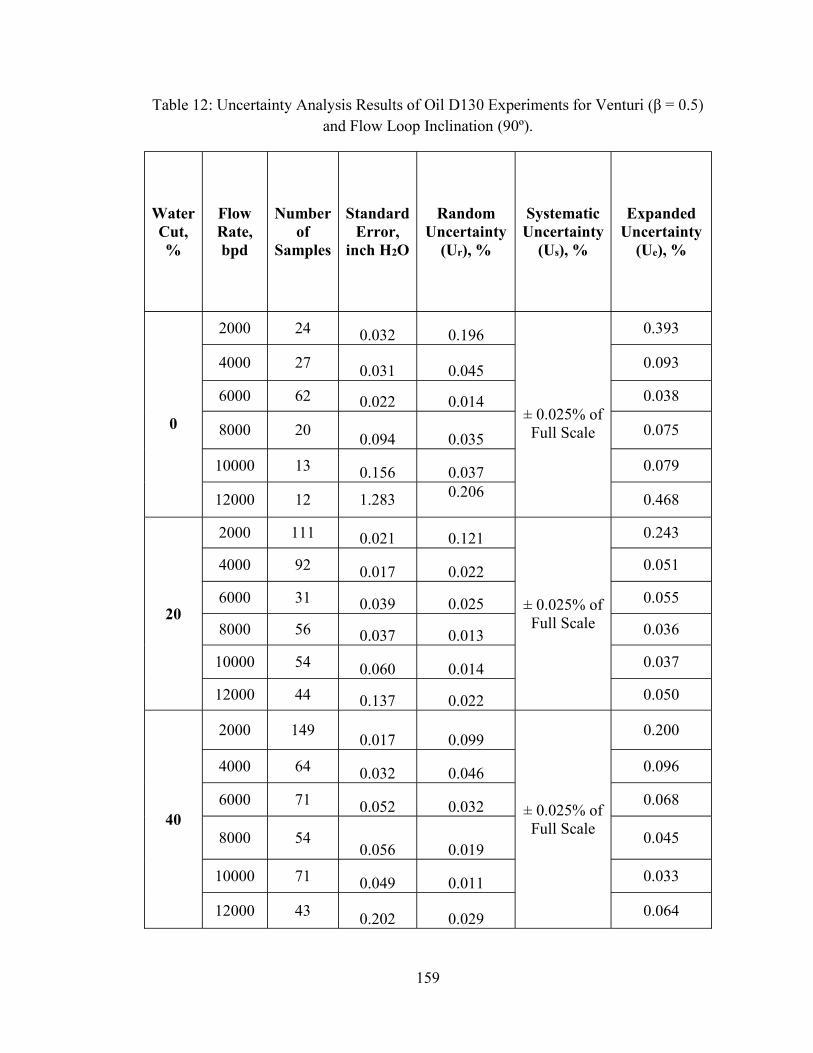
159
Table 12and Flow Loop Inclination (90º).
Water Cut, %
Flow Rate, bpd
Number of
Samples
Standard Error,
inch H2O
Random Uncertainty
(Ur), %
Systematic Uncertainty
(Us), %
Expanded Uncertainty
(Ue), %
0
2000 24 0.032 0.196
± 0.025% of Full Scale
0.393
4000 27 0.031 0.045 0.093
6000 62 0.022 0.014 0.038
8000 20 0.094 0.035
0.075
10000 13 0.156 0.037 0.079
12000 12 1.283 0.206 0.468
20
2000 111 0.021 0.121
± 0.025% of Full Scale
0.243
4000 92 0.017 0.022 0.051
6000 31 0.039 0.025 0.055
8000 56 0.037 0.013 0.036
10000 54 0.060 0.014 0.037
12000 44 0.137 0.022 0.050
40
2000 149 0.017 0.099
± 0.025% of Full Scale
0.200
4000 64 0.032 0.046 0.096
6000 71 0.052 0.032 0.068
8000 54 0.056 0.019
0.045
10000 71 0.049 0.011 0.033
12000 43 0.202 0.029 0.064

160
Cont-Table 12: Uncertainty Analysis Results of Oil D130 Experiments for Venturi
Water Cut, %
Flow Rate, bpd
Number of
Samples
Standard Error,
inch H2O
Random Uncertainty
(Ur), %
Systematic Uncertainty
(Us), %
Expanded Uncertainty
(Ue), %
60
2000 116 0.018 0.101
± 0.025% of Full Scale
0.203
4000 117 0.024 0.032 0.070
6000 119 0.047 0.028 0.062
8000 55 0.071 0.024 0.054
10000 36 0.075 0.016 0.041
12000 31 0.164 0.023 0.052
80
2000 127 0.017 0.085
± 0.025% of Full Scale
0.172
4000 29 0.036 0.047 0.097
6000 60 0.037 0.021 0.049
8000 16 0.132 0.043 0.089
10000 21 0.109 0.022 0.051
12000 10 0.309 0.043 0.090
100
2000 43 0.030 0.155
± 0.025% of Full Scale
0.310
4000 23 0.031 0.038 0.079
6000 52 0.040 0.021 0.050
8000 24 0.081 0.024
0.054
10000 30 0.108 0.021 0.048
12000 11 0.266 0.120 0.251
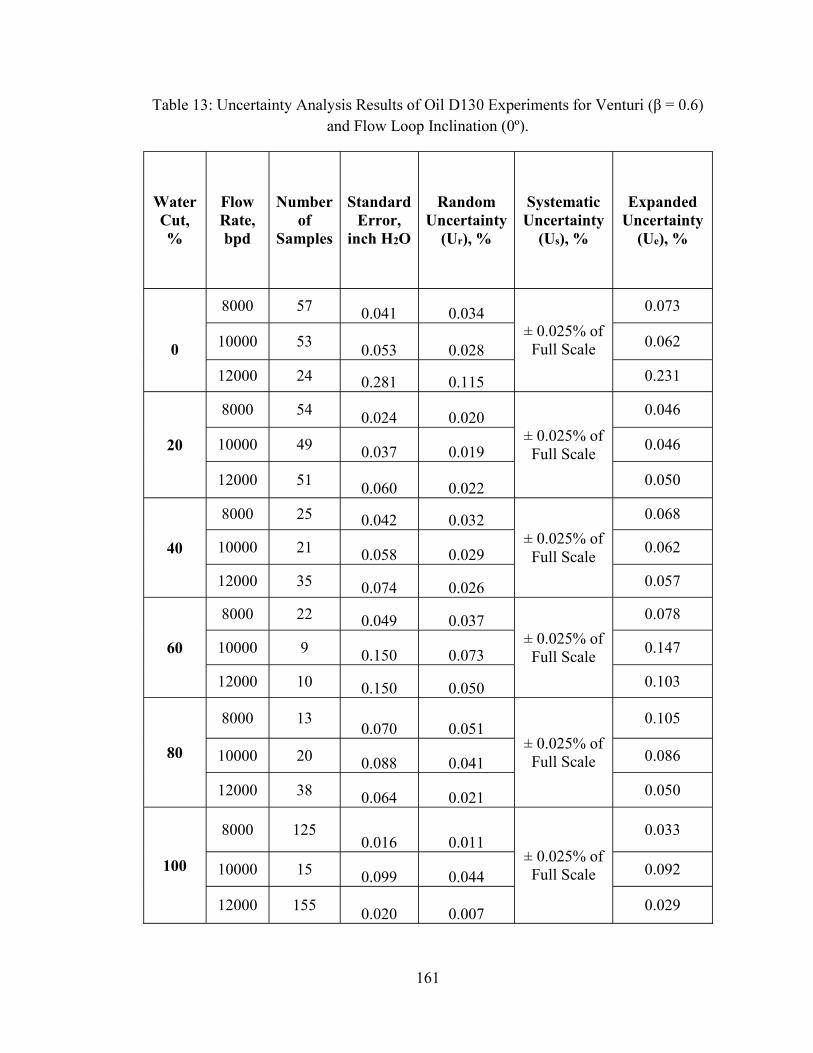
161
Table 13and Flow Loop Inclination (0º).
Water Cut, %
Flow Rate, bpd
Number of
Samples
Standard Error,
inch H2O
Random Uncertainty
(Ur), %
Systematic Uncertainty
(Us), %
Expanded Uncertainty
(Ue), %
0
8000 57 0.041 0.034 ± 0.025% of Full Scale
0.073
10000 53 0.053 0.028
0.062
12000 24 0.281 0.115 0.231
20
8000 54 0.024 0.020 ± 0.025% of Full Scale
0.046
10000 49 0.037 0.019 0.046
12000 51 0.060 0.022 0.050
40
8000 25 0.042 0.032 ± 0.025% of Full Scale
0.068
10000 21 0.058 0.029 0.062
12000 35 0.074 0.026 0.057
60
8000 22 0.049 0.037 ± 0.025% of Full Scale
0.078
10000 9 0.150 0.073 0.147
12000 10 0.150 0.050 0.103
80
8000 13 0.070 0.051
± 0.025% of Full Scale
0.105
10000 20 0.088 0.041 0.086
12000 38 0.064 0.021 0.050
100
8000 125 0.016 0.011
± 0.025% of Full Scale
0.033
10000 15 0.099 0.044 0.092
12000 155 0.020 0.007
0.029

162
Table 13and Flow Loop Inclination (90º).
Water Cut, %
Flow Rate, bpd
Number of
Samples
Standard Error,
inch H2O
Random Uncertainty
(Ur), %
Systematic Uncertainty
(Us), %
Expanded Uncertainty
(Ue), %
0
8000 47 0.031 0.026 ± 0.025% of Full Scale
0.057
10000 64 0.043 0.023
0.052
12000 22 0.440 0.162 0.324
20
8000 39 0.021 0.017 ± 0.025% of Full Scale
0.042
10000 55 0.039 0.020 0.047
12000 37 0.071 0.026 0.057
40
8000 53 0.019 0.014 ± 0.025% of Full Scale
0.038
10000 18 0.120 0.061 0.124
12000 41 0.044 0.015 0.039
60
8000 37 0.040 0.030 ± 0.025% of Full Scale
0.064
10000 12 0.096 0.046 0.095
12000 51 0.068 0.023 0.052
80
8000 49 0.034 0.024
± 0.025% of Full Scale
0.054
10000 6 0.168 0.077 0.156
12000 16 0.133 0.043 0.089
100
8000 124 0.02 0.016
± 0.025% of Full Scale
0.040
10000 30 0.01 0.015 0.039
12000 25 0.03 0.027
0.060
163
APPENDIX B
RESULTS OF THE MODIFIED VENTURI DISCHARGE
COEFFICIENT, k
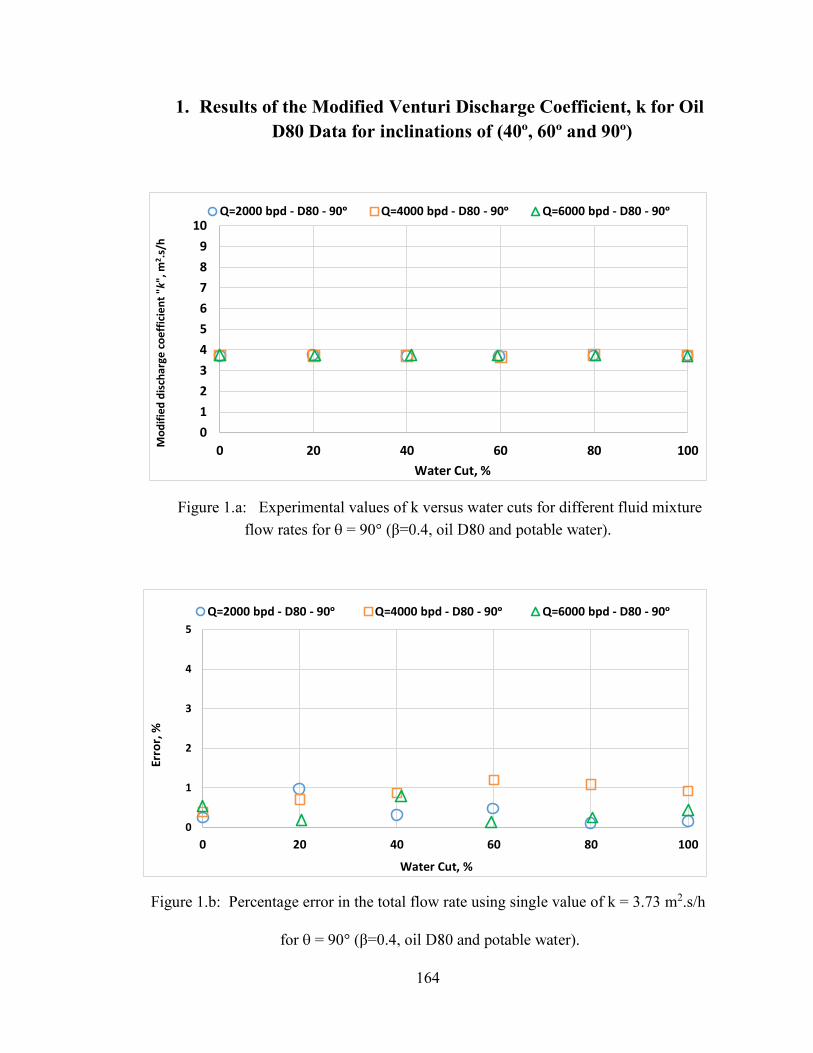
164
1. Results of the Modified Venturi Discharge Coefficient, k for Oil D80 Data for inclinations of (40º, 60º and 90º)
Figure 1.a: Experimental values of k versus water cuts for different fluid mixture
flow rates for = 90
Figure 1.b: Percentage error in the total flow rate using single value of k = 3.73 m2.s/h
for = 90 er).
0123456789
10
0 20 40 60 80 100Mod
ified
dis
char
ge c
oeff
icie
nt "
k", m
2 .s/h
Water Cut, %
Q=2000 bpd - D80 - Q=4000 bpd - D80 - 90 Q=6000 bpd - D80 -
0
1
2
3
4
5
0 20 40 60 80 100
Erro
r, %
Water Cut, %
Q=2000 bpd - D80 - 90 Q=4000 bpd - D80 - 90 Q=6000 bpd - D80 - 90

165
Figure 2.a: Experimental values of k versus water cuts for different fluid mixture
flow rates for = 40
Figure 2.b: Percentage error in the total flow rate using single value of k = 5.93 m2.s/h
for = 40
1
2
3
4
5
6
7
8
9
10
0 20 40 60 80 100
Mod
ified
dis
char
ge c
oeff
icie
nt "
k", m
2 .s/h
Water Cut, %
Q=2000 bpd - D80 - Q=4000 bpd - D80 - 40 Q=6000 bpd - D80 - 40
Q=8000 bpd - D80 - 40 Q=10000 bpd - D80 - 40 Q=120000 bpd - D80 -
0
1
2
3
4
5
0 20 40 60 80 100
Erro
r, %
Water Cut, %
Q=2000 bpd - D80 - Q=4000 bpd - D80 - 40 Q=6000 bpd - D80 - 40
Q=8000 bpd - D80 - 40 Q=10000 bpd - D80 - 40 Q=12000 bpd - D80 -

166
Figure 3.a: Experimental values of k versus water cuts for different fluid mixture flow
rates for = 60
Figure 3.b: Percentage error in the total flow rate using single value of k = 5.93 m2.s/h
for = 60
1
2
3
4
5
6
7
8
9
10
0 20 40 60 80 100
Mod
ified
dis
char
ge c
oeff
icie
nt "
k", m
2 .s/h
Water Cut, %
Q=2000 bpd - D80 - 60 Q=4000 bpd - D80 - 60Q=6000 bpd - D80 - 60 Q=8000 bpd - D80 -
0
1
2
3
4
5
0 20 40 60 80 100
Erro
r, %
Water Cut, %
Q=2000 bpd - D80 - Q=4000 bpd - D80 - 60 Q=6000 bpd - D80 - 60
Q=8000 bpd - D80 - 60 Q=10000 bpd - D80 - 60 Q=12000 bpd - D80 -
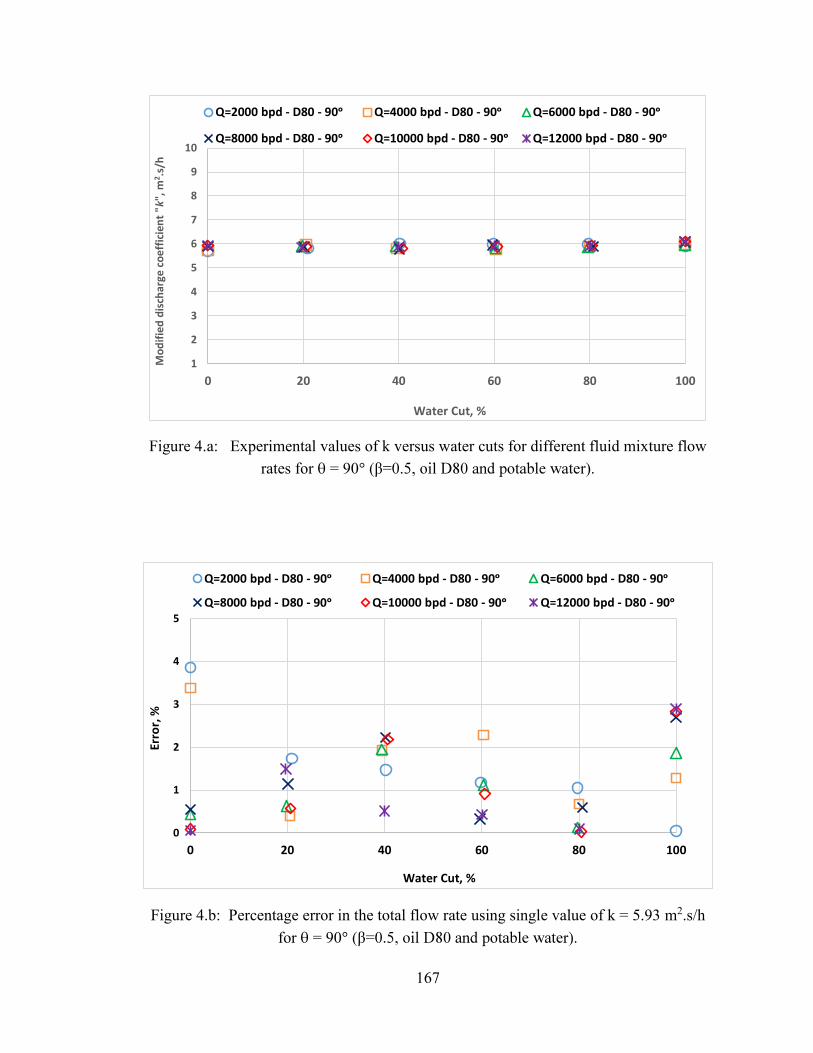
167
Figure 4.a: Experimental values of k versus water cuts for different fluid mixture flow
rates for = 90 ter).
Figure 4.b: Percentage error in the total flow rate using single value of k = 5.93 m2.s/h
for = 90
1
2
3
4
5
6
7
8
9
10
0 20 40 60 80 100
Mod
ified
dis
char
ge c
oeff
icie
nt "
k", m
2 .s/h
Water Cut, %
Q=2000 bpd - D80 - 90 Q=4000 bpd - D80 - 90 Q=6000 bpd - D80 - 90
Q=8000 bpd - D80 - Q=10000 bpd - D80 - Q=12000 bpd - D80 - 90
0
1
2
3
4
5
0 20 40 60 80 100
Erro
r, %
Water Cut, %
Q=2000 bpd - D80 - 90 Q=4000 bpd - D80 - 90 Q=6000 bpd - D80 - 90
Q=8000 bpd - D80 - Q=10000 bpd - D80 - Q=12000 bpd - D80 - 90

168
Figure 5.a: Experimental values of k versus water cuts for different fluid mixture flow
rates for = 90
Figure 5.b: Percentage error in the total flow rate using single value of k = 8.75 m2.s/h
for = 90
0
1
2
3
4
5
6
7
8
9
10
0 20 40 60 80 100
Mod
ified
dis
char
ge c
oeff
icie
nt "
k", m
2 .s/h
Water Cut, %
Q=6000 bpd - D80 - Q=8000 bpd - D80 - 90 Q=9000 bpd - D80 - 90
0
1
2
3
4
5
0 20 40 60 80 100
Erro
r, %
Water Cut, %
Q=6000 bpd - D80 - 90 Q=8000 bpd - D80 - 90 Q=9000 bpd - D80 -
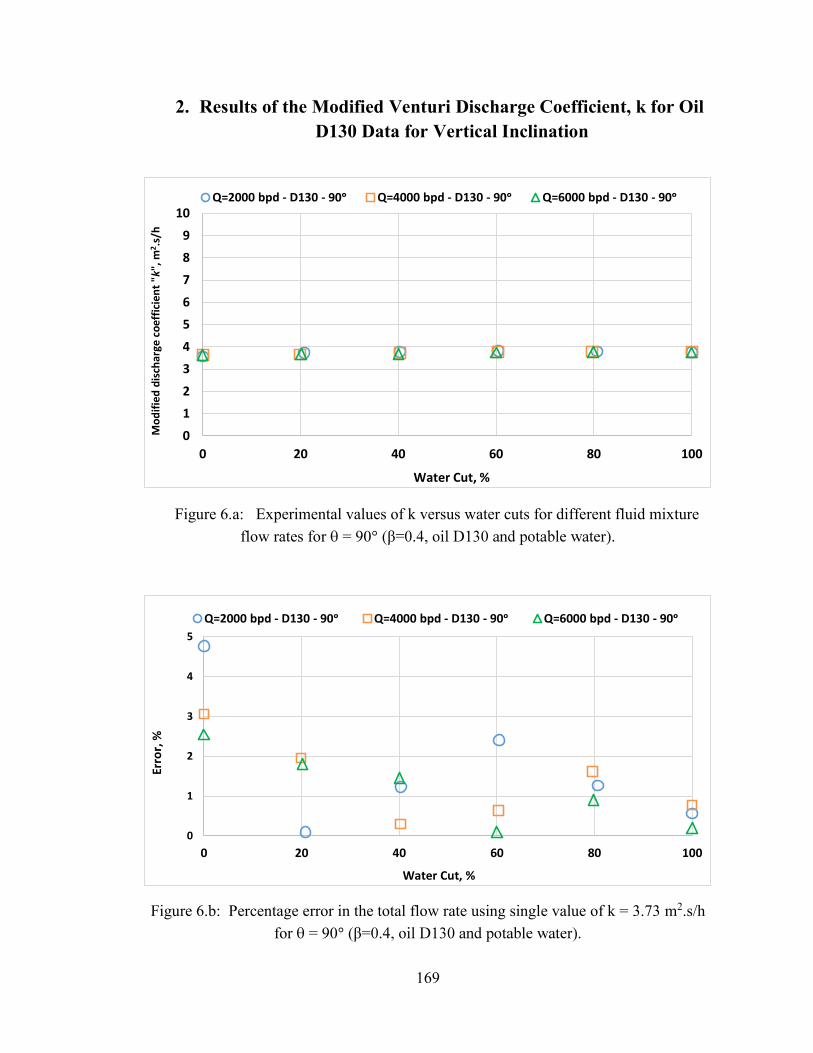
169
2. Results of the Modified Venturi Discharge Coefficient, k for Oil D130 Data for Vertical Inclination
Figure 6.a: Experimental values of k versus water cuts for different fluid mixture
flow rates for = 90
Figure 6.b: Percentage error in the total flow rate using single value of k = 3.73 m2.s/h
for = 90
0
1
2
3
4
5
6
7
8
9
10
0 20 40 60 80 100
Mod
ified
dis
char
ge c
oeff
icie
nt "
k", m
2 .s/h
Water Cut, %
Q=2000 bpd - D130 - Q=4000 bpd - D130 - Q=6000 bpd - D130 - 90
0
1
2
3
4
5
0 20 40 60 80 100
Erro
r, %
Water Cut, %
Q=2000 bpd - D130 - Q=4000 bpd - D130 - 90 Q=6000 bpd - D130 - 90

170
Figure 7.a: Experimental values of k versus water cuts for different fluid mixture flow
rates for = 90 , oil D130 and potable water).
Figure 7.b: Percentage error in the total flow rate using single value of k = 5.93 m2.s/h
for = 90
1
2
3
4
5
6
7
8
9
10
0 20 40 60 80 100
Mod
ified
dis
char
ge c
oeff
icie
nt "
k", m
2 .s/h
Water Cut, %
Q=2000 bpd - D130 - Q=4000 bpd - D130 - 90 Q=6000 bpd - D130 - 90
Q=8000 bpd - D130 - Q=10000 bpd - D130 - 90 Q=12000 bpd - D130 - 90
0
1
2
3
4
5
0 20 40 60 80 100
Erro
r, %
Water Cut, %
Q=2000 bpd - D130 - Q=4000 bpd - D130 - 90 Q=6000 bpd - D130 - 90
Q=8000 bpd - D130 - Q=10000 bpd - D130 - 90 Q=12000 bpd - D130 - 90
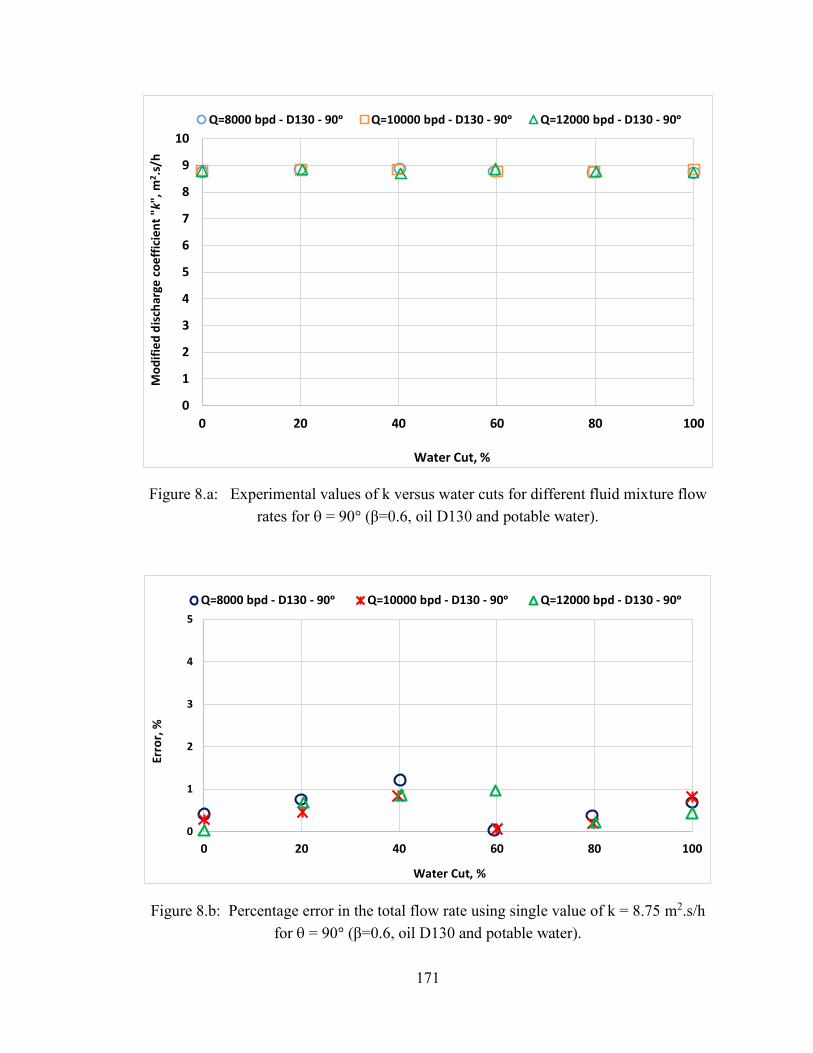
171
Figure 8.a: Experimental values of k versus water cuts for different fluid mixture flow
rates for = 90
Figure 8.b: Percentage error in the total flow rate using single value of k = 8.75 m2.s/h
for = 90
0
1
2
3
4
5
6
7
8
9
10
0 20 40 60 80 100
Mod
ified
dis
char
ge c
oeff
icie
nt "
k", m
2 .s/
h
Water Cut, %
Q=8000 bpd - D130 - Q=10000 bpd - D130 - 90 Q=12000 bpd - D130 - 90
0
1
2
3
4
5
0 20 40 60 80 100
Erro
r, %
Water Cut, %
Q=8000 bpd - D130 - Q=10000 bpd - D130 - 90 Q=12000 bpd - D130 - 90

172
APPENDIX C
RESULTS OF THE VENTURI DISCHARGE
COEFFICIENT, Cd

173
1. Results of Venturi Meter Discharge Coefficient, Cd for Oil D80 Data and for Inclinations (40º, 60º and 90º)
Figure 1: Experimental venturi discharge coefficient, Cd, versus water cut for low
fluid mixture flow rates for 90
Figure 2: Experimental venturi discharge coefficient, Cd, versus water cut for low
fluid mixture flow rates for 40
0.95
0.97
0.99
1.01
1.03
1.05
0 20 40 60 80 100
Vent
uri D
isch
arge
Coe
ffic
ien,
Cd
Water Cut, %
Q=2000 bpd - D80 - Q=4000 bpd - D80 - 90 Q=6000 bpd - D80 - 90
0.95
0.97
0.99
1.01
1.03
1.05
0 20 40 60 80 100
Vent
uri D
isch
arge
Coe
ffic
ien,
Cd
Water Cut, %
Q=2000 bpd - D80 - 40 Q=4000 bpd - D80 - 40 Q=6000 bpd - D80 - 40
Q=8000 bpd - D80 - Q=10000 bpd - D80 - 40 Q=12000 bpd - D80 - 40

174
Figure 3: Experimental venturi discharge coefficient, Cd, versus water cut for low
fluid mixture flow rates for 60
Figure 4: Experimental venturi discharge coefficient, Cd, versus water cut for low
fluid mixture flow rates for 90 and potable water).
0.95
0.97
0.99
1.01
1.03
1.05
0 20 40 60 80 100
Vent
uri D
isch
arge
Coe
ffic
ien,
Cd
Water Cut, %
Q=2000 bpd - D80 - Q=4000 bpd - D80 - 60 Q=6000 bpd - D80 - 60
Q=8000 bpd - D80 - 60 Q=10000 bpd - D80 - Q=12000 bpd - D80 -
0.95
0.97
0.99
1.01
1.03
1.05
0 20 40 60 80 100
Vent
uri D
isch
arge
Coe
ffic
ien,
Cd
Water Cut, %
Q=2000 bpd - D80 - Q=4000 bpd - D80 - 90 Q=6000 bpd - D80 - 90
Q=8000 bpd - D80 - 90 Q=10000 bpd - D80 - Q=12000 bpd - D80 -
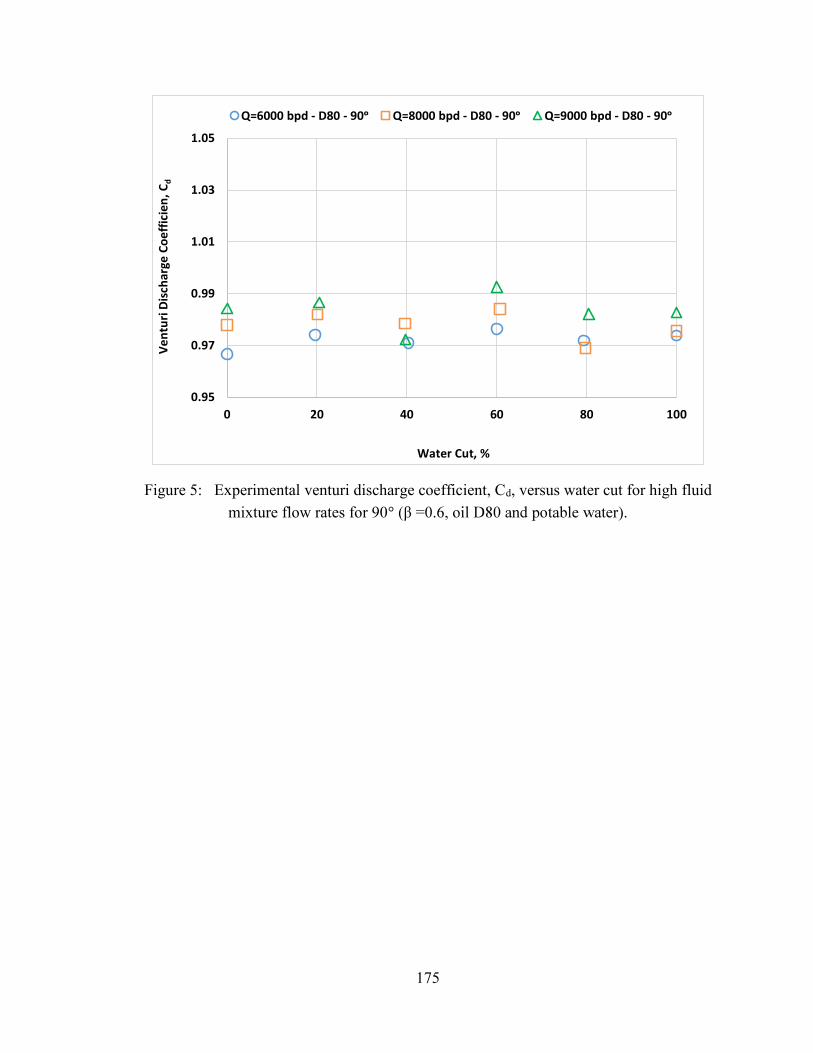
175
Figure 5: Experimental venturi discharge coefficient, Cd, versus water cut for high fluid
mixture flow rates for 90
0.95
0.97
0.99
1.01
1.03
1.05
0 20 40 60 80 100
Vent
uri D
isch
arge
Coe
ffic
ien,
Cd
Water Cut, %
Q=6000 bpd - D80 - 90 Q=8000 bpd - D80 - 90 Q=9000 bpd - D80 - 90

176
2. Results of Venturi Meter Discharge Coefficient, Cd for Oil D130 Data and for Vertical Inclination
Figure 6: Experimental venturi discharge coefficient, Cd, versus water cut for low
fluid mixture flow rates for 90
Figure 7: Experimental venturi discharge coefficient, Cd, versus water cut for fluid
mixture flow rates for 90
0.9
0.93
0.96
0.99
1.02
1.05
0 20 40 60 80 100
Vent
uri D
isch
arge
Coe
ffic
ien,
Cd
Water Cut, %
Q=2000 bpd - D130 - 90 Q=4000 bpd - D130 - Q=6000 bpd - D130 - 90
0.95
0.97
0.99
1.01
1.03
1.05
0 20 40 60 80 100
Vent
uri D
isch
arge
Coe
ffic
ien,
Cd
Water Cut, %
Q=2000 bpd - D130 - Q=4000 bpd - D130 - 90 Q=6000 bpd - D130 - 90
Q=8000 bpd - D130 - 90 Q=10000 bpd - D130 - Q=12000 bpd - D130 - 90
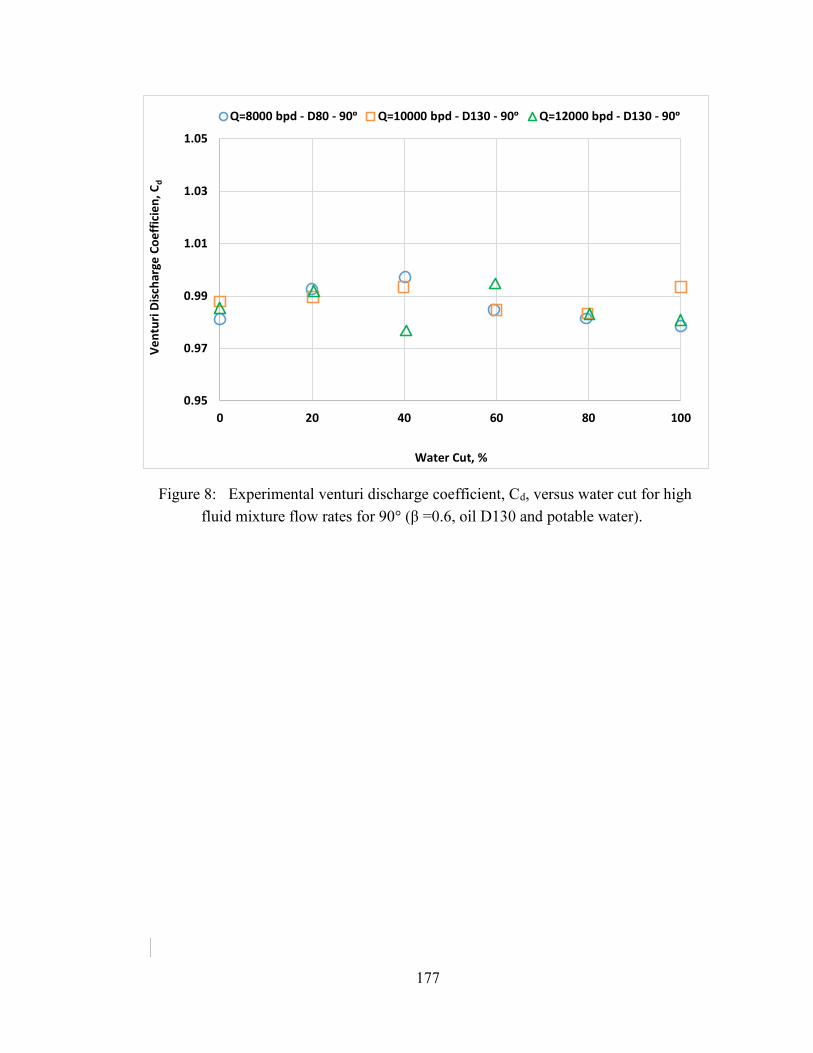
177
Figure 8: Experimental venturi discharge coefficient, Cd, versus water cut for high
fluid mixture flow rates for 90
0.95
0.97
0.99
1.01
1.03
1.05
0 20 40 60 80 100
Vent
uri D
isch
arge
Coe
ffic
ien,
Cd
Water Cut, %
Q=8000 bpd - D80 - 90 Q=10000 bpd - D130 - 90 Q=12000 bpd - D130 - 90
178
Vitae
Name Mujahid Omer Seed Ahmed Elobeid
Nationality Sudanese
Date of Birth November 17, 1989
Email [email protected]
Address P.O. Box 7722, King Fahd University of Petroleum and
Minerals, Dhahran 31261, Saudi Arabia
Academic Background M.Sc. in Mechanical Engineering
(2014 - 2016)
King Fahd University of Petroleum and Minerals, Dhahran,
Saudi Arabia
Major: Mechanical Engineering (Thermo-Fluid)
B.Sc. in Mechanical Engineering
(2008 2013)
University of Khartoum, Khartoum, Sudan
Major: Mechanical Engineering
Publications Mujahid O. Elobeid, Luai M. Alhems, Abdelsalam Al-Sarkhi1, Aftab Ahmad, Syed. M. Shaahid Mehaboob Basha, J. J. Xiao, Rafael Lastra
Pressure Drop Measurements for Oil-Journal of Petroleum Science and Engineering. Status: Published.
179
Mehaboob Basha, Syed. M. Shaahid, Aftab Ahmad, A. M. Al-Sarkhi1, Luai M. Al-Hadhrami, Mujahid O. Elobeid, J. J. Xiao, Rafael Lastra
OIL (D80)-WATER FLOJournal of Engineering Research.
Status: Accepted.
Mujahid O. Elobeid, Aftab Ahmad, Abdelsalam Al-Sarkhi1, Luai M. Alhems, Syed. M. Shaahid Mehaboob Basha, J. J. Xiao, Rafael Lastra
sure Drop Measurements in Venturi
Arabian Journal for Science and Engineering. Status: Submitted.
Mujahid O. Elobeid, Aftab Ahmad, Mansoor Alam, Abdelsalam Al-Sarkhi1, Luai M. Alhems, Syed. M. Shaahid Mehaboob Basha, J. J. Xiao, Rafael Lastra a Flow Rate, Water Cut and Viscosity on Venturi Pressure Drop Measurements for Oil-
Status: On progress to be submit within one month to ISI journal.
Related Documents