1

Welcome message from author
This document is posted to help you gain knowledge. Please leave a comment to let me know what you think about it! Share it to your friends and learn new things together.
Transcript
1
2
Acknowledgements The Saskatchewan Wildlife Management Report is produced by the Wildlife Unit of the Fish, Wildlife and
Lands Branch. It was co-authored by all members of the Wildlife Unit, including (in alphabetical order)
Nelson Ackerman, Katherine Conkin, Mike Gollop, Allison Henderson, Lois Koback, Chuck Lees, Jeanette
Pepper, Tom Perry, Iga Stasiak, Rob Tether, Graham Thibault, Brad Tokaruk, Tim Trottier, Matthew
Weiss, Todd Whiklo and Travis Williams. Katherine Conkin is the senior editor of this document.
The Ministry of Environment is indebted to the hunters and trappers of Saskatchewan for providing
harvest and population information, as well as biological samples, which form the foundation of this
report. In addition, public participants, guides and outfitters and partner agencies are acknowledged for
their contributions to this effort. Many other members of the Fish, Wildlife and Lands Branch
participated in population surveys and their donation of time and expertise is greatly appreciated.
Special thanks is extended to the Compliance and Field Services staff, whose contribution to game
management is significant, both in direct participation in population surveys and biological sample
collections, as well as the qualitative information they provide the Wildlife Unit. This information is
invaluable to game management in Saskatchewan. Thank you to all!
Citation: Saskatchewan Ministry of Environment. 2018. Saskatchewan Wildlife Management Report
2017. Fish and Wildlife Technical Report 2018-1. 111pp.
3
Table of Contents Acknowledgements ................................................................................................................................... 2
List of Tables ............................................................................................................................................. 9
List of Figures .......................................................................................................................................... 11
List of Appendices ................................................................................................................................... 11
General Information ................................................................................................................................... 12
Introduction to Wildlife Management and Guiding Principles in Saskatchewan ................................... 12
What species are involved? ................................................................................................................ 12
History of Wildlife Management Zones .............................................................................................. 12
Key Considerations Guiding Wildlife Management ............................................................................ 14
Data Collection Techniques .................................................................................................................... 18
Population Survey Techniques ............................................................................................................ 18
Biological Sample Collection ............................................................................................................... 19
Hunting and Harvest Statistics ............................................................................................................ 21
Survey History ..................................................................................................................................... 22
Outfitting in Saskatchewan ..................................................................................................................... 23
STATUS OF SPECIES IN SASKATCHEWAN .................................................................................................... 24
White-tailed Deer (Odecoileus virginianus dakotensis) .............................................................................. 24
Population Status .................................................................................................................................... 24
Survey Data ......................................................................................................................................... 24
Biological Sample Collections.............................................................................................................. 29
General Overview ............................................................................................................................... 29
Hunting Season Review ........................................................................................................................... 30
Research Initiatives ................................................................................................................................. 32
Management Objectives and Strategies ................................................................................................. 32
Long-term Management Objectives ................................................................................................... 32
Short-term Management Strategies ................................................................................................... 33
Additional Information ........................................................................................................................ 33
Mule Deer (Odecoileus hemionus) .............................................................................................................. 34
Population Status .................................................................................................................................... 34
Survey Data ......................................................................................................................................... 34
Biological Sample Collections.............................................................................................................. 37
4
General Overview ............................................................................................................................... 37
Hunting Season Review ........................................................................................................................... 37
Research Initiatives ................................................................................................................................. 38
Management Objectives and Strategies ................................................................................................. 38
Long-term Management Objectives ................................................................................................... 38
Short-term Management Strategies ................................................................................................... 38
Additional Information ........................................................................................................................ 39
Elk (Cervus canadensis) ............................................................................................................................... 40
Population Status .................................................................................................................................... 40
Survey Data ......................................................................................................................................... 40
Biological Sample Collections.............................................................................................................. 42
General Overview ............................................................................................................................... 42
Hunting Season Review ........................................................................................................................... 44
Research Initiatives ................................................................................................................................. 45
Management Objectives and Strategies ................................................................................................. 45
Long-term Management Objectives ................................................................................................... 45
Short-term Management Strategies ................................................................................................... 45
Additional Information ........................................................................................................................ 46
Moose (Alces alces) ..................................................................................................................................... 47
Population Status .................................................................................................................................... 47
Survey Data ......................................................................................................................................... 47
Biological Sample Collections.............................................................................................................. 50
General Overview ............................................................................................................................... 50
Hunting Season Review ........................................................................................................................... 50
Research Initiatives ................................................................................................................................. 51
Management Objectives and Strategies ................................................................................................. 52
Long-term Management Objectives ................................................................................................... 52
Short-term Management Strategies ................................................................................................... 53
Additional Information ........................................................................................................................ 53
Pronghorn (Antilocapra americana) ........................................................................................................... 54
Population Status .................................................................................................................................... 54
Survey Data ......................................................................................................................................... 54
5
Biological Sample Collections.............................................................................................................. 55
General Overview ............................................................................................................................... 56
Hunting Season Review ........................................................................................................................... 56
Research Initiatives ................................................................................................................................. 56
Management Objectives and Strategies ................................................................................................. 57
Long-term Management Objectives ................................................................................................... 57
Short-term Management Strategies ................................................................................................... 57
Additional Information ........................................................................................................................ 57
Black Bear (Ursus americanus).................................................................................................................... 58
Population Status .................................................................................................................................... 58
Survey Data ......................................................................................................................................... 58
Biological Sample Collections.............................................................................................................. 58
General Overview ............................................................................................................................... 58
Hunting Season Review ........................................................................................................................... 58
Research Initiatives ................................................................................................................................. 61
Management Objectives and Strategies ................................................................................................. 61
Long-term Management Objectives ................................................................................................... 61
Short-term Management Strategies ................................................................................................... 61
Additional Information ........................................................................................................................ 61
Barren-ground Caribou (Rangifer tarandus groenlandicus) ....................................................................... 62
Population Status .................................................................................................................................... 62
Survey Data ......................................................................................................................................... 64
Biological Sample Collections.............................................................................................................. 64
General Overview ............................................................................................................................... 65
Hunting Season Review ........................................................................................................................... 66
Harvest Monitoring ................................................................................................................................. 66
Research Initiatives ................................................................................................................................. 67
Management Objectives and Strategies ................................................................................................. 67
Long-term Management Objectives ................................................................................................... 67
Short-term Management Strategies ................................................................................................... 67
Additional Information ........................................................................................................................ 68
Woodland Caribou (Rangifer tarandus caribou) ......................................................................................... 69
6
Population Status .................................................................................................................................... 69
Survey Data ......................................................................................................................................... 69
Biological Sample Collections.............................................................................................................. 70
General Overview ............................................................................................................................... 70
Hunting Season Review ........................................................................................................................... 71
Research Initiatives ................................................................................................................................. 72
Management Objectives and Strategies ................................................................................................. 73
Long-term Management Objectives ................................................................................................... 74
Short-term Management Strategies ................................................................................................... 74
Additional Information ........................................................................................................................ 74
Plains Bison (Bison bison bison) .................................................................................................................. 76
Population Status .................................................................................................................................... 76
Survey Data ......................................................................................................................................... 76
Biological Sample Collections.............................................................................................................. 76
General Overview ............................................................................................................................... 78
Hunting Season Review ........................................................................................................................... 80
Research Initiatives ................................................................................................................................. 80
Management Objectives and Strategies ................................................................................................. 81
Long-term Management Objectives ................................................................................................... 81
Short-term Management Strategies ................................................................................................... 81
Additional Information ........................................................................................................................ 81
Upland Game Birds ..................................................................................................................................... 82
Population Status .................................................................................................................................... 82
Survey Data ......................................................................................................................................... 82
Biological Sample Collections.............................................................................................................. 82
General Overview ............................................................................................................................... 84
Hunting Season Review ........................................................................................................................... 84
Research Initiatives ................................................................................................................................. 86
Management Objectives and Strategies ................................................................................................. 86
Long-term Management Objectives ................................................................................................... 86
Short-term Management Strategies ................................................................................................... 86
Additional Information ........................................................................................................................ 86
7
Waterfowl ................................................................................................................................................... 87
Population Status .................................................................................................................................... 87
Survey Data ......................................................................................................................................... 87
Biological Sample Collections.............................................................................................................. 90
General Overview ............................................................................................................................... 90
Hunting Season Review ........................................................................................................................... 90
Research Initiatives ................................................................................................................................. 91
Management Objectives and Strategies ................................................................................................. 93
Long-term Management Objectives ................................................................................................... 93
Short-term Management Strategies ................................................................................................... 93
Additional Information ........................................................................................................................ 93
Furbearers ................................................................................................................................................... 94
Population Status .................................................................................................................................... 94
Survey Data ......................................................................................................................................... 94
Biological Sample Collections.............................................................................................................. 96
General Overview ............................................................................................................................... 96
Trapping Season Review ......................................................................................................................... 96
Research Initiatives ............................................................................................................................... 100
Management Objectives and Strategies ............................................................................................... 100
Long-term Management Objectives ................................................................................................. 100
Short-term Management Strategies ................................................................................................. 100
Additional Information ...................................................................................................................... 100
Gray Wolf (Canis lupus) ............................................................................................................................. 101
Population Status .................................................................................................................................. 101
Survey Data ....................................................................................................................................... 101
Biological Sample Collections............................................................................................................ 102
General Overview ............................................................................................................................. 102
Hunting Season Review ......................................................................................................................... 102
Research Initiatives ............................................................................................................................... 102
Management Objectives and Strategies ............................................................................................... 104
Long-term Management Objectives ................................................................................................. 104
Short-term Management Strategies ................................................................................................. 104
8
Additional Information ...................................................................................................................... 104
Additional Species ..................................................................................................................................... 105
Cougar (Puma concolor) ........................................................................................................................ 105
Population Status .............................................................................................................................. 105
Research Initiatives ........................................................................................................................... 105
Additional Information ...................................................................................................................... 105
Literature Cited ......................................................................................................................................... 106
Appendix ................................................................................................................................................... 110
9
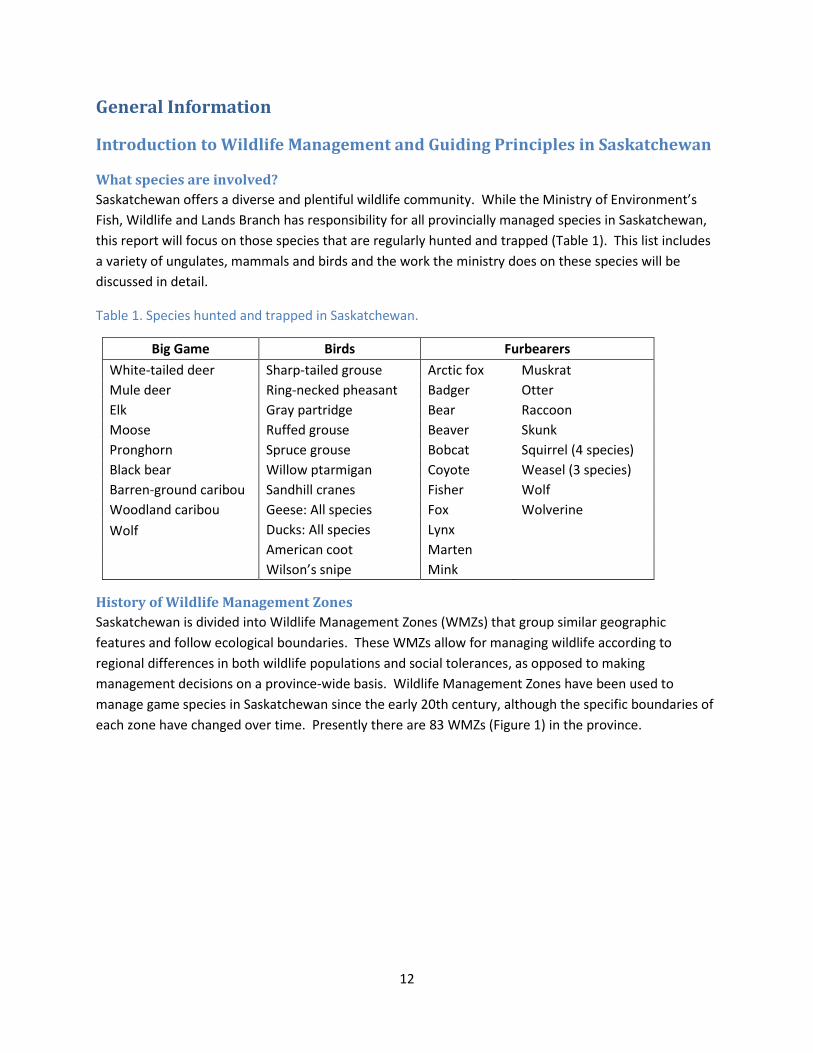
List of Tables Table 1. Species hunted and trapped in Saskatchewan.............................................................................. 12
Table 2. Winter severity description (2008-2017). .................................................................................... 17
Table 3. Hunter harvest survey response rates in 2017. ............................................................................ 22
Table 4. Wildlife surveys completed in 2013 through 2017. ...................................................................... 23
Table 5. White-tailed deer population and density data collected intermittently in select WMZs by aerial
survey (1994-2017). .............................................................................................................................. 26
Table 6. Spotlight survey population trends for white-tailed deer presented as deer per linear mile
observed in 2016 and 2017 compared to the long-term average (LTA) (1983-2017) where possible. “-
-“= data not available, *= new route established in 2014 or 2015, **= adjusted route...................... 27
Table 7. Estimated provincial white-tailed deer population structure based on 2017 CWMS field
observations as compared to the 35-year LTA (1983-2017) in the grassland (WMZs 1-14), farmland
(WMZs 15-30), parkland (WMZs 31-47), forest fringe (WMZs 48-55), forest (WMZs 56-69) and
northern forest (WMZs 70-76) ecozones. Data collected through both the traditional booklet and
new CWMS smartphone App is indicated by “*”. ................................................................................ 28
Table 8. Estimated white-tailed deer harvested by Saskatchewan and Canadian resident hunters in
Saskatchewan for years when data was collected (2008-2017) relative to the 10-year mean (2000-
2009) when harvest data was collected using paper mail-in surveys. After 2013, harvest data was
collected using an online survey. ......................................................................................................... 31
Table 9. White-tailed deer harvested by non-resident (guided) hunters in Saskatchewan (2007-2017).
Data not available is indicated by “---“. ................................................................................................ 32
Table 10. Mule deer population and density data collected by aerial survey (1994-2017). ...................... 35
Table 11. Spotlight survey population trends for mule deer presented as deer per linear mile observed
in 2016 and 2017 compared to the long-term average (LTA) (1983-2017) where possible. “---“= data
not available, *= new route established in 2014 or 2015, **= adjusted route. .................................. 35
Table 12. Provincial mule deer population structure based on results of the 2017 CWMS and compared
to the long-term average (LTA) (1983-2017) in the grassland (WMZs 1-14), farmland (WMZs 15-30),
parkland (WMZs 31-47), forest fringe (WMZs 48-55), forest (WMZs 56-69) and northern forest
(WMZs 70-76). Data not available is indicated by “---“ and data collected through both the
traditional booklet and new CWMS smartphone App is indicated by “*”. .......................................... 36
Table 13. Mule deer harvested by resident hunters in Saskatchewan (2008-2017). Data not available is
indicated by “---“. ................................................................................................................................. 38
Table 14. Elk population, density and herd structure data collected on aerial surveys (1982-2017). Data
not available is indicated by “---“. ........................................................................................................ 40
Table 15. Results of the 2017 follow-up WMZ 33 email hunter harvest survey. ....................................... 44
Table 16. Estimated elk harvested by resident hunters in Saskatchewan (2008-2017). Data not available
is indicated by “---“. .............................................................................................................................. 45
Table 17. Moose population, density and herd structure data collected on aerial surveys (2007-2017).
Data not available is indicated by “---“. ................................................................................................ 48
Table 18. Moose harvest in 2017 compared to the 5-year mean (2013-2017). Data not available is
indicated by “---“. ................................................................................................................................. 51
10
Table 19. Pronghorn herd structure survey results from 2017. ................................................................. 55
Table 20. Pronghorn harvest (2007-2017). Data not available is indicated by “---“. ................................ 56
Table 21. Resident black bear harvest in 2008 through 2017. Data not available is indicated by “---“. .... 59
Table 22. Canadian Resident Black Bear Harvest in Saskatchewan, 2015-2017. ....................................... 59
Table 23. Non-resident black bear harvest in 2008 through 2017. Data not available is indicated by “---“.
.............................................................................................................................................................. 60
Table 24. Population surveys of Beverly and Qamanirjuaq Herds between 1967 and 2014. Estimates
before 1982 were visual surveys conducted on calving grounds and were based on the number of
breeding females. Data not available is indicated by “---“. .................................................................. 65
Table 25. Estimated upland game bird harvest by Saskatchewan residents. ............................................. 85
Table 26. Percentage of hunters of each residency hunting waterfowl exclusively, upland game birds
exclusively and all game birds (i.e. both waterfowl and upland game birds) on their 2017
Saskatchewan game bird licence.......................................................................................................... 85
Table 27. Goose population status. All estimates are three-year running averages. Goose species
include greater white-fronted geese (GWFG), Canada geese (CAGO), snow geese (SNOW) and Ross’
geese (ROGO). The CAGO Winter Survey estimate includes Central Flyway Tall Grass Prairie, Short
Grass Prairie, Hi-line, and Western Prairie/Great Plains populations (p49), while the SNOW/ROGO
Winter Survey estimate includes Western Central Flyway Total and Mid-continent Population
Central Flyway populations (p50). ........................................................................................................ 88
Table 28. Breeding population estimates (thousands) for 10 species of ducks from the traditional survey
area (strata 1-18, 20-50, 75-77) covered by annual breeding population surveys. Duck species
include mallard (MALL), gadwall (GADW), American wigeon (AMWI), green-winged teal (GWTE),
blue-winged teal (BWTE), northern shoveler (NSHO), northern pintail (NOPI), redhead (REDH),
canvasback (CANV) and both greater and lesser scaup (Scaup Spp.). ................................................. 89
Table 29. Annual spring abundance indices for the Mid-Continent Population of Sandhill cranes derived
from surveys of the Central Platte River Valley, NE. All estimates are three-year running averages. 90
Table 30. Duck harvest in Saskatchewan (2008-2017). ............................................................................. 92
Table 31. Goose harvest in Saskatchewan (2008-2017). ........................................................................... 92
Table 32. Furbearer species abundance as determined from the Annual Status of Furbearers Survey. .. 95
Table 33. Annual fur licence sales in Saskatchewan (2008-2017). ............................................................ 97
Table 34. Fur harvest by species (2008-2017). .......................................................................................... 98
Table 35. Annual pelts marketed and associated cash value (2008-2017). ............................................... 99
Table 36. Results of Wolf Hunts. .............................................................................................................. 103
11
List of Figures Figure 1. Wildlife Management Zones (WMZ) in Saskatchewan. Some WMZ boundaries were realigned
in 2014 to allow for more easily identified boundary markers. ........................................................... 13
Figure 2. White-tailed deer range in Saskatchewan, including ten white-tailed deer management units
(WTDMU) delineated by ecozone, key winter habitat availability as identified by the 1982 Terrestrial
Wildlife Habitat Inventory and Wildlife Management Zones. ............................................................. 25
Figure 3. Schematic of the effect of severe winter conditions on all age classes in a deer population over
time. Note that it takes multiple years for a population to recover from a winter mortality event due
to the impact to the reproductive age classes. .................................................................................... 30
Figure 4. Number of elk observations summarized per wildlife management zone recorded with the
Cooperative Wildlife Management Survey mobile application in 2017. ............................................. 41
Figure 5. Relative abundance map of elk in Saskatchewan in 2017. Elk abundance estimates were based
on a variety of data sources, including: aerial surveys, cooperative wildlife management
submissions, public and Ministry of Environment staff field reports and expert opinion.
Saskatchewan WMZ boundaries are included for reference. .............................................................. 43
Figure 6. Moose Management Units (MMU), used by biologists to manage moose populations, are
identified, along with moose habitat and WMZ boundaries. .............................................................. 49
Figure 7. Farmland moose study area for research project. Red line depicts Hwy # 11.
(Adapted from Brook 2014) ................................................................................................................. 52
Figure 8. Pronghorn Management Units (PMUs) for Saskatchewan, 2017. .............................................. 55
Figure 9. Barren-ground caribou range map. ............................................................................................ 63
Figure 10. Woodland caribou range in Saskatchewan (Saskatchewan Ministry of Environment 2012). .. 70
Figure 11. Genetic Population Structure (d) is the preferred depiction based on cluster assignments. .. 73
Figure 12. Plains bison range in Saskatchewan.......................................................................................... 77
Figure 13. McCusker River Plains Bison Population range in Saskatchewan. ............................................ 78
Figure 14. Sturgeon River Plains Bison Population range in Saskatchewan (courtesy of Sturgeon River
Plains Bison Stewards). ......................................................................................................................... 79
Figure 15. Bison population trend from annual aerial survey conducted by park staff within Prince Albert
National Park (Parks Canada. 2014 Free-ranging plains bison census 1996-2017. Prince Albert
National Park. Waskesiu Lake, Saskatchewan. Canada. Unpublished files). ........................................ 80
Figure 16. Upland game bird ranges across the province (BirdLife International and Handbook of the
Birds of the World 2016). Please note the ring-necked pheasant range is likely artificial north of the
South Saskatchewan River and Qu’Appelle River system due to temporary presence of released
birds. ..................................................................................................................................................... 83
Figure 18. Current Wolf Management Areas in Saskatchewan. ............................................................... 103
List of Appendices Appendix A. Licence sales (2008 -2017) for all licence types in Saskatchewan. Data not available is
indicated by “---“. ............................................................................................................................... 110
12
General Information
Introduction to Wildlife Management and Guiding Principles in Saskatchewan
What species are involved?
Saskatchewan offers a diverse and plentiful wildlife community. While the Ministry of Environment’s
Fish, Wildlife and Lands Branch has responsibility for all provincially managed species in Saskatchewan,
this report will focus on those species that are regularly hunted and trapped (Table 1). This list includes
a variety of ungulates, mammals and birds and the work the ministry does on these species will be
discussed in detail.
Table 1. Species hunted and trapped in Saskatchewan.
Big Game Birds Furbearers
White-tailed deer Sharp-tailed grouse Arctic fox Muskrat
Mule deer Ring-necked pheasant Badger Otter
Elk Gray partridge Bear Raccoon
Moose Ruffed grouse Beaver Skunk
Pronghorn Spruce grouse Bobcat Squirrel (4 species)
Black bear Willow ptarmigan Coyote Weasel (3 species)
Barren-ground caribou Sandhill cranes Fisher Wolf
Woodland caribou Geese: All species Fox Wolverine
Wolf Ducks: All species Lynx
American coot Marten
Wilson’s snipe Mink
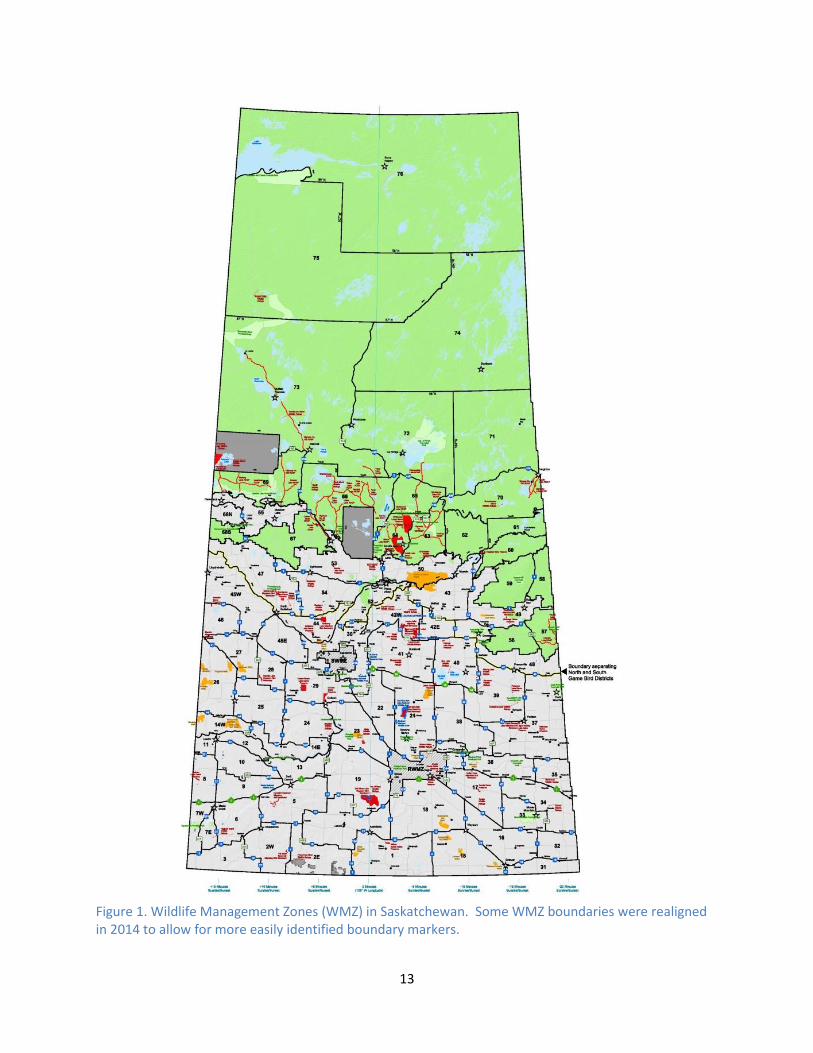
History of Wildlife Management Zones
Saskatchewan is divided into Wildlife Management Zones (WMZs) that group similar geographic
features and follow ecological boundaries. These WMZs allow for managing wildlife according to
regional differences in both wildlife populations and social tolerances, as opposed to making
management decisions on a province-wide basis. Wildlife Management Zones have been used to
manage game species in Saskatchewan since the early 20th century, although the specific boundaries of
each zone have changed over time. Presently there are 83 WMZs (Figure 1) in the province.
13
Figure 1. Wildlife Management Zones (WMZ) in Saskatchewan. Some WMZ boundaries were realigned in 2014 to allow for more easily identified boundary markers.
14
Key Considerations Guiding Wildlife Management
Wildlife populations can be affected by a variety of factors. Subsequently, managing wildlife
populations can be a complex task and wildlife managers must consider many variables when making
decisions. First and foremost, the demographics of the population being managed are considered. Is
the population increasing or decreasing? Does the population have the necessary components (e.g. age
structure, reproductive capabilities, etc.) to achieve the goals that are being set? In addition to the
demographics of the population, managers must consider other variables that are acting on the
population, such as environmental conditions, infectious disease and habitat availability. Finally, given
that wildlife is a public resource and that the public interacts with wildlife in many different ways,
wildlife managers must also consider the needs and wants of the public and how best to mitigate these
interactions for positive outcomes. Each of these considerations will be discussed in further detail
below.
Population Demographics
It is a popular misconception that wildlife is managed on the basis of a total population count that is
accurate both locally and provincially. In fact, such counts would be cost prohibitive and logistically
unfeasible. While some jurisdictions may occasionally provide an estimate of the total provincial or
state population for a species, these are derived numbers that come from a variety of small scale survey
techniques and are not used as a basis for making management decisions.
Wildlife managers rely on many metrics to assess how wildlife populations are faring. Most commonly
used are population size/abundance, density and structure. Population size is often presented as an
estimate of abundance and derived from surveys of small areas that are then extrapolated to larger
areas. Acquiring true abundance data is time and cost-intensive to acquire and the dynamic nature of
populations makes the information relevant for only short periods of time. Density, or number of
animals per kilometre squared, is another metric of interest and allows wildlife managers to extrapolate
the carrying capacity of a habitat type or area. As with abundance, this metric is often an estimate and
is extrapolated across larger areas. Finally, population structure, or the components the population is
made up of, is important to knowing how a population functions. Structure in wildlife management is
usually defined as the gender and age components of a population. For example, it is important to
know the number of adult (i.e. breeding) females, as well as the number of adult (i.e. breeding) males in
a population if one is going to predict how a population may grow or decline over time. It is equally
important to know what proportion of the population is young of the year, in order to assess
recruitment into the population over a period of time. All of these metrics can be assessed with varying
levels of statistical certainty and can be used to evaluate the state of wildlife populations at a variety of
spatial scales and over many time periods.
Environmental Conditions – Winter Severity
Environmental conditions during key periods in a species’ life cycle can greatly impact population
growth or decline. In Saskatchewan, where winter is the dominant season and often the most extreme
in nature, winter severity is often a key variable impacting populations. A severe winter can directly
impact a species survival by making resources unavailable, or can indirectly impact survival by causing
individuals to expend desperately-needed energy to a point where they enter spring in poor health,
15
which can either result in decreased reproductive capability or subsequent death. Alternatively, a mild
winter can result in a larger cohort of the population surviving the winter and entering spring in good
health, and a subsequent population increase. Three main factors of winter severity are the
temperature, snow depth and length of winter. Temperature can either be ambient temperature or
include the wind chill, which is largely related to shelter availability. However, often snow depth is the
more important variable, as it has the ability to make resources completely unavailable to grazing
wildlife or significantly increase the amount of energy expended to access the resources. Finally, the
length of winter can cause animals to enter spring in poor health due to increased depletion of fat
reserves if winter extends into the normal spring period. Winter severity affects populations for more
than one year and significant changes in wildlife populations can often be attributed to winter severity
in previous years. As such, managers consult records of winter severity (Table 2) in previous years quite
regularly. Although winter severity measurements have been largely anecdotal to date, the ministry has
done preliminary modeling work (A. Schmidt, pers. comm.) to quantify winter severity and found that
the average temperature from November to February interacting with the accumulated snowfall
between October and February is well correlated to the trend in white-tailed deer populations in the
Melville region. Further work is being considered to fine-tune this modeling exercise so that it may be
applied more broadly across the province.
Habitat Availability
Habitat availability is quite simply the area and resources available to an individual in a particular
location. Driven not only by the physical availability (i.e. habitat is present), but also the functional
availability (i.e. habitat can be used by the individual), habitat availability can be a significant driver of
population growth and decline both locally and on a larger scale. Historically with settlement and more
recently with urban sprawl, natural habitats are becoming fragmented and lost to accommodate other
land uses (namely agricultural, industrial and urban development). Even in situations where habitat
exists, fragmentation can limit use if individuals cannot move between parcels of habitat, and/or an
increase in number of individuals using each parcel (and the resources they sustain) can make them
functionally unavailable. The availability of quality wintering habitat is a particularly important factor for
Saskatchewan ungulates. The annual carrying capacity of the habitat mosaic in a local area will vary
over time such that when environmental conditions are favourable the area may sustain high
populations. However, in severe winters in areas with a shortage of quality wintering habitat,
populations may decline sharply or come to rely heavily on agricultural food sources leading to
increased human conflict. Optimum populations are achieved when management maintains a post-
harvest population that is commensurate with what the available wintering habitat can sustain.
16
Public Input
Wildlife in Saskatchewan is managed as a public resource and residents of Saskatchewan interact with
wildlife in a variety of ways. Whether it is a positive interaction (such as viewing wildlife in their natural
environment or hunting wildlife for food) or a negative interaction (such as dealing with crop
depredation, property damage or vehicle collision with wildlife), how people interact with wildlife is as
unique as the individual and changes both with the species of wildlife and the situation under which the
interaction occurs. Additionally, interactions with wildlife can be multi-faceted and the landowner who
enjoys hunting deer for his year’s supply of steaks can simultaneously be dealing with flocks of geese
which are consuming portions of a pea field and thereby impacting the farm operation’s bottom line.
Furthermore, often the same wildlife can be viewed in several different lights and the deer that one
person enjoys watching on their daily walks, can be the same deer that another person is trying to drive
away from their crops and can even be the same deer that a third person is planning to hunt come fall.
These complex interactions require wildlife managers to consider all points of view and strive to achieve
a solution that appeases all interested parties. Factor in considering population demographics,
environmental conditions, and habitat availability, while striving to maintain sustainable wildlife
populations and one can begin to understand the complexities of managing wildlife.
17
Table 2. Winter severity description (2008-2017).
Year Description
2007-2008 Moderate winter, but slow snow melt and late (mid-May) green-up.
2008-2009 Late green-up, possible mule deer winter kill in Great Sandhills, concerns in WMZ 29 (Gary Donald, pers. comm.).
2009-2010 Mid-October snowfall which melted. Mild and no snow in south until 1st week in December. Bitterly cold mid-December.
2010-2011 Mid-October snowfall which melted. Severe winter over most of province especially in the southeast, along United States border and the Cypress Hills. Milder in the northwest. Major snowfall in late April in the southeast. Delayed green-up.
2011-2012 Relatively mild winter over most of the province with warmer-than-average temperatures and below-average snow depth.
2012-2013 Severe winter across most of the province, including colder-than-average temperatures and above-average snow depth. Winter extended into the spring and delayed green-up.
2013-2014 Moderate to severe winter, with colder-than-average temperatures, that extended into the spring and delayed green-up.
2014-2015 Relatively mild winter over most of the province with warmer-than-average temperatures and below-average snow depth.
2015-2016 Relatively mild winter over most of the province with warmer-than-average temperatures and below-average snow depth. Southeast portion of province experienced heavier snowfall and above average snow crust which resulted in moderate deer mortality.
2016-2017 Relatively mild winter across much of the province. Slightly above average snow depth and average temperature conditions throughout the Parkland and Forest Fringe region.
18
Data Collection Techniques The Ministry of Environment uses a variety of data collection techniques in order to monitor each
species of interest. Each survey is designed to maximize the quality and quantity of information
collected, while minimizing the disturbance to wildlife, within the logistical and financial resources of the
ministry. Often the information collected includes data related to population size, structure and density
within a particular region.
Population Survey Techniques
Population survey techniques are unique to the species that is being surveyed. Each survey is designed
to maximize detection of individuals during the time period of interest in order to answer the biological
questions being asked. Historically, many population surveys were aerial, primarily conducted in the
winter months when there is sufficient snow on the ground and deciduous leaf cover is lacking in order
to improve observers’ ability to detect animals. However, ground-based survey techniques have gained
popularity in recent years in response to both the logistical and financial constraints of aerial surveys
and interest in additional research questions. Common survey techniques employed by the ministry
include: a) Stratified Random Block Surveys; b) Population Structure Surveys (aerial based); c) co-
operative deer management surveys; d) Spotlight Surveys; and e) Pronghorn Herd Structure Surveys.
Each of these techniques is described in detail below.
a) Stratified Random Block Survey: This aerial survey design stratifies areas into sample units
(quadrats or blocks) based on habitat type. Sample units are randomly selected from each
strata. Observers strive to achieve a population density estimate of ±20% within 90 per cent
confidence intervals for the survey area. Put plainly, observers want to ensure that they cover
enough area to confidently estimate the density across the entire survey area. A more detailed
explanation can be found in Stewart (1983).
b) Population Structure Survey (aerial based): These surveys, typically conducted in winter when
snow cover and lack of foliage make observations easier, are designed to estimate age (i.e. adult
vs. young) and sex composition of ungulate populations. Structures are usually presented as
adult males or young per adult female. Survey flight paths are chosen to cover habitat types
with high probability of detecting animals. Prior to the survey, minimum animal observations to
obtain precise estimates within desired confidence intervals are calculated as per Czaplewski et
al. (1993) and Scheaffer et al. (1990).
c) Co-operative Wildlife Management Survey (CWMS): Formerly the Co-operative Deer
Management Survey (CDMS), a citizen-science survey that exclusively collected observations of
white-tailed and mule deer. In 2016, the ministry explored the use of a mobile application to
boost participation and launched the co-operative wildlife management survey application in
October 2017, with the inclusion of white-tailed and mule deer, moose, elk, sharp-tailed grouse
and wild turkey.
19
d) Spotlight Survey: This nocturnal, ground-based survey monitors deer population trends along
nineteen established routes across the province. Observers travel each route in a truck
outfitted with powerful spotlights. As deer are detected, observers record the number of deer
observed and the species, age (i.e. juvenile or adult) and sex. A hand-held spotlight is used to
improve classification once deer are observed, but is not used for detection.
e) Pronghorn Herd Structure Survey: This ground-based survey monitors the changes in
pronghorn populations over time. Seventy routes (each 80 kilometres long) were established
across the pronghorn range in Saskatchewan and staff complete each one annually between July
1 and July 21. Two surveyors record the number, age and sex of all pronghorn observed within
800 metres either side of the road.
Biological Sample Collection
Biological sample collections are the collection of any tissue, such as teeth, fur, feathers, antlers, brains,
and skin, from an animal. These samples are often used to determine sex, age, health, genetic makeup
and (where applicable) antler configuration of game species. Age of harvested animals older than
young-of-the-year is often determined using tooth cementum deposition (moose, elk, white-tailed deer
and black bear) and/or molar wear (white-tailed deer only). In game birds, feather wear and length can
differentiate young-of-the-year from adults. In 2017, a hunter surveillance program was in place to
collect heads and test for chronic wasting disease.
Chronic Wasting Disease
Chronic wasting disease (CWD) is a fatal degenerative disease that affects the nervous system of cervids
or members of the deer family, including deer, elk, moose, and caribou. CWD belongs to a group of
diseases known as transmissible spongiform encephalopathies (TSEs) similar to BSE (mad cow disease) in
cattle and scrapie in sheep. The disease was first detected in a wild mule deer in Saskatchewan in the
fall of 2000. As of 2015, CWD has spread to wild white-tailed deer, mule deer, elk and moose
populations within Saskatchewan. The disease has not yet been detected in caribou.
The disease is caused by infectious proteins, called prions, which are persistent in the environment and
resistant to environmental degradation. Infectious prions begin to accumulate in the nervous tissue of
the animal and eventually cause microscopic lesions to form in the brain. Symptoms which are not
apparent until the last few weeks or months of infection include weight loss, behavioral change,
excessive salivation, exhaustion, increased drinking and salivation, poor co-ordination, trembling and
drooping of the head and ears. CWD is transmitted directly from animal to animal and from sources of
environmental contamination including bait piles, mineral licks, grain bags, and other environments
contaminated with fluids shed by infected animals. Prions are shed in urine, saliva, feces and blood of
infected animals and may be shed up to a year or longer before animals begin to show signs of disease.
Contact between animals is not necessary to spread the disease, as it can also be spread by prion-
contaminated feed, soils, or shared water sources. When healthy animals come in contact with the
bodily fluids of an infected animal or contaminated environment, they too may become infected. The
reason we do not see a rapid increase in deaths is because it is a slowly developing disease with infected

20
deer taking a year and half or more to die. However, once infected, none recover as CWD is always
fatal. Annual declines in populations of mule deer, white tailed deer, and elk have been documented in
endemic areas of Wyoming and Colorado, where the disease has been present since the late 1980s
(DeVivo et al., 2014, Monello et al. 2014, Edmunds et al. 2016).
Population models and empirical evidence from areas of high prevalence indicate that CWD results in a
younger age structure, lower recruitment and lower numbers of deer and elk (Bollinger, pers. com.,
Miller et al. 2008, Dulberger et al. 2010, Monello et al. 2014, Edmunds et al. 2016). Saskatchewan
operated a CWD surveillance program from 1997 through 2012 and again in 2015 through 2017.
Samples collected from 2012 to 2014 included only sick or dying deer collected by conservation officers
and collar-marked research animals. Cervids that tested positive for CWD (2001 to 2017) include: 474
(of 28,522 tested) mule deer, 115 (of 16,172) white-tailed deer, 12 (of 1,610) elk, and one (of 253)
moose. In 2017, a total of 864 cervid heads were tested and 105 were CWD positive and 11 new CWD
zones were identified. In contrast, the CWD surveillance program from 1997-2003 revealed only 12
positive CWD animals out of 11,209 heads tested. For survey results and a map of CWD positives, visit
http://www.cwhc-rcsf.ca/surveillance_data_cwd.php.
The ministry established a CWD working group to help development of a long-range strategic plan to
outline Saskatchewan’s response to CWD. The CWD Working Group consists of members from the
ministries of Agriculture, Health, and Environment as well as representatives from Saskatchewan
Association of Rural Municipalities, Agricultural Producers Association of Saskatchewan, Saskatchewan
Wildlife Federation, Nature Saskatchewan, Saskatchewan Bowhunters Association, Saskatchewan
Outfitters Association, Regina Fish and Game League, and Parks Canada. The working group members
share a common interest in seeing the prevalence of CWD contained to levels that will minimize impacts
on wildlife, indigenous communities, as well as on agriculture, including game farms and potential
contamination of food and feed sources.
Implications of CWD to humans are unknown. Although there have been no documented cases of CWD
in humans, The World Health Organization, Health Canada, and the Saskatchewan Ministry of Health
recommend that CWD infected meat not be consumed. Hunters are advised to take certain precautions
when field dressing, transporting and processing animals and have animals tested prior to consumption.
This is of special importance as research indicates that hunters’ samples are 24 per cent more likely to
contain a CWD positive animal compared to the proportion of animals with CWD in the population as a
whole (Edmunds et al. 2016).
What Hunters Can Do to Help
Report any animal acting abnormally to the nearest Ministry of Environment office. Do not shoot, handle or consume any animal that appears sick.
Wear latex or rubber gloves when field dressing your deer, moose, or elk.
Bone out the meat from your animal. Do not saw through bone, and avoid cutting through the brain or backbone of the animal.
Avoid handling brain and spinal tissues.
21
Wash your hands thoroughly after field dressing is completed and clean instruments used in field dressing in a mild bleach wash.
Do not consume brain, spinal cord, eyes, spleen, tonsils and lymph nodes of harvested animals. Normal field dressing coupled with boning out a carcass will remove most, if not all, of these body parts. Cutting away all fatty tissue will remove remaining lymph nodes.
If you have your deer or elk commercially processed, request that your animal is processed individually, without meat from other animals being added to meat from your animal. Avoid transporting a deer carcass from the area where it was taken. If the carcass is transported, dispose of the carcass waste by double-bagging it and taking it to an approved landfill.
Avoid practices such as baiting, feeding, and mineral licks which may artificially congregate deer enhancing risk of disease transmission.
Hunting and Harvest Statistics
Continued monitoring of annual licence sales and harvest from hunting and trapping activities is critical
for evaluating the implications of management strategies and ensuring the long-term sustainability of
wildlife populations, as well as determining trends in hunter and trapper demographics and behaviour.
Each year, the ministry’s Fish, Wildlife and Lands Branch conducts an annual computerized draw for elk,
moose, pronghorn antelope and either-sex and antlerless mule deer. Over-the-counter licences are
available for white-tailed deer, black bear, moose (bull-calf), elk (bulls-only, either sex), and game birds.
In recent years, the ministry has worked to modernize the licensing system to increase the efficiency of
issuing licences and providing valuable licence sale data. The new online-based licensing system was
introduced in 2013 and is contracted to Aspira (formerly Active Network), an experienced multi-national
company that provides similar services for over 25 other provinces and states within North America.
The online licensing system was customized to meet the needs of Saskatchewan and provides added
benefits including real-time data that can be used by conservation officers and wildlife managers, an
additional option for hunters, anglers and trappers to purchase their licences online from home, and
streamlined financial processes. In addition, security features ensure that non-residents of
Saskatchewan cannot obtain Saskatchewan resident hunting, angling and trapping privileges by
including a built-in residency verification.
In order to monitor annual harvest, the ministry conducts a hunter harvest survey (HHS) through the
Hunting, Angling and Trapping Licence (HAL) system. Hunters have the option to complete their surveys
by logging online to their HAL account, in-person at a ministry office, or over the phone by calling the
Aspira inquiry line (1-888-773-8450). The summarized results are provided in advance of the big game
draw each year and can be viewed at http://www.saskatchewan.ca/residents/parks-recreation-heritage-
and-arts/hunting-trapping-and-angling/hunting/hunter-harvest-survey.
In 2017, the ministry added hunter harvest surveys for several additional licences to the HAL system, as
well as the Annual Status of Furbearers Survey (ASFS). Between the two survey types, 29,021 surveys
were completed (Table 3), which was an increase from the 23,510 completed in 2016. Response rates,
or the number of surveys completed compared to the number of surveys available, increased slightly
between the two years for almost all surveys. Adjusted response rate accounts for the approximately 20
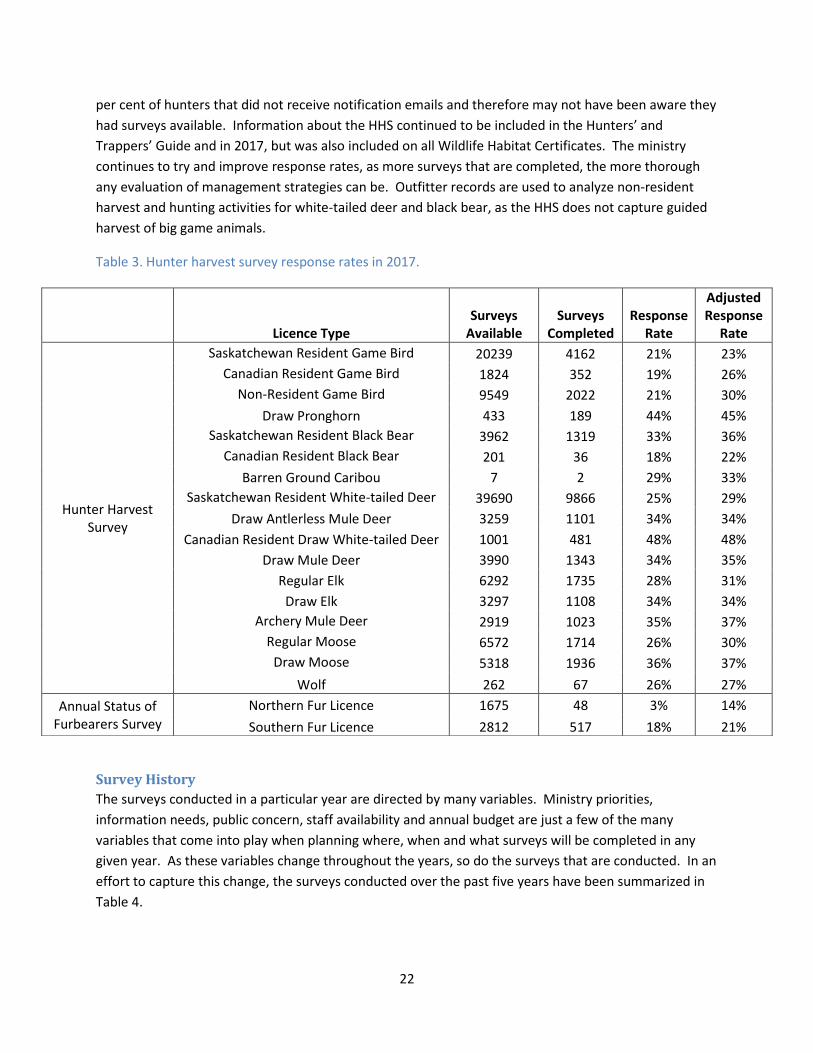
22
per cent of hunters that did not receive notification emails and therefore may not have been aware they
had surveys available. Information about the HHS continued to be included in the Hunters’ and
Trappers’ Guide and in 2017, but was also included on all Wildlife Habitat Certificates. The ministry
continues to try and improve response rates, as more surveys that are completed, the more thorough
any evaluation of management strategies can be. Outfitter records are used to analyze non-resident
harvest and hunting activities for white-tailed deer and black bear, as the HHS does not capture guided
harvest of big game animals.
Table 3. Hunter harvest survey response rates in 2017.
Survey History
The surveys conducted in a particular year are directed by many variables. Ministry priorities,
information needs, public concern, staff availability and annual budget are just a few of the many
variables that come into play when planning where, when and what surveys will be completed in any
given year. As these variables change throughout the years, so do the surveys that are conducted. In an
effort to capture this change, the surveys conducted over the past five years have been summarized in
Table 4.
Licence Type Surveys
Available Surveys
Completed Response
Rate
Adjusted Response
Rate
Hunter Harvest Survey
Saskatchewan Resident Game Bird 20239 4162 21% 23%
Canadian Resident Game Bird 1824 352 19% 26%
Non-Resident Game Bird 9549 2022 21% 30%
Draw Pronghorn 433 189 44% 45%
Saskatchewan Resident Black Bear 3962 1319 33% 36%
Canadian Resident Black Bear 201 36 18% 22%
Barren Ground Caribou 7 2 29% 33%
Saskatchewan Resident White-tailed Deer 39690 9866 25% 29%
Draw Antlerless Mule Deer 3259 1101 34% 34%
Canadian Resident Draw White-tailed Deer 1001 481 48% 48%
Draw Mule Deer 3990 1343 34% 35%
Regular Elk 6292 1735 28% 31%
Draw Elk 3297 1108 34% 34%
Archery Mule Deer 2919 1023 35% 37%
Regular Moose 6572 1714 26% 30%
Draw Moose 5318 1936 36% 37%
Wolf 262 67 26% 27%
Annual Status of Furbearers Survey
Northern Fur Licence 1675 48 3% 14%
Southern Fur Licence 2812 517 18% 21%
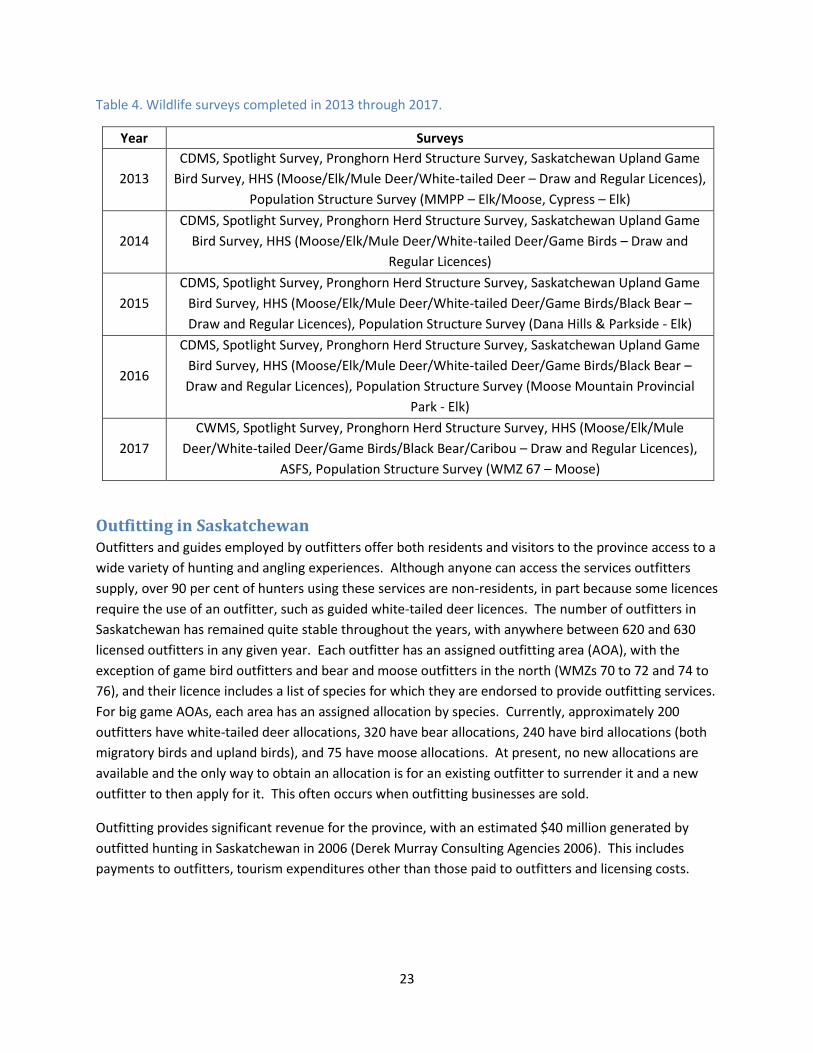
23
Table 4. Wildlife surveys completed in 2013 through 2017.
Year Surveys
2013
CDMS, Spotlight Survey, Pronghorn Herd Structure Survey, Saskatchewan Upland Game
Bird Survey, HHS (Moose/Elk/Mule Deer/White-tailed Deer – Draw and Regular Licences),
Population Structure Survey (MMPP – Elk/Moose, Cypress – Elk)
2014
CDMS, Spotlight Survey, Pronghorn Herd Structure Survey, Saskatchewan Upland Game
Bird Survey, HHS (Moose/Elk/Mule Deer/White-tailed Deer/Game Birds – Draw and
Regular Licences)
2015
CDMS, Spotlight Survey, Pronghorn Herd Structure Survey, Saskatchewan Upland Game
Bird Survey, HHS (Moose/Elk/Mule Deer/White-tailed Deer/Game Birds/Black Bear –
Draw and Regular Licences), Population Structure Survey (Dana Hills & Parkside - Elk)
2016
CDMS, Spotlight Survey, Pronghorn Herd Structure Survey, Saskatchewan Upland Game
Bird Survey, HHS (Moose/Elk/Mule Deer/White-tailed Deer/Game Birds/Black Bear –
Draw and Regular Licences), Population Structure Survey (Moose Mountain Provincial
Park - Elk)
2017
CWMS, Spotlight Survey, Pronghorn Herd Structure Survey, HHS (Moose/Elk/Mule
Deer/White-tailed Deer/Game Birds/Black Bear/Caribou – Draw and Regular Licences),
ASFS, Population Structure Survey (WMZ 67 – Moose)
Outfitting in Saskatchewan Outfitters and guides employed by outfitters offer both residents and visitors to the province access to a
wide variety of hunting and angling experiences. Although anyone can access the services outfitters
supply, over 90 per cent of hunters using these services are non-residents, in part because some licences
require the use of an outfitter, such as guided white-tailed deer licences. The number of outfitters in
Saskatchewan has remained quite stable throughout the years, with anywhere between 620 and 630
licensed outfitters in any given year. Each outfitter has an assigned outfitting area (AOA), with the
exception of game bird outfitters and bear and moose outfitters in the north (WMZs 70 to 72 and 74 to
76), and their licence includes a list of species for which they are endorsed to provide outfitting services.
For big game AOAs, each area has an assigned allocation by species. Currently, approximately 200
outfitters have white-tailed deer allocations, 320 have bear allocations, 240 have bird allocations (both
migratory birds and upland birds), and 75 have moose allocations. At present, no new allocations are
available and the only way to obtain an allocation is for an existing outfitter to surrender it and a new
outfitter to then apply for it. This often occurs when outfitting businesses are sold.
Outfitting provides significant revenue for the province, with an estimated $40 million generated by
outfitted hunting in Saskatchewan in 2006 (Derek Murray Consulting Agencies 2006). This includes
payments to outfitters, tourism expenditures other than those paid to outfitters and licensing costs.
24
STATUS OF SPECIES IN SASKATCHEWAN
White-tailed Deer (Odecoileus virginianus dakotensis) Saskatchewan's white-tailed deer are a highly valued game species. They are considered the most
abundant and widely-distributed ungulate in Saskatchewan, living in diverse habitats across the province
south of the Pre-Cambrian shield (Figure 2), with a preference for open hardwood forests that border
native grasslands or agricultural fields. Saskatchewan represents part of the northern-most extent of
their North American range where population change is largely driven by winter severity, which impacts
body condition, restricts mobility and reduces access to quality forage. After humans, coyotes and
wolves represent their most important predators south and north of the forest fringe, respectively.
Population Status The status of white-tailed deer populations in the province is monitored annually using ground-based
population trend surveys, hunter harvest surveys, a citizen-science population structure survey and field
reports. Ministry staff conduct annual ground-based spotlight surveys in 19 WMZs across the province,
providing data that indicates potential changes in regional populations over time. Results of the HHS
provide estimates of the number of white-tailed deer hunters and their harvest success. The CWMS is a
long-standing voluntary survey where participants record and report their deer observations, providing
important population structure information. In 2017, more deer observations were made using the
newly launched CWMS App for smartphones than traditional paper booklets. Field reports from
landowners, stakeholder groups, the general public and ministry staff provide additional information. At
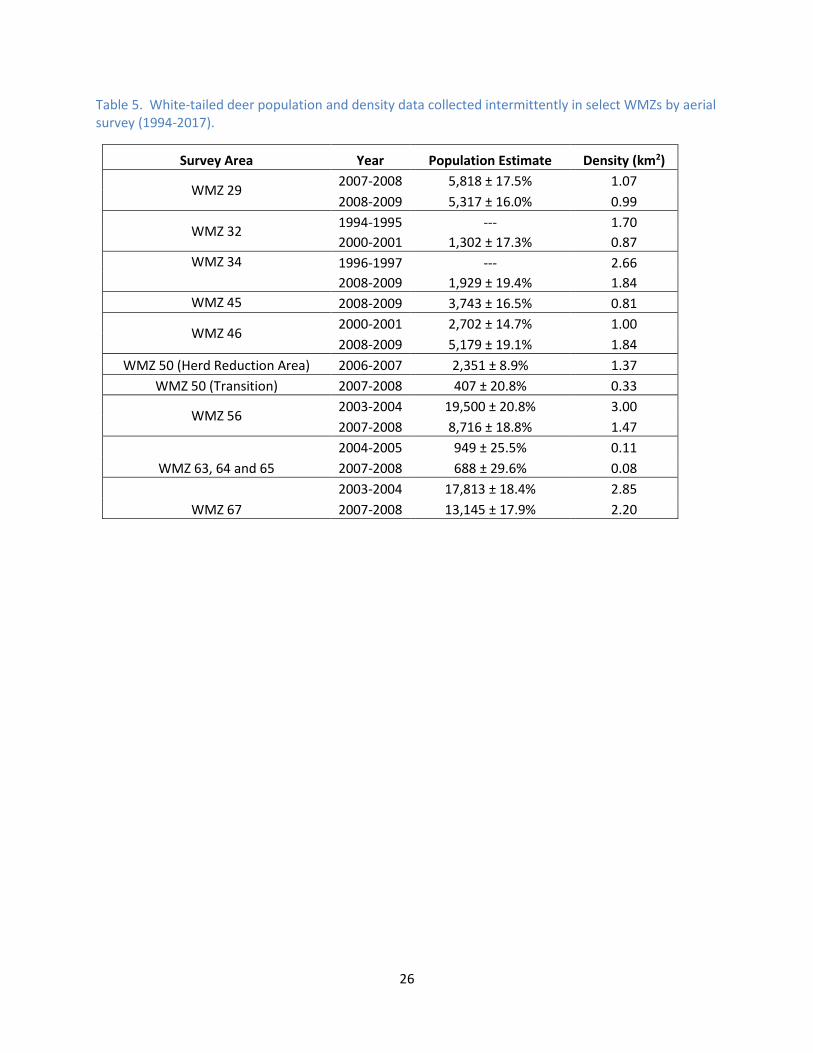
one time aerial surveys yielded valuable estimates of white-tailed deer population density in select
regions of the province (Table 5). In order to support a stronger science-based approach to
management, the feasibility of a white-tailed deer aerial survey program in study areas that represent
white-tailed deer management units (Figure 2) is currently being explored.
Survey Data
In 2017, white-tailed deer population trends were assessed using ground-based spotlight surveys (Table
6), indicating a stable or slightly increasing white-tailed deer population overall. Note that poor weather
and road conditions limited the completion of eight spotlight routes across the province. Population
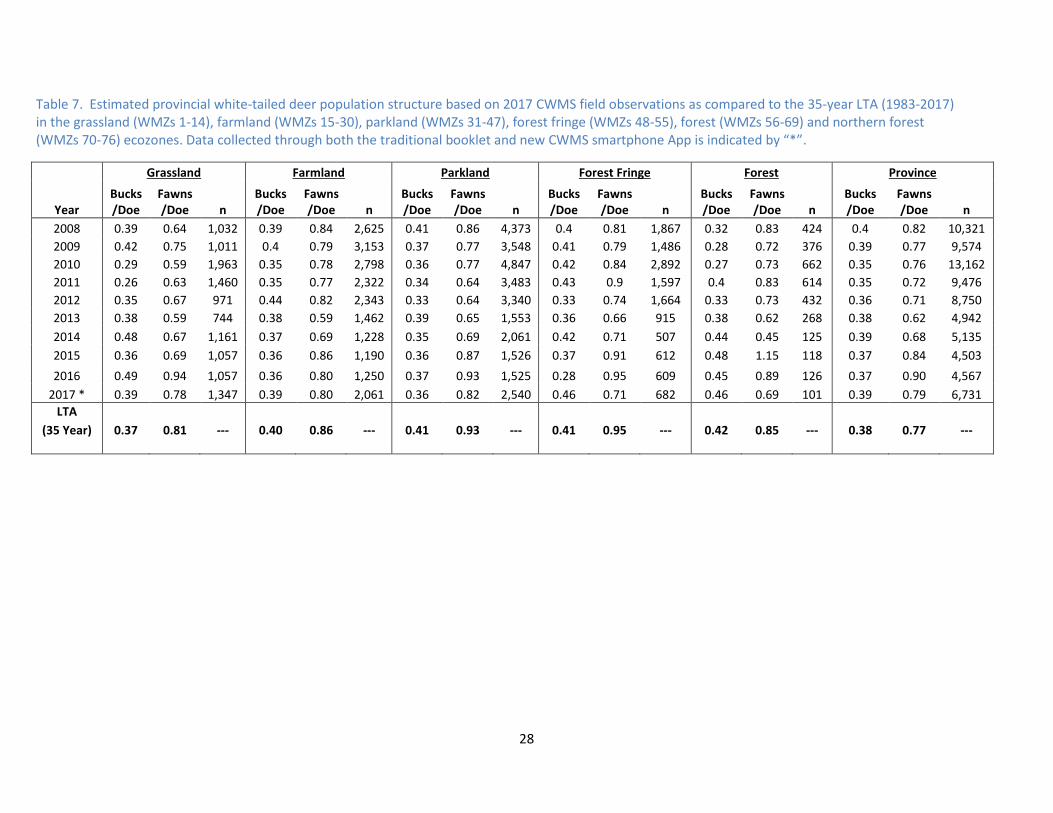
structure data collected through the CWMS (Table 7) and harvest data from the HHS also inform white-
tailed deer management (Tables 8 and 9).
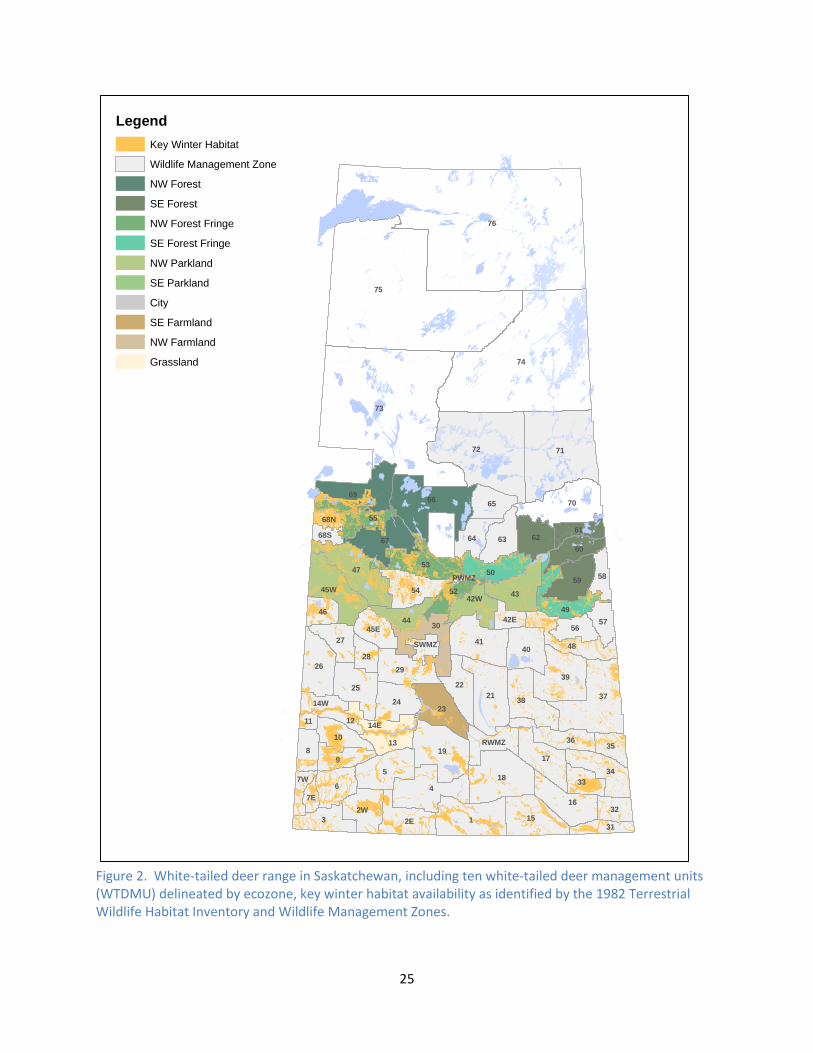
25
Figure 2. White-tailed deer range in Saskatchewan, including ten white-tailed deer management units (WTDMU) delineated by ecozone, key winter habitat availability as identified by the 1982 Terrestrial Wildlife Habitat Inventory and Wildlife Management Zones.
76
75
73
74
72 71
1
4
5
37
66
186
70
21
19
3
47
39
69
41
9
15
53
38
16
43
67
26
30
8
25
23
17
34
48
29
54
40
49
59
24
2E
55
50
36
63 62
22
45W
65
10
27
2W
60
64
44
33
56
61
13
52
32
46
57
35
28
58
31
45E
42W
14E12
RWMZ
7W
42E
14W
7E
11
68S
68N
SWMZ
PWMZ
Legend
Key Winter Habitat
Wildlife Management Zone
NW Forest
SE Forest
NW Forest Fringe
SE Forest Fringe
NW Parkland
SE Parkland
City
SE Farmland
NW Farmland
Grassland
26
Table 5. White-tailed deer population and density data collected intermittently in select WMZs by aerial survey (1994-2017).
Survey Area Year Population Estimate Density (km2)
WMZ 29 2007-2008 5,818 ± 17.5% 1.07
2008-2009 5,317 ± 16.0% 0.99
WMZ 32 1994-1995 --- 1.70
2000-2001 1,302 ± 17.3% 0.87
WMZ 34 1996-1997 --- 2.66
2008-2009 1,929 ± 19.4% 1.84
WMZ 45 2008-2009 3,743 ± 16.5% 0.81
WMZ 46 2000-2001 2,702 ± 14.7% 1.00
2008-2009 5,179 ± 19.1% 1.84
WMZ 50 (Herd Reduction Area) 2006-2007 2,351 ± 8.9% 1.37
WMZ 50 (Transition) 2007-2008 407 ± 20.8% 0.33
WMZ 56 2003-2004 19,500 ± 20.8% 3.00
2007-2008 8,716 ± 18.8% 1.47
WMZ 63, 64 and 65
2004-2005 949 ± 25.5% 0.11
2007-2008 688 ± 29.6% 0.08
WMZ 67
2003-2004 17,813 ± 18.4% 2.85
2007-2008 13,145 ± 17.9% 2.20
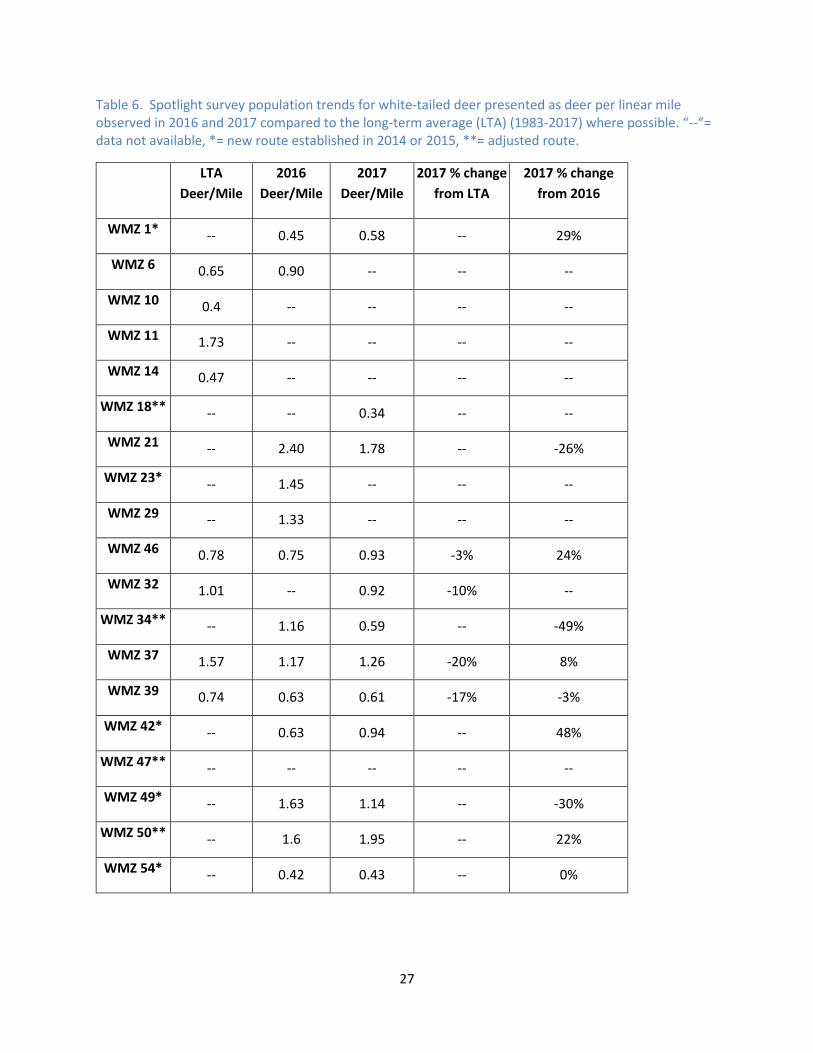
27
Table 6. Spotlight survey population trends for white-tailed deer presented as deer per linear mile observed in 2016 and 2017 compared to the long-term average (LTA) (1983-2017) where possible. “--“= data not available, *= new route established in 2014 or 2015, **= adjusted route.
LTA
Deer/Mile
2016
Deer/Mile
2017
Deer/Mile
2017 % change
from LTA
2017 % change
from 2016
WMZ 1* -- 0.45 0.58 -- 29%
WMZ 6 0.65 0.90 -- -- --
WMZ 10 0.4 -- -- -- --
WMZ 11 1.73 -- -- -- --
WMZ 14 0.47 -- -- -- --
WMZ 18** -- -- 0.34 -- --
WMZ 21 -- 2.40 1.78 -- -26%
WMZ 23* -- 1.45 -- -- --
WMZ 29 -- 1.33 -- -- --
WMZ 46 0.78 0.75 0.93 -3% 24%
WMZ 32 1.01 -- 0.92 -10% --
WMZ 34** -- 1.16 0.59 -- -49%
WMZ 37 1.57 1.17 1.26 -20% 8%
WMZ 39 0.74 0.63 0.61 -17% -3%
WMZ 42* -- 0.63 0.94 -- 48%
WMZ 47** -- -- -- -- --
WMZ 49* -- 1.63 1.14 -- -30%
WMZ 50** -- 1.6 1.95 -- 22%
WMZ 54* -- 0.42 0.43 -- 0%
28
Table 7. Estimated provincial white-tailed deer population structure based on 2017 CWMS field observations as compared to the 35-year LTA (1983-2017) in the grassland (WMZs 1-14), farmland (WMZs 15-30), parkland (WMZs 31-47), forest fringe (WMZs 48-55), forest (WMZs 56-69) and northern forest (WMZs 70-76) ecozones. Data collected through both the traditional booklet and new CWMS smartphone App is indicated by “*”.
Year
Grassland Farmland Parkland Forest Fringe Forest Province
Bucks/Doe
Fawns/Doe n
Bucks/Doe
Fawns/Doe n
Bucks/Doe
Fawns/Doe n
Bucks/Doe
Fawns/Doe n
Bucks/Doe
Fawns/Doe n
Bucks /Doe
Fawns/Doe n
2008 0.39 0.64 1,032 0.39 0.84 2,625 0.41 0.86 4,373 0.4 0.81 1,867 0.32 0.83 424 0.4 0.82 10,321
2009 0.42 0.75 1,011 0.4 0.79 3,153 0.37 0.77 3,548 0.41 0.79 1,486 0.28 0.72 376 0.39 0.77 9,574
2010 0.29 0.59 1,963 0.35 0.78 2,798 0.36 0.77 4,847 0.42 0.84 2,892 0.27 0.73 662 0.35 0.76 13,162
2011 0.26 0.63 1,460 0.35 0.77 2,322 0.34 0.64 3,483 0.43 0.9 1,597 0.4 0.83 614 0.35 0.72 9,476
2012 0.35 0.67 971 0.44 0.82 2,343 0.33 0.64 3,340 0.33 0.74 1,664 0.33 0.73 432 0.36 0.71 8,750
2013 0.38 0.59 744 0.38 0.59 1,462 0.39 0.65 1,553 0.36 0.66 915 0.38 0.62 268 0.38 0.62 4,942
2014 0.48 0.67 1,161 0.37 0.69 1,228 0.35 0.69 2,061 0.42 0.71 507 0.44 0.45 125 0.39 0.68 5,135
2015 0.36 0.69 1,057 0.36 0.86 1,190 0.36 0.87 1,526 0.37 0.91 612 0.48 1.15 118 0.37 0.84 4,503
2016 0.49 0.94 1,057 0.36 0.80 1,250 0.37 0.93 1,525 0.28 0.95 609 0.45 0.89 126 0.37 0.90 4,567
2017 * 0.39 0.78 1,347 0.39 0.80 2,061 0.36 0.82 2,540 0.46 0.71 682 0.46 0.69 101 0.39 0.79 6,731
LTA
(35 Year) 0.37 0.81 --- 0.40 0.86 --- 0.41 0.93 --- 0.41 0.95 --- 0.42 0.85 --- 0.38 0.77 ---
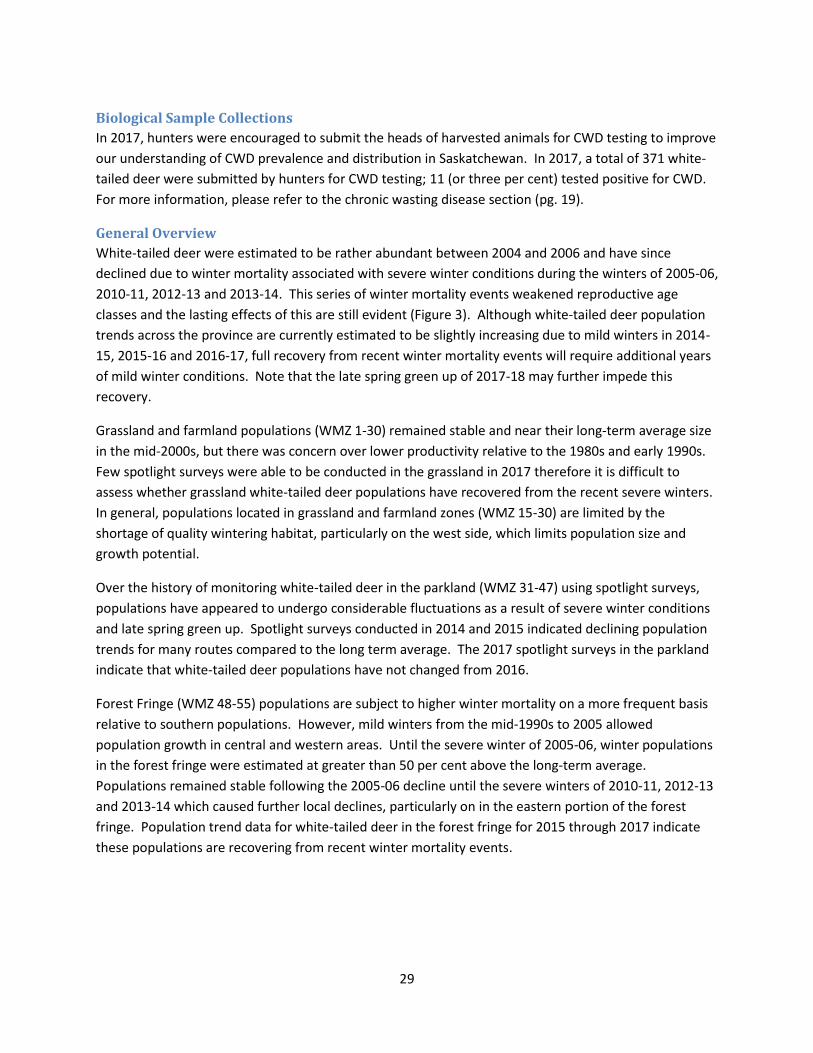
29
Biological Sample Collections
In 2017, hunters were encouraged to submit the heads of harvested animals for CWD testing to improve
our understanding of CWD prevalence and distribution in Saskatchewan. In 2017, a total of 371 white-
tailed deer were submitted by hunters for CWD testing; 11 (or three per cent) tested positive for CWD.
For more information, please refer to the chronic wasting disease section (pg. 19).
General Overview
White-tailed deer were estimated to be rather abundant between 2004 and 2006 and have since
declined due to winter mortality associated with severe winter conditions during the winters of 2005-06,
2010-11, 2012-13 and 2013-14. This series of winter mortality events weakened reproductive age
classes and the lasting effects of this are still evident (Figure 3). Although white-tailed deer population
trends across the province are currently estimated to be slightly increasing due to mild winters in 2014-
15, 2015-16 and 2016-17, full recovery from recent winter mortality events will require additional years
of mild winter conditions. Note that the late spring green up of 2017-18 may further impede this
recovery.
Grassland and farmland populations (WMZ 1-30) remained stable and near their long-term average size
in the mid-2000s, but there was concern over lower productivity relative to the 1980s and early 1990s.
Few spotlight surveys were able to be conducted in the grassland in 2017 therefore it is difficult to
assess whether grassland white-tailed deer populations have recovered from the recent severe winters.
In general, populations located in grassland and farmland zones (WMZ 15-30) are limited by the
shortage of quality wintering habitat, particularly on the west side, which limits population size and
growth potential.
Over the history of monitoring white-tailed deer in the parkland (WMZ 31-47) using spotlight surveys,
populations have appeared to undergo considerable fluctuations as a result of severe winter conditions
and late spring green up. Spotlight surveys conducted in 2014 and 2015 indicated declining population
trends for many routes compared to the long term average. The 2017 spotlight surveys in the parkland
indicate that white-tailed deer populations have not changed from 2016.
Forest Fringe (WMZ 48-55) populations are subject to higher winter mortality on a more frequent basis
relative to southern populations. However, mild winters from the mid-1990s to 2005 allowed
population growth in central and western areas. Until the severe winter of 2005-06, winter populations
in the forest fringe were estimated at greater than 50 per cent above the long-term average.
Populations remained stable following the 2005-06 decline until the severe winters of 2010-11, 2012-13
and 2013-14 which caused further local declines, particularly on in the eastern portion of the forest
fringe. Population trend data for white-tailed deer in the forest fringe for 2015 through 2017 indicate
these populations are recovering from recent winter mortality events.
30
Figure 3. Schematic of the effect of severe winter conditions on all age classes in a deer population over time. Note that it takes multiple years for a population to recover from a winter mortality event due to the impact to the reproductive age classes.
Field reports suggest that forest (WMZ 56-69) populations in the southern boreal forest grew steadily
from the mid-1990s onwards due to a series of mild winters, peaking in the mid-2000s. At this time,
western forest residents reported deer numbers at an all-time high. Some winter mortality occurred in
2004-05 (central regions), 2005-06 (central and eastern regions) and 2006-07 (all forest WMZs), but
declines were reportedly most obvious in the central and eastern forest. Between 2007 and 2010,
several consecutive mild winters is thought to have allowed populations in the forest to recover.
However, the winters of 2010-11, 2012-13 and 2013-14 likely set population recovery back, particularly
in the east. In 2017, field reports indicate that white-tailed deer in the forest are continuing their
recovery from this series of severe winters.
Northern forest populations (WMZ 70-76) are small and it is believed they suffered significant winter
mortality from 2010-2014. Little is known about northern forest white-tailed deer populations in
Saskatchewan.
Hunting Season Review The ministry strives to provide harvest opportunities for white-tailed deer according to Saskatchewan’s
Game Allocation Framework. The Saskatchewan resident regular licence and Canadian resident draw
licence are either-sex licences that have historically placed increased hunting pressure on the buck
component of the population. Antlerless licences apply pressure to the reproductive component of the
DEER AGE
YEAR 0 1 2 3 4 5 6 7 8
2010-2011
2011-2012
2012-2013
2013-2014
2014-2015
2015-2016
2016-2017
2017-2018
2018-2019
2019-2020
Weak cohort from 2010-2011 severe winter Weak cohort from 2012-2013 severe winter
Weak cohort from 2013-2014 severe winter Reproductive age
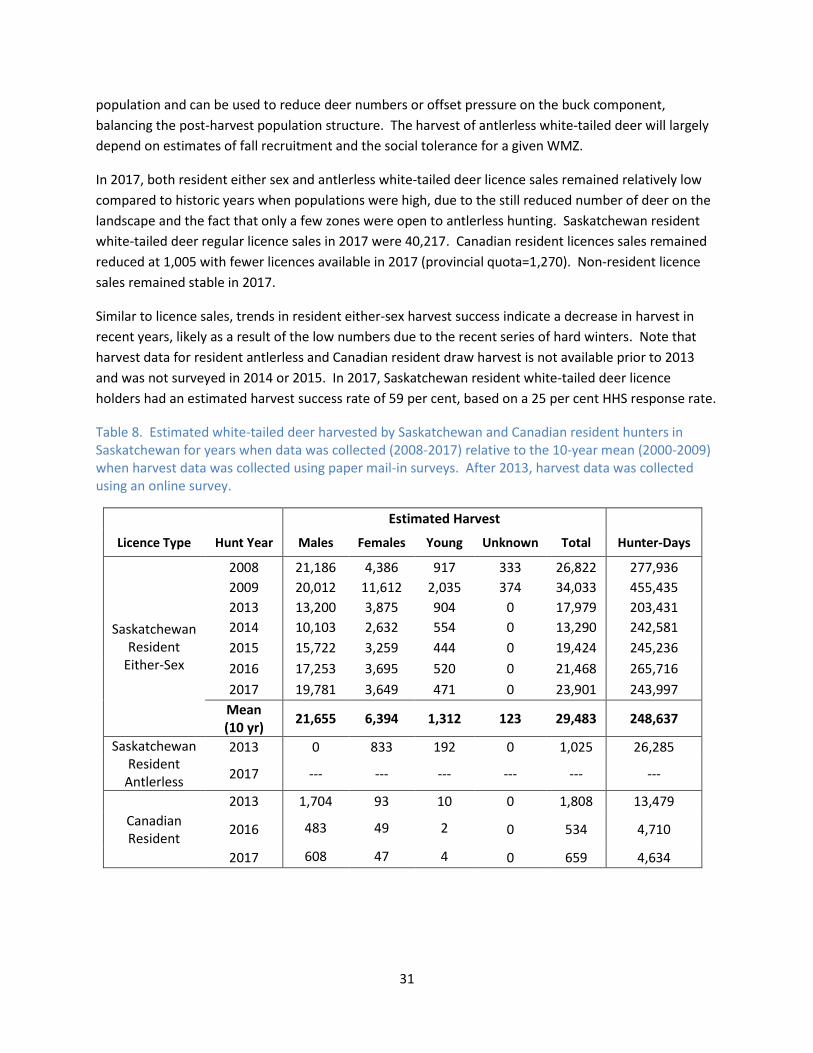
31
population and can be used to reduce deer numbers or offset pressure on the buck component,
balancing the post-harvest population structure. The harvest of antlerless white-tailed deer will largely
depend on estimates of fall recruitment and the social tolerance for a given WMZ.
In 2017, both resident either sex and antlerless white-tailed deer licence sales remained relatively low
compared to historic years when populations were high, due to the still reduced number of deer on the
landscape and the fact that only a few zones were open to antlerless hunting. Saskatchewan resident
white-tailed deer regular licence sales in 2017 were 40,217. Canadian resident licences sales remained
reduced at 1,005 with fewer licences available in 2017 (provincial quota=1,270). Non-resident licence
sales remained stable in 2017.
Similar to licence sales, trends in resident either-sex harvest success indicate a decrease in harvest in
recent years, likely as a result of the low numbers due to the recent series of hard winters. Note that
harvest data for resident antlerless and Canadian resident draw harvest is not available prior to 2013
and was not surveyed in 2014 or 2015. In 2017, Saskatchewan resident white-tailed deer licence
holders had an estimated harvest success rate of 59 per cent, based on a 25 per cent HHS response rate.
Table 8. Estimated white-tailed deer harvested by Saskatchewan and Canadian resident hunters in Saskatchewan for years when data was collected (2008-2017) relative to the 10-year mean (2000-2009) when harvest data was collected using paper mail-in surveys. After 2013, harvest data was collected using an online survey.
Estimated Harvest
Licence Type Hunt Year Males Females Young Unknown Total Hunter-Days
Saskatchewan Resident
Either-Sex
2008 21,186 4,386 917 333 26,822 277,936
2009 20,012 11,612 2,035 374 34,033 455,435
2013 13,200 3,875 904 0 17,979 203,431
2014 10,103 2,632 554 0 13,290 242,581
2015 15,722 3,259 444 0 19,424 245,236
2016 17,253 3,695 520 0 21,468 265,716
2017 19,781 3,649 471 0 23,901 243,997
Mean (10 yr)
21,655 6,394 1,312 123 29,483 248,637
Saskatchewan Resident
Antlerless
2013 0 833 192 0 1,025 26,285
2017 --- --- --- --- --- ---
Canadian Resident
2013 1,704 93 10 0 1,808 13,479
2016 483 49 2 0 534 4,710
2017 608 47 4 0 659 4,634
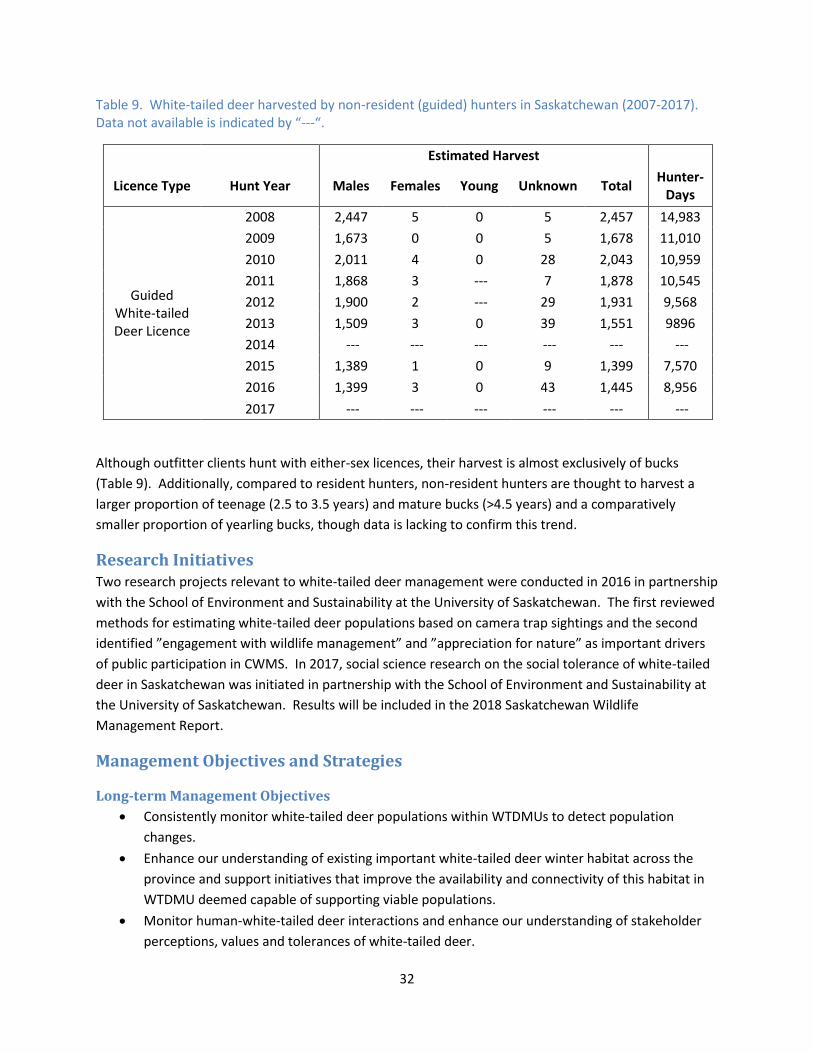
32
Table 9. White-tailed deer harvested by non-resident (guided) hunters in Saskatchewan (2007-2017). Data not available is indicated by “---“.
Estimated Harvest
Licence Type Hunt Year Males Females Young Unknown Total Hunter-
Days
Guided White-tailed Deer Licence
2008 2,447 5 0 5 2,457 14,983
2009 1,673 0 0 5 1,678 11,010
2010 2,011 4 0 28 2,043 10,959
2011 1,868 3 --- 7 1,878 10,545
2012 1,900 2 --- 29 1,931 9,568
2013 1,509 3 0 39 1,551 9896
2014 --- --- --- --- --- ---
2015 1,389 1 0 9 1,399 7,570
2016 1,399 3 0 43 1,445 8,956
2017 --- --- --- --- --- ---
Although outfitter clients hunt with either-sex licences, their harvest is almost exclusively of bucks
(Table 9). Additionally, compared to resident hunters, non-resident hunters are thought to harvest a
larger proportion of teenage (2.5 to 3.5 years) and mature bucks (>4.5 years) and a comparatively
smaller proportion of yearling bucks, though data is lacking to confirm this trend.
Research Initiatives Two research projects relevant to white-tailed deer management were conducted in 2016 in partnership
with the School of Environment and Sustainability at the University of Saskatchewan. The first reviewed
methods for estimating white-tailed deer populations based on camera trap sightings and the second
identified ”engagement with wildlife management” and ”appreciation for nature” as important drivers
of public participation in CWMS. In 2017, social science research on the social tolerance of white-tailed
deer in Saskatchewan was initiated in partnership with the School of Environment and Sustainability at
the University of Saskatchewan. Results will be included in the 2018 Saskatchewan Wildlife
Management Report.
Management Objectives and Strategies
Long-term Management Objectives
Consistently monitor white-tailed deer populations within WTDMUs to detect population
changes.
Enhance our understanding of existing important white-tailed deer winter habitat across the
province and support initiatives that improve the availability and connectivity of this habitat in
WTDMU deemed capable of supporting viable populations.
Monitor human-white-tailed deer interactions and enhance our understanding of stakeholder
perceptions, values and tolerances of white-tailed deer.
33
Annually allocate white-tailed deer surplus using a sustainable harvest strategy.
Maintain harvest opportunities that respect the temporal aspect of white-tailed deer breeding
ecology by adjusting season dates to avoid the peak of the rut (i.e., when 50 per cent of females
are considered bred).
Short-term Management Strategies
Adjust harvest pressure using indicators, such as population structure or hunter harvest success,
that align with management thresholds as presented in the white-tailed deer management plan.
Quantify annual winter severity in all WTDMU across the province using mean weekly snow
depth and temperature data.
Improve our understanding of the distribution and prevalence of diseases affecting white-tailed
deer, particularly Chronic Wasting Disease (CWD).
Identify social tolerance thresholds for white-tailed deer south of the provincial forest.
Additional Information
Most recent provincial species plan: None available.
For additional information, please contact:
Allison Henderson, PhD
White-tailed Deer Manager
Fish and Wildlife Branch
Ministry of Environment
120 Smith Street East, Yorkton, SK S3N 3V3
(306) 786-1425
34
Mule Deer (Odecoileus hemionus) Mule deer, named for their large mule-like ears, are most commonly found in the dry and moist
grassland and parkland regions of the Saskatchewan. Although mule deer are known to thrive in early
successional habitats where forbs, grasses and shrubs dominate, they have readily adapted to forage
opportunistically on agricultural crops in both grassland and parkland regions of Saskatchewan. Much
like white-tailed deer, Saskatchewan represents part of the northern-most extent of their North
American range where population change is largely driven by winter severity, which impacts body
condition, restricts mobility and reduces access to quality forage. After humans, coyotes represent their
most important predators.
Population Status The status of mule deer populations in the province is monitored annually using ground-based
population trend surveys, hunter harvest surveys, a citizen-science population structure survey and field
reports. Ministry staff conduct annual ground-based spotlight surveys in 10 WMZs across the province,
providing data that indicates potential changes in regional populations over time. Results of the HHS
provide estimates of the number of mule deer hunters and their harvest success. The CWMS is a long-
standing voluntary survey where participants record and report their deer observations, providing
important population structure information. Field reports from landowners, stakeholder groups, the
general public and ministry staff provide additional information. At one time aerial surveys yielded
valuable estimates of mule deer population density in select regions of the province (Table 10). In order
to support a stronger science-based approach to management, the feasibility of a mule deer aerial
survey program is currently being explored.
Survey Data
In 2017, mule deer population trends were difficult to assess using ground-based spotlight surveys,
given that very few routes were completed as a result of poor weather and road conditions (Table 11).
Of the few that were conducted, they indicate an increasing mule deer population. Population structure
data collected through the CWMS (Table 12) and harvest data also inform mule deer management
(Table 13).
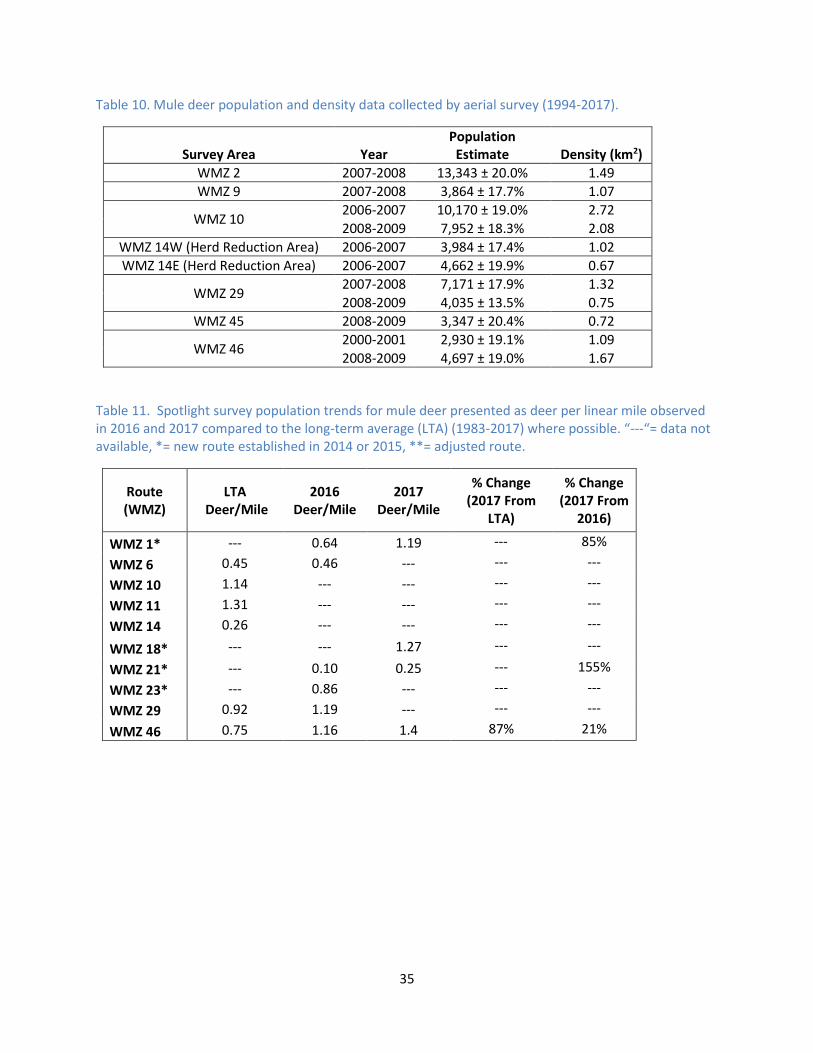
35
Table 10. Mule deer population and density data collected by aerial survey (1994-2017).
Survey Area Year Population
Estimate Density (km2)
WMZ 2 2007-2008 13,343 ± 20.0% 1.49
WMZ 9 2007-2008 3,864 ± 17.7% 1.07
WMZ 10 2006-2007 10,170 ± 19.0% 2.72
2008-2009 7,952 ± 18.3% 2.08
WMZ 14W (Herd Reduction Area) 2006-2007 3,984 ± 17.4% 1.02
WMZ 14E (Herd Reduction Area) 2006-2007 4,662 ± 19.9% 0.67
WMZ 29 2007-2008 7,171 ± 17.9% 1.32
2008-2009 4,035 ± 13.5% 0.75
WMZ 45 2008-2009 3,347 ± 20.4% 0.72
WMZ 46 2000-2001 2,930 ± 19.1% 1.09
2008-2009 4,697 ± 19.0% 1.67
Table 11. Spotlight survey population trends for mule deer presented as deer per linear mile observed in 2016 and 2017 compared to the long-term average (LTA) (1983-2017) where possible. “---“= data not available, *= new route established in 2014 or 2015, **= adjusted route.
Route (WMZ)
LTA Deer/Mile
2016 Deer/Mile
2017 Deer/Mile
% Change (2017 From
LTA)
% Change (2017 From
2016)
WMZ 1* --- 0.64 1.19 --- 85%
WMZ 6 0.45 0.46 --- --- ---
WMZ 10 1.14 --- --- --- ---
WMZ 11 1.31 --- --- --- ---
WMZ 14 0.26 --- --- --- ---
WMZ 18* --- --- 1.27 --- ---
WMZ 21* --- 0.10 0.25 --- 155%
WMZ 23* --- 0.86 --- --- ---
WMZ 29 0.92 1.19 --- --- ---
WMZ 46 0.75 1.16 1.4 87% 21%
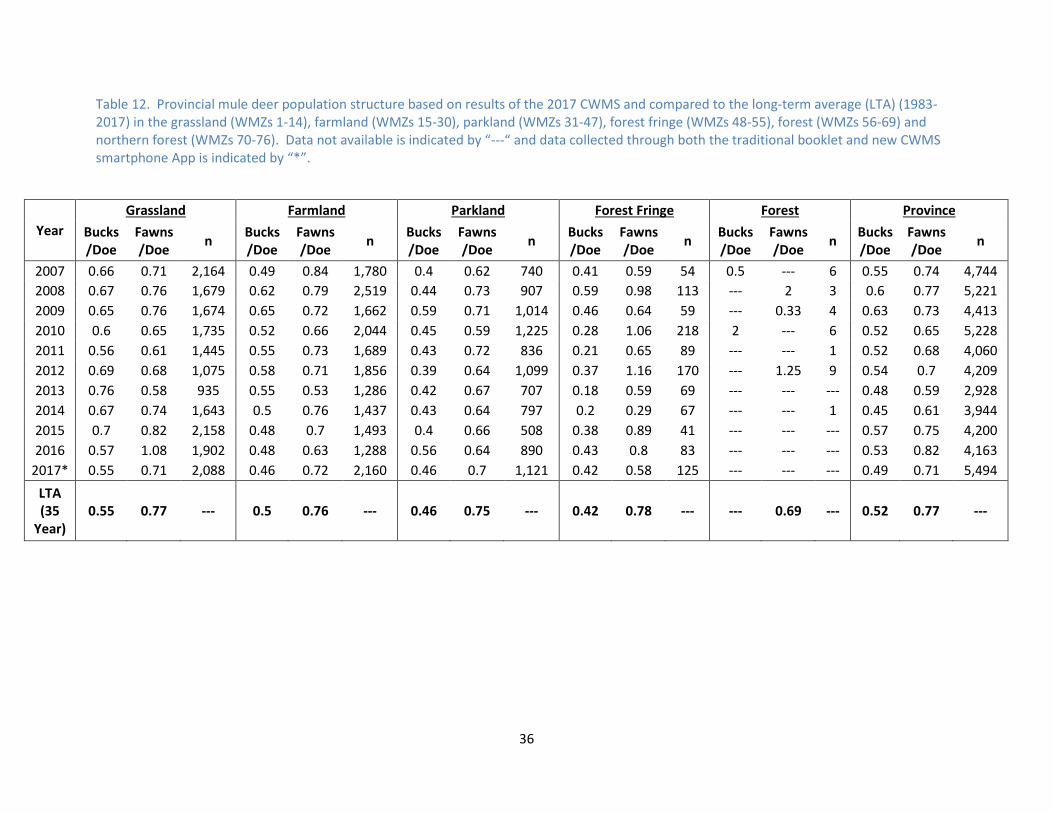
36
Table 12. Provincial mule deer population structure based on results of the 2017 CWMS and compared to the long-term average (LTA) (1983-2017) in the grassland (WMZs 1-14), farmland (WMZs 15-30), parkland (WMZs 31-47), forest fringe (WMZs 48-55), forest (WMZs 56-69) and northern forest (WMZs 70-76). Data not available is indicated by “---“ and data collected through both the traditional booklet and new CWMS smartphone App is indicated by “*”.
Year
Grassland Farmland Parkland Forest Fringe Forest Province
Bucks/Doe
Fawns/Doe
n Bucks/Doe
Fawns/Doe
n Bucks/Doe
Fawns/Doe
n Bucks/Doe
Fawns/Doe
n Bucks/Doe
Fawns/Doe
n Bucks /Doe
Fawns/Doe
n
2007 0.66 0.71 2,164 0.49 0.84 1,780 0.4 0.62 740 0.41 0.59 54 0.5 --- 6 0.55 0.74 4,744
2008 0.67 0.76 1,679 0.62 0.79 2,519 0.44 0.73 907 0.59 0.98 113 --- 2 3 0.6 0.77 5,221
2009 0.65 0.76 1,674 0.65 0.72 1,662 0.59 0.71 1,014 0.46 0.64 59 --- 0.33 4 0.63 0.73 4,413
2010 0.6 0.65 1,735 0.52 0.66 2,044 0.45 0.59 1,225 0.28 1.06 218 2 --- 6 0.52 0.65 5,228
2011 0.56 0.61 1,445 0.55 0.73 1,689 0.43 0.72 836 0.21 0.65 89 --- --- 1 0.52 0.68 4,060
2012 0.69 0.68 1,075 0.58 0.71 1,856 0.39 0.64 1,099 0.37 1.16 170 --- 1.25 9 0.54 0.7 4,209
2013 0.76 0.58 935 0.55 0.53 1,286 0.42 0.67 707 0.18 0.59 69 --- --- --- 0.48 0.59 2,928
2014 0.67 0.74 1,643 0.5 0.76 1,437 0.43 0.64 797 0.2 0.29 67 --- --- 1 0.45 0.61 3,944
2015 0.7 0.82 2,158 0.48 0.7 1,493 0.4 0.66 508 0.38 0.89 41 --- --- --- 0.57 0.75 4,200
2016 0.57 1.08 1,902 0.48 0.63 1,288 0.56 0.64 890 0.43 0.8 83 --- --- --- 0.53 0.82 4,163
2017* 0.55 0.71 2,088 0.46 0.72 2,160 0.46 0.7 1,121 0.42 0.58 125 --- --- --- 0.49 0.71 5,494
LTA (35
Year) 0.55 0.77 --- 0.5 0.76 --- 0.46 0.75 --- 0.42 0.78 --- --- 0.69 --- 0.52 0.77 ---
37
Biological Sample Collections
In 2017, hunters were encouraged to submit the heads of harvested animals for CWD testing to improve
our understanding of CWD prevalence and distribution in Saskatchewan. In 2017, a total of 298 mule
deer were submitted by hunters for CWD testing; 63 (or 21 per cent) tested positive for CWD. For more
information, please refer to chronic wasting disease section (pg. 19).
General Overview
In 2017, survey and field report information indicated that provincial mule deer populations were stable
or increasing as they continued to recover from the recent series of severe winters (2010-2014). Field
reports indicated that populations in select WMZ south of the forest fringe had fully recovered and were
increasing above socially-tolerable levels. In 2017, more deer observations were made using the newly
launched CWMS App for smartphones than traditional paper booklets. Provincial mule deer buck:doe
and fawn:doe ratios were increasing, but remained below the long-term average in the farmland,
parkland and forest fringe and were very close to the long-term average in the grassland.
Hunting Season Review Saskatchewan resident hunters who have been selected in the big game draw have the option to hunt
with an antlerless licence (with a bag limit of one or two animals, depending on the WMZ) and/or a mule
deer either-sex licence. In 2017, an archery-only regular either-sex licence was also available for
Saskatchewan residents. Either-sex licences result in increased hunting pressure on the buck
component of the population. Antlerless licences attempt to offset this effect, balancing the harvest
structure. Canadian resident and non-resident hunters do not have the opportunity to hunt mule deer
in Saskatchewan.
In 2017, a reduced quota was maintained in order to allow mule deer populations to fully recover from
the recent series of severe winters and as such licence sales remained low (3,993) compared to prior to
the series of severe winters pre-2010 (6,377). In contrast, archery licence sales remained elevated and
close to the five-year average in 2017, with 2,941 licences sold. Similar to licence sales, harvest of mule
deer on an archery licence remained relatively stable between 2016 and 2017. Either-sex mule deer
harvest on a draw licence increased slightly.
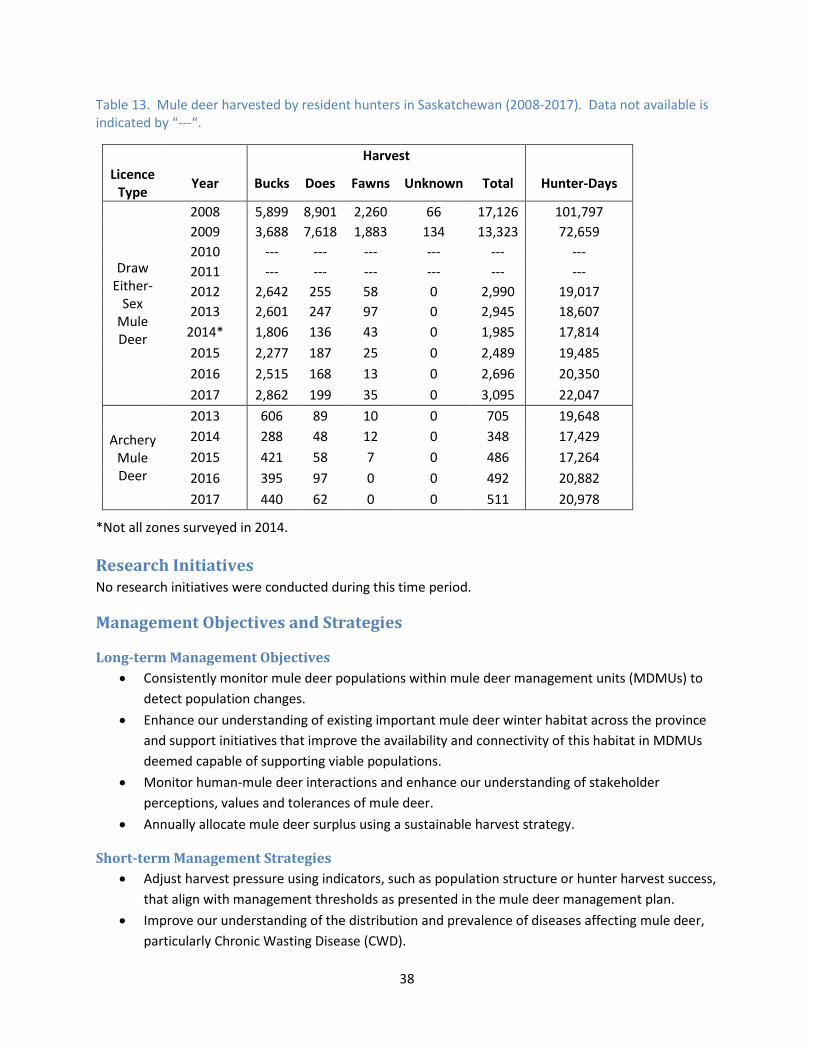
38
Table 13. Mule deer harvested by resident hunters in Saskatchewan (2008-2017). Data not available is indicated by “---“.
Harvest
Licence Type
Year Bucks Does Fawns Unknown Total Hunter-Days
Draw Either-
Sex Mule Deer
2008 5,899 8,901 2,260 66 17,126 101,797
2009 3,688 7,618 1,883 134 13,323 72,659
2010 --- --- --- --- --- ---
2011 --- --- --- --- --- ---
2012 2,642 255 58 0 2,990 19,017
2013 2,601 247 97 0 2,945 18,607
2014* 1,806 136 43 0 1,985 17,814
2015 2,277 187 25 0 2,489 19,485
2016 2,515 168 13 0 2,696 20,350
2017 2,862 199 35 0 3,095 22,047
Archery Mule Deer
2013 606 89 10 0 705 19,648
2014 288 48 12 0 348 17,429
2015 421 58 7 0 486 17,264
2016 395 97 0 0 492 20,882
2017 440 62 0 0 511 20,978
*Not all zones surveyed in 2014.
Research Initiatives No research initiatives were conducted during this time period.
Management Objectives and Strategies
Long-term Management Objectives
Consistently monitor mule deer populations within mule deer management units (MDMUs) to
detect population changes.
Enhance our understanding of existing important mule deer winter habitat across the province
and support initiatives that improve the availability and connectivity of this habitat in MDMUs
deemed capable of supporting viable populations.
Monitor human-mule deer interactions and enhance our understanding of stakeholder
perceptions, values and tolerances of mule deer.
Annually allocate mule deer surplus using a sustainable harvest strategy.
Short-term Management Strategies
Adjust harvest pressure using indicators, such as population structure or hunter harvest success,
that align with management thresholds as presented in the mule deer management plan.
Improve our understanding of the distribution and prevalence of diseases affecting mule deer,
particularly Chronic Wasting Disease (CWD).
39
Quantify annual winter severity in all MDMUs across the province using mean weekly snow
depth and temperature data.
Identify social tolerance thresholds for mule deer south of the provincial forest.
Additional Information
Most recent provincial species plan: None available.
For additional information, please contact:
Todd Whiklo
Mule Deer Manager
Fish, Wildlife and Lands Branch
Ministry of Environment
350 Cheadle St. W. Swift Current, SK S9H 4G3
(306) 778-8262
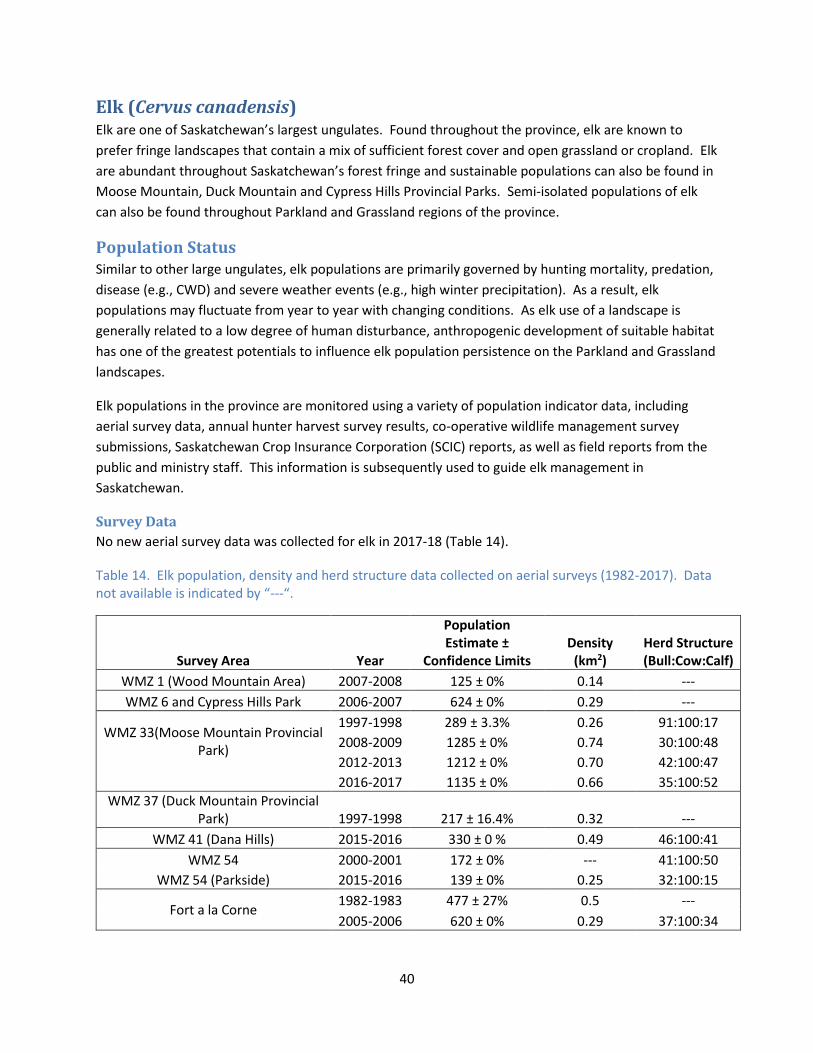
40
Elk (Cervus canadensis) Elk are one of Saskatchewan’s largest ungulates. Found throughout the province, elk are known to
prefer fringe landscapes that contain a mix of sufficient forest cover and open grassland or cropland. Elk
are abundant throughout Saskatchewan’s forest fringe and sustainable populations can also be found in
Moose Mountain, Duck Mountain and Cypress Hills Provincial Parks. Semi-isolated populations of elk
can also be found throughout Parkland and Grassland regions of the province.
Population Status Similar to other large ungulates, elk populations are primarily governed by hunting mortality, predation,
disease (e.g., CWD) and severe weather events (e.g., high winter precipitation). As a result, elk
populations may fluctuate from year to year with changing conditions. As elk use of a landscape is
generally related to a low degree of human disturbance, anthropogenic development of suitable habitat
has one of the greatest potentials to influence elk population persistence on the Parkland and Grassland
landscapes.
Elk populations in the province are monitored using a variety of population indicator data, including
aerial survey data, annual hunter harvest survey results, co-operative wildlife management survey
submissions, Saskatchewan Crop Insurance Corporation (SCIC) reports, as well as field reports from the
public and ministry staff. This information is subsequently used to guide elk management in
Saskatchewan.
Survey Data
No new aerial survey data was collected for elk in 2017-18 (Table 14).
Table 14. Elk population, density and herd structure data collected on aerial surveys (1982-2017). Data not available is indicated by “---“.
Survey Area Year
Population Estimate ±
Confidence Limits Density
(km2) Herd Structure (Bull:Cow:Calf)
WMZ 1 (Wood Mountain Area) 2007-2008 125 ± 0% 0.14 ---
WMZ 6 and Cypress Hills Park 2006-2007 624 ± 0% 0.29 ---
WMZ 33(Moose Mountain Provincial Park)
1997-1998 289 ± 3.3% 0.26 91:100:17
2008-2009 1285 ± 0% 0.74 30:100:48
2012-2013 1212 ± 0% 0.70 42:100:47
2016-2017 1135 ± 0% 0.66 35:100:52
WMZ 37 (Duck Mountain Provincial Park) 1997-1998 217 ± 16.4% 0.32 ---
WMZ 41 (Dana Hills) 2015-2016 330 ± 0 % 0.49 46:100:41
WMZ 54 2000-2001 172 ± 0% --- 41:100:50
WMZ 54 (Parkside) 2015-2016 139 ± 0% 0.25 32:100:15
Fort a la Corne 1982-1983 477 ± 27% 0.5 ---
2005-2006 620 ± 0% 0.29 37:100:34

41
In autumn 2017, the Ministry of Environment launched a mobile application version of the CWMS, which
included the ability for public participants to record elk observations. The key recording period for elk
has been set to August 20 to February 20. In 2017, there were 151 total elk observations recorded with
the CWMS app, resulting in 1,130 elk observed in 30 WMZs and a herd structure estimate of 235 bulls:
327 cows: 204 calves (see Figure 4 below).
Figure 4. Number of elk observations summarized per wildlife management zone recorded with the Co-operative Wildlife Management Survey mobile application in 2017.
42
Biological Sample Collections
In 2017, heads from harvested elk were eligible for voluntary CWD testing. A total of 42 elk heads were
submitted for CWD testing, with one elk testing positive for CWD in WMZ 43. For more information on
the CWD harvest sampling program please refer to the chronic wasting disease section (pg. 19).
General Overview
Elk population abundance, trends and hunting opportunities vary regionally throughout the province
(Figure 5 below). According to information including the annual hunter harvest survey, expert surveys
and field reports, most elk populations in core areas of elk range along the boreal forest fringe remain
stable following consecutive mild winters. Field reports of high predator numbers and past changes in
management objectives may have reduced some elk populations throughout this area. Management in
core elk range will continue to focus on maintaining sustainable populations of elk.
Elk populations have grown and in some cases expanded throughout Parkland and Grassland regions of
the province over the past several years. Factors contributing to the apparent population increase and
expansion are likely due to a combination of mild winters, excess in forage, low levels of predation and
the mobile and gregarious nature of elk. In Moose Mountain Provincial Park, elk populations remain
above target objectives following mild winters and relatively difficult (e.g., wet) conditions during recent
hunting seasons.
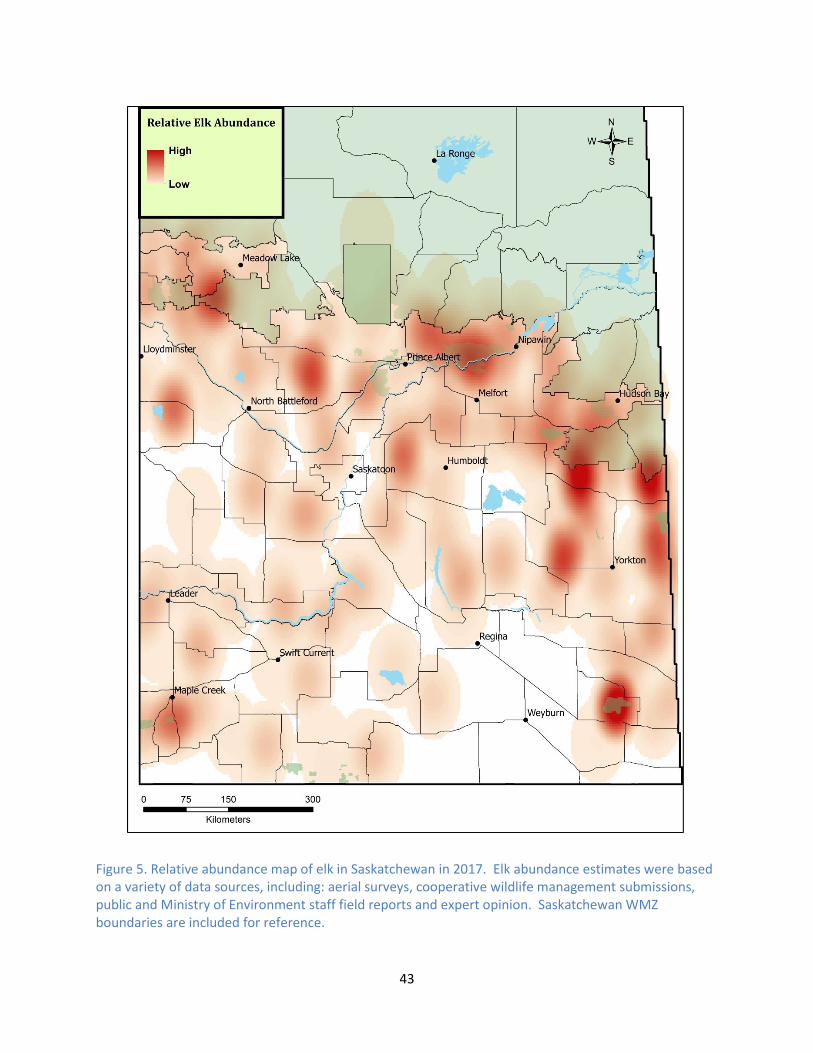
43
Figure 5. Relative abundance map of elk in Saskatchewan in 2017. Elk abundance estimates were based on a variety of data sources, including: aerial surveys, cooperative wildlife management submissions, public and Ministry of Environment staff field reports and expert opinion. Saskatchewan WMZ boundaries are included for reference.
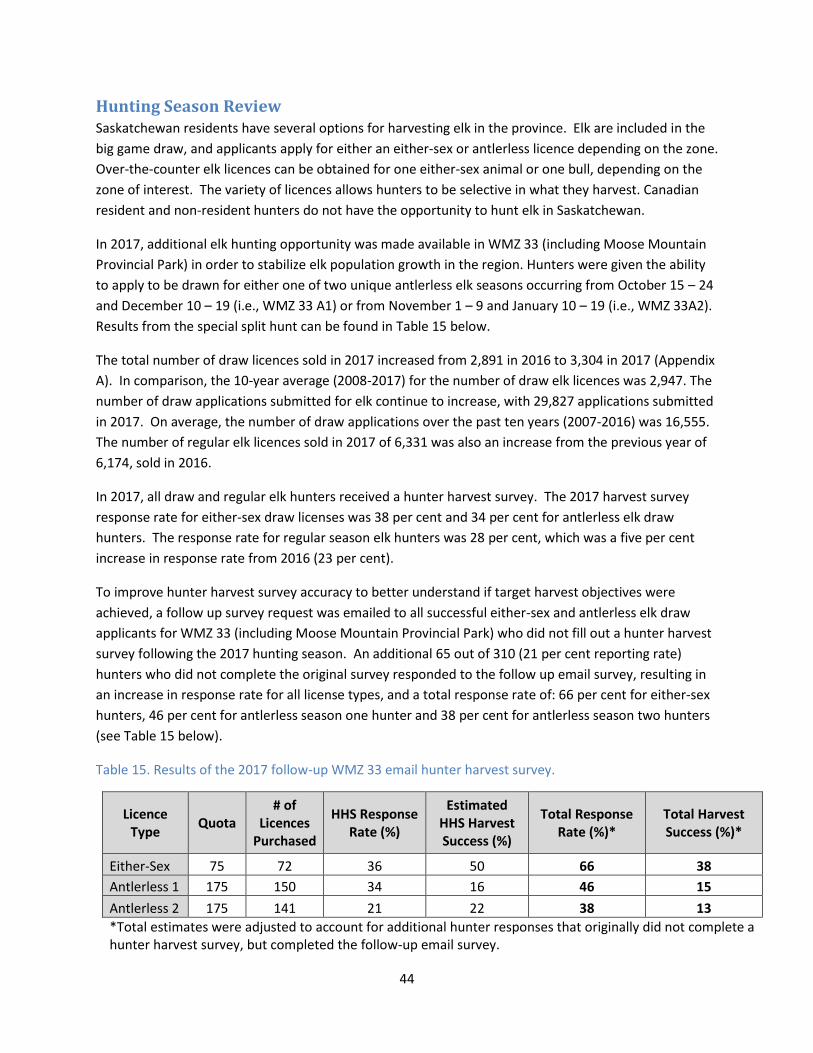
44
Hunting Season Review Saskatchewan residents have several options for harvesting elk in the province. Elk are included in the
big game draw, and applicants apply for either an either-sex or antlerless licence depending on the zone.
Over-the-counter elk licences can be obtained for one either-sex animal or one bull, depending on the
zone of interest. The variety of licences allows hunters to be selective in what they harvest. Canadian
resident and non-resident hunters do not have the opportunity to hunt elk in Saskatchewan.
In 2017, additional elk hunting opportunity was made available in WMZ 33 (including Moose Mountain
Provincial Park) in order to stabilize elk population growth in the region. Hunters were given the ability
to apply to be drawn for either one of two unique antlerless elk seasons occurring from October 15 – 24
and December 10 – 19 (i.e., WMZ 33 A1) or from November 1 – 9 and January 10 – 19 (i.e., WMZ 33A2).
Results from the special split hunt can be found in Table 15 below.
The total number of draw licences sold in 2017 increased from 2,891 in 2016 to 3,304 in 2017 (Appendix
A). In comparison, the 10-year average (2008-2017) for the number of draw elk licences was 2,947. The
number of draw applications submitted for elk continue to increase, with 29,827 applications submitted
in 2017. On average, the number of draw applications over the past ten years (2007-2016) was 16,555.
The number of regular elk licences sold in 2017 of 6,331 was also an increase from the previous year of
6,174, sold in 2016.
In 2017, all draw and regular elk hunters received a hunter harvest survey. The 2017 harvest survey
response rate for either-sex draw licenses was 38 per cent and 34 per cent for antlerless elk draw
hunters. The response rate for regular season elk hunters was 28 per cent, which was a five per cent
increase in response rate from 2016 (23 per cent).
To improve hunter harvest survey accuracy to better understand if target harvest objectives were
achieved, a follow up survey request was emailed to all successful either-sex and antlerless elk draw
applicants for WMZ 33 (including Moose Mountain Provincial Park) who did not fill out a hunter harvest
survey following the 2017 hunting season. An additional 65 out of 310 (21 per cent reporting rate)
hunters who did not complete the original survey responded to the follow up email survey, resulting in
an increase in response rate for all license types, and a total response rate of: 66 per cent for either-sex
hunters, 46 per cent for antlerless season one hunter and 38 per cent for antlerless season two hunters
(see Table 15 below).
Table 15. Results of the 2017 follow-up WMZ 33 email hunter harvest survey.
Licence Type
Quota # of
Licences Purchased
HHS Response Rate (%)
Estimated HHS Harvest Success (%)
Total Response Rate (%)*
Total Harvest Success (%)*
Either-Sex 75 72 36 50 66 38
Antlerless 1 175 150 34 16 46 15
Antlerless 2 175 141 21 22 38 13
*Total estimates were adjusted to account for additional hunter responses that originally did not complete a hunter harvest survey, but completed the follow-up email survey.
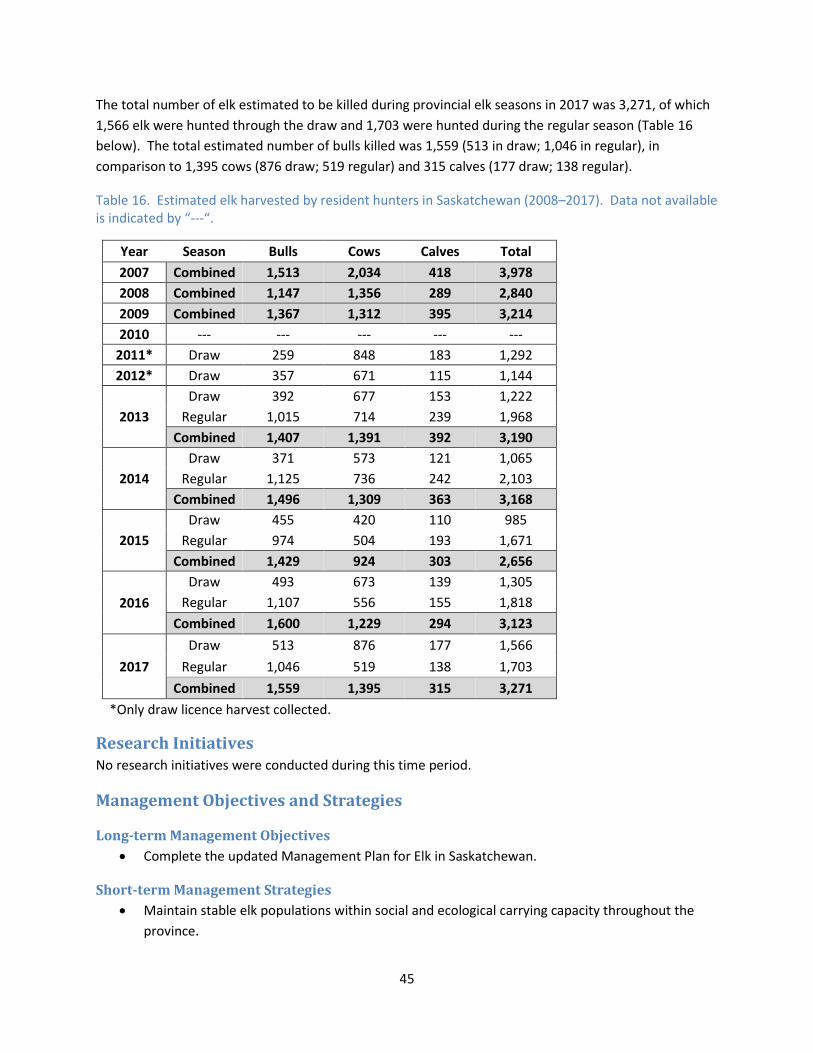
45
The total number of elk estimated to be killed during provincial elk seasons in 2017 was 3,271, of which
1,566 elk were hunted through the draw and 1,703 were hunted during the regular season (Table 16
below). The total estimated number of bulls killed was 1,559 (513 in draw; 1,046 in regular), in
comparison to 1,395 cows (876 draw; 519 regular) and 315 calves (177 draw; 138 regular).
Table 16. Estimated elk harvested by resident hunters in Saskatchewan (2008–2017). Data not available is indicated by “---“.
Year Season Bulls Cows Calves Total
2007 Combined 1,513 2,034 418 3,978
2008 Combined 1,147 1,356 289 2,840
2009 Combined 1,367 1,312 395 3,214
2010 --- --- --- --- ---
2011* Draw 259 848 183 1,292
2012* Draw 357 671 115 1,144
2013
Draw 392 677 153 1,222
Regular 1,015 714 239 1,968
Combined 1,407 1,391 392 3,190
2014
Draw 371 573 121 1,065
Regular 1,125 736 242 2,103
Combined 1,496 1,309 363 3,168
2015
Draw 455 420 110 985
Regular 974 504 193 1,671
Combined 1,429 924 303 2,656
2016
Draw 493 673 139 1,305
Regular 1,107 556 155 1,818
Combined 1,600 1,229 294 3,123
2017
Draw 513 876 177 1,566
Regular 1,046 519 138 1,703
Combined 1,559 1,395 315 3,271
*Only draw licence harvest collected.
Research Initiatives No research initiatives were conducted during this time period.
Management Objectives and Strategies
Long-term Management Objectives
Complete the updated Management Plan for Elk in Saskatchewan.
Short-term Management Strategies
Maintain stable elk populations within social and ecological carrying capacity throughout the
province.
46
Promote the HHS to prospective elk hunters.
Promote the CWMS mobile application for the public to record locations of elk to assist in
management.
Additional Information
Most recent provincial species plan:
Arsenault, A. 2008. Saskatchewan elk (Cervus elaphus) Management Plan – Update. Saskatchewan
Ministry of Environment, Fish and Wildlife Branch Technical Report 2008-02. 63pp. (Unpublished)
For additional information, please contact:
Tom Perry
Elk Manager
Fish, Wildlife and Lands Branch, Ministry of Environment
800 Central Avenue, Prince Albert SK., S6V 6G1
(306) 953-2695
47
Moose (Alces alces) Moose, the largest member of the deer family, historically inhabited all regions of the province, with the
exception of the mixed grassland ecoregion, but since settlement of the prairies, have been restricted to
boreal regions of the province dominated by spruce, aspen and pine trees (Figure 6). Cover and browse
availability were thought to be the limiting factors to moose distribution from the forest and forest
fringe ecoregions. Additionally, it was believed that temperature (particularly heat in the absence of
cover) in the south would limit their expansion into more southern regions. Although we are only
beginning to understand the factors underlying moose re-colonization of farmland and prairie regions of
the province (See LaForge et al. 2016 for more detail), the combination of abnormally favourable
climatic conditions, lack of predators, decline in the rural population of Saskatchewan, and the presence
of optimal foraging conditions have likely contributed to moose survival in southern Saskatchewan.
Population Status Moose populations are monitored annually using information gathered from aerial population surveys,
the hunter harvest survey, the co-operative wildlife management survey, relevant research conducted
by external organizations and field reports from the general public, landowners and ministry staff.
Survey Data
There were no aerial surveys for moose in 2017 (Table 17). Due to poor snow conditions, a planned
survey in WMZ 67 was cancelled. In October 2017, the co-operative wildlife management survey app
was launched. Volunteers download the app to their smartphone and collect information on the
number of moose observed, age (adult or young), and sex (male or female). In addition to the app, a
paper survey form was also available. A total of 993 moose were observed. Herd structure within the
southern farmland landscape (B:C:C) was 75:100:81. A note of caution as this was the first year for the
app and there are a number of WMZs with only a few moose observations.
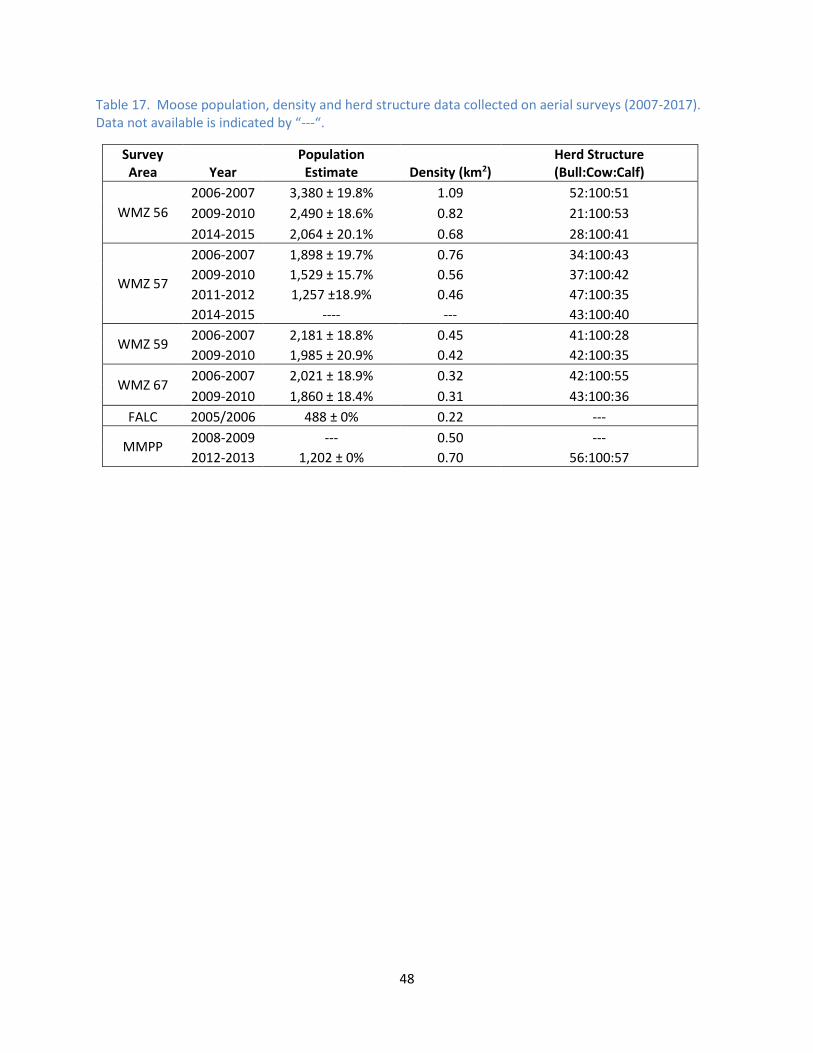
48
Table 17. Moose population, density and herd structure data collected on aerial surveys (2007-2017). Data not available is indicated by “---“.
Survey Area Year
Population Estimate Density (km2)
Herd Structure (Bull:Cow:Calf)
WMZ 56
2006-2007 3,380 ± 19.8% 1.09 52:100:51
2009-2010 2,490 ± 18.6% 0.82 21:100:53
2014-2015 2,064 ± 20.1% 0.68 28:100:41
WMZ 57
2006-2007 1,898 ± 19.7% 0.76 34:100:43
2009-2010 1,529 ± 15.7% 0.56 37:100:42
2011-2012 1,257 ±18.9% 0.46 47:100:35
2014-2015 ---- --- 43:100:40
WMZ 59 2006-2007 2,181 ± 18.8% 0.45 41:100:28
2009-2010 1,985 ± 20.9% 0.42 42:100:35
WMZ 67 2006-2007 2,021 ± 18.9% 0.32 42:100:55
2009-2010 1,860 ± 18.4% 0.31 43:100:36
FALC 2005/2006 488 ± 0% 0.22 ---
MMPP 2008-2009 --- 0.50 ---
2012-2013 1,202 ± 0% 0.70 56:100:57
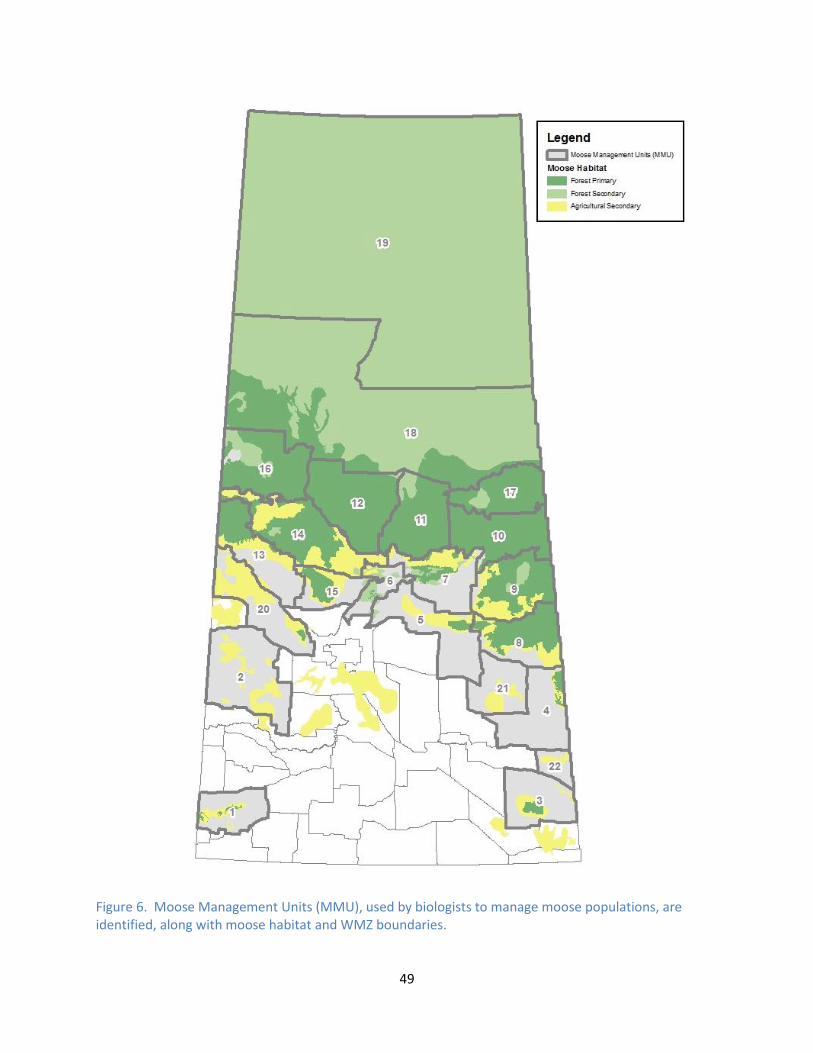
49
Figure 6. Moose Management Units (MMU), used by biologists to manage moose populations, are identified, along with moose habitat and WMZ boundaries.
50
Biological Sample Collections
Hunters and trappers have indicated to ministry staff that the moose population is declining in WMZs 56
and 57. In 2015, a disease prevalence/moose tissue sampling project was initiated in cooperation with
the Canadian Wildlife Health Cooperative (CWHC). This was the third year of the tissue collection study.
The project purpose is to look at disease prevalence with respect to several key diseases that affect
moose (meningeal worm, winter tick, and giant liver fluke). Between 2015 and 2017, a total of 26
samples were collected from draw hunters in WMZ 56 and 57. Tissue samples included hair, liver,
blood, feces and incisors.
General Overview
Moose in the boreal forest (WMZ 56-73) appear to be declining, and are below the long-term winter
average. Moose in the forest fringe (WMZ 48-55) are stable and slightly above the long-term winter
average. In both the parkland (WMZ 31-47) and farmland (WMZ 15-30), moose populations have
stabilized, with some WMZs showing a decreasing population due to liberal licence quotas in the past
several years. Isolated pockets of moose are located throughout the grassland (WMZ 1-14).
In 2008, concerns regarding conflicts with moose in southern agricultural wildlife management zones
reached a point where it was necessary to introduce moose hunting seasons in a number of zones in
order to reduce the moose population and the number of moose-human conflicts. Between 2010 and
2016, 23,799 moose licences were issued to hunters in WMZ 1-47, including Saskatoon WMZ and
Regina-Moose Jaw WMZ. Hunter success averaged 83 per cent over a five-year period (2012-2016).
A provincial moose management plan is under development. The goal of the plan is to sustainably
manage moose and their habitats in Saskatchewan. Moose will be managed as “northern” boreal
populations and “southern” agricultural populations. Management of moose within the broader
agricultural zone has to consider different issues than those considered for moose populations in the
northern forest. There are four main objectives in the plan with several “management actions”
described under each objective. The moose management plan should be available in 2019.
Winter tick (Dermacentor albipictus) loads throughout the province, were moderate to low during the
winter of 2016-17. The spring of 2017 had low to moderate tick-related mortality. There were no new
cases of meningeal worm (Parelaphostongylus tenuis) west of longitude 106° in 2017. Meningeal worm
continues to be of low concern for moose in the province.
Hunting Season Review Moose continue to be an important big game species in Saskatchewan and hunting opportunities
remained good in 2017. Several boreal wildlife management zones on the east side of the province saw
reduced draw quotas due to concerns over lower moose numbers in those zones. Residents have the
opportunity to apply for either-sex or antlerless licences through the big game draw. All hunters can
purchase regular “bull only” moose licences, while Canadian and non-resident hunters must purchase a
Guided Moose Licence and hunt with an outfitter. In 2017, licence sales were down a second year in a
row with 6,594 regular and 5,575 draw licences being sold, compared to the 7,221 regular and 5,572
draw licences sold in 2016 (Appendix A).
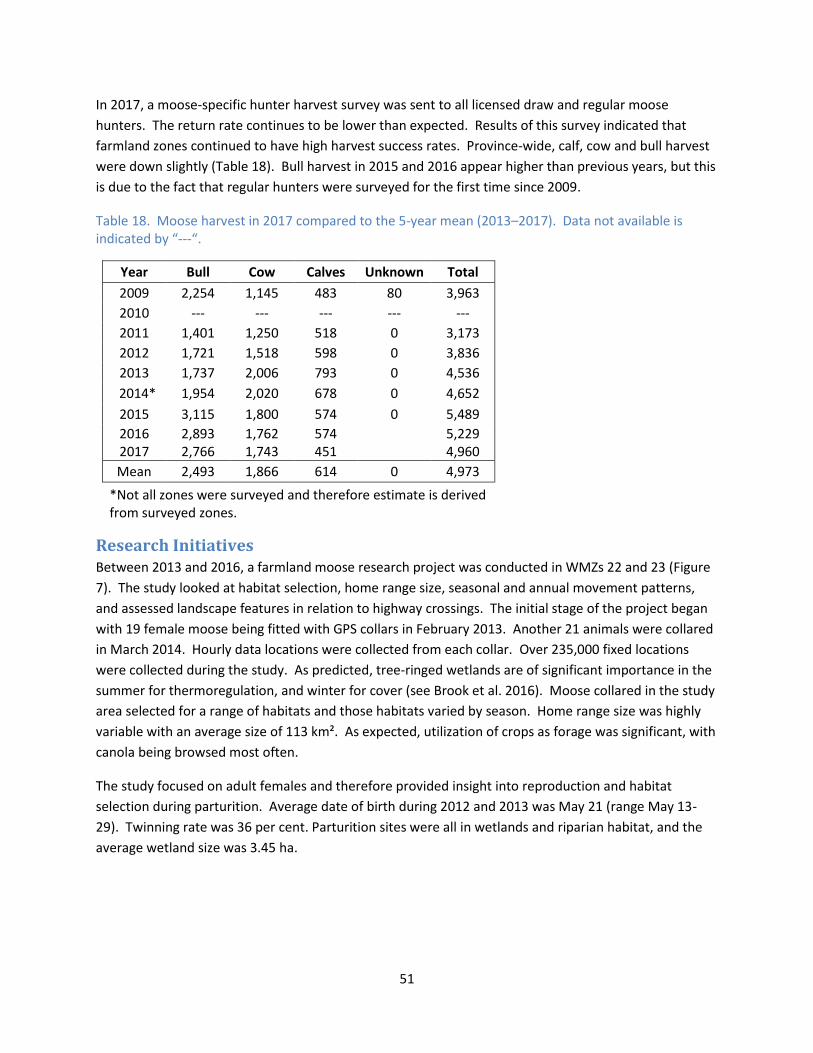
51
In 2017, a moose-specific hunter harvest survey was sent to all licensed draw and regular moose
hunters. The return rate continues to be lower than expected. Results of this survey indicated that
farmland zones continued to have high harvest success rates. Province-wide, calf, cow and bull harvest
were down slightly (Table 18). Bull harvest in 2015 and 2016 appear higher than previous years, but this
is due to the fact that regular hunters were surveyed for the first time since 2009.
Table 18. Moose harvest in 2017 compared to the 5-year mean (2013–2017). Data not available is indicated by “---“.
Year Bull Cow Calves Unknown Total
2009 2,254 1,145 483 80 3,963
2010 --- --- --- --- ---
2011 1,401 1,250 518 0 3,173
2012 1,721 1,518 598 0 3,836
2013 1,737 2,006 793 0 4,536
2014* 1,954 2,020 678 0 4,652
2015 3,115 1,800 574 0 5,489
2016 2017
2,893 2,766
1,762 1,743
574 451
5,229 4,960
Mean 2,493 1,866 614 0 4,973
*Not all zones were surveyed and therefore estimate is derived from surveyed zones.
Research Initiatives Between 2013 and 2016, a farmland moose research project was conducted in WMZs 22 and 23 (Figure
7). The study looked at habitat selection, home range size, seasonal and annual movement patterns,
and assessed landscape features in relation to highway crossings. The initial stage of the project began
with 19 female moose being fitted with GPS collars in February 2013. Another 21 animals were collared
in March 2014. Hourly data locations were collected from each collar. Over 235,000 fixed locations
were collected during the study. As predicted, tree-ringed wetlands are of significant importance in the
summer for thermoregulation, and winter for cover (see Brook et al. 2016). Moose collared in the study
area selected for a range of habitats and those habitats varied by season. Home range size was highly
variable with an average size of 113 km². As expected, utilization of crops as forage was significant, with
canola being browsed most often.
The study focused on adult females and therefore provided insight into reproduction and habitat
selection during parturition. Average date of birth during 2012 and 2013 was May 21 (range May 13-
29). Twinning rate was 36 per cent. Parturition sites were all in wetlands and riparian habitat, and the
average wetland size was 3.45 ha.
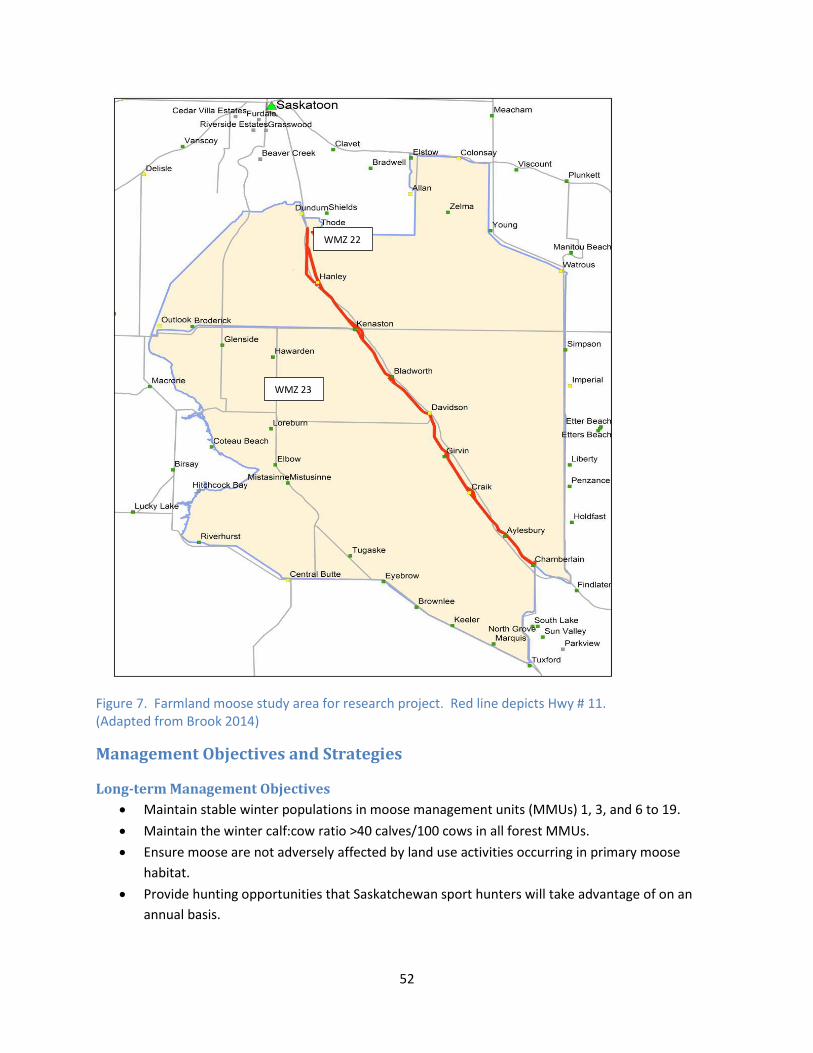
52
Figure 7. Farmland moose study area for research project. Red line depicts Hwy # 11. (Adapted from Brook 2014)
Management Objectives and Strategies
Long-term Management Objectives
Maintain stable winter populations in moose management units (MMUs) 1, 3, and 6 to 19.
Maintain the winter calf:cow ratio >40 calves/100 cows in all forest MMUs.
Ensure moose are not adversely affected by land use activities occurring in primary moose
habitat.
Provide hunting opportunities that Saskatchewan sport hunters will take advantage of on an
annual basis.
WMZ 22
WMZ 23
53
Manage moose population numbers in farmland MMUs and WMZs that recognize concerns of
local residents.
Increase communication of moose biology, ecology and management to the Saskatchewan
public.
Short-term Management Strategies
Update Management Plan for Moose (Alces alces) in Saskatchewan.
Continue aerial surveys (population density and herd structure) within primary moose habitat
on a four-year cycle.
Focus on access control when addressing forest harvesting plans within the boreal plain
ecozone.
Evaluate harvest strategies within primary and secondary habitat to ensure both conservation
and sustainable harvest levels are met.
Continue with antlerless moose seasons to assist with stabilizing moose populations in
agricultural WMZs.
Complete management objectives for moose in agricultural landscapes.
Additional Information
Most recent provincial species plan:
Arsenault, A. 2000. Status and management of moose (Alces alces) in Saskatchewan. Saskatchewan
Environment and Resource Management. Fish and Wildlife Technical Report 2000-01. 84pp.
For additional information, please contact:
Katie Rasmussen
Moose Manager
Fish, Wildlife and Lands Branch
Ministry of Environment
Unit 1- 101 Railway Place Meadow Lake, SK S9X 1X6
(306) 236-9819
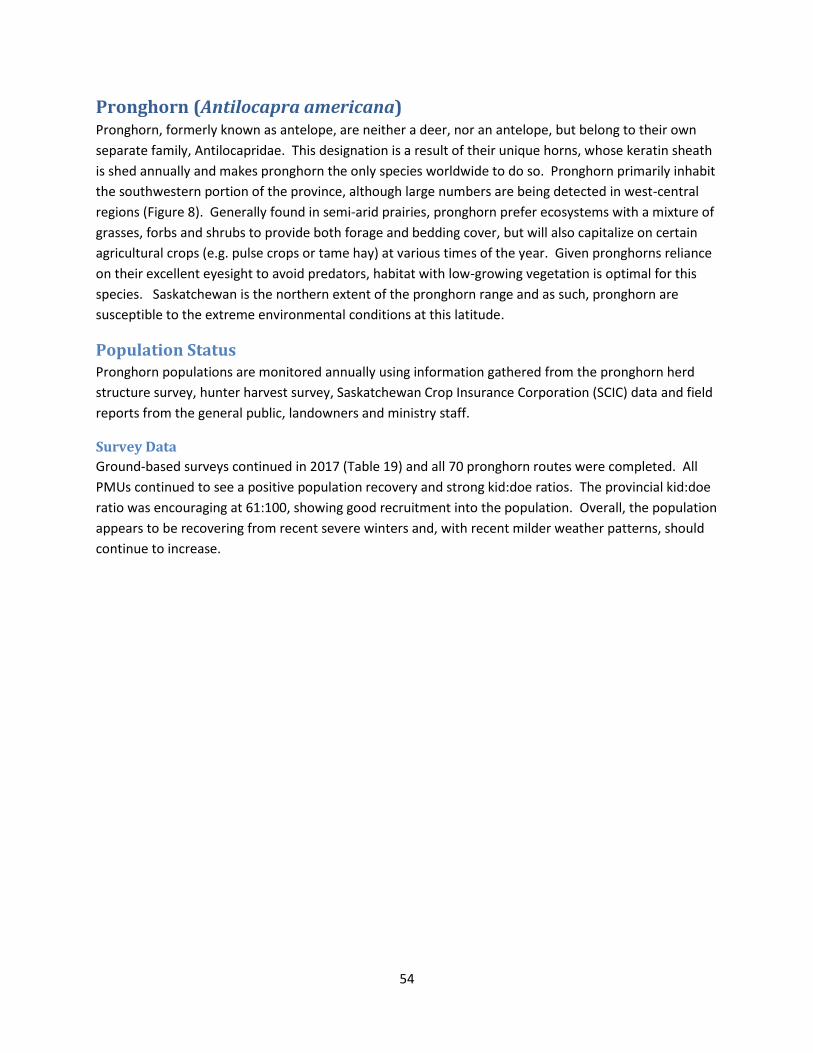
54
Pronghorn (Antilocapra americana) Pronghorn, formerly known as antelope, are neither a deer, nor an antelope, but belong to their own
separate family, Antilocapridae. This designation is a result of their unique horns, whose keratin sheath
is shed annually and makes pronghorn the only species worldwide to do so. Pronghorn primarily inhabit
the southwestern portion of the province, although large numbers are being detected in west-central
regions (Figure 8). Generally found in semi-arid prairies, pronghorn prefer ecosystems with a mixture of
grasses, forbs and shrubs to provide both forage and bedding cover, but will also capitalize on certain
agricultural crops (e.g. pulse crops or tame hay) at various times of the year. Given pronghorns reliance
on their excellent eyesight to avoid predators, habitat with low-growing vegetation is optimal for this
species. Saskatchewan is the northern extent of the pronghorn range and as such, pronghorn are
susceptible to the extreme environmental conditions at this latitude.
Population Status Pronghorn populations are monitored annually using information gathered from the pronghorn herd
structure survey, hunter harvest survey, Saskatchewan Crop Insurance Corporation (SCIC) data and field
reports from the general public, landowners and ministry staff.
Survey Data
Ground-based surveys continued in 2017 (Table 19) and all 70 pronghorn routes were completed. All
PMUs continued to see a positive population recovery and strong kid:doe ratios. The provincial kid:doe
ratio was encouraging at 61:100, showing good recruitment into the population. Overall, the population
appears to be recovering from recent severe winters and, with recent milder weather patterns, should
continue to increase.
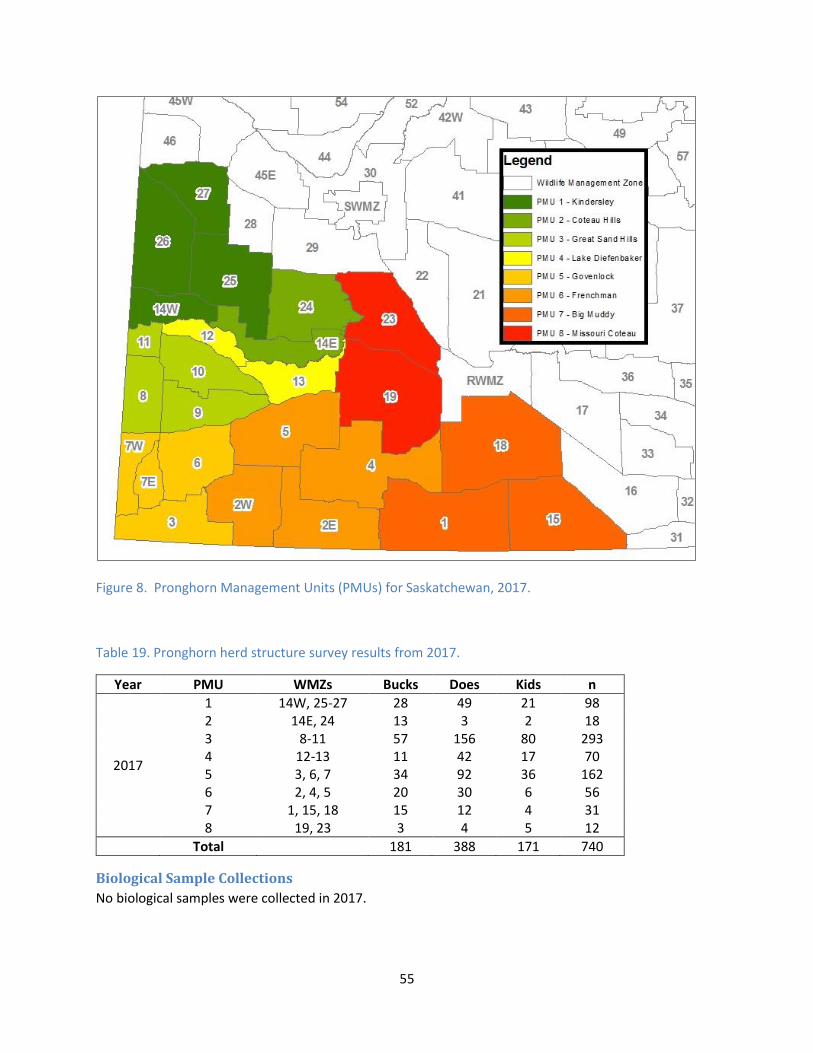
55
Figure 8. Pronghorn Management Units (PMUs) for Saskatchewan, 2017.
Table 19. Pronghorn herd structure survey results from 2017.
Year PMU WMZs Bucks Does Kids n
1 14W, 25-27 28 49 21 98 2 14E, 24 13 3 2 18 3 8-11 57 156 80 293
2017 4 12-13 11 42 17 70 5 3, 6, 7 34 92 36 162
6 2, 4, 5 20 30 6 56 7 1, 15, 18 15 12 4 31 8 19, 23 3 4 5 12
Total 181 388 171 740
Biological Sample Collections
No biological samples were collected in 2017.
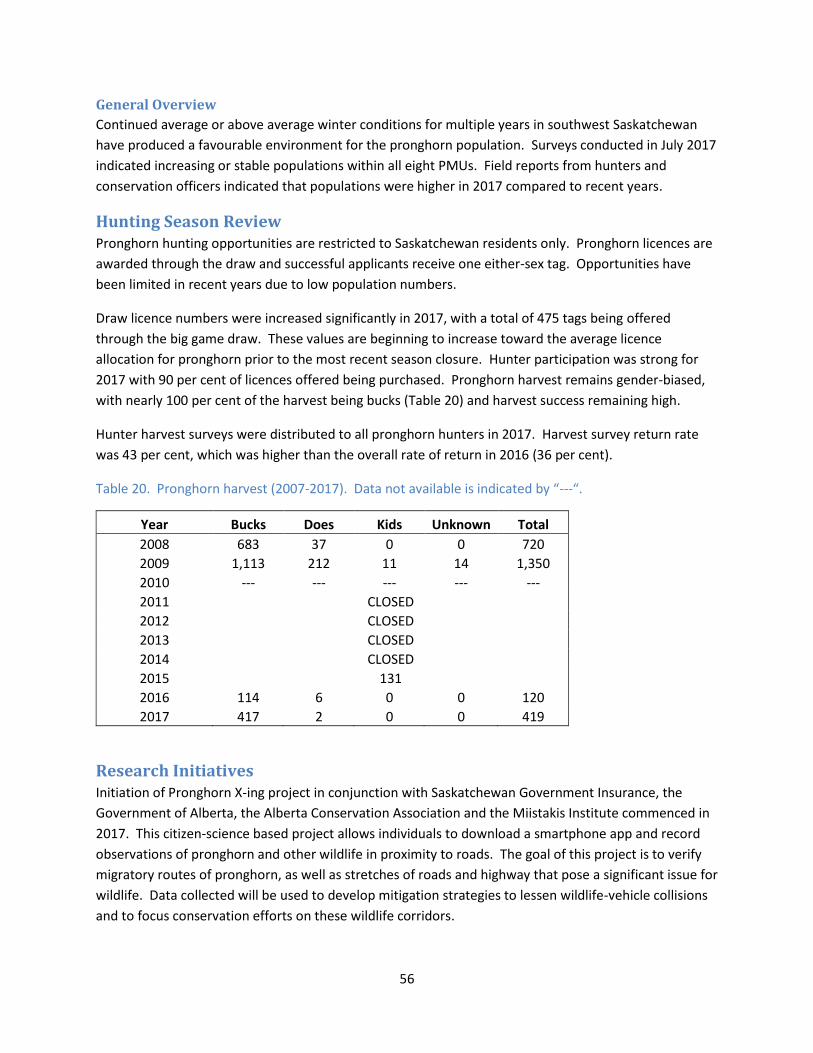
56
General Overview
Continued average or above average winter conditions for multiple years in southwest Saskatchewan
have produced a favourable environment for the pronghorn population. Surveys conducted in July 2017
indicated increasing or stable populations within all eight PMUs. Field reports from hunters and
conservation officers indicated that populations were higher in 2017 compared to recent years.
Hunting Season Review Pronghorn hunting opportunities are restricted to Saskatchewan residents only. Pronghorn licences are
awarded through the draw and successful applicants receive one either-sex tag. Opportunities have
been limited in recent years due to low population numbers.
Draw licence numbers were increased significantly in 2017, with a total of 475 tags being offered
through the big game draw. These values are beginning to increase toward the average licence
allocation for pronghorn prior to the most recent season closure. Hunter participation was strong for
2017 with 90 per cent of licences offered being purchased. Pronghorn harvest remains gender-biased,
with nearly 100 per cent of the harvest being bucks (Table 20) and harvest success remaining high.
Hunter harvest surveys were distributed to all pronghorn hunters in 2017. Harvest survey return rate
was 43 per cent, which was higher than the overall rate of return in 2016 (36 per cent).
Table 20. Pronghorn harvest (2007-2017). Data not available is indicated by “---“.
Year Bucks Does Kids Unknown Total
2008 683 37 0 0 720
2009 1,113 212 11 14 1,350
2010 --- --- --- --- ---
2011 CLOSED
2012 CLOSED
2013 CLOSED
2014 CLOSED
2015 131
2016 114 6 0 0 120
2017 417 2 0 0 419
Research Initiatives Initiation of Pronghorn X-ing project in conjunction with Saskatchewan Government Insurance, the
Government of Alberta, the Alberta Conservation Association and the Miistakis Institute commenced in
2017. This citizen-science based project allows individuals to download a smartphone app and record
observations of pronghorn and other wildlife in proximity to roads. The goal of this project is to verify
migratory routes of pronghorn, as well as stretches of roads and highway that pose a significant issue for
wildlife. Data collected will be used to develop mitigation strategies to lessen wildlife-vehicle collisions
and to focus conservation efforts on these wildlife corridors.
57
Management Objectives and Strategies
Long-term Management Objectives
• Update the Management Plan for Pronghorn in Saskatchewan to provide guidance and structure
to management of pronghorn in the future.
• Survey pronghorn populations annually to obtain current data to inform management decisions.
Short-term Management Strategies
Increase pronghorn populations and harvest opportunities within the confines of social
tolerance.
Promote the hunter harvest survey to hunters to increase response rate from current levels.
Additional Information
Most recent provincial species plan:
Arsenault, A. 2007. Management strategy for pronghorn (Antilocapra americana) in Saskatchewan.
Saskatchewan Ministry of Environment. Fish and Wildlife Technical Report 2008-01. 34pp.
For additional information, please contact:
Todd Whiklo
Pronghorn Manager
Fish, Wildlife and Lands Branch, Ministry of Environment
350 Cheadle St. W. Swift Current, SK S9H 4G3
(306) 778-8262
58
Black Bear (Ursus americanus) Black bears are a sought-after prize by resident and non-resident hunters, alike. Black bears can live in a
variety of habitats, but generally prefer the dense woods of the mixed-wood or boreal forest. Requiring
significant amounts of food, particularly in the fall when building up fat reserves to survive hibernation,
bears will utilize habitat with thick underbrush of berry and nut-bearing plants, which are often found
along valleys and other waterways. Black bears will also utilize man-made food sources and can often
be found feeding in garbage dumps and campsites. The black bear range extends from throughout the
north southward in the Parkland ecoregion as far south as the eastern Qu’Appelle River system in
Saskatchewan.
Population Status Saskatchewan black bear populations are monitored based primarily on data from the hunter harvest
survey, the current version of which was initiated in 2015. These data are supplemented by reports
from hunters, ministry staff and from crop and bee-yard damage compensation data provided by
Saskatchewan Crop Insurance Corporation.
Survey Data
Hunter harvest survey data for Saskatchewan and Canadian residents are presented in Table 21 and 22.
Harvest data from non-residents of Canada are summarized in Table 23. The hunter harvest response
rate for Saskatchewan resident bear hunters in 2017 was 33 per cent up from 29 per cent in 2016 and 16
per cent in 2015. The harvest response rate for Canadian residents was 17 per cent compared with 18
per cent in 2016 and 14 per cent in 2015.
Of the 1,320 licensed resident bear hunters who responded to the hunter harvest survey, 267 (20 per
cent) did not hunt bear in 2017; the same percentage as in 2016. If extrapolated to the total number of
resident licensed bear hunters in 2017, this would suggest that 792 individuals purchased bear licences
but did not hunt bear. Of the 1,053 respondents who did hunt bear 254 harvested an animal indicating
a harvest rate of 24 per cent down from 25 per cent in 2016 and 33 per cent in 2015.
Results from the Annual Status of Furbearers Survey indicate particularly high bear populations in the
Northern Fur Conservation Area in 2016-17. Data from 2017-18 is not yet available.
Biological Sample Collections
Saskatchewan currently has no biological sampling program for black bear.
General Overview
Based on anecdotal evidence collected during the period it appears that bear populations were
generally stable or increasing. Increases were mainly reported in the east-central and southeast areas.
This general population trend is consistent with most jurisdictions across the North American black bear
range.
Hunting Season Review Black bears in Saskatchewan are hunted under a regular licence during spring (April to June) and fall
(August to October) seasons. Each hunter, regardless of residency, may take one bear of either sex, with
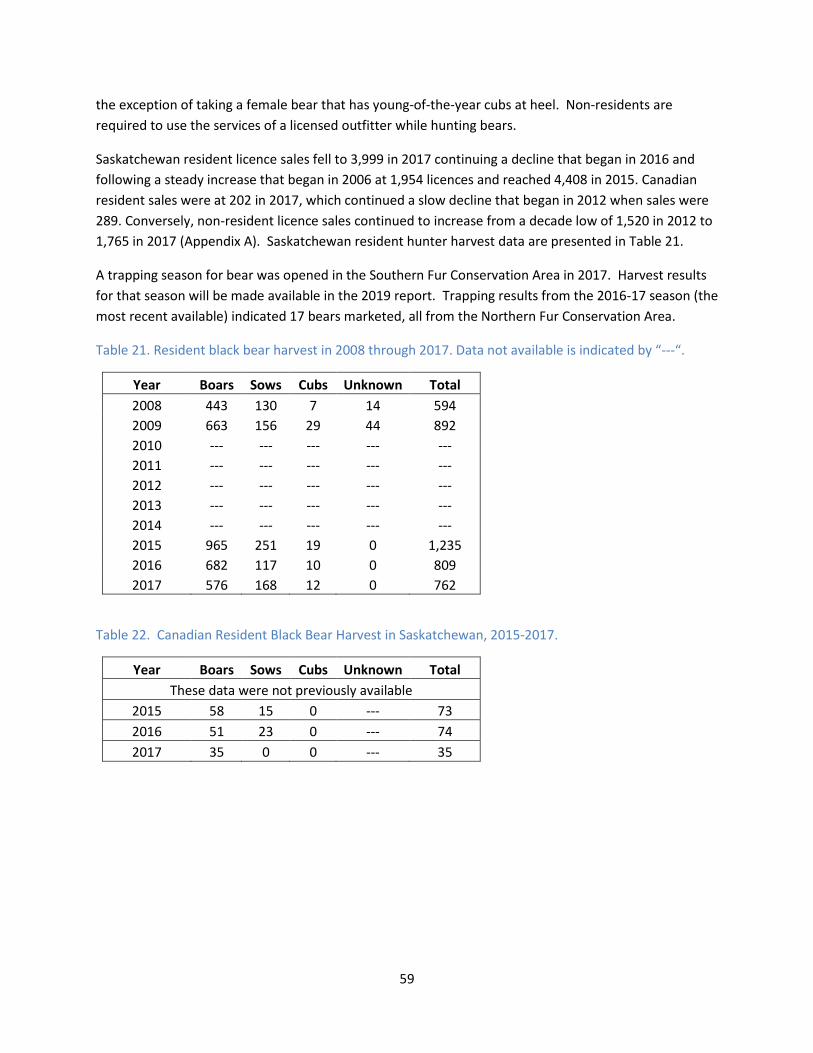
59
the exception of taking a female bear that has young-of-the-year cubs at heel. Non-residents are
required to use the services of a licensed outfitter while hunting bears.
Saskatchewan resident licence sales fell to 3,999 in 2017 continuing a decline that began in 2016 and
following a steady increase that began in 2006 at 1,954 licences and reached 4,408 in 2015. Canadian
resident sales were at 202 in 2017, which continued a slow decline that began in 2012 when sales were
289. Conversely, non-resident licence sales continued to increase from a decade low of 1,520 in 2012 to
1,765 in 2017 (Appendix A). Saskatchewan resident hunter harvest data are presented in Table 21.
A trapping season for bear was opened in the Southern Fur Conservation Area in 2017. Harvest results
for that season will be made available in the 2019 report. Trapping results from the 2016-17 season (the
most recent available) indicated 17 bears marketed, all from the Northern Fur Conservation Area.
Table 21. Resident black bear harvest in 2008 through 2017. Data not available is indicated by “---“.
Year Boars Sows Cubs Unknown Total
2008 443 130 7 14 594
2009 663 156 29 44 892
2010 --- --- --- --- ---
2011 --- --- --- --- ---
2012 --- --- --- --- ---
2013 --- --- --- --- ---
2014 --- --- --- --- ---
2015 965 251 19 0 1,235
2016 682 117 10 0 809
2017 576 168 12 0 762
Table 22. Canadian Resident Black Bear Harvest in Saskatchewan, 2015-2017.
Year Boars Sows Cubs Unknown Total
These data were not previously available
2015 58 15 0 --- 73
2016 51 23 0 --- 74
2017 35 0 0 --- 35
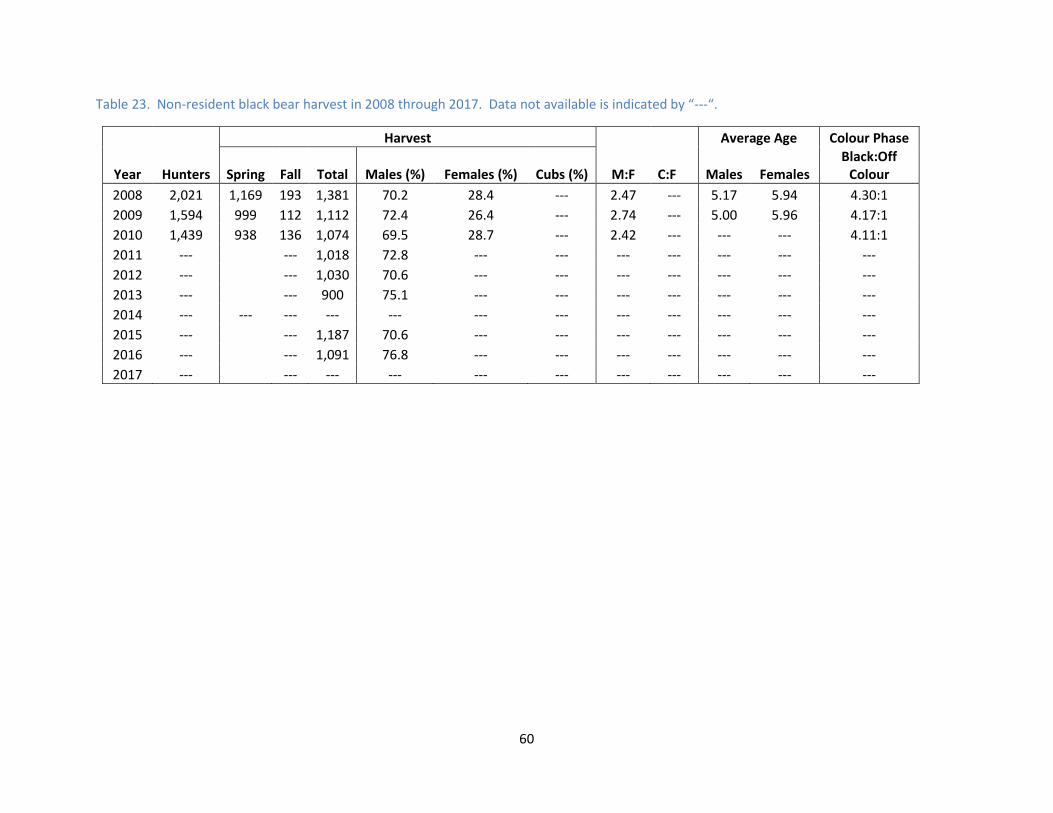
60
Table 23. Non-resident black bear harvest in 2008 through 2017. Data not available is indicated by “---“.
Harvest Average Age Colour Phase
Year Hunters Spring Fall Total Males (%) Females (%) Cubs (%)
M:F C:F Males Females Black:Off
Colour
2008 2,021 1,169 193 1,381 70.2 28.4 --- 2.47 --- 5.17 5.94 4.30:1
2009 1,594 999 112 1,112 72.4 26.4 --- 2.74 --- 5.00 5.96 4.17:1
2010 1,439 938 136 1,074 69.5 28.7 --- 2.42 --- --- --- 4.11:1
2011 --- --- 1,018 72.8 --- --- --- --- --- --- ---
2012 --- --- 1,030 70.6 --- --- --- --- --- --- ---
2013 --- --- 900 75.1 --- --- --- --- --- --- ---
2014 --- --- --- --- --- --- --- --- --- --- --- ---
2015 --- --- 1,187 70.6 --- --- --- --- --- --- ---
2016 --- --- 1,091 76.8 --- --- --- --- --- --- ---
2017 --- --- --- --- --- --- --- --- --- --- ---
61
Research Initiatives Black bear research was initiated in May 2016 as a part of a larger project studying woodland caribou in
Saskatchewan’s Northern Boreal Shield. Over the first year, more than 20 bears across northeastern
Saskatchewan were fitted with GPS satellite collars designed to provide spatial location data. The
project is ongoing, with research focused on understanding bear habitat selection patterns in the Shield,
and in particular, how caribou respond to bear space-use patterns.
Management Objectives and Strategies
Long-term Management Objectives
Continually define the provincial range of black bears.
Define bear habitat across the province.
Assess black bear population trend.
Monitor hunter harvest and other related mortality.
Create long-term management units.
Short-term Management Strategies
Assess population status and trend by monitoring trends in harvest rates from the hunter
harvest survey and supporting or encouraging dedicated research on bear populations.
Compile and map observations of black bears outside of their existing normal range in order to
document the extent of range expansion.
Design management units based on regional differences in habitat quality, hunting popularity,
and human land use.
Additional Information
Most recent provincial species plan: None available.
For additional information, please contact:
Mike Gollop
Black Bear Manager
Fish and Wildlife Branch
Ministry of Environment
102-112 Research Dr. Saskatoon, SK S7N 3R3
(306) 933-5767
62
Barren-ground Caribou (Rangifer tarandus groenlandicus) Barren-ground caribou is a subspecies of caribou that range between Saskatchewan, Nunavut and the
Northwest Territories. They are well-adapted to the northern regions of the continent, with large,
concave hooves that function well to support the animal in deep snow and are efficient scoops when the
caribou paws through the snow to uncover its primary food source, lichens. Although specializing on
lichens in the winter, they shift to green vegetation with higher protein content come spring. Disease,
accidents, wolves and humans are the major sources of mortality for caribou. Disturbance, habitat loss
and alteration are also important limiting factors on barren-ground caribou populations over the long-
term.
The ranges of two barren-ground caribou herds commonly extend into Saskatchewan, the Beverly and
Qamanirjuaq herds. Both herds calve in Nunavut and portions of the herds migrate into northern
Saskatchewan during the winter months (November to March). The Beverly herd typically migrates into
northwestern and north central Saskatchewan, sometimes migrating as far south as Carswell Lake and
Cree Lake. The Qamanirjuaq Herd migrates into north eastern Saskatchewan from the east, sometimes
ranging as far south as the Churchill River. There appears to have been a gradual retraction northward
over the past 50 years, especially in the western and central parts of their Saskatchewan range. See
map of range (Figure 9).
Population Status The monitoring of barren-ground caribou populations is informed by western scientific, local and
Indigenous Traditional Knowledge. Contributors include Indigenous people living in caribou range, the
Beverly and Qamanirjuaq Caribou Management Board (BQCMB) and professionals working for the
various governments presiding over the jurisdictions caribou use. The results of monitoring are
documented by the BQCMB and other researchers in the BQCMB Management Plan, land use plans and
protected area strategies.
Population size for each herd is estimated from data collected by June calving ground and spring and fall
composition surveys. An effort is made to estimate recruitment of calves into the population each year
from spring composition surveys conducted in April. Calving grounds are delineated by reconnaissance
flights yearly if possible, cow:calf ratios estimated from the sample. Calving grounds are stratified into
high, medium and low concentrations of calving females prior to calving ground population surveys
undertaken at longer intervals (i.e. every 2-6 years). Aerial photography of caribou on the calving
grounds and visual surveys using double observers in aircraft flying transect strips at different widths
depending on prior stratification are the principal methods used to estimate the number of breeding
females in the population.
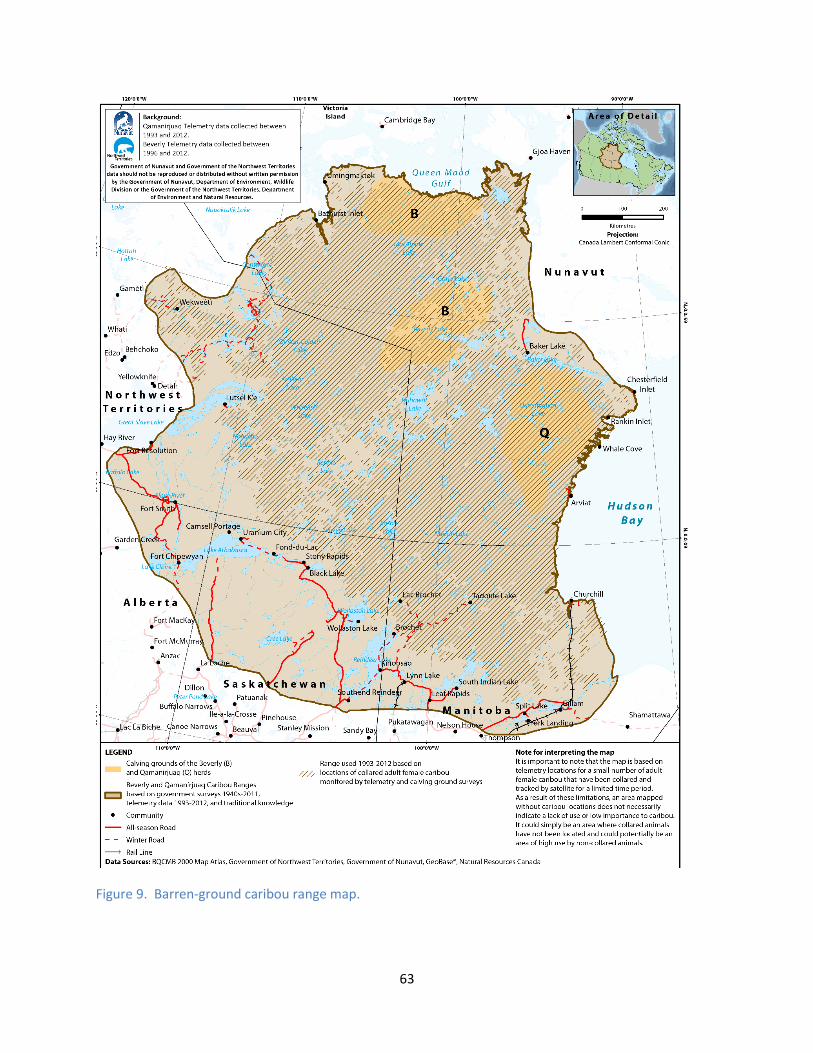
63
Figure 9. Barren-ground caribou range map.
64
Up to 50 caribou are collared in each population that includes adults of both sexes, but predominately
females. Satellite tracking of collared caribou is used to track their movements, map their distribution,
estimate adult female and male mortality, locate concentrations of caribou for composition and calving
ground delineation/reconnaissance surveys, and to identify important habitats (i.e. migration corridors,
water crossings, calving grounds, post-calving areas).
Survey Data
The Qamanirjuaq Herd was most recently surveyed for population size in 2017, but results have not
been released at this time. There has been an estimated decline of approximately two per cent
between survey years 2008, 2014 and 2017. In general, the 2017 survey has shown slightly more
females than in 2014 and this is qualified by the observation that collared females from a more
northerly population appeared to be mixing along the northern edge of the Qamanirjuaq calving
grounds which means that there could be an over-estimate of Q females. Recruitment surveys
conducted on this herd since 1998 have shown an overall decline in recruitment and at levels well below
the comfort level of 30 calves:100 cows. This represents the overall trend in recruitment values to
below 20 calves:100 cows. It appears that pregnancy rate has also declined probably due to nutritional
stress of the breeding females.
A population survey of Beverly – Ahiak calving ground complex was completed in June 2011 along the
Queen Maud Gulf (QMG) coast of Nunavut (Table 24). As part of this survey the traditional Beverly
calving ground and QMG coast were delineated by widely spaced transects to locate calving caribou and
stratify the calving grounds by density. Spring recruitment and calving ground reconnaissance surveys
were completed in 2012, 2013 and 2014. Results of these surveys indicated few to no calving caribou on
the traditional Beverly calving grounds, and similar distribution and densities of calving caribou and
calves on the Queen Maud Gulf calving ground.
Biological Sample Collections
No biological data from this time period is currently available.
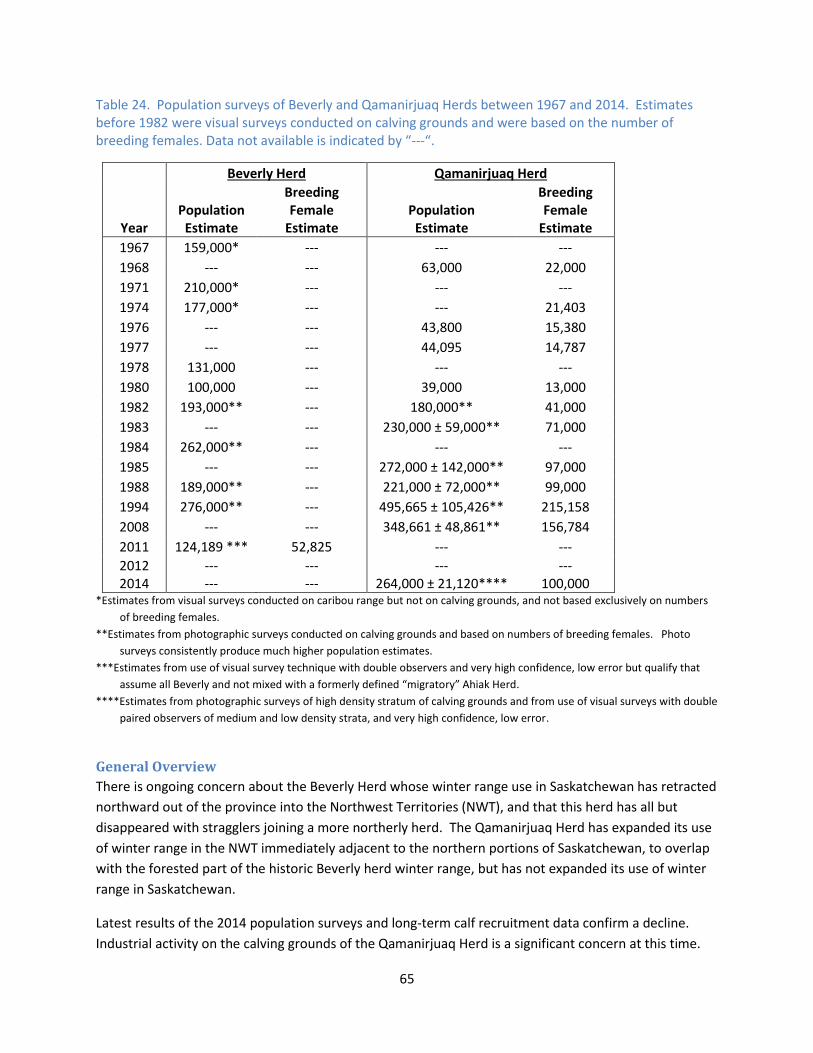
65
Table 24. Population surveys of Beverly and Qamanirjuaq Herds between 1967 and 2014. Estimates before 1982 were visual surveys conducted on calving grounds and were based on the number of breeding females. Data not available is indicated by “---“.
Beverly Herd Qamanirjuaq Herd
Year Population
Estimate
Breeding Female
Estimate Population
Estimate
Breeding Female
Estimate
1967 159,000* --- --- ---
1968 --- --- 63,000 22,000
1971 210,000* --- --- ---
1974 177,000* --- --- 21,403
1976 --- --- 43,800 15,380
1977 --- --- 44,095 14,787
1978 131,000 --- --- ---
1980 100,000 --- 39,000 13,000
1982 193,000** --- 180,000** 41,000
1983 --- --- 230,000 ± 59,000** 71,000
1984 262,000** --- --- ---
1985 --- --- 272,000 ± 142,000** 97,000
1988 189,000** --- 221,000 ± 72,000** 99,000
1994 276,000** --- 495,665 ± 105,426** 215,158
2008 --- --- 348,661 ± 48,861** 156,784
2011 124,189 *** 52,825 --- ---
2012 2014
--- ---
--- ---
--- 264,000 ± 21,120****
--- 100,000
*Estimates from visual surveys conducted on caribou range but not on calving grounds, and not based exclusively on numbers
of breeding females.
**Estimates from photographic surveys conducted on calving grounds and based on numbers of breeding females. Photo
surveys consistently produce much higher population estimates.
***Estimates from use of visual survey technique with double observers and very high confidence, low error but qualify that
assume all Beverly and not mixed with a formerly defined “migratory” Ahiak Herd.
****Estimates from photographic surveys of high density stratum of calving grounds and from use of visual surveys with double
paired observers of medium and low density strata, and very high confidence, low error.
General Overview
There is ongoing concern about the Beverly Herd whose winter range use in Saskatchewan has retracted
northward out of the province into the Northwest Territories (NWT), and that this herd has all but
disappeared with stragglers joining a more northerly herd. The Qamanirjuaq Herd has expanded its use
of winter range in the NWT immediately adjacent to the northern portions of Saskatchewan, to overlap
with the forested part of the historic Beverly herd winter range, but has not expanded its use of winter
range in Saskatchewan.
Latest results of the 2014 population surveys and long-term calf recruitment data confirm a decline.
Industrial activity on the calving grounds of the Qamanirjuaq Herd is a significant concern at this time.

66
Approvals for infrastructure-rich exploration establishments have occurred on occupied portions of the
calving grounds despite appeals from the BQCMB and grassroots organizations not to approve such
activity. In addition, a crash in the caribou population on Baffin Island has led to more hunting of
mainland arctic caribou herds including the Qamanirjuaq Herd. Internet sales have increased
tremendously whereby hunters from the mainland hunt caribou for re-sale to people requesting meat
over the internet on Baffin Island. This is legal in Nunavut and NWT and is called inter-settlement trade.
The state of Saskatchewan’s portion of caribou winter range continues to be a major source of concern
for the BQCMB and caribou-using peoples from northern Saskatchewan. Much of the range has
succumbed to forest fire in recent decades, setting back succession to the mature forest states
preferred by caribou. This is likely contributing to range retraction, in combination with the increase in
human activity in the Athabasca, Cree Lake and Wollaston Lakes regions in recent decades. Caribou
were present in the province in the winter months of 2017, but not earlier in the year (fall 2016).
Hunting Season Review Only permanent residents of WMZ 76 may purchase a licence to hunt barren-ground caribou. They are
entitled to purchase a maximum of two either-sex licenses. A total of 10 licenses were purchased in
2017 and 16 caribou were harvested in the province. (Appendix A).
Barren-ground caribou are highly valued by several northern native cultures and continue to be their
primary food source, which they harvest under Treaty or Métis rights. Across the range, the estimated
value of the harvest is $20 million annually (InterGroup Consultants Ltd. 2013). Data on subsistence
harvest is not presently collected, but in 2015 subsistence hunters were thought to be numerous,
coming mainly from Wollaston, Black Lake and Fond Du Lac and some additional hunters from Stony
Rapids, Southend, Stanley Mission, Uranium City, Fort Chipewyan and Grandmother’s Bay. Harvest
pressure is often higher than usual in years when caribou migrate close to communities.
Harvest Monitoring A partnership was initiated between the Ministry of Environment, Prince Albert Grand Council (PAGC)
and GNWT in 2009 to undertake community-based monitoring in the Athabasca communities, part of
which was intended to document harvest. Tina Giroux (ADNDC) was the biologist hired to co-ordinate
the monitoring and began a program to have harvest monitored by the communities themselves and
results shared based on approval by the range communities (Athabasca Denesuline). The partner
named as PAGC changed to Athabasca Denesuline Né Né Land Corporation (ADNLC). The ministry
pulled out of the partnership in 2012 and GNWT in 2016. A data sharing agreement between ADNLC
and the BQCMB was completed and signed off in November 2017. Tina Giroux set a target of getting
100 hunters involved in harvest reporting from each of the communities and reached that target in
2017. She believes this will account for 90 per cent or better of the harvest each year.
Within the past several years, conservation officers have patrolled in the Wollaston Lake, Black Lake and
Fond Du Lac areas to check hunter kills for signs of wastage where front quarters of animals were
sometimes left behind, and/or other portions of edible meat not retrieved before scavengers made it
unsuitable. The officers have reported non-retrieval of caribou at varying levels from year to year.
67
Based on their reports, it is estimated that approximately 10 per cent of hunted caribou are not
retrieved. This is lower than estimated through an educated guess by the BQCMB (i.e. 25 per cent).
The Beverly and Qamanirjuaq herds are managed with advisement from the BQCMB, while the Bathurst
and Ahiak herds are managed through Territorial processes. The BQCMB consists of 13 members from
the Northwest Territories, Nunavut, Manitoba, Saskatchewan, and Indian and Northern Affairs Canada.
Eight of those members represent aboriginal communities on the range.
Research Initiatives The ministry was involved in an advisory capacity with some research initiatives conducted by the
BQCMB during this time period, including harvest monitoring, herd vulnerability assessments,
recruitment and calving ground delineation surveys.
Management Objectives and Strategies The BQCMB produced and updated the management plan for the Beverly and Qamanirjuaq herds. Tim
Trottier along with one community representative (Dennis Larocque) participated in revising the plan to
ensure that it meets ministry expectations. Saskatchewan has adopted this plan which can be found on
the BQCMB website. Action plans are directed at maintaining and monitoring healthy, sustainable
populations at levels adequate for continued subsistence harvest and other uses, if herd size allows,
while protecting important caribou habitat, such as calving grounds, from human disturbance.
Long-term Management Objectives
Management of these herds is based on the management plan produced by the Beverly and Qamanirjuaq
Caribou Management Board. Thirty-four objectives and their actions are divided among nine goals. The
following are goals from that plan (Beverly and Qamanirjuaq Caribou Management Board 2005) are:
To conserve the Beverly and Qamanirjuaq Herds in a co-operative manner.
To strengthen support for caribou conservation.
To increase knowledge of barren-ground caribou and the caribou-human system.
To monitor caribou population status over time.
To monitor the harvest of caribou.
To maintain the Beverly and Qamanirjuaq Herds within their natural range of abundance.
To maintain adequate amounts of high-quality habitat.
To manage for the sustainable use of caribou.
To manage human land use in a way that protects Beverly and Qamanirjuaq caribou and their
habitats.
Short-term Management Strategies
The following are strategies taken from those in the BQCMB management plan that the ministry is best
able to act upon during this period.
Use all forms of knowledge, including Local and Traditional Knowledge (Aboriginal Traditional Knowledge/Inuit Qaujimajatuqangit-IQ) and scientific knowledge.

68
Develop additional ways for residents of caribou range communities to be involved in
monitoring and management actions.
Maintain and enhance the profile of the BQCMB and caribou issues in range communities.
Increase awareness of caribou issues and the BQCMB.
Increase knowledge of land use on the range and impacts on caribou and their habitats.
Secure funding to adequately monitor both herds.
Undertake harvest monitoring.
Develop and apply a technique for estimating harvest levels.
Re-affirm geographic and demographic boundaries for the herds.
Strive for protection of key habitats important to caribou.
Identify and strive for sustainable hunting practices.
Monitor and assess the impacts of human land use on habitats.
Describe and evaluate the impact of new and existing roads accessing caribou habitat.
Support and contribute to land use plans, and encourage land use planning across the range.
Screen key land use proposals for potential effects on caribou and range.
Provide guidance on development proposals and environmental assessments where there are potential impacts on caribou.
Additional Information
Most recent provincial species plan: Based on the Beverly and Qamanirjuaq Caribou Management Plan
(www.arctic-caribou.com).
For additional information, please contact:
Tim Trottier
Barren-ground Caribou Manager
Fish, Wildlife and Lands Branch
Ministry of Environment
1328 La Ronge Ave. La Ronge, SK S0J 1L0
(306) 425-4237
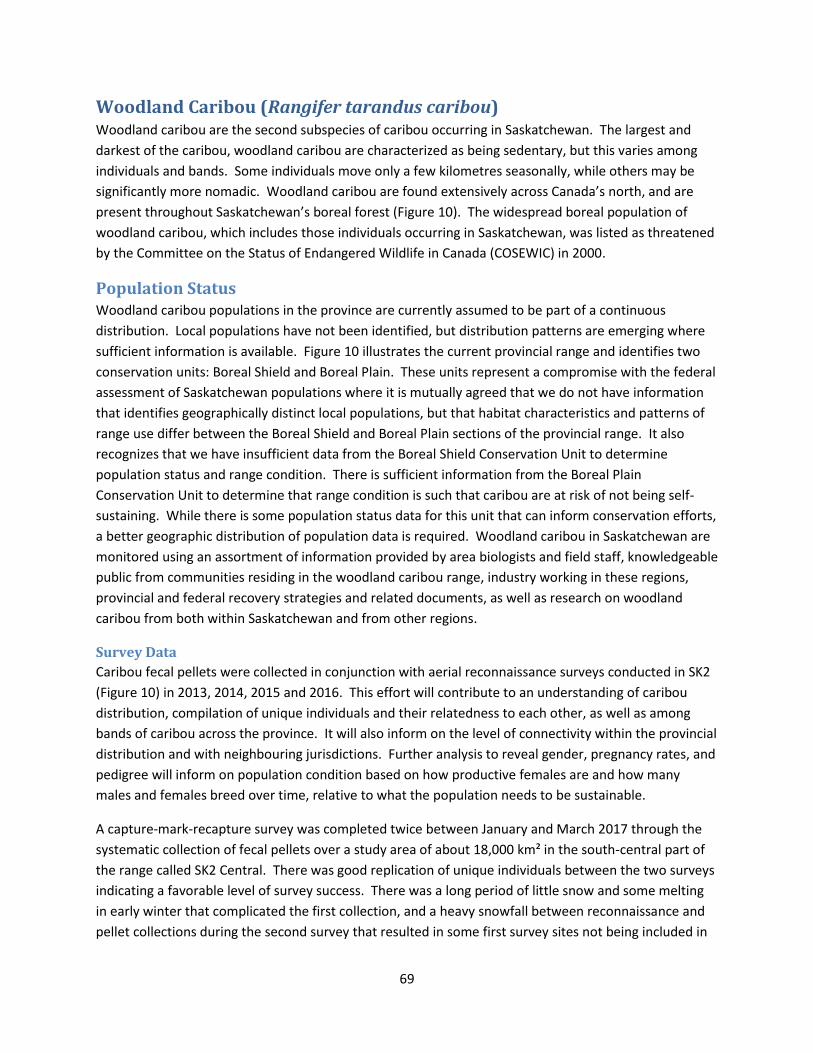
69
Woodland Caribou (Rangifer tarandus caribou) Woodland caribou are the second subspecies of caribou occurring in Saskatchewan. The largest and
darkest of the caribou, woodland caribou are characterized as being sedentary, but this varies among
individuals and bands. Some individuals move only a few kilometres seasonally, while others may be
significantly more nomadic. Woodland caribou are found extensively across Canada’s north, and are
present throughout Saskatchewan’s boreal forest (Figure 10). The widespread boreal population of
woodland caribou, which includes those individuals occurring in Saskatchewan, was listed as threatened
by the Committee on the Status of Endangered Wildlife in Canada (COSEWIC) in 2000.
Population Status Woodland caribou populations in the province are currently assumed to be part of a continuous
distribution. Local populations have not been identified, but distribution patterns are emerging where
sufficient information is available. Figure 10 illustrates the current provincial range and identifies two
conservation units: Boreal Shield and Boreal Plain. These units represent a compromise with the federal
assessment of Saskatchewan populations where it is mutually agreed that we do not have information
that identifies geographically distinct local populations, but that habitat characteristics and patterns of
range use differ between the Boreal Shield and Boreal Plain sections of the provincial range. It also
recognizes that we have insufficient data from the Boreal Shield Conservation Unit to determine
population status and range condition. There is sufficient information from the Boreal Plain
Conservation Unit to determine that range condition is such that caribou are at risk of not being self-
sustaining. While there is some population status data for this unit that can inform conservation efforts,
a better geographic distribution of population data is required. Woodland caribou in Saskatchewan are
monitored using an assortment of information provided by area biologists and field staff, knowledgeable
public from communities residing in the woodland caribou range, industry working in these regions,
provincial and federal recovery strategies and related documents, as well as research on woodland
caribou from both within Saskatchewan and from other regions.
Survey Data
Caribou fecal pellets were collected in conjunction with aerial reconnaissance surveys conducted in SK2
(Figure 10) in 2013, 2014, 2015 and 2016. This effort will contribute to an understanding of caribou
distribution, compilation of unique individuals and their relatedness to each other, as well as among
bands of caribou across the province. It will also inform on the level of connectivity within the provincial
distribution and with neighbouring jurisdictions. Further analysis to reveal gender, pregnancy rates, and
pedigree will inform on population condition based on how productive females are and how many
males and females breed over time, relative to what the population needs to be sustainable.
A capture-mark-recapture survey was completed twice between January and March 2017 through the
systematic collection of fecal pellets over a study area of about 18,000 km² in the south-central part of
the range called SK2 Central. There was good replication of unique individuals between the two surveys
indicating a favorable level of survey success. There was a long period of little snow and some melting
in early winter that complicated the first collection, and a heavy snowfall between reconnaissance and
pellet collections during the second survey that resulted in some first survey sites not being included in
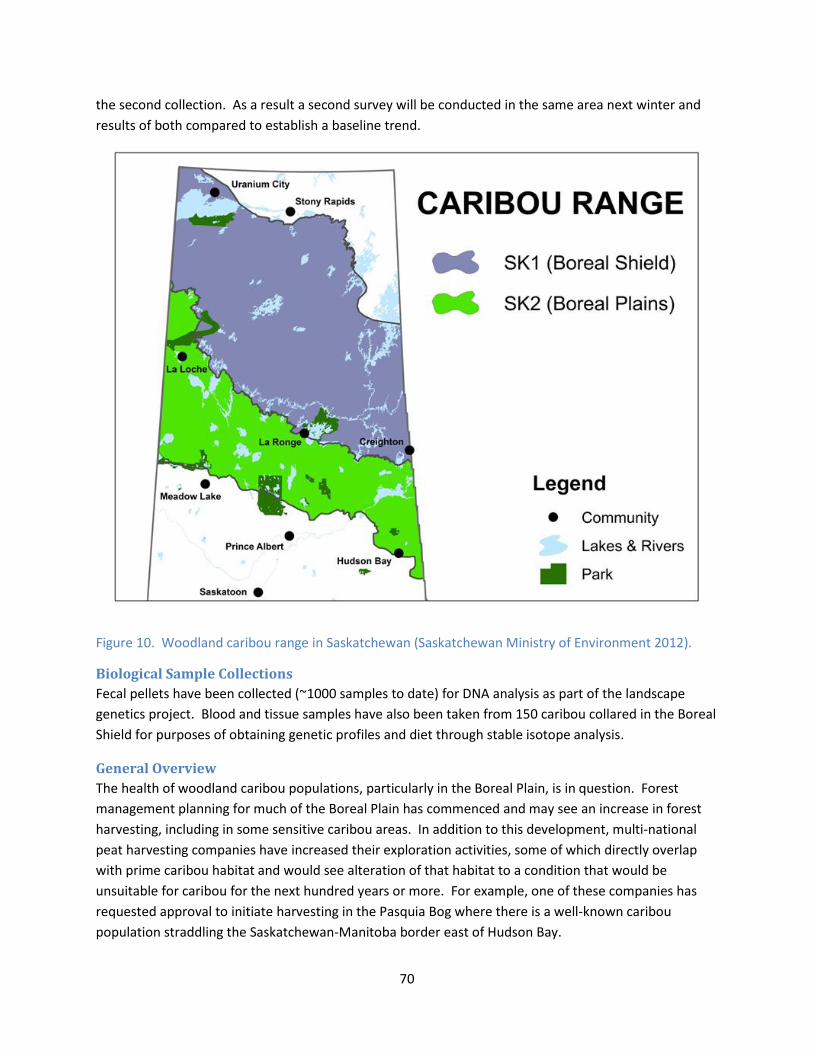
70
the second collection. As a result a second survey will be conducted in the same area next winter and
results of both compared to establish a baseline trend.
Figure 10. Woodland caribou range in Saskatchewan (Saskatchewan Ministry of Environment 2012).
Biological Sample Collections
Fecal pellets have been collected (~1000 samples to date) for DNA analysis as part of the landscape
genetics project. Blood and tissue samples have also been taken from 150 caribou collared in the Boreal
Shield for purposes of obtaining genetic profiles and diet through stable isotope analysis.
General Overview
The health of woodland caribou populations, particularly in the Boreal Plain, is in question. Forest
management planning for much of the Boreal Plain has commenced and may see an increase in forest
harvesting, including in some sensitive caribou areas. In addition to this development, multi-national
peat harvesting companies have increased their exploration activities, some of which directly overlap
with prime caribou habitat and would see alteration of that habitat to a condition that would be
unsuitable for caribou for the next hundred years or more. For example, one of these companies has
requested approval to initiate harvesting in the Pasquia Bog where there is a well-known caribou
population straddling the Saskatchewan-Manitoba border east of Hudson Bay.

71
Within the Boreal Shield, upcoming uranium mining and associated long-distance road networks will be
examined with industry participation to determine their effects on local caribou populations and
habitat.
The National Boreal Caribou Recovery Strategy was released in September 2012 and included provincial
obligations to collect population data on caribou, particularly in the Boreal Shield, as well as direction to
undertake range planning in the Boreal Plain that would direct human land use to ensure sustainable
caribou populations, while maintaining a minimum of 65 per cent undisturbed critical habitat at any
given time in the future. As a result, the ministry embarked on a set of directed studies in response to
the federal recovery strategy for the boreal population of woodland caribou.
The Provincial Woodland Caribou Management Team held a final meeting in February 2012 and
approved a draft provincial strategy that subsequently was re-named to be a provincial conservation
strategy. It has since been approved by the Minister of Environment and is the guiding document for
management. The directed studies mentioned above were developed by a Woodland Caribou Technical
Committee (WCTC) contrived by the ministry to bring together experienced researchers with an interest
in pursuing research in the province according to guidance provided by the ministry. The WCTC is not
representative, but combines the ministry staff most directly involved in management with outside
researchers and together they developed the directed studies. An integrated internal Woodland
Caribou Working Group has also been established with representation from Fish, Wildlife, and Lands,
Environmental Assessment, Technical Services, Fire Management, Forest Services and Communication
and Client Services branches, as well as the Ministry of Economy.
Management for woodland caribou via habitat will be guided by “range plans” of which the first in SK2
Central is nearing completion. These plans will address how the province meets the federally prompted
goal of attaining and maintaining a minimum undisturbed habitat of 65 per cent. Range planning
commenced in January 2015 within SK2 Central of the Boreal Plain part of the provincial range known as
SK2. This conservation unit was divided into SK2 West, SK2 Central, and SK2 East. Representatives of
First Nations, Métis Locals and a wide variety of stakeholders, including industry, join the ministry and
other government staff at range planning tables every three or four months to share information and
discuss development of the range plans. This process has also triggered the Duty to Consult based on
government guidelines. A draft plan for the SK2 Central sub-unit was released for public input in
October 2017 and subsequent drafts written to incorporate public and internal suggestions, and a final
meeting of the SK2 Central Planning Table held in November 2017. It is expected that the final plan will
be complete in one more year.
Hunting Season Review Regulated harvest was closed province-wide in 1987 in response to concerns of declining populations
and remains closed today. Sustenance harvest continues, but it is unclear to what degree.
72
Research Initiatives Cameco completed its caribou collaring study around Key and Cree Lakes that would help them address
concerns about industrial disturbance to caribou and habitat. Results of that effort are yet to be
released. Their fieldwork will also be combined with the University of Saskatchewan-led collaring study
in the Boreal Shield and will also help to gain a better understanding to what extent natural disturbance
(i.e. wildfire burns) affect caribou persistence. An interim report was produced describing results from
the first two years of the U of S study (McLoughlin et al. 2016). Preliminary conclusions resulting from
that report are: 1) habitat is relatively pristine with low levels of anthropogenic disturbance compared
to other parts of Canada; 2) despite frequent wildfires in the last 40 years, large tracts of high-quality
habitat remain and are available to caribou; 3) some of the highest densities of boreal caribou in Canada
were observed (36.9 caribou/1,000 km² or approximately 3,380 caribou in the study area extrapolated
to ~5,000 in SK1 – Boreal Shield); 4) wolf densities appear to be low with much larger territories than
observed elsewhere (3.5x) and very low moose densities; 5) very low human hunting pressure;
6) caribou population characterized by high adult female survival (>0.90) and moderate-low recruitment
(~0.20 ) but high pregnancy rates (~0.90); 7) a large herbivore population experiencing density-related
constraints on further population growth; and 8) age and sex structure combined with survival and
reproductive rates indicative of a stable to slightly increasing population.
Genetic research based on pellet collections (mainly SK2) and blood samples (SK1) is showing weak
population structure within the southern part of the boreal plain, but overall a continuous distribution
of caribou provincially which indicates a relatively-well genetically-connected population characterized
by Isolation by Distance (Priadka, 2015). Figure 11 illustrates the results as genetic clusters that are
closely related with adjacent clusters, and less closely related to distantly located clusters.
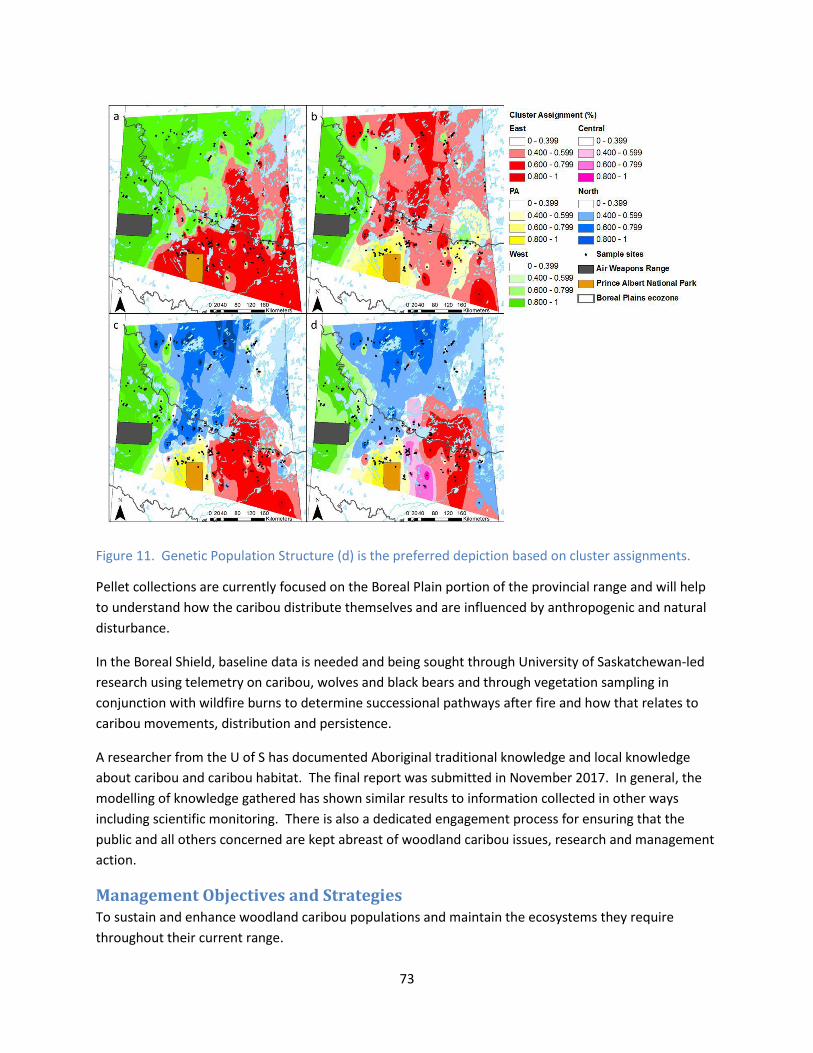
73
Figure 11. Genetic Population Structure (d) is the preferred depiction based on cluster assignments.
Pellet collections are currently focused on the Boreal Plain portion of the provincial range and will help
to understand how the caribou distribute themselves and are influenced by anthropogenic and natural
disturbance.
In the Boreal Shield, baseline data is needed and being sought through University of Saskatchewan-led
research using telemetry on caribou, wolves and black bears and through vegetation sampling in
conjunction with wildfire burns to determine successional pathways after fire and how that relates to
caribou movements, distribution and persistence.
A researcher from the U of S has documented Aboriginal traditional knowledge and local knowledge
about caribou and caribou habitat. The final report was submitted in November 2017. In general, the
modelling of knowledge gathered has shown similar results to information collected in other ways
including scientific monitoring. There is also a dedicated engagement process for ensuring that the
public and all others concerned are kept abreast of woodland caribou issues, research and management
action.
Management Objectives and Strategies To sustain and enhance woodland caribou populations and maintain the ecosystems they require
throughout their current range.
74
Long-term Management Objectives
Develop range plans for each conservation unit.
Delineate critical habitat for woodland caribou in the Boreal Plain Conservation Unit and the
Boreal Shield Conservation Unit.
Develop or adopt a cumulative effects model in collaboration with industries and other
interested parties.
Link Range Plans with Land Use Plans in collaboration with stakeholders and Aboriginal groups.
Develop integrated access management plans for each Woodland Caribou Conservation Unit
(WCCU).
Develop a wildfire suppression plan for caribou range.
Evaluate the long-term effects of climate change on woodland caribou population status, and its
effect on caribou habitat and use.
Establish a reporting system that will identify proposed developments and activities within any
WCCU (with impacts to be assessed through cumulative effects model).
Contribute to forest insect/disease management planning.
Assess caribou population demographics and trends, beginning with high-risk areas.
Establish and promote a formal program for collection of track, sighting and telemetry data.
Monitor health and condition of woodland caribou.
Analyze genetic variation in and among caribou populations.
Collaborate with First Nations and Métis with an interest in caribou and caribou range to
develop effective conservation practices
Collaborate with neighbouring jurisdictions in managing for trans-boundary caribou populations
Collaborate with industries and recreation groups to develop best management practices for
caribou and critical habitat.
Investigate methods of population estimation.
Complete the process of and finalize listing Woodland Caribou as a provincial species at risk.
Short-term Management Strategies
Commence delineation of critical habitat starting with examination of forest ecosites to identify
those preferred by caribou.
Identify habitat and local population connectivity issues across the Boreal Plain conservation
unit through landscape genetics.
Formalize and improve the sighting and track reporting program.
Identify and formalize methods for determining population size and trend.
Additional Information
Most recent provincial species plan:
Saskatchewan Environment. 2007. Recovery Strategy for Boreal Woodland Caribou (Rangifer tarandus
caribou) in Saskatchewan. Saskatchewan Environment. Fish and Wildlife Technical Report 2007. 46pp.
(Unpublished)
75
McLoughlin, Phil et al. 2016. Population dynamics and critical habitat of woodland caribou in the
Saskatchewan Boreal Shield. Department of Biology, University of Saskatchewan; Interim Project
Report, 2013-2016. 162pp. (Unpublished).
Priadka, Pauline. 2015. Genetic Connectivity of Boreal Woodland Caribou (Rangifer tarandus caribou) in
Central Canada. Faculty of Graduate Studies of The University of Manitoba; Thesis for the degree of
Master of Natural Resources Management. Natural Resources Institute. Winnipeg, Canada. 125pp.
Mamun, Abdullah Al and Ryan Brook. 2017. Characterizing, Mapping and Modelling Aboriginal
Traditional Knowledge about Woodland Caribou in Saskatchewan in Support of Range Planning. Final
Report to the Saskatchewan Ministry of Environment. University of Saskatchewan. 119pp.
(Unpublished)
For additional information, please contact:
Tim Trottier
Woodland Caribou Recovery Management Team
Fish, Wildlife and Lands Branch
Ministry of Environment
1328 La Ronge Ave. La Ronge, SK S0J 1L0
(306) 425-4237
OR
Gigi Pittoello
Woodland Caribou Recovery Management Team
Fish, Wildlife and Lands Branch
Ministry of Environment
3211 Albert Street Regina S4S 5W6
(306) 787-2751
76
Plains Bison (Bison bison bison) Plains bison are the largest wild land mammal in North America with adult males ranging in weight from
600 to 850 kilograms and standing nearly two metres at the shoulder (Caras 1967). They are
distinguished by their large head, rounded shoulder hump, broad snout, and short stout black horns that
curve upward. The front quarters are heavier than the hind quarters, with the head and front shoulders
being covered in a heavy long wooly pelage. Plains bison are sexually dimorphic with females smaller
than males. In Saskatchewan, plains bison are found in two distinct locations (Figure 12), described as
the McCusker River population (Figure 13) and the Sturgeon River population (Figure 14).
Population Status Plains bison were extirpated from Saskatchewan in the late 19th century. In 1969, 50 plains bison (36
females and 14 males) were obtained from Elk Island National Park of Canada and released north of the
Thunder Hills near Meyakamew Lake, which is approximately 60 km north of Prince Albert National Park
(PANP). These animals did not stay at the original release site. Approximately 10-15 of the bison moved
south settling in the southwest region of PANP and became known as the Sturgeon River herd. Another
10-17 animals were re-captured by the Department of Natural Resources and re-located to the
Vermette-Upper Cummings Lake region. These animals eventually settled in the McCusker River area
within the Cold Lake Air Weapons Range and became known as the McCusker River herd. The Sturgeon
River herd is monitored annually by PANP staff (in the park), the Sturgeon River Plains Bison Stewards
(outside the park) and field reports from the general public, landowners and Ministry of Environment
staff. The McCusker River herd is not monitored annually.
Survey Data
The Sturgeon River population slowly grew over the past 35 years and in 2007-08 peaked at 400+
animals. An anthrax outbreak in the population in 2008 along with wolf predation and unregulated
hunting has resulted in a steady decline in the population since 2008. In 2017, the population was
estimated to be less than 250 (Figure 15). There is limited information about the McCusker River
population. Anecdotal estimates suggest the population remains around 150.
Biological Sample Collections
No biological samples were collected during this time period.

77
Figure 12. Plains bison range in Saskatchewan.

78
Figure 13. McCusker River Plains Bison Population range in Saskatchewan.
General Overview
The Committee on the Status of Endangered Wildlife in Canada (COSEWIC) list plains bison as
threatened. This designation was given in 2004. Status reassessment began in November 2013 and
COSEWIC has re-confirmed the status designation as threatened. Under the Species at Risk Act (SARA)
plains bison are not considered to be at risk. The Federal Government is presently reviewing the re-
assessment with a decision on listing expected in 2018. The decision not to list bison under SARA in 2004
was due to the potential economic implications for the Canadian bison industry (SARA, SI/2005-72/
annex 1).
In 2006, a draft management strategy was developed to help guide management actions by the Federal
and Provincial governments responsible for the Sturgeon River Plains Bison. Stakeholders were brought
together to discuss goals and outcomes for the bison herd. One of the goals was to develop a long-term
bison management plan.
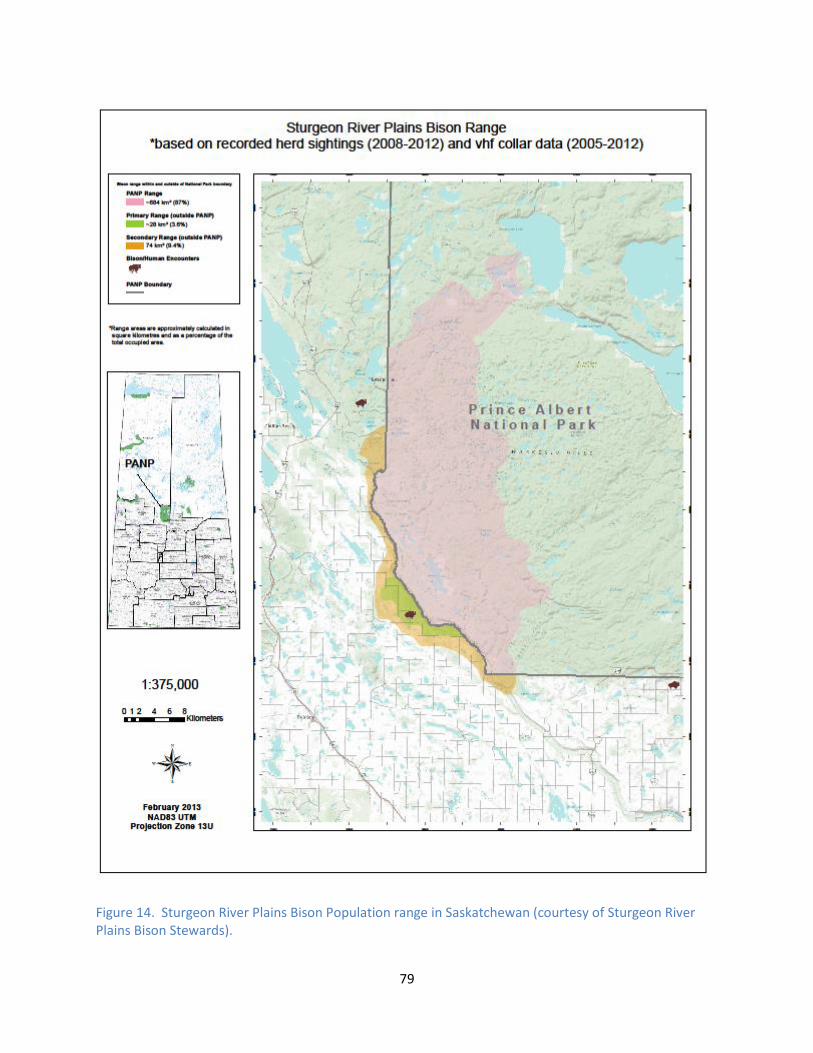
79
Figure 14. Sturgeon River Plains Bison Population range in Saskatchewan (courtesy of Sturgeon River Plains Bison Stewards).
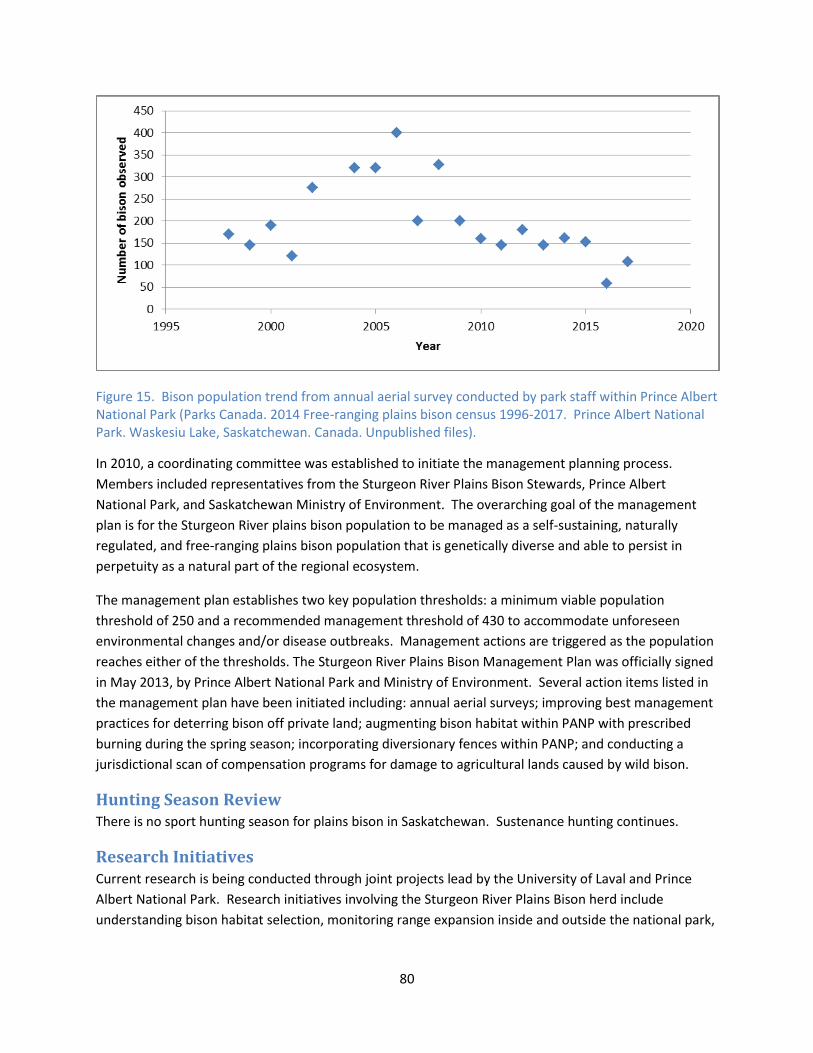
80
Figure 15. Bison population trend from annual aerial survey conducted by park staff within Prince Albert National Park (Parks Canada. 2014 Free-ranging plains bison census 1996-2017. Prince Albert National Park. Waskesiu Lake, Saskatchewan. Canada. Unpublished files).
In 2010, a coordinating committee was established to initiate the management planning process.
Members included representatives from the Sturgeon River Plains Bison Stewards, Prince Albert
National Park, and Saskatchewan Ministry of Environment. The overarching goal of the management
plan is for the Sturgeon River plains bison population to be managed as a self-sustaining, naturally
regulated, and free-ranging plains bison population that is genetically diverse and able to persist in
perpetuity as a natural part of the regional ecosystem.
The management plan establishes two key population thresholds: a minimum viable population
threshold of 250 and a recommended management threshold of 430 to accommodate unforeseen
environmental changes and/or disease outbreaks. Management actions are triggered as the population
reaches either of the thresholds. The Sturgeon River Plains Bison Management Plan was officially signed
in May 2013, by Prince Albert National Park and Ministry of Environment. Several action items listed in
the management plan have been initiated including: annual aerial surveys; improving best management
practices for deterring bison off private land; augmenting bison habitat within PANP with prescribed
burning during the spring season; incorporating diversionary fences within PANP; and conducting a
jurisdictional scan of compensation programs for damage to agricultural lands caused by wild bison.
Hunting Season Review There is no sport hunting season for plains bison in Saskatchewan. Sustenance hunting continues.
Research Initiatives Current research is being conducted through joint projects lead by the University of Laval and Prince
Albert National Park. Research initiatives involving the Sturgeon River Plains Bison herd include
understanding bison habitat selection, monitoring range expansion inside and outside the national park,
81
tracking movement patterns, bison reaction to diversionary fences, and studying predator-prey
relationships.
Management Objectives and Strategies
Long-term Management Objectives
Manage bison population numbers and population structure (age/sex) to allow for a self-
sustaining and genetically diverse population while ensuring that the social carrying capacity for
wild plains bison is not exceeded.
Ensure that sufficient habitat is available to maintain a self-sustaining and wild plains bison
population in the Sturgeon River region while mitigating negative impacts to local agriculture.
Minimize conflict between bison and private landowners adjacent to Prince Albert National Park
by improving prevention materials and methods, and increasing the social carrying capacity of
the bison herd (the number of animals tolerated by landowners and the public within the
regional geographic area).
Short-term Management Strategies
Continue to monitor the bison population using aerial survey methods on an annual basis (PANP
staff).
Support ongoing research pertaining to bison food preference and habitat preference
throughout the current Sturgeon River plains bison range.
Increase the use of diversionary fences on private land to steer bison to more preferable
locations.
Maintain a bison anthrax protocol to guide operational procedure for future anthrax outbreaks.
Implement action items found within the Sturgeon River Plains Bison Management Plan.
Additional Information
Most recent provincial species plan: None available.
For additional information, please contact:
Katie Rasmussen
Plains Bison Manager
Fish, Wildlife and Lands Branch, Ministry of Environment
Unit 1- 101 Railway Place Meadow Lake, SK S9X 1X6
(306) 236-9819
82
Upland Game Birds Seven upland game bird species inhabit Saskatchewan, including ring-necked pheasant, sharp-tailed
grouse, gray partridge (formerly Hungarian partridge), ruffed grouse, spruce grouse, rock ptarmigan and
willow ptarmigan. While some of these species inhabit prairie landscapes and others more forested
landscapes, upland birds inhabit all regions of the province (Figure 16). Wild turkeys are also found
locally in pockets of the southeast and southwest corners of the province, but have not reached
populations where a hunting season would be considered for them.
Population Status In past, populations of upland game birds were monitored through a series of population surveys,
harvest surveys and field reports. Population surveys were discontinued in the late 1990s – early 2000s
and since that point, populations have been monitored using information gathered from the hunter
harvest survey and field reports from stakeholder groups, the general public, landowners and ministry
staff.
Survey Data
There is a general consensus among most jurisdictions in the Great Plains that upland game bird harvest
approximates trends in the population. That is, harvest of game birds tends to be self-limiting such that
when populations are abundant, hunters are quite successful, but when populations are limited, so is
the harvest. This theory holds true in Saskatchewan, where population estimates obtained in between
1960 and 1980 are well correlated to harvest estimates (Department of Tourism and Renewable
Resources 1980). Harvest in Saskatchewan was monitored until 2010, discontinued for several years
and reinstated in 2014.
Biological Sample Collections
No biological samples were collected in 2017.
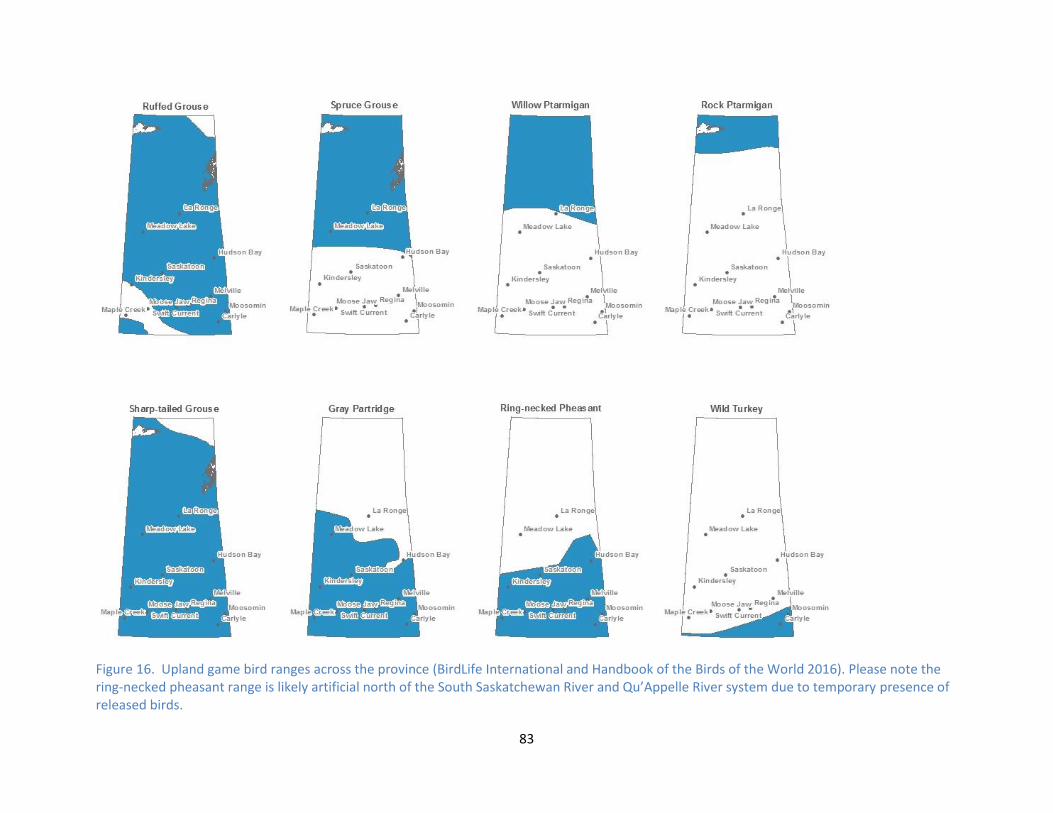
83
Figure 16. Upland game bird ranges across the province (BirdLife International and Handbook of the Birds of the World 2016). Please note the ring-necked pheasant range is likely artificial north of the South Saskatchewan River and Qu’Appelle River system due to temporary presence of released birds.
84
General Overview
Hunter harvest survey data collected in 2017 (Table 25) suggests that populations of sharp-tailed grouse
and gray partridge were similar to last year, although remain depressed compared to long-term
objectives. Populations of ring-necked pheasant declined in 2017, although remained above long-term
objectives. As expected, ruffed grouse and spruce grouse populations declined. This aligns with the
normal ~10 year cycling of these species. Population impressions based on harvest data were
corroborated by field reports from staff and stakeholders. All field reports of ptarmigan species indicate
the populations are doing well.
Hunting Season Review With the exception of ring-necked pheasant and ptarmigan, which can only be harvested by residents,
all hunters can harvest upland game birds. Saskatchewan is divided into two zones, the North Game
Bird District and the South Game Bird District and bag limits and season lengths may vary between these
two zones for each species. Bag limits were at their most liberal levels into 2012, but in response to
several severe winters, followed by cool, wet springs, in short succession, the ministry made reductions
to the bag limits of prairie species. In 2013, the daily bag limits of sharp-tailed grouse and ring-necked
pheasants were reduced from three to two birds and the possession limit for gray partridge was reduced
from 24 to 16 birds. In 2014, additional reductions were made to the gray partridge bag limit to bring it
from eight birds daily to four birds daily. Possession limit remained at twice the daily bag limit. In 2015,
the ring-necked pheasant daily bag limit returned to three birds. Daily bag and possession limits for
these species remained in place in 2017.
Increases in licence fees in 2017 likely drove a slight decrease in resident licence sales (Appendix A).
Canadian resident licence sales remained relatively stable and non-resident licences sales continued
their upward trend. In total, 20,413 resident, 2,024 Canadian and 11,120 non-resident licences were
sold in 2017.
In 2014, the hunter harvest survey was made available to hunters of all residencies, rather than just
Saskatchewan residents as in past and recent surveys included a question about whether participants
hunted waterfowl only, upland game birds only or both waterfowl and upland game birds. Over time,
the ministry will be able to use this data to better understand unique trends in game bird hunters. In
2017, the percentage of hunters hunting waterfowl only, upland game birds only or both waterfowl and
upland game birds remained similar to previous years for all residencies (Table 26).
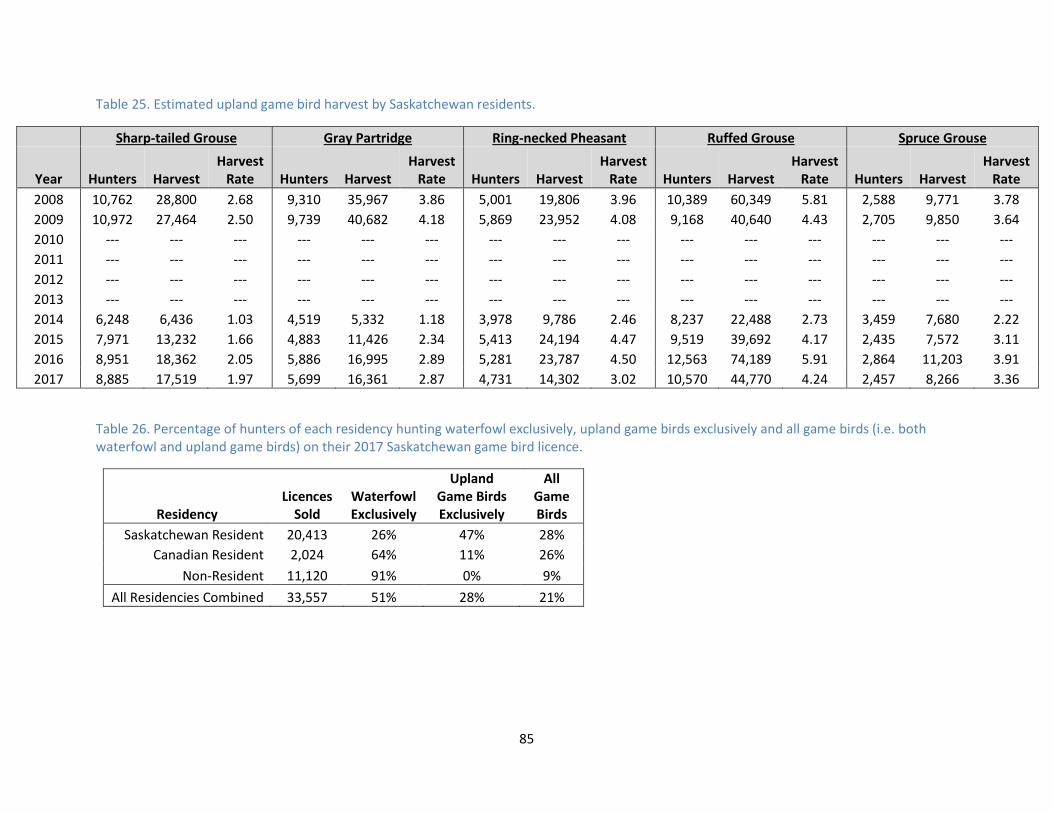
85
Table 25. Estimated upland game bird harvest by Saskatchewan residents.
Sharp-tailed Grouse Gray Partridge Ring-necked Pheasant Ruffed Grouse Spruce Grouse
Year Hunters Harvest Harvest
Rate Hunters Harvest Harvest
Rate Hunters Harvest Harvest
Rate Hunters Harvest Harvest
Rate Hunters Harvest Harvest
Rate
2008 10,762 28,800 2.68 9,310 35,967 3.86 5,001 19,806 3.96 10,389 60,349 5.81 2,588 9,771 3.78
2009 10,972 27,464 2.50 9,739 40,682 4.18 5,869 23,952 4.08 9,168 40,640 4.43 2,705 9,850 3.64
2010 --- --- --- --- --- --- --- --- --- --- --- --- --- --- ---
2011 --- --- --- --- --- --- --- --- --- --- --- --- --- --- ---
2012 --- --- --- --- --- --- --- --- --- --- --- --- --- --- ---
2013 --- --- --- --- --- --- --- --- --- --- --- --- --- --- ---
2014 6,248 6,436 1.03 4,519 5,332 1.18 3,978 9,786 2.46 8,237 22,488 2.73 3,459 7,680 2.22
2015 7,971 13,232 1.66 4,883 11,426 2.34 5,413 24,194 4.47 9,519 39,692 4.17 2,435 7,572 3.11
2016 8,951 18,362 2.05 5,886 16,995 2.89 5,281 23,787 4.50 12,563 74,189 5.91 2,864 11,203 3.91
2017 8,885 17,519 1.97 5,699 16,361 2.87 4,731 14,302 3.02 10,570 44,770 4.24 2,457 8,266 3.36
Table 26. Percentage of hunters of each residency hunting waterfowl exclusively, upland game birds exclusively and all game birds (i.e. both waterfowl and upland game birds) on their 2017 Saskatchewan game bird licence.
Residency Licences
Sold Waterfowl Exclusively
Upland Game Birds Exclusively
All Game Birds
Saskatchewan Resident 20,413 26% 47% 28%
Canadian Resident 2,024 64% 11% 26%
Non-Resident 11,120 91% 0% 9%
All Residencies Combined 33,557 51% 28% 21%
86
Research Initiatives In partnership with the University of Regina and SaskPower, a research project on sharp-tailed grouse
commenced in the fall of 2017. The objectives of this study are to use historical grouse and habitat data,
in combination with contemporary field studies, to characterize and map major habitat features
important for the long-term persistence of sharp-tailed grouse leks and understand how variation in
annual weather conditions influences productivity. This study will continue through 2020.
Management Objectives and Strategies
Long-term Management Objectives
Maintain sustainable upland game bird populations that can support continued hunting
opportunity for future generations.
Short-term Management Strategies
Complete an updated Management Plan for Upland Game Birds in Saskatchewan.
Develop predictive models to estimate the impact of weather severity during key stages of
upland game bird lifecycles and, in particular, the impact weather variables have on
productivity.
Identify current land cover across the province and determine location and distribution of
available habitat for upland game bird species, particularly sharp-tailed grouse.
Continue to utilize all available data to inform management strategies, including the annual
review of seasons, daily bag limits and possession limits.
Additional Information
Most recent provincial species plan:
Department of Tourism and Renewable Resources. 1980. Saskatchewan Game Bird Management
Objectives and Strategies for the 80s. Fisheries and Wildlife Branch. Regina, SK
For additional information, please contact:
Katherine Conkin
Upland Game Bird Manager
Fish, Wildlife and Lands Branch
Ministry of Environment
102-112 Research Dr. Saskatoon, SK S7N 3R3
(306) 933-5304
87
Waterfowl Saskatchewan is an important area for four species of geese and almost every duck species in western
North America (n= 36). Birds wintering in the Central, Mississippi and to a lesser extent Pacific Flyways
use Saskatchewan either as breeding grounds during the summer or staging grounds along migrations to
and from more northerly locations. Although not technically a waterfowl species, Saskatchewan also
provides important staging habitat for sandhill cranes.
Population Status Given that migratory birds fall under both federal and provincial jurisdiction, and are managed
cooperatively with other jurisdictions in the flyways, waterfowl populations have been monitored
annually by both the Canadian and United States federal governments. A series of surveys, including air-
ground breeding population surveys, waterfowl banding, white-fronted goose fall staging surveys and
mid-winter waterfowl surveys across the United States, allow the Central Flyway to compile an annual
Harvest and Population Survey Data Book.
Survey Data
Although the ministry does not collect waterfowl population data, the Central Flyway Harvest and
Population Survey Data Book (Dubovsky 2017) produced annually allows wildlife managers to monitor
populations along the Central Flyway. Additionally, the Status and Harvests of Sandhill Cranes report
(Dubovsky 2017) informs on crane populations that use Saskatchewan. Pertinent results from these
publications are included below (Tables 27, 28 and 29). Please note, much of the 2017 data was not
available at the time of production of this report and therefore the data will be included in the
Saskatchewan Wildlife Management Report 2018.
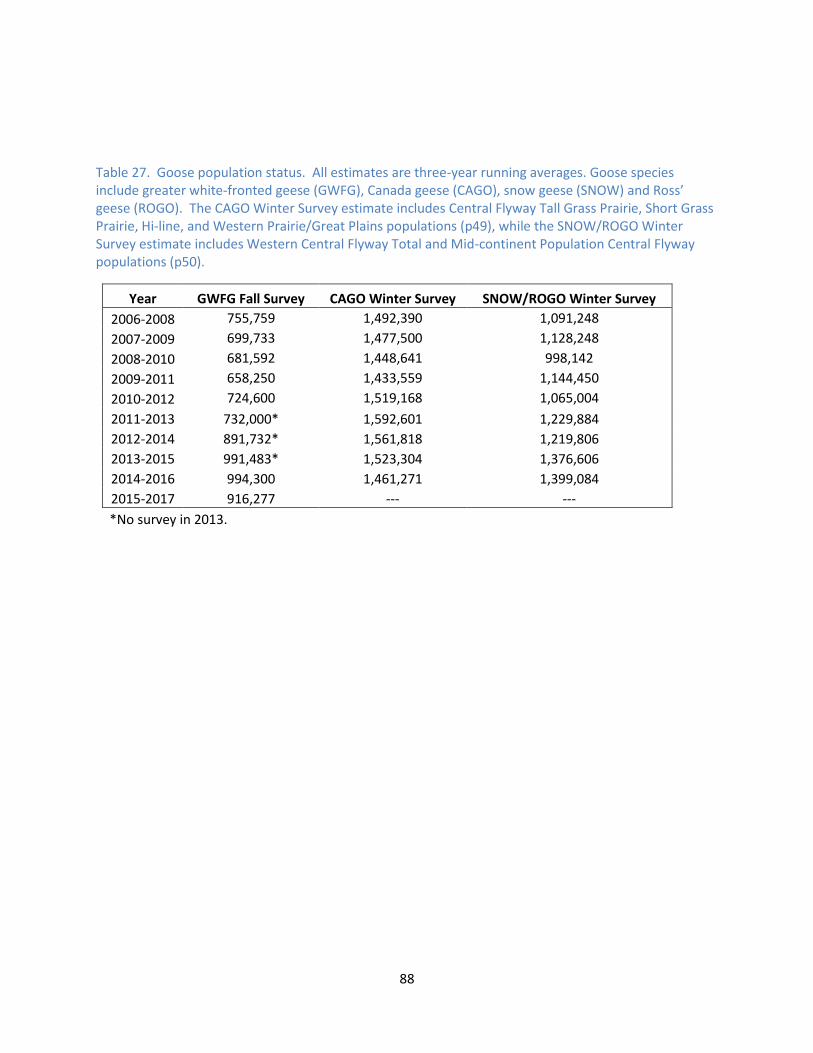
88
Table 27. Goose population status. All estimates are three-year running averages. Goose species include greater white-fronted geese (GWFG), Canada geese (CAGO), snow geese (SNOW) and Ross’ geese (ROGO). The CAGO Winter Survey estimate includes Central Flyway Tall Grass Prairie, Short Grass Prairie, Hi-line, and Western Prairie/Great Plains populations (p49), while the SNOW/ROGO Winter Survey estimate includes Western Central Flyway Total and Mid-continent Population Central Flyway populations (p50).
Year GWFG Fall Survey CAGO Winter Survey SNOW/ROGO Winter Survey
2006-2008 755,759 1,492,390 1,091,248
2007-2009 699,733 1,477,500 1,128,248
2008-2010 681,592 1,448,641 998,142
2009-2011 658,250 1,433,559 1,144,450
2010-2012 724,600 1,519,168 1,065,004
2011-2013 732,000* 1,592,601 1,229,884
2012-2014 891,732* 1,561,818 1,219,806
2013-2015 991,483* 1,523,304 1,376,606
2014-2016 994,300 1,461,271 1,399,084
2015-2017 916,277 --- ---
*No survey in 2013.
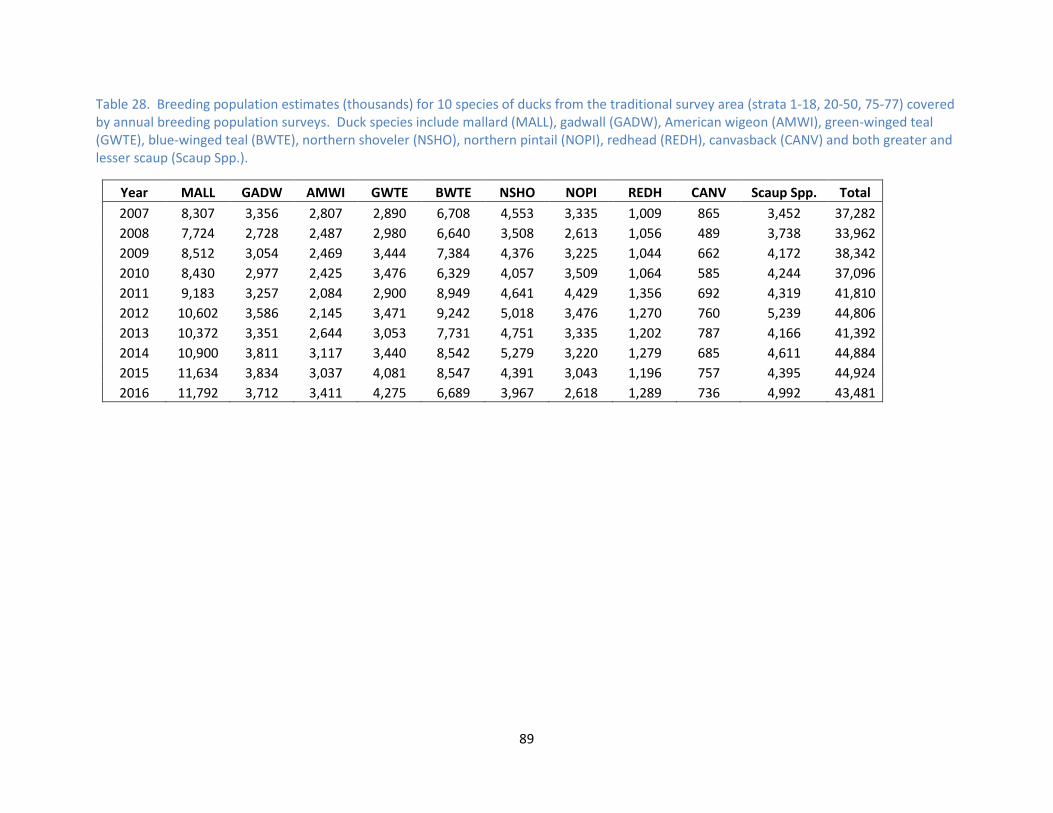
89
Table 28. Breeding population estimates (thousands) for 10 species of ducks from the traditional survey area (strata 1-18, 20-50, 75-77) covered by annual breeding population surveys. Duck species include mallard (MALL), gadwall (GADW), American wigeon (AMWI), green-winged teal (GWTE), blue-winged teal (BWTE), northern shoveler (NSHO), northern pintail (NOPI), redhead (REDH), canvasback (CANV) and both greater and lesser scaup (Scaup Spp.).
Year MALL GADW AMWI GWTE BWTE NSHO NOPI REDH CANV Scaup Spp. Total
2007 8,307 3,356 2,807 2,890 6,708 4,553 3,335 1,009 865 3,452 37,282
2008 7,724 2,728 2,487 2,980 6,640 3,508 2,613 1,056 489 3,738 33,962
2009 8,512 3,054 2,469 3,444 7,384 4,376 3,225 1,044 662 4,172 38,342
2010 8,430 2,977 2,425 3,476 6,329 4,057 3,509 1,064 585 4,244 37,096
2011 9,183 3,257 2,084 2,900 8,949 4,641 4,429 1,356 692 4,319 41,810
2012 10,602 3,586 2,145 3,471 9,242 5,018 3,476 1,270 760 5,239 44,806
2013 10,372 3,351 2,644 3,053 7,731 4,751 3,335 1,202 787 4,166 41,392
2014 10,900 3,811 3,117 3,440 8,542 5,279 3,220 1,279 685 4,611 44,884
2015 11,634 3,834 3,037 4,081 8,547 4,391 3,043 1,196 757 4,395 44,924
2016 11,792 3,712 3,411 4,275 6,689 3,967 2,618 1,289 736 4,992 43,481
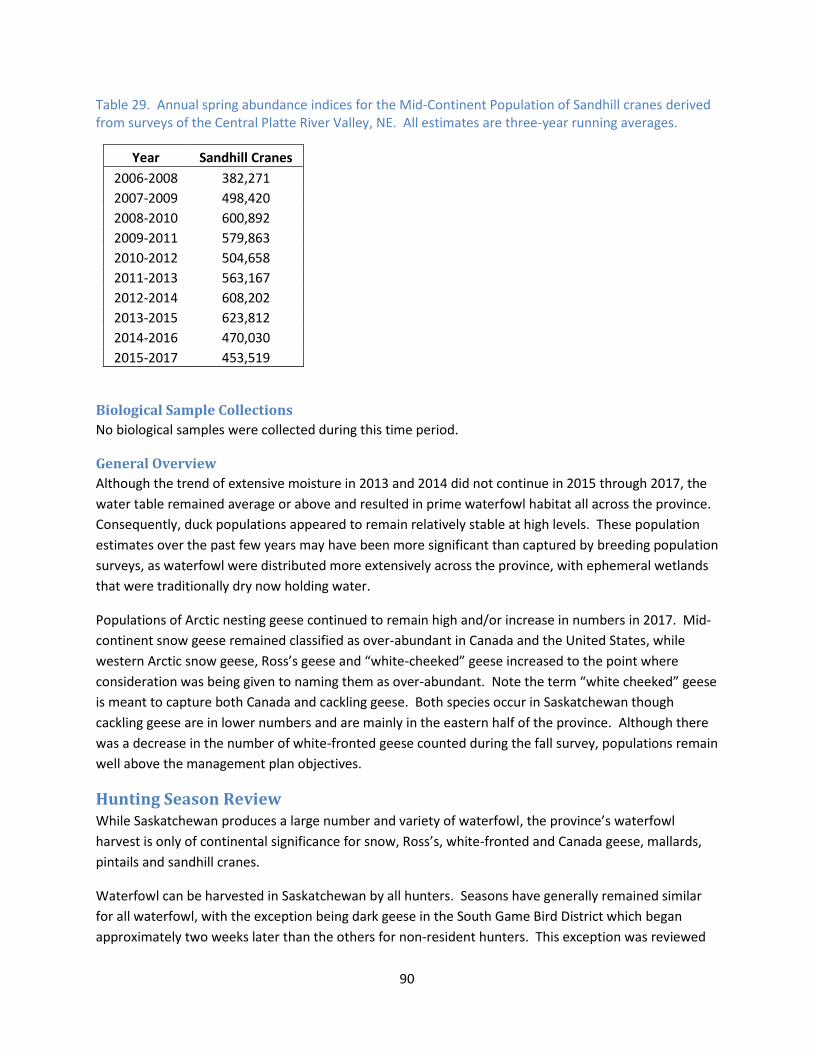
90
Table 29. Annual spring abundance indices for the Mid-Continent Population of Sandhill cranes derived from surveys of the Central Platte River Valley, NE. All estimates are three-year running averages.
Year Sandhill Cranes
2006-2008 382,271
2007-2009 498,420
2008-2010 600,892
2009-2011 579,863
2010-2012 504,658
2011-2013 563,167
2012-2014 608,202
2013-2015 623,812
2014-2016 470,030
2015-2017 453,519
Biological Sample Collections
No biological samples were collected during this time period.
General Overview
Although the trend of extensive moisture in 2013 and 2014 did not continue in 2015 through 2017, the
water table remained average or above and resulted in prime waterfowl habitat all across the province.
Consequently, duck populations appeared to remain relatively stable at high levels. These population
estimates over the past few years may have been more significant than captured by breeding population
surveys, as waterfowl were distributed more extensively across the province, with ephemeral wetlands
that were traditionally dry now holding water.
Populations of Arctic nesting geese continued to remain high and/or increase in numbers in 2017. Mid-
continent snow geese remained classified as over-abundant in Canada and the United States, while
western Arctic snow geese, Ross’s geese and “white-cheeked” geese increased to the point where
consideration was being given to naming them as over-abundant. Note the term “white cheeked” geese
is meant to capture both Canada and cackling geese. Both species occur in Saskatchewan though
cackling geese are in lower numbers and are mainly in the eastern half of the province. Although there
was a decrease in the number of white-fronted geese counted during the fall survey, populations remain
well above the management plan objectives.
Hunting Season Review While Saskatchewan produces a large number and variety of waterfowl, the province’s waterfowl
harvest is only of continental significance for snow, Ross’s, white-fronted and Canada geese, mallards,
pintails and sandhill cranes.
Waterfowl can be harvested in Saskatchewan by all hunters. Seasons have generally remained similar
for all waterfowl, with the exception being dark geese in the South Game Bird District which began
approximately two weeks later than the others for non-resident hunters. This exception was reviewed
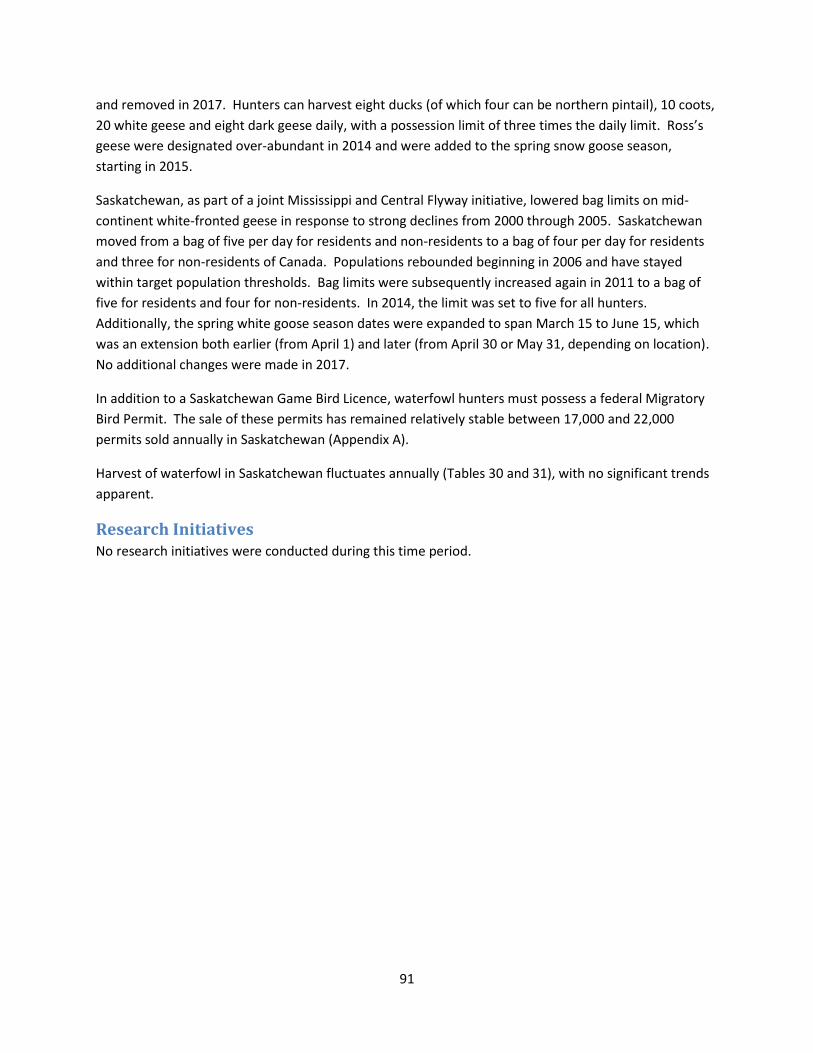
91
and removed in 2017. Hunters can harvest eight ducks (of which four can be northern pintail), 10 coots,
20 white geese and eight dark geese daily, with a possession limit of three times the daily limit. Ross’s
geese were designated over-abundant in 2014 and were added to the spring snow goose season,
starting in 2015.
Saskatchewan, as part of a joint Mississippi and Central Flyway initiative, lowered bag limits on mid-
continent white-fronted geese in response to strong declines from 2000 through 2005. Saskatchewan
moved from a bag of five per day for residents and non-residents to a bag of four per day for residents
and three for non-residents of Canada. Populations rebounded beginning in 2006 and have stayed
within target population thresholds. Bag limits were subsequently increased again in 2011 to a bag of
five for residents and four for non-residents. In 2014, the limit was set to five for all hunters.
Additionally, the spring white goose season dates were expanded to span March 15 to June 15, which
was an extension both earlier (from April 1) and later (from April 30 or May 31, depending on location).
No additional changes were made in 2017.
In addition to a Saskatchewan Game Bird Licence, waterfowl hunters must possess a federal Migratory
Bird Permit. The sale of these permits has remained relatively stable between 17,000 and 22,000
permits sold annually in Saskatchewan (Appendix A).
Harvest of waterfowl in Saskatchewan fluctuates annually (Tables 30 and 31), with no significant trends
apparent.
Research Initiatives No research initiatives were conducted during this time period.
92
Table 30. Duck harvest in Saskatchewan (2008-2017).
Year MALL GADW AMWI GWTE BWTE NSHO NOPI REDH CANV LESC
2008 150,906 16,212 4,001 6,683 15,132 5,958 15,076 2,360 2,310 0
2009 135,546 17,720 3,873 1,147 2,624 6,045 17,226 760 456 826
2010 125,686 15,653 5,251 6,093 12,272 14,176 13,625 4,353 491 4,059
2011 143,258 29,404 8,992 3,534 22,787 22,040 20,217 4,563 6,150 2,029
2012 188,380 15,570 5,950 4,360 15,470 12,330 15,470 3,970 1,690 1,410
2013 193,591 18,864 2,527 6,969 38,943 15,458 19,243 5,884 761 1,973
2014 163,468 43,710 4,316 3,895 25,278 10,943 30,717 3,460 5,703 528
2015 179,718 14,492 8,091 9,477 29,860 7,456 11,790 2,407 1,094 48
2016 159,158 25,707 14,329 21,295 15,217 13,360 11,869 3,144 3,967 3,016
2017 133,725 15,200 7,741 4,977 19,148 8,395 28,390 326 530 443
Table 31. Goose harvest in Saskatchewan (2008-2017).
Year SNGO ROGO GWFG CAGO/CACG
2008 112,986 35,227 55,647 155,728
2009 80,753 20,655 30,882 140,922
2010 77,568 26,280 33,558 149,533
2011 85,848 34,682 52,762 173,045
2012 95,620 20,830 36,130 178,540
2013 127,835 29,478 42,181 141,655
2014 121,091 30,269 65,463 161,815
2015 68,341 19,302 31,953 177,475
2016 50,105 14,803 32,304 201,289
2017 54,502 35,452 45,104 208,946
93
Management Objectives and Strategies
Long-term Management Objectives
Continue to work within the Central and Mississippi Flyways framework to ensure that all
waterfowl and sandhill cranes are managed within sustainable and socially-acceptable levels.
Continue to work in partnerships through the Prairie Habitat Joint Venture to ensure a strong
ongoing commitment to waterfowl habitat retention and improvement through the North
American Waterfowl Management Plan (NAWMP).
Short-term Management Strategies
Completion of a new five-year plan to direct NAWMP efforts in Saskatchewan.
Additional Information
Most recent provincial species plan:
Central Flyway Webless Migratory Game Bird Technical Committee. 2006. Management guidelines for
the mid-continent population of Sandhill cranes. Central Flyway Council Document.
Central Flyway Waterfowl Technical Committee. 2010. Management guidelines for hi-line Canada
geese. Central Flyway Council Document.
White-fronted Goose Subcommittee of the Central Flyway Waterfowl Technical Committee, the Arctic
Goose Committee of the Mississippi Flyway Game Bird Technical Section, and the Alaska
Department of Fish and Game, with assistance from representatives of the Canadian Wildlife Service
and U.S. Fish and Wildlife Service. 2015. Management plan for midcontinent greater white-fronted
geese. Flyway Council Document.
For additional information, please contact:
Katherine Conkin
Waterfowl Manager
Fish, Wildlife and Lands Branch
Ministry of Environment
102-112 Research Dr. Saskatoon, SK S7N 3R3
(306) 933-5304
94
Furbearers Furbearers include 21 species or species groups (e.g. hare, squirrel, weasel) in Saskatchewan that are
trapped and whose pelts are marketed. The trapping industry in Saskatchewan currently includes
almost 5,000 registered trappers and generates between $1 and $6 million in revenue every year from
the sale of pelts. Furbearers are a renewable resource and many trappers depend on raw fur sales to
supplement their annual income and therefore proper conservation management is important to ensure
the long-term sustainability of the resource and the trapping industry. A vibrant trapping industry is also
important since trappers play an important role in controlling numbers of some potentially problematic
species such as coyotes, wolves and beaver.
Since trapping seasons extend throughout the winter and into spring, some information presented in
this report is necessarily based on data from the trapping season that closed the year prior to
publication while some is based on the trapping season that closed in the current year.
Population Status Populations of furbearers are monitored using the Annual Status of Furbearers Survey and field reports
from the general public, landowners and Ministry of Environment staff. The Furbearer Survey moved to
an online format in 2017 and became part of the regular Harvest Survey available under the automated
licensing system.
Data is also collected on annual fur harvest however these data tend to track market conditions and so
are not reliable for tracking population trends. However, inferential conclusions about population
status are possible when harvest volumes fail to track markets in a predictable manner. For some
species such as wolverine that are not specifically targeted by trappers so that capture conditions
approach randomness, the number of animals harvested in a year can be indicative of populations but
these are only inferential since there is no measure of trapping effort available.
Survey Data
The Annual Status of Furbearers Survey asks trappers to assess the abundance of local furbearers. Each
is assigned a number between 0 and 4, with 0 corresponding to never being found in the area, 1 to
sometimes being found but not present in the year of interest, 2 to being scarce, 3 to being common
and 4 to being abundant. The average of all trappers reporting on the species is summarized in order to
determine if the species is abundant (>3.3), common (2.8 – 3.2), fairly common (2.3 – 2.7), uncommon
(2.0 – 2.3), scarce (<2.0) or never found (0). Species that are not found in the area are excluded from
the calculation and species that are not reported on are indicated with a “-“. Results of the survey are
shown in Table 32.
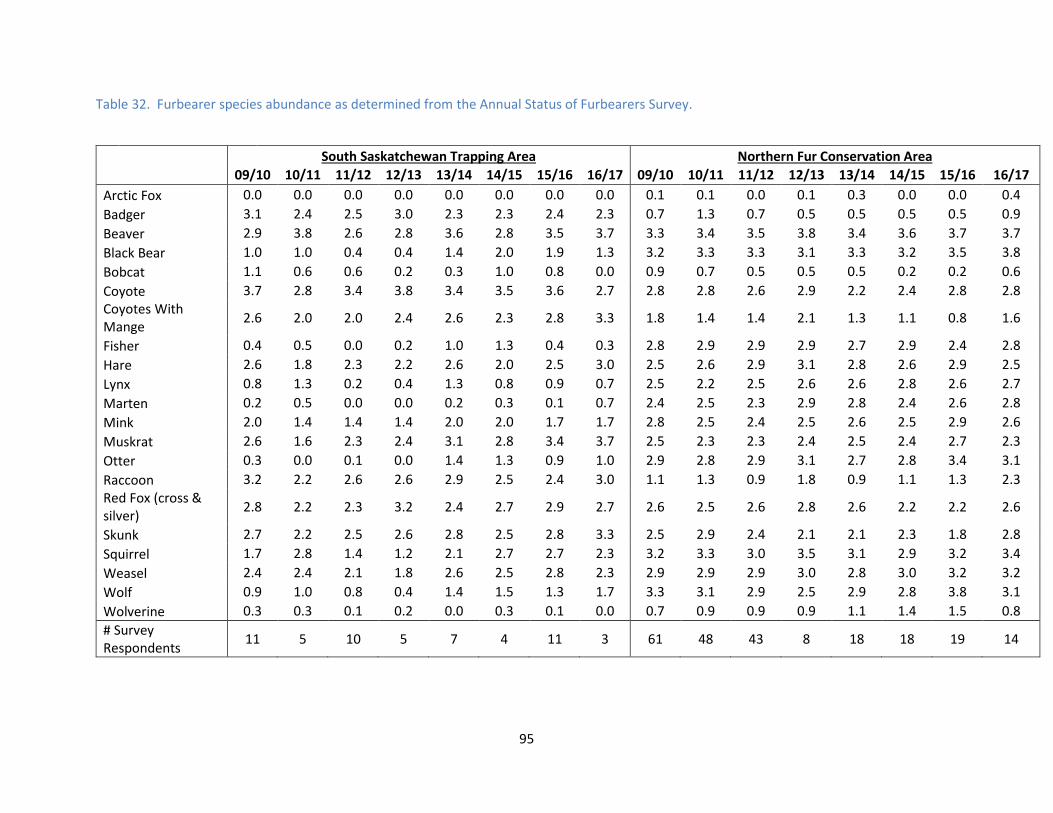
95
Table 32. Furbearer species abundance as determined from the Annual Status of Furbearers Survey.
South Saskatchewan Trapping Area Northern Fur Conservation Area
09/10 10/11 11/12 12/13 13/14 14/15 15/16 16/17 09/10 10/11 11/12 12/13 13/14 14/15 15/16 16/17
Arctic Fox 0.0 0.0 0.0 0.0 0.0 0.0 0.0 0.0 0.1 0.1 0.0 0.1 0.3 0.0 0.0 0.4
Badger 3.1 2.4 2.5 3.0 2.3 2.3 2.4 2.3 0.7 1.3 0.7 0.5 0.5 0.5 0.5 0.9
Beaver 2.9 3.8 2.6 2.8 3.6 2.8 3.5 3.7 3.3 3.4 3.5 3.8 3.4 3.6 3.7 3.7
Black Bear 1.0 1.0 0.4 0.4 1.4 2.0 1.9 1.3 3.2 3.3 3.3 3.1 3.3 3.2 3.5 3.8
Bobcat 1.1 0.6 0.6 0.2 0.3 1.0 0.8 0.0 0.9 0.7 0.5 0.5 0.5 0.2 0.2 0.6
Coyote 3.7 2.8 3.4 3.8 3.4 3.5 3.6 2.7 2.8 2.8 2.6 2.9 2.2 2.4 2.8 2.8
Coyotes With Mange
2.6 2.0 2.0 2.4 2.6 2.3 2.8 3.3 1.8 1.4 1.4 2.1 1.3 1.1 0.8 1.6
Fisher 0.4 0.5 0.0 0.2 1.0 1.3 0.4 0.3 2.8 2.9 2.9 2.9 2.7 2.9 2.4 2.8
Hare 2.6 1.8 2.3 2.2 2.6 2.0 2.5 3.0 2.5 2.6 2.9 3.1 2.8 2.6 2.9 2.5
Lynx 0.8 1.3 0.2 0.4 1.3 0.8 0.9 0.7 2.5 2.2 2.5 2.6 2.6 2.8 2.6 2.7
Marten 0.2 0.5 0.0 0.0 0.2 0.3 0.1 0.7 2.4 2.5 2.3 2.9 2.8 2.4 2.6 2.8
Mink 2.0 1.4 1.4 1.4 2.0 2.0 1.7 1.7 2.8 2.5 2.4 2.5 2.6 2.5 2.9 2.6
Muskrat 2.6 1.6 2.3 2.4 3.1 2.8 3.4 3.7 2.5 2.3 2.3 2.4 2.5 2.4 2.7 2.3
Otter 0.3 0.0 0.1 0.0 1.4 1.3 0.9 1.0 2.9 2.8 2.9 3.1 2.7 2.8 3.4 3.1
Raccoon 3.2 2.2 2.6 2.6 2.9 2.5 2.4 3.0 1.1 1.3 0.9 1.8 0.9 1.1 1.3 2.3
Red Fox (cross & silver)
2.8 2.2 2.3 3.2 2.4 2.7 2.9 2.7 2.6 2.5 2.6 2.8 2.6 2.2 2.2 2.6
Skunk 2.7 2.2 2.5 2.6 2.8 2.5 2.8 3.3 2.5 2.9 2.4 2.1 2.1 2.3 1.8 2.8
Squirrel 1.7 2.8 1.4 1.2 2.1 2.7 2.7 2.3 3.2 3.3 3.0 3.5 3.1 2.9 3.2 3.4
Weasel 2.4 2.4 2.1 1.8 2.6 2.5 2.8 2.3 2.9 2.9 2.9 3.0 2.8 3.0 3.2 3.2
Wolf 0.9 1.0 0.8 0.4 1.4 1.5 1.3 1.7 3.3 3.1 2.9 2.5 2.9 2.8 3.8 3.1
Wolverine 0.3 0.3 0.1 0.2 0.0 0.3 0.1 0.0 0.7 0.9 0.9 0.9 1.1 1.4 1.5 0.8
# Survey Respondents
11 5 10 5 7 4 11 3 61 48 43 8 18 18 19 14
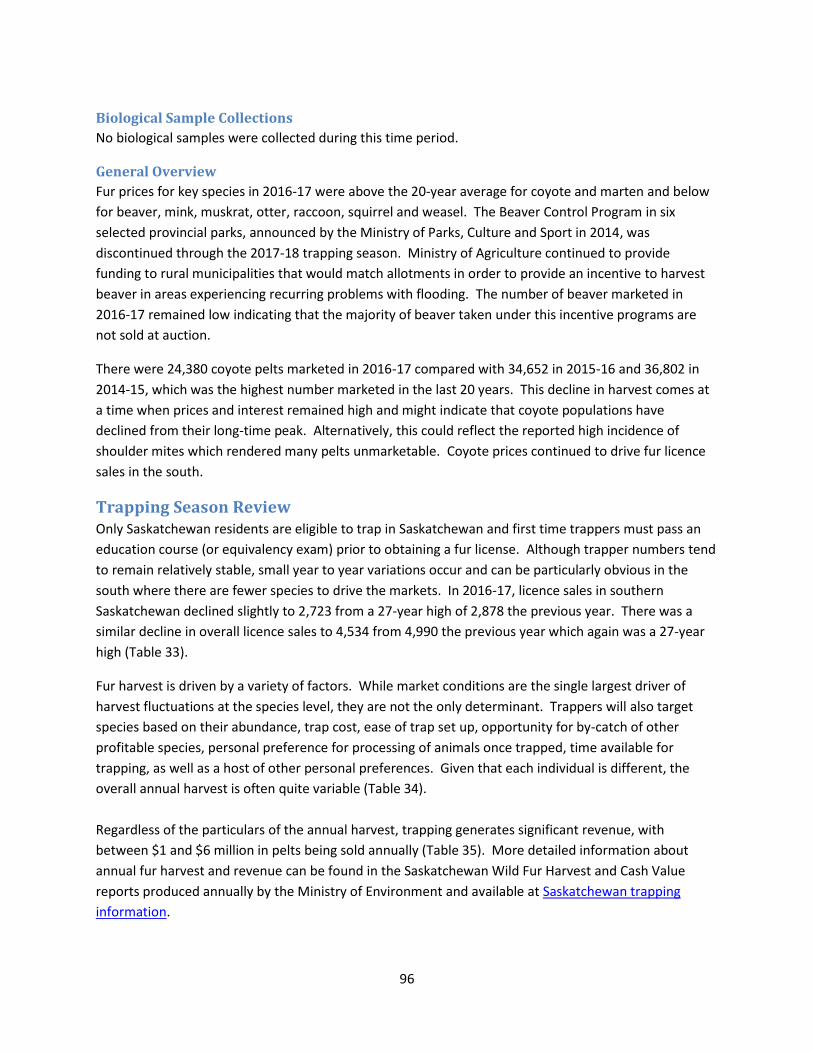
96
Biological Sample Collections
No biological samples were collected during this time period.
General Overview
Fur prices for key species in 2016-17 were above the 20-year average for coyote and marten and below
for beaver, mink, muskrat, otter, raccoon, squirrel and weasel. The Beaver Control Program in six
selected provincial parks, announced by the Ministry of Parks, Culture and Sport in 2014, was
discontinued through the 2017-18 trapping season. Ministry of Agriculture continued to provide
funding to rural municipalities that would match allotments in order to provide an incentive to harvest
beaver in areas experiencing recurring problems with flooding. The number of beaver marketed in
2016-17 remained low indicating that the majority of beaver taken under this incentive programs are
not sold at auction.
There were 24,380 coyote pelts marketed in 2016-17 compared with 34,652 in 2015-16 and 36,802 in
2014-15, which was the highest number marketed in the last 20 years. This decline in harvest comes at
a time when prices and interest remained high and might indicate that coyote populations have
declined from their long-time peak. Alternatively, this could reflect the reported high incidence of
shoulder mites which rendered many pelts unmarketable. Coyote prices continued to drive fur licence
sales in the south.
Trapping Season Review Only Saskatchewan residents are eligible to trap in Saskatchewan and first time trappers must pass an
education course (or equivalency exam) prior to obtaining a fur license. Although trapper numbers tend
to remain relatively stable, small year to year variations occur and can be particularly obvious in the
south where there are fewer species to drive the markets. In 2016-17, licence sales in southern
Saskatchewan declined slightly to 2,723 from a 27-year high of 2,878 the previous year. There was a
similar decline in overall licence sales to 4,534 from 4,990 the previous year which again was a 27-year
high (Table 33).
Fur harvest is driven by a variety of factors. While market conditions are the single largest driver of
harvest fluctuations at the species level, they are not the only determinant. Trappers will also target
species based on their abundance, trap cost, ease of trap set up, opportunity for by-catch of other
profitable species, personal preference for processing of animals once trapped, time available for
trapping, as well as a host of other personal preferences. Given that each individual is different, the
overall annual harvest is often quite variable (Table 34).
Regardless of the particulars of the annual harvest, trapping generates significant revenue, with
between $1 and $6 million in pelts being sold annually (Table 35). More detailed information about
annual fur harvest and revenue can be found in the Saskatchewan Wild Fur Harvest and Cash Value
reports produced annually by the Ministry of Environment and available at Saskatchewan trapping
information.
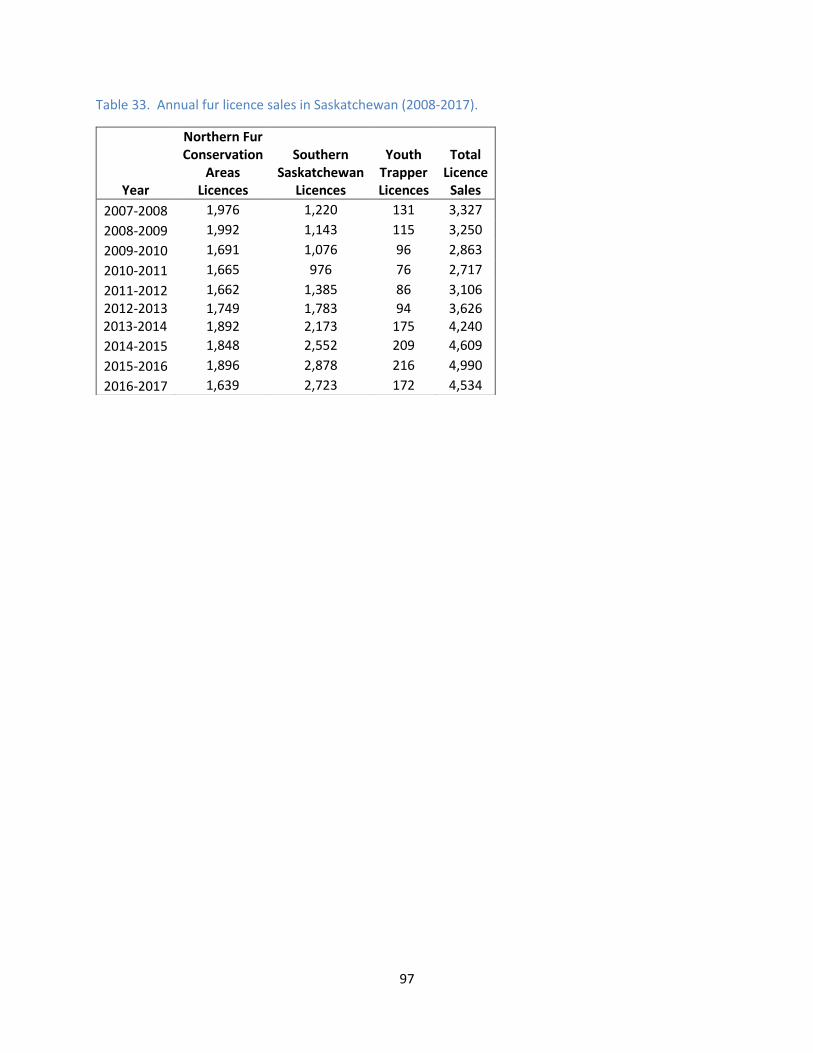
97
Table 33. Annual fur licence sales in Saskatchewan (2008-2017).
Year
Northern Fur Conservation
Areas Licences
Southern Saskatchewan
Licences
Youth Trapper Licences
Total Licence
Sales
2007-2008 1,976 1,220 131 3,327
2008-2009 1,992 1,143 115 3,250
2009-2010 1,691 1,076 96 2,863
2010-2011 1,665 976 76 2,717
2011-2012 1,662 1,385 86 3,106
2012-2013 2013-2014
1,749 1,892
1,783 2,173
94 175
3,626 4,240
2014-2015 1,848 2,552 209 4,609
2015-2016 1,896 2,878 216 4,990
2016-2017 1,639 2,723 172 4,534
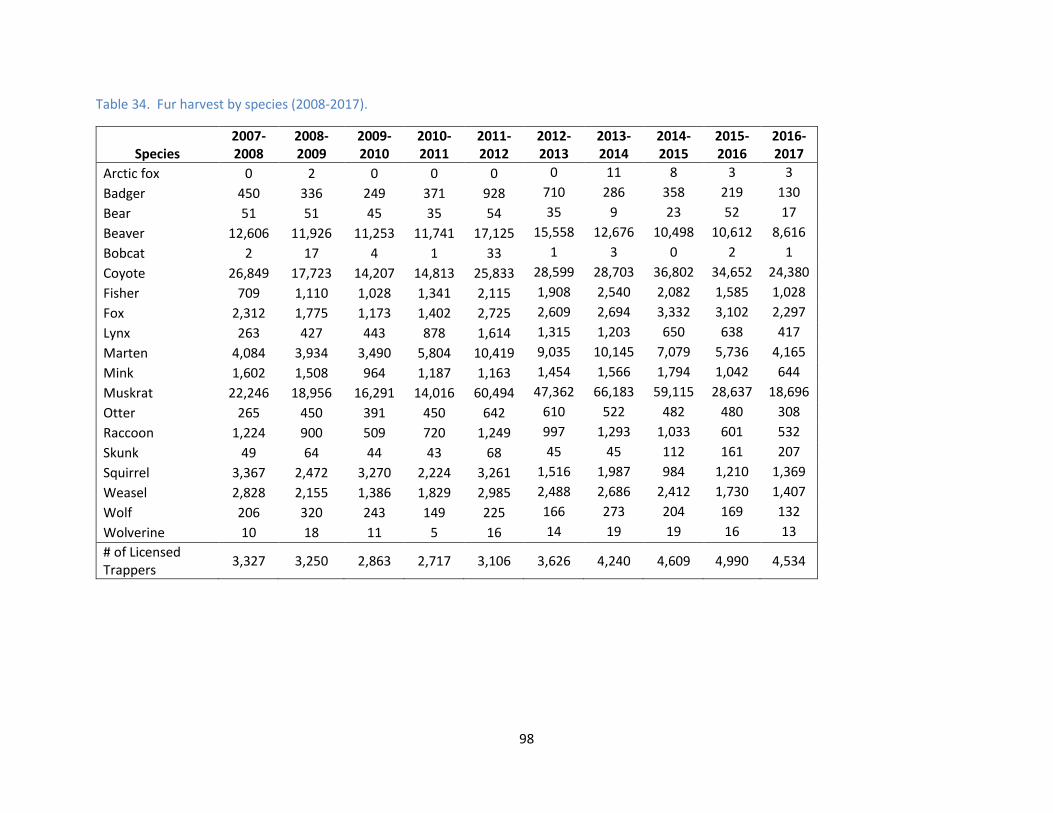
98
Table 34. Fur harvest by species (2008-2017).
Species 2007- 2008
2008- 2009
2009- 2010
2010- 2011
2011- 2012
2012- 2013
2013- 2014
2014- 2015
2015-2016
2016-2017
Arctic fox 0 2 0 0 0 0 11 8 3 3
Badger 450 336 249 371 928 710 286 358 219 130
Bear 51 51 45 35 54 35 9 23 52 17
Beaver 12,606 11,926 11,253 11,741 17,125 15,558 12,676 10,498 10,612 8,616
Bobcat 2 17 4 1 33 1 3 0 2 1
Coyote 26,849 17,723 14,207 14,813 25,833 28,599 28,703 36,802 34,652 24,380
Fisher 709 1,110 1,028 1,341 2,115 1,908 2,540 2,082 1,585 1,028
Fox 2,312 1,775 1,173 1,402 2,725 2,609 2,694 3,332 3,102 2,297
Lynx 263 427 443 878 1,614 1,315 1,203 650 638 417
Marten 4,084 3,934 3,490 5,804 10,419 9,035 10,145 7,079 5,736 4,165
Mink 1,602 1,508 964 1,187 1,163 1,454 1,566 1,794 1,042 644
Muskrat 22,246 18,956 16,291 14,016 60,494 47,362 66,183 59,115 28,637 18,696
Otter 265 450 391 450 642 610 522 482 480 308
Raccoon 1,224 900 509 720 1,249 997 1,293 1,033 601 532
Skunk 49 64 44 43 68 45 45 112 161 207
Squirrel 3,367 2,472 3,270 2,224 3,261 1,516 1,987 984 1,210 1,369
Weasel 2,828 2,155 1,386 1,829 2,985 2,488 2,686 2,412 1,730 1,407
Wolf 206 320 243 149 225 166 273 204 169 132
Wolverine 10 18 11 5 16 14 19 19 16 13
# of Licensed Trappers
3,327 3,250 2,863 2,717 3,106 3,626 4,240 4,609 4,990 4,534
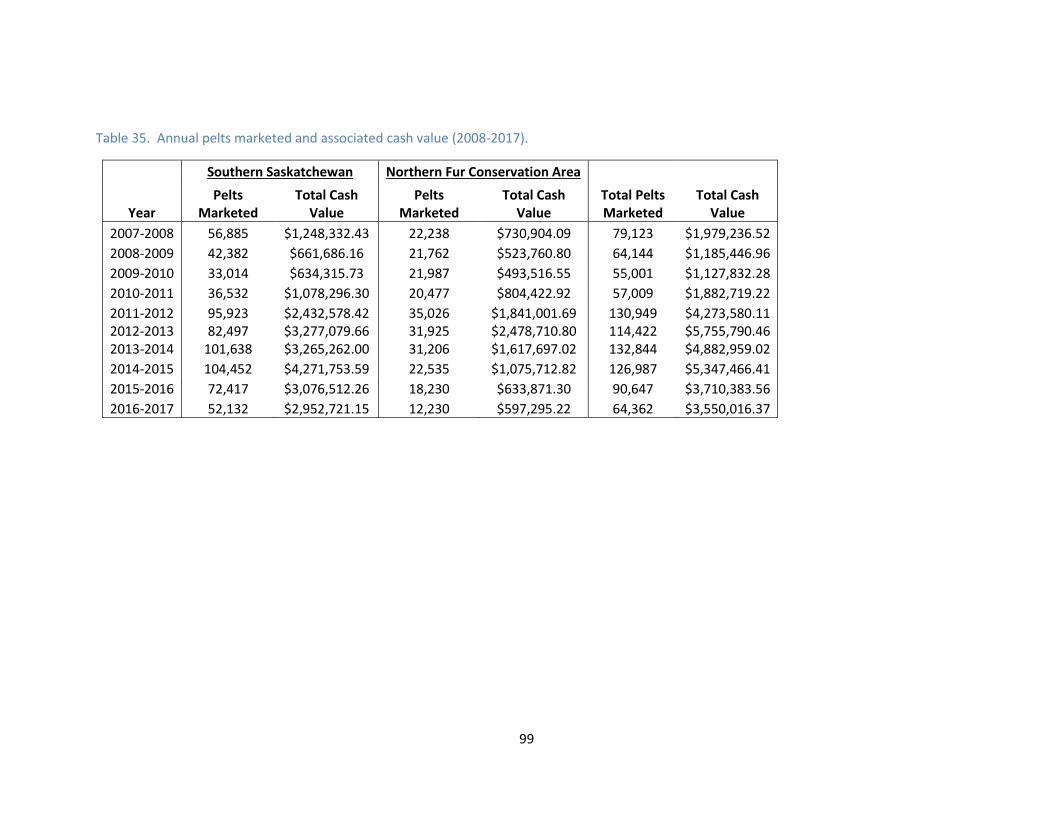
99
Table 35. Annual pelts marketed and associated cash value (2008-2017).
Southern Saskatchewan Northern Fur Conservation Area
Year Pelts
Marketed Total Cash
Value Pelts
Marketed Total Cash
Value Total Pelts Marketed
Total Cash Value
2007-2008 56,885 $1,248,332.43 22,238 $730,904.09 79,123 $1,979,236.52
2008-2009 42,382 $661,686.16 21,762 $523,760.80 64,144 $1,185,446.96
2009-2010 33,014 $634,315.73 21,987 $493,516.55 55,001 $1,127,832.28
2010-2011 36,532 $1,078,296.30 20,477 $804,422.92 57,009 $1,882,719.22
2011-2012 95,923 $2,432,578.42 35,026 $1,841,001.69 130,949 $4,273,580.11 2012-2013 2013-2014
82,497 101,638
$3,277,079.66 $3,265,262.00
31,925 31,206
$2,478,710.80 $1,617,697.02
114,422 132,844
$5,755,790.46 $4,882,959.02
2014-2015 104,452 $4,271,753.59 22,535 $1,075,712.82 126,987 $5,347,466.41
2015-2016 72,417 $3,076,512.26 18,230 $633,871.30 90,647 $3,710,383.56
2016-2017 52,132 $2,952,721.15 12,230 $597,295.22 64,362 $3,550,016.37
100
Research Initiatives Trap testing research is ongoing and based on the priorities determined by the Canadian Wildlife
Directors Committee. Traps meeting the killing efficiency standards of the Agreement on International
Humane Trapping Standards are certified for continued use for the appropriate species. See also under
Black Bear and Gray Wolf.
Management Objectives and Strategies
Long-term Management Objectives
Continue to maintain a viable fur harvesting industry in Saskatchewan and to ensure there is
training and regulatory support for attracting new trappers and managing human-wildlife
conflicts.
Short-term Management Strategies
Work with Saskatchewan trapper’s organizations, Ministry of Agriculture and Saskatchewan
Crop Insurance Corporation to coordinate approaches for dealing with problem furbearers.
Additional Information
Most recent provincial species plan:
Koback, L. 2017. Saskatchewan Wild Fur Harvest and Cash Values 2016-17. Fish, Wildlife & Lands Branch
Summary Report. Saskatoon, SK.
For additional information, please contact:
Mike Gollop
Furbearer and Carnivore Manager
Fish, Wildlife and Lands Branch, Ministry of Environment
102-112 Research Dr. Saskatoon, SK S7N 3R3
(306) 933-5767
Or
Lois Koback
Fur Harvest Statistics Coordinator
Fish, Wildlife and Lands Branch, Ministry of Environment
102-112 Research Dr. Saskatoon, SK S7N 3R3
(306) 933-5766
101
Gray Wolf (Canis lupus) Wolf management is the concern of a wide variety of government agencies, professional organizations
and public groups. They are protected in Saskatchewan as a furbearer and a big game species, but most
management effort has traditionally been directed toward dealing with human-wildlife conflicts
associated with the species.
A regular hunting season for gray wolf was added in 2017 following pilot programs in each of the three
preceding years. The season was restricted to wildlife management zones along the forest fringe not
within the Northern Fur Conservation area.
Population Status There are no formal surveys of wolf populations in Saskatchewan. Provincial populations were
estimated in 2006 using a linear regression model of the relationship of wolf density and ungulate
biomass and a habitat model based on typical densities reported in the literature for habitat types
prevalent in Saskatchewan. The ungulate biomass method yielded an estimated provincial population of
2,719 wolves based on predicted densities of one wolf/150 km2 in the forest fringe (WMZs 37, 43, 47-55)
and forest (WMZ 56-69) and one wolf/400 km2 in the shield (WMZs 70-76). The habitat method
resulted in an estimate of 3,773 wolves based on predicted densities of one wolf/70 km2 in the forest
fringe, 1/50 km2 in the forest and 1/200 km2 in the shield.
There are no new data that could be applied to improve these estimates, however anecdotally there is
some indication that resident wolf densities in the forest fringe may have increased since the 2006
estimates. Populations along the forest fringe have historically tended to fluctuate quite widely
apparently in relation to available food resources so there is no evidence that increasing the predicted
density in this region would improve the long-term estimate. Any long-term increase in provincial
population would likely be the result of range expansions which appear to be occurring along the
southern forest fringe and in isolated pockets on the prairies.
Survey Data
There was no formal population survey conducted for wolves during 2017. A wolf population index is
derived from the Annual Status of Furbearers Survey that is aimed primarily at trappers. Since this
survey began the sample size of trappers reporting has generally been too small to assess trends with
any confidence. However, in 2017 the furbearer survey was added to the regular hunter harvest survey
available online through the automated licensing system. This resulted in a significant increase in the
number of trappers responding and will be summarized in next year’s report.
An indirect measure of abundance is also obtained from export records of wolf pelts marketed by
trappers. These data mainly reflect trapper effort as influenced by market prices but can indicate
population declines where predicted harvest fails to mirror market peaks. Wolf harvest data are
presented in Table 32.
Also, with the addition of a regular season hunting opportunity for wolves, the holders of a wolf licence
were also included in the 2017 hunter harvest survey. Results of this survey are shown in Table 36.
102
Biological Sample Collections
Over 25 hair, blood and tissue samples were collected from legally harvested wolves during 2016 as part
of the University of Saskatchewan Boreal Wolf research project. Samples will be used to understand
wolf genetic population structure in Saskatchewan. No samples were collected in 2017.
General Overview
Although complaints persisted in some areas around wolves impacting moose populations there was no
widespread anecdotal evidence to support that wolf populations along the forest fringe were above
long-term norms. Compensated livestock losses to wolves were also at normal levels. There were 29
Rural Municipalities in the Wolf Management Area (WMA; Figure 18) in 2017. Policy allows these
municipalities access to some wolf harvest methods not available outside the WMA.
Survey data from all sources as well as anecdotal reports from ministry field staff and general public
seem to indicate populations at normal levels with typical anomalies in distribution resulting in pockets
with higher densities.
Hunting Season Review Saskatchewan did not have a hunting season for wolves prior to 2014. The pilot wolf hunt in WMZ 49
was continued in 2015 with 100 licences (200 tags) offered and an additional hunt was conducted in
WMZ 53. The 2015 hunts ran from December 15 through March 31, 2016. The pilot hunt was again
expanded in 2016 when it was open across the forest fringe in WMZs 43, 47, 48, 49, 50, 53, 54, 55 and
68 North with the season open from October 15, 2016 to March 31, 2017. A formal regular season was
initiated in 2017-18 encompassing the 2016-17 zones and season dates. Results of all hunts are shown
in Table 36.
Research Initiatives Wolf research was initiated in March 2014 as a part of a larger project studying woodland caribou in
Saskatchewan’s Northern Boreal Shield. Over the first year, 37 wolves in more than 20 packs spanning
across northern Saskatchewan were fitted with GPS satellite collars designed to provide three years of
location data. The project is ongoing, with research focused on understanding wolf habitat selection
patterns in the Shield, and in particular, how caribou respond to wolf space-use patterns. Research on
wolves uniquely large home range size is also underway.
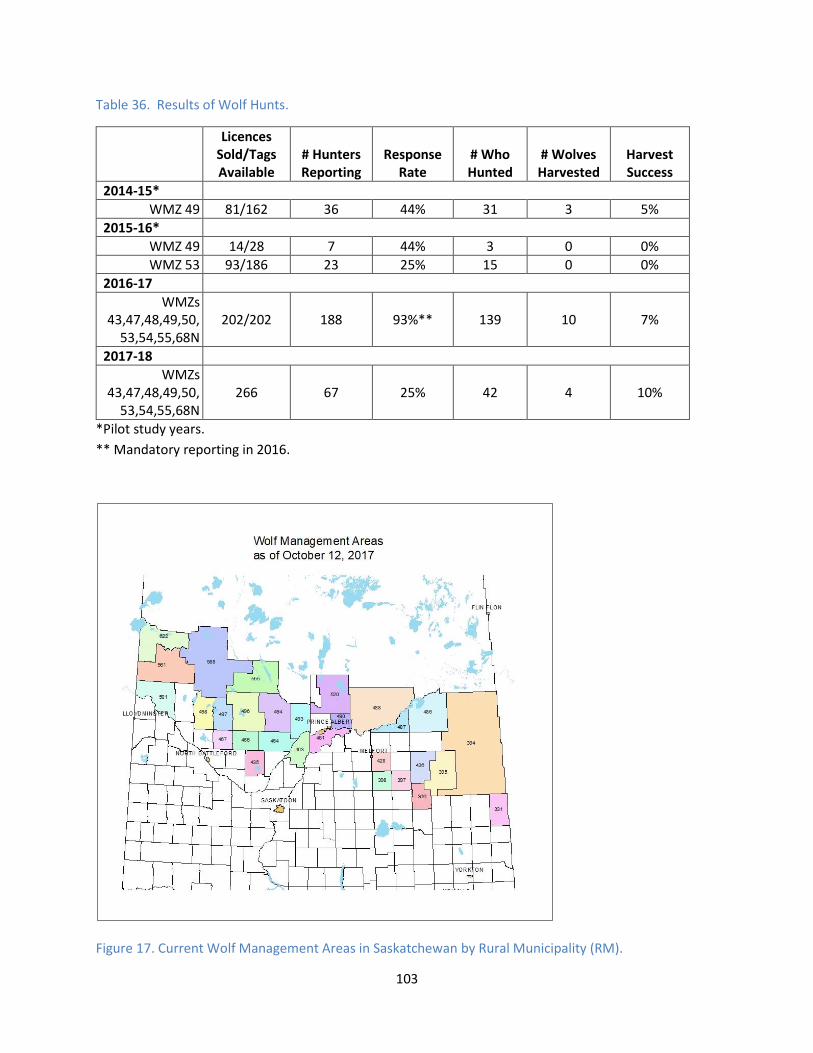
103
Table 36. Results of Wolf Hunts.
Licences Sold/Tags Available
# Hunters Reporting
Response Rate
# Who Hunted
# Wolves Harvested
Harvest Success
2014-15*
WMZ 49 81/162 36 44% 31 3 5%
2015-16*
WMZ 49 14/28 7 44% 3 0 0%
WMZ 53 93/186 23 25% 15 0 0%
2016-17
WMZs 43,47,48,49,50,
53,54,55,68N 202/202 188 93%** 139 10 7%
2017-18
WMZs 43,47,48,49,50,
53,54,55,68N 266 67 25% 42 4 10%
*Pilot study years.
** Mandatory reporting in 2016.
Figure 17. Current Wolf Management Areas in Saskatchewan by Rural Municipality (RM).
104
Management Objectives and Strategies
Long-term Management Objectives
Monitor and document wolf range in Saskatchewan.
Increase sample size reporting on the population index survey.
Improve harvest data by accessing export data for wolves retained for personal use and by
acquiring better data on wolves harvested, but not marketed, by trappers.
Monitor hunter harvest and other related mortality.
Create long-term management units.
Short-term Management Strategies
Analyze and assess future use of hunting as a wolf management tool.
Document wolf distribution from field reports.
Additional Information
Most recent provincial species plan: Seguin, R. J. 1991. A Wolf Management Strategy for Saskatchewan.
Editors Mike Gollop (chair), Dave Brewster, Wayne Runge, Tim Trottier. Wildlife Population
Management. Information Base, 91-WPM-4
For additional information, please contact:
Mike Gollop
Furbearer and Carnivore Manager
Fish, Wildlife and Lands Branch
Ministry of Environment
102-112 Research Dr. Saskatoon, SK S7N 3R3
(306) 933-5767
105
Additional Species
Cougar (Puma concolor) Cougars are one of the most evasive and secretive of all wildlife. Like many species, cougar numbers
dropped and their range decreased dramatically following settlement of the prairies. Beginning about
the turn of this century there was an increasing number of cougar sightings outside of the traditional
post-settlement range. This trend occurred in western and mid-western jurisdictions across the
continent, including Saskatchewan. Cougar sightings in Saskatchewan have since been confirmed across
the south and as far north as La Ronge and Wintego Lake. Breeding populations have been confirmed in
the Cypress Hills, Glaslyn and Porcupine Hills areas with suspected breeding in Moose Mountain and
across the parkland-boreal forest interface.
Population Status
Saskatchewan cougar populations are managed based on accepted principles of conservation weighted
by trends in the occurrence of human and livestock conflicts. Saskatchewan has never offered hunting or
trapping seasons. However, in 2016 legislation was advanced in support of a trapping season which was
initiated in 2017. This was in response to increasing human conflicts in southwest Saskatchewan where
local cougar populations have increased substantially since the first confirmation of a breeding
population in 2006. Cougars are protected under Saskatchewan’s Wildlife Regulations; however,
landowners have the right to kill a cougar in order to protect their livestock or property. Any cougar
killed must be reported to the Ministry of Environment immediately.
Research Initiatives
There is currently no research being undertaken on cougars in Saskatchewan. In 2010, University of
Alberta master’s student, Carl Morrison, began work building on previous cougar research conducted in
the Cypress Hills (Bacon 2010). Using GPS radio collars and wildlife cameras, the focus of this research
examined the cougars' spatial and temporal behavioral response to a seasonal flux in human use and
evaluated habitat selection, movement and dispersal in an isolated and naturally fragmented
landscape. This work was completed in 2013.
Survey Results
As a result of cougar being named a furbearer they will be included in the 2018 online furbearer survey.
They were not included in 2017 and the harvest results from trapping are not available at this time.
There were 21 cougars taken by ministry staff, predator control specialists or landowners under problem
wildlife legislation in 2017.
Additional Information
Most recent provincial species plan: None available.
106
For additional information, please contact: Mike Gollop
Furbearer and Carnivore Manager
Fish, Wildlife and Lands Branch, Ministry of Environment
102-112 Research Dr. Saskatoon, SK S7N 3R3
(306) 933-5767 or [email protected]
Literature Cited Arsenault, A. 2000. Status and management of moose (Alces alces) in Saskatchewan. Saskatchewan
Environment and Resource Management. Fish and Wildlife Technical Report 2000-01. 84pp.
Arsenault, A. 2005. Status and Management of Wildlife in Saskatchewan, 2002 and 2003. Saskatchewan
Environment, Resource Technical Report 2005-2. 89pp.
Arsenault, A. 2007. Management strategy for pronghorn (Antilocapra americana) in Saskatchewan.
Saskatchewan Ministry of Environment. Fish and Wildlife Technical Report 2008-01. 34pp.
Arsenault, A. 2008. Saskatchewan elk (Cervus elaphus) Management Plan – Update. Saskatchewan
Ministry of Environment, Fish and Wildlife Branch Technical Report 2008-02. 63pp. (Unpublished)
Bacon, M. 2010. The ecology of a re-established cougar (Puma concolor) population in southeastern
Alberta and southwestern Saskatchewan. M.Sc. Thesis, University of Alberta, Edmonton, AB,
Canada.
Beverly and Qamanirjuaq Caribou Management Board. 2005. Beverly and Qamanirjuaq Caribou
Management Plan 2005-2012. Technical Report.
BirdLife International and Handbook of the Birds of the World. 2016. Bird species distribution maps of
the world. Version 6.0. Available at http://datazone.birdlife.org/species/requestdis
Brewster, D. 1993. Reproductive performance and fetal developments of white-tailed deer in
Saskatchewan. Saskatchewan Natural Resources. Wildlife Technical Report 93-1. 41pp.
Brook, R. K. 2014. Habitat Selection, Movements, and Vehicular Collision Risk of Moose in the
Agricultural Landscape of Saskatchewan. Progress Report for the Period March 2013 – Jan 2014.
36pp. (Unpublished)
Brook, R. K., M.P. LaForge, A.L. Wheeler and N.L. Michel. 2016. Habitat Selection, Home Range,
Movements, and Reproductive Success of Adult Female Moose in the Agricultural Landscape of
Saskatchewan. Final Technical Report. 188pp. (Unpublished)
Caras, R. 1967. North American Mammals: Fur-Bearing Animals of the United States and Canada. New York: Meredith Press.
107
Central Flyway Webless Migratory Game Bird Technical Committee. 2006. Management guidelines for
the mid-continent population of Sandhill cranes. Central Flyway Council Document.
Central Flyway Waterfowl Technical Committee. 2010. Management guidelines for hi-line Canada geese.
Central Flyway Council Document.
Couldwell, G. 1976. Deer food purchase program. Saskatchewan Department of Natural Resources.
Wildlife Bulletin, 76-W-8.
Couldwell, G. 1979. Mortality of white-tailed deer in Saskatchewan in the 1978-1979 winter.
Saskatchewan Parks and Renewable Resources. Wildlife Bulletin, 79-WPM-12.
Couldwell, G. 1980. Mortality of white-tailed deer in Saskatchewan in the 1979-1980 winter.
Saskatchewan Tourism and Renewable Resources. Wildlife Bulletin, 80-W-8.
Czaplewski, R., D. Crowe, and L. McDonald. 1993. Sample sizes and confidence intervals for wildlife
population ratios. Wildlife Society Bulletin 11(2):121-128.
Department of Tourism and Renewable Resources. 1980. Saskatchewan game bird management
objectives and strategies for the 80’s. Fisheries and Wildlife Branch. Regina, SK
Derek Murray Consulting Associates. 2006. Economic Evaluation of Saskatchewan’s Outfitted Hunting
and Fishing Industry. A technical report prepared by Derek Murray Consulting Associates for
Saskatchewan Environment.
DeVivo MT, Edmunds DR, Kauffman MJ, Schumaker BA, Binfet J, et al. (2017) Endemic chronic wasting
disease causes mule deer population decline in Wyoming. PLOS ONE 12(10).
Dubovsky, J. A. 2017. Status and harvests of sandhill cranes: Mid-Continent, Rocky Mountain, Lower
Colorado River Valley and Eastern Populations. Administrative Report, U.S. Fish and Wildlife Service,
Lakewood, Colorado. 15pp.
Dubovsky, J. A., compiler. 2017. Central Flyway harvest and population survey data book 2016. U.S. Fish
and Wildlife Service, Lakewood CO.
Dulberger, J. N. Thompson Hobbs, H. M. Swanson, C. J. Bishop, and M. W. Miller. 2010. Estimating chronic
wasting disease effects on mule deer recruitment and population growth. J. of Wildlife Management 46:
1086-1095.
Edmunds DR, Kauffman MJ, Schumaker BA, Lindzey FG, Cook WE, et al. 2016. Chronic Wasting Disease
Drives Population Decline of White-Tailed Deer. PLOS ONE 11(8).
InterGroup Consultants Ltd. 2013. Economic Valuation and Socio-Cultural Perspectives of the Estimated
Harvest of the Beverly and Qamanirjuaq Caribou Herds. Submission to Beverly and Qamanirjuaq
Caribou Management Board. Stonewall, Manitoba. 58pp.
108
Koback, L. 2017. Saskatchewan Wild Fur Harvest and Cash Values 2016-17. Fish and Wildlife Branch
Summary Report. Saskatoon, SK.
Laforge, M.P., N.L. Michel, A.L. Wheeler, and R.K. Brook. 2016. Habitat selection by female moose in the
Canadian prairie ecozone. Journal of Wildlife Management 80:1059-1068.
Mamun, A. A. and R.K. Brook. 2017. Characterizing, Mapping and Modelling Aboriginal Traditional
Knowledge about Woodland Caribou in Saskatchewan in Support of Range Planning. Final Report to
the Saskatchewan Ministry of Environment. University of Saskatchewan. 119pp. (Unpublished)
McLoughlin, P. D., K. Stewart, C. Superbie, T. Perry, P. Tomchuk, R. Greuel, K. Singh, A. Truchon-Savard, J.
Henkelman, and J. F. Johnstone. 2016. Population dynamics and critical habitat of woodland caribou
in the Saskatchewan Boreal Shield. Interim Project Report, 2013–2016. Department of Biology,
University of Saskatchewan, Saskatoon. 162pp.
Miller, M.W., H. M. Swanson, L.L. Wolfe, F.G. Quartoarone, S.L. Huwer, C. H. Southwick, and P. M.
Luckacs. 2008. Lions and prions and deer demise. PLoS ONE 3: e4019.
Monello, E., J. G. Powers, N. Thompson Hobbs, T. R. Spraker, M.K. Watry, M.A. Wild. 2014. Survival and
population growth of a free ranging elk population with a long history of exposure to chronic
wasting disease. J. of Wildlife Management 78: 214-223.
Priadka, P. 2015. Genetic Connectivity of Boreal Woodland Caribou (Rangifer tarandus caribou) in
Central Canada. Faculty of Graduate Studies of The University of Manitoba; Thesis for the degree of
Master of Natural Resources Management. Natural Resources Institute. Winnipeg, Canada. 125pp.
Saskatchewan Environment. 2007. Recovery Strategy for Boreal Woodland Caribou (Rangifer tarandus
caribou) in Saskatchewan. Saskatchewan Environment. Fish and Wildlife Technical Report 2007.
46pp. (Unpublished)
Saskatchewan Ministry of Environment. 2012. Recovery Plan For Boreal Woodland Caribou (Rangifer
tarandus caribou) in Saskatchewan. Saskatchewan Ministry of Environment. Fish and Wildlife
Technical Report 2012 – pending review.
Scheaffer, R., W. Mendenhall, and L. Ott. 1990. Elementary Survey Sampling, 4th Ed. PWS-Kent Publishing
Co., Boston. ISBN 0-534-92185-X. 390pp.
Seguin, R. J. 1991. A Wolf Management Strategy for Saskatchewan. Editors Mike Gollop (chair), Dave
Brewster, Wayne Runge, Tim Trottier. Wildlife Population Management. Information Base, 91-WPM-
4.
Stewart, R. 1983. The stratified random block aerial survey technique. Saskatchewan Parks and
Renewable Resources. Wildlife Population Management. Information Base, 83-WPM-12.

109
White-fronted Goose Subcommittee of the Central Flyway Waterfowl Technical Committee, the Arctic
Goose Committee of the Mississippi Flyway Game Bird Technical Section, and the Alaska
Department of Fish and Game, with assistance from representatives of the Canadian Wildlife Service
and U.S. Fish and Wildlife Service. 2015. Management plan for midcontinent greater white-fronted
geese. Flyway Council Document.
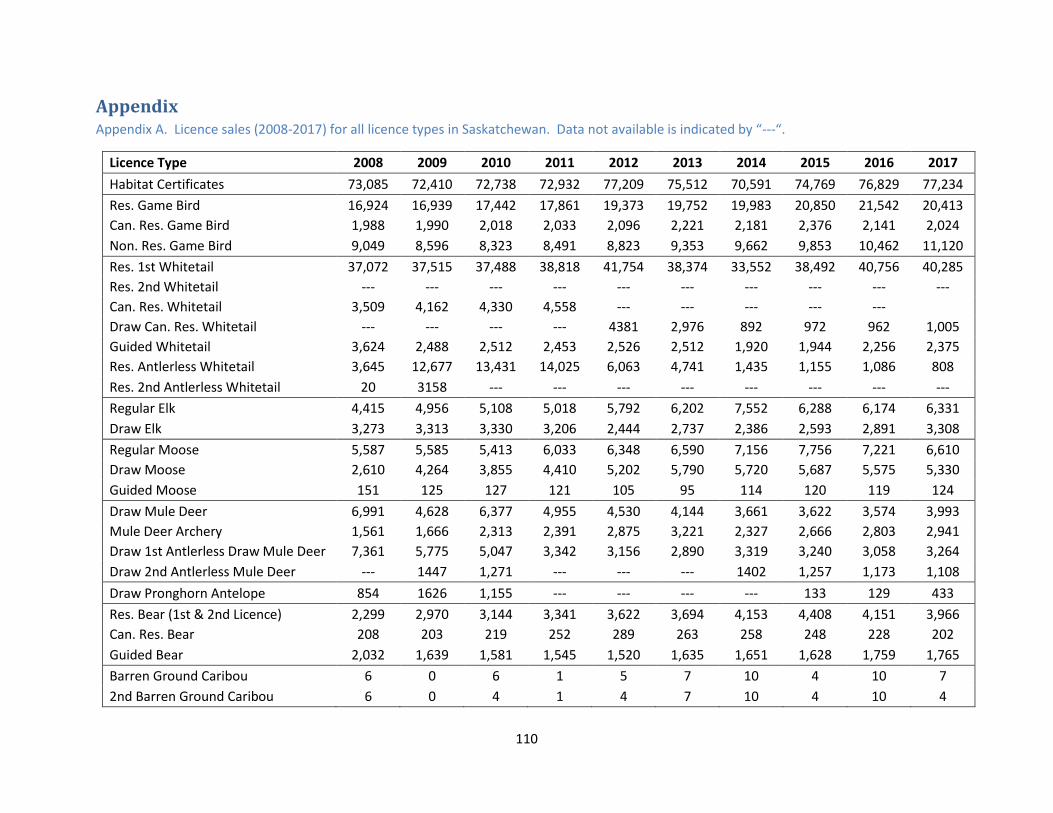
110
Appendix Appendix A. Licence sales (2008-2017) for all licence types in Saskatchewan. Data not available is indicated by “---“.
Licence Type 2008 2009 2010 2011 2012 2013 2014 2015 2016 2017
Habitat Certificates 73,085 72,410 72,738 72,932 77,209 75,512 70,591 74,769 76,829 77,234
Res. Game Bird 16,924 16,939 17,442 17,861 19,373 19,752 19,983 20,850 21,542 20,413
Can. Res. Game Bird 1,988 1,990 2,018 2,033 2,096 2,221 2,181 2,376 2,141 2,024
Non. Res. Game Bird 9,049 8,596 8,323 8,491 8,823 9,353 9,662 9,853 10,462 11,120
Res. 1st Whitetail 37,072 37,515 37,488 38,818 41,754 38,374 33,552 38,492 40,756 40,285
Res. 2nd Whitetail --- --- --- --- --- --- --- --- --- ---
Can. Res. Whitetail 3,509 4,162 4,330 4,558 --- --- --- --- ---
Draw Can. Res. Whitetail --- --- --- --- 4381 2,976 892 972 962 1,005
Guided Whitetail 3,624 2,488 2,512 2,453 2,526 2,512 1,920 1,944 2,256 2,375
Res. Antlerless Whitetail 3,645 12,677 13,431 14,025 6,063 4,741 1,435 1,155 1,086 808
Res. 2nd Antlerless Whitetail 20 3158 --- --- --- --- --- --- --- ---
Regular Elk 4,415 4,956 5,108 5,018 5,792 6,202 7,552 6,288 6,174 6,331
Draw Elk 3,273 3,313 3,330 3,206 2,444 2,737 2,386 2,593 2,891 3,308
Regular Moose 5,587 5,585 5,413 6,033 6,348 6,590 7,156 7,756 7,221 6,610
Draw Moose 2,610 4,264 3,855 4,410 5,202 5,790 5,720 5,687 5,575 5,330
Guided Moose 151 125 127 121 105 95 114 120 119 124
Draw Mule Deer 6,991 4,628 6,377 4,955 4,530 4,144 3,661 3,622 3,574 3,993
Mule Deer Archery 1,561 1,666 2,313 2,391 2,875 3,221 2,327 2,666 2,803 2,941
Draw 1st Antlerless Draw Mule Deer 7,361 5,775 5,047 3,342 3,156 2,890 3,319 3,240 3,058 3,264
Draw 2nd Antlerless Mule Deer --- 1447 1,271 --- --- --- 1402 1,257 1,173 1,108
Draw Pronghorn Antelope 854 1626 1,155 --- --- --- --- 133 129 433
Res. Bear (1st & 2nd Licence) 2,299 2,970 3,144 3,341 3,622 3,694 4,153 4,408 4,151 3,966
Can. Res. Bear 208 203 219 252 289 263 258 248 228 202
Guided Bear 2,032 1,639 1,581 1,545 1,520 1,635 1,651 1,628 1,759 1,765
Barren Ground Caribou 6 0 6 1 5 7 10 4 10 7
2nd Barren Ground Caribou 6 0 4 1 4 7 10 4 10 4
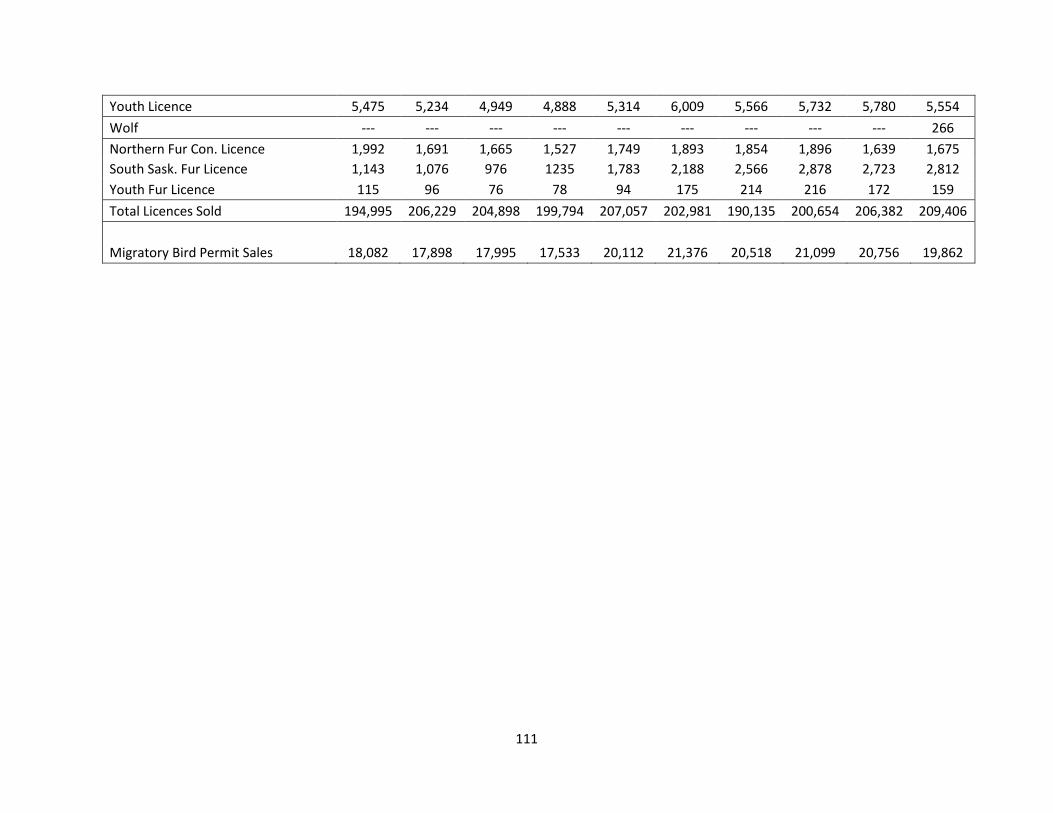
111
Youth Licence 5,475 5,234 4,949 4,888 5,314 6,009 5,566 5,732 5,780 5,554
Wolf --- --- --- --- --- --- --- --- --- 266
Northern Fur Con. Licence 1,992 1,691 1,665 1,527 1,749 1,893 1,854 1,896 1,639 1,675
South Sask. Fur Licence 1,143 1,076 976 1235 1,783 2,188 2,566 2,878 2,723 2,812
Youth Fur Licence 115 96 76 78 94 175 214 216 172 159
Total Licences Sold 194,995 206,229 204,898 199,794 207,057 202,981 190,135 200,654 206,382 209,406
Migratory Bird Permit Sales 18,082 17,898 17,995 17,533 20,112 21,376 20,518 21,099 20,756 19,862
Related Documents