Welcome message from author
This document is posted to help you gain knowledge. Please leave a comment to let me know what you think about it! Share it to your friends and learn new things together.
Transcript


A world-wide community demand for accountability when producing food products was the catalystfor, the Vegetable and Potato Growers’ of Western Australia to produce a Code of Practice and a BestEnvironmental Management Practices Reference Manual.
The Code and Manual were compiled by:-• Potato Growers’ Association of WA (Inc) • Department of Agriculture Western Australia• WA Vegetable Growers Association (Inc) • Water and Rivers Commission• Department of Environmental Protection • Western Potatoes
Personnel:-Project CommitteeJim Turley, Executive Producer, Potato Growers’ Association of WA (Inc)Ben Rose, Principal Author, Department of Agriculture WACaroline Raphael/Ron Powell, Department of Environmental ProtectionSandra Franz/Rachael Spencer, Water and Rivers CommissionNeil Graham, Western PotatoesJohn Warren, Department of Agriculture WA
Further Significant Contributors to the text material and review input were:-Sam Calameri, President WA Vegetable Growers’ Association (Inc)David Anderson, Vegetable and Potato GrowerMark Feldwick, Department of HealthLen Gordon, Worksafe Western AustraliaProf. Lyn Abbott, Dr Dan Murphy, University of WAHenry Brockman, Department of Agriculture WAJohn Burt, Department of Agriculture WATim Calder, Department of Agriculture WAStuart Learmonth, Department of Agriculture WABob Paulin, Department of Agriculture WAAllan McKay, Department of Agriculture WADr Ian McPharlin, Department of Agriculture WACatherine Nind, Department of Agriculture WAPhil Ross, Department of Agriculture WAChris Sharpe, Peter Tille, Department of Agriculture WALeigh Walters, Australian Potato Industry Technology Transfer ProjectHeidi Buckton, Cockburn Sound Management Council
Production and Publishing:-Editor, June Hutchison Desktop Publisher, Liz Berry – Berry GraphicsArtist, Susan Jacobs Publisher, Quality Press
Financial Contributors for Publishing:-Horticulture Australia Limited A.P.C. Potato Producers CommitteePotato Growers’ Association of WA (Inc) Western PotatoesWater and Rivers CommissionDepartment of Environmental Protection
Manjimup Land Conservation District Committee
Acknowledgements

Introduction ..................................................................................................1
1 Farm Planning ...........................................................................................4
1.1 Select suitable sites where environmental problems will be minimal ........................................................................................ 4
Starting a new horticultural enterprise..............................................................................................4Useful maps and reports ......................................................................................................................4
Site selection and planning ..................................................................................................................5Pre-purchase assessment......................................................................................................................5Water assessment ................................................................................................................................5Detailed soil survey .............................................................................................................................5Water supply construction plan ...........................................................................................................6
1.2 Plan the whole farm to minimise environmental impacts ...............................6Producing a physical farm plan for horticulture ..............................................................................6
Obtain an aerial photograph and maps of the farm.............................................................................6Obtain materials for mapping..............................................................................................................7Draw the first overlay maps ................................................................................................................7Detailed soil survey and soil map .......................................................................................................7Audit and plan water supply .............................................................................................................. 8Plan surface water control earthworks and drainage ..........................................................................8Outline workable cropping paddocks..................................................................................................9Plan fences, windbreaks, access tracks and other infrastructure.........................................................9Plan the irrigation system and layout ..................................................................................................9
References............................................................................................................................................10
2 Soil Management ...................................................................................11
2.1 Minimise or virtually eliminate soil erosion ......................................................12Observing the signs of erosion ..........................................................................................................12
Site water erosion risks ......................................................................................................................13Erosion prevention by surface water control...................................................................................14
Cross slope cultivation ......................................................................................................................14Basin tillage .......................................................................................................................................14 Installing surface water control earthworks ......................................................................................15 Permanent grade banks and grassed waterways................................................................................17Temporary grade furrows ..................................................................................................................19Using a clinometer to survey temporary grade furrows....................................................................20Using a laser level to survey earthworks ..........................................................................................21Purchasing or hiring equipment ........................................................................................................23Establishing grass cover to stabilise waterways................................................................................23
Cover crops..........................................................................................................................................24Soil-friendly methods of establishing post-harvest cover crops .......................................................25Practices that should not be used to sow cover crops .......................................................................26Cover crops and grazing....................................................................................................................26Re-establishing pasture by direct drilling..........................................................................................26
Contents

Wind protection ..................................................................................................................................27Windbreaks ........................................................................................................................................27Protecting bare cultivated soil ...........................................................................................................30Shelter crops ......................................................................................................................................30
All weather access ...............................................................................................................................30Rehabilitation of eroded or landslip areas .......................................................................................31
Gully filling procedure ......................................................................................................................31Rocked or concreted chutes...............................................................................................................33Treatment of landslips .......................................................................................................................34
2.2 Maintain or improve soil physical and biological health ...............................34Understanding soil quality and health..............................................................................................34Field tests for soil health ....................................................................................................................34
How to test soil health.......................................................................................................................35Procedure for ten soil tests ................................................................................................................36Recording the health of your soil ......................................................................................................39Modifying soil management to treat soil health problems................................................................43Water repellent soils ..........................................................................................................................43
Minimising soil compaction ...............................................................................................................44Minimising cultivation .......................................................................................................................44Guidelines for good cultivation practice ..........................................................................................45
Implements ........................................................................................................................................46Minimising the impacts of soil fumigation .......................................................................................47Other soil management techniques....................................................................................................47
Cropping rotations..............................................................................................................................48Increasing soil organic matter ...........................................................................................................48
Green mulching .................................................................................................................................49Applying compost..............................................................................................................................49Compost for sustainable horticultural production systems ...............................................................49
Claying of light sands .........................................................................................................................52Site specific soil management strategies ...........................................................................................54
2.3 Manage soil and drainage to minimise export of nutrients and chemicals.......................................................................................... 54
Export of nutrients and chemicals ....................................................................................................54Erosion .................................................................................................................................................54Leaching...............................................................................................................................................54Waterlogged sites ................................................................................................................................54Correct drainage practice ..................................................................................................................54
Shallow broad-based drains...............................................................................................................55Interceptor banks ...............................................................................................................................56Sub-surface drainage .........................................................................................................................56

2.4 Manage soil acidity, sodicity, salinity and other soil chemical problems ....................................................................................................56
Soil acidity ...........................................................................................................................................56Liming ...............................................................................................................................................57
Soil salinity ..........................................................................................................................................59Identifying and managing saline land ..............................................................................................59
Measuring soil salinity ......................................................................................................................59Revegetating saline land....................................................................................................................60Sub-surface drainage .........................................................................................................................60
Irrigation salinity ................................................................................................................................62Salinity risk factors............................................................................................................................62Practices to avoid...............................................................................................................................62
Cadmium and other heavy metals ....................................................................................................63Cadmium risk factors for potatoes ...................................................................................................63Aluminium toxicity .............................................................................................................................64Soil sodicity..........................................................................................................................................64References............................................................................................................................................65Appendix 2.1 – Salt and waterlogging tolerant vegetation.............................................................67Appendix 2.2 – Suitable high water use commercial tree species for planting
on recharge areas .....................................................................................................67Appendix 2.3 – Compost production ................................................................................................68
3 Fertiliser Management .........................................................................69
3.1 Optimise application of nutrients to plant and soil requirements ..............70Soil sampling and testing ...................................................................................................................70Calculating fertiliser application rates .............................................................................................70Phosphorus management ...................................................................................................................71
Phosphorus fertiliser management for sands.....................................................................................71Phosphorus fertiliser management for loamy or gravelly soil ..........................................................72Method of application of phosphorus................................................................................................73
Choosing the right fertilisers .............................................................................................................73Trace elements.....................................................................................................................................75
3.2 Minimise loss of fertiliser to the environment .................................................76Storage and handling of fertilisers....................................................................................................76Accurate application of fertilisers .....................................................................................................76
Incorporation of fertiliser for cauliflower and broccoli crops...........................................................77Fertigation ...........................................................................................................................................78
Boomsprayer application...................................................................................................................78Mixing fertilisers for fertigation or boomspray application..............................................................78
Broadcasting........................................................................................................................................78Erosion of soil fertility ........................................................................................................................79

3.3 Minimise leaching of nutrients............................................................................. 79Minimising leaching of nitrogen........................................................................................................79Nitrogen application and tissue testing ............................................................................................79Taking account of nutrients in groundwater ...................................................................................80
Other ways to reduce nitrogen leaching............................................................................................80Minimising leaching of phosphorus on light sands .........................................................................81Other post-plant fertiliser applications ............................................................................................81
Potassium and sulphur application on sandy soils ............................................................................81Soil amendments .................................................................................................................................82References............................................................................................................................................82Appendix 3.1 – Indicative rates of phosphorus application for potatoes on sands......................83Appendix 3.2 – Indicative rates of phosphorus application for potatoes on loams .....................84Appendix 3.3 – Fertiliser management for vegetables on sandy soils of the
high rainfall south west coastal plain ....................................................................85Appendix 3.4 – Calculating nitrogen applied in irrigation water..................................................86
4 Irrigation Management ........................................................................89
4.1 Use an efficient, properly maintained irrigation system ................................90Uniformity indicators defined ...........................................................................................................90
Selecting the right type of system......................................................................................................91Systems suitable for various site and soil types................................................................................91
System components and layout .........................................................................................................92Selecting the right sprinkler ..............................................................................................................93Sprinkler head design factors affecting distribution uniformity .......................................................94Sprinkler pressure and jet size...........................................................................................................96Sprinkler system design for windy conditions ..................................................................................96Sprinkler system design for high and moderate wind areas .............................................................97Pipe sizing..........................................................................................................................................98Mainlines – specification and layout.................................................................................................98Laterals – layout ................................................................................................................................98Pump selection...................................................................................................................................98Filtration unit .....................................................................................................................................99
Reliability of irrigation fittings..........................................................................................................99Fertigation........................................................................................................................................100 Chemigation.....................................................................................................................................101Fertiliser injection methods .............................................................................................................101Warning when mixing fertilisers .....................................................................................................103
System checks and maintenance .....................................................................................................103Items that need to be routinely checked or measured .....................................................................103Equipment needed for evaluating your irrigation system ...............................................................103Pump operating pressure and the operation of all pressure relief valves .......................................104Draw-down of bore water supplies .................................................................................................104System pressure and pressure variation ..........................................................................................104Leaking pies and sealing rings ........................................................................................................104
Pressures at the sprinkler .................................................................................................................104Flow and operation of each sprinkler or water distributor..............................................................105 Measuring the discharge from outlets .............................................................................................106Depth of water applied ....................................................................................................................106Sprinkler system uniformity ............................................................................................................106Operation of fertigation and chemigation equipment .....................................................................107Correcting faults ..............................................................................................................................107
4.2 Apply irrigation in accordance with crop demand and evaporation.......................................................................................................108
Irrigation scheduling ........................................................................................................................108Monitoring evaporation rate ...........................................................................................................109
Evaporimeter....................................................................................................................................109 Evaporation rate and replacement rate ............................................................................................109Calculating irrigation replacement rate and time required for irrigation ........................................111Minimising evaporation losses ........................................................................................................112
Monitoring soil moisture ..................................................................................................................113Feel...................................................................................................................................................113Tensiometers ....................................................................................................................................113Neutron probes.................................................................................................................................116Capacitance probes ..........................................................................................................................116
Avoiding over-irrigating ...................................................................................................................116
4.3 Manage salinity of irrigation water ...................................................................117Measuring salinity ...........................................................................................................................117Water quality for irrigation ..............................................................................................................117Salt tolerance of vegetables .............................................................................................................118Precautions for the irrigation use of salty water .............................................................................120Caution re leaching..........................................................................................................................121Corrosion of pumps and metallic components................................................................................121
References..........................................................................................................................................121Appendix 4.1 – Average daily evaporation rates ...........................................................................122Appendix 4.2 – Average daily evaporation rates for vegetable growing areas in WA...............123Appendix 4.3 – Wind velocities for Jandakot and Manjimup .....................................................124Appendix 4.4 – Effect of wind on sprinkler distribution uniformity ..........................................126Appendix 4.5 – Installation and maintenance of tensiometers ....................................................127Appendix 4.6 – Graph and interpretation of tensiometer readings ............................................128
5 Water Resource Management ...........................................................131
5.1 Minimise nutrients entering surface and groundwaters ..............................132Sources of nutrients and chemicals.................................................................................................132Minimising leaching .........................................................................................................................132
Nitrates in groundwater ...................................................................................................................133

Monitoring the quality of groundwater..........................................................................................134Minimising erosion ...........................................................................................................................134Minimising nutrients in drainage....................................................................................................134Water re-use ......................................................................................................................................134
Irrigating vegetated land with nutrient rich wastewater..................................................................134
5.2 Maintain or restore the character and bed stability of waterways ...................................................................................137
What is riparian land?......................................................................................................................137Stream bank erosion – what it is and why it occurs .......................................................................137How riparian vegetation affects stream banks ................................................................................139Revegetating stream banks ..............................................................................................................139
5.3 Safeguard streams, water bodies and drains ..................................................140Fencing to protect riparian land .....................................................................................................141Separation buffers for sensitive water resources...........................................................................141Vegetated buffer strips to trap nutrients........................................................................................142
Why and how buffer strips work.....................................................................................................142Establishing vegetated buffers.........................................................................................................143Nutrient stripping areas ...................................................................................................................144
How to avoid dam construction failures.........................................................................................146
5.4 Minimise salinity of water ....................................................................................149Minimising salinity of groundwater................................................................................................149Minimising salinity of surface water ..............................................................................................149
5.5 Prevent contamination of water by chemicals and fuels .............................150Storing and dispensing fuels and chemicals...................................................................................150Toxicity of chemicals to aquatic life ................................................................................................151
Selection of pesticides to minimise environmental impact.............................................................151Estimating risk of pesticide contamination of water resources.......................................................152
Chemical use near water resources.................................................................................................155References..........................................................................................................................................156Appendix 5.1 – Groundwater monitoring bores............................................................................157
6 Chemical Management .......................................................................161
6.1 Minimising use of chemicals that are toxic to humans or the environment.................................................................................................162
6.2 Transport chemicals and fuels safely .................................................................162Safe transport of fuels on-farm .......................................................................................................162Safe transport of chemicals..............................................................................................................162
Loading and unloading pesticides ...................................................................................................163

6.2 Store chemicals and fuels safely .........................................................................163Safe storage of fuels ..........................................................................................................................163Safe storage of chemicals .................................................................................................................167
Chemical storage site selection .......................................................................................................167Chemical storage shed design .........................................................................................................167Storage of bulk chemicals ...............................................................................................................167
Chemical spills ..................................................................................................................................169Equipment required in a spill kit .....................................................................................................169Dealing with chemical spills ...........................................................................................................169
Chemical records ..............................................................................................................................169Cleaning of spraying equipment .....................................................................................................170
6.4 When using pesticides, minimise risks to human health..............................170The product label..............................................................................................................................170Preventing poisoning ........................................................................................................................171
Mixing pesticides.............................................................................................................................171Protective clothing for pesticide spraying operations .....................................................................172
Choosing the safest chemical pesticide ...........................................................................................174Training and licensing ......................................................................................................................175Material Safety Data Sheets ............................................................................................................175
Mixing different chemicals in the spray tank..................................................................................175A jar test for compatibility ..............................................................................................................176
References..........................................................................................................................................177
7 Controlling Pests and Diseases.........................................................179
7.1 Minimise occurrence of pest and disease outbreaks .....................................180Hygiene practices ..............................................................................................................................180
Use clean certified seed material.....................................................................................................180Nursery accreditation.......................................................................................................................180Seedlings – hygiene.........................................................................................................................181Certified seed potatoes ....................................................................................................................181Vegetable seed treatments................................................................................................................181Prevention – quarantine...................................................................................................................182Cleaning equipment coming onto the farm.....................................................................................183Chemicals for disinfecting...............................................................................................................184Wash station.....................................................................................................................................184Potato disease example – bacterial wilt ..........................................................................................185
Crop rotation strategies ...................................................................................................................186Biofumigation crops ........................................................................................................................186Rotations to control soil insect pests in potatoes ............................................................................186
Crop cultural strategies....................................................................................................................187Pest habitats and hosts .....................................................................................................................187Disease carrier species ......................................................................................................................188Lures, traps and deterrents .............................................................................................................188

7.2 Monitor for pests and diseases and base decisions to spray on ‘economic injury’ thresholds..........................................................188
Soil-borne pests .................................................................................................................................189Monitoring for whitefringed weevil ................................................................................................189
Regular crop monitoring..................................................................................................................189Example- carrot leaf blights ............................................................................................................190
Spray strategies based on ‘economic injury’ thresholds...............................................................190
7.3 Control weeds and invertebrate pests by timely physical, biological and chemical means ............................................................................191
New weed threats ..............................................................................................................................191Orobanche or broomerapes..............................................................................................................191
Inter-rotation crops for weed control .............................................................................................192Treating weeds...................................................................................................................................192Preventing herbicide resistance.......................................................................................................193
Herbicide modes of action...............................................................................................................193How to rotate mode of action groups..............................................................................................194
Biological control of invertebrate pests ..........................................................................................195‘Soft’ pesticides for control of invertebrate pests ..........................................................................195
Soil treatment for control of African black beetle without fumigation...........................................195The spray diary .................................................................................................................................196Insecticide resistance management .................................................................................................196
Integrating control strategies for resistance ....................................................................................197Planning and conducting spraying according to best practice ........................................................198Rotating insecticide groups .............................................................................................................198
References..........................................................................................................................................199Appendix 7.1 – Herbicide resistance groups..................................................................................201Appendix 7.2 – Mode of action classification for insecticides .....................................................203
8 Maintaining our Native Flora and Fauna ...................................... 205
8.1 Manage remnant vegetation on the farm to enhance its quality ..............206Fencing native vegetation.................................................................................................................206Managing native vegetation .............................................................................................................206Revegetating unproductive areas ....................................................................................................207
Site preparation for establishing native trees and shrubs................................................................207Tree planting....................................................................................................................................209Direct seeding ..................................................................................................................................211Where to obtain seedlings ...............................................................................................................214
8.2 Conserve and enhance the native plant and animal species in local natural ecosystems ....................................................................214
Buffer areas .......................................................................................................................................214

8.3 Control weeds on farm and adjacent road verges .........................................214Aquatic weeds ...................................................................................................................................216
8.4 Control feral animals..............................................................................................2171080 poison baits.............................................................................................................................217Fox baiting with 1080 poison..........................................................................................................217Options for rabbit control ................................................................................................................218Control of pest native animals.........................................................................................................219The starling – an introduced pest threat ..........................................................................................220The sparrow .....................................................................................................................................220
References..........................................................................................................................................221
9 Waste Management .............................................................................223
9.1 Reduce, re-use and recycle wastes where possible ........................................224Used chemical containers .................................................................................................................224
How to properly rinse......................................................................................................................224DrumMuster scheme for recycling of used chemical containers....................................................225
Disposing of residual chemicals, oils and dip solutions ................................................................227Disposal of plastic and other solid wastes ......................................................................................227Disposal of plant, putrescible and domestic wastes.......................................................................228Disposal of wastewater .....................................................................................................................229
Irrigating vegetated land with nutrient rich wastewater..................................................................229References..........................................................................................................................................232
10 Minimising Air Pollution ..................................................................233
10.1 Minimise spray drift from the application of pesticides ............................234Spray drift of pesticides...................................................................................................................234
Selecting equipment and nozzle types ............................................................................................234Spray nozzles...................................................................................................................................235Boom height and travel speed .........................................................................................................235
Setting up spray equipment .............................................................................................................235Spray pressure..................................................................................................................................235Calibration of boomsprayers ...........................................................................................................235
Following directions for use of chemicals.......................................................................................236Weather conditions ...........................................................................................................................236
Wind speed and direction ................................................................................................................236Air stability ......................................................................................................................................236Relative humidity and temperature .................................................................................................237
Aerial spraying..................................................................................................................................237The spray operator’s duty of care to minimise air pollution .......................................................237Spray plans and spray drift awareness zones ................................................................................238Hormone herbicides .........................................................................................................................240

10.2 Minimise impacts of dust, odours and flies ...................................................243Dust ....................................................................................................................................................243Odours and flies ................................................................................................................................243
Managing fly breeding when using manure....................................................................................243Litter management...........................................................................................................................244
10.3 Minimise emissions of greenhouse gases and ozone depleting gases on farm ......................................................................................244
What is the greenhouse effect? ........................................................................................................244Reducing greenhouse gas emissions on the farm...........................................................................245Ozone depleting gases.......................................................................................................................246References..........................................................................................................................................246
APPENDIX 11.1..........................................................................................247Training – Units of Competency .....................................................................................................247
GLOSSARY ..................................................................................................249
INDEX ..........................................................................................................251

This Best Environmental Management Practicesmanual (referred to as the BEMP Manual) hasbeen compiled by the Department of Agriculture,Western Australian in conjunction with the Waterand Rivers Commission and Department ofEnvironmental Protection for the PotatoGrowers’ Association of WA and VegetableGrowers’ Association of WA.
It is a companion publication to the Code ofPractice for Sustainable Vegetable and PotatoGrowing in WA and is designed for easy cross-referencing.
The Code document describes the environmentalissues, expected environmental outcomes andenvironmental management principles, and liststhe best environmental management practices(BEMPs).
The BEMP Manual outlines how to conduct bestpractices for sustainable vegetable and potatogrowing. It covers those growing operations thatpotentially have the most impact on theenvironment, describing techniques, methodsand procedures that minimise environmentalimpacts. The Manual uses the same structure asthe Code. Each section has numbered principles,under which are described the bestenvironmental management practicesunderpinning each principle.
Environment is defined as the surroundingconditions that sustain all forms of life. This istaken to include the natural environment – soil,water, air, bio-diversity and the humanenvironment.
The BEMP Manual is not an occupational healthand safety guide, although it does cover somepractices for safe use of chemicals, clean air andminimising noise, which can have significantimpacts on the broader human environment.Neither is it a ‘how to grow’ guide. Crop-specific agronomy, control of specific pests and
diseases, business practices and marketing arebeyond the scope of this Manual.
Practices that are essential to the environmentalsustainability of annual horticultural cropping inWestern Australia are covered. Examples ofcrops to which the Manual applies are potato,cauliflower, carrot, onion, sweet corn, broccoli,tomato, cucurbit, pumpkin, melon andstrawberry.
Production of cereal crops, mushrooms andperennial horticultural crops such as tree fruit,nuts and vines and any crop grown byhydroponics is not covered in this BEMPManual.
The practices described are the best known to theeditorial committee at the time of writing. Muchof the text is taken directly from:
• Department of Agriculture WA Farmnotes andBulletins. These can be accessed on theInternet at www.agric.wa.gov.au
• Information notes from the Water and RiversCommission, Department of EnvironmentalProtection and other government departments.
Other information sources include:
• Personal comments from experienced leadinggrowers and consultants.
• Personal comments from horticulture andresource management staff of governmentagencies and universities.
• Internet websites of Australian and overseashorticultural and environmental institutions.
The philosophy behind the Manual is one ofcontinually improving best practices.Wheneveradditional or better practices are developed,sections will be updated. Growers will receivethe information to append to their Manuals.
1
Introduction

Disclaimers
The Chief Executive Officer of the Department ofAgriculture Western Australia, the State ofWestern Australia and the Potato Growers’Association of WA (Inc) accept no liabilitywhatsoever by reason of negligence or otherwisearising from use or release of the information inthis Manual or any part of it.
This material has been written for WesternAustralian conditions. Its availability does not
imply suitability to other areas, and anyinterpretation or use is the responsibility of theuser.
Mention of product or trade names does notimply recommendation, and any omissions areunintentional. Recommendations were current atthe time of preparation of the originalpublication.
2
Explanatory Note
The best environmental management practices(BEMPs) described in this manual are takendirectly from the Code of Practice. They arehighlighted in bold text indicated with a squaresymbol.
The Code of Practice explains why the BEMPsare important. This Manual gives technicalinformation that should enable growers toconduct the BEMPs where appropriate for theiroperations.
In some cases the information is detailed and inothers, brief. The authors have endeavoured totreat each practice in appropriate depth.
However we recognize that some growers mayneed more information. The references at end ofeach section are provided for this purpose.
The manual also deals with other practices thatare not BEMPs, but are unavoidable someexceptional situations. Examples are fumigation,broadcasting, chemigation and irrigating withmarginally salty water. In these cases,environmentally sustainable alternatives arepresented.. For growers who still consider thatthere is no alternative for their situation,precautions and techniques that minimize theenvironmental impacts are outlined.

Farm PlanningSE
CTI
ON
1
1.1 Select suitable sites whereenvironmental problemswill be minimal
Starting a new horticultural enterprise
Horticulture can have negative impacts on thenatural and human environments in which it islocated. These include land use conflicts arisingfrom noise, dust, spray and other nuisances,removal of native vegetation and biodiversityvalues, and pollution of surface andgroundwater. A number of agencies have legalresponsibilities and controls relating to the useand management of land and water resources toavoid these negative impacts. These includeLocal Government, Department of AgricultureWestern Australia, the Water and RiversCommission and the Department ofEnvironmental Protection. It is essential toobtain the necessary statutory approvals fromthese agencies as a first step to planning any newhorticultural enterprise.
For example, most areas of the Swan CoastalPlain, Darling Scarp and Manjimup- Pembertonare proclaimed water areas. In these areas, alicense will be required from the Water andRivers Commission to divert ground or surfacewater for private use for horticulture. Contact theWater and Rivers Commission on (08) 278 0300to find out what the requirements may be.
It may not be necessary to submit a proposal toall these agencies. This depends on where theproposal is located and the potential impact ofthe proposal. For example, if there is no proposalto clear or drain land then these approvals willnot be required from Agriculture WesternAustralia.
Growers planning new or expandinghorticultural operations should find out whatlegislative approvals they must obtain byreferring to either:
- The Code of Practice (Potato Growers’Association et al, 2002), Section 13‘Legislative requirements for new orexpanding horticultural operations’, or
- AGMAPS Horticulture Land Capability MapsCD (see below), section entitled ‘GettingGovernment Approvals’.
Useful maps and reports (Agriculture Western Australia, 1999)
In order to assist in the selection of areas suitablefor horticulture and other agricultural land uses,the Department of Agriculture WA has preparedthe Land Resource Series (LRS), of maps andreports.
The LRS maps are intended for regionalplanning purposes and most are produced at ascale of 1:50,000. By nature of the mappingtechniques and sampling density, the maps arenot detailed enough for property- specificplanning but will give a broad indication of landsuitability.
Detailed land resource and capabilityinformation is available on CD- ROM for theSwan Coastal Plain area. Less detailed landresource information is available for other areasand other uses, but the scale of mapping can be alot smaller and therefore the reliability can beless. It is intended that CD-ROMs containingavailable land capability and resource mappingfor other areas of the State will be preparedprogressively.
The AGMAPS Horticulture Land CapabilityMaps, Swan Coastal Plain, Lancelin to AugustaCD ROM includes the following informationsections:
- Groundwater availability
The maps show the groundwater sub-areas. Agroundwater sub-area is a groundwatermanagement area defined as part of aGroundwater Area Management Plan preparedby the Water and Rivers Commission. Theamount of water generally available forallocation in these areas is also shown. Anindividual site assessment is required todetermine specific groundwater availability on asite.
4

SEC
TIO
N 1
Where there is no groundwater sub-area mappedit has been determined that groundwateravailability is sporadic and unreliable. A siteassessment will be necessary to determine thegroundwater and surface water availability ofspecific properties. Contact the Water and RiversCommission on (08) 9278 0300 for moreinformation.
- Horticulture Land Capability Maps
Land capability refers to the physical ability of adefined land unit to support a particular land usesuch as horticulture. It takes into accountspecific productivity and managementrequirements of the land use plus the risk of landdegradation. Factors considered in determininghorticulture land capability include waterrepellence, sub-surface compaction, winderosion risk, water erosion risk, unrestrictedrooting depth, phosphorus export risk, soil waterstorage, secondary surface salinity, salinity risk,soil pH, waterlogging risk, site drainage, soilworkability, salt exposure, land instability, sub-surface compaction and flood risk.
Land with a capability rating of 1 or 2 is subjectto few physical limitations, which can beovercome by planning and management. Landwith a rating of 3 has limitations that will requireattention but can be overcome. Land with acapability rating of 4 or 5 is subject to a highdegree of limitations with extensive managementmeasures required.
The AGMAPS CD can be obtained from:Publications Officer,Agriculture WA, Baron- Hay Court, South Perth.
Site Selection and planning(Department of Agriculture Western AustraliaLand Management Services, 2002)
It is recommended that growers selecting andplanning a new site should contract professionalland management consultants, such asDepartment of Agriculture Western AustraliaLand Management Services, to help themundertake water, land and soil assessments.
These can be done as a condition of purchase orafter the block is purchased. However, theDepartment of Agriculture Western Australiastrongly suggests that pre- purchase land andwater appraisals (1 and 2 below) are carried outand the necessary Government approvalsobtained prior to purchase of any land forintensive horticultural purposes:
1. Pre-purchase assessment
A general suitability report is prepared from abroad assessment of existing data and a brieffield visit. This survey can be undertaken by thevendor pre-sale, or as a condition on the offerand acceptance by the purchaser. Cost is usuallyaround $1000 but is dependent upon the blocksize (mileage not included).
2. Water assessment
One of the major limiting factors forhorticultural development is water availability.Water requirements depend upon the type ofenterprise and the evaporation measurements forthe area. It is recommended that growers obtainprofessional services to assess their block foravailability of water resources. The assessmentshould include:
- Preliminary water assessment.
- Assessment of current and potential waterdemand.
- Assessment of all existing property watersupplies and potential supplies.
- Calculation of safe yields versus demand.
- Planning of potential bore or dam sites.
- Recommendation and costing of proposedworks.
The cost for this service is around $1000(mileage not included), but depends upon thesize of the property.
3. Detailed soil survey
Once a suitable site for the horticulturalenterprise has been selected, the next essentialstep is to undertake a soil survey. This
5

SEC
TIO
N 1
investigation of the soils will help in defininglimitations to enterprise establishment, planningirrigation requirements and other managementdecisions. There are several scales of surveydepending on requirements.
4. Water supply construction plan preparation
This involves the investigation of a selected sitefor the construction of required water supplyearthworks:
• Field assessment by drilling or backhoe pits
• Survey of construction site and pegging ofworks
• Report and diagrams of construction details
• Water supply construction supervision
• Supervision of construction of proposed works
• Survey of completed works to calculate actualstored volume
Costing of these services is site specific.
Contact for further information
For more detailed information on fee structure orfor a quote, contact:Land Management ServicesDepartment of Agriculture Western AustraliaBaron-Hay CourtSouth Perth WA 6151Telephone: (08) 9368 3829
1.2 Plan the whole farm tominimise environmentalimpacts
A farm plan examines the natural resources ofthe property, presents options for soundmanagement and makes appropriate conservationtreatment recommendations:
• Erosion and salinity control• Revegetation
• Remnant vegetation protection • Farm water supply • Farm layout• Access
Producing a physical farm plan forhorticulture(Rose, 1997)
The following 9 steps are a suggested procedurefor farm planning. Farmers can produce theirown farm plan or have all or part of it doneprofessionally. It is recommended thatprofessional land management consultants becontracted to assist with steps 4-soil survey, 5-water supply, 6- surface water controlearthworks (if applicable) and 9- irrigationsystem plan.
Department of Agriculture WA LandManagement Services can be contracted toproduce whole farm plans. The cost of a wholefarm plan is site dependent:
1. Obtain an aerial photograph and maps ofthe farm
• Purchase a colour aerial photo or digital photofrom the Department of Land Administration(DOLA) (see Table 1.1), at a scale of 1:2500 to1:5,000, depending on farm size.
• Purchase a contour overlay map of the farm, toaccurately match the aerial photo. This can beobtained from mapping consultants or DOLA.They will need a location plan with thelocation number and the actual length of twoboundaries or long fences marked on it. Mostsurveyors and land management consultantscan conduct a more accurate contour survey,which may be required for the irrigation plan.
The contour information is necessary to designan efficient and effective irrigation layout. Thecost of the contour plan will vary according toblock size and complexity.
6

7
2. Obtain materials for mapping
The following basic materials are required:
- Translucent paper which can be drawn on withlead or coloured pencils, or alternatively,transparent film. Fine, permanent overheadprojection markers are required to draw onfilm and they can be rubbed out with an eraser.
- A transparent grid overlay for measuring thearea of paddocks. Agriculture WesternAustralia can supply one with conversions fordifferent scales. Alternatively, centimetre/millimetre graph paper can be photocopiedonto an overhead transparency.
- Accurate ruler. Other drawing implements suchas compass, protractor, parallel rule, scale ruleare also useful.
An option is to digitise the farm plan and scanthe aerial photo onto a computer. Suitablesoftware is available, for example, Arcview,Mapinfo or ‘stand alone’ farm planning softwaresuch as PAM. The choice of manual or computermethods will depend on the individual’s skills.
For those who have large or complex farmingoperations and own a modern computer, thedigital option is likely to be a worthwhileinvestment. Digitised plans can be more easilyupdated and information such as fertiliser, cropand other monitoring information can be enteredon disc and related to the map.
3. Draw the first overlay maps
Tape or clip the farm photo to a board to make iteasier to work with (clothes pegs work well)!.Tape transparent overlay paper or film over thephoto.
Draw on one overlay sheet:
- Catchment divides and ridge lines
- Natural drainage lines
- Arrows to indicate where run-off water flows.
- Areas that are not suitable for cultivation suchas rocky or waterlogged areas
- On a second overlay sheet, draw in existinginfrastructure
Existing vegetation and fence lines should bevisible on the aerial photo.
A colour photo will usually show winterwaterlogged or saline areas as darker andsummer damp areas as greener.
Distance can be measured on the map, forexample, on a map with scale 1:5,000, one cm = 50 metres on the ground.
4. Detailed soil survey and soil map
The main purposes of a detailed soil assessmentare to define areas of soil suitable for irrigatedhorticulture. It is essential that blocks containsoils of similar physical and chemical
Table 1.1 Farm plan mapping services
Service Provider Contact address
Aerial photographs- prints or CD. Department of Land PO Box 2222, Midland, 6056Contour maps at 1:100,000 scale Administration (DOLA) Phone 9273 7208or on CD. Fax 9273 7656
Scaled farm maps Department of Agriculture Spatial Resource InformationFarm photos and maps on CD Western Australia GroupDigital farm planning services Land Management Services Agriculture Western Australia
Baron-Hay CourtSouth Perth WA 6151Phone 9368 3829
SEC
TIO
N 1
characteristics so that a uniform quality ofproduce can be obtained through a plannedfertiliser and irrigation strategy. This approachenables easier management and should also savewater and money.
A detailed soil survey for horticulture involvesdigging a series of backhoe pits in order todescribe the soil profile through the rootingzone. The contracting of the backhoe operator isnormally the responsibility of the client. The costof this is estimated at $60-80/hour anddepending upon the size of the block should takebetween half a day and two days.
The soil surveyor uses a stereoscope to delineatesoil patterns on aerial photographs. Fieldinspections are then carried out to check soil unitboundaries, depth, texture, pH, gravel contentand soil moisture and if necessary, to takesamples for detailed chemical and physicalanalysis. The surface characteristics of the land,its slope, drainage and susceptibility to erosionare also noted.
From this field information, a map is producedshowing areas of similar soils (managementunits), available moisture and proposeddelineation of horticulture blocks. Theaccompanying report describes the soil units, thesoil characteristics and management relevant tointensive horticultural use. Detailed profiledescriptions for each soil pit are also included.
It is recommended that professional soilsurveyors such as Department of AgricultureWestern Australia Land Management Services becontracted to conduct the survey. The cost of thesoil assessment depends upon the size andcomplexity of the area being surveyed.
5. Audit and plan water supply
Map the location of existing developed watersupply resources. Calculate the storage capacityof dams and annual supply from bores (this maybe dependent on license conditions. If new watersupplies need to be developed, contractprofessional land management services to locatedam or bore sites and design earthworks if theseare required. (refer to point 4 under ‘Siteselection’ above).
6. Plan surface water control earthworks anddrainage
If cropping is to be conducted where run-offoccurs at any time, properly planned surfacewater control earthworks to prevent soil erosionand nutrient export are essential. The exactlocation of these will need to be determined onthe ground but the 5 metre contour overlay andaerial photo are useful for conceptual planning.
• Mark in safe disposal areas for run-off. Theseshould be left permanently grassed orvegetated to act as waterways for disposal ofexcess run-off water. Natural drainage lines arethe best disposal areas. An adjacent paddockthat has been grassed for at least a year or isunder forest or plantation may also be suitableif the land slopes away from the cultivatedplot. A thorough on-site investigation isessential to ensure that the disposal areas haveminimal effect on the workability of the farmor neighbours’ properties.
Where there are no such safe disposal areas inor adjacent to the paddock, grassed waterwayscan be constructed with a grader (Section 2.1).They must be permanently vegetated and notbe cultivated. Ideally they should not be usedas vehicle tracks, but access tracks can oftenbe located beside them. Space waterways insuch a way that temporary grade furrowsrunning into them are no more than 100 mlong.
• Sketch a concept plan of surface water controlearthworks (refer to Section 2.1 for details).Grassed waterways and diversion banks maybe needed to divert water running off roads,yards, catchments or waterlogged areas up-slope of the paddock. These will be surveyedon a 0.25% – 1% grade which means they canbe pencilled in on a slight angle to the contourlines. They must lead to a stable, grasseddisposal area.
Grassed waterways within areas to be croppedneed to be located between cropping bays. Thewidth of cropping bays will depend on thewidth of the cropping machinery to be used,such as the boomspray.
8
SEC
TIO
N 1

9
Sketch where temporary grade furrows will berequired to protect cultivated slopes. Theymust run into stable grassed disposal areas orgrassed waterways.
• Use the area grid overlay to estimate thecatchment area of surface water controlearthworks. If the catchment is too large, run-off will exceed the flow capacity of thewaterway and may cause soil erosion (refer toSection 2.1 ‘Permanent grade banks andgrassed waterways’).
• Surface water control earthworks such asbanks and grassed waterways and can beplanned so that they empty into existinghillside dams or proposed dams sites, thusincreasing water storage.
Note: In cases where surface water controlearthworks or drainage may alter flows acrossthe property boundary, neighbours must beconsulted. It is also wise to contact the districtDepartment of Agriculture’s Land ConservationOfficer who can advise whether a formalnotification to drain should be submitted to theCommissioner for Soil and Land Conservation.
Contrary to common belief, surface water
control earthworks do not exclude much land
from cropping. One kilometre of waterway 3 m
wide is only 1/3 of a hectare in area. One
kilometre of temporary grade banks is less than
1/10 of a hectare in area.
7. Outline workable cropping paddocks
• Using the scale on the map and the area gridoverlay, measure of the required area (thismethod is accurate to within 5%). Irrigationlayout will obviously be a major considerationwhen determining the shape of cropping areas.Use a compass if a centre pivot irrigator is tobe used and a ruler if straight irrigation runsare required. Pencil in and rub out the variouspossibilities until satisfied the best layout isproduced.
• Pencil in the area and dimensions of eachpaddock. Unsuitable classes of land such assteep slopes, waterlogged areas and naturalwaterways should be fenced off and notcultivated.
8. Plan fences, windbreaks, access tracks andother infrastructure
• Be prepared to move fences that are in thewrong places. Construction of new fences to afarm plan with surface water control for soiland land conservation purposes is fully taxdeductible in the year of expenditure.
9. Plan the irrigation system and layout
Irrigation planning should be conducted byCertified Irrigation Designer (CID) accreditedirrigation consultants. An accurate layout of theproposed horticultural enterprise is mapped overthe contour plan. From this map, a plan of theirrigation system is prepared.
Existing systems can be analysed for theirefficiencies and, quite often, major problems canbe cheaply overcome with a small change indesign.
The pipes in the network are sized to comparethe cost of pipe work against the cost of power.The design will include universally acceptedirrigation efficiencies, generally set at a flowvariation of 10%. This will allow for accurateirrigation scheduling and possible automation ofthe system based on soil moisture.
The integration of irrigation design andscheduling into the horticulture plan ultimatelyleads to better management of irrigation waterand hence a higher economic return to thegrower. The cost of this service is dependentupon block size and soil and landformcomplexity.
SEC
TIO
N 1

References
Agriculture Western Australia, 1999. AGMAPSHorticulture Land Capability Maps, SwanCoastal Plain, Lancelin to Augusta. (CD-ROM).
Department of Agriculture WA LandManagement Services, 2002. Planning forIntensive Horticulture. Information leaflet.
Potato Growers’ Association of WA, Departmentof Agriculture Western Australia, et al, 2002.Code of Practice for EnvironmentallySustainable Vegetable and Potato Production inWestern Australia.
Rose, B, 1997. Preventing Erosion and SoilStructure Decline, a Soil Management PracticesGuide for Horticultural Farmers in the SouthWest High Rainfall Hills. Agriculture WesternAustralia miscellaneous publication 23/97.
10
SEC
TIO
N 1
Permanent surface water control works are an essential component of the farmplan for cropping hill slopes.

11

SEC
TIO
N 2
Soil management may well be the mostimportant aspect of sustainable vegetable andpotato cropping in the long term. Soil erosion,export of nutrients and chemicals, and leachingare among the most significant impacts ofhorticultural cropping and are caused entirely orin part by poor management of soil. Goodpractices to minimise all of these impacts aredescribed in this section.
Growers will also find information that will helpthem to understand their soils, including soilbiology, which is so vital to soil health. Methodsof soil monitoring, appropriate cultivationtechniques, cover cropping and mulching areexplained, which will help maintain or increasesoil fertility. Soil health issues such as acidity,salinity, sodicity and heavy metal contaminationare also discussed.
2.1 Minimise or virtuallyeliminate soil erosion
Observing the signs of erosion
❑ Check cultivated paddocks regularly forsigns of erosion
The obvious signs
The signs of severe water erosion are obvious:
• Rills. These are small shallow wash lines (lessthan wheel width), often numerous and usuallyseen first in wheel ruts. They are formed wherewater has run off, and removed soil. Rills mayform gullies if left untreated.
• Gullies. Large scars on the landscape, wheremany tonnes of topsoil have been removed bywater erosion. Erosion gullies often worsenrapidly if not treated. Gullies most often occurin natural flow lines – areas on slopes whererun-off water will tend to collect and flow. Forthis reason, flow lines should never becultivated.
• Build-up of soil on fences at the foot of slopes.Old fence posts are good indicators of soilbuild-up at the foot of slopes. It is not unusual
to see posts ‘shortened’ 30 cm or more. Thisdepth of washed or blown soil deposited alongfence lines equates to many hundreds of tonnesremoved from the paddock.
Rills, gullies and soil build-up at the foot of aslope are signs that either the site should not becultivated or the grower’s soil management hasbeen inappropriate for the site and soil type (see‘Site water erosion risks’, this section).
In either case, immediate installation of surfacewater control earthworks is required to rectifythe situation in the short term. In the longer term,if the decision is made to crop the site in thefuture, an improved soil management strategy isrequired. This would need to include appropriateminimal cultivation practices, cover cropping,mulch cropping and surface water control.
Less obvious signs of soil erosion
Unacceptable erosion may be occurring whenthere is no obvious scarring of the landscape.Growers should regularly take a closer look attheir cultivated soil.
The following are signs that significant erosionis occurring and improvements to soilmanagement need to be made:
1. Run-off from cultivated soil.
2. Washed appearance of the soil surface.
3. Windblown soil surface and/or dust blowing.
It is not acceptable to disregard any of theseerosion signs in the knowledge that the paddockwill be levelled and pastured after cropping,covering up the signs of erosion. Soil erosion iscumulative, with the topsoil and organic matterlosses eventually leading to reduced soil fertilityand soil structure decline which in turneventually lead to worsening erosion anddecreased productivity.
1. Run-off from cultivated soil
Observe the paddock during irrigation andrainfall for signs of run-off. Run-off may beoccurring without rills being evident. Run-off
12
Soil Management
SEC
TIO
N 2
should not occur during irrigation or rainfall ofnormal intensity. If this does happen then soilmanagement and/or irrigation is deficient.
If run-off still occurs when cultivation, croppingand irrigation management is being conductedaccording to best management practices, theneither:
• The site should not be used for cultivatedhorticulture, or
• The site needs more protection by surfacewater control earthworks.
Surface water control earthworks effectivelydivert or control run-off into man-madechannels, before it can increase in speed or depthsufficiently to erode the cultivated soil. Thechannels (temporary grade furrows or permanentgrade banks) run on a gradual gradient, areshallow and may be grassed, allowing the waterto run in them without causing significanterosion.
2. Washed appearance of the soil surface. (McTainsh and Boughton, 1993).
Sheet erosion is the removal of soil in a thinsheet from the entire soil surface. The signs are awashed, sandy appearance of the soil surface andthere may be a thin surface crust. It can occureven on very gently sloping land, where theremay be no sign of rills.
Sheet erosion occurs by a process known asrainfall attachment and re-detachment. When araindrop hits an unprotected soil surface, thewater in it flows out very rapidly in a radialdirection, tearing loose or detaching some soil inthe process. This soil is then carried a shortdistance down-slope in a film of water beforedepositing again on the soil surface. As it is thenmore loosely bound than it was in the morecohesive parent soil, other raindrops re-detach itmore easily, moving it a short distance eachtime. Although slower and less obvious than rillor gully erosion, this process is neverthelesssignificant.
Preventing sheet erosion on such sites requiresattention to be paid to such things as:
• Protecting the soil surface by rapidestablishment of crop cover.
• Avoiding cultivation at the times of year whenthere is significant risk of intense rainfall.
• Ensuring that the rate of sprinkler irrigation isnot too high and causing run-off.
• Testing the soil for water repellence andtreating appropriately if this is a problem.
• Testing for soil structure decline and treatingappropriately.
3. Wind-blown soil surface and/or dustblowing
Wind erosion can cause the loss of manyhundreds of tonnes of topsoil in dry windyconditions. Windbreaks, nurse crops, stubbleretention and cover crops are all practices thatcan be used to prevent wind erosion (Section2.1).
❑ All growers need to have a soil erosionprevention strategy for each of theircultivated sites, according to site and soilconditions, seasonal risks and the croppingrotation.
(Refer to Sections 2.1 and 2.2 of the Code ofPractice).
Site water erosion risks
Section 2.1 of the Code of Practice outlines landcapability limits to cultivated cropping:
❑ Land with slope greater than 15% gradientshould not be cultivated.
❑ Land that is waterlogged during the periodof crop or post - harvest cover cropestablishment should not be cultivated.
❑ All land with 10-15% slope should haveadequate surface water control earthworksin place according to best practices, at alltimes during cropping.
13

❑ All land with 5-10% slope will require someprotection by surface control earthworks,depending on crop type and soil type.
Many other sites with less than five percentslope, such as those which become waterloggedin winter or which receive run-off from up-slope,should also be protected by surface water controlearthworks during cropping. The erosion hazardsmay not be apparent until erosion occurs.
If erosion is experienced on any site, actionshould be taken, either to cease cropping andkeep it under permanent pasture or vegetation orto install surface water control earthworks.
Erosion prevention by surface watercontrol
❑ When growing on hill slopes, plan a surfacewater control strategy at least one yearprior to cropping the paddock.
Walk over the site and decide where accesstracks, surface water control works orwindbreaks will need to be located (see below).Sketch these on a map of the paddock. Includesuch things as diagrams of the profile of thewaterways and notes on how and when they willbe vegetated.
Growers who are aware of erosion problems onthe site, and are unsure of the techniquesrequired can obtain expert advice on the layoutof surface water control earthworks. The localLandcare Coordinator, Dept of Agriculture LandConservation Officer or private soils consultantare usually able to do this.
Cross slope cultivation(Rose, 1997)
❑ Cultivating across the slope on a gradientof 2-3% is recommended for slopes of up to7% gradient. If this is done, grade furrowswill not be necessary.
• On slopes up to about 6% for potatoes and 7%for cauliflowers, erosion can be minimisedwithout the use of temporary grade furrows bycultivating across the slope on a 1- 3 % grade.
• The grades should be checked with aclinometer every 50 metres or so down theslope in the same way as that described forgrade furrows, to ensure that it is between 1-3% over the cultivated area. If this is not done,or if cultivation on a level contour isattempted, water may burst through wherecultivation crosses a flow line, causing severegully or rill erosion.
• Flow lines should be left uncultivated, to act asstable waterways. Cultivating across flow linesis a common cause of severe erosion.
• A suitable disposal area should be left grassedup at the lower end of the cultivation to takeexcess run-off.
• Potato harvesters with adjustable offset hitchand steerable wheels are necessary whenoperating on a side slope.
Basin tillage(Rose, 1997)
The basin tillage implement is commonly knownas a ‘dammer dyker’. This is like a set ofpaddle wheels which form small banks about 70cm apart across the furrows. These cause waterto pond in small basins, aiding infiltration. Forpotato cropping, the ‘dammer dyker’ wheels arebest mounted on the same tool frame behind thehillers and rippers.
This arrangement reduces cost and reducescompaction in the wheel ruts, as there are fewerpasses with the tractor. Infiltration is greatlyimproved because the rippers break upcompaction pans and the small ponds made bythe basin tillage reduce run-off. Basin tillage isusually sufficient to prevent run-off and erosionduring crop establishment on most sites withdeep, well- drained soils and slopes less thanabout 3%. However, it is not a substitute forsurface water control earthworks or cross slopecultivation on slopes steeper than 3%.
14
SEC
TIO
N 2
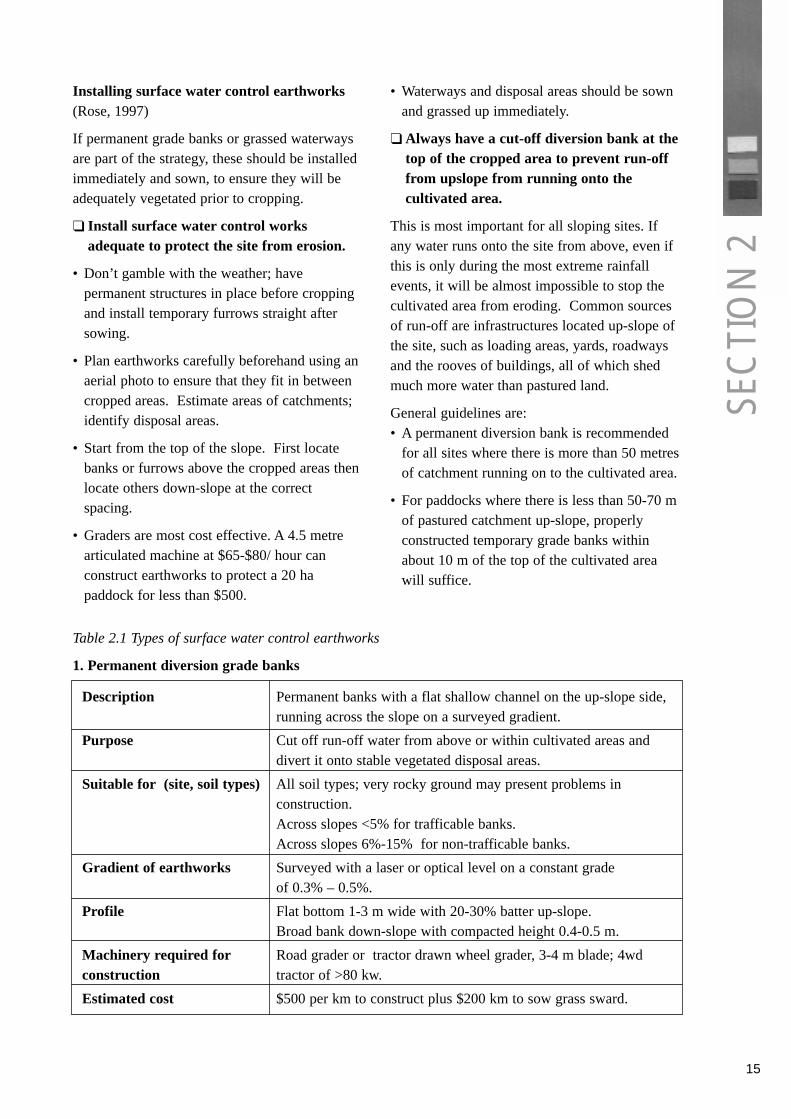
Installing surface water control earthworks (Rose, 1997)
If permanent grade banks or grassed waterwaysare part of the strategy, these should be installedimmediately and sown, to ensure they will beadequately vegetated prior to cropping.
❑ Install surface water control worksadequate to protect the site from erosion.
• Don’t gamble with the weather; havepermanent structures in place before croppingand install temporary furrows straight aftersowing.
• Plan earthworks carefully beforehand using anaerial photo to ensure that they fit in betweencropped areas. Estimate areas of catchments;identify disposal areas.
• Start from the top of the slope. First locatebanks or furrows above the cropped areas thenlocate others down-slope at the correctspacing.
• Graders are most cost effective. A 4.5 metrearticulated machine at $65-$80/ hour canconstruct earthworks to protect a 20 hapaddock for less than $500.
• Waterways and disposal areas should be sownand grassed up immediately.
❑ Always have a cut-off diversion bank at thetop of the cropped area to prevent run-offfrom upslope from running onto thecultivated area.
This is most important for all sloping sites. Ifany water runs onto the site from above, even ifthis is only during the most extreme rainfallevents, it will be almost impossible to stop thecultivated area from eroding. Common sourcesof run-off are infrastructures located up-slope ofthe site, such as loading areas, yards, roadwaysand the rooves of buildings, all of which shedmuch more water than pastured land.
General guidelines are:• A permanent diversion bank is recommended
for all sites where there is more than 50 metresof catchment running on to the cultivated area.
• For paddocks where there is less than 50-70 mof pastured catchment up-slope, properlyconstructed temporary grade banks withinabout 10 m of the top of the cultivated areawill suffice.
15
Table 2.1 Types of surface water control earthworks
1. Permanent diversion grade banks
Description Permanent banks with a flat shallow channel on the up-slope side, running across the slope on a surveyed gradient.
Purpose Cut off run-off water from above or within cultivated areas and divert it onto stable vegetated disposal areas.
Suitable for (site, soil types) All soil types; very rocky ground may present problems in construction.Across slopes <5% for trafficable banks.Across slopes 6%-15% for non-trafficable banks.
Gradient of earthworks Surveyed with a laser or optical level on a constant grade of 0.3% – 0.5%.
Profile Flat bottom 1-3 m wide with 20-30% batter up-slope.Broad bank down-slope with compacted height 0.4-0.5 m.
Machinery required for Road grader or tractor drawn wheel grader, 3-4 m blade; 4wdconstruction tractor of >80 kw.
Estimated cost $500 per km to construct plus $200 km to sow grass sward.
SEC
TIO
N 2

2. Grassed waterways
Description Permanent waterways running up and down the slope, not on a surveyed grade, ideally along flow lines.
Permanent pasture cover is essential – leave grassed or sow with grass (kikuyu is best) immediately after construction.
Purpose To dispose of run-off water from cultivated land, grade furrows or grade banks.
Suitable for (site, soil types) Hill slopes up to 15% in stable gravelly or duplex soils.Not suitable for higher or permanent flows, sandy or other unstable soils (see ‘other stabilised waterways’ for these sites).
Gradient of earthworks Variable; follows hill-slope. Up to 15% on suitable, stable sites.
Profile Broad, shallow cross Section, 3-5 metres wide and 0.2-0.3 metres deep.Small waterways that are also used for vehicle access are slightly dished in the middle to prevent water from flowing in the wheel ruts.
Machinery required for Road grader, RazorbackTM type tractor drawn grader or squareconstruction mouldboard plough.
Estimated cost $200- 500 per km to construct plus $200 per km to sow grass sward.
3. Temporary grade furrows
Description • Temporary, trafficable furrows running across the slope to divert water into grassed waterways or disposal areas.
• Maximum length 50 – 100 metres depending on slope, soil type and furrow size.
• Maximum spacing 30 – 60 metres depending on slope and crop type.
Installed immediately after sowing potato, vegetable or cereal crops.
Purpose Cut off and divert water from cultivated land.
Suitable for (site, soil types) All soil types on hill slopes 5% -20%.
Gradient of earthworks Grade 1 – 2% on sand, 3 – 4% on karri loams, 4 – 5% on clay loams.
Profile 0.5-1 metre wide and 0.2-0.4 metres deep.
Machinery required for One pass with back blade, single-disc or single-mouldboard plough. construction
Estimated cost $200 per km.
16
SEC
TIO
N 2

17
❑ On slopes longer than 70 m and more than5% gradient, install either temporary gradefurrows or permanent grade banks acrossthe slope to divert any run-off from thecultivated soil into stable waterways or ontopasture.
❑ As a ‘rule of thumb’, the grade furrows ordiversion banks should be at spacings of nomore than 50 m, depending on slope andsoil type. They should be surveyed on thecorrect gradient, properly constructed andmaintained.
Plan to have pasture or grassed waterways in theright place to carry run-off from the cropped areasafely without eroding. If the site is no morethan 200 m in width across the slope and slopingaway on both sides, it is often possible to divertrun-off from the cultivated area onto stablepastured land. However many croppingpaddocks are too large or else they slope inwardsto drainage lines within the cropped area. Inthese cases it is crucial to have stable grassedwaterways in place with vegetation establishedbefore the ground is cultivated.
- Install and stabilise earthworks at least a yearbefore cropping
To prevent erosion, ensure that surface watercontrol earthworks and access tracks areconstructed and stabilised at least one year priorto planting. Sow grass swards in the channels ofwaterways and diversion banks during theseason before the land is cultivated, to ensure thegrass is well established. Established pastureswards, especially perennial grasses such askikuyu, provide adequate and inexpensive coverto prevent erosion of most waterways that wouldbe required to carry water diverted fromcultivated paddocks. Extreme cases such asspillways or narrow waterways on steep slopeswith unstable soils may require more expensivestabilisation such as rocking or concreting (seebelow).
- Maintain waterways and diversion banks andtracks in a stable condition.
Once these are in place and working well, make
them a permanent part of the propertyinfrastructure and never cultivate over them.
Construct earthworks and sow grass on them theprevious year and cultivate around them. Do notcultivate the whole paddock and then try toconstruct earthworks.
- Install grade furrows to divert water off steepor long cultivated slopes.
Install temporary grade furrows on cultivatedslopes to divert surface run-off into stablewaterways or onto pasture during and aftercropping. Construction is quick and easy, withone cut using a back blade, single-mouldboard orsingle-disc plough. Cutting the furrows afterplanting is not a problem as there is little loss ofplanted area and the narrow, shallow crosssection enables most machinery to cross themwithout destroying the profile. Take care to getthe grades to within one percent, by using aclinometer or laser level. As a rule of thumb, thegrade is 3- 4 % for temporary grade furrows onloamy/ gravelly soils. Ensure that grade furrowsare not more than 50 m apart and 100 metres inlength.
❑ Be prepared to liaise with neighbourswhere surface water run-off to or fromadjoining properties may impact on them.
Permanent grade banks and grassedwaterways(Rose, 1997)
These are permanent structures that may carryquite large flows, so careful planning, design andsurveying are essential. Figures 2.1-2.3 belowshow adequate cross sections for grade banksand waterways with the catchment areasspecified. If larger catchment areas are involved,they should be designed and planned by aqualified Landcare technician or surveyor.
For both grade banks and waterways:
• Ensure that a stable area for water disposal isavailable, for example, a pastured paddock thatwill never be cultivated, a tree plantation orother permanently vegetated area.
SEC
TIO
N 2
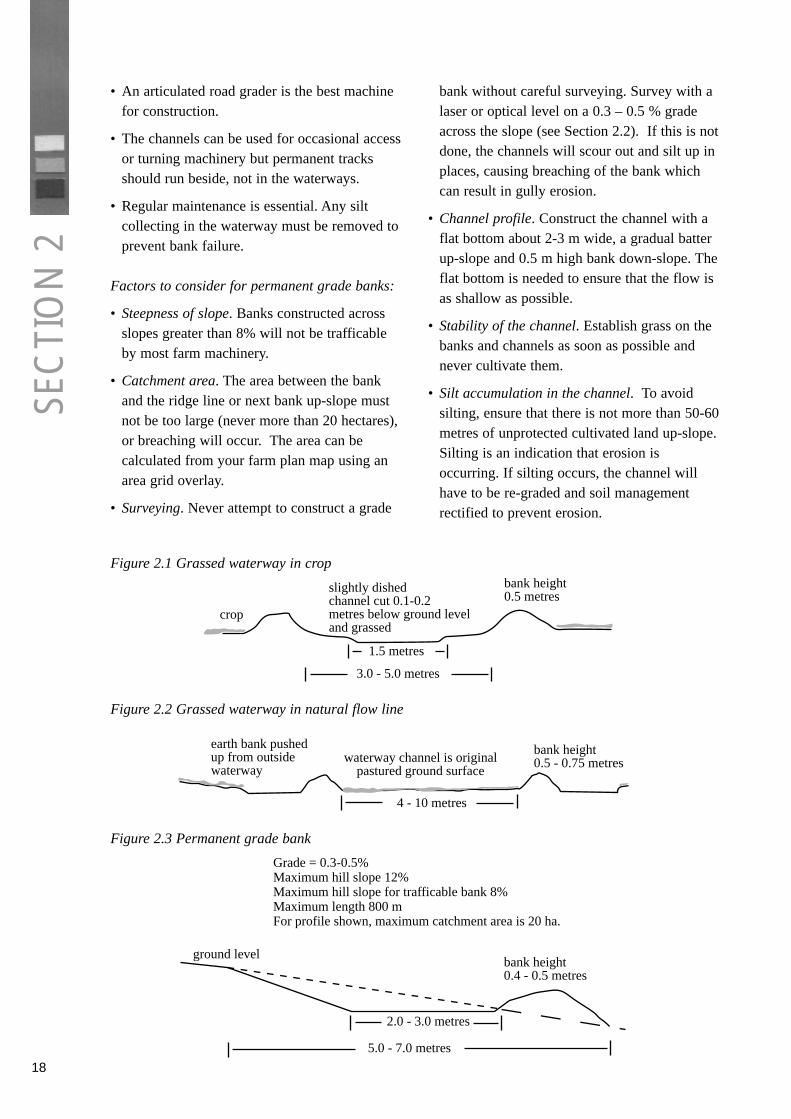
• An articulated road grader is the best machinefor construction.
• The channels can be used for occasional accessor turning machinery but permanent tracksshould run beside, not in the waterways.
• Regular maintenance is essential. Any siltcollecting in the waterway must be removed toprevent bank failure.
Factors to consider for permanent grade banks:
• Steepness of slope. Banks constructed acrossslopes greater than 8% will not be trafficableby most farm machinery.
• Catchment area. The area between the bankand the ridge line or next bank up-slope mustnot be too large (never more than 20 hectares),or breaching will occur. The area can becalculated from your farm plan map using anarea grid overlay.
• Surveying. Never attempt to construct a grade
bank without careful surveying. Survey with alaser or optical level on a 0.3 – 0.5 % gradeacross the slope (see Section 2.2). If this is notdone, the channels will scour out and silt up inplaces, causing breaching of the bank whichcan result in gully erosion.
• Channel profile. Construct the channel with aflat bottom about 2-3 m wide, a gradual batterup-slope and 0.5 m high bank down-slope. Theflat bottom is needed to ensure that the flow isas shallow as possible.
• Stability of the channel. Establish grass on thebanks and channels as soon as possible andnever cultivate them.
• Silt accumulation in the channel. To avoidsilting, ensure that there is not more than 50-60metres of unprotected cultivated land up-slope.Silting is an indication that erosion isoccurring. If silting occurs, the channel willhave to be re-graded and soil managementrectified to prevent erosion.
18
bank height0.5 - 0.75 metres
4 - 10 metres
earth bank pushedup from outsidewaterway
waterway channel is originalpastured ground surface
ground levelbank height0.4 - 0.5 metres
Grade = 0.3-0.5%Maximum hill slope 12%Maximum hill slope for trafficable bank 8%Maximum length 800 mFor profile shown, maximum catchment area is 20 ha.
2.0 - 3.0 metres
5.0 - 7.0 metres
SEC
TIO
N 2
slightly dishedchannel cut 0.1-0.2metres below ground leveland grassed
bank height0.5 metres
crop
1.5 metres
3.0 - 5.0 metres
Figure 2.1 Grassed waterway in crop
Figure 2.2 Grassed waterway in natural flow line
Figure 2.3 Permanent grade bank

19
Factors to consider for grassed waterways
• Location. Locate grassed waterways in flowlines (areas on slopes where run-off water willtend to collect and flow) where possible. Inthese cases the existing pasture should be leftintact and low banks graded in from outside(see Figure 2.1)
• Profile. To prevent erosion, waterway profilesmust be at least 3 m wide, shallow and wellvegetated because they run up and down theslope and are not on a surveyed grade.
• Where there is no natural flow line.Sometimes there is a need for a grassedwaterway where there is no natural flow line.In these cases, narrow waterways 3- 5 metrewide can be constructed by grading about 10cm of topsoil from the channel into low bankson each side. It is important to leave sometopsoil in the flat channel to help establishmentof grass in the channel. These waterways aregenerally suitable for catchment areas less than5 hectares, waterway lengths less than 0.5 kmand slopes less than 10%. (Agriculture WAwaterway design software, 1991).
• Stability of the channel. Grassed waterwaysmust be well vegetated. They usually followthe slope of the land and are often quite steep.Hence, Erosion will occur if they are notbroad, shallow and stabilised with grass cover.Where possible avoid cutting through thedarker topsoil (A horizon), as the subsoil isoften unstable and may erode quickly. Sowthe waterways in spring and if possibleirrigate. Waterways need to be grassed beforethe first heavy winter rains.
• Suitable implements for construction.Articulated road graders are the best machinesfor constructing waterways in most situations.A hydraulically adjustable back blade orsquare mouldboard plough can be used forconstructing small dished waterways.
• Trafficability. In general, vehicles should notcross the banks of grassed waterways as thisgreatly increases the risk of breaching. Neithershould they be used for vehicle or machineryaccess, especially on steep country, as erosionis likely to occur in wheel tracks. However,
narrow waterways with small catchment areascan be designed to take occasional traffic. Aslightly dished profile is constructed betweenthe vehicle tracks and a grass swardestablished in it. This ensures that water willflow in the grassed area rather than in thevehicle tracks, which are prone to erosion.
Temporary grade furrows(Rose, 1997)
These are small, temporary drains used to gathersurplus run-off water from cultivated land anddirect it across the slope to vegetated areas suchas grassed waterways or adjacent pasturepaddocks. The furrows are small in section (15-20 cm deep by 50 cm wide) and aretrafficable. The potato harvester will fill them inbefore the wheels pass over. They can onlycarry a limited amount of water, so if therecommended spacings and lengths areexceeded, breaching and erosion are likelyconsequences. Grade furrows leading intograssed waterways are the best option for slopesover about eight percent, on which permanentgrade banks would not be trafficable and crossslope cultivation is not possible.
Donnybrook potato grower Bert Russellremarked that his time spent to install gradefurrows returns at least $1000 per hour inimproved production in a wet year. The gradefurrows prevented loss of topsoil and nutrients,enabled easier access for crop inspections andresulted in a reduced price dockage due to greenpotatoes
‘Rules of thumb’ for temporary grade furrowsare:
• The furrows need to be put in immediatelyafter sowing the crop, not the next day, as thereis the risk of rain making the paddock too wetto install them later.
• Furrows should not longer than 50 m. Furrowsof 100 m long have been used in less erodiblesoils. However, for longer furrows a largerprofile is required, making them more difficultto cross with machinery.
• The spacing between furrows must be between30-60 metres (Table 2.3).
SEC
TIO
N 2

• Grade of furrows 3% on most soils – less onsands, more on clay loams (Table 2.2).
• Grade furrows should not be marked in by eye,as it is almost impossible to get the graderight.
• To construct grade furrows, make one passwith a single disc three-point linkage plough,mouldboard, or back blade throwing the soildown-slope.
• Re-cut grade furrows immediately after sowingthe post-harvest cover crop.
20
Table 2.2 Guide to grade (fall) of temporary grade furrows in different soils
Soil type Grade of furrow
Sands 1-2 %
Sandy loams e.g. karri loam 3 %
Clay loams 4-4.5%
Table 2.3- Spacing of temporary grade furrows
Slope of paddock Spacing of grade furrows
Heavy loam soils Sandy loam soils
Steep (15%+) 30 m 20m
Medium (10-15%) 30-40 m 20-25 m
Low (up to 10%) up to 50m 25-40 m
• Steep slopes, light soils, poor soil structure,low organic matter and fine tilth are all factorsthat will require closer furrow spacings.
• For sandier soils, furrow grade must be less.
Using a clinometer to survey temporary gradefurrows(Rose, 1997)
One operator using a laser level, staff and shovelcan survey grade furrows as described below.However two people can survey them using themuch cheaper clinometer. This procedure isfaster than using the laser level because theoperator does not need to keep retracing hissteps to shift the level. It is not as accurate as thelaser level and is not recommended for gradebanks, but is adequate for temporary gradefurrows.
A pocket clinometer can be bought for about$200. However an even simpler instrument
consisting of a weighted T square with markedgraduations, suspended in the middle of the Tcan be easily made.
Equipment
Clinometer, two ranging poles (1.6 metrebroomsticks painted red on top for visibility areideal), coloured tape, shovel.
Procedure
• Start with the first furrow at the top of thepaddock and move down.
• Use your knowledge of the paddock and theguidelines in Tables 2.2 and 2.3 to decidespacing and grade of the furrows.
• One person holds the clinometer on top of onepole and sights along the marking on theinstrument corresponding to the required grade(3% for most loamy soils).
• The other person walks out about 20 m andholds the ranging pole upright.
SEC
TIO
N 2
The distance between grade furrows and their grade (fall) is determined by the slope of thehillside, soil type, crop to be grown, the fineness of tilth and the likelihood of heavy rainover a short period. It is important that the furrows have the right grade for the soil type.Incorrect or uneven grade can cause scouring, silting and breaching.
21
• The person sighting with the clinometerpositions the other person so that the top of theupright pole is in his sights at the requiredgrade.
• Make a small mound with the shovel, andplace coloured tape on top at each point tomark the line.
• Where slope changes across the paddock, orthe furrow crosses a flow line, it will need tocurve to maintain an even gradient. Take morereadings with the clinometer in thesesituations. Make curves gradual to avoidsilting.
Tip: For accuracy, both operators should standthe pole on their boot, placed in a cultivationfurrow to eliminate errors caused by uneventerrain.
Using a laser level to survey earthworks(Rose, 1997)
Care of the laser level
• Avoid getting it wet or excessively dusty. Usethe plastic cover if left standing during heavyrain or in extremely dusty conditions.
• Always transport the level in its case, in thecab, not on the tray of the ute.
• Keep it clean. Clean the glass window with aclean tissue to avoid scratching it.
• Check the low battery indicators (lower rightcorner of display on receiver and flashing lighton the level transmitter). Replace batterieswithin 1 hour of low indication.
Setting up the laser level
• Fully extend the tripod legs and set tripod atabout chest height. Gently push the pointedends of the legs into the ground with yourboot.
• Place level on tripod and loosely secure withthe large knurled screw underneath, whilesteadying the level with the other hand.
• Move level around on the rounded tripod headuntil the bubble comes near to within the circleand tighten the screw underneath.
• Switch level on.
• Fine level adjustment can be done with thethree flat knurled nuts at the base of the level.Move two at a time in opposite directions untilthe red ‘out of level’ light stops flashing. Thelaser beam will stop operating if the instrumentis out of level.
Using a laser level to survey earthworks on a3% grade
• Set up the level near where the top end of yourfurrow will be.
• Turn the laser eye receiver on and clamp it tothe top of the staff. Turn on the audible‘beeper’. Move to where you want the furrowto start.
• Slide the staff up and down until you hear acontinuous beep indicating that it is on level.
• Shovel a small pile of earth where the staffstood to mark your first point (a piece ofcoloured tape will make this more visible).
• Slide the staff up the length shown Table 2.4for a 3% slope, i.e. 60 centimetres.
• Pace 20 metres across the slope where youthink the bank will go. You should first checkhow long your paces are by measuring 20metres with a tape and pacing that distance.Most people have about 23 paces for 20metres.
• Move up or down the slope until the beepersounds continuously when the staff is stood onthe ground vertically. Mark the second pointwith the shovel.
• Continue marking in the same fashion,extending the staff 60 centimetres more forevery 20 metres you pace.
• Permanent grade banks can be surveyed usingthe same method. However the grade will bemuch less (usually 0.5%) which means thestaff will only be moved up 10 centimetres forevery 20 metres paced.
• If you need more help, an Agriculture WAofficer can show you how to use the level inthe field.
SEC
TIO
N 2
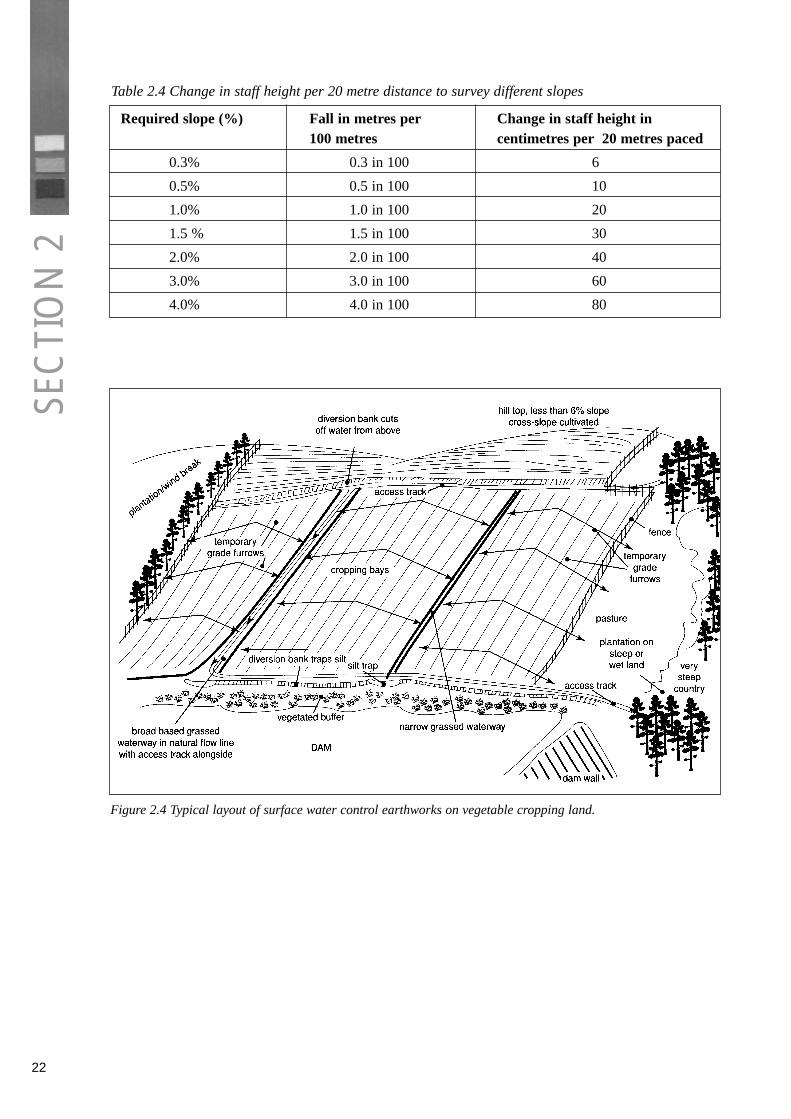
22
Table 2.4 Change in staff height per 20 metre distance to survey different slopes
Required slope (%) Fall in metres per Change in staff height in 100 metres centimetres per 20 metres paced
0.3% 0.3 in 100 6
0.5% 0.5 in 100 10
1.0% 1.0 in 100 20
1.5 % 1.5 in 100 30
2.0% 2.0 in 100 40
3.0% 3.0 in 100 60
4.0% 4.0 in 100 80
Figure 2.4 Typical layout of surface water control earthworks on vegetable cropping land.
SEC
TIO
N 2

23
Purchasing or hiring equipment
Surveying equipment can be bought fromsurveyors’ equipment suppliers, for example,Associated Instrumentation, Spectraphysics orTisco Instruments. (The authors show nopreference to the retailers listed and otherAustralian retailers can be found in the ‘YellowPages’).
The equipment listed below can be hired fromManjimup Landcare District Committee. Phone977 18180 for bookings.
- Surveying equipment – laser level, opticallevel, tripod, staff, clinometer
- Ausplow 3 point linkage deep ripper
- Single disc 3 point linkage plough forconstructing grade furrows
- Soil aerator
Establishing grass cover to stabilisewaterways(Rose, 1997; Hawley, 1997)
Permanently grassed waterways are an essentialcomponent of an erosion control system forvegetable production in high rainfall hills areassuch as Manjimup and Donnybrook. Theyenable the safe disposal of run-off water fromslopes into the natural drainage system and helpto minimise erosion.
Waterways can be constructed on land which isirrigated conventionally, or where centre pivotirrigation is used.
To minimise erosion, the ideal time of the yearto carry out the earthworks is thesummer/autumn period, when rainfall is at itslowest, although there is still a risk ofthunderstorms causing soil movement on bareslopes. Many landholders, however, would findit more convenient to complete the earthworks inlate winter to early spring when land is beingprepared for production. Irrespective of whattime of the year the works take place, it isessential to achieve revegetation of thewaterways as soon as possible to minimiseerosion.
By design some waterways are cut 15- 20 cmbelow the ground surface to create a shallowchannel to accommodate peak flows from theprotected land. This frequently creates anunfavourable site for the establishment of plantcover because some of the topsoil, whichcontains the nutrients for plant growth, isstripped from the waterway and is not replaced.Often the subsoil is hard, lacks structure andprovides an infertile, difficult environment forroot penetration and plant establishment.
Breaking up the subsoil by ripping, to facilitateroot penetration, can not be recommended, dueto the increased risk of erosion where watermovement is concentrated.
Suggested method for establishment of plantcover on waterways
• Direct sow by disc or tine three-point linkage-mounted drill, which is narrow enough to beaccommodated in the bottom of the waterway.A small Connor SheaTM disc drill would beideal. Drag light harrows behind the drill tocover the seed.
• If the ground is too hard to obtain effectivepenetration of 1 to 2 cm, lightly disc harrow toloosen up the surface.
• Where a suitable drill is unavailable, lightlydisc to provide a seed bed for the incorporationof broadcast seed. Harrow after seeding.
• Sow the sides of the waterway as well as thebase with seed and fertiliser.
• Sow a perennial pasture mixture to obtainstable, dense plant cover in the waterway.
• Carry out sowing as soon as possible afterconstruction of the waterways to minimiseerosion.
• Apply a heavy application of fertiliser topromote vigorous growth.
• During establishment it is essential that the soilbe kept moist to the surface by irrigation,otherwise mortality of seedlings can beexpected to be high in the warm to hotconditions of spring/summer.
SEC
TIO
N 2
24
Suggested pasture mixturekg/ha $/kg
Palestine strawberry clover 4 10.80Whittet kikuyu 2 32.00Ryegrass, e.g. Concord, Conquest, Richmond, Progrow 4 4.15Oats 20 0.16
• A perennial pasture mixture is preferablebecause it provides stable cover. Rhizomatousgrasses, including kikuyu and couch, are idealbecause of the uniform, matted cover theyprovide to limit soil movement by trappingparticulate matter. The same can be said forthe perennial clovers, which should be sownwith the grasses to provide nitrogen forgrowth.
• A disadvantage of the perennial species is thatthey could invade the cultivated land andbecome difficult to kill, especially couchwhich requires a high rate of glyphosate foreffective control.
• Temperate perennial grasses, which generallyhave a tufted growth habit, are less desirable.There is an opportunity for soil movementbetween the clumps and rilling and erosion inthe waterways.
• Phalaris, because leaf initiation commencesbelow ground, would be the most suitable,with the ryegrasses and cocksfoot less suitable.
• Annual grasses and legumes are also lessdesirable owing to their instability in a sward,particularly where irrigation is conducted.This results in the sward being prone toinvasion by weeds.
• Annual ryegrass and oats are included in themixture to obtain quick ground cover toprevent soil movement. They are not expectedto persist once the kikuyu and cloverestablishes a dense sward.
• If there is concern about the control of kikuyuin the vegetable areas, a suggested alternativegrass to sow is phalaris. A fine seed bed isessential for successful establishment. Sow 4kg/ha of Sirolan and roll the waterwayafterwards, if possible.
• Kikuyu will not germinate unless soiltemperatures reach 18-20˚C.
• Clover must be inoculated and lime pelletedfor effective nodulation and establishment.
Suggested fertiliser applicationkg/ha $/kg
Plain super 200 0.30Super copper zinc 400 0.43Muriate of potash 100 0.44Urea 100 0.57
Procedure
• Inoculate and lime pellet the clover the day ofsowing.
• Drill or broadcast the seed mixed with theplain super.
• Broadcast the super copper zinc and muriate ofpotash after sowing.
• Broadcast the urea when the pasture mixturehas germinated and the oats are 10 cm tall.Water the urea in after topdressing.
The total cost of establishing grass on a onekilometre of drain, three metres wide is less than$500.
Cover Crops(Rose,1997)
❑ Establishing a cover crop immediately afterharvest is of prime importance, both on thehigh rainfall hills land to prevent watererosion and on the sandy coastal plain toprevent wind erosion.
Minimise cultivation when establishing the covercrop or pasture
There is no need to plough, rotary hoe, use aconventional wide point drill or roll the paddock.Further cultivation after harvest will do moredamage to soil structure and may cause moresoil compaction. It should not be necessary tofertilise the paddock as adequate nutrients forpasture or cereal establishment would normallyremain in the soil from the horticultural crop.
SEC
TIO
N 2

25
Establishing a cover crop should be done withno more than one pass of a cultivationimplement. The simplest and most effective wayto sow a post-harvest cover crop is to broadcastcoarse seed such as oats or lupins at twice thenormal rate and follow with one pass of a tinedimplement or harrow. As well as reducing therisk of soil erosion, this method is simpler andcheaper than traditional cultivation sowing.
If there is risk of wet weather, broadcast thecover crop before harvest
Severe erosion events are most common afterharvesting in late in autumn or winter when ithas been too wet to sow a cover crop. Wherethere is a high risk of very wet weather,broadcast oats before harvest (use method 3 inexamples below) and install temporary gradefurrows immediately after harvest.
Ensure good vegetative cover and root structure
• Irrigate cover crops sown after summer harvestto ensure good establishment.
❑ Irrigation of bare, cultivated soil during theperiod between crops or while the covercrop is establishing, is the only way to stopwind erosion on some sandy sites.
• Keep stock off the cover crop during winter toavoid pugging.
• Leave the roots of the cover crop intact. Ifestablishing pasture in the following autumn,direct drill pasture seed into the cereal covercrop stubble. (see ‘Re-establishing pasture bydirect drilling’, this section).
Install grade furrows to protect cover cropssown on sloping sites
This is particularly important to protect the soilfrom intense rainfall where root crops wereharvested in late autumn or winter. On steepersites (>5% slope) and longer slopes (>100 m),grade furrows should be installed immediatelyafter sowing a cover crop at all times of the year.Where possible plan to avoid using the steepestcountry for crops that will be harvested in lateautumn or winter.
Soil friendly methods of establishing post-harvest cover crops and pastures
1. Establishment of oats and pasture afterharvesting potatoes
Growers in the Pemberton area use the followingmethod to establish oats and pasture in oneoperation, after harvesting potatoes in April –June:
• Level the paddock by following the harvesterwith a crumbler (one pass only).
• Direct drill the oats and pasture seed.
Or
• Broadcast oats and pasture seed together andcover the seed with one light pass of acrumbler implement.
Late maturing ryegrasses such as Concord orConquest, with subterranean and balansa cloversare recommended. Ryegrasses have a vigorousroot system that that is good for restoring soilstructure. The pasture must be sown as quicklyas possible and with minimal cultivation, beforethe opening rains make the paddock too wet towork. The oats can then be grazed in spring,which will allow the pasture species to establish.
2. Alternative method to 1
• Broadcast oats straight after harvestingpotatoes.
• Follow immediately with a deep ripper orchisel plough with harrows or railway irondragged behind to level the ground. Workacross the slope on a grade following the gradefurrows.
• If pasture is to follow, broadcast and lightlyharrow in or direct drill the pasture seedstraight after the deep ripping.
A challenge is to develop an implement thatdeep rips, sows oats, levels and broadcastspasture seed in one pass!
3. Recommended method for late harvest ofpotatoes
• Broadcast oats or an oat-lupins/vetch mixtureimmediately prior to harvesting. Vigorous oat
SEC
TIO
N 2

26
varieties such as Saia or Swan are best, andsow at a heavy rate (150 kg per hectare);fertiliser is not needed. The harvester willcover the seed and this results in acceptablegermination.
• Follow the harvester with one pass of acrumbler to level the paddock.
This quick ‘fail safe’ method eliminates the riskof the paddock being too wet to sow a covercrop after harvest. It is recommended whenanother vegetable crop is to follow, as the oatscan be grazed off in spring and/or turned in as agreen mulch.
If a pasture rotation is to follow, seed should bedirect drilled into the stubble in April of thefollowing year. Hence, with this method, pastureestablishment is delayed. Cultivation to sow thepasture should be avoided as this will leave thesoil vulnerable to erosion and contribute tofurther soil structure decline.
4. For early harvest of potatoes, December toFebruary
• Use method 1 or 2 to sow oats and pasture.Irrigate the cover crop several times to enablethe pasture to establish with the oats
or
• Use method 2 to sow oats or a summer cropsuch as sorghum or Sudax. As early asJanuary there is usually enough moisture left inthe soil after harvest for the crop to establish.Graze or spray the crop off. Direct drill orbroadcast and harrow in pasture seed in April/May.
5. For cauliflowers
Cauliflower stumps must be killed to preventspread of pests and diseases. To do this withminimal soil disturbance, mulching with anorchard mulcher is the preferred method. Asingle pass with a rotavator at no more than 2 cmdeep or a single pass with offset discs are othermethods that are acceptable though lesssatisfactory as they entail more soil disturbance.
If a crop of potatoes is to follow, use method 2(broadcast oats and chisel plough or deep rip)immediately after the cauliflowers are mulched.
If the paddock is to be returned to pasture, directdrill the pasture seed or broadcast and followwith harrows or crumbler as for method 1.Laneways and compacted areas may need deepripping or chisel ploughing prior to sowing.
Practices that should not be used to sow covercrops
Traditional sowing methods, using the oldertypes seed drills with conventional discs orscarifier points, should not be conducted whensowing cover crops.
These methods entail two or three cultivationswith a scarifier or disc plough prior to sowingand sometimes rolling after sowing. Thisprocess completely destroys any root structureremaining from the crop, leaving a finely tilledsoil surface with a cultivation pan at 15 – 20 cmdepth. When heavy rain falls on soil in thiscondition, it cannot infiltrate into the compactedsubsoil and runs off, carrying the loose topsoilwith it. Use of traditional sowing methods forestablishing post-harvest cover crops has been amajor cause of soil erosion in the south westhills areas.
Cover crops and grazing
Stocking or driving machinery on wet paddocksthat have been recently cultivated causespugging and compaction which destroys soilstructure. For this reason, the cover crop shouldnot be stocked during winter. Two options are:
- Defer grazing until spring, graze lightly andcut for hay.
- If a summer vegetable crop is to follow, turn inthe cover crop as a green manure in spring.
Re-establishing pasture by direct drilling
In the year following cropping, slash or graze thecover crop and use herbicides to kill the weeds.Direct drill the pasture with a minimum tillagepasture drill such as the Connor Shea 470 or8000TM series.
SEC
TIO
N 2

These machines have specially designed narrowT boot tines and flat coulter discs that enableaccurate sowing directly into the dry cover cropstubble or sprayed-off pasture, with minimal soildisturbance. Direct drilling involves only onepass and leaves old roots intact. This techniquevirtually eliminates erosion.
Direct drilling is not only better for the soil butalso cheaper and more convenient thantraditional intensive cultivation methods.
Points requiring close attention with directdrilling are:
Depth of sowing
Ideally fine seeds, such as clovers and grasses,should be sown at 1 cm depth and no greaterthan 2 cm. Germination will be reduced asdepth increases. Oats and cereal rye will tolerategreater sowing depths and 3 to 4 cm will notaffect germination.
Speed of sowing
If the correct ground speed is used there will beno need to cover the seed with trailing harrows,or by rolling. The T boot tine is designed tocause soil to collapse into the furrow to coverthe seed, provided the soil moisture level issatisfactory during sowing.
Fertiliser application
Don’t drill compound or mixed fertilisers withfine seeds as they can be toxic to germinatingseedlings. Toxicity is caused by theconcentration of fertiliser salts in the soilsolution, particularly in dry conditions.
Nitrogenous and potassic fertilisers are the causeof this problem when concentrated in solution.Fine seeds can be safely drilled withsuperphosphate at rates up to 200 kg/ha.Broadcast nitrogen when oats or cereal rye havereached 10 to 15 cm tall, or when ryegrasseshave reached 5 to 10 cm tall and have developedroot systems to utilise the nitrogen efficiently.Potash can be applied at the same time, or, onloamy soils, broadcast prior to sowing. Thefoliage of the developing crop or pasture at thetime of broadcasting should be dry to avoidburning.
Insect control
Frequent and close monitoring of insects atgermination is essential. No till or minimum tillseeding is more prone to insect damage thanconventional sowing methods. Insects fall intothe furrows left by the drilling operation andtarget the germinating seedlings. Watch for red-legged earth mite, pasture beetle, black beetle,weevils, grubs and slugs.
Inspect the reseeding closely every two daysduring germination. Inspection for weevils,grubs and slugs should be carried out in the lateafternoon or evening, when they become active.If seedlings appear to be chewed, or aredisappearing, scratch below the surface of thesoil where holes are evident, or it appears to bedisturbed, to identify the cause. Where damageis significant appropriate spraying will benecessary. Without spraying establishment islikely to fail.
Wind Protection
Windbreaks(Farm Forestry Advisory Service, 1996; Lantzke,1998)
❑ When growing in wind prone areas, includewindbreaks in the soil managementstrategy.
On the Swan Coastal Plain in particular, highwind speeds can cause crop damage and reducethe efficiency of sprinkler irrigation problems.The south west coastal plain is generally thewindiest areas in the state, with the dominantwind direction being from the east in themorning and from the south west in theafternoon. In winter, strong winds can also comefrom the north west with the approach of coldfronts. The establishment of well-designedwindbreaks provides wind protection and thushelps achieve higher yields and quality for mosthorticultural crops.
Tree windbreaks slow some of the wind as itpasses through, while the rest accelerates overthe top. Wind speed at ground level is reducedfor a short distance upwind and a much longerdistance downwind. A windbreak’s effectiveness
27
SEC
TIO
N 2

at providing shelter depends on factors such asheight, orientation to the wind, position in thelandscape, permeability to wind and uniformity(or absence of gaps).
Benefits of windbreaks
Windbreaks can increase farm productivity by:
• Preventing soil erosion when paddocks are dryand bare.
• Reduced plant damage. Windbreaks decreasethe incidence of broken stems, leaf loss andlodging of plants. The percentage of fallen andblemished fruit is reduced. Vegetable crops areprotected from sandblasting.
• Increased plant performance. Trials of variouscrops have shown that windbreaks can increaseyield. Strong, hot winds increase evapo-transpiration, causing moisture stress so thatmore frequent irrigation is required.
• Tree windbreaks when managed appropriatelycan also reduce groundwater recharge, increasebiodiversity and yield valuable timberproducts.
Windbreak design
Windbreak design will depend on their intendedpurpose – shelter, timber, aesthetic enhancement,or a combination of benefits. Next, consider yourfarm business and any limitations imposed byfarm boundaries, roads, fences and soil types.
Because the cost of establishing windbreaksthroughout a large farm can be high, givepriority to:
• Areas prone to wind erosion, such as mid toupper slopes and crests on the windward side.
• Crops which are particularly susceptible towind or spray drift.
• Paddocks used for young stock.
• Infrastructure such as dams, roads and sheds.
Spacing between windbreaks
Tree height is the main factor governing a windbreak’s effectiveness, so the taller the trees,the further windbreaks can be spaced apart.
Windbreaks are considered to give protection tothe area around them where wind speed atground level is reduced by at least 20 per cent.Using this yardstick, windbreaks can protectland for at least 20 tree heights in their lee, andup to four tree heights upwind. The area ofgreatest protection is between two and 10 treeheights downwind.
Constructed windbreaks
Artificial windbreaks can be used on theboundary of the property but, because of cost areusually used as smaller, internal windbreaks.Farmnote 24/84 ‘Building a syntheticwindbreak’ details how to construct syntheticwindbreaks.
Engineered windbreaks are designed to bebetween 40 and 55 % permeable, as the passageof some air through the fence prevents theturbulence created with dense or solid structures.ParawebTM is one synthetic material used forwindbreaks. Strong shade-cloth can also be used.Temporary ParawebTM windbreaks 0.95 metreshigh, supported by steel pickets and slats, can beused for growing vegetables. (Schwartz, 1984).
Tree windbreaks
Trees make excellent windbreaks because theygrow tall and are cheaper and more durable thanother alternatives. To protect soil and crops, theideal windbreak is about 30 to 40 % permeableto wind and has uniform foliage to ground levelon at least one side. Number of rows andspacing will depend on tree species.
Large trees are generally only suitable forexternal windbreaks and need to be placedfurther from the crop area to preventcompetition. Smaller trees can be used for bothinternal and external windbreaks
Many tree species can be used. NativeCasuarina sp are popular, giving good protectionall year. Native flowering species can provideadded bio-diversity benefits as bird habitats.Deciduous poplars and alders are often used forsummer protection. A single row of some speciessuch as poplar planted closely, about 1.5m
28
SEC
TIO
N 2

spacing, can make a reasonable windbreak.Larger trees can be grown in two rows 3 – 4metres apart with a similar distance betweentrees in the rows. An understory of shrubs andsmall trees to 5 m height between large trees isrecommended. Root competition is a
consideration. Some species, especially thelarger ones, will require root pruning with asingle-tined deep ripper if they are to be grownwithin one tree height of cropped areas.
Root competition is a consideration and rootpruning may be required with some species.
29
Table 2.5 Some suggested species suitable for windbreaks.(Department of Agriculture WA, 1990, Bulletin 4147; Department of Conservation and LandManagement Plant Propagation Centre)
Species Max. Height (m) Comments
Casuarina cunninghamiana (river sheoak) 15 Moderately dense canopy
Casuarina equisitifolia (coastal sheoak) 10 Medium spreading canopy
Casuarina obesa (swamp sheoak) 10 Salt tolerant
Agonis flexuosa (WA peppermint) 10 Willow-like foliage
Cerotonia siliqua (carob bean) 15 Dense canopy, edible beans, an introduced species
Callistemon sp 5 Fast growing, large red flowersKings Park Special bottlebrush)
Melaleuca nesophila 5 Large shrub, mauve bottlebrush flowers, drought resistant.
Acacia celastrifolia 2 Ornamental
Eucalyptus cladocalyx (dwarf sugar gum) 8 Fast growing
Eucalyptus lehmannii (bushy yate) 4 Bushy mallee
Eucalyptus platypus var heterophylla 7 Spreading, dense canopy(coastal moort)
Melaleuca lanceolata 6 Small dense tree suitable for (Rottnest Island tea tree) coastal areas.
Eucalyptus botryoides 30 Timber(southern mahogany)
Eucalyptus gomphocephala (tuart) 20 Likes limestone soils, timber, fast growing
Corymbia maculata (spotted gum) 25 Attractive tree, dense foliage, profuse cream flowers, timber
Eucalyptus saligna (Sydney bluegum) 35 Timber, fast growing
Eucalyptus grandis (rose gum) 35 Timber
Eucalyptus camaldulensis (river red gum) 20 Timber potential, some salt tolerance
Pinus pinaster (maritime pine) 20 Timber
Pinus radiata 30 Timber
Pinus canariensis 25 Attractive feature tree, timber.
Pinus pinea 10 Edible nuts
Note: There are other large trees with timber potential that are also suitable for windbreaks.
Refer to Section 8.1 for technical information on site preparation and tree planting.
SEC
TIO
N 2

Protecting bare, cultivated soil(Agriculture Western Australia, 1993; Rose, 1997)
❑ Minimise the time that the soil surface isleft bare and dry.
Avoid cultivating large areas and leaving thembare before planting. It is usually not necessaryto leave cultivated soil bare for more than a fewweeks before planting, even if soil fumigationhas been conduted.
After cultivating sites that are susceptible towind erosion:
- Water dry soil regularly to stabilise the exposed surface
❑ Plant post-harvest cover crop and irrigatethem after harvesting vegetable or potatocrops on sandy soils during summer.
- Treat water repellent soils to ensure thoroughwetting
- Install grade furrows where needed on slopingsites
• Leave crop residues on the soil surface asmulch.
Retention of crop residues is a proven method ofpreventing wind erosion in cultivated soils wherethere is risk of wind erosion after harvest. Only asmall amount of material is needed – 50 %ground cover is usually sufficient to preventerosion. The roots of the crop residue should beleft intact where possible.
Soils with greater than 50% gravel content aregenerally less susceptible to wind erosion.
Note: Grazing pea or faba bean stubbles shouldbe avoided. They provide poor protection astheir stubbles break up easily and blow away.The soil may be left completely bare resulting ina high risk of severe wind erosion.
Cultivation
Fast, dry cultivation increases the risk of winderosion.
If soil moisture is adequate, it may be possible tomaintain high cultivation speeds (up to 20 km/h)
without significant damage to soil structure.Speed must be reduced if moisture declines.
Trash handling seeders and minimum tillage canimprove the soil’s ability to resist erosion.
Cultivation should be stopped when clods arebeing excessively shattered and sand is beingknocked out of the plant root balls. A cloud ofdust can signal this stage.
On water repellent soils it is particularlyimportant to conduct practices such as stubbleretention and minimum tillage and ensure thatthe soil is thoroughly wet before cultivation.
Shelter crops
Shelter crops, sometimes known as ‘nurse crops’are a way of protecting young plants.
Nurse crops of cereal species
Nurse crops of cereal rye or other cereal speciescan be planted between the rows of direct seededvegetable crops such as carrots and onions toreduce sandblasting of emerging seedlings.Cereal rye is tough and withstands sandblastingmuch better then other cereals. It is sown at arate of about 50 kg per hectare. The cereal rye iskilled with a selective grass herbicide once thecrop is established and before the cereal ryeseriously competes with the vegetable crop.Nurse crops only protect the emerging seedlingand do not offer many of the other advantages ofwindbreaks that are listed above.
All weather access(Department of Natural Resources, Qld, 1995)
Good practices for constructing access tracks areas follows (see Figure 2.7, page 66).
• Construct tracks at ground level wherepossible.
In most situations, low cost unsurfaced tracksshould be constructed at ground level by gradingas lightly as possible and leaving no windrowsalongside. This avoids cutting into unstablesubsoils and channelling water in or alongsidethe track.
30
SEC
TIO
N 2
31
• Locate tracks on ridge-lines or directly upand down slope where possible.
This will minimise the tendency for the track tocollect water, thus reducing erosion.
Where a track must cross a slope, it is goodpractice to construct it immediately below asurveyed diversion grade bank. In some casesthe track can be run along the bank itself, butnever in the channel. This minimises the landused, and protects the track from erosion.
Avoid locating tracks on grassed waterwaysexcept where the waterway is specially dished inthe middle to run water on stable groundbetween the wheel tracks (Rose, 1997).
• Install ‘speed humps’ to divert water off thetrack.
Construct ‘speed humps’ (low earth banks)across the track every 20-100 m to divert wateroff the track onto pasture on the lower side.Steeper grades require closer spacings.
Maintain access tracks – any erosion damageshould be repaired and drainage rectifiedpromptly. Speed humps and diversion drainsneed to be maintained as necessary.
Constructing built-up roadways is expensive, butmay be necessary in situations of high use orpoor drainage. If not properly constructed, theycan intercept and channel water, thus causingerosion. Construct drains beside roadways wherenecessary. To minimise erosion of the drains:
- Construct drains with a flat bottom, at least 0.5meters wide.
- Run the drains off into pasture or vegetationevery 20-100 m depending on slope andvolume of run-off.
Where this cannot be done and the grade issteep, the drain may need to be lined with rock(see ‘Rocked chutes specifications andconstruction’ below).
A qualified consultant should be employed toplan roadways so that gutters, diversion drainsand pipe crossings are adequately designed andproperly located.
Rehabilitation of eroded and landslipareas
❑ Establish and/ or maintain perennialvegetation on waterways.
Fencing and/ or permanently vegetating streamsand flow lines is much less expensive in the longrun than taking a risk and trying to repair erosionafter it has occurred. When waterways havedegraded to deep eroding gullies, stabilisingthese is a costly exercise involving rocking orconcreting at costs of up to $50,000 per km ormore. The situation is best avoided by notclearing the natural vegetation from streams andfencing it to keep stock out. If waterways havealready been cleared but are not yet eroding,they should be fenced as soon as possible tomaintain vigorous perennial vegetation on them.Introduced species such as kikuyu grass andbull- rushes are easy to establish and suitable fordegraded sites with no native bush conservationvalues.
❑ Timely action is needed to treat erosiongullies as soon as possible after they start,as the damage may worsen rapidly.
The eroding gully will need to be repaired insummer when there is little chance of rain. If theeroded section is short, the catchment less than10 hectares and the slope less than about 3%, itmay be possible to fill the gully and stabilise itby sowing a grass sward.
Gully filling procedure(Department of Agriculture WA Farmnote 56/79)
1. A road grader is the best machine to use forfilling erosion gullies. Make the first 4- 6 runsalong the side of the gully taking up to 15 cmof topsoil away from the gully edge. Stockpilethe fertile topsoil containing grass and cloverseed in two windrows about six metres awayfrom the gully edge on both sides.
2. Switch the angle of the blade to cut off theedge of the gully and push subsoil into it.Work around and around the edge of the gullyuntil it is filled to a gentle depression.
3. Respread the windrowed topsoil over thefilled gully area. Reseed with grass, oats andclover (see ‘Establishing grass cover to
SEC
TIO
N 2

stabilise waterways’, this section, forrecommended seed mixes.)
4.To protect the filled gully while grassestablishes, install temporary grade furrows atintervals of less than 50 m to divert run-offaway from filled area and onto stable pasture.Construct a large horseshoe shaped diversionbank at the top of the filled area to divertlarger flows from up-slope.
5.Fence the area immediately to keep stock off.Two electric tapes or wires are sufficient andcost effective to keep cattle off whilevegetation establishes.
6.Keep the filled area grassed so it functions as astable waterway. Do not attempt to cultivateover it again.
In cases where flow is confined to steep unstableeroding gullies and cannot be diverted to anothermore stable area, grassed waterways cannot beconstructed. However, timely treatment isessential as hundreds of cubic metres of soil maybe eroded away each winter, rapidly multiplyingthe cost of rectification.
In these situations, more expensive constructedwaterways are required.
32
Table 2.6 Constructed waterways(Rose, 2000)
1. ROCKED CHUTES
Description Spoon shaped drain lined with geo-textile and rock.
Purpose Creating a stable man-made waterway where earth, grassed waterways are not feasible.
Suitable for (site, soil types) Erodible soils, relatively high peak flows.
Gradient of earthworks Slopes up to 15%.
Profile Excavate 3-4 m wide by 0.8- 1 m deep with flat bottom and battered sides; backfill with 0.3- 0.3 m of rock aggregate.
Machinery required for Forming profile – road grader or excavator with wide flat bucket.construction Laying rocks – heavy truck and front end loader or excavator.
Estimated cost $20- 50,000 per km.
2. CHUTES LINED WITH CONCRETE REVETMENT MATTRESS
Description Chutes and spillways lines with an indented concrete filled fabric mattress.
Purpose As for rocked chutes. Dam spillways.Drop structures.
Suitable for (site, soil types) Situations such as high volume or fast flows and/or unstable soils, where cheaper options are not possible.
Gradient of earthworks 10- 80%.
Profile Spoon shaped; width generally 1 – 5 m depending on flow.
Machinery required for Forming profile- road grader or excavator with wide flat bucket.construction Laying concrete- bulk concrete truck; specialised concrete pumping
machinery.
Estimated cost to survey and Concrete revetment lined chutes- > $50,000 per km.construct
SEC
TIO
N 2

33
Rocked or concreted chutes(Rose, 2000)
Rocked chute- specifications and construction(Rose, 2000.)
• Calculate the required cross sectional area ofthe chute. For catchments of larger than 20hectares, 20 year peak flows should becalculated and the cross section designedaccordingly. For paddock situations within thelimits specified, dimensions in Figure 2.5 willbe adequate.
• Part fill deeply eroded sections of the gullywith suitable clay based fill and compact.
• Shape the gully into a shallow spoon crosssection (see diagram) with a flat bottom 0.5 mwide (Figure 2.5). A road grader or trackmounted excavator with wide bucket are themost economical machines to use for this
operation. Choice of machine will depend onsite terrain.
• Estimate the volume of rocks required. Therock layer is about 0.5 metres thick down thechute. A chute of the dimensions shown inFigure 2.5 will need a 10 cubic metretruckload of rock for every 7 metres of drain
• Cart rocks and stockpile them down the gullyadjacent to the chute so that they can easily beinstalled with a front-end loader, backhoe orexcavator.
• The size of the rocks is very important.Approximately equal volumes of rocks 20 -50cm diameter and rocks of around fist to golfball size are needed. If the rock fill does nothave a mixture of rocks between these sizes,make paired stockpiles of the smaller and thelarger rocks.
Figure 2.5 Cross section of a rocked chute (suitable for slopes of 5% to 15%, with a cleared catchmentarea of up to 20 hectares).
• Purchase geo-textile – Bidum A24 or 34 grade.This comes in rolls 150 m long by 4 m wide(Geofabrics Australia phone 93094388).
• Bury the top of the geo-textile in a substantialtrench at the top of the chute and fill with rock.Run the textile down the spoon drain.
• Spread a layer of the smaller rocks about 10-15 cm thick on the bidum cloth.
• Place the larger rocks on the smaller rocks.
• Fill around the large rocks with small fist sizedrocks, packed in to make a uniform rock layer40-50 cm thick.
• The geo-textile blanket should be wide enoughto extend about 0.3 m outside the lip of thespoon drain on each side. After the rock is inplace, grade about 0.5 m of earth in over theedges of the geo-textile.
Sow a strip a few metres wide along the edges ofthe drain with kikuyu, ryegrass and clover. Keepstock off while this establishes. This willstabilise and protect the edges of the drain in theevent of over-topping.
SEC
TIO
N 2

Treatment of landslips(Rose and Bennett, 1999)
Landslips can occur on steep slopes alonggeological lineaments or at the intersection oflineaments. These lineaments may be doleritedykes, quartz seams, faults or shear zones. Theslips are caused by clearing of forest allowingmore water to infiltrate into the subsoil where itis channelled along the lineaments. This canlubricate the interface between the soil profileand saprolite (weathering rock), causing sectionsof the soil profile to slip. An extreme event suchas heavy rain provides the ‘trigger’ for the slip tomove.
Though usually less than one hectare, there arelarger slips covering several hectares. Slippage ismore common on steep, cleared, sites withshallow soils and bedrock close to the surface,such as found in the Blackwood Valley aroundBalingup and Bridgetown.
❑ Treat landslips early by fencing andplanting with trees and shrubs to preventworsening erosion and slippage.
It is helpful to map the lineaments on an aerialphoto of the whole farm and tackle rehabilitationas part of a whole farm plan. AgWA staff canassist with this.
• Fence the slippage, including a hectare ormore above, and keep stock off.
• Plant large waterlogging tolerant trees belowthe slip to stabilise it, e.g. E. patens, E. botryoides, E. grandis, A. melanoxylon, E. robusta. This helps prevent continued soilmovement down the slope.
• Plant small shrubby deep-rooted trees directlyabove the slip, for example ornamental/flowering native species such as Melaleuca,Acacia, Grevillea and Callistemon are ideal.Their role is to bind the soil together andprevent erosion. Perennial grasses such askikuyu can also be encouraged to grow in theslip. It is important not to use larger trees onthe active slip as their weight and wind forcescan actually make the slip less stable.
• Plant a tree-lot along the lineament up-slope ofthe slip as far as possible to help use the
excess water. Commercial blue gums oreucalypts for sawlogs are good options.
• Pumping from a groundwater bore above theslip and using the water is another option, ifthe water is of good enough quality.
2.2 Maintain or improve soilphysical and biologicalhealth
Understanding soil quality and health(See Code of Practice 2.2)
Field tests for soil health
❑ Monitor soil health and where necessarychange or modify soil management.
Why assess soil health?(Murphy and Abbott, 2000)
Western Australian topsoils generally consist ofmaterial that is low in clay, organic matter andbiological activity. Consequently their inherentsoil quality is naturally low. These soils arewidely used for farming but they are highlyvulnerable to inappropriate managementpractices, which cause a decline in soil health.For sustainable soil management to be achieved,the growers need early recognition of soil healthproblems. To combat a decline in soil healthwith the intention of maintaining long-termproductivity, the adoption of improved landmanagement practices is required.
Soil quality index and benchmarks
University of WA researchers are developing asoil quality index based on the simple physical,chemical and biological soil tests listed in thissection. The index will show critical levels forthese soil quality indicators and active soilorganic carbon for soil types within WAcropping regions. Farmers will be able tocompare their test results over time and againstthe critical levels for their soil type and region.This will enable them to determine whether their
soil health is improving or declining and adjusttheir management practices accordingly.
34
SEC
TIO
N 2

Organic matter – a key component of soil quality(Milton et al, 2002)
Sustainable management of soil, in particularsoil organic matter, has been identified asessential for the continued viability of theWestern Australian agricultural industry. Soilorganic matter plays a key role in carbon,nitrogen, sulphur and phosphorus cycling andalso improves soil structure.
Total soil organic matter content changes slowly(unless soil erosion occurs, in which case thereis a rapid decline), due to the relatively smallinput of organic matter each year compared tothe soil reserve. The reason is that a largefraction of soil organic matter in Australian soilsis charcoal, which is essentially inert carbon.The size of the charcoal fraction is notinfluenced in the short-term by managementpractice.
Total soil carbon is therefore not suited tomonitoring short-term (less than approximately 5years) changes in soil fertility. However it is stillcommon soil analysis requested by farmers.
The biologically active or ‘labile’ fractions ofsoil organic matter do reflect changes in soilquality. Methods of detecting them areappropriate for use within laboratory-based soilquality packages (see test 9, ‘Soil organic carbonand biological activity’, below). It is to be hopedthat these tests will soon be available to growers.
Country-based training courses in soil fertilityfor farmers are presented in association with theLand Management Society. An intensive,university-based course on soil fertility, thatspecifically targets agricultural consultants andagri-business representatives, is held annually.These courses are supported by a ‘Soils areAlive’ newsletter (4 editions/year) and associatedwebsite (www.soilhealth.com). General aspectsof soil biology and agricultural sustainability arealso being promoted through a regular sciencesection in the Western Australian No-TillageFarmers Association (WANTFA) newsletter (www.wantfa.com.au) and a question-and-answer column (‘Ask Dr Dirt’).
How to test soil health(Rose, 1997)
To thoroughly assess a paddock, the physical andbiological tests should be done for at least foursites per paddock to account for soil variability.The 10 simple tests described can be conductedand recorded in 30 minutes. It is recommendedthat paddock soil health and cultivation recordsare kept, as they can be compared over time andagainst local benchmarks when these aredeveloped.
Equipment needed:
Spade, 10 cm soil sampling tool, plastic bagsand tape, infiltrometer ring , clear dish standingon square of black plastic, watch, ruler/ tape, soilpenetrometer or sharpened 6 mm rod, 10 litres ofrain water, recording sheet on clip board, pencil.
A good set of tests for soil health is as follows:
Physical indicators
1. Soil moisture and time since last rain2. Soil surface condition3. Penetrometer test for compaction pans4. Water repellency test5. Infiltration rate6. Slaking and dispersion7. Soil profile description
Biological indicators
8. Large soil organisms
9. Soil organic carbon and biological activity
Chemical indicators
10. Chemical tests
Tests 2, 3 and 4 are important to determine theerosion prevention strategy.
Test 3. (Penetrometer test for compaction pans)can be repeated many times over the paddockconcentrating on areas where compaction issuspected, such as loading areas.
Test 4 (Water repellency) should be done on drysurface soil from at least several locations in thepaddock.
Tests 9 and 10 are laboratory tests, conducted onbulked surface samples taken over each soiltype.
35
SEC
TIO
N 2
Digging two or more holes to 40 cm depth witha spade for each paddock is sufficient for theother tests. Test 5 (Infiltration rate) should bedone next to the hole on undisturbed pasture.Tests 6-10 are conducted on soil from the holes.
Procedure for ten soil tests(Rose, 1997; Abbott, 2002)
1. Soil moisture and time since last rain
The physical and biological soil tests shouldalways be done when the soil is moist, as resultsof some tests will vary with soil moisture.Recording soil moisture and time since last rainwill also indicate how well drained the soil is.
Procedure – Feel handfuls of soil from 0-10 cmand 10-20 cm depth.
Dry Dusty; no moisture present.
Moist Moisture present but cannot be squeezed out by hand.
Wet Moisture can be squeezed out by hand
2. Soil surface condition
This ranks the extent to which the soil surfacehas become degraded as a result of erosion,aggregate breakdown or compaction and thedegree of protection by vegetation.
Observe the soil surface on an undisturbed 4metre square area adjacent to the soil profilehole:
Erosion. Rills are where water has run andcarried soil with it. Visually estimate the % ofarea affected by rill erosion and depth and lengthof rills. Repeat for gully erosion. Estimate % ofarea affected by sheet erosion (Section 2.1‘Observing the signs of erosion’). A moreaccurate way to measure erosion is by insertingpins marked at soil surface level. The amount ofsoil removed can be measured by measuring thelength of pin exposed.
Surface crusting usually occurs in soils with adispersible clay fraction. These are usually sodic.A crust up to 2 cm thick forms when the surfacedries out. Record presence or absence.
Cloddiness. Record presence or absence of solidclods not held together by plant roots.
Vegetative and/ or crop cover. Estimatepercentage of ground covered.
3. Penetrometer test for compaction pans
Soils with sandy loam to sandy clay loamtextures have a continuous range of particlesizes. These are more susceptible to compactionthan poorly graded sands. Compaction can bedetected visually by observing hard layers whendigging, where roots will not penetrate. Directmeasures can be obtained with a penetrometer.
A penetrometer measures soil hardness or degreeof compaction. The readings can indicate (butare not directly correlated to) ability of roots topenetrate into the soil. Taking readings at every5 cm depth will indicate whether compactionpans are present. Note that penetrometerreadings can be unreliable in peaty or verygravelly soils and should be repeated severaltimes.
There are several types of penetrometers. Thesimplest ‘home made’ version is a 6 mm rodwith a handle. The depth of penetration underthe user’s weight can be measured with a ruler.
Another type, a 10 mm graduated, pointed rodwith a sliding 1 kg weight, can be made forabout $150. More accurate penetrometers canbe purchased. These are sharpened rods withforce gauges attached to the handle.
Record the force or number of blows (dependingon the type of instrument used) required topenetrate each 10 cm depth of soil profile to atleast 40 cm.
4. Water repellency test (Water drop penetrationtest)
Place a drop of water on the soil surface. Onnon-wetting soils the water will form a ball and stay on the surface for a while. Record on thesheet the time taken for the drop to infiltrate.
36
SEC
TIO
N 2
Time (seconds) Classification
<3 wettable
3-60 slightly water repellent
60-600 strongly water repellent
>600 severely water repellent
5. Infiltration rate
An infiltrometer ring is used to test for soilpermeability. This measures the rate of waterentry into the soil. Slow infiltration may meancompaction, unstable aggregates, poor soilstructure or surface crusting.
To make the infiltrometer ring, cut the top andbottom out of a tin 15 or more cm in diameter.Make six indented marks 1 cm apart with ascrewdriver up the outside of the tin startingthree cm from the sharp edge. Twist the sharpedge of ring into the soil to the 3 cm mark andpack clay soil around the outside to form a seal.Avoid disturbing the soil surface inside the ring.Gently pour a few cm of water into the ring andwait for it to soak in completely and wet thesoil. Then pour 5 cm depth of rain water intothe ring (to top indented mark). Record the timetaken for the water to infiltrate. Record the depthinfiltrated after 5, 10, 20, 30 minutes.
6. Tests for slaking and dispersion
Aggregate stability tests measure the ability ofsoil crumbs (aggregates) to maintain theirstructure when subjected to forces, for examplecultivation and raindrop impact.
The slaking test- measures the extent to whichthese soil aggregates disintegrate into fineraggregates when placed in rainwater. Thedispersion test measures the extent to whichfiner aggregates break down into clay (theaggregate appears to dissolve and makes thewater ‘cloudy’).
Take a few 0.5-1.0 cm diameter crumbs of soiland immerse them in a shallow, clear dish ofrainwater standing on a sheet of black plastic.
Record whether they slake or disperse afterabout 10 minutes.
7. Soil profile description
This essentially describes the soil type, i.e. thedepth, texture, colour and gravel content of thesoil layers, depth of root penetration andpresence of plough or compaction layers.
Dig a 40-50 cm deep square-sided hole 30 cmwide. For the A horizon (top, darker coloured )and B horizon (soil below this), record:
Depth Use a ruler of steel tape.
Colour Black, light or dark brown, orange, yellow or grey.
Gravel Estimate to nearest 10 % by content volume of gravel stones larger
than 2 mm .
Texture
Use the ribbon test. Take a golf ball sizedquantity of soil free of gravel stones and work itup in your hand, adding drops of water until it ismoist but not so that water can be squeezed fromit. Work it out between thumb and forefingerinto a ribbon. The length of the ribbon that canbe formed and the feel of the soil determines itsclassification.
sand – S – will not form a ribbon, cannot bemoulded, feels gritty.
loamy sand – LS – minimal ribbon about 5 mm.
clayey sand – CS – sand grains stick to andcolour fingers, ribbon 5-15 mm.
sandy loam – SL – can be moulded but feelsgritty, ribbon 15-25 mm.
loam – L – spongy, smooth feel (not gritty orsilky); ribbon about 25 mm.
sandy clay loam – SCL – gritty feel but plastic;ribbon 40-50 mm.
clay loam – CL – smooth, plastic, ribbon 40-50mm.
clay loam, sandy – CLS – plastic but somegrittiness; ribbon 40-50 mm.
light clay – LC – plastic, smooth, slight resistanceto ribboning shear; ribbon about 75 mm.
37
SEC
TIO
N 2

clay – C – smooth, very plastic, moderate to firmribboning shear, can be moulded into rods,ribbon 75 mm or more.
Roots Record presence, depth and quantity.
Compaction layers Record presence or absence and depth. Apocket penetrometer can be used for down-hole testing of soil hardness.
8. Large soil organisms
The presence of earthworms indicates a healthysoil as these animals dig through the soil andexude ‘glues’ that help form soil aggregates.Many other soil micro-organisms, especiallyfungi, do the same thing but will not be visibleto the naked eye. Although some beetles andweevils and most mites are beneficial to the soil,others, such as white fringed weevil, are pests ofroot crops. Either way, they are worthrecording.
Examine the darker soil from the A horizon ,especially the root zone. In pastures this is thevegetated sod of soil removed from the top ofthe holes. Record soil animals.
9. Soil organic carbon and biological activity
Biological fertility predominantly occurs in thesurface layers of Western Australian agriculturalsoils (Murphy et al., 1998). Total organic carbonis measured by most laboratories, as part of theirstandard soil chemical analysis of samples takenfrom the top 10 cm. This test is of little usebecause most of the carbon in WA soils ischarcoal, which gives no indication of thebiological activity in the soil.
There are simple laboratory tests that areaccurate and reliable enough to show changes inthe biological health of soil in less than a 5 yeartime span. In the past these tests have not beenavailable commercially in WA. However, due topromotion by researchers at the University ofWA (Milton et al., 2002), they are becomingavailable in some laboratories.
Examples of useful laboratory tests for soilbiological activity are:
1. Potentially available nitrogen
2. Hot water soluble C extraction
3 Cold water extractable C extraction
4. Microbial biomass
Growers are advised to seek laboratories that cando some or all of these tests and request thatthey be done in addition to the normal soilnutrient analyses.
Soil samples of 0-5 cm depth are required todetect changes in soil biological activity in theshort term.
10. Chemical tests
Standard analyses of soil nutrients are availablecommercially through companies such asCSBPTM or AnalabsTM. Kits and sampling toolscan be purchased from rural supplies retailers.
To get nutrient application right, it is essential toconduct a soil sampling and testing program,aiming to test each main soil type in eachpaddock or land management unit at three yearlyintervals.
Sampling technique is important (Farmnote94/84), as it is the usual source of inaccuracy ofsoil test results. Take at least 20 core samples to10 cm depth for each soil type and bulk thesetogether for testing. Samples should preferablybe taken along marked transects so that these canbe re-sampled in later years, enabling moreaccurate detection of changes in the soil nutrientstatus.
Have the soils tested at an accredited laboratory,e.g. CSBPTM, SummitTM, Chemistry CentreTM orAnalabsTM. Specify that the PRI test is required.It is often cost effective to engage anindependent soil consultant to interpret theresults and recommend fertiliser types and rates.
Keep the soil nutrient test records with the otherdata for each paddock.
38
SEC
TIO
N 2

Recording the health of your soil (Rose, 1997)
The farmer can conduct and record most of thetests in the field. Table 2.7 below is provided forthe grower to photocopy and use as field
recording sheets. Soil nutrient status and soilorganic carbon tests are conducted in thelaboratory but can be attached to this recordingsheet or entered into the tables.
39
Table 2.7 Soil quality and health test recording sheet
Farmer name ..............................................................................................................................................
Location No ...............................................................................................................................................
Paddock name............................................................................................................................................
Date of this test ..........................................................................................................................................
PADDOCK CROPPING HISTORY
Date clearedNumber of times croppedRotation interval between crops (years)Crops grownCurrent crop rotationOriginal vegetation on site in order of abundance, e.g. marri, jarrah
CULTIVATION TECHNIQUES
Year that minimal tillage first used
List all cultivations and 1 ......................................................2....................................................chemical applications used 3 ......................................................4....................................................for last crop 5 ......................................................6....................................................
7 ......................................................8....................................................9 ......................................................10..................................................
SEC
TIO
N 2

1. TOPSOIL MOISTURE AND TIME SINCE LAST RAIN
Soil moisture in A horizon (tick box)
Dry (D), moist (M) , wet (W)
Time since last rain (days, hours)
Note that the soil should be moist for all of the physical and biological tests
2. SOIL SURFACE CONDITION
site A site B site C site D site E
Extent of rill/ sheet erosion (% of area, depth of rills in cm), e.g. 25/8
Surface crusting (yes/no)
Surface soil structureless, massive – forms clods when cultivated (yes/ no)
Vegetative/ crop cover(type of pasture or crop or bare)
3. PENETROMETER TEST FOR COMPACTION
site A site B site C site D site E
Force (kPa) or number of blows to penetrate first 10 cm
Force (kPa) or number of blows to penetrate next 10 cm
Force (kPa) or number of blows to penetrate next 10 cm
Force (kPa) or number of blows to penetrate next 10 cm
4. WATER REPELLENCY TEST
site A site B site C site D site E
Time (seconds) for a drop of water to soak into firm, dry soil surface
5. INFILTROMETER TEST FOR SOIL PERMEABILITY
site A site B site C site D site E
Time to infiltrate (minutes)................cm in.........minutes, e.g. 5/15
40
SEC
TIO
N 2

41
6. SLAKING AND DISPERSION
site A site B site C site D site E
Aggregate stability test (Tick box for A & B horizons) A B A B A B A B A B
Dispersion: no dispersion
incomplete dispersion
complete dispersion
Slaking: aggregate retains shape
partial collapse
complete collapse
7. SOIL PROFILE DESCRIPTION
A horizon site A site B site C site D site E
Depth cm
Gravel, approx. percent
Colour, e.g. orange, yellow, grey,brown,
Texture, by ribbon length (mm) and feel (see test description for codes)
Root abundance (0-3) 1 = few, 3 = many
Plough/ compaction layer? (yes/ no)
B horizon (subsoil)
Gravel approx. percent
Colour
Texture
Hard pan present? Depth to pan
Root depth (cm)
8. LARGE SOIL ORGANISMS
3.1 Soil animals (tick if present) site A site B site C site D site E
Earthworms
Weevils
Beetles
Other (name)
Insect larvae
Eggs of earthworms or other
SEC
TIO
N 2

9. SOIL BIOLOGICAL ACTIVITY AND ORGANIC CARBON
Laboratory tests for organic matter and biological activity.Take 0-5 cm samples taken at the same places as the samples for chemical tests
Paddock soil type, e.g. A-brown sand. site A site B site C site D site E
Potentially available nitrogen
Water soluble C
Enzyme activity
Microbial biomass
Total carbon
10. SOIL CHEMICAL TESTS
Notes:
• If the soil type is the same for all sites the samples can be bulked into one 0-10 cm sample andone 20-30 cm sample.
• PRI is only necessary on light sandy soils.• Trace elements are only necessary every three or four crops or if deficiency is suspected.
Soil type pH N P K S Ca PRI Reactive Tracee.g. A-brown (CaCl2) elements ironsand
site A 0-10 cm
site A 20-30 cm
site B 0-10 cm
site B 20-30 cm
site C 0-10 cm
site C 20-30 cm
site D 0-10 cm
site D 20-30 cm
site E 0-10 cm
site E 20-30 cm
42
SEC
TIO
N 2
43
Modifying soil management to treat soilhealth problems(Rose, 1997)
Erosion
Treat by:
• Minimising tillage.
• Maintaining vegetative cover by post-harvestcover crops (high rainfall) or leaving stubblesintact (low rainfall).
• Constructing surface water control works suchas grade banks, grade furrows, grassedwaterways.
• Cultivating across the slope on a controlledgrade.
Surface crusting
This indicates soil sodicity. Treat with gypsum.
Cloddiness
Increase organic matter. Introduction of aperennial pasture phase and growing mulchcrops will help achieve this. Application ofgypsum is beneficial in some soils and this canbe determined by trying test strips. If the causeis compaction, treat by modifying cultivationpractices (see ‘minimising soil compaction’below). Don’t deep rip if the subsoil is clay.
Poor infiltration
Treat as for compaction. Minimise tillage andgrow perennials where possible, to keep rootchannels intact deeper in the soil profile. Alsosee ‘Water repellency’ below.
Soil compaction
A short-term solution is deep ripping with anarrow tined implement. However, compactionis a symptom of using cultivation practicesinappropriate for the soil type and needs to beaddressed by improving the soil managementstrategy. Practices that minimise compaction aredescribed under ‘Minimising soil compaction’below.
Water repellency(Blackwell and Morrow, 1997)
Practices that reduce water repellency:
• Applying clay to the topsoil by clay spreadingor delving (bringing subsurface clay into thesurface soil).
• Furrow sowing using press wheels is most costeffective for large areas. Similarly, presswheels can be used to flatten the tops of thehills when cropping potatoes.
• Liquid soil wetting products can be sprayed infurrows using specially adapted furrowseeders.
• Straw mulching is another means of improvinginfiltration.
Slaking soils
Build up organic matter by maximisingvegetative growth, planting mulch crops oradding mulches or compost. Control surfacewater run-off to minimise erosion.
Dispersive soils
Treat with gypsum.
Low biological activity/ organic carbon
• Practise minimal or no tillage.
• Grow green mulch crops or adding compost ormanures.
• Apply lime if pH <4.5.
• Introduce a perennial pasture phase such askikuyu, lucerne or perennial rye.
Water repellent soils
• Furrow sowingFurrow sowing using press wheels most costeffective for large areas.
• Straw mulching
• Application of liquid soil wetting products
This is expensive but may be more practical formore intensive applications on smaller areas.
SEC
TIO
N 2
Minimising soil compaction(Rose, 1997.)
The degree of traffic compaction increases withnumber of passes but the first pass does 90% ofthe damage.
• Control traffic during all cropping operations
Controlled traffic farming is the repeated use ofthe same wheel tracks for every tillage, planting,spray and harvest operation. The benefits arethat damage to soil structure through continualcompaction and re-loosening is confined to asmall percentage of the cropped area. Tractiveand field efficiencies are also improved.
Good practices in horticulture that are based onthe principle of controlled traffic farming are:
- Standardising and widening the span ofboomsprayers and fertilising machinery so thatall post-planting tractor traffic can be confinedto fewer, wider spaced tracks.
- Cropping on raised beds, which are the samewidth as the inside of wheel tracksstandardised for all implements used.
• Make a single pass with a narrow-tinedimplement in the wheel ruts after planting.
For the final cultivation, make a pass with athree-point linkage mounted implement withtines following in the wheel ruts. This breaksup the compacted layer and aids infiltration ofwater.
• Keep tyre pressures as low as possible anduse lighter machinery where possible.
Reducing ground pressure will reduce soilcompaction. The most practical way to do thisis to lower tyre pressures as far as possible.This effectively enlarges the ‘footprint’ of thetyre to a longer, flatter shape, spreading theweight of the machine over a larger area.Another way to reduce ground pressure is touse lighter machinery or tracked machinerywhere possible.
• Treat only the compacted areas by deepripping.
Where traffic compaction hardpans do occurthey can be broken down by deep ripping to
30-50 cm depth with a narrow-tined ripper.However, deep ripping should not be necessaryas a regular practice. It is far preferable tominimise compaction by practicing minimal,appropriate tillage as described in the sectionsabove. Ripping can have detrimental effects onsoils with shallow clay B-horizons, by causingsubsoil smearing and bringing clay to thesurface.
• Keep stock and machinery off wet soil.
Most severe compaction occurs when the soilis worked by machinery or pugged by stockwhen wet. Stock and machinery should be keptoff cropping paddocks in winter when the soilis wet.
• Practice mulching of crop residues and growgreen mulch crops.
Leave the roots intact and the crop residuesstanding or slashed and lightly incorporated into the top few centimetres of soil. Thismaintains the root channels, increasing soilorganic matter and soil micro-organisms whichimprove soil structure and infiltration.
Minimising cultivation(Rose, 1997)
The aim when cultivating is to minimise damageto the topsoil structure. This means minimisinginversion, mixing, pulverising and smearing ofthe soil profile.
Table 2.8 summarises the ways in which topsoilcan be damaged, the implements that cause thedamage and the best implements to use to avoid it.
Frequent or fine tillage destroys soil structureby:
• Breaking up the natural crumb structure bydestroying soil aggregates
• Destroying root pathways
• Compaction, creating traffic hard pans.
Compacted, poorly aerated soil has no crumbstructure, fewer air spaces and high resistance topenetration (hardness). These factors limit rootgrowth and reduce infiltration resulting in lower
44
SEC
TIO
N 2

45
crop yields, more run-off and more erosion.Contrary to common belief, fine tilth does notaerate the soil but has the opposite effect.Rotary hoes tend to destroy soil structure bytheir pulverising action. Disc and mouldboardploughs smear and seal the subsoil causing‘plough pans’ which limit root penetration.
Although horticultural cropping, particularly forpotato and root vegetables, requires relativelyintensive cultivation, there is great variation inthe number and type of cultivations used. Whilethe traditional method was to cultivate as manyas 10 times (including planting and hilling),leading potato growers are now cultivating onlyfour times, without any decrease and sometimeswith increased yield and quality.
❑ Minimise tillage to maintain soil structure,reduce soil compaction.
❑ Keep cultivation and soil disturbance to theminimum required to grow the cropsuccessfully.
Guidelines for good cultivationpractice(Rose, 1997)
In general:
❑ Narrow-tined implements are far lessdamaging than broad bladed implements.
❑ Slow rotation and travel speeds are lessdamaging than fast speeds.
The following are guidelines for good cultivationpractice:
• Minimise the number of cultivations. Lesscultivation means less destruction of soilstructure and less compaction in wheel ruts. Inthe Manjimup- Donnybrook are, accepted bestpractice conducted by leading potato growersinvolves only four cultivations to prepare thepaddock, plant and grow the crop.
• Minimise depth of cultivation for allcultivations other than when deep ripping hardpans. Deep ploughing reduces soil biologicalactivity by inverting, mixing and diluting thecrucial surface organic layer. This top five toten cm of aerated soil is where most of the soil
organisms, organic matter and nutrients arestored, readily accessible to crop roots.
• Never cultivate through valleys or flow lines.Leave at least a five metre wide uncultivatedstrip down flow lines to function as a stablewaterway. Stabilise by planting a permanentgrass sward.
• Do not cultivate when the soil is wet. Workingwet soil is the quickest way to destroy soilstructure and cause severe soil compaction.
• Cultivate across the slope where practical. Ifthe slope does not exceed six percent, it ispossible to cultivate, plant and harvest acrossthe slope on a grade of two to three percent.This greatly reduces or eliminates the need forsurface water control earthworks such astemporary grade furrows.
Don’t cultivate pasture to a fine tilth and don’t itleave fallow for long periods. Spray pasture offseveral weeks in advance. The root material andmost of the plant matter will rot down on or nearthe surface. Best pre-planting cultivation practiceis a maximum of two passes with a tined orscalloped disc implement (not a rotary hoe).Growers in south east NSW have grownexcellent crops with only one pass of a ‘powerharrows’ implement (see ‘Other good soilmanagement techniques, this section).
Leave fallow for only long enough to ensurecomplete breakdown of plant material beforeplanting. This minimises the time that the tilledsoil is vulnerable to erosion.
Avoid the practice of soil fumigation wherepossible. Fumigation destroys soil structure andincreases the risk of erosion because:
- It involves rotary hoeing the soil to a fine tilth.
- The soil is left bare for several weeks after thefumigant is incorporated.
- Fumigation temporarily reduces soil biologicalactivity.
If fumigation must be done and the site is on aslope, install surface water control earthworksimmediately afterwards to protect the bare soilfrom erosion.
SEC
TIO
N 2
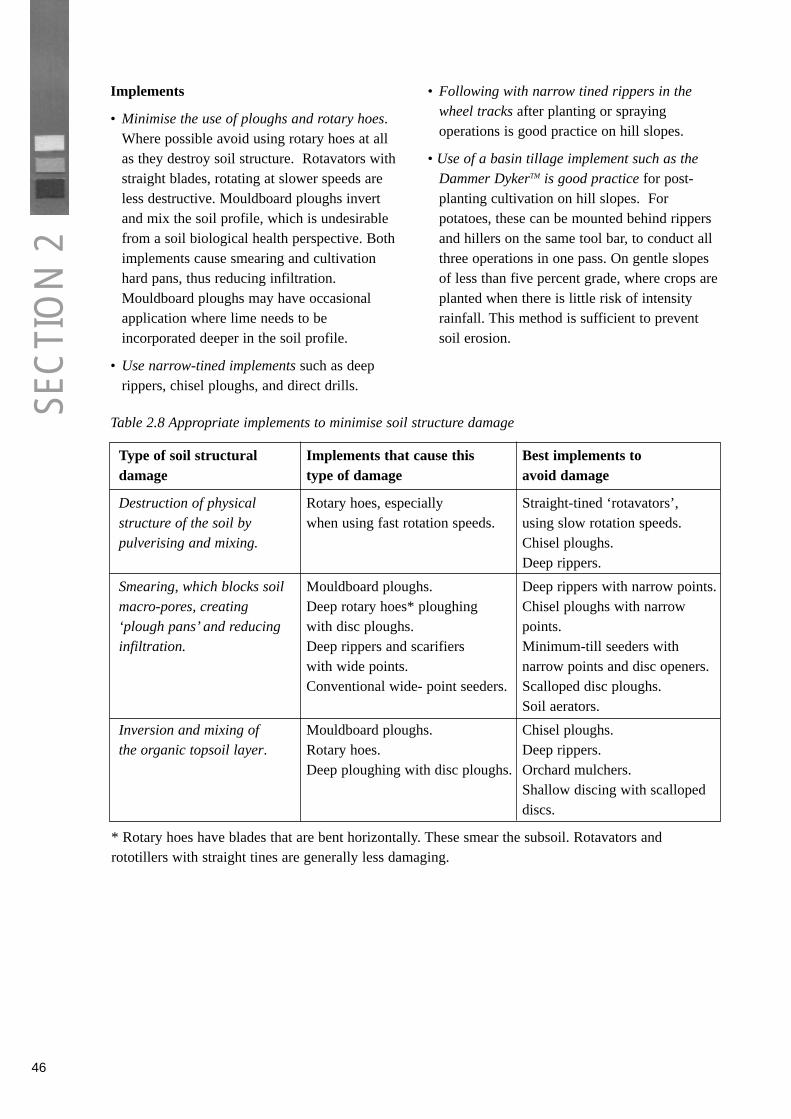
Implements
• Minimise the use of ploughs and rotary hoes.Where possible avoid using rotary hoes at allas they destroy soil structure. Rotavators withstraight blades, rotating at slower speeds areless destructive. Mouldboard ploughs invertand mix the soil profile, which is undesirablefrom a soil biological health perspective. Bothimplements cause smearing and cultivationhard pans, thus reducing infiltration.Mouldboard ploughs may have occasionalapplication where lime needs to beincorporated deeper in the soil profile.
• Use narrow-tined implements such as deeprippers, chisel ploughs, and direct drills.
• Following with narrow tined rippers in thewheel tracks after planting or sprayingoperations is good practice on hill slopes.
• Use of a basin tillage implement such as theDammer DykerTM is good practice for post-planting cultivation on hill slopes. Forpotatoes, these can be mounted behind rippersand hillers on the same tool bar, to conduct allthree operations in one pass. On gentle slopesof less than five percent grade, where crops areplanted when there is little risk of intensityrainfall. This method is sufficient to preventsoil erosion.
46
Table 2.8 Appropriate implements to minimise soil structure damage
Type of soil structural Implements that cause this Best implements todamage type of damage avoid damage
Destruction of physical Rotary hoes, especially Straight-tined ‘rotavators’,structure of the soil by when using fast rotation speeds. using slow rotation speeds.pulverising and mixing. Chisel ploughs.
Deep rippers.
Smearing, which blocks soil Mouldboard ploughs. Deep rippers with narrow points.macro-pores, creating Deep rotary hoes* ploughing Chisel ploughs with narrow ‘plough pans’ and reducing with disc ploughs. points.infiltration. Deep rippers and scarifiers Minimum-till seeders with
with wide points. narrow points and disc openers.Conventional wide- point seeders. Scalloped disc ploughs.
Soil aerators.
Inversion and mixing of Mouldboard ploughs. Chisel ploughs. the organic topsoil layer. Rotary hoes. Deep rippers.
Deep ploughing with disc ploughs. Orchard mulchers.Shallow discing with scalloped discs.
* Rotary hoes have blades that are bent horizontally. These smear the subsoil. Rotavators andrototillers with straight tines are generally less damaging.
SEC
TIO
N 2

47
Minimising the impacts of soil fumigation(Rose, 1997)
Fumigation is currently the most effective wayto control whitefringed weevil in potato crops.Metham sodium fumigant is incorporated intothe soil prior to planting. For the fumigant to beeffective the soil has to be ploughed androtavated to obtain a fine tilth and the fumigantis incorporated with a blade plough.
This treatment is costly and destructive of soilstructure. It can and should be avoided wherepossible, where monitoring determines that it isnot necessary.
Potato paddocks should be monitored forwhitefringed weevil in the summer beforeplanting by using the simple procedure describedin Section 7.2 under ‘Monitoring forwhitefringed weevil’.
If monitoring determines that soil fumigationmust be conducted, then good surface watercontrol practice is crucial. Grade furrows shouldbe installed immediately after fumigation toprotect the finely cultivated soil from erosion.They should be re-cut immediately after plantingand again after sowing of the post-harvest covercrop.
Soil treatment for control of African black beetlewithout soil fumigation
An effective method for black beetle control isto spray chlorpyrifos on the soil in front of theplanter or incorporate it using only a single passwith tines and a crumbler. These methods ofincorporation are much less destructive of soilstructure than fumigation because they do notinvolve rotary hoeing and leaving the soil bare.Also, the pesticide acts only on insects, not othersoil organisms such as fungi that may bebeneficial to soil structure. However, forchlorpyrifos to have any effect on controllingwhitefringed weevil as well as black beetlecontrol, thorough incorporation with a rotaryimplement is necessary.
Biofumigation- another way to minimise soilfumigation
Biofumigation is the sowing of plant species thatcontain natural chemicals toxic to soil borneinsect pests. These plants may be grown asinter- row ‘nurse crops’ or between rotations andincorporated into the soil. The potential of someBrassica species containing high levels ofbiofumigant chemicals called glucosinolates iscurrently being researched, but provenbiofumigation strategies are yet to beestablished.
Other good soil management techniques (Rose, 1997)
Other good soil management techniques thathave potential for use in WA vegetable andpotato growing are outlined below.
Sowing of post-harvest cover crops from thepotato harvester
A small, hydraulically driven seeder can easilybe mounted on the potato harvester. Large seedsuch as cereals, vetches and lupins is droppedvia tubes beneath the conveyor belt where it iscovered with soil while the harvester isoperating. This technique is used in the USA. Iteliminates the risk of failing to sow a cover cropand saves the cost of broadcasting or drillingseed.
Minimum tillage for brassicas
There has been interest from some growers ingrowing cauliflowers by planting directly intopasture that has been sprayed off. A specialplanter incorporating rippers, coulters and presswheels would need to be constructed to do this.Some growers are already reducing the numberof cultivations from several down to three orfour.
Permanent beds for cauliflowers and potatoes
These are used extensively on flood irrigatedflats and some sprinkler irrigated hills areas in
SEC
TIO
N 2

48
Queensland and South Australia. They havebeen tested successfully on winter waterloggeddry land cropping sites at Mount Barker, WA.The benefits are that the tractor wheels alwayspass over the same tracks and the beds areraised, thus reducing soil compaction andwaterlogging. When permanent beds were usedin conjunction with minimum tillage,improvements in soil structure weredemonstrated on some sites. A bed-shapingimplement is needed to construct the beds.
Power harrows
The power harrows was developed by theRobertson District Potato Advancement andLandcare Association in NSW, with the help of aNational Landcare grant. It is essentially athree- point-linkage deep ripper with tines fittedwith a set of side sweeps to lift and fracture thesubsoil. A gearbox driving two vertical ‘roto-tillers’ and driven by the tractor power take off isbolted to the frame. The ‘roto-tillers’ cultivate 40 cm strips to coincide with the potato hills.Minimum till trials in which the only cultivationprior to planting was one pass with the powerharrows showed yield increases of two to 34% infive of seven trial plots. Improvements in grossmargins were even greater than the yieldincreases as production costs were considerablyreduced.
Straw Mulching
A mechanical straw mulching machine is used toapply clean cereal straw to the inter-row furrowsat rates of 600 to 1000 kg/hectare. The HobsonStraw Mulching machine uses baled straw andcan be operated by one man from the tractorseat.
The machine, which is patented, consists of aseries of bale chambers attached to a head framespaced to match furrow widths. Each chamber isan individual unit that has its own hydraulicmotor for operation. It applies the straw in 20 – 25 cm lengths evenly on the soil surfaceand presses it in with a flat cleated press wheel.
A straw mulching machine of a different design,constructed from a self propelled cereal cropharvester, is currently being used to apply mulchin swaths under grape vines in the south west of WA.
Trials conducted in Idaho, USA, have shown thatstraw mulching increased potato yields by sevento 40%, reduced soil loss by up to 95%, nitrogenloss by at least 46% and phosphate loss by atleast 65%.
The machine has not yet been demonstrated inWA, but trials have been conducted in theManjimup area by spreading straw manuallybetween potato ridges. Visual observationsconfirmed decreased run-off from the treatedarea.
Cropping rotations
❑ Adopt cropping rotations that restorestructure and organic matter to the soil
For potatoes and cauliflowers, the recommendedrotation time between crops is three to fouryears. The usual reason for this is to control soilborne diseases but the practice also has a crucialrole in restoring soil structure and increasing soilorganic matter.
Pasture grasses such as ryegrass and somecereals such as oats have dense, fibrous rootsystems which exude substances that ‘glue’ soiltogether, thus restoring the structure, organiccontent and biological activity.
❑ Aim to have at least two years in ryegrass/legume pasture or cereal crops grownunder minimum or no till between thehorticultural crop phases.
Increasing soil organic matter(Rose, 1997)
Adding organic matter to the soil improves thewater holding, structural, pH and nutrientavailability qualities of the soil.
❑ Maintain or increase soil organic matterby:
SEC
TIO
N 2

49
Green mulching
Growing a ‘break crop’ and mulching it inbefore growing the vegetable crop is known asgreen mulching. This practice has two-foldbenefits in that it improves the soil biologicalhealth and is an effective pre-plant weed control.The medium term gains are reduced cost ofweed control and increased vegetable yields dueto enhanced soil biological activity. Theseusually outweigh the costs of sowing the cropand foregoing grazing production for a fewmonths.
To mulch a ‘break crop’, slash it a few timesbefore it becomes too rank and fibrous, leavingthe plant matter to break down on the surface.Finally, kill it by spraying with a selectiveherbicide.
It is not necessary to deeply plough in cropresidues as this destroys the soil’s essentialsurface organic layer. If there is still fibrousstubble, it can then be chopped up and partlyincorporated in the top few centimetres of soil,leaving the deeper roots intact. Suitableimplements to achieve this are orchard mulchersor scalloped offset disc ploughs.
Leave it for long enough for the stubble androots to break down before planting, to reducethe risk of Rhizoctonia disease (Section 7.1 ‘Pesthabitats and hosts’). Hill slopes may need to beprotected by soil conservation earthworks duringthis period (Section 2.1 ‘Erosion prevention bysurface water control’).
Applying compost
Compost is beneficial to soil health in the sameway as green manures. Compost application maybe more economic than green mulching forintensive, frequent cropping, where the propertyis close to a compost manufacturer, as transportis a major cost.
There are many grades of compost, ranging fromgreen waste compost, which is relatively low innutrients, to spent mushroom compost andcomposted poultry manure, which are muchhigher in nutrients. The nutrient analysis of thecompost should be taken into account whencalculating fertiliser application rates.
All composts increase the soil biologicalactivity, buffer soil pH, improve nutrientavailability, improve soil structure and increasethe capacity of the water to hold and retainwater. Economic yield increases have beenobtained in trials for a range of vegetable cropswith compost applied to the surface beforeplanting at rates as low as 25 tonnes per hectare(Paulin, 1999).
Compost for sustainable horticulturalproduction systems(Paulin, 1999)
What is compost?
Compost is a biologically active material oflargely organic origin. It can have widelydiffering texture and is a typically dark browncolour with an earthy smell.
Compost is the result of a manageddecomposition process in which a succession ofaerobic micro-organisms break down organicmatter into a range of complex organicsubstances, loosely referred to as humus. Someof these substances are very stable, with a half-life in the soil of greater than 100 years, whilstothers have are broken down much morequickly.
The presence, effectiveness and build-up of soilorganic matter and, more importantly, effectiveorganic cycles, is a function of climate, soil typeand management practices. These factors willultimately determine how much compost isneeded to increase soil organic matter.
Potential benefits
The benefits of using compost will largely resultfrom its effects on soil organic matter levels andincreased organic matter cycling.
Using compost can be expected to reduceproduction costs and improve crop performanceby:
• Improved crop yields, quality and storage life.
• More efficient and reduced use of fertilisersand pesticides, including soil fumigants.
SEC
TIO
N 2

50
• Increased ability of the crop to resist pests anddiseases.
Using compost can also improve soil quality andhealth by:
• Improved soil organic matter levels and organic cycles.
• Increased plant available water.
• Increased nutrient availability and nutrientholding capacity.
• Improved soil structure.
• Reduced levels of soil borne plant pathogensand pests.
It is important to accept that these changes willaccumulate with its continued use and that thefull benefits, especially in terms of disease andpest control may take several years to develop.
Compost production(See Appendix 2.3)
Compost quality
Compost quality depends on maturity, type,nutrient content and levels of contaminants.Contaminants include pests, pathogens, seeds ofweed species, inert contaminants such as plasticin all its forms, metal and glass and heavymetals. If industrial waste or sewage sludge hasbeen used to make the compost, heavy metalcontaminants can include cadmium, arsenic andlead, which are toxic, and plant nutrients such ascopper and zinc, that with repeated soilapplication could build to plant toxic levels.
The objective of compost manufacture is toeither eliminate these risks or keep them toacceptable levels. Compost manufacturerstherefore need to have demonstrable certifiedquality control processes in place.
Compost maturity
As a guide, with immature compost,temperatures in a moist undisturbed compost pilewill be hot, relative to fully matured compostwhere temperatures will have stabilised around20-25˚C.
Feedstock and composting time largelydetermine compost maturity. The level ofmaturity is characterised by a succession ofmicro-organisms. For example, relativelyimmature composts are characterised by highlevels of Actinomycete fungii and thesecomposts are potentially more effective atdisease suppression.
Immature composts are those that have notcompleted the thermophyllic phase and are bestsuited for use as mulches. They still have arelatively high nitrogen requirement and arelikely to compete with crops for nitrogen,especially when incorporated in the soil. This istermed nitrogen draw-down, and the potentialfor it to occur can be determined by conductinga nitrogen draw-down index or NDI test in alaboratory. Note, that under the AustralianStandard AS4454 for compost, these materialscan be called compost, providing they haveundergone adequate periods of temperaturesabove 50˚C to control pests, pathogens andweeds.
For horticultural production the mainconsideration is whether the material is bestsuited to soil incorporation prior to cropestablishment or application as mulch after thecrop has been established. Current experienceindicates that immature composts are best usedas soil mulches and generally to established treeor vine crops.
Compost type
Compost from non-woody organic materialssuch as crop waste, straw and leafy materials hasa fine granular appearance and takes the leastamount of time to make. This is because thecarbon in these materials is easily degraded.With the addition of clay in relatively smallamounts, these composts develop a good crumbstructure that is visibly soil like in appearance.
Composts made from lignified woody materialsdisplays different characteristics and, unlesscoarse woody material is screened out, is bestsuited to use as surface mulches. (mainlybecause the carbon from these sources isdifficult to degrade). These materials are
SEC
TIO
N 2

51
therefore effectively immature composts becausethey contain, depending on their age andcoarseness, undecomposed woody material. Soilincorporation processes generally break up thiswoody material, increasing the amount ofexposed, undecomposed woody material. Thisresults in increasing microbial activity anddecomposition which competes for availablenitrogen and potentially reduces crop growth.
Composted mulches can still influence andenhance soil microbial activity and hence willgenerally out perform non-composted mulches.They are likely to become more available aslocal governments increasingly divert ‘greenwaste’ from landfill.
Nutrient content and characteristics
The nature and ratios of the materials orfeedstocks used to make compost will influencethe nutrient content of the compost produced.
Being derived largely from plant materials(typically 80% of the initial mix), compostnutrient contents and their ratios will be similarto those in most crops. Depending on the rateused, compost therefore has the potential tosupply mulch of a crop’s nutrient needs.
Phosphorus and potassium are typically in theorder of 1.5% to 3.5% and 1.0% to 2.5%respectively.
The critical factor is nitrogen. Nitrogen levelsrarely exceed 1.5% (dry weight) in well-madereasonably mature composts. In maturecompost, nitrogen is almost totally organic and istherefore largely contained within micro-organisms. Their constant recycling means aslow release of nitrogen. However in mosthorticultural cropping situations, this nitrogensource alone is unlikely to be sufficient for croprequirements.
Compost reduces leaching of nitrogen
One of compost’s advantages is its ability tosignificantly reduce leaching, particularly ofnitrate nitrogen. Compost retains nitrogen andreleases it slowly. Overseas experience suggeststhat in initial years of compost application, 30%to 50% of the total nitrogen will be available to a
crop within six months. However, this will varywith climate and soil type as well as composttype.
Strategies for using compost
Full benefits will only be obtained from regular,repeated compost applications. As the impact onsoil organic matter cycles and microbialpopulations stabilises, significant reductions infertiliser, irrigation and pesticide applicationswill be possible.
For vegetable production on sandy light soils,trial work suggests that rates in the order of 20tonnes/ha are sufficient to achieve significantresults. In the longer term, it is feasible thatlower rates of 10-15 tonnes/year will besufficient to maintain these benefits. However itmust be stressed that these rates will bedetermined by our ability to adopt managementpractices that encourage the maintenance ofeffective soil organic cycles. These include thereduced cultivation, greater use of cover or breakcrops and selection of pesticides and fertilisersthat are less disruptive to beneficial microbialpopulations.
Spreading of compost
Ideally, compost is applied using specialisedcompost spreading machines, which generallyutilise conveyer belt feed and rotary spreadingmechanisms. Large capacity Multi-spreadersTM orsimilar type fertiliser spreading units will do thejob, but are ideal due to slower spreading rateand greater susceptibility to blockage.
The ease of spreading of different grades ofcompost varies with the composition (feed stockmaterials used) and moisture content. For easeof spreading, the compost needs to be moist butfriable and crumbly in texture. Spreading isdifficult if the product is wet and soggy.
Cost considerations for using compost
Estimated percentage savings in input costsneeded to cover a range of compost prices andrates are presented in Table 2.9. These figuresare based on typical fertiliser, pesticide andirrigation costs associated with major vegetable
SEC
TIO
N 2

Percentage input cost savings required to cover cost, at compost price per tonne ($)
Rate of compost (tonnes/ha) $20/tonne $30/tonne $40/tonne $50/tonne
12 8.1% 12.2% 16.2% 20.3%
25 16.9% 25.3% 33.8% 42.2%
50 33.8% 50.7% 67.6% 84.4%
52
crops grown on the sandy soils of the SwanCoastal Plain (Vegetable Budgeting Handbookfor the Swan Coastal Plain, Peter Gartrell,(1998) Agriculture Western AustraliaMiscellaneous publication 13/98). Theseestimates indicate that as little as a one thirdreduction in the cost of these inputs will coverthe cost of a 25 t/ha compost application.
This break-even figure does not include anyconsideration of increases to marketable yield
that have already been demonstrated for severalcrops. The rates of compost used in Table 2.9have achieved yield increases in practice. Thecurrent costs of compost typically vary around$40 to $50 per tonne, depending on source andtransport requirements. In future, factors such aslandfill reduction targets, introduction of landfilllevies and restrictions on the use of raw poultrymanure are likely to result in some downwardpressure on compost prices.
Some compost suppliers in the south west
Malatesta Green Organics, Bunbury.08 9725 4144
Custom Composts, Mandurah. 08 9581 9582
Cost is around $30 per tonne depending ongrade. Transport (back-loads) can be arrangedthrough local hauliers. E.g. Kamman BulkHaulage will deliver to orchards in Manjimupfor around $18 per tonne for road train back-loads.
Claying of light sands(Carter and Hetherington, 1999)
Light sands, especially white, grey and blacksands often have attributes that causeenvironmental and production problems. Theyare often water repellent, which causes poorinfiltration, uneven wetting and susceptibility toerosion at the break of season.
They also have a low Phosphorus RetentionIndex and a low reactive iron content that
translates to a low holding capacity for nutrients,rendering the soil infertile and prone to nutrientexport when fertilisers are applied.
The hydrophobic compounds (waxes, alkanes,long chained fatty acids) that are left behind inthe breakdown of organic matter are a majorcause of water repellence in non-wetting soils.Most of the water-repellent soils have claycontent of less than one percent. Sands that havethree to four percent clay content do not appearto have these water-repellent characteristics.
Water repellence generally exists only in the top100mm cultivated layer. The soil below thisdepth wets up easily because of the lack oforganic matter and hence the lack ofhydrophobic compounds.
Research carried out by Agriculture WesternAustralia on cereal cropping/ pasture landevaluated the application of clay subsoil toincrease the ability of these soils to accept water.An amount of 100 t/ha of subsoil with a 30%clay content, mixed into the top 100 mmincreases the clay content of the cultivated layer
SEC
TIO
N 2
Table 2.9 Percentage input cost savings in fertiliser, pesticide and irrigation,required for economic compost application

53
SEC
TIO
N 2
to three to four percent. This ameliorant iscontinuing to produce positive results even 8years after the first application.
Benefits of clay application
• Increased production. Under claying, lupinyield increased by 700 kg/ ha whilst pastureseed production increased by 100%.
• Increased moisture infiltration. Infiltrationrates increased by three times, with theaddition of the clay, and the water repellencyrating of the soil was reduced from highseverity to zero in the second year afterapplication.
• Even wetting of the soil. The soil wets upevenly and even light rains are able topenetrate over the whole surface. The evenwetting of the soil allows the majority of theweed seeds to germinate at the same time,allowing better herbicide activity and weedkill.
• Wind erosion control. The sand develops acrust after rainfall and enough strength toprevents wind erosion when undisturbed.
• Nutrient retention. Retention of phosphorusand potassium which is made available to theplants.
• Increased microbial activity. Longer period ofsoil wetness encourages longer soil microbialactivity.
What are suitable clay subsoils?
A clay content of 30% or more is the mostimportant attribute of subsoils for spreading.Doing a texture or ribboning test can assess this(Section 2.2 ‘Procedure for 10 soil tests’).Knowing the actual clay content can assist youin decreasing the amount of subsoil that needs tobe spread and also the cost of spreading.Changes in the subsoil as the pit is excavatedshould be checked to make sure you are notspreading sub standard material.
The other important thing in the subsoil is itsability to slake (Section 2.2). If the subsoil doesnot slake it is not suitable.
Subsoils that have high clay content (>50%),slake quickly and are highly dispersive (Section2.2) are even more suitable and could be spreadat lower rates.
The pH of the subsoil should also be taken intoaccount in determining the rate of subsoil to bespread. Most subsoils in Western Australia areslightly less acid than the topsoils and will notaffect the pH of the topsoil markedly.
The amount of subsoil that is applied willdetermine the clay content in the top 100 mm of topsoil. If spreading larger quantities than 100 t/ha, incorporation to a greater depth will benecessary to avoid a hard setting problem in thetopsoil.
Location of suitable subsoil
The greatest cost in clay spreading is thetransport cost. The optimum cartage distancewould be 300 metres or less. If suitable clay canbe found in the centre of the paddock then that isthe cheapest option, but this is not alwayspossible. Other options include increasing thecatchment on an existing dam, building a newdam and using the excavated subsoil or digginga silage pit.
The first step is to auger in the desired locationsfor suitable clay. Most clay/spreading machinesrequire 50 metres of pit length to fill the bowl inone pass. Examine the area to make sure there isdepth of subsoil and no sand seams or largerocks.
Spreading the subsoil.
It is best to aim for an even cover of clay/subsoilas this will require only one incorporation andcan then be left until seeding time. This ishowever not possible with all machines. TheClaymateTM, RoadScraperTM, Multi SpreaderTM,LehmannTM and LandplanerTM have all been usedto spread clay and can all do the job. Theamount of ripping that is done in the pit prior toloading the machine determines the quality ofthe spreading job. The finer and drier thematerial that goes into the machine the better itwill come out.

54
For vegetable and potato cropping, therecommended application rate is 200 tonnes perhectare of subsoil if the clay content is 30%(Heap, 1998). Proportionally lower rates can beapplied if the clay content is higher.
The spreading rate should be verified on theground with the use of catching trays or smalltarp. If gaps are left between the clayed strips,that distance should be no more than 1.5 metres.This is about the maximum distance that can becomfortably smudged in two runs.
Smudging is performed by dragging a framemade from two railway irons across the trails ofsubsoil. The frame is pulled at speed diagonallyacross the trails twice, in opposite directions at45 degrees to the strips to give an even spread.This operation will also incorporate the clay.
Incorporation
The subsoil spread on the surface should beincorporated soon after it is applied. If it is notand it rains, it will slake and form a solid mass,which will have to dry out before you cansmudge and/or incorporate. This mass of subsoilwill also shed water and restrict plant growth.
Incorporation of 200 t/ha for vegetables orpotatoes should be to a depth of about 100 to150 mm initially, so that about a quarter of thematerial is still on the surface. The material onthe surface gets rained on and slakes but is not ina high enough concentration to seal the surfaceand shed water. Being in contact with the spreadclay that is on the surface will also wet thematerial just below the surface.
The incorporation can be achieved with tines oroffset discs. Cropping the paddock for two yearshelps the incorporation.
Site specific soil managementstrategies (Refer to Section 2.2 of the Code of Practice)
2.3 Manage soil and drainageto minimise export ofnutrients and chemicals
Export of nutrients and chemicals(Refer to Section 2.3 of the Code of Practice)
Erosion(Refer to Section 2.3 of the Code of Practice)
Leaching(Refer to Section 2.3 of the Code of Practice)
Waterlogged sites(Rose, 2000; Bennett et al, 1999)
Winter waterlogging is a common problem in thehigh rainfall SW, as the heavy rainfall during theperiod May-September can saturate the soilprofile for more than a week at a time on somesites. Sites that remain waterlogged in summerare generally not suitable for horticulture in highrainfall areas because:
• Most horticultural crops cannot grow inprolonged waterlogged conditions.
• Waterlogged soils are often unstable and likelyto erode when cultivated
In situations where waterlogging is caused byseepage discharge which is fed continually bygroundwater under pressure, the area is bestexcluded from horticulture paddocks. It shouldbe fenced and vegetated with native swampspecies. In some other situations waterloggingcan be treated effectively but it is essential thatcorrect drainage practice is conducted.
Correct drainage practice
❑ Plan carefully before proceeding withdrainage:
• A notification of intent (NOI)* may berequired if the drainage will affectdownstream users. The local catchmentgroup and downstream neighbours must beconsulted to ensure that planned drainage
SEC
TIO
N 2
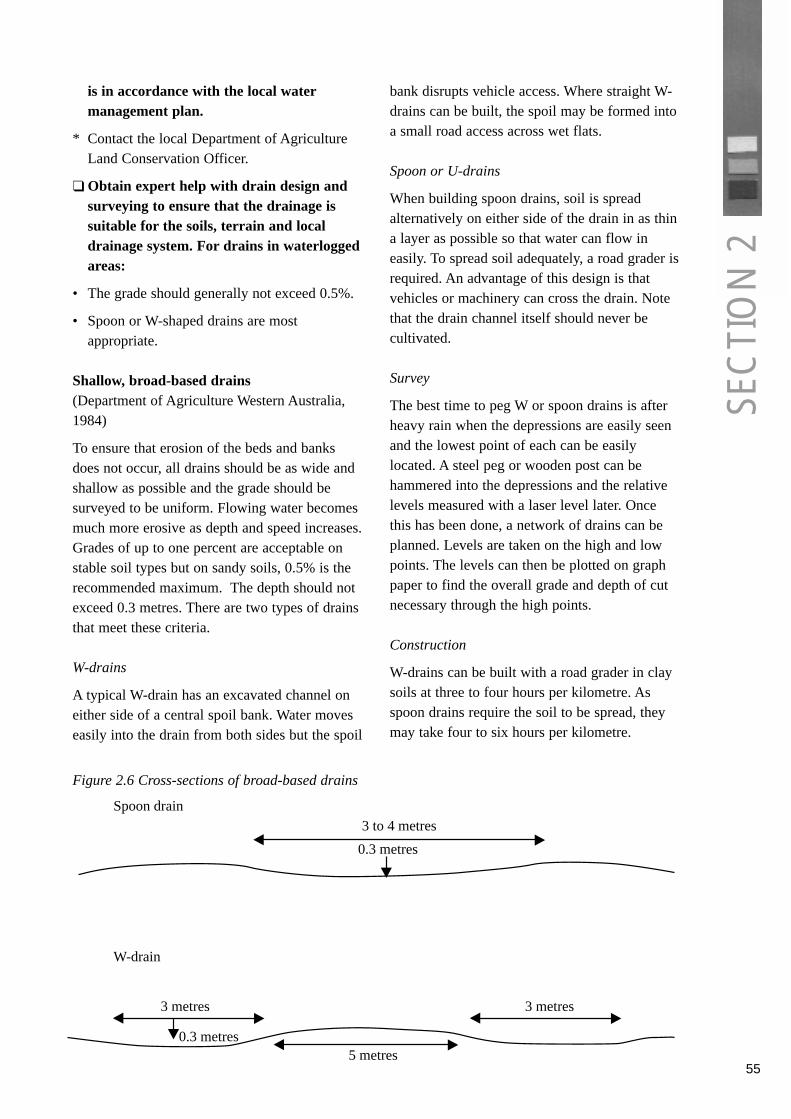
55
3 to 4 metres
0.3 metres
0.3 metres
3 metres 3 metres
5 metres
W-drain
Spoon drain
Figure 2.6 Cross-sections of broad-based drains
SEC
TIO
N 2
is in accordance with the local watermanagement plan.
* Contact the local Department of AgricultureLand Conservation Officer.
❑ Obtain expert help with drain design andsurveying to ensure that the drainage issuitable for the soils, terrain and localdrainage system. For drains in waterloggedareas:
• The grade should generally not exceed 0.5%.
• Spoon or W-shaped drains are mostappropriate.
Shallow, broad-based drains(Department of Agriculture Western Australia,1984)
To ensure that erosion of the beds and banksdoes not occur, all drains should be as wide andshallow as possible and the grade should besurveyed to be uniform. Flowing water becomesmuch more erosive as depth and speed increases.Grades of up to one percent are acceptable onstable soil types but on sandy soils, 0.5% is therecommended maximum. The depth should notexceed 0.3 metres. There are two types of drainsthat meet these criteria.
W-drains
A typical W-drain has an excavated channel oneither side of a central spoil bank. Water moveseasily into the drain from both sides but the spoil
bank disrupts vehicle access. Where straight W-drains can be built, the spoil may be formed intoa small road access across wet flats.
Spoon or U-drains
When building spoon drains, soil is spreadalternatively on either side of the drain in as thina layer as possible so that water can flow ineasily. To spread soil adequately, a road grader isrequired. An advantage of this design is thatvehicles or machinery can cross the drain. Notethat the drain channel itself should never becultivated.
Survey
The best time to peg W or spoon drains is afterheavy rain when the depressions are easily seenand the lowest point of each can be easilylocated. A steel peg or wooden post can behammered into the depressions and the relativelevels measured with a laser level later. Oncethis has been done, a network of drains can beplanned. Levels are taken on the high and lowpoints. The levels can then be plotted on graphpaper to find the overall grade and depth of cutnecessary through the high points.
Construction
W-drains can be built with a road grader in claysoils at three to four hours per kilometre. Asspoon drains require the soil to be spread, theymay take four to six hours per kilometre.

56
Maintenance
Re-grading will be required if the channels siltup on flat grades. Silting is an indication thaterosion is occurring due to poor drain design orpoor soil management, which should berectified.
Keep the channels grassed, particularly wherethe grade exceeds 0.5 %.
Major drains should be fenced off and vegetationestablished along the banks (Refer to Section 5.3for details).
Interceptor banks
❑ Graded interceptor banks are a way ofreducing waterlogging on slopes withduplex soils.
A grader is the best machine for constructingthese, in the same way as grade diversion banks.The difference is that they may be deeper (up to0.8 metre), to intersect the impermeable claylayer. They are designed to run water and are agood means of water harvesting.
Sub-surface drainage
Sub-surface drainage, by perforated drain coilpipe, mole drainage or tyre drains, is sometimesused to combat waterlogging and soil salinity(Section 2.4). However, it is not recommendedfor wet grey sands as these soils have a lowcapacity to retain nutrients and chemicals.Phosphorus and nitrogen may be leached fromthe soil into the drainage outflow where it mayenter wetlands or waterways.
2.4 Manage soil acidity, sodicity,salinity and other soilchemical problems
Soil acidity
Horticultural cropping acidifies the soil at afaster rate than other agricultural activitiesbecause it removes more plant products andrequires more fertiliser. Plant material isgenerally alkaline. When it is removed the soilbecomes more acid, especially in the root zone
at five to 20 cm depth. Significant yieldreductions will occur for nearly all crops andpastures when the pH (in CaCl2) falls below 4.5.
Managing soil acidity is an important activity forall horticultural growers. It is most crucial inacid sandy soils and soil types where acidityincreases at depth.
❑ Include pH and lime requirements in thesoil test and nutrient management strategybefore each vegetable crop.
Soil acidity, expressed as soil pH, is animportant component of the soil test. Get expertrecommendations on the type of lime productand the rate at which lime should be applied toyour soil. Application rates will depend on thesoil pH, soil type and its pH buffering capacity.Less lime is required to raise the pH of sandysoils by one unit than would be required to havethe same effect on heavier soils, which have ahigh buffering capacity due to high clay and/ororganic carbon content.
❑ Regular and substantial lime applicationswill be necessary to maintain productivityof sandy soils.
Acidic, grey sands, such as those on the ScottCoastal Plain, need applications of lime to adjustsoil pH, measured in calcium chloride, tobetween 5.0 and 5.5. Applications of limeshould be applied at the break of season(May/June) prior to planting to maximise theopportunity for it to impact on the soils pH(Paulin, 1999).
Lime increases soil pH and therefore plays a keyrole in our farming systems. Lime has the addedbenefits of:
• Increasing rhizobium survival and nodulationof legumes, which generally survive poorly inlow pH soils.
• Increasing plant availability of nitrogen,phosphorus, and molybdenum.
• Decreasing available aluminium levels.
• Lime can also have the adverse affect ofincreasing the incidence of take-all diseasesusceptible areas, and decreasing plantavailability of copper, manganese, and zinc.
SEC
TIO
N 2

57
SEC
TIO
N 2
Liming(Leonard, 1995)
How to start liming – soil monitoring
Soil monitoring is an essential part of a limemanagement program and allows you to considera lime rate and how often you should apply it.
The soil should be tested for pH in the topsoil(0-10 cm) and in the subsurface (10-20 cm). Ifyou have a deep sandy soil you should also testfor pH at the 20-30 cm depth.
Soils should be monitored every two to threeyears to track soil pH and lime movement.
Initial soil pH
As soil acidity increases (the lower the pH),more lime is needed to ameliorate acidity.
If soil pH is lower in the sub-surface soilcompared to the topsoil, a liming program mustcommence immediately. It can take five years ormore before you see any pH increases in thesub-surface after a topsoil application.
Crops
Different crop species have different tolerancesto acidity. Plant growth is affected at a certainsoil pH, which is known as the critical pH.Below the critical pH plant growth is severelyretarded. When to commence liming will dependon the critical pH level of the most acid sensitivespecies you have in your rotation. Lime shouldbe applied when the soil reaches a pH near butabove the critical pH for the crops to be grown.
Caution for potato growers(McKay, 2002; Department of Agriculture NSW,1983).
Common scab disease of potatoes (Streptomycesscabies) is favoured by neutral to alkaline soilconditions. Raising soil pH to near 7 or aboveby the application of lime or wood ash willincrease the risk of scab occurrence.
If liming is required, the following methods,combined with soil pH testing prior to croppingto ensure that pH is not too high, will minimiserisk of scab occurrence:
- Apply low rates (<2tonnes per hectare) afterthe potato crop before the pasture phase, toallow adequate time for it to disperse in thesoil.
- On acid sands that have very low pH, wherehigher rates of lime are required, incorporatethe lime into the top 20 cm of soil. Wherepossible allow a year or more for it to dispersein the soil before cropping.
Buffering capacity
The pH buffering capacity of a soil is its abilityto resist pH changes. The higher the organiccarbon and/or clay in the soil, the greater itsbuffering capacity and its ability to resist pHchange. More lime is needed to increase soil pHin a soil with a high buffering capacity.
Table 2.10 Estimated pH increases with theaddition of 1 t/ha of 100% NV product to soiltypes with a high, medium and low leachingintensity
Leaching factor of soil type Increase in pH
High (sand) 0.5 – 0.7
Medium (loam) 0.3 – 0.5
Low (clay) 0.2 – 0.3
Incorporation
Lime has to be physically in contact with moistacid soil in order to neutralise acidity.
Lime dissolves slowly in the soil, therefore,incorporation in the top 10 cm of soil (or deeperif possible) is best to increase the rate of reactionand leaching of lime to a greater depth.
Incorporating lime will increase soil pH in the 0-10 cm soil depth within one to three years.
If lime is not incorporated it will take longer toincrease soil pH.
Rainfall
Newly applied lime starts to react with thehydrogen ions only after the soil becomes moist. Higher rainfall means greater leaching and fasterlime reaction.

58
Lime quality
Agricultural lime comes from either naturallyoccurring limestone or fine lime-sand. These arecomposed mostly of calcium carbonate withsilica and/or magnesium carbonate. Deposits oflime-sand occur mainly along the south westcoast, while deposits of limestone occur south ofPerth. Lime sources are also found in the form ofdolomite, which is a lake source, and inindustrial by-products.
The quality, and therefore the effectiveness, ofdifferent lime products varies. Two measures oflime quality are neutralising value and fineness.
Neutralising value (NV)
The capacity of a liming material to correct soilacidity is expressed as neutralising value (NV).The higher the NV, the greater the ability of theproduct to neutralise the acidity. Pure lime orcalcium carbonate is taken as the standard withNV of 100.
The neutralising values of all other sources oflime are graded relative to pure calciumcarbonate. Therefore, a source of lime with aneutralising value of 80 means it is 80 per centas effective as pure calcium carbonate inneutralising soil acidity, that is, it is 20 per cent
less effective than pure calcium carbonate. Alime source with a neutralising value of 150 is50 per cent more effective than pure calciumcarbonate.
Liming products like pure hydrated or slakedlime and pure burnt or quick lime have NV of130 and 170 respectively.
Fineness
The finer the lime, the more quickly it will reactto neutralise acid in the soil. A lime with fineparticles has a greater surface exposed to theacid and more particles distributed through thesoil than an equal weight of coarser material.The accepted measure of fineness in WesternAustralia is the percentage of particles that willpass through a 0.6 mm sieve.
In Western Australia all commercial limingproducts must be registered under the FertiliserAct as one of two grades (see Table 2.11).Neutralising value will depend on thecomposition and particle size of the product. Asthe costs of cartage and spreading generallycomprise more than 60% of liming costs, it isimportant to factor in neutralising value whencomparing the cost of using different limeproducts.
Grade of lime Neutralising value (NV) Material which passes a 0.6 mm sieve
First grade not less than 75% at least 80%
Second grade not less than 50% at least 60%
Table 2.11 Grade and neutralising value of lime
To compare the cost of lime for your situation,use the following calculation:
Cost of product ($/t) = cost of lime at the pit +freight + spreading.
Pure lime equivalent ($/t) = cost of productmultiplied by 100 divided by neutralising value(NV).
Example
Lime A
Cost of lime at pit $9/t; freight $0.10/km (200km); spreading $10/t; NV95.
Cost of product ($/t) = $9 + $20 + $10 = $39
Cost of pure lime equivalent ($/t) =$39multiplied by 100 divided by 95 = $41
SEC
TIO
N 2

59
SEC
TIO
N 2
Lime B
Cost of lime at pit $9/t; freight $0.10/km (180km); spreading $10/t; NV80.
Cost of product ($/t) = $9 + $18 + $10 = $37
Cost of pure lime equivalent ($/t) = $37multiplied by 100 divided by 80 = $46
This example shows that although Lime B’s costof product is cheaper, its pure lime equivalentcost is more expensive. Lime A provides bettervalue for money spent to neutralise soil acidity.
Applying good quality lime of neutralising value>95% and fineness, 90 % passing through a 0.6mm sieve, will save costs and ensure goodresults.
• If lime or other soil amendments are needed,apply well before cropping.
Lime moves into the soil slowly, so it may takeover a year for top dressing to take effect. Inhorticulture this can be overcome by applyingwell before cultivation, so that it is incorporatedinto soil during cultivation and planting. If soilpH is lower in the sub-surface, a liming programmust be adopted well before soils reach criticallevels in the topsoil, because lime will take timeto leach down.
Other factors affecting soil pH
❑ On acid soils, use non- acidifying fertilisers,such as ammonia-free nitrogen sources andgypsum, in preference to acidifyingfertilisers.
Fertilisers that contain N in the form ofammonium, such as ammonium sulphate,ammonium nitrate and di-ammonium phosphate,generate acidity in the soil. They release H+ ionswhen ammonium is converted to nitrate in thesoil. Elemental sulphur and to a lesser extenturea are other fertilisers which generate soilacidity, but to a lesser extent. The acidification ismade worse if the fertiliser is leached below theroot zone and not used by the plant. (Moore,1998).
If possible avoid using these fertilisers on acidsoils as from two to seven kg of lime would be
required to neutralise every kilogram of fertiliserapplied.
Contrary to common belief, superphosphatefertilisers do not contribute to soil acidification,though they may increase crop yield andtherefore product removal. (Moore, 1998).
Effect of organic matter on soil pH
❑ Mulch cropping and application of compostare good practices for acid sands becausethey increase the organic matter content ofthe topsoil, which buffers and increases soilpH.
Soil salinity
Identifying and managing saline land
❑ Identify land with saline subsoils and mapit in the farm plan.
The most cost effective and rapid method ofsurveying large areas for soil salinity is by usingelectromagnetic inductance instruments, eitherairborne, vehicle mounted or hand held. Forsome areas, aerial surveys have been conducted(inquire at the Department of AgricultureWestern Australia). If you suspect salinesubsoils, it is worth hiring a hand-held EM 38instrument which gives readings that can bedirectly converted to the average concentrationof salts in the top one to two metres of soil.Examples of sites with saline subsoils are somepoorly drained flats with clay at or near thesurface, such as are found on parts of the easternSwan Coastal Plain. These sites may become toosaline for horticulture and are best planted totrees or perennial pastures.
Measuring soil salinity
Most ‘measures’ of salinity use electricalconductivity to estimate salinity of soil andwater. These measures are cheap and easy to do,and can even be done (with some care) in thefield.
Another, increasingly more common, estimate iswith the EM 38 or EM 31 using electro-magnetic induction. EM readings are useful to

compare within and between similar sites, butuse EM readings with caution unless they arecalibrated against soil salinities (ECe forpreference) and other influencing factors. TheEM38 instrument is quite expensive, butrelatively easy to use in the field, and givesreadings into the root zone.
Soil samples can be measured by the ‘EC 1:5w/v’ method – one part by weight (g) air driedsoil to five parts by volume (mL) distilled water,which is agitated then allowed to settle, then thesolution is measured for electrical conductivity(EC). However, sand particles will not hold asmuch salt from the soil water as will clay.Therefore, sand will give apparently lowerreadings than clay, even though the soil water(which is the part affecting plant roots) is thesame.
ECe or ECse – electrical conductivity of theextract or saturation extract- is a more accuratetest that allows for the soil texture affect on soilsalinity. The proper measurement of the ECe is alaboratory technique and relatively expensive.
The EC1:5 reading, (if less than 350 mS/m) canbe converted to ECe by multiplying by thefollowing factors depending on soil texture(approximate only):
sand 15sandy loam 12loam 10clay loam 9light/medium clay 8heavy clay 6
Revegetating saline land
❑ Plant salt and/ or waterlogging tolerantnative vegetation on land where salinegroundwater is within two metres of thesurface. This will reduce capillary rise andreduce concentration of salts on the soilsurface.
Refer to Appendix 2.1 for a list of salt andwaterlogging tolerant species suitable forrevegetation.
Saline discharge is often caused by excessiverecharge on land above the seepage area.Planting high water use crops, such as lucerneand commercial tree species, on the rechargearea above the seepage can reduce salinedischarge. For this to be effective, over 50% ofthe catchment above the seep would need to beplanted
❑ Planting high water use vegetation inrecharge areas above saline seeps on thefarm can reduce saline discharge.
Refer to Appendix 2.2 for a list of suitable highwater use commercial tree species for plantingon recharge areas.
Note that it is desirable to plant shrub speciesunderneath the trees to increase wildlife habitatand windbreak values. (Section 2.1 under‘Windbreaks’).
Refer to Section 8.1 for technical information onsite preparation and tree planting.
Sub-surface drainage(Bennett et al, 1999)
• In some cases, such as the south westirrigation area near Harvey, sub-surfacedrainage can help prevent the salinisationof land with saline subsoils.
Caution: Sub-surface drainage may increasenutrient export from sands with lowPhosphorus Retention Index (PRI) and shouldnot be conducted in these soil types.
60
SEC
TIO
N 2

Table 2.12 Sub- surface drains (Rose, 2001) (Bennett et al, 1999)
SUB-SURFACE TYREDRAINS
Description Trench in which truck tyres are placed, fastened together to form a tube.Covered with geo-textile cloth and filled over with soil. If the drain is to be designed to run water in permeable soils, it needs to be lined with clay or plastic sheeting under the tyres.
Purpose Disposing of surface and shallow sub-surface water in situations where trafficability (of light vehicles only) is required.
Suitable for Wet or seasonally waterlogged sites, or any site where a substantial (site, soil types) trench can be dug on an even grade. Slopes up to 15%.
Gradient of earthworks Variable depending on hill slope; needs to be even to prevent blockage.
Profile Circular, 0.5-0.7 m in diameter.
Machinery required for Excavator, manual labour.construction
Estimated cost $20- 50,000 per km.
Possible problems and May be susceptible to blockage – screened inlets required.limitations Durability uncertain as the technique has not been tested over long
periods.
SUB-SURFACE DRAINAGE-SLOTTEDCOIL DRAINAGE TUBE
Description Slotted plastic agricultural drainage pipe, 80 or 100 mm in diameter.The trench is partly backfilled with 5-10mm bluemetal or similaraggregate to assist drainage and prevent blockage of the slots (thisis essential).
Purpose Draining waterlogged soils.
Suitable for Waterlogged flats, seepage areas at foot of slope.(site, soil types)
Gradient of earthworks The bottom of the trenches must be accurately surveyed to an evengrade (0.1- 1 %) using laser controlled equipment.
Profile Laid in trenches 160-200 mm wide and 800-1000 mm deep.
Machinery required for Laser controlled pipe laying machine or trench digger.construction
Estimated cost $2000/ hectare at 50 metre spacings or $7-10,000 per km.
Possible problems and The slots in the pipe can be blocked by iron precipitates in the drainage limitations water. It is wise to incorporate permanent access points at the ends of
the pipelines for inspection and flushing. Pipelines should be no more than 300 m long.
61
SEC
TIO
N 2

Mole drains
Mole drains can be constructed in loam or claybased soils using a mole plough. This isrelatively inexpensive but the site needs to becarefully surveyed and a network of slotted pipedrains constructed at 50 m intervals for the moledrains to run into. This process is expensive,costing more than $2000 per hectare.
Irrigation salinity (Refer to Section 4.3 for information about thesalinity of irrigation water and how to manageit).
All horticultural farmers need to regularlymonitor salinity and conduct managementpractices to prevent even small increases in thesalinity of soil and irrigation water.
Most standard agricultural soil analyses includesoil conductivity (EC), which is a measurementof soil salinity. Specify that EC be included in allof your soil tests. Keep records of thesemeasurements to detect any increases in soilsalinity.
Salinity risk factors
❑ Be aware of conditions and practices thatincrease the risk of irrigation salinity andavoid them.
If your horticulture paddocks have two or moreof the following characteristics, there is a risk ofsalinity developing.
• Poorly drained soils
• Subsoils with high salt content
• Saline water table less than two metres fromthe surface. At the critical depth of around 1.8m, saline water can reach the surface bycapillary rise in medium textured or clay soils,in sufficient quantities to decrease wheat yields(Moore, 1998).
• Clay or fine textured topsoils. These soils areslower to drain and have the greatest capillaryrise.
Practices to avoid
❑ Avoid irrigating with water containing highsalt concentrations and where this cannotbe avoided manage irrigation carefully(Section 4.3).
❑ Avoid cropping on or near wet areas suchas groundwater discharge areas or onpoorly drained soils.
Poorly drained or groundwater discharge areasare at high risk of becoming saline, more sowhere rainfall is less than 800 mm. These areasshould not be cleared. In most cases where suchsites have been cleared they are unlikely to besuitable for horticulture and are best fenced offand revegetated with suitable high water useperennial shrubs or trees.
Do not flood irrigate poorly drained soils.
Treat wet areas by revegetating before theybecome saline (see above).
❑ Avoid using potash as a potassium fertiliser.Use other sources such as potassiumsulphate which do not increase soil salinity.
Avoid using fertilisers containing chloride suchas potash (potassium chloride). It is cheapfertiliser that is often acceptable for fertilisingpastures and cereal crops. However it is notrecommended for horticulture because it canincrease soil salinity by increasing the soilchloride ion concentration. Up to 10 times asmuch potassium is required for somehorticultural crops than would be applied topasture. This can be likened to adding another300 kg of salt per hectare to the soil, in additionto that which comes from rainfall and irrigationwater.
Chloride is a component of salt (sodiumchloride) and is toxic to plants, particularly somevegetables, if it occurs in elevated concentrationsin the soil.
Use potassium sulphate or potassium nitrate, asthese do not contain chloride.
Although they are more expensive fertilisers,they provide additional sulphate or nitrogen. Note that these extra nutrients need to be
62
SEC
TIO
N 2
63
SEC
TIO
N 2
factored into the overall fertiliser strategy toavoid applying excess amounts.
Cadmium and other heavy metals(CRC for Soil and Land Management andCSIRO, 1999)
❑ Potato growers should always use lowcadmium phosphate fertilisers and wherethere is risk of heavy metal contamination,monitor the metal concentrations infertilisers, soil amendments, soil and tubers.
Cadmium can be taken up by plant roots. It ismost readily available in sandy or saline soils.Saline soils have high levels of chloride.Cadmium reacts with chloride to form acomplex, which is more readily taken up byplant roots. Trials have shown that cadmiumuptake in potato tubers increases significantlywhere the salinity of irrigation water exceeds1000 ppm (200 mS/m). Uptake variesconsiderably between different plant species andbetween varieties or cultivars.
Cadmium levels may increase in the soil ifsewage sludge or phosphatic fertilisers high incadmium are applied. Sewage sludge is not oftenused in horticulture and most phosphaticfertilisers now come from low cadmium rockphosphate sources.
The only way to detect cadmium levels is bytissue testing by accredited laboratories. WesternPotatoes routinely samples potatoes it sells andhas them tested for cadmium.
Cadmium risk factors for potatoes(CRC for Soil and Land Management andCSIRO, 1999; McKay, 2002)
Saline irrigation water
The maximum concentration of cadmiumallowable (MC) in potato tubers is 0.1 mgcadmium per kg fresh weight. Surveys haveshown that the probability of cadmium in potatotubers exceeding the MC is low when usingirrigation water with conductivity less than 200mS/m, but rises to over 50% as irrigation waterconductivity rises above 300mS/m.
Potato growers are advised to use water with aconductivity of less than 200 mS/m.
Growers should test the salinity of theirirrigation water regularly, especially beforecommencing irrigation and later in summer(Section 4.3 Measuring salinity).
If use of water with conductivity above 200mS/m is unavoidable:
- Select potato varieties with low or mediumsusceptibility to cadmium uptake, includingWilwash, Russet Burbank, Lemhi, Russet,Ranger Russet, Winlock, Tarago, Pontiac,Atlantic, Desiree and Delaware.
- Use sulphate of potash rather than muriate ofpotash to supply potassium.*
- Confirm possible problems by in-crop tubertesting. When water conductivity remainsconstant, testing early in the season gives agood indication of potential problems.
* Note: Make sure the crop receives sufficientzinc applied before planting.
Soil cadmium
Research also indicated that the probability ofcadmium levels reaching the MC was increasedif the soil contained more than 15 µg/kgcadmium extracted in 0.01 M calcium chloride.Soil cadmium levels are likely to be high inpaddocks with a history of heavy applications ofphosphate fertiliser containing high levels ofcadmium.
If possible, avoid growing potatoes on thesesoils.
In-crop tuber sampling
For each soil type, potato variety or managementunit, take a representative sample of at least 25healthy tubers, taken from at least 5 locations,about 50-70 days after planting. This will usuallygive a good indication of the tuber cadmiumconcentration in the mature tubers.
Brush off soil, put the tubers in a clean paperbag, keep them cool and send the sample to alaboratory within 3 days for analysis of cadmiumconcentration.
Sampling of plant tops to estimate cadmiumconcentrations is not recommended as levelsvary with different stages in growth.
Aluminium toxicity
❑ If aluminium toxicity is suspected, ask thelaboratory to include soluble aluminium inthe soil tests.
❑ The treatment for aluminium toxicity is thesame as for soil acidity, that is applyinglime to raise the soil pH.
Soil sodicity
In Australia, soils are called sodic if they havean exchangeable sodium percentage (ESP) of 6to 15 and highly sodic if their ESP is more than15. Sodium adsorption ratio (SAR) may be usedas an alternative test, particularly in saline soils.Most soil laboratories can do these tests.
Sodicity destroys soil structure and causessurface crusting.
Soil sodicity in general does not occur in thesouth west horticulture growing areas. Howeverit may be a problem on clay or alkaline soils.
Procedure to indicate whether a soil is sodic(gypsum responsive)(Department of Agriculture Western Australia,1985)
❑ Test clay or alkaline soils for sodicity.
The following procedure should be repeated withsamples from different parts of a suspected area,as soils can vary greatly even within a fewmetres.
1. Take a sample of the soil from the surface andanother from 15 cm below the surface.
2. Place about 50 mL of distilled water or freshlycollected rainwater into each of two clean jars,labelled surface and subsurface for easyidentification.
3. Wet the soil sample with the distilled wateruntil it is moist, easily manipulated but notsticky. Mould some of the soil into a sphereabout 7 mm in diameter and gently drop intothe appropriately labelled jar of water.
4. Leave the jars of water completelyundisturbed for 24 hours. If after this time amilky cloud or halo has formed around eithersoil sphere then the soil is likely to be gypsumresponsive.
❑ Sodic soils can be treated by applyinggypsum to reduce the sodicity of the surfacesoil, adding organic matter and carefullyapplying best practices to maintain andimprove soil structure.
• To determine whether gypsum will bebeneficial, test strips of gypsum can beapplied at rates of 2.5, five and seven tonnesper hectare, to compare yield with untreatedstrips. Alternatively, take at least 20 smallequal samples from the surface and 15 cmdepth from the suspected area, bulk them intwo lots and send them to a soil testinglaboratory for sodicity testing. A soilsconsultant should be able to recommend agypsum application rate given the test resultsand the crop type.
• Apply gypsum before the soil is wet.
• Only very light, shallow cultivation afterapplication is required, to stop the gypsumfrom blowing away.
• Minimum tillage practices should be adoptedafter gypsum application. This will ensure thatthe gypsum remains close to the surface andwill also help build up organic matter, whichimproves soil structure.
• The gyspum will supply more than croprequirements of sulphur, so no extra sulphurfertiliser should be required in the year ofapplication.
❑ Crops that are more tolerant of alkaline,saline soils should be grown (where soils aresodic).
64
SEC
TIO
N 2

65
SEC
TIO
N 2
References
Abbott, L., 2002. Associate Professor of SoilScience, University of Western Australia perscomm.
Agriculture WA, 1998. Managing Nutrients OnIrrigated Pastures. Farmnote no. 39/98
Agriculture Western Australia , 1993. Winderosion: Monitoring the Paddock Status.Farmnote No. 45/93.
Agriculture Western Australia. EstablishingNatural Shelter Belts In Carnarvon. InformationSheet No. 25.
Agriculture Western Australia, 1984. Building ASynthetic Windbreak. Farmnote 24/84.
Agriculture Western Australia, 1994. Wind AndBird Protection Of Table Grapes In Carnarvon.Farmnote 52/94.
Agriculture Western Australia, 1994. Limingacid soils: a break-even analysis. Bulletin 4289.
Bennett, D., George, R. and Russell, B., 1999.Mole Drainage for increased productivity in thesouth west Irrigation Area. Agriculture WABulletin 4354.
Blackwell, P. and Morrow, G, 1997. FurrowSowing On Water Repellent Soils. AgricultureWA Bulletin 4333.
Carter, D. and Hetherington, R. 1999. ClayingWater Repellent Soils. Farmnotes.
Carter, D., 1999. Preventing Wind Erosion.Agriculture Western Australia, Albany.
CRC for Soil and Land Management and CSIROLand and Water, 1999. Managing Cadmium inPotatoes for Quality Produce.
Cronin, D., 1998. The Effectiveness ofStreamlining in Improving the Water Quality ofAgricultural Drains in the Peel-HarveyCatchment, Western Australia. MurdochUniversity, Honours Thesis.
Department of Agriculture New South Wales,1983. Common scab and rhizoctonia disease ofpotatoes. Agfact H8.AB.34.
Department of Agriculture Western Australia,1990. Tree planting on Farms in High RainfallAreas. Bulletin 4147.
Department of Agriculture Western Australia,1984. Spoon and W-drains. Farmnote 120/84.
Department of Agriculture Western Australia,1985. Gypsum Improves Soil Stability. Farmnote32/85.
Department of Conservation and LandManagement Plant Propagation Centre. The TreeGrowers’ Information Kit.
Department of Natural Resources, Qld, 1995.Farm Access Tracks For Erosion Control. DNRLand Facts.
Department of Agriculture WA, 1995. The use ofBauxite Residue as a Soil Amendment in thePeel- Harvey Coastal Plain Catchment.
Evangelisti et al, 1998. A Manual for ManagingUrban Stormwater Quality in Western Australia.Water and Rivers Commission.
Farm Forestry Advisory Service, 1999.Windbreak Design And Management. Treenote 22.
Heady, G. and Guise, N., 1994. Streamlining, anEnvironmentally Sustainable Network for theSwan Coastal Plain (Peel-Harvey catchment).Agriculture WA Bulletin 4279.
Heap, M., 1998. Pers comm. AgricultureWestern Australia senior potato developmentofficer.
Lantzke, N., 1999. Windbreaks for Horticultureon the Swan Coastal Plain. Agriculture WesternAustralia.
Leonard, L., 1995a. Looking at Liming –Consider the Rate. Agriculture Western AustraliaFarmnote 78/95.
Leonard, L., 1995b. Looking at Liming –Quality. Agriculture Western Australia Farmnote77/95.
Leonnard, L, 1995c. Looking at Liming – TestStrips. Agriculture Western Australia FarmnoteNo. 79/95.
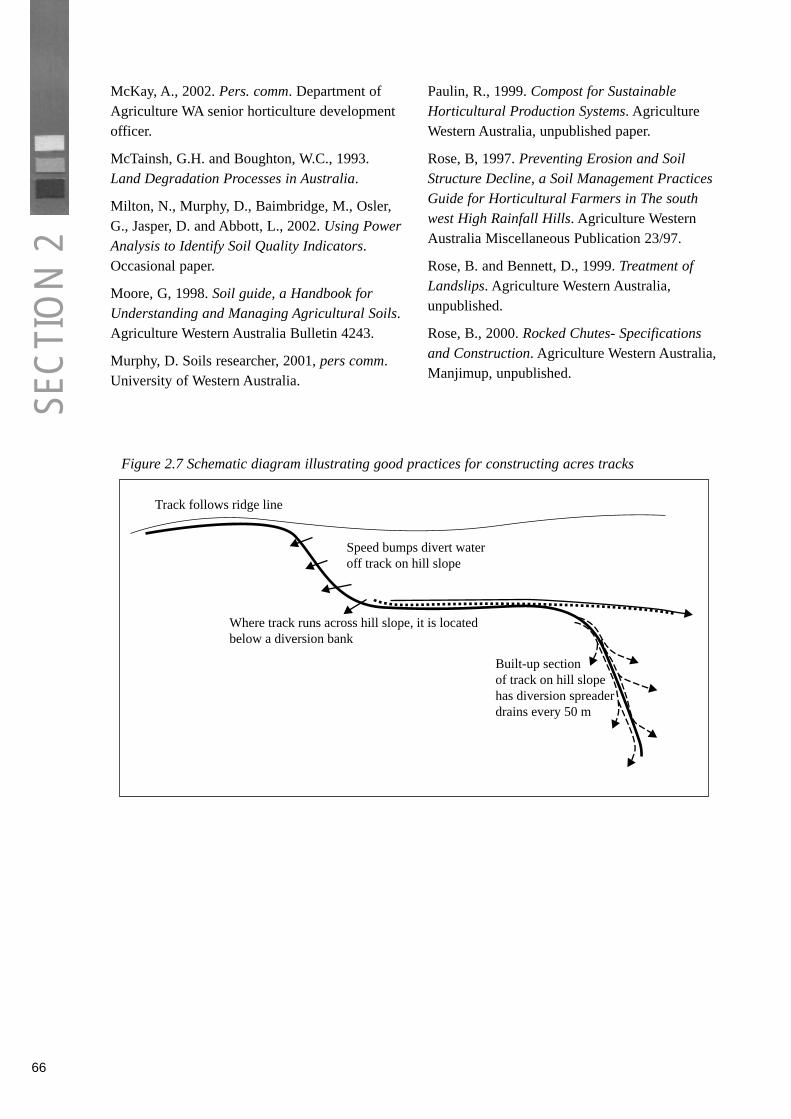
McKay, A., 2002. Pers. comm. Department ofAgriculture WA senior horticulture developmentofficer.
McTainsh, G.H. and Boughton, W.C., 1993.Land Degradation Processes in Australia.
Milton, N., Murphy, D., Baimbridge, M., Osler,G., Jasper, D. and Abbott, L., 2002. Using PowerAnalysis to Identify Soil Quality Indicators.Occasional paper.
Moore, G, 1998. Soil guide, a Handbook forUnderstanding and Managing Agricultural Soils.Agriculture Western Australia Bulletin 4243.
Murphy, D. Soils researcher, 2001, pers comm.University of Western Australia.
Paulin, R., 1999. Compost for SustainableHorticultural Production Systems. AgricultureWestern Australia, unpublished paper.
Rose, B, 1997. Preventing Erosion and SoilStructure Decline, a Soil Management PracticesGuide for Horticultural Farmers in The southwest High Rainfall Hills. Agriculture WesternAustralia Miscellaneous Publication 23/97.
Rose, B. and Bennett, D., 1999. Treatment ofLandslips. Agriculture Western Australia,unpublished.
Rose, B., 2000. Rocked Chutes- Specificationsand Construction. Agriculture Western Australia,Manjimup, unpublished.
66
SEC
TIO
N 2
Track follows ridge line
Speed bumps divert wateroff track on hill slope
Where track runs across hill slope, it is locatedbelow a diversion bank
Built-up sectionof track on hill slopehas diversion spreaderdrains every 50 m
Figure 2.7 Schematic diagram illustrating good practices for constructing acres tracks
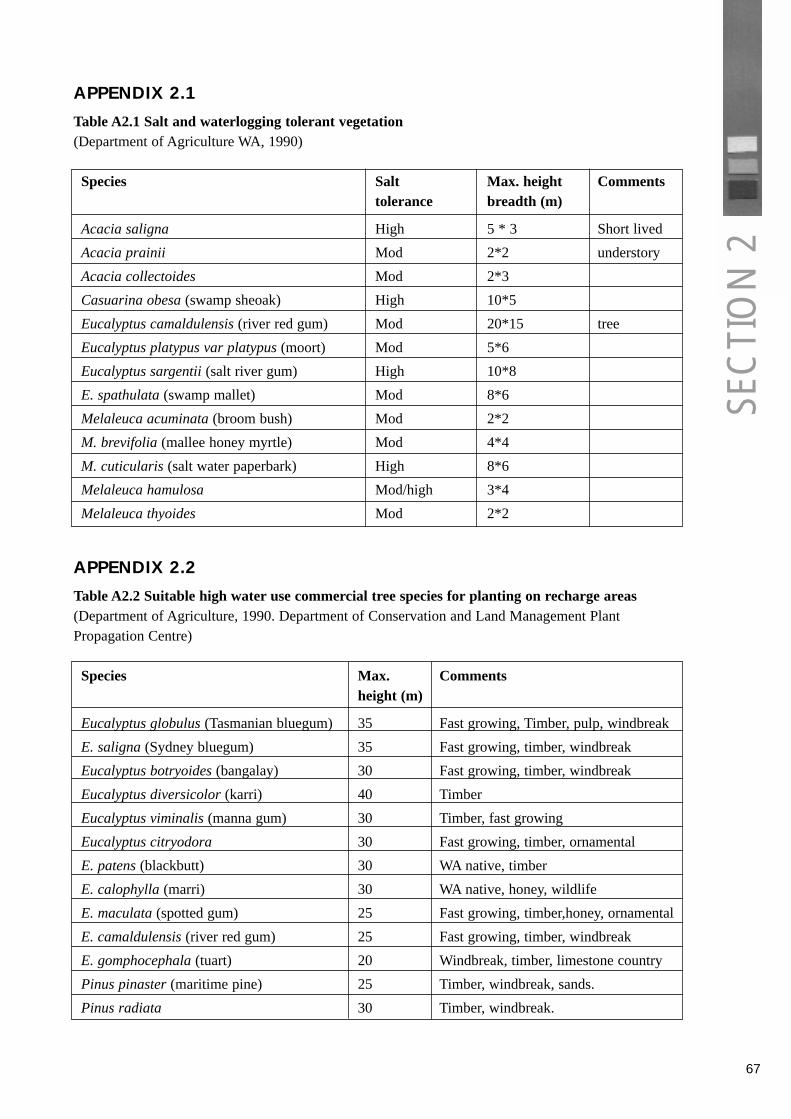
67
SEC
TIO
N 2
APPENDIX 2.1
Table A2.1 Salt and waterlogging tolerant vegetation(Department of Agriculture WA, 1990)
Species Salt Max. height Commentstolerance breadth (m)
Acacia saligna High 5 * 3 Short lived
Acacia prainii Mod 2*2 understory
Acacia collectoides Mod 2*3
Casuarina obesa (swamp sheoak) High 10*5
Eucalyptus camaldulensis (river red gum) Mod 20*15 tree
Eucalyptus platypus var platypus (moort) Mod 5*6
Eucalyptus sargentii (salt river gum) High 10*8
E. spathulata (swamp mallet) Mod 8*6
Melaleuca acuminata (broom bush) Mod 2*2
M. brevifolia (mallee honey myrtle) Mod 4*4
M. cuticularis (salt water paperbark) High 8*6
Melaleuca hamulosa Mod/high 3*4
Melaleuca thyoides Mod 2*2
APPENDIX 2.2
Table A2.2 Suitable high water use commercial tree species for planting on recharge areas(Department of Agriculture, 1990. Department of Conservation and Land Management PlantPropagation Centre)
Species Max. Commentsheight (m)
Eucalyptus globulus (Tasmanian bluegum) 35 Fast growing, Timber, pulp, windbreak
E. saligna (Sydney bluegum) 35 Fast growing, timber, windbreak
Eucalyptus botryoides (bangalay) 30 Fast growing, timber, windbreak
Eucalyptus diversicolor (karri) 40 Timber
Eucalyptus viminalis (manna gum) 30 Timber, fast growing
Eucalyptus citryodora 30 Fast growing, timber, ornamental
E. patens (blackbutt) 30 WA native, timber
E. calophylla (marri) 30 WA native, honey, wildlife
E. maculata (spotted gum) 25 Fast growing, timber,honey, ornamental
E. camaldulensis (river red gum) 25 Fast growing, timber, windbreak
E. gomphocephala (tuart) 20 Windbreak, timber, limestone country
Pinus pinaster (maritime pine) 25 Timber, windbreak, sands.
Pinus radiata 30 Timber, windbreak.

68
SEC
TIO
N 2
APPENDIX 2.3
Compost production(Paulin, 1999)
Compost is made from a wide range of organicmaterials including plant material, such as strawand other crop/garden/tree materials, along withmanure, food waste and animal processingwaste. Inorganic materials such as clay, fly ash(from power generation) and bauxite residue or‘alkaloam’ can be included. These non-organicmaterials can potentially improve compostquality and its nutritional characteristics.
However, growers should request that compostscontaining industrial residues be analysed forheavy metals and should also have their soil andproduce tested periodically.
To make compost, these raw ingredients or feedstocks are mixed to provide carbon to nitrogenratios in the range of 1:25 to 1:40. There are anumber of composting methods including openwindrow, static pile and in-vessel processes.Regardless of method, composting requiresprocess control to ensure that, within thecomposting mass:
• adequate oxygen levels are maintained
• moisture levels are maintained between 45 and55%
• temperatures are maintained below 70˚C andpreferably below 60˚C
Composting is an oxygen requiring process.This is achieved by either pumping air throughthe compost or by physical turning of thecompost at regular intervals.
Moisture levels are equally important formicrobial growth. Micro-organisms requiremoisture and their growth and activity willdecline when moisture levels drop below 40%.As moisture content increases beyond 60%, therisk of low oxygen conditions developingincreases rapidly and their activity will alsodecline.
The composting process involves two criticalstages, which are characterised by thetemperatures achieved within the compostingpile or windrow.
1st Stage – Thermophyllic (hot) phase
Temperature exceeds 50˚C and must bemaintained below 70˚C by turning and aeration.This period typically lasts up to six weeks.Under carefully managed conditions, it can bemuch shorter and, with woody materials, it canalso be much longer.
Providing temperatures above 50 – 55˚C aremaintained for four to five days, effectivesterilisation occurs during this period. Thesetemperatures kill pathogenic micro-organismswhile the beneficial microbes that areresponsible for organic matter breakdownsurvive temperatures up to 60-70˚C.
2nd Stage – Mesophyllic phase.
Temperatures are less than 50˚C and fall overtime, eventually stabilising at 20 to 25˚C. Thisperiod is usually referred to as the maturationphase and generally takes another six to eightweeks.
Nitrogen is the fuel for microbial activity, whichdegrades or breaks down the carbon rich organicmaterials such as straw, crop waste, food wasteand ‘green waste’. Nitrogen is usually derivedfrom manure. However a number of fresh,green/leafy organic wastes have adequate carbonnitrogen ratios for them to compost without theaddition of extra nitrogen.
When the carbon: nitrogen ratio is low, nitrogenlevels are high relative to carbon levels. Thisaccelerates microbial activity levels so thatmaintaining temperatures below 70˚C becomesmuch more difficult. This situation also resultsin greater nitrogen losses.
If nitrogen levels are too low, the compostingprocess will fail to achieve temperatures requiredto destroy disease organisms as well as other soilpests and weeds.

Fertiliser ManagementSE
CTI
ON
3
Use of Best Environmental ManagementPractices in fertiliser management is crucial topreventing movement of nutrients off the siteand into water bodies and groundwater.
This section outlines BEMPs for fertilisermanagement as follows:
• Soil sampling and testing
• Calculating fertiliser application rates
• Phosphorus fertiliser management
• Choosing the right fertiliser
• Correct storage and handling
• Accurate application
• Fertigation
• Minimising leaching of nitrogen andphosphorus
• Soil amendments
3.1 Optimise application ofnutrients to plant and soilrequirements
Today’s horticultural growers need to obtainexpert analyses of soil test results for each soiltype within each paddock. In this way, nutrientapplication can be matched as closely as possibleto crop requirements for optimum production onthe particular soil. The extra cost will be morethan offset by the savings in fertiliser costs.
Soil sampling and testing(WA Dept of Agriculture, 1984)
To get nutrient application right, it is necessaryto conduct a soil sampling and testing program,aiming to test each main soil type (landmanagement unit) in each paddock prior to eachvegetable cropping phase. To gain anunderstanding of their soil nutrient requirements,it is recommended that growers hire anexperienced, independent soil nutrient consultantto analyse soil test results and prescribe fertiliserapplication rates.
❑ Sample and test each soil type or landmanagement unit in each paddock or priorto each vegetable crop, or for pasture, athree yearly interval.
Correct soil sampling technique is important.For vegetable and potato cropping, two soil testsamples from the top 15 cm are required, one at0-10 cm and the other at 10-15 cm. Take about20 cores to 15 cm (using a two centimetrediameter corer) in a zigzag pattern (see BulletinNo 4328 ) from the area to be cropped. Bulk the0-10 cm cores in one plastic bag and the 10-15cm cores together in another plastic bag. Labelthe bags clearly with the soil type and coredepth.
Take separate samples for different soil typesand areas that have different paddock histories.Avoid unrepresentative areas such as sprinklerlines, fence lines and sheds that may have hadhigher rates of fertilisers through spillage, trafficetc. than the main area of the paddock.
❑ Use reputable laboratories for testing andinterpretation
Have the soils tested at an accredited laboratory,e.g. CSBP, Chemistry Centre. Avoid usinglaboratories in other States or countries as theymay use different chemical analyses and thesewill give different readings to the standard testsused in WA.
Calculating fertiliser application rates(Agriculture Western Australia, 1999)
❑ Engage an experienced, independent soilnutrient consultant to analyse soil testresults and prescribe fertiliser applicationrates.
To calculate how much of each nutrient to apply,nutrient consultants use the followinginformation:
• Soil type and PRI (from soil test).
• Concentrations of the nutrients already in thatsoil as shown by a soil test.
• Crop replacement requirement, which is the
70

SEC
TIO
N 3
amount of nutrient that the crop or livestockwill remove from the paddock. To calculatethe consultant needs to know theconcentration of nutrients in the plant oranimal material (from tables) and the totalquantity of plant or animal material perhectare expected to be removed from thepaddock.
• Efficiency factor, which is a measure of theproportion of the nutrient applied to the soilthat can be extracted from the soil by theplant. If a crop requires one unit of nutrientand it has an efficiency factor of 10 for thatsoil, then 10 units of nutrient must be presentin the soil to provide one unit to the plant.Heavier, higher PRI soils have higher Pefficiency factors, i.e. more P has to bepresent in the soil to supply the plant’s needs.
• Leaching factor, which allows for nutrient lossby leaching and erosion. It depends on thesoil type and fertiliser type. In grey and whitesandy soils, nutrients stay in soluble form sothese soils have the highest leaching factors. Ifsoil erosion occurs, more nutrients will be lostand the leaching factor will be even higher.
Calculating fertiliser application rates involvesinterpretation of tables of tissue nutrientconcentrations for different crops and efficiencyfactors and leaching factors for different soiltypes. Other factors such as soil texture, reactiveiron content and pH will also influence the soilnutrient requirements. For these reasons, it isbest to hire an experienced soil nutrientconsultant at least to gain initial understandingof the soil chemistry.
Phosphorus management
❑ On all soil types, apply phosphorusaccording to soil phosphorus test levels.
Environmental best practice for phosphorusapplication on all soils is:
1. Test the major soil types in a paddock beforeeach vegetable or potato crop.
2. Contract a qualified, independent soilconsultant to calculate phosphorus
requirements, according to soil PRI andavailable phosphorus test levels.
3. Aim for 95 % maximum yield. Attempting togain a few percent in yield by applyingphosphorus (or nitrogen) in excess ofrecommendations is damaging to theenvironment and not good practice.
To determine how much phosphorus fertilisershould be applied, it is essential to have the soiltested for phosphorus. The Colwell-extractable Pand the PRI-100 tests are the standard soil teststhat should be requested.
To get an accurate result, the proper samplingtechnique should be used (see ‘Taking soilsamples for testing’ above).
The Colwell soil test for phosphorus
The Colwell-extractable P test is the standardsoil P test used in WA. It measures the P insolution after extraction by a 0.5M sodiumbicarbonate solution, at pH 8.5, shaken for 18hours. The Colwell test measures phosphorusthat is either adsorbed or in solution in the soiland is used as an indicator of phosphorusavailable to plants during a cropping period.Colwell-extractable P is expressed as mg/kg orparts per million (ppm).
The PRI-100 test for phosphorus retention
The capacity of a soil to retain phosphorus ismeasured by using the Phosphorus RetentionIndex (PRI) test, which can be done by most soillaboratories on request. In general, the lightcoloured sands have low reactive iron contentand low clay content which means they willhave a low PRI. White and grey sands have thelowest PRI’s. These soils have a very lowcapacity to hold on to the major nutrientsphosphorus and sulphur.
Phosphorus fertiliser management for sands(McPharlin, 2001; Rose, 2001)
Sands present moderate to high risk ofphosphorus leaching. Particular care andattention needs to be paid to the rate and timing
71

SEC
TIO
N 3
of phosphorus application on sands as excessphosphorus is rapidly leached into groundwater,or into dams and wetlands that may be nearby.The rate of phosphorus application requiredvaries greatly depending on the amount ofresidual phosphorus present in the soil. It isessential that sands are tested for residualphosphorus levels and Phosphorus RetentionIndex to determine how much phosphorusfertiliser will be required.
Appendix 3.1 shows indicative rates ofphosphorus that would be required for autumn,winter or summer sown potatoes on the coastalsands. Rates for two soil types, for different soiltest levels of phosphorus are shown. The soilgroups are:
- Grey-white (Bassendean/Joel) and light yellow(Karrakatta) sands.
- Red-Orange, yellow (Spearwood or Tuart)sands.
Note that these rates are only indicative andaccurate determination of requirements willdepend on specific characteristics of the soil,such as PRI and texture that can only bedetermined by doing soil tests.
Plant Analysis (potatoes)
Collect samples of petioles (20 per time) afterplanting to monitor the phosphorus status of thecrop. The % phosphorus should range from 0.8-0.9% when tubers are 10mm diameter to 0.2-0.25% at 120 to 130 days after sowing.
Phosphorus fertiliser management for loamyor gravelly soil
Phosphorus export by leaching much less onthese soils. The moderate to high iron contentensures that most of the soil P is bound(adsorbed) to soil particles, that is the P isretained in the topsoil and not easily leached.
However excess P should not be applied to thesesoils because if erosion occurs, phosphorus richtopsoil is washed into dams and streams. Once inthe water body, this adsorbed P can be evenmore damaging than dissolved P. The reason forthis is that under warm, anaerobic conditions
common in summer, the chemical conditions inthe water change and the P adsorbed insediments is released into the water. It is in theseconditions that the water becomes nutrientenriched and algal blooms are likely to occur.
With marron and fish culture and tourismbecoming important industries in the south west,algal blooms caused by nutrient export fromfarm land can have devastating economic as wellas environmental consequences.
Trials conducted growing potatoes on jarrah-marri and karri soils in the Manjimup-Pemberton area (Hegney, Mc Pharlin et al, 1992)showed that:
• Phosphorus requirements for 99% yield variedgreatly, from 25 kg of P to over 200 kg of P,depending on the soil P test levels and the soilPRI.
• Potatoes grown on jarrah-marri gravelly loamsrequire relatively small phosphorusapplications when Colwell P level is above 160ppm before planting.
• To lift yield from 95% of maximum to 99% ofmaximum, phosphorus applied had to beincreased by 60- 75% , i.e. 110 to 150 kg morephosphorus per hectare (equivalent to about1.5 tonnes of superphosphate). The extraphosphate produced no significantimprovement in tuber quality.
• The indication is that 1.5 tonnes ofsuperphosphate, costing about $300 would berequired to achieve a four percent increase(about 2 tonnes per hectare) in yield. Thisequates to about $600 in production. In otherwords, to gain a few hundred dollars perhectare, the grower greatly increases the risk ofdamage to streams, dams and groundwaterresources.
Refer to Appendix 3.2 for indicative rates ofphosphorus application for potatoes on loams.Note that these rates are only indicative.Accurate determination of requirements willdepend on specific characteristics of the soil,such as PRI and texture that can only bedetermined by doing soil tests.
72
SEC
TIO
N 3
Note also that patches of sands, often with lowPRI are common in jarrah- marri and karri soils.It is most important that these soils be tested andfertilised separately from the high PRI brownand red soils. Much less phosphorus is requiredfor these soils and it should be applied little andoften, mainly after planting. (see above‘Phosphorus management for potatoes on sands’and Section 3.3 ‘Minimising leaching ofphosphorus on light sands’).
Method of application of phosphorus(Paulin, 2001)
The recommended application method forphosphorus fertiliser depends on the soil PRI andthe crop grown. The following are guidelines:
1. Soil ‘PRI-100’ values are less than 2.0 to 3.0
Phosphorus is best applied in more than oneapplication by:
Broadcasting three applications. Take care whenbroadcasting fertiliser to ensure accuracy andevenness of placement (see 3.2 ‘Broadcasting’).
Or
A light application pre-planting, with more than75% of the phosphorus applied by fertigationduring crop growth.
To accommodate progressive development of thecrop root system, the total amount should beapplied as follows
• 15 to 25% of the total application at planting.Apply the higher proportion when only twoapplications will be made. This applicationshould be applied over the planting row.
• 30 to 40% of the total application, three to fourweeks later and when three applications willbe made.
• The remainder half way through the crop’sexpected life or as late as is practicable interms of minimising crop damage, such as withpotatoes.
2. Soil ‘PRI-100’ values exceeding 15 to 20
When soil PRI-100 values exceed 15 to 20 andavailable phosphorus soil test levels are low, the
total phosphorus application should be eitherbanded or broadcast at planting, depending oncrop (banded for potatoes).
Choosing the right fertilisers (Rose, 2002; Ross, 2002)
The grower needs to determine, with the help ofa nutrient consultant, suitable fertilisers in thecorrect proportions according to soil test andcrop requirements. The nutrient content, andwhether it is in slow or quick release form, needsto be carefully considered when selecting thefertilisers to be applied (refer to Table 3.1below).
Standard blended products such as Potato ETM,NPK BlueTM, Super-SpudTM and AgrasTM andsome unblended products such as SuperphosTM
and potassium sulphate contain two or morenutrients in certain proportions. Some of theseproducts are granulated, which has the advantagethat the nutrients are mixed in fixed proportionsin each granule, ensuring even distribution.
However, using standard-blended products ontheir own is often not the best practice becausethis will seldom supply all nutrients in thecorrect proportions. In order to apply enough ofone nutrient there is likely to be too much ofanother.
It is necessary to calculate from the soil testshow much of each nutrient is required. Customblends can then be made up for each paddock orsoil type. Alternatively the nutrients can beapplied in the correct proportions in separatefertiliser applications, whichever is mostconvenient for the grower.
❑ Order custom blended fertilisers mixed inthe proportions recommended by the soiltest analysis, in preference to using onlystandard blended products.
The fertilisers applied may include somestandard blend products, but the main thing isthat the right balance of nutrients are appliedaccording to the soil test, and this will varyaccording to paddock fertiliser history and soiltype (see Table 3.2 overleaf for an example).
73

Fertiliser Percent by weight of nutrient
Phosphorous Sulphur Calcium Nitrogen Potassium % % % % %
Single superphosphate 9.1 11.5 20 0 0
Double Superphosphate 17.5 3.5 16 0 0
Triple Superphosphate 20 0-1.5 15 0 0
Phosphate rock* 1-15 0 N/a 0 0
North Carolina Rock* 13.5 0 36 0 0
Wet process phosphoric acid 13 0 0 0 0
Di-ammonium phosphate 20 0-1.0 0 17.5 0
Mono- ammonium phosphate 22.6 0-1 0 12 0
Ammonium nitrate 0 0 0 30 0
Ammonium sulphate 0 0 24 21 0
Anhydrous ammonia 0 0 0 82 0
Calcium nitrate 0 0 19 15 0
Potassium nitrate 0 0.2 0.6 13 36.5
Potassium chloride 0 0 0 0 50- 51(muriate of potash)
Urea 0 0 0 46 0
Gypsum (CaSO4.2H2O) 0 17 22 0 0.4
Elemental sulphur* 0 90-100 0 0 0
Standard-blended products
Potato-ETM 7 13 15 4 7
Super-SpudTM 12.4 5 N/a 11 12.2
Agras No 1TM 7.6 17 0 17.5 0
Summit TopyieldTM 20 1.7 0 18 0
Summit PastureTM 18.6 10 14 0 0
Coastal SuperTM** 7.5 18.5 17.5 0 0
* Slow release fertilisers ** Half of the S is slow release elemental sulphur
SEC
TIO
N 3
Post-plant applications should be recorded toensure that total application is according to thesoil test analysis and plant tissue testing results.Tissue testing provides a ‘double check’ that thecrop is receiving adequate nutrition throughoutcrop growth.
Fertigation and boomsprayer application enablessoluble nutrients to be applied in balanced
amounts during crop growth. Note that somesoluble fertilisers react together and should notbe mixed in the fertigation tank (Section 3.1).
Slow release phosphorus and sulphur fertilisersare available at little extra cost and are worthconsidering as part of a strategy for light sands(Section 3.3).
74
Table 3.1 Nutrient content of some common fertilisers(adapted from Moore, 1998)

SEC
TIO
N 3
75
Table 3.2 Example – Calculating fertiliser application to supply nutrients according to soil test andcrop replacement requirements. (The nutrient contents of the fertilisers were derived from Table 3.4).
Fertilisers (application rate in kg per hectare)
Nutrient Lime Double Potassium Urea Mono Totals Recommendation(5,000) super (130) sulphate (574) ammonium according to soil
(722) phosphate test and crop (296 kg) replacement
N 264 36 300 300
P 23 67 90 90
K 300 300 300
S 130 130 100
Ca 1600 1600 N/a
The important point to note from the example inTable 3.2 Is that the rates of N and P fertilisershave been calculated so that the total N and Papplications do not exceed the soil testrecommendations for that soil and crop. This isimportant from an environmental perspectivebecause it is these nutrients that have the mostpotential to pollute water resources.
Note also that the sulphur application exceedsthe recommendations; but this does not matter asboth sulphur and potassium are not seriousenvironmental pollutants.
Calcium application is well in excess of croprequirements as this rate was needed to raise soilpH. Lime has no known detrimental off-siteenvironmental effects.
Trace elements
❑ Include trace elements in the soil testsperiodically
(Moore, 1998)
Most soils in WA are ancient and highlyweathered. When newly cleared, they are oftenacutely deficient in the major nutrients,phosphorus and nitrogen and the trace elementscopper, zinc and sometimes molybdenum andmanganese. Profitable production on these soilshas only been achieved by applying fertilisers.
Horticultural growers should have their soilstested periodically for trace elements. Traceelements can be applied to the soil or as foliarspray, according to soil consultants’recommendations.
Manganese deficiency is a problem in manycoastal and wheat belt soils. Manganese sulphatecan be applied to the soil or as a foliar spray.
Molybdenum deficiency is most marked on theyellow sandy earth soils of the wheat belt.However, it can also occur on sandy gravellysoils and the red-brown soils of the lower southwest hills horticultural areas. Molybdenum canbe applied to the soil or as a foliar spray.
Copper has been shown to have good residualvalue and may only need to be applied at therecommended level every 25-30 years on cerealcropping land but may be required morefrequently for vegetable cropping, depending onsoil test results.
Zinc is now added to WA-made phosphaticfertilisers to maintain levels added to the soil. Itcan also be applied in foliar sprays.

SEC
TIO
N 3
76
3.2 Minimise loss of fertiliser tothe environment
Storage and handling of fertilisers
❑ Store fertilisers in covered field bins orsheds that keep the product dry andprevent contact with the ground.
It is essential that storage facilities have thefollowing characteristics:
- Sealed floor such as a concrete slab underlainwith waterproof plastic membrane (slab as fordwellings is generally sufficient but wouldhave to be thicker if vehicles are to be drivenon it)
- Covered, to keep the product dry and prevent itbeing blown or washed outside the storagearea by wind or water.
Bulk fertiliser can be stored in sheds andhandled with a bucket loader, provided that theloading area is concreted to prevent fertiliserfrom spilling into the surrounding environment.
• Don’t dump fertilisers in heaps on theground.
In the past, some growers have had fertiliserdumped on the ground where they transferred itinto spreading equipment with a front-endloader. This practice was most common on newor leased land remote from storage facilities. It isno longer acceptable for any fertiliser, even onheavy soil types, as a few centimetres of soilcontaminated with fertiliser are left over an areaof about 10 by 10 metres. This amounts tobetween 100 and 1000 kg of fertiliser left on thesoil surface, where it can be washed directly into drains and streams, either in solution orattached to soil particles, or leach downwardsinto water tables.
Storage bins
Covered metal field storage bins on legs, of thetype hired by fertiliser companies, are adequate.Most covered truck mounted bins with augers orconveyor belts to transfer the product areacceptable provided the transfer mechanismsoperate without spilling fertiliser.
One tonne fertiliser bins that can be stacked in ashed, handled with a fork-lift and placed on flatbed trucks are also available. All of thesestorage/handling methods are acceptable.
• Covered field bins should be ordered well inadvance if fertiliser needs to be stored in thepaddock.
Bagged fertiliser
Bagged fertiliser should be stored in a coveredshed with a sealed floor as above. Whentransported, it should be adequately secured onthe truck and covered in the event of rain.
Fertiliser bags should be completely emptiedinto the fertiliser box of the applicationimplement and kept for recycling or properdisposal (Section 9.1, ‘Plastic and other solidwastes’).
Accurate application of fertilisers
Excess fertiliser applied in the wrong place, atthe wrong time or in the wrong form can beeasily leached or washed into groundwater andsurface water bodies. In order to minimise theloss of fertiliser into the environment, the aim isto ensure that as much of the applied fertiliser aspossible is taken up by the crop.
Most vegetable crops are fast growing, but donot have extensive root systems. To ensure thatthe crop makes maximum use of the fertiliser,application must be accurate in terms of rate andplacement.
❑ Banding or dropping and incorporating offertiliser close to the plants using anaccurately calibrated fertilising or plantingimplement are the best practices for pre-plant fertiliser application on most soilsexcept light sands.
Fertilising using an implement mounted on theplanter, that meters fertiliser accurately andincorporates it into the seed-bed has been provedto be more effective than banding for brassicacrops and is also being trialed for potatoes (seebelow).

SEC
TIO
N 3
77
Incorporation of fertiliser for cauliflower andbroccoli crops (Lancaster and Ross, 2002)
For brassica crops such as cauliflower andbroccoli, fertiliser placement on loam and claysoils has traditionally been by banding. Twonarrow bands of fertiliser are placed either sideof the seedling transplant, so they are slightlybelow and off set from the seedlings. Analternative method for fertiliser placement forthese crops is to apply the fertiliser to the soilsurface in a strip (about 20 cm wide) andincorporate it into the soil to a maximum depthof 15 cm (strip incorporation). The cauliflowerand broccoli seedlings are transplanted in to thisfertiliser strip.
The fertiliser is incorporated using small rotarytillers on the planting machinery. The number ofrotary tillers required depends upon the numberof rows of crop to be planted by each pass of themachine. One row of cauliflower is placed ineach strip of incorporated fertiliser. Existingbrassica planting machinery can be modified tofit the rotary tillers.
Experimental work and growers’ experience hasshown that this strip incorporation method helpscauliflower and broccoli plants grow faster,particularly during the cooler winter months.Plant growth occurs immediately, as the plantroots are surrounded by the phosphorus fertiliser,which is mixed through the soil in the root zone.
For banded fertiliser, the plant roots first have togrow to the band to intercept the fertiliser andthis delay in the plants obtaining nutrients canreduce early and subsequent growth.
Commercial producers have also reported otheradvantages that the strip incorporation methodhas over banding:
- A reduction in the number of harvests requiredto remove the crop.
- Less chance of ‘fertiliser burn’ of the roots ofthe transplanted seedling.
Fertiliser burn of the roots often occurs whenfertiliser is banded, as the seedlings can betransplanted directly on top of the fertiliser bandif there is a slight movement sideways of thetransplanting machinery. With stripincorporation, the fertiliser is mixed evenlyaround the plant roots
For strip incorporation on loam and clay soils,fertiliser containing a higher concentration ofwater-soluble phosphorus is more effective. Theamount of water-soluble phosphorus can bedetermined by looking at the chemical analysisof the fertiliser written on the bag or asking forthe analysis in the case of bulk supplies. Thestrip incorporation method can be successfullyused with fertiliser that has a low water solublephosphorus content, if the background level ofphosphorus in the soil is high. This will beshown by soil testing.
Cropping sandy and loamy soil types separately, to enable application offertilisers according to the different soil requirements is good practice.

SEC
TIO
N 3
78
Fertigation(Refer to Section 4.1 for details of best practicesfor fertigation)
❑ Fertigation is a recommended means ofpost-planting fertiliser application ifconducted according to best practice.
Table 3.6 Fertiliser solubility for estimating tank sizes(Calder and Burt, 2001)
Examples
Fertiliser Solubility Amount of Water needed tokilograms per fertiliser required dissolve that amount100 litres at 20 ° (kilograms per hectare) fertiliser (litres)
Potassium nitrate 32.0 80 250
Urea 105.0 30 29
Potassium sulphate 11.0 80 730
Boomsprayer application
The use of fertigation is less suitable where thesprinkler layout gives a poor distributionuniformity. In this situation, a boomsprayer canapply soluble fertilisers more efficiently.
Apply sprinklers for two to five minutes afterboomspraying to wash the fertilisers from theleaves and into the soil.
This method is used in preference to fertigationfor crops such as lettuce in windy coastal plainareas where wind speeds often make itimpossible to attain acceptable sprinklerdistribution uniformity.
Boomsprayer application of all soluble fertilisersand chemicals is the standard method used byDepartment of Agriculture WA vegetableresearchers in their trials, where maximalaccuracy is required.
Mixing fertiliser for fertigation or boomsprayapplication
When preparing fertiliser solutions for injectionunits, care must be taken with chemicals. Somewill react together forming precipitates, whichblock and damage the equipment. Solublefertilisers that must not be mixed together are:
• Calcium nitrate with any phosphates orsulphates.
• Magnesium sulphate with di- or mono-ammonium phosphate.
• Phosphoric acid with iron, zinc, copper andmanganese sulphates.
Most materials used in fertigation are corrosive.The injector is also often used to inject acid intothe irrigation system for regular maintenance.Therefore, all injector parts should be made ofcorrosion resistant materials.
Broadcasting
Broadcasting of fertiliser from super spreaders isthe most inaccurate means of application and isgenerally not suitable for vegetable and potatocropping, except for acid grey sands with verylow PRT. Banding, boomspray application, stripincorporation and fertigation are the preferredmethods.
However, broadcasting is suitable for otherrotations in the horticulture enterprise, suchestablishing post-harvest cover crops andtopdressing pastures.
• Top dress after break of season aftergermination (Do not top dress prior to break ofseason or in winter).

79
SEC
TIO
N 3
• Avoid top dressing fertilisers on bare ground.
• When top-dressing pastures or crops, the besttime is after germination when the topsoil ismoist.
• Do not apply fertilisers in wet paddocks.
• Do not apply fertilisers in or on the banks ofstreams or drains.
Erosion of soil fertility
❑ Applying best practices to minimise soilerosion is essential to prevent loss ofnutrients from the topsoil. (Section 2)
3.3 Minimise leaching ofnutrients
Minimising leaching of nitrogen(Lantztke,1995)
High nitrogen concentration in the groundwaterbelow horticultural properties is common on thesouth west coastal plains (Section 5.1 ‘Nitratesin groundwater’). This is important for threereasons:
• Health concerns from drinking water with highnitrate levels
• The growth of algae in surface water
• The amount of nitrogen applied to crops inirrigation water
Nitrogen application and tissue testing
❑ Apply no more nitrogen fertiliser than thecrop needs for good growth. Refer toDepartment of Agriculture WA fertiliserrecommendations for different crops.
❑ Apply nitrogen fertiliser in small, regulardoses throughout the life of the crop. This isespecially important on sandy soils.
Indicative rates of nitrogen application on sandysoil types can be found in Appendix 3.3
When plants are young, place nitrogen fertiliserwith droppers immediately adjacent to plants.When crops develop more extensive roots theyare better able to extract nutrients spread over
the whole cropped area.
Once the crop’s water requirements are beingprovided by irrigation, both nitrogen andpotassium can be applied by fertigation,boomspray or broadcasting in regularapplications – at least weekly for nitrogen and atleast fortnightly for potassium (Paulin, 2001).
Potatoes (processing)
• Around 20-30% of N is applied immediatelyprior to planting
• Two to three post-plant applications of 50kg/ha up to 50 mm tuber size
• Weekly applications of 20, dropping to 10kg/ha/wk to maintain leaf petiole nitrate levelsabove 8000 ppm
• Nitrogen rates for seed potatoes can be furtherreduced
Other vegetable crops
On all soils, apply nitrogen weekly. Rates forthe first four weeks are 30% less thansubsequent applications and these can bemaintained until a week before harvest.
❑ Match nitrogen application rates with cropgrowth stage. When plants are young, placenitrogen fertiliser with droppersimmediately adjacent to plants.
Plant tissue testing is recommended as the mostaccurate means of determining whether andwhen to apply more nitrogen and other nutrientsduring growth of vegetable and potato crops.Plant tissue samples need to be carefullycollected to prevent contamination. Accreditedlaboratories conduct accurate nutrient analysescost effectively with results generally beingavailable within a few days. Alternatively, saptesting kits provide a quick method to determinethe nitrogen status of a crop.
❑ Conduct tissue testing to determinewhether the crop has sufficient nitrogenand adjust nitrogen applications.
Most vegetable crops have specific tissue testingrequirements in terms of the part of the plantsampled and growth stage. For example:

SEC
TIO
N 3
80
• Potatoes
Petiole testing is the most reliable check on thenutrient state of a potato crop and should becarried out at least four times during theseason. It is very important that the first test istaken when developing tubers reach 10 mm inlength because our standards are based on thisstage of potato plant development. Toaccurately judge this, begin checking tubersize at least weekly, five weeks from planting.Repeat petiole sampling at least four times,ideally every two weeks.
• Carrots and onions
Sample youngest mature leaf at mid growthperiod.
• Corn
At tasselling, sample the ear leaves.
Most manures, particularly poultry manure, andsome composts are high in nitrogen. Growersneed to know the nitrogen content of theseproducts and factor it into the total nitrogenapplication.
❑ Do not apply high rates of poultry manure,which will increase soil nitrogen levels farbeyond what the plant can use and lead tonitrogen leaching.
Taking account of nutrients ingroundwater(Lantzke, 1995)
Groundwater may contain significant amounts ofnitrogen leached from previous applications. Theamount of nitrogen in groundwater can besignificant- amounting to over 30% of the croprequirements on some sites. If the recommendedamounts of nitrogen are continually appliedwithout subtracting the nitrogen in irrigationwater, the total nitrogen applied will be greatlyin excess of crop requirements. The result willbe further leaching of nitrogen into thegroundwater aquifer, increasing the pollution ofthis resource.
❑ Factor groundwater nitrogen into totalnitrogen application.
Refer to Appendix 3.4 to calculate nitrogenapplied in irrigation water. Subtract the nitrogento be applied in irrigation water over the life of acrop from the total nitrogen required for thatcrop when calculating fertiliser requirements.
Growers should test bore water to determine theconcentration of nitrogen, potassium and, if thesoils are grey or white sands, phosphorus(Section 5.1).
Nitrogen
The result should be expressed as ppm or mg/Lof total nutrient. If test results express thenitrogen concentration as nitrate-nitrogen, divideby 4.5 to get the nitrogen concentration. Thisfigure can be used, but will underestimate thetotal amount of nitrogen being applied, becauseadditional small amounts of nitrogen are usuallypresent in the groundwater as ammonia andorganic nitrogen. For this reason it is best to askthe laboratory to do the analysis for totalnitrogen.
Potassium
Potassium concentrations in the groundwaterbeneath horticultural properties may also buildup to the point that irrigation with this watersupplies a significant part of the crop’srequirement. A potassium analysis can be doneat the same time as a nitrogen analysis. Theresults may indicate that potassium fertiliserapplications can also be reduced.
Phosphorus
Phosphorus concentrations in groundwater underhorticultural properties are unlikely to increase,since this nutrient is held tightly by most soilsand not readily leached. However, levels mayincrease in the shallow groundwater belowhorticultural properties that are located on acidwhite or grey sands.
Other ways to reduce nitrate leaching(Lantzke, 1995)
• Do not over-water. Excessive applications ofwater infiltrate through the soil and leachnutrients away. Small, frequent waterings are

81
SEC
TIO
N 3
best on sandy soils, keeping the root zonemoist without excessive water loss by deepdrainage.
❑ Never apply nitrogen when the soil issaturated
• Ensure that your irrigation system applieswater evenly. Uneven application leads toover-watering in some areas in order to supplyenough water to the drier spots. This excesswater drains below the root zone, takingnutrients with it.
• Slow-release nitrogen fertilisers can reduceleaching, because they supply nitrogen at asteady rate over an extended period. This canresult in efficient nitrogen use by crops, withless nutrients available for leaching. At presentthese forms of nitrogen are more expensiveand uneconomic for broad scale application.
Clays and red mud ‘alkaloam’ reduce leaching ofnutrients by improving soil nutrient retention,wettability and water holding capacity.
❑ Consider applying soil amendments to lightsandy soils (Refer to Section 2.2).
Minimising leaching of phosphorus onlight sands
Phosphorus leaches rapidly from white or greysands and particular attention needs to be paid tophosphorus management. These sands have avery low PRI (Section 3.1 Phosphorusmanagement). This is due to low clay content ofless than one percent. Without the clay particlesonto which it can adsorb, the phosphorus israpidly leached below the root zone where it isfixed by clays at greater depth or enters thewater table.
Sands with low PRI require less phosphorus tobe applied as fertiliser as it stays in the solubleform in which it is readily taken up by plantroots. However, the phosphorus must be appliedlittle and often, or in slow release form. If singleapplications of soluble phosphorus, sulphur andto a lesser extent, potassium are applied to lowPRI sands, these nutrients will rapidly leachvertically or wash laterally out of the root zone.
Section 3.1 explains why and how phosphorusshould be carefully managed on sands.Appendices 3.1 and 3.3 give an indication of theapplications required, according to soilphosphorus levels and soil PRI.
❑ Apply phosphorus according to soilphosphorus test levels
❑ Have the PRI test conducted on light sandysoils. The PRI test result is important todetermine the fertiliser strategy for thesesoils
❑ Over 70% of the total phosphorus fertilisershould be applied post-planting, ‘little andoften’ on light sandy soils with PRI < 20
Another environmentally acceptable alternativeis to use fewer applications of slow releasesources of phosphorus such as reactive rockphosphate, and sulphur such as crushed rockgypsum. Organic manures are also suited tothese conditions as they release nutrients moreslowly than soluble fertilisers. However theseshould be in dried granulated forms as rawmanures present fly breeding and odour hazards.
❑ Consider using slow release sources ofphosphorus and sulphur and driedgranulated manures on light sands with low PRI.
Other post-plant fertiliser applications
Potassium and sulphur application on sandysoils(Paulin, 1999)
Potassium and sulphur are, like nitrogen, quicklyleached from the soil profile, particularly insandy soils with PRI < 20.
Indicative rates of potassium application forvegetables on sandy soil types can be found inAppendix 3.3.
Sufficient sulphur for heavier soil types issupplied in soluble form with some phosphatefertilisers, such as superphosphate. If othersources of phosphate with little or no sulphur areused, or the soils are light sands, extra sulphurmay need to be applied from other sources suchas gypsum or potassium sulphate.
SEC
TIO
N 3
82
Tissue testing is the best way to ensure that thecrop is receiving the right amount of eachnutrient when it is needed. This is mostimportant on sandy soils.
Soil amendments
❑ Increase the organic matter and claycontent of grey and white sands by:
• Turning in mulch crops
• Applying compost
• Claying
Organic matter in the soil minimises leaching byretaining soil nutrients and releasing them slowlyas it decomposes and oxidises. Green mulching,incorporation of residues and composting(Section 2.2) to increase organic matter aretherefore good practices for minimising leachingof nutrients.
In addition to increasing infiltration byovercoming water repellency and improvingmoisture retention on sands, clay is beneficial tothe nutrition of these soils in that it:
• Retains phosphorus, potassium and sulphur inthe topsoil where it is made available to theplants. It increases the Phosphorus RetentionIndex (PRI) of the topsoil.
• Retains soil moisture and encourages longersoil microbial activity, resulting in acontrolled release of soil nutrients over alonger period.
See Section 2.2 for details of clay soilamendments.
References
Agriculture Western Australia, 1997. Soil testingfor Vegetable Production on the Swan CoastalPlain. Bulletin 4328.
Agriculture Western Australia, 1999. Lime andNutrient Calculator.
Calder, T. and Burt, J., 2001. Selection ofFertigation Equipment. Agriculture WAFarmnote 35/2001.
Fertiliser Industry Federation of Australia, 2001.Cracking the Nutrient Code.
Hegney MA., McPharlin IR., Doust JG., JefferyRC., 1992. Phosphorus requirements ofDelaware potatoes on Jarrah/Marri soils.Agriculture WA Activity: 92MA20 (unpublished).
Hegney MA., McPharlin IR., Doust JG., JefferyRC., 1992. Phosphorus nutrition of potatoes onJarrah/Marri soils. Agriculture WA Activity:92MC23 (unpublished).
Lancaster, R. and Ross, P., 2002. Incorporationof fertiliser for cauliflower and broccoli crops.Western Australian Department of AgricultureWA Farmnote, publication pending.
McKay, A., 2002. pers. comm. Department ofAgriculture Western Australia senior horticulturedevelopment officer.
Lantzke, N., 1995. Nitrates in the groundwaterbeneath horticultural properties. Department ofAgriculture Western Australia Farmnote 2/95.
McPharlin, I., 2001. Phosphorus fertilisermanagement of potatoes on sands. Departmentof Agriculture Western Australia (unpublished).
McPharlin, I, 2001. Phosphorus fertilisermanagement of potatoes on sands. Departmentof Agriculture Western Australia (unpublished).
Moore, G, 1998. Soil Guide, a handbook forunderstanding and managing agricultural soils.Agriculture Western Australia Bulletin 4243.
Paulin, R. 2001. Best Practices for VegetableProduction, Scott River. (unpublished).
Peverill, K.I., Sparrow, L.A. and Reuter, D.J.,1999. Soil Analysis, an Interpretation Manual.CSIRO Publishing.
Rose, B.J., 2002. pers. comm. Department ofAgriculture Western Australia.
Ross, P., 2002. pers. comm. Department ofAgriculture Western Australia.
Further Reading
Floyd, R., 1986. Molybdenum Deficiency inVegetables. Department of Agriculture WesternAustralia Farmnote No.88/86.
Hawson, M., 1983. Manganese Deficiency inVegetables. Department of Agriculture WesternAustralia, Farmnote 89/83.

83
SEC
TIO
N 3
Example: What the rate of TSP should beapplied on a Spearwood sand with a soil testresult of 45 mg/kg of phosphorus?
TSP rate is 100/20.5 times the P rate from thetable.
TSP rate = 100/20.5 * 189
= 922 kg/hectare
Plant analysis (potatoes)
Collect samples of petioles (20 per time) afterplanting to monitor the P status of the crop. The%P for maximum yield ranges from 0.8-0.9%(tubers 10 mm diameter) to 0.2-0.25% at 120 to130 days after sowing.
APPENDIX 3.1
Indicative rates of phosphorus application for potatoes on sands
Table A3.1 Indicative phosphorus (P) or double superphosphate (DSP) required for potatoes (basedon Delaware) on coastal sands according to Colwell soil test P
Soil test result Light yellow (Karrakatta) Red-orange (Spearwood) sands0-15 cm sands & grey-white sands & Yellow (Tuart) sands
(mg/kg) Kg P/ ha (kg DSP/ha)* Kg P/ ha (kg DSP/ha)*
<11 162 926 285 1629
11-20 147 840 278 1589
21-30 111 634 261 1495
31-40 75 428 225 1286
41-50 40 228 189 1080
51-60 27 156 154 880
61-70 26 150 119 680
71-80 26 150 85 486
81-90 26 150 48 274
>90 26 150 26 150
Note: Application rates of different fertilisers can be calculated from the P rate in the table: • double superphosphate (DSP) from CSBP contains 17.5%P• triple superphosphate (TSP) from Summit has 20.5% P• superphosphate (super) from CSBP has 9.5 % P.
Disclaimer
Further, but without detracting from the disclaimer applying to this manual, the figures in Table A3.1are only indicative, for the stated Swan Coastal Plain soil types, to give 95% maximum yield. It isrecommended that growers have their soils tested and obtain advice from qualified soils consultants tointerpret the tests and make fertiliser recommendations.

SEC
TIO
N 3
84
APPENDIX 3.2
Indicative rates of phosphorus application forpotatoes on loams(McPharlin, 2001)
These recommendations are for the managementof P for late winter, spring and early summer-sown potatoes on the loams (includes thegravelly jarrah/marri sandy loams, loams, loamysands and karri loams ) in the Manjimup-Pemberton area. These soils generally retainphosphorus and are termed ‘high P-sorbingsoils’. This means that most of the soilphosphorus will be either adsorbed (looselybound) or fixed (permanently bound) to soilparticles (Peverill et al, 1999).
The redder, finer textured soils generally havehigher iron content, higher PRI and higherphosphorus sorbing and fixing capacity.
Soil testing
To determine how much P to apply pre-planting,
both the Colwell P and the PRI-100 test arerequired (see soil testing above).
For gravelly jarrah-marri and karri loams, theColwell test is used to predict if the soil willrespond to applied P and the PRI-100 is used todetermine the amount of P to apply.
Estimating phosphorus application rate
If the Colwell test is greater than 160 ppm thensoil P is substantially adequate for crop growthand it is only necessary to apply 33 kg ofphosphorus (191 kg of DSP) per hectare.
If the Colwell soil test is less than 160 ppm (thecritical level for potatoes) then phosphorusshould be applied according to the soil PRI-100test result as shown in Table A3.2 below. Thehigher the PRI-100 test, the higher the Papplication required. This is because high PRIsoils fix much of the P applied, making itunavailable for uptake by the plant roots.
Table A3.2 Indicative phosphorus (P) or double superphosphate (DSP) required for potatoes (basedon Delaware) on loams according to the PRI-100 soil test
PRI-100 P (kg/ha) DSP PRI-100 P (kg/ha) DSPreading range equivalent reading range equivalent
(kg/ha) (kg/ha)
<50 33 191 171-180 144 823
51-60 46 265 181-190 149 850
61-70 58 334 191-200 153 875
71-80 69 397 201-220 161 920
81-90 80 456 221-240 168 958
91-100 89 510 241-260 174 991
101-110 98 561 261-280 179 1020
111-120 106 607 281-300 184 1044
121-130 114 650 300-350 190 1090
131-140 121 690 351-400 195 1122
141-150- 127 727 400-450 200 1143
151-160 133 762 451-500 203 1158
161-170 139 793 >500 208 1190
Note: Application rates of different fertilisers can be calculated from the P rate as described underTable A3.1

85
SEC
TIO
N 3
Disclaimer
Further, but without detracting from theforegoing disclaimer applying to this manual,the figures in Table A3.2 are only indicative, forthe stated soil types of the Manjimup-Pembertonarea (not the Busselton area), to give 95%maximum yield. It is recommended that growershave their soils tested and obtain advice fromqualified soils consultants to interpret the testsand make fertiliser recommendations.
Plant Analysis (potatoes)
Collect samples of petioles (20 per time) afterplanting to monitor the P status of the crop. The%P for maximum yield ranges from 0.41-0.55%(tubers 10 mm diameter) to 0.2-0.25% (tubers>80 mm diameter).
APPENDIX 3.3
Fertiliser management for vegetables on sandy soils of the high rainfall south west coastal plain(Paulin, 2001)
The nutrient application rates given in Table A3.3 are only indications and actual requirements willdepend on the soil test levels. Fertiliser programs need to be continually monitored and developed withthe aid of soil testing and tissue analysis. Over time as sites are re-planted to successive horticulturalcrops, it will also become increasingly important to take account of the cropping history.
Table A3.3 Indicative nutrient application rates for vegetable crops on soils of the south west coastalplains
Crop nutrient application rate (kg/ha)
Soil Nutrient Potato Carrot Onion Sweet CommentsCorn
Orange- Phosphorus 200 – 250 200 300 200 Estimates based on research brown with several horticulturalsand crops on grey sands elsewhere
in Western Australia. These Grey sand 100 150 100 phosphorus rates assume low
90 – 100 soil test levels. As available phosphorus levels increase, application rates will fall to crop replacement levels, which are in the order of 25 kg/ha (see Table A3.1).
Orange- Nitrogen 320 250 300 300 For potato and carrots, thesebrown rates seek to regulate abovesand ground plant growth in order
360 250 300 300 to improve tuber/root quality.Grey sand
Orange- Potassium 300 250 250 250 It is possible that lower ratesbrown can be applied but there issand insufficient trial data to
350 300 300 300 support/quantify this.Grey sand
Further, but without detracting from the foregoing disclaimer applying to this manual, the figures in this Table 3.3 are onlyindicative, for the stated soil types. It is recommended that growers have their soils tested and obtain advice from qualifiedsoils consultants to interpret the tests and make fertiliser recommendations.
SEC
TIO
N 3
86
APPENDIX 3.4
Calculating nitrogen applied in irrigationwater(Lantzke, 1995)
Step 1
Have a sample of your bore water analysed todetermine its total nitrogen content. Take asample of at least 100 mL of water in a cleanbottle with a tight lid. Keep the sample cool inan ice pack or Esky® and deliver it to thelaboratory (Chemistry Centre WA or privatelaboratory) within a few hours. Frozen sampleswill last up to four weeks (fill the bottle onlytwo-thirds full, to allow for expansion duringfreezing).
Step 2
Calculate the volume of irrigation water (m3)applied per hour over one hectare:
Output of one sprinkler (L/h) multiplied by 10divided by distance (m) between sprinklers alongeach lateral multiplied by distance (m) betweenlaterals.
Another way to do this is, if you know the ratethat water being applied in mm per hour:
Volume of water applied, in cubic metres = 10times the depth of water applied in millimetres
Step 3
Calculate how many kilograms of nitrogen areapplied per hectare per hour in the irrigationwater:
Nitrogen analysis results (Step 1) multiplied byvolume of water per hectare per hour (Step 2)divided by 1000.
Step 4
Calculate how many kilograms of nitrogen areapplied per hectare over the crop’s life. Hours ofwatering will vary with time of year, crop stageand rainfall:
Kg of nitrogen per hectare per hour (Step 3)multiplied by total number of hours of wateringover the crop’s life.
The figure obtained in Step 4 is the extranitrogen that is applied to the crop per hectarefrom the nitrogen in the groundwater.
Example
If the nitrogen concentration of bore water usedin a market garden is 15 ppm, how muchnitrogen is being applied through the irrigationsystem over one crop’s lifetime?
Assume the following:
• output of a Pope Premier sprinkler (size 12nozzle) at a pressure of 300 kPa = 1452 L/h(24.2 L/min);
• sprinklers 12 m apart along the laterals;
• laterals 13 m apart;
• crop watered 1.5 hours per day (on average);and
• the crop is a cabbage crop that takes 72 days tomature.
Step1
The nitrogen content of water is 15 ppm (whichis the same as 15 mg/L).
Step 2
Calculate the volume of irrigation water (m3)applied per hour over one hectare:
Output of one sprinkler (L/h) multiplied by 10divided by distance (m) between sprinklers alongeach lateral multiplied by distance (m) betweenlaterals).
That is: 1452 multiplied by 10 divided by 12multiplied by 13 = 93 m3/ha/h
Step 3
Calculate how many kilograms of nitrogen areapplied per hectare per hour in the irrigationwater:
Nitrogen analysis results (Step 1) multiplied byvolume of water per hectare per hour (Step 2)divided by 1000.
That is: 15 multiplied by 93 divided by 1000 = 1.40 kg of nitrogen per hectare per hour.

87
SEC
TIO
N 3
Step 4
Calculate how many kilograms of nitrogen areapplied per hectare over the crop’s life:
Kg of nitrogen/ha/hour (Step 3) multiplied bytotal number of hours of watering over the crop’slife.
That is: 1.40 multiplied by 108 (1.5 hours/daymultiplied by 72 days) hours = 151 kg ofnitrogen/ha/crop.
A cabbage crop generally requires about 400 kgper hectare of nitrogen for optimum growth. Thisgrower only needs to apply 249 kg of nitrogenper hectare (400 kg minus 151 kg) because ofthe contribution from the irrigation water.
In this example, nitrogen applied in thegroundwater is 38% of the crop’s nitrogenrequirements!
A machine for strip incorporating fertiliser into cauliflower beds - good practice.

SEC
TIO
N 3
88
Excessive application of phosphorus andnitrogen fertiliser is a major cause ofalgal blooms and excessive weed growthin wetlands and waterways.
Spreading compost.
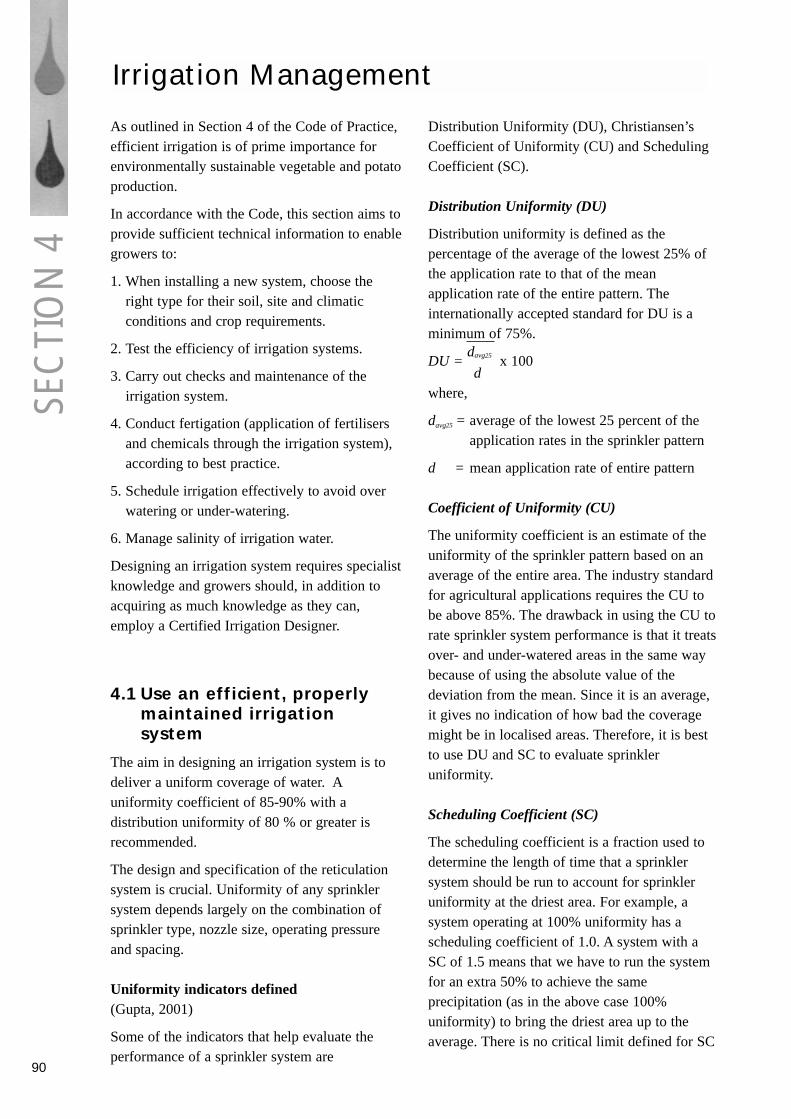
Irrigation ManagementSE
CTI
ON
4
As outlined in Section 4 of the Code of Practice,efficient irrigation is of prime importance forenvironmentally sustainable vegetable and potatoproduction.
In accordance with the Code, this section aims toprovide sufficient technical information to enablegrowers to:
1. When installing a new system, choose theright type for their soil, site and climaticconditions and crop requirements.
2. Test the efficiency of irrigation systems.
3. Carry out checks and maintenance of theirrigation system.
4. Conduct fertigation (application of fertilisersand chemicals through the irrigation system),according to best practice.
5. Schedule irrigation effectively to avoid overwatering or under-watering.
6. Manage salinity of irrigation water.
Designing an irrigation system requires specialistknowledge and growers should, in addition toacquiring as much knowledge as they can,employ a Certified Irrigation Designer.
4.1 Use an efficient, properlymaintained irrigationsystem
The aim in designing an irrigation system is todeliver a uniform coverage of water. Auniformity coefficient of 85-90% with adistribution uniformity of 80 % or greater isrecommended.
The design and specification of the reticulationsystem is crucial. Uniformity of any sprinklersystem depends largely on the combination ofsprinkler type, nozzle size, operating pressureand spacing.
Uniformity indicators defined(Gupta, 2001)
Some of the indicators that help evaluate theperformance of a sprinkler system are
Distribution Uniformity (DU), Christiansen’sCoefficient of Uniformity (CU) and SchedulingCoefficient (SC).
Distribution Uniformity (DU)
Distribution uniformity is defined as thepercentage of the average of the lowest 25% ofthe application rate to that of the meanapplication rate of the entire pattern. Theinternationally accepted standard for DU is aminimum of 75%.
DU = davg25 x 100d
where,
davg25 = average of the lowest 25 percent of the application rates in the sprinkler pattern
d = mean application rate of entire pattern
Coefficient of Uniformity (CU)
The uniformity coefficient is an estimate of theuniformity of the sprinkler pattern based on anaverage of the entire area. The industry standardfor agricultural applications requires the CU tobe above 85%. The drawback in using the CU torate sprinkler system performance is that it treatsover- and under-watered areas in the same waybecause of using the absolute value of thedeviation from the mean. Since it is an average,it gives no indication of how bad the coveragemight be in localised areas. Therefore, it is bestto use DU and SC to evaluate sprinkleruniformity.
Scheduling Coefficient (SC)
The scheduling coefficient is a fraction used todetermine the length of time that a sprinklersystem should be run to account for sprinkleruniformity at the driest area. For example, asystem operating at 100% uniformity has ascheduling coefficient of 1.0. A system with aSC of 1.5 means that we have to run the systemfor an extra 50% to achieve the sameprecipitation (as in the above case 100%uniformity) to bring the driest area up to theaverage. There is no critical limit defined for SC
90

SEC
TIO
N 4
in the irrigation industry, however a SC of 1.4would be a good measure of the systemuniformity.
SC = d
dlowest
where:
d = mean application rate of the entire area
dlowest = average lowest application rate in the five percent window size of the entirearea or a minimum of four catch cans.
Selecting the right type of system
When selecting an irrigation system, topography,soils and climate and possible environmentalimpacts must be considered to ensure that thesystem is the most efficient and appropriate forthe site conditions.
❑ Consider the environmental risks whenselecting the system type and design bestsuited to the soil, terrain and windconditions.
The following information should already bepart of the farm plan and should be used inselecting the irrigation system.
• Map of the property’s boundaries and size ofthe property.
• Location in relation to other land uses,particularly sensitive land uses such asresidential areas, conservation wetlands andpublic drinking water supply areas where spraydrift and leaching may be issues.
• Climatic data – temperature, rainfall andevaporation graphs or tables, wind intensityand frequency.
• Soils map of the property and soil profiledescriptions, including texture, wettingproperties and infiltration rate.
• Depth to summer and winter water table, withareas where this is less than two metresmapped.
• Topographic survey map of the property. Ifthere is to be large investment in permanentirrigation systems, the area should be mappedto one metre contours.
• Location, quantity, quality and availability ofthe water source.
• Types of crops, spacing, estimated rate andfrequency of irrigation.
• The location and availability of the energysource.
Soils
The first step in preparing a sound irrigation planis to carry out a soil survey and prepare a soilmap. A soil map allows the designer to map cropmanagement units as a basis for the irrigationdesign. Irrigation section boundaries should thenbe designed to coincide as closely as possiblewith these units.
Soil profile information for the main soil types isessential for the designer to ensure that wateringapplication rates are always less than theminimum soil infiltration rates for each station.Soil texture, gravel content and infiltration rateshould be measured over at least one metreprofiles.
Topography
When the elevation variation across a property ismore than two metres, this will significantlyaffect pressure heads in the irrigation lines. Thepressure differentials must be taken into accountwhen designing the irrigation layout. Appropriatepipe diameters and pressure compensationdevices are crucial to ensure acceptableuniformity coefficients over all irrigation sectors.
Some types of irrigation systems presentproblems on steep terrain or land prone towaterlogging (see overleaf).
Systems suitable for various site and soil types
Some advantages and disadvantages ofcommonly used types of irrigation systems aredescribed below:
1. Dripper or micro-sprinkler systems usemuch less water than conventional sprinklersystems and are the best option for minimisingleaching on sands. These systems can beadapted to any site. They are used for growingmelons, pumpkins and cucurbits but are not
91

SEC
TIO
N 4
widely used for growing other vegetablecrops, such as lettuce which require cooling ofthe leaves in hot conditions. However, micro-sprinklers are an option for most vegetablecrops and use less water than conventionalsprinklers. Micro-sprinkler systems are similarto dripper systems in that they are lowpressure, have low application rates and areconnected to small-diameter polyethylenereticulation tubing,
Disposal of large quantities of used plastictubing is an issue. The life of the tubing, andwhether it can be recycled, should beconsidered when selecting the system.Depending on the quality of the tube anddrippers and the application, it may only last ayear or two. Landfill is not a good way todispose of polyethylene plastics as these donot break down for hundreds of years. It isbest to select systems that can be re-used atleast for several years, and dipose of oldtubing through plastic recycling facilities.
2. Permanent sprinkler systems with buriedPVC reticulation are often used in moreintensive operations where land is limited.Time and labour savings offset the highcapital cost where there is frequent croppingof vegetables, but not where there are longpasture phases in the crop rotation.
3. Semi-permanent sprinkler systems withdetachable coupled aluminium pipes or polypipe are suited to and widely used insituations where there is a pasture or dry-landcrop phase. These systems need regularchecking and maintenance to minimiseleakage and ‘blow-outs’ at the pipe couplings.
4. Centre pivot irrigators have many benefitsbut can present particular problems. Once setup they can water a large area with very littlelabour input. Another advantage is that thereare no pipes and sprinkler spacings to considerwhen constructing surface water controlearthworks.
The large circular shape of the irrigated area(400-750 m in diameter, 20- 40 hectares)means that hill country they are likely to
traverse some land that is unsuitable forintensive cultivation, e.g. drainage lines,waterlogged areas or steep slopes over 15%gradient. The temptation is to cultivate andplant through those areas and if this is done,erosion is likely.
Another problem with centre pivots is thatexcessive run-off and erosion can occur whenthe sprinklers are aligned running up a steepslope. Erosion will also often occur in thewheel ruts of centre pivot irrigators. In theseconditions low rate sprinklers and high travelspeeds should be used.
For centre pivot systems it is essential to plansurface water control earthworks, which needto be in place at all times during cropping toprevent erosion. A good surface water controllayout is permanent grassed waterways every50 – 100 m running up and down the slopewith temporary grade furrows running intothem, intercepting the wheel ruts and thusdisposing of excess water safely (Section 2.1).
Irrigation systems 5 and 6 are generally lesssuitable for vegetable and potato growing.
5. Flood irrigation is a cheap way of irrigatingpasture flats. However its relative inefficiencyand the high risks of nutrient and chemicalexport are disadvantages when using it forcultivated cropping.
6. ‘Rain gun’ type travelling irrigators. Largetravelling irrigators can cause soil erosion insome situations. Models that apply water at ahigh rate with large droplet sizes can causeerosion, especially in the wheel ruts.Travelling irrigators are generally notrecommended on long (>100 m) and or steep(>5%) slopes.
System components and layout(Agriculture Western Australia, 1992)
Selecting the right type of irrigation system anddesign it properly is probably the most importantdecision that vegetable and potato growers make.
Designing an irrigation system involves selectingthe right components and integrating them in an
92

SEC
TIO
N 4
effective layout. This is a specialised task andrequires the input of a qualified consultant.
❑ When selecting and designing an irrigationsystem, employ a Certified IrrigationDesigner (CID) accredited consultant.
• Where possible, all stations should carrysimilar flows and operate against similarheads.
• Dividing the plot into several equal operatingshifts will enable the pump size to be reduced.
❑ Ensure the system has an effective means ofcontrolling the time and duration of waterapplication.
Some modern systems are automated to switchon and off according to pre-set times or soilmoisture levels, as detected by electronic soilmoisture monitoring systems. Some benefits ofautomation are:
• Reduced labour costs
• Easier night-time operation
Fertigation in trickle systems can also beautomated.
❑ Select the system components to best suitthe crop conditions, with consideration ofenvironmental risks.
From an environmental perspective, aim for asystem that:
• Has an irrigation uniformity coefficient of>85%.
• Is not prone to leakage, pipe failure orblockages, i.e. utilises appropriate fittings,pipe classes, pressure regulators and filters.
• Has minimal spray pattern distortion andspray drift under windy conditions.
• Waters at a rate not exceeding the infiltrationrate of the soil.
• Has effective means of controlling application,to minimise infiltration of water past the rootzone.
The following guidelines are to help growers torecognise an efficient, environmentally soundirrigation system and to improve their systems.
Attention needs to be paid to all of the sub-headings in this section, which serve as achecklist for growers.
Selecting the right sprinkler(Calder, T. 1992; Gupta et al, 2001)
Most irrigation of vegetable and potato crops inthe south west of Western Australia is bysprinklers. In addition to their regular use forcrop irrigation, sprinklers are sometimes used forfrost control, crop cooling, and minimising thedamage caused by sand blasting.
The efficiency of a sprinkler system is measuredby the amount of water available to the plants,after evaporation, as a percentage of the waterapplied. Observations of market garden sprinklersystems in and around Perth have indicated thatmany systems are inefficient. The sandy soilsand hot windy summer conditions on the SwanCoastal Plain pose particular problems forsprinkler irrigation.
Sprinkler design and delivery rate is crucial. Inorder to select the most suitable type, growersneed information on the water application ratesand operating pressures for each sprinkler type.
❑ The application rate of the sprinklers oremitters should not exceed the infiltrationrate of the heaviest soil type in the block.
If water runs off the surface during irrigation,then the rate of application is too high. Run-offduring irrigation wastes water, exports nutrientsand erodes soil.
There is wide variation between types andbrands in cost, uniformity of water applicationand durability. Several new sprinkler designshave appeared on the market in the last 10 years,many of them constructed of plastics forcorrosion resistance and low cost.
The following guidelines are to help the growerpurchase the most suitable type and bestperforming brand of sprinkler.
- First ensure that it has the right delivery rateand operation rate for your irrigation plan.
- Look at the cost and compare it with theexpected life of the sprinkler.
93

SEC
TIO
N 4
- Find out what parts are likely to wear. Howmuch will it cost to replace them? - Will it becheaper to replace the whole sprinkler?
- Will the sprinkler be prone to blockages orcorrosion?
- Does it comply with Australian designstandards?
- How does it perform in windy conditions?
- What is the application rate? Is it suitable forthe soil types?
- Can nozzles be changed easily if required?
• Medium rate continuous throw rotatorsprinklers such as the Nelson RotatorTM orNetafimTM. These are the least likely of thelarger sprinklers to cause run-off and erosionand are therefore recommended especially forsteep slopes and water-repellent or loamy soils.Application rate about four mm per hour, abouthalf the rate of most standard impulsesprinklers. They generally do not throw as far,although spacings of up to 14 m are possiblewith some models.
• Impulse double jet sprinklers such as PopeRainmaker or Premier models are traditionallythe most commonly used. When larger jetsizes are used, irrigation rate may exceedinfiltration rate on loamy soils or soil profileswith low water holding capacity, e.g. duplexsand/ gravel over clay. This can cause run-off,nutrient export and erosion. On these sites,care is needed in selecting smaller nozzles andnot irrigating for too long.
• Micro-sprinklers. Micro-irrigation is anefficient way of supplying water to a plant.The systems operate above 90 per centefficiency. On sandy soils, pulsing with amicro-irrigation system can save about 40 percent of the total water used by sprinklers, dueto less leaching and less evaporation losses.Micro-irrigation systems have lower pressurerequirements and are cheaper to operate. Windconditions need to be considered whenplanning spacings.
The wetting pattern and distribution uniformityof all sprinklers is greatly affected by windconditions. It is crucial to check the prevailingwind velocities and plan appropriate sprinklerspacings, pressures and nozzle sizes beforeinstalling the system. (see ‘Sprinkler systemdesign for windy conditions’ in this section).Application rate and droplet size can be alteredwithin a limited range for each sprinkler type bynozzle selection.
Sprinkler head design factors affectingdistribution uniformity(Solomon, 1990)
The following are three general design factorsthat influence sprinkler distribution uniformity:
Rotation speed of the jet
Rapidly rotating jets have less chance to developan envelope of moving air, so will alwaysencounter maximum drag and will undergo mostbreak-up. Thus rapidly rotating sprinklers aregenerally more affected by wind than lowerrotation speeds.
Jet trajectory
The maximum throw in still air is achieved ataround 30 degrees trajectory. However, in thepresence of wind, high trajectory angles sufferthe disadvantage that the water is in the airlonger and hence more affected by wind. Forsprinklers to be used in moderate to high windconditions, lower trajectory angles are advised;23, 21 and even 18 degree trajectory angles areavailable for use in successively higher windconditions.
Single or double nozzles
The single nozzle is preferred in windyconditions because the second, spreader nozzleusually has a much finer and more diffuse spraythan the main nozzle and is more affected bywind.
94

SEC
TIO
N 4
95
Table 4.1 Summary of sprinkler types
Sprinkler type Material Application Wetted Commentsrate area
diameter
Micro-sprinklers Plastic Low 1-4 metres Water efficient, low pressure. Can be used for some vegetable crops. Good performance in wind if located close to the ground.
Continuous throw, Plastic Medium 6-12 metres Generally good performance in wind single nozzle if spaced correctly. Lower applicationrotator types rate than impact sprinklers makes
them generally more suitable on hill slopes.
Butterfly types Metal or Medium 6- 7 metres Generally good performance in wind plastic if spaced correctly.
Impulse or Metal or Medium 10-18 Performance in wind is variable‘knocker’ plastic to high metres depending on model and nozzlesprinklers size. Care needed to select nozzle
size to keep application rate belowsoil infiltration rate.
Large gun Metal High 20- 50 Can cause surface run-off andtype impulse metres be susceptible to spray drift in windysprinklers conditions. Care needed to select the
right model and jet size for the soil and wind conditions. Generally not suitable for some situations such a steep slopes and heavy soils.
Sprinkler pressure and jet size
Sprinkler pressures above the recommendedrange create misting, resulting in wastage ofwater by evaporation and spray drift and poordistribution uniformity in windy conditions.Sprinkler pressures lower than the recommendedrange will give a typical ‘donut’ pattern and poordistribution uniformity.
❑ Restrict operating pressures to themanufacturer’s recommended range.
Check the pump operating pressure and keep itwithin the system limits. Always fit pressurerelief valves. Pressure compensating devicesshould be specified on hilly land where lateralscan not be positioned on the contour.
Table 4.2 Recommended pressures for a rangeof sprinkler jet sizes
Jet size Pressure needed(millimetres) (kPa)
2.4- 4.8 240- 345
4.8-6.3 310- 415
6.3- 9.5 345- 480
❑ Do not use sprinklers of different types,precipitation rates or operating pressureswithin any sector of an irrigation system,unless specified by a CID accredited designfor the site.
Sprinkler system design for windy conditions(Gupta et al, 2001; Calder, 1992)
Shallow-rooted vegetable crops are often grownon sandy soils in hot, windy summer weather.These conditions pose a difficult wateringproblem for many Western Australian vegetablegrowers.
During summer, regular and uniform waterapplications are needed to maintain growth.Irrigation systems should be able to cope withhigher water requirements when hot, windyconditions occur.
A survey of vegetable properties on the SwanCoastal Plain showed that only 10% of sprinklerirrigation systems operated at the internationallyaccepted level of uniformity. On the Coastal
Plain, wind speeds exceed 16 km/hr for 75% ofthe time during the main irrigation season.Irregularities in wetting patterns are common,largely because of variations in sprinkler spacingand capacities.
Wind speed and direction (Appendix 4.3) is amajor factor causing distortion in the uniformityof irrigation. Besides increasing water loss byevaporation, wind distorts sprinkler distributionpatterns. Any sprinkler system operating underwindy conditions must be designed to take intoconsideration the effect of wind speed on itsperformance.
Choose sprinklers and jet sizes, and design thesprinkler layout to counteract the effect of windvelocities. The following are some guidelines fordesigning irrigation systems for windyconditions.
❑ Sprinklers that produce coarser dropletsminimise evaporation losses and are lesssusceptible to wind drift.
• A combination of smaller spacing and loweroperating pressures is desirable. Tests haveshown that raising the operating pressure ofthe system does not improve uniformity if thesprinkler spacing is too large. Increasedoperating pressure also produces finerdroplets, which lead to higher evaporation andwind drift.
• Where possible, run banks of sprinklersoperating together at right angles to theprevailing summer wind direction.
• Use square spacings, as the problem of dryspots in the centre of adjacent sprinklers inwindy conditions is worse under rectangularspacings.
• Use windbreaks to reduce wind speed.
Sprinkler spacing
Proper spacing of the sprinklers is of paramountimportance to achieve an acceptable level ofdistribution uniformity under windy conditions.For example, on a site with a prevalent windspeed of 13 km/hr, a system with sprinklersspaced 16 m x 16 m would have to be run 30%longer to apply the same minimum depth of
SEC
TIO
N 4
96

SEC
TIO
N 4
97
irrigation water as 14 m x 14 m spacedsprinklers. This would cause over- and under-irrigation in some spots within the paddockleading to poor quality produce and leaching offertilisers.
The sprinkler’s wetting radius quoted by themanufacturer is based on the indoor (zero windspeed) testing of the product at recommendedoperating pressures and discharge rates. There islittle information available from themanufacturer / supplier as to how much extraoverlap and which configuration (square,rectangle or triangle) would maximise sprinkleruniformity under windy conditions.
❑ Space sprinklers to achieve a coefficient ofuniformity (CU) greater than 85 per cent(internationally accepted levels).
Exceeding recommended spacing greatly reducesthe uniformity of application in windyconditions. Table 4.3 shows the sprinkler spacingneeded with various wind velocities.
Table 4.3 The effect of wind on sprinkler spacing
Wind velocity Spacing requirement, as a percentage of the spray diameter (diameter of the circle wetted in calm conditions)
No wind 65%
0-8 km/hr 60 %
9-16 km/hr 50%
Above 17 km/hr 22-30%
Refer to Appendix 4.4 for an example of howwind affects distribution uniformity for aparticular sprinkler type.
There is great variation in performance betweendifferent sprinkler models in windy conditions.
Department of Agriculture WA researchers(Gupta, 2001) are currently conducting extensivetesting of many brands of sprinklers in a rangeof wind conditions. This work will be publishedand available to growers in 2002. It will helpsystem designers, equipment sellers and growersto select the proper sprinkler and its spacing fora new system under windy conditions. It will
also be useful when modifying existing systemsto improve distribution uniformity if theprevailing wind speeds for the site are known.
Sprinkler system design for high andmoderate wind areas
From the wind velocity tables in Appendices 4.3(Jandakot, typical of the south west CoastalPlain) and 4.4 (Manjimup, typical of the southwest Hills) the following general comments canbe made about sprinkler system design for thoseareas.
The SW Coastal Plain is a windy area. Windspeeds in excess of 20 km/ hr occur over 40% ofthe time in the morning, rising to 70- 80% of thetime in the afternoon during summer. Theefficiency of sprinkler irrigation is likely to beinefficient for much of the time unless specialconsideration is given to the design andoperation of the system.
The prevailing SE-E and NW-W wind directionsshould be taken out in designing the layout.Windbreaks should be planted at right angles tothe prevailing winds, ie. a NE-SW orientation, toreduce wind speeds in the irrigation area. Windresistant sprinkler heads with continuous jets andlow trajectory angles should be used. Analternative is to consider changing to dripper ormicro-sprinkler systems, which are moreefficient in windy conditions.
The south west hills areas are less windy and aremore suited to sprinkler irrigation. Windconditions in the mornings are from one to 10km/ hr for 50 to 60% of the time. Winds are is inexcess of 20 km/h only five to 10% of the timein the mornings and up to 17% in the afternoons.The loamy soils of this area generally requireless frequent watering than the sands of theCoastal Plain so it is more feasible to avoidwatering in windy conditions. However, there isstill a significant amount of wind in excess of 16km/h and performance in windy conditionsshould be considered when selecting sprinklersand designing the layout. Wind conditions varyin hilly topography and some sites will benefitfrom strategically placed windbreaks.

SEC
TIO
N 4
98
Pipe sizing (Calder, 1992)
Economical pipe sizes often have a friction lossranging from 0.4 m to 1.2 metres per 100 metresof pipe. The most economical pipe size will varywith the pipe longevity, hours of pumping, pipefriction, energy cost and the current cost of pipe.
• Water velocities in pipes should not exceed 1.5 m/sec in mainlines or two m/sec in laterals.Water velocities lower than 0.6 m/sec allow airto accumulate at high points in the pipe.
• The use of air release valves at high pointsshould always be considered.
* Saving money by purchasing smaller diameterpipes may lead to problems in efficiency andincreased operating expenses due to flowturbulence. Turbulent flows result in highfriction losses and reduce the pipes’ operatinglife. Pipe size should be adequate to ensurelaminar (smooth) flow.
For further details on pipe selection and sizing,see Farmnote 65/87 ‘Selecting pipes for thefarm’, or consult a Certified Irrigation Designer.
Mainlines – specification and layout(Calder, 1992)
• The mainline should be a minimum of Class 9or one class higher than that specified for theoperating pressure. This will cater for the extrapressure caused by possible water hammer.
• Pipe strength decreases as temperaturesincrease. Temperature rating should conform torecommendations found in Farmnote 65/87‘Selecting pipes for the farm’.
• Mainlines located in the centre of the propertyare more economical than edge mainlines,since they create shorter laterals, which in turnreduce the friction losses.
• On steep slopes, the mainline is generallydesigned to go up and down the hill.
Laterals – layout(Calder, 1992)
• Pressure variations in a valve section shouldnot exceed 20 per cent of the sprinkler oremitter operating pressure. This will give aflow variation of approximately 10%.
• When rectangular sprinkler spacing is used, thelaterals should be oriented so that theprevailing winds flow across them. This willimprove the application uniformity. In WesternAustralia, a north-south direction is desirableto compensate for the easterly winds whichdominate in summer. However, in undulatingterrain, topography dictates the direction of thelaterals.
• On steep sloping land, laterals are positionedto go across the slope or approximately on thecontour, except where special managementrequires otherwise. If the laterals arepositioned downslope from the mainline,increased pressure can compensate for extrafriction loss and pipe sizes can be reduced.
• For future reference, obtain and keep a plan ofthe pipe network and operating specificationsas designed by the consultant.
Pump selection (Calder, 1992)
Many types of pumps are available but usuallyonly one will best match a design. Using anoversized pump will ultimately result in higheroperating costs. It is usually more economical inthe long term to spend a little more on the mostefficient pump, see Farmnote 17/84 ‘Pumpingwater on the farm’.
• Above 30m static lift, a submersible pump ischeaper than a turbine pump.
• Suction lift for centrifugal pumps should bekept to an absolute minimum and should be inaccordance with manufacturers’ performanceguidelines.
• The distance from an elbow to the suctionvalve of the pump should be at least three tofive times the diameter of the pipe.

SEC
TIO
N 4
99
• The suction line inlet should be three to fivetimes the pipe diameter below the watersurface.
• With increasing age, pumps tend to decline inoperating efficiency. This situation can costgrowers a considerable amount of money inoperating costs. Inspection of the impeller mayshow cavitation damage and that for theminimal cost of a new impeller the originalefficiency can be restored. If cavitation hasoccurred, the cause should be determined.Unless there is an operating problem such asair ingress or suction blockage, the cause islikely to be poor design, which should becorrected.
• An ammeter installed on the motor will alsoshow any dramatic change in energy use andindicate a potential problem.
• Install a pressure gauge at the pump outlet toenable regular checking of the pump’sperformance. For accurate reading, thedistance from a pressure gauge to a valveshould be at least three to five times thediameter of the pipe. Flow meters are alsouseful but are less common owing to theirrelatively high cost.
Filtration unit(Calder, 1992)
• Sizing of the filter depends on the flow rateand debris loading.
• Other than pump intake screens, filters shouldnever be installed on the suction side of apump.
• The choice of filters between moulded screen,grooved disk and sand filters depends on whatis to be filtered. Generally, grooved disks arebest suited to suspended solids and organicmatter.
• Look at the effective filter area whencomparing filter types and brands.
• The size of the filter mesh orifices should be atleast one quarter of the micro-sprinklers’outlets or one seventh of the emitters’ outlets.
• A good general rule concerning filtration is tobe conservative, keeping below manufacturers’guidelines for pressure loss and using 80 percent of manufacturers’ maximum flow rates.
• Following the installation of a new system,conduct pump and pressure tests to identifymalfunctions.
Reliability of irrigation fittings(Rose, 1997)
Failure of irrigation fittings is a common causeof system leakage and ‘blow-outs’. Neither eventis acceptable. Blow-outs are likely to causesevere soil erosion, and leakage of any kindwastes water and can decrease the efficiency ofthe system by reducing pressure. Choosing theright types of fittings for the purpose will greatlyimprove the reliability of the system and reducethe amount of maintenance that will be required.Some fittings are prone to failure, especially insemi-permanent sprinkler systems.
❑ Do not use unsuitable or failure-proneirrigation fittings.
Common causes of failures in irrigation systemsare:
• Some types of aluminium pipe fittings. Thelatch type of joiner (e.g.Pope Mainline) is farmore reliable than the twist type(e.g.Flexolite), which can loosen and twistundone during use if laid on uneven ground.
• Leakage due to worn coupling seals. Therubber sealing rings in all types of aluminiumpipe couplings should be regularly checkedand replaced when worn.
• Some PVC plastic fittings can become brittleafter prolonged exposure to sunlight.
• Avoid coupling plastic components to metalcomponents, especially where the componentsmay be subject to mechanical stresses. Thejoin will be a weak point, due to the largedifference in strength of the metal and plastic.
• Ensure that the grade of pipe used is adequatefor the system pressures.
• Water hammer can be a cause of burst pipes.
SEC
TIO
N 4
100
Ensure that suitable air release valves are fittedto the mainline to reduce the possibility ofwater hammer.
• Flexible riser tubes for low rate plasticsprinklers are joined via coupling grommetsinto polyethylene pipe laterals. These canoccasionally pop out of the grommets.However these systems have been improvedand are generally less prone to major blowoutsthan aluminium semi-permanent systems.
Fertigation
Fertigation is the injection of soluble fertilisersinto water flowing through an irrigationdistribution system for application to land orcrops or both. It has potential benefits, includingsavings on labour and fuel costs andconvenience for frequent applications at lowrates.
However, if fertigation is to be used, it must beconducted properly, as outlined below, tominimise risks of nutrient pollution by spillage,back-flow, leaching and spray drift.
To be efficient and environmentally acceptable,fertigation should ensure the following:
- Back-flow of nutrients into the water resourcecan not occur.
- Accurate application.
- Minimal risk of spillage.
- Containment and clean-up in the event ofspillage.
- Minimal spray drift.
Accurate fertigation relies on an irrigationsystem that can apply water and fertiliseruniformly over the crop, (distribution uniformity> 90%) with minimal spray drift. Drippersystems are more likely to be capable ofachieving these criteria, as they place wateraccurately on the crop plants and are notsusceptible to spray drift. (Calameri, 2002).
Non-uniform application of plant nutrientsresults in uneven crop growth. In over-wateredareas, fertiliser or chemical may leach past theroot zone, resulting in higher fertiliser costs and
possible groundwater pollution. Spray drift canpollute surrounding natural and humanenvironments.
Fertigation by sprinklers is an inefficient meansof applying fertilisers or chemicals in manysituations. For example, the large leaves of cropssuch as brassicas funnel water in to the base ofthe plants. Sandy soils can quickly becomesaturated around the base of the plants duringfertigation, with the result that much of thefertiliser is leached downwards beyond the rootzone. When such crops are grown on sandysoils, it is best to apply fertilisers by boomsprayor broadcasting rather than fertigation once thecrop has developed substantial leaf cover(Calder, T. pers. comm).
❑ If fertigation is to be practiced, ensure thatthe irrigation system has a high coefficientof uniformity and low spray drift.
❑ Do not conduct fertigation in windconditions exceeding 10 km/hr, or intemperature inversion conditions (Section10.1 ‘Weather conditions’).
The greatest environmental risk associated withfertigation is accidental back-flow of fertilisersinto the water resource. For this reason, it isessential that the equipment have safety devicesto prevent back-flow. Traditionally, somegrowers injected fertilisers into the suction pipebelow the pump, near the water resource(suction injection). This method presents thehighest risk of pollution of the water resourceand must not be used. The injection systemshould be located along the mainline, away fromthe water source.
❑ Anti-siphon devices and check valvesshould be fitted and operating according tothe manufacturer’s approved designspecification, to prevent back-flow offertilisers and pollution of the waterresource.
❑ Do not inject fertilisers into irrigationsystems at or near dams, bores or any otherwater resource.
❑ Suction injection (location of the injectionpoint on the irrigation suction pipe below
the pump) is not acceptable, as it presents ahigh risk of water resource pollution.
Chemigation
Chemigation is the injection of pesticidesthrough the irrigation system to control pests. Itis an inefficient method of applying pesticides,and can lead to off-target drift and water bodycontamination.
This method of application is allowed by law,except where the pesticide label prohibits its use.Always read the pesticide label to ensure thatchemigation is allowed, (for example, on themetham sodium label, chemigation isprohibited).
There is continuing discussion by WAgovernment agencies about the practice ofchemigation, in view of the environmental risks.Meanwhile, if chemigation must be used, all ofthe practices outlined above for fertigationshould be practiced, with additional safeguards.Back-flow devices as prescribed in newVictorian legislation (see below; TimebaseVictorian Legislation, 2002) should be used toprevent contamination of water resources:
A person must not use chemigation equipmentunless that equipment complies with thefollowing specifications:
- A check valve or vacuum release valve mustbe installed between the irrigation watersupply and the point of injection of theagricultural chemical product to preventback-flow to the water source.*
- A check valve must be installed between theinjection pump and main line to prevent flowof water into the chemical tank if theinjection pump has failed.
- Interlocking or electronic controlmechanisms must be used to preventcontinued injection of an agriculturalchemical product once the water pump hasstopped.
- Any spray nozzle must produce droplets thevolume median diameter of which is greaterthan 1400 micron.
- A person using chemigation equipment mustcalibrate and inspect the equipment at thecommencement of each chemigationtreatment and at intervals not exceeding 3months unless the equipment has not been inuse during the whole of the period.
Operators should be properly trained to set upand operate the equipment, and to handle anduse chemicals safely.
The point of injection of concentrated chemicalsis a high spill risk area. There should be a spillkit at the site at all times. Chemigationequipment should be surrounded by in a dished,waterproof spill containment trough or slab.
Fertiliser injection methods(Calder et al, 1991)
There are two types of fertigation:
• Proportional fertigation delivers a constantratio of nutrients applied to flow rate.
• Quantitative fertigation is the application ofthe plant nutrients in predeterminedconcentrations to the irrigation system.
The type of fertigation chosen depends on thecrop grown and the farm management system. Itis important to select a fertiliser injection methodthat best suits the irrigation system and the cropto be grown. Each fertiliser injector is designedfor a specified pressure and flow range. Caremust be taken in selecting a fertigation systemthat suits your requirements.
It is important to decide on the required fertiliserinjection rate, the flow rate and pressure of thesystem and whether a pressure loss in the systemis acceptable. Not all injection systems can beapplied to both types of fertigation.
There are four principal methods used infertiliser injection, some of which present higherenvironmental risks than others. They are:
• metering pumps;
• pressure differential;
• the venturi (vacuum); and
• suction injection.
101
SEC
TIO
N 4

Suction injection is not acceptable because itpresents an unacceptable risk of pollution of thewater source. The other systems are acceptable ifinstalled properly and not located at theirrigation pump near the water source.
Metering pumps
The metering pump method uses a pump toinject the fertiliser solution from a supply tankinto the mainline. The metering pump may bedriven by an electric or diesel motor or by waterpressure The pump must develop a pressuregreater than that of the pipeline to force thesolution into the pipe.
Advantages:
• Simple to install and operate.
• Suitable for proportional or quantitativefertigation.
• Easily adjustable injection rate.
• No pressure loss in the mainline.
• Suitable for automation.
Disadvantages:
• Pumps and piping must withstand irrigationmainline pressure.
• Needs electricity or motor if not hydraulicallydriven.
A metering pump is often the most trouble freechoice. The metering pump system is flexibleand simple to install and operate.
Pressure differential
The pressure differential method creates apressure difference through the use of aregulating valve between the tank inlet andoutlet. The difference in pressure is sufficient tocause water to flow through the tank.
There are two systems that use a pressuredifferential method. In one, a nutrient bagcontaining the fertiliser solution is in the tank,allowing the water pressure to force the solutionout and into the system. In the other system,water enters the tank and mixes with thefertiliser solution before flowing into the system.
Advantages:
• Simple and inexpensive to operate.
• Easy to maintain.
• Easy to alter the type of fertiliser.
• Suitable for powder formulations, if usedwithout a bag.
• No electricity or fuel needed.
Disadvantages:
• Requires pressure loss in the mainline, or abooster pump.
• If used without a bag, the concentration of thefertiliser solution decreases over time.
A pressure differential tank is best whenfertigation is done on an irregular basis, andwhere stock solutions are not proportional.
Venturi (vacuum)
The venturi (vacuum) injection method uses aventuri device to cause a reduced pressure(vacuum) that sucks the fertiliser solution intothe line.
Advantages:
• Easy to maintain.
• Easily adjustable injection rate.
• Suitable for very low injection rates.
• Injection rates can be controlled with ametering valve.
• Suitable for proportional and quantitativefertigation.
Disadvantages:
• Requires pressure loss in the mainline, orbooster pump.
• Quantitative fertigation is difficult.
• Not environmentally acceptable when used onpumps near water bodies.
As the venturi system works on velocity to forcethe solution into the line, it depends upon asound irrigation system, which can deliver aconstant flow, in order to maintain a constant
102
SEC
TIO
N 4
supply of plant nutrient. A metering pump maybe a better option if the irrigation system isunsuitable.
Suction Injection
Suction injection is a method in which thefertiliser tank is connected by pipe to the suctionline of a centrifugal pump. There is a the risk ofcontamination of the water source fromfertilisers or chemicals draining through thesuction hose to the water supply and otherproblems such less accuracy, less suitability forautomation and the likelihood of air entering thesystem. For these reasons, this method shouldnot be used and it is recommended that growersselect one of the other methods described above.
Warning when mixing fertilisers
When preparing fertiliser solutions for injectionunits, care must be taken with chemicals.
Some fertilisers that must not be mixed togetherare listed below.
• Calcium nitrate with any phosphates orsulphates.
• Magnesium sulphate with di-or mono-ammonium phosphate.
• Phosphoric acid with iron, zinc, copper andmanganese sulphates.
Most materials used in fertigation are corrosive.The injector is also often used to inject acid intothe irrigation system for regular maintenance.Therefore, all injector parts should be made ofcorrosion resistant materials.
System checks and maintenance(Luke, 1990)
To get the best results from an irrigation systemyou need to check its efficiency periodically.
❑ Check and maintain the irrigation systemregularly.
To evaluate your system, measurements must betaken on the property, under actual workingconditions. It is important to test both old andnew systems – new ones because they should beoperating to design specifications and old onesbecause their efficiency deteriorates with use.
There are three things you must know aboutyour system:
• The rate of application of water.
• The variation in delivery rate from place toplace.
• Whether sprinklers spread the water evenly ornot.
Items that need to be routinely checked ormeasured
1. Pump operating pressure and the operation ofall pressure relief valves.
2. Draw-down of bore water supplies.
3. System pressures and pressure variation.
4. Pressures at the sprinkler.
5. Leaking pipes and sealing rings.
6. The flow and operation of each sprinkler orwater distributor.
7. Depth of water applied.
8. Sprinkler system uniformity.
9. Operation of fertigation equipment.
During lengthy non-watering periods, test runeach segment of the system for a very shortperiod about once every ten days to keep thewater supply, electronics and sprinklersoperational.
Equipment needed for evaluating yourirrigation system
• A current irrigation design of your property.
• A good quality, accurate pressure gauge with arange of 0 to 400 kilopascals (kPa).
• A Pitot tube for taking pressures of over-canopy sprinklers and large low-levelsprinklers.
• A threaded T-piece and fittings for takingpressures of small low-level sprinklers.
• Three to four metres of flexible plastic tubingto measure outputs. The tubing should be of asize that will allow it to fit over the sprinklernozzles.
103
SEC
TIO
N 4

• A 13 mm (or other) threaded T for insertingthe pressure gauge in various parts of tricklelaterals.
• Barbed 13 mm (or other) joiners to repairlaterals once pressure readings have beentaken.
• A bucket or drum large enough to collect theflow from a sprinkler for 30 seconds.
• A watch that measures in seconds.
• A large metric measuring jug.
• A small measuring cylinder or rain gauge.
• At least 30 tin cans with a minimum height of100 mm, to measure the distribution ofsprinkler.
• A tape measure 30 to 50 m long.
Pump operating pressure and the operation ofall pressure relief valves
Pumps and motors wear out with use. Mostgrowers accept this as fact but do little about ituntil the unit fails. Many irrigators are unawareof how well the pump is performing, itsoperating pressure or the efficiency of pumping.Nor do they have a chart of the pumpperformance curve to show the flow at which theoptimum efficiency of the pump set is obtained.
Measurement of pump performance andcorrective action where necessary is theessential first step in evaluating your sprinklersystem. All pumps should have a pressure gaugeand flow meter near the pump outlet.Experienced personnel such as local qualifieddealers or consultants can measure pumpefficiency. Alternatively, you can do it yourselfas follows:
- Determine the head, which is the height of thepipe outlet above the water level of the dam orbore.
- Determine the power of the pump from thepump manual. Record the pressure and flowgauge readings with the pump operating at themeasured head and specified power.
The efficiency of the pump can be calculated bythe following formula:
Efficiency (%) = 1000 (power of pump in kw)
9.8 x (flow in litres per second) x (head in metres)
The efficiency of the pump should be the sameas that stated in the pump manual.
Draw-down of bore water supplies
If drawing from a bore, check the standing leveland draw-down level of the groundwater supplyduring operation. This is particularly importantduring late summer when the aquifer level is lowand water inflow into the bore is likely todecrease.
System pressure and pressure variation
When checking pressures, first adjust any sub-main or internal valves to the pressure shown onthe irrigation plan. Do this at the start of eachirrigation season by carefully adjusting eachvalve several times until steady, correct pressureis achieved.
If the system is working properly, the valves willbe adjusted so that the average pressure over thewhole unit is as close as possible to the designpressure stated on the irrigation plan. None ofthe sprinklers or emitters should be operating atmore than 10 per cent above or 10 per centbelow this average pressure.
Leaking pipes and sealing rings
Inspecting water distribution lines when they areunder pressure will help find leaks in the pipes.Rubber sealing rings in aluminium pipecouplings should be routinely checked for leaksand worn seals replaced
Pressures at the sprinkler
After the internal pressures are set according tothe design, measure the operating pressures at 10or more locations spread across each irrigationunit. These must include the points nearest thevalve, at the start and ends of laterals, and at
104
SEC
TIO
N 4
points of high and low elevation. The techniquefor doing this depends upon the type of system.
Over-canopy and large low-level sprinklers
Attach a Pitot tube to the gauge and then place itwith the end of the tube held into the waterstream, about 3 mm away from the nozzle. Thereading may fluctuate, but the correct readingwill be the highest registered on the gauge withthe Pitot tube in this position.
Small low-level sprinklers
Attach a threaded tee piece to the gauge. Thenselect a sprinkler and choke off the water bycrimping back the connector tube. Remove thesprinkler and replace it with the T piece, finallyscrewing the sprinkler on top of the assembly.Release the connector tube and record thepressure.
From the reading taken at 10 or more sprinklers,calculate the average pressure by adding all thepressures together, and dividing them by thenumber of sprinklers used in the test. The resultshould be close to the sprinkler pressure statedon the irrigation plan. If the variation is greaterthan 10 per cent above or below this, try toreduce it by adjusting any internal valvesinstalled in the system.
If the variation cannot be reduced to within theten per cent tolerance level, discuss the problemwith an irrigation designer.
Trickle irrigation systems
The pressure at 10 different places in a tricklesystem should also be taken. These can be at theend of laterals, or at the start, high and lowpoints, as for sprinkler tests. For these mid-lateral readings, cut the line and insert thethreaded takeoff. After the reading is completed,repair the lateral with the barbed joiner.
Pressure compensating system
If the design uses pressure compensatingsprinklers or emitters, then pressure variationsfrom the irrigation plan greater than 10 per centmay be found. Providing the pressures fallwithin the manufacturer’s specified range for
optimum performance, the system should beoperating satisfactorily.
Spot-check and record the precipitation rate ofeach distributor line two or three times eachsummer. Variations could mean a potentialproblem, such as system wear, water loss, waterinlet blockage, pipe sludge accumulation, pipedamage or distributor blockage.
Flow and operation of each sprinkler or waterdistributor
Checking for worn sprinkler components
Watch your sprinklers and emitters during anirrigation to see if they are working properly.Look for:
• Excessive leakage of water around thesprinklers
• ‘Dumping’ of water around the sprinklers
• Uneven rotation (seen as ‘fluttering’ in smallsprinklers)
• Loss of throw, leading to dry or under-wateredareas
• Sprinkler parts distorted by the sun, forexample, the bridge of micro-sprinklers
• Sprinklers or emitters not working, or stoppingduring an irrigation
• Emitters spurting water.
During winter, dismantle some sprinklers andcheck for wear of parts. This includes wear ofthe spindle, spinner and nozzles of micro-sprinklers, and the base, connector tube, seals,washers, springs, arms, spindles and nozzles ofover-canopy sprinklers.
Replacement of worn sprinklers and parts duringwinter will prevent problems arising fromsprinkler failure during the irrigation season.
Blocked or partially blocked trickle emittersindicate possible filtration problems, but may betreatable. For more information on thesetreatment techniques see Farmnote No. 43/92‘Iron in water for micro-irrigation’ and FarmnoteNo. 41/90 ‘Removing blockages from trickleirrigation lines’.
105
SEC
TIO
N 4

Checking nozzle and emitter sizes
All outlets should be the size stated on theirrigation plan to ensure an even depth of wateris applied across the irrigation unit. It is usualfor outlet sizes to be uniform throughout,although sometimes the size varies toaccommodate differences in pressure or spacing.Study the irrigation plan carefully, and check thesizes across the unit.
Most outlets are marked with their size inmillimetres, fractions of an inch, output in litresper hour, or in the case of plastic nozzles, bycolour coding.
Unmarked nozzles with round openings can havetheir size checked by carefully inserting theshank of an unused steel drill bit into the nozzle.The bit with a snug fit indicates the nozzle size.This method can also be used to check fornozzle wear. A sloppily fitting drill bit of thesame size as that stamped on the nozzle indicatessubstantial wear, and the nozzle should bereplaced.
Measuring the discharge from outlets
Since outlets are affected by wear, it is essentialto periodically measure discharge and comparethis with the manufacturer’s performance chart.Collect the discharge from a sprinkler or emitterin a bucket for 30 seconds and measure thewater collected in litres, using a measuring jug.
In the case of small low-level sprinklers, holdback the arm or spinner and direct the streaminto the bucket for the 30 seconds. With largesprinklers, place the end of three to four metresof plastic tubing over the nozzle, and direct thestream into a bucket for 30 seconds. Where thesprinkler has a rear nozzle, repeat the test on thesecond nozzle to determine the total discharge.Trickle emitters can be held over the collectingcontainer.
Discharge, L/h = (litres collected in 30 seconds)multiplied by 120
Repeat the test on at least 10 outlets across theirrigation unit. The discharges of individualsprinklers on any one lateral should not vary bymore than 15 per cent.
Compare the discharge measured over yourblock with the manufacturer’s specifications forthe given operating pressure. If yours are onaverage more than about 15 per cent higher, it islikely that substantial nozzle wear has occurred,and you should consult your supplier aboutnozzle replacement.
Depth of water applied
The depth of water applied is the amount ofwater that would be collected in a rain gauge ormeasuring cylinder placed at the soil surfaceduring irrigation.
To irrigate efficiently, you must know whatdepth of water your system is applying. This willensure enough water is applied and willminimise the amount lost to drainage.
Two simple techniques can be used to measurethe depth of water being applied.
1. First, if there is a meter, record the reading(usually in kilolitres) at the start and finish ofthe irrigation. Subtracting the reading at thestart from the reading at the finish will giveyou the kilolitres used. From your irrigationplan, measure the area that was irrigated.
Depth in mm = (kL reading at finish minus kLreading at start) divided by area irrigated(hectares), all divided by 10.
2. The second technique uses the discharge of anindividual sprinkler or trickle emitter, and thearea over which it applies the water. Using themanufacturer’s performance chart, read off thedischarge for the combination of nozzle oremitter size and pressure. Then work out thearea being irrigated by each outlet bymeasuring the distance between irrigationrows and the distance between outlets downthe row.
Sprinkler system uniformity
If the sprinklers distribute the water unevenly,some areas will receive too little water andothers too much. Under-watered areas of cropmay become water stressed and in the overwatered areas, large amounts of water will bewasted and nutrients leached. Similarly, plant
106
SEC
TIO
N 4

nutrients will be unevenly distributed iffertigation is practised.
The rate and uniformity of precipitation ofsprinklers over the irrigated area should be testedannually or if there have been any changes to thesystem.
Check how even the distribution is by placing agrid pattern of empty tin cans betweensprinklers. At least 30 cans of the same sizeshould be used. Ensure the cans are upright, andnot under low hanging foliage. The can layoutwill depend on the value of crop, and the type ofsprinkler system installed. For sprinklersarranged in staggered lines, 14 m apart, arrangethe sprinklers in a 2 m grid.
For low-level sprinklers, the cans should be duginto the ground with about 25 mm showingabove the surface. This will ensure that the cansare below the throw of the sprinkler.
Sketch a plan showing the position of the cans.Turn the sprinklers on and operate themnormally for at least a full irrigation. Record thedirection and strength of the wind during thetest.
After the sprinklers have been turned off,measure volume of water in each can using ameasuring cylinder or rain gauge, and the depthusing an accurate ruler. Record the results on thesketch plan.
Repeat the test to determine the evenness of thedistribution over a range of wind conditions. Aswell, carry out the test at several locations in theirrigation unit.
Calculating distribution uniformity
From the sketch plan, firstly average thecontents of the cans by dividing the total amountof water by the number of cans. Then circle thelowest amount, the next lowest, and so on, untilyou have circled a quarter of the values on theplan.
The next step is to average this ‘lowest quarter’of the readings. Distribution uniformity as apercentage (DU%) is calculated by dividing thelow quarter average by the average of all thereadings, and multiplying by 100.
DU%, = low quarter average multiplied by 100divided by average of all readings
A DU of 75 per cent or higher indicatesacceptable uniformity, while values less than 67per cent indicate that the sprinkler distribution isnon-uniform.
Operation of fertigation and chemigationequipment
Injection lines should be regularly inspected and,if they have deteriorated, replaced with lines ofapproved standard. Fertigation equipment shouldnot be accessible to stock or unauthorisedpersonnel that may interfere with its operation.Flow rates should be periodically measured tomaintain accurate rates of fertiliser application.
Correcting faults
Where faults are found in the irrigation system,the necessary changes should be worked outwith your Certified Irrigation Designer. Whendesigning or re-designing a sprinkler system, fullaccount should be taken of the effects of wind,temperature and humidity. System pressure,sprinkler type and delivery rate and sprinklerspacings need to be selected accordingly.
After evaluating the sprinkler system andcorrecting any faults, the grower can irrigate,knowing how much water is being applied, andthat application is uniform and efficient.
Better crop yields, savings in pumping costs andless water used will more than repay the cost ofmaintaining and/or improving the irrigationsystem.
107
SEC
TIO
N 4

4.2 Apply irrigation inaccordance with cropdemand and evaporation
The grower needs to consider many variables toensure efficient watering. The following factorsshould be taken into account to determine thequantity and frequency of water application:
1. Type of crop and growth stage. This willdetermine the percentage of soil cover and theleaf area, which affect crop water use.
2. Evaporation rate. This will be affected by
• Relative humidity
• Wind speed
• Daily solar radiation (UV)
• Air temperature
3. Soil moisture content. This will be affectedby the soil’s :
• Water retention capacity
• Infiltration rate
• Wetting properties
4. Type of sprinkler or emitter used. Forexample, drippers generally have lessevaporation loss than sprinklers.
Irrigation scheduling (WA Dept. of Agriculture, 1990
The efficiency of water application is dependenton the design of the irrigation system, and theway in which the watering program is scheduled.
Irrigation scheduling is deciding time andfrequency of irrigation and how much water toapply.
The aims of irrigation scheduling are to:
1. Replace the water used (transpired) by a cropand that which is lost by evaporation duringapplication.
2. Minimise evaporation losses duringapplication.
3. Maintain adequate soil moisture in the rootzone during growth (day-time), so thatoptimum crop yield is achieved.
4. Avoid applying more water than the croprequires, thus minimising loss of water andnutrients by drainage through the soil belowthe root zone.
Why reliance on experience is not acceptable
Many growers still rely on years of experience todevelop irrigation schedules that produce goodcrops.
However, trials done by the Department ofAgriculture Western Australia have shown thatmany of these schedules, which were developedto maximise yields rather than save water, tendto over-water. Introducing best practices inirrigation scheduling has resulted in watersavings of up to 70 per cent.
Over-watering causes many problems including:
• Inefficient use of applied nutrients by plants.
• Leaching of nutrients into the groundwater andwetlands adjacent to sandy soils.
• Waterlogging and yield losses on heavy soils.
• Wasted water and unnecessarily high pumpingcosts.
The Environmental Protection Authority requiresthat new horticultural enterprises be non-polluting and to ensure this, more reliablescheduling techniques must be used.
The need to upgrade the scheduling of irrigationsystems therefore stems from the joint needs toconserve water, reduce costs, and preserve theenvironment.
❑ For effective scheduling of irrigation, it isimportant to monitor and record both:
• evaporation and
• soil moisture
Evaporation records enable the grower toestimate how much water to apply (replacementrate).
Soil moisture monitoring provides a ‘doublecheck’ as to accuracy of the replacement rate andtells the grower when to apply water and forhow long.
108
SEC
TIO
N 4
By using both evaporation and soil moisturerecords, growers can become very efficient atirrigation scheduling. Neither is sufficient on itsown, but in combination they provide essentialcross checks.
Monitoring evaporation rate
For accurate irrigation scheduling, the growerneeds a local record of evaporation, i.e. dailyrecordings from an evaporimeter on the property,or at least in the local area.
❑ Monitor pan evaporation rate and factor itinto the daily estimation of the quantityand frequency of water application that willbe required.
Average daily evaporation figures are available(Appendix 4.2; Bureau of Meteorology). Theseaverages are only useful as a starting point forestimating evaporation replacement. The actualdaily figures can be more than 60% above orbelow the average, (see Appendix 4.1, whichshows highest and average evaporation figuresfor Perth). It is important to measure and recordevaporation rate on or near the property ratherthan use an average daily figure.
In addition to daily temperature and windconditions evaporation varies according to site-specific influences such as exposure andwindbreaks.
Evaporimeter
Evaporation is measured by an evaporimeter andis essentially millimetres of water lost from thesurface of an open water body. Electronicevaporimeters can be purchased or simple panevaporimeters constructed.
A simple evaporimeter can be made from anycontainer that has a diameter of at least 30 cmand a depth of at least 20 cm. A gauge (plasticruler) is attached to determine the amount ofevaporation in millimetres. A ‘V’ notch cut in theupper edge assures a constant water level whenfilling. Poultry netting should be used to protectthe evaporimeter from birds and animals. Thehome-made evaporimeter may not be sensitiveenough for daily readings. Check local
evaporation figures for these areas to see howthey compare with the home-made evaporimeter.More sensitive electronic evaporimeters can bepurchased
Use of the evaporimeter
For crops grown on sandy soils, read theevaporimeter throughout the year. Droughtsensitive crops such as avocados could sufferfrom water stress, even in winter, after four orfive rain-free days.
On heavier soils, start reading the evaporimeterin late October. A useful guide is to startirrigating after a loss of 25 mm in a week. Eachweek from then on, the evaporimeter should beread and then refilled.
If a pan evaporimeter is used, rainfall will beincluded in the evaporimeter readings and thereis no need to allow for a reduction in irrigationrequirements.
Evaporation rate and replacement rate
The replacement rate, (depth of water requiredto be applied each day in millimetres), is basedon daily evaporation rate. The daily replacementrate is calculated by adjusting the dailyevaporation rate by the following factors:
• A crop factor that takes account of the croptype and growth stage.
• An efficiency factor, which accounts forevaporation losses during irrigation (forsprinkler irrigation). The efficiency factordepends on wind conditions (Table 4.4).
• If the irrigation water has salt levels above 90mS/m, (500 ppm), an extra leaching fractionmay need to be applied (Section 4.3).
Crop factor
For best growth in the Perth region, the cropfactor is about 80 to 150 per cent of themeasured evaporation rates, depending on thecrop type and growth stage. For example, cornneeds (on average) 100 per cent, but this variesby about 20 % each way depending on growthstage. Application needs to increases as leaf area
109
SEC
TIO
N 4
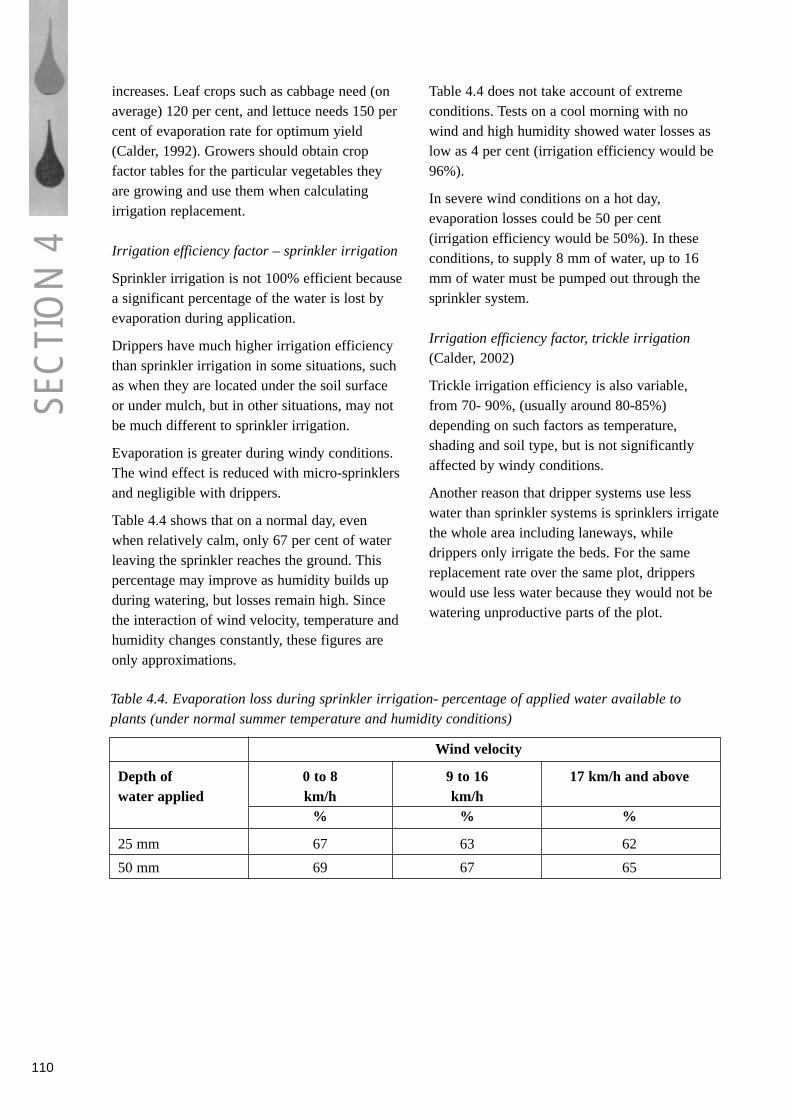
increases. Leaf crops such as cabbage need (onaverage) 120 per cent, and lettuce needs 150 percent of evaporation rate for optimum yield(Calder, 1992). Growers should obtain cropfactor tables for the particular vegetables theyare growing and use them when calculatingirrigation replacement.
Irrigation efficiency factor – sprinkler irrigation
Sprinkler irrigation is not 100% efficient becausea significant percentage of the water is lost byevaporation during application.
Drippers have much higher irrigation efficiencythan sprinkler irrigation in some situations, suchas when they are located under the soil surfaceor under mulch, but in other situations, may notbe much different to sprinkler irrigation.
Evaporation is greater during windy conditions.The wind effect is reduced with micro-sprinklersand negligible with drippers.
Table 4.4 shows that on a normal day, evenwhen relatively calm, only 67 per cent of waterleaving the sprinkler reaches the ground. Thispercentage may improve as humidity builds upduring watering, but losses remain high. Sincethe interaction of wind velocity, temperature andhumidity changes constantly, these figures areonly approximations.
Table 4.4 does not take account of extremeconditions. Tests on a cool morning with nowind and high humidity showed water losses aslow as 4 per cent (irrigation efficiency would be96%).
In severe wind conditions on a hot day,evaporation losses could be 50 per cent(irrigation efficiency would be 50%). In theseconditions, to supply 8 mm of water, up to 16mm of water must be pumped out through thesprinkler system.
Irrigation efficiency factor, trickle irrigation(Calder, 2002)
Trickle irrigation efficiency is also variable,from 70- 90%, (usually around 80-85%)depending on such factors as temperature,shading and soil type, but is not significantlyaffected by windy conditions.
Another reason that dripper systems use lesswater than sprinkler systems is sprinklers irrigatethe whole area including laneways, whiledrippers only irrigate the beds. For the samereplacement rate over the same plot, dripperswould use less water because they would not bewatering unproductive parts of the plot.
110
Table 4.4. Evaporation loss during sprinkler irrigation- percentage of applied water available toplants (under normal summer temperature and humidity conditions)
Wind velocity
Depth of 0 to 8 9 to 16 17 km/h and abovewater applied km/h km/h
% % %
25 mm 67 63 62
50 mm 69 67 65
SEC
TIO
N 4
Salinity (leaching fraction)
If the salt level in the irrigation water is over 90mS/m (500 ppm) and irrigation is by sprinklers,an extra amount of water (leaching fraction) mayneed to be applied to flush water from the rootzone. Refer to Section 4.3 ‘Precautions for theirrigation use of salty water’ for more details, orrefer to detailed handbooks.
For trickle irrigation, a leaching fraction isgenerally not required as long as an adequatewetting pattern is established and maintained. Ifwatering is irregular and the wetted zone aroundthe roots is allowed to contract inwards, saltswill also move into the root zone.
Calculating irrigation replacement rate andtime required for irrigation(Luke, 1990)
Most vegetables are very water-sensitive plantsbecause they have poorly developed and shallowroots. On the sands of the coastal plains, whichhave very poor water holding capacity,vegetables normally need to be watered everyday in summer (except when rainfall is morethan evaporation).
Vegetables are very sensitive to heat stress. Inheat wave conditions they may require morewatering than is indicated. When a cool week isfollowed by a very hot week, extra water shouldbe applied.
Sprinkler irrigation
Evaporation losses from sprinklers duringirrigation must be factored in. The irrigationefficiency, expressed as a percentage of theirrigation water remaining for plant use afterevaporation loss, is approximately as follows:
Night watering 90%Average day 65-85%Very hot windy day 50-60%
Estimates of evaporation losses for differentwind speeds are shown below in Table 4.4.
Calculating the time required for sprinklerirrigation
1. Calculate the precipitation rate (PR). P.R. (mm/min) = (litres/minute/sprinkler)divided by (sprinkler spacing, m lateralspacing, m)
2. Measure the evaporation for the previous dayfrom the evaporimeter.
3. Decide on the replacement rate by applyingthe following factors to the evaporation rate.
• Multiply by the crop factor
• Multiply by 100/ irrigation efficiency (%)in prevailing wind conditions (Table 4.4above).
• Allow extra for salinity if necessary(Section 4.3 ‘Leaching fraction’).
4. Work out the hours or minutes of watering,which is the replacement rate divided by theprecipitation rate.
Example
1. Calculate the precipitation rate (PR):Sprinkler spacing 6 m Lateral spacing between pipes 6 m Litres/minute/sprinkler = 15 PR = 15 divided by (6 multiplied by 6) = 0.42mm/minute.
2. Evaporation for day = 9.2 mm (January)
3. Replacement rate:Crop factor is 140 per cent (lettuces, morethan 25% growth stage) = 1.4 * 9.2= 12.9 mm Wind efficiency factor, expected winds 8 km/hour= 67%100/67 * 12.9= 19.25 mm.The water is less than 90 mS/m conductivityso there is no adjustment required for salinityReplacement rate = 19.25 mm
4. Minutes of watering = replacement rate /precipitation rate=19.25 / 0.42 = 46 minutes
111
SEC
TIO
N 4
Trickle irrigation
Calculating the replacement rate for drippers isdone in the same way as the sprinklercalculations. However, different efficiencyfactors will be applied:
- The efficiency factor will usually be higher(around 80%) and there need not be allowancefor windy conditions.
- A leaching fraction need not be added whentrickle irrigating using water of higher saltcontent.
Calculation of precipitation rate differs slightly:
• Count up the number of drippers per wettedhectare *.
• Precipitation rate (PR) in millimetres per hour(mm/h) = (No. of drippers/hectare multipliedby number of litres/dripper/hour) divided by10,000.
* Note that, unlike sprinklers, which irrigate thewhole area including laneways, dripper systemsonly irrigate the beds. For example, a 1.0hectare vegetable plot has 10,000 drippers,watering 0.8 hectares of beds and there are 0.2hectares of laneways that are not watered. Thisplot has 10,000/ 0.8 = 12,500 drippers perwetted hectare.
On heavy soils, if the dripper irrigation periodsare less than eight hours per day, it is better todouble the time and water every second day.This is because less than eight hours wateringmay not produce a uniform wetting pattern inthese soil types. On sandy soils, which hold lesswater, irrigation will have to be for shorterperiods but more frequent and this will beindicated by the tensiometers.
Minimising evaporation losses
❑ To minimise evaporative losses apply waterduring the coolest time of the day and attimes when there is least wind.
❑ Water early in the morning if usingsprinklers.
This results in the target area being betterserviced by the reticulation system and decreaseswater loss through evaporation. Ideally, the firstirrigation on hotter days should be between 5.30a.m. and 6.30 a.m. Watering before 8 a.m. canalso take advantage of off-peak electricity rates.
From the tables in Appendix 4.3 (Jandakot andManjimup wind velocities), some comments canbe made about the timing of sprinkler irrigationin these areas.
On the Swan Coastal Plain about 20- 25% ofwind is above 20 km/ h at 6 a.m. rising to over40% at 9 a.m. and 70- 85% at 3 p.m. These windconditions greatly reduce the efficiency ofsprinkler irrigation and are a major considerationfor the grower. The best times to water are frompre-dawn to before mid-morning. Higher windvelocities in the afternoon mean that wateringwith sprinklers is inefficient at that time and thatmore water would have to be applied. Howevertensiometer readings usually indicate that mostcrops on the sandy soil types require afternoonwatering because of the low moisture retentioncapacity of the sands. Alternatives to considerare night watering and changing to drippers.
Summer wind velocities in the south west hillsareas are much lower, with only five to tenpercent of the winds being over 20 km/ hour inthe mornings and up to 17 % in the afternoons.This climate is more suitable for sprinklerirrigation. The best time to water is early to mid-morning. Tensiometer readings will indicatewhether more than one watering is required onsandy soil types.
Watering at night presents higher risks ofnutrient leaching occurring particularly on thesandy soils of the Swan Coastal Plain. Plants uselittle water at night and as these soils do not holdwater well, excess water applied will drainrapidly beyond the root zone.
However, it is recognised that it is often too hotor windy to apply sufficient water during theday. Watering at night may also be necessary forfrost control.
112
SEC
TIO
N 4
❑ If watering at night on sandy soils:
• Water lightly (less than 5 mm) and asclose to dawn as possible.
Or
• Have an efficient automated soilmonitoring system that switches thepump off when the soil becomessaturated.
Monitoring soil moisture(WA Dept of Agriculture, 1998)
The physical structure of the soil dictates thereserve of water available to the plants.Watering should aim to provide water to the rootmass, most of which is located in the upper 200millimetres of soil. Water that penetrates belowthis depth is effectively wasted and increases theproblem of nutrient leaching.
Using the methods described above, the growerestimates how much water a crop requires (thereplacement rate). However it is also importantknow how much water is in the soil. Thisenables the grower to:
• Double-check whether the right amount ofirrigation has been applied and adjust thereplacement rate if necessary.
• Determine when to switch the irrigation on andwhen to switch it off. For example, soilmoisture monitoring will show whether asingle daily application or two or three shorterapplications are necessary to provide thereplacement rate required by the crop on theparticular soil type.
To determine the amount of water a crop is usingand whether the frequency of irrigation is right,it is necessary to measure the soil moisturecontent on a regular basis.
❑ Install moisture-detecting sensors withinand below root depth to determine whenirrigation is required and gain anunderstanding of the soil moisture profile.
The maximum time of continuous wateringdepends upon the soil type and the root depth ofthe crop. On sandy soils, prolonged watering
periods result in water draining below the rootzone. It may be necessary to break up theirrigation into several shorter periods
For example, sandy soils requiring 50 mm ofwater replacement in a week may need fourwaterings each of 13 mm during the week.
There are a number of methods used formonitoring soil moisture levels in vegetable andpotato crops:
1. Feel2. Tensiometers3. Capacitance probes4. Neutron probes
Soil moisture monitoring, using one of methods2- 4 should be an integral part of every grower’soperation. Monitoring soil moisture by feel aloneis neither accurate nor efficient enough formodern growing operations.
The large benefits in water, fuel and fertilisersavings, and in yield increases, more than justifythe time and effort needed to set up a soilmoisture monitoring program. The tensiometersand capacitance probes can be set to recordautomatically, and to trigger irrigation. Theserecords can also be stored and analysed on acomputer for record keeping or predicting futurewatering needs.
Feel
Feeling the soil is the oldest method. Holes aredug regularly to determine whether the lastirrigation has penetrated to the correct depth.However, the technique is not accurate andcannot be relied upon as a guide to how muchwater is in the soil, or when the next wateringshould occur.
Tensiometers (Luke, 1998)
Tensiometers consist of a water-filled hollowtube that acts like an artificial plant root. At oneend, buried in the soil, is a porous cup. On theother is a pressure gauge. The tube between thegauge and the cup is filled with water and sealedwith a cap.
113
SEC
TIO
N 4
As the soil dries out, water is sucked from thetube, through the cup. This causes a partialvacuum in the tube and increases the pressurereading on the gauge. The higher the reading, theless water in the soil, and the harder it is for theplant to extract water. After irrigation, waterenters the cup and the vacuum pressure falls.
Tensiometers are relatively cheap, are easy to setup, and are valuable tools for irrigators. They areused in groups, with two or three instrumentsinstalled at different depths making up a ‘station’or ‘nest’. At each station or nest the tensiometersare installed at the top, middle and/or bottom ofthe root zone. For vines and tree crops this iscommonly at 30, 60 and 90 cm respectively. Forvegetable crops tensiometers are commonlyinstalled at 30 and 45 cm.
Initially, buy several sets of two or three, and seethe benefits and cost savings. Then install furthersets in each soil type on your property. This willensure overall watering efficiency, better planthealth, and increased crop yield.
Tensiometers should only be used as an indicatorof when to water. Because of the time it takes forwater to move through some heavier clay soils,even after the correct amount of water has beenapplied, it may take up to 24 hours for the waterto soak down to the cup. In these soils, ifwatering continued until the gauge readingsstarted to decline, over-watering would occur.
Note: For sandy soils, it is essential to usespecial sand tensiometers that have the blue(sensitive) tips. These can detect the very smalldifference in tension (pressure) between wet sandand sand that is too dry for the plant to extractwater.
Preparing for installation
When tensiometers are bought, they must beprepared for installation. Unpreparedtensiometers will not give true readings. Thepreparation varies slightly depending on thebrand. Follow the instructions supplied to ensurecorrect filling, removal of air, and calibration.
Quick draw tensiometers
One other tensiometer on the market is theQuick Draw® type. This is not left inserted inone place but is moved around the field. Afterthe device is set up and adjusted, it is moved toany site where a reading is required. Full detailsof the technique for setting up Quick Drawtensiometers come from the manufacturer withthe device. Note that this technique is notrecommended for gravel soils, which willdamage the instrument when it is continually re-inserted.
Where to install tensiometers
If a tensiometer is to give useful informationabout the availability of water in the soil, it mustbe put in a representative position and installedproperly.
Use the following guide to select the right site:
• Determine the greatest area of similar soil forthe crop. It may be necessary for you to have asoil survey made of the property, to identifythe various soil types.
• Select an area where the plants have averagevigour. A second station should be placedelsewhere in the planting as a check.
• Choose a place to install the station. For shallow-rooted vegetable crops thetensiometer station should be placed in theactive root zone of the plant, directly under thestem of the plant. When the crop is young, oneshallow tensiometer is adequate; as the plantgrows, place a deeper tensiometer at thebottom of the root zone.
• Ensure that the positions selected receive anaverage water application. You must check theoperating pressures, water output and waterdistribution of sprinklers in order to choose thebest possible sites (Farmnote No. 35/90). Donot place tensiometers in localised hollows orexcess water may build up around them.
Installation and maintenance
Installation of tensiometers is best done whenthe soil is moist, preferably two or three days
114
SEC
TIO
N 4
after irrigation. Refer to Appendix 4.5 forinstallation and maintenance of tensiometers.
Interpreting tensiometer readings
A tensiometer measures how hard the rootsystem of a plant must work to extract water forits needs. It directly measures the ‘soil matricpotential’, which is the physical force that theroot system must overcome to free the waterfrom the grip of the soil particles.
All tensiometers read in centibars (cb). Onehundred centibars equals one bar. The higher thereading on the gauge, for example 40 cb, theharder it is for the plant to extract water from thesoil. The lower the reading, for example 10 cb,the easier it is for the plant to extract water fromthe soil.
Most of the water in the soil available for plantgrowth occurs as a thin film on the soil particlesor as droplets within the soil pores. The amountof water held in pores one to two days after anirrigation is known as field capacity.
At field capacity, tensiometer readings can rangefrom six cb to 10 cb for sandy soils, and 10 cb ormore for the heavy-textured soils. Readings lessthan field capacity indicate that the soil issaturated.
Because soils vary widely, a tensiometer readingbetween 25 cb (in light-textured soils) and 60 cb(in heavy-textured soils) tells you that it is timeto irrigate. High tensiometer readings such asthese show that the soil moisture has beendepleted to a level where the crop could bestressed and needs water.
When to take readings
Ideally, take tensiometer readings at the sametime each day, in the early morning. Thefrequency of readings depends on the soil type.
• In heavy soils, read tensiometers just before anirrigation and one or two days after theirrigation. In addition, read the tensiometers asnecessary between irrigations, to help indeciding the timing of the next irrigation.
• In light soils, take daily readings.
In spring, summer and autumn, crop water use isrelatively high, and the soil dries out morequickly. During these seasons, take tensiometerreadings more often. For example, for sprinkler-irrigated tree crops in sandy soils, take readingseach day. For vines on loamy soils, readingstaken two or three times a week are usuallyenough.
Weekly reading of the tensiometers duringwinter is a way of detecting waterlogging.Consistently low readings would indicate thatthere may be a waterlogging problem and a needfor drainage or other remedial action.
How to record the readings
Enter tensiometer readings in a notebook ordiary with the rainfall and irrigation amounts anddates.
It is important to identify the location oftensiometer stations or nests, by recording avalve or site number, the depth of thetensiometer being read, and the date and time oftaking the reading.
Plot tensiometer readings on graph paper. Agraph provides the best picture of the changes insoil moisture levels.
Tensiometer records
The tensiometer readings (in centibars) with thedate and time should be recorded in a notebook.These readings can be graphed, to help in theinterpretation of the data.
The vertical scale of the graph represents therange of tensiometer readings from 0 to 80 cb.The horizontal scale represents time in days.
Record the date of each irrigation with an arrowabove the graph. Also record above the arrowthe time in hours and the amount of waterapplied during, or the amount of rainfall.
Draw in horizontal lines to show the desirablerange of tensiometer readings, about 10-40centibars. Irrigating to keep the readingsbetween these lines will maintain the plants in anunstressed or minimal stress condition.
115
SEC
TIO
N 4
Refer to Appendix 4.6 for an example ofgraphing and interpreting tensiometer readings.
Points to remember
• The tensiometer with the readings that rise themost rapidly (usually the shallow one)determines when the next irrigation is due.
• The deepest tensiometer helps to determine thecorrect depth of irrigation. If this tensiometerindicates that the soil is wet below the rootzone, too much water is being applied.
• Do not change your irrigation practicedrastically. Monitor the readings for a period;dig holes with a shovel or a 100 mm auger,and follow your irrigation through the soiluntil you gain confidence in the tensiometerreadings. This may take several irrigationcycles.
• It is not possible to set out instructions onwhen to irrigate for all crops, soils, methods ofirrigation and climatic conditions. However, byplotting your tensiometer readings and keepingthem within the desirable range you will gainconfidence in using these instruments and willbe able to decide when to irrigate and howmuch water to apply.
• Soils with water infiltration or hard panproblems can present difficulties ininterpreting tensiometer readings. A growermight apply sufficient water to wet the soil tothe porous cup and yet there could be nochange to a tensiometer reading.
It is possible that the water did not enter the soil(poor infiltration), ran off to a non-target area or,if it soaked in, was held up by a subsoilcompaction pan. Investigation of the problemwould be needed.
Neutron probes
A neutron probe is a radioactive source andreceiver lowered down monitoring holes in thefield. The radioactive source emits neutrons,which are reflected off water in the soil, back toa receiver. This produces a digital count readout,which is converted to a moisture content bycalibrating the site.
This technique is widely used for irrigationscheduling. It has been used as a research toolfor many years, but has been developed into anon-farm system only in the last few years. Themajor disadvantages of the system are theradiation hazard, the insensitivity of the methodnear the soil surface, and a cost of $ 10,000 to$14,000 for the equipment. It is generally notused for potatoes as tubers close to the probe cancause erroneous readings.
Although quite a few growers have purchasedunits, many now rely on an irrigation schedulingservice that uses a neutron probe. These arerelatively cheap, and in recent years the numbershave grown rapidly. Such a service removes theneed for the grower to buy a machine, get alicence to own and operate it, and learn how tooperate the system.
Capacitance probes
Recent developments of capacitance probes, afairly old system, offer good potential. Thesedevices, like gypsum blocks, use electricalmeasurements to estimate water content. Unlikegypsum blocks they are not affected by soil saltsand do not dissolve with time. Some systems useseveral of these probes, wired to a data logger orcentral computer. This technique is in use incommercial crops around Australia, but it is stillnot perfected for use on vegetable crops onsandy soils in Western Australia.
Avoiding over-irrigating
Over-irrigating is a major potential cause ofnutrient leaching on sands. The hydraulicconductivity of sands increases 20-fold when thesand is completely wet and at this point, excesswater applied leaches rapidly beyond the rootzone. (Calder, T, 2002)
❑ Use an efficient and accurate method of soilmoisture monitoring, particularly on sandysoils.
❑ Ensure that irrigation is stopped beforewater infiltrates past the root zone.
At least two probes should be installed at eachstation at different depths to give an
116
SEC
TIO
N 4

understanding of the soil moisture profile. Theprobe location should be based on the depth ofthe root system and include monitoring justbelow the root zone. The effect of moisture onthe vegetable quality can also be assessed byfactors such as appearance (wilting).
Over-irrigating on heavy soils may saturate thetopsoil and cause run-off, nutrient loss anderosion. Run-off during irrigation may also bean indication that the application rate of thesprinkler system is too high for the soil type.
❑ Ensure that irrigation is stopped beforewater runs off the soil surface.
Rainfall should be deducted from the amount ofwater applied and, on some occasions, theirrigation system may be switched off. Soilmoisture monitoring will be necessary todetermine when the watering should be restarted.This can save water (and money), reduce theleaching of nutrients to the environment andimprove the growing conditions for thevegetables.
❑ Deduct rainfall from the amount of waterapplied.
4.3 Manage salinity of irrigationwater
The total amount of minerals in solution inwater, the total soluble salts (TSS), mainlydetermines the suitability of water for cropirrigation. Other criteria are generally ofsecondary importance.
Measuring salinity (Department of Agriculture Western Australia,1990)
TSS mainly determines the suitability of waterfor irrigation. The types of salts in water arecommon salt (sodium chloride), calcium andmagnesium bicarbonates, chlorides andsulphates. Sodium chloride is usually about 75%of the total, a ratio similar to sea water.
TSS is most easily measured by the electricalconductivity of the water, quoted as units ofmillisiemens per metre (mS/m). Multiply the
conductivity (mS/m) by 5.5 to convertapproximately to milligrams per litre (mg/L)concentration. Multiply the conductivity by0.385 to convert approximately to the old unit,grains per gallon.
Samples for analysis of salt content
Samples of 500 mL can be sent in glass orplastic bottles to laboratories or the Departmentof Agriculture WA to be analysed for a small fee.Use a clean screw cap, cork or stopper to sealthe bottle, and mark the bottle itself with thesender’s name and address, and the date ofsampling.
Alternatively growers can purchase a pocketconductivity meter from instrument companiessuch as Perth ScientificTM for around $200. Theycan do EC testing of samples themselves, but theresults will only be as accurate as the calibrationof the meter.
Iron
Many groundwaters contain iron. It blockstrickle irrigation lines and pumps with depositsof reddish brown hydrated iron oxide. For smallscale uses, iron can be removed by aeration andsettling.
Corrosion
Metallic corrosion increases with the TSS andacidity of the water. To assess the corrosivenessof water, particularly undergroundwater, specialtechniques are required to make sure the sampleis obtained without loss of dissolved gases.Before taking samples, seek advice from theChemistry Centre of WA.
The only method to reduce corrosion bygroundwater is to use resistant materials such asplastic piping and protective coatings on tanksand bronze or stainless steel for pumps.
Water quality for irrigation(Lantzke and Calder, Agriculture WesternAustralia, 1999)
Irrigating crops with water of salinity higherthan the plant can tolerate will result in yieldloss and may decrease crop quality. Salty
117
SEC
TIO
N 4
irrigation water can affect plant growth in twoways:
- Osmotic effect – Salts concentrate in thetopsoil due to evapo-concentration. Thiscreates osmotic stress, which makes it moredifficult for the plant roots to extract waterfrom the soil.
- Chloride and sodium toxicity – These ions canbe taken up either by the roots or by directcontact with the leaves and can be toxic toplants.
Generally, 635 mS/m (or 3500 mg/L) of totalsalts is regarded as the maximum for safewatering of any plants. With this salt content,drainage must be excellent and each wateringshould apply enough water to leach accumulatedsalts below the roots of plants. Most vegetableswill suffer yield losses when the salt levels in theirrigation water reach 100-200 mS/m.
❑ Test the irrigation water at the end ofsummer and select crops that can toleratethe salt levels without unacceptable yieldloss.
The suitability of water for irrigation isinfluenced not only by the total soluble salts andtheir composition, but also by:
• type of soil and drainage.
• climate (rainfall and evaporation), the croptype.
• method and management of irrigation.
In general when sprinkler irrigating with waterof salinity > 90 mS/m (groups B and C in Table4.5), growers need to take specific managementprecautions (see ‘Precautions for the irrigationuse of saline water’ below).
Salt tolerance of vegetables
Most vegetables are moderately to highly saltsensitive so irrigation water of good quality isrequired. Seedlings are more sensitive to saltthan mature plants.
Table 4.5 below lists the salt tolerance ofvegetable crops according to water conductivitygroup. These figures are estimates only (plus orminus 10%), based on sprinkler irrigation on awell-drained sandy loam to loam soil, with about15% of the water applied percolating below theroot zone.
The guidelines are too restrictive for dripirrigation, which is applied for longer periods,reducing salt concentration in the root zone. Inaddition, increases in salinity due to evaporationare generally less with drip irrigation.
118
SEC
TIO
N 4

Table 4.5 Tolerance of vegetables to total salts in irrigation water(adapted from Lantzke and Calder, 1999)
Water group and Precautions for Group Suggested EC (mSconductivity(EC) irrigation use plants /m) causingin (mS/m) 10% yield
reduction
A. 0-90 Avoid wetting leaves Highly salt bean 100on hot dry days. sensitive parsnip 90
lettuce 140onion 120carrot 130radish capsicum 150
B. 90-270 Avoid wetting leaves Mildly salt cucumber 220during daytime, avoid sensitive sweetcorn 170light frequent waterings rock melon 270and water quickly using potato 170continuous wetting cabbage 190sprinklers. water melon 240
broccoli 260Application of additional cauliflower 270water (leaching fraction) pumpkin 270may be needed. tomato 230
spinach 230
C. 270-635 Avoid wetting of leaves Slightly salt asparagus kaleof most plants where sensitive garden beetspossible. Adequate 340leaching necessary. Only irrigate on well-drained soils.
Application of additional water (leaching fraction) will probably be needed.
Note: Multiply mS/m by 5.5 to give parts per million (ppm) or milligrams per litre (mg/L)
119
SEC
TIO
N 4
Precautions for the irrigation use of saltywater(Lantzke, 1999)
❑ When the irrigation water has conductivity90 – 635 mS/m and there is no fresherwater supply:
• Maximising irrigation efficiency by minimising evaporation is of primeimportance.
• Dripper systems under plastic mulch arethe best irrigation option when using saltywater.
• Avoid irrigating on heavy or poorly drainedsoils.
• Application of more water may benecessary to flush salts from the root zone.
It is important to reduce evaporation if usingsalty water for sprinkler irrigation. Water justbefore dawn, early in the morning or lateevening when the air is more humid. Watering inthe heat of the day concentrates the salts, due tothe high evaporation. Watering during highwinds also concentrates salts.
• If using sprinklers, water using continuouswetting sprinklers and avoid light, frequentwatering during hot weather.
• Keep the water off the leaves to avoidburning.
Avoid wetting leaves during daytime and do notuse sprinklers that produce fine droplets. Lowpressure systems – drippers and low-pressuremicro-sprinklers – are generally the best forminimising evaporation. Avoid intermittentsprinklers if possible, especially slow revolutionsprinklers, which allow drying periods, causingsalt to build up on the leaves.
When watering with saline water, closelyobserve the growth and condition of plants orherbage. Saline water can cause considerableyield loss before symptoms of leaf burn becomeobvious.
• Monitor the soil conductivity in andbeneath the root zone and take actionbefore salt accumulation becomes aproblem.
To do this it will be necessary to dig holes atdifferent locations, and take soil samples downthe profiles, the deepest sample being takenbelow the root zone. The heavier soil types inthe paddock are likely to show salt accumulationfirst and it is these that should be sampled. Thesoil can be tested quickly in the field using theEC 1:5 method (Section 2.4 ‘Measuring soilsalinity’), using a pocket EC meter andrainwater.
The more salty waters can be used moresuccessfully on a well-drained light soil than ona poorly drained heavy soil, and also in districtswhere high seasonal rainfall leaches the saltsaccumulated in the soil. In well drained, sandysoils irrigation water can readily flush salts outof the root zone.
Leaching fraction
The stringent use of water to prevent waste andleaching may cause a salt build up in the soilwhen sprinkler irrigating with salty water. Extrairrigation may be necessary when usingirrigation water of conductivity groups B and C(90- 635 mS/m). The amount of extra waterrequired to leach salt from the root zone is calledthe leaching fraction. The amount of leachingrequired to maintain acceptable growth dependson:
- The salt content of the irrigation water
- The salt tolerance of the crop
- Climatic conditions
- Soil type
- Irrigation method and management
For example, a leaching fraction of 20% or moremay be required for heavier soils when irrigatingwith sprinklers, using water with salt levels inthe higher range (Group C in Table 4.5).
A leaching fraction is not required for drippers,as long as an adequate wetting pattern isestablished and maintained. Hence it is betterpractice to irrigate by drippers rather thansprinklers when using water that has high saltcontent. (Calder, 2002).
120
SEC
TIO
N 4
Caution re leaching(BEMP Manual Editorial Committee, 2002).
Applying extra irrigation to increase leachingof salts will also increase the risk of leaching offertilisers. It is the grower’s responsibility tominimise leaching of nitrogen and phosphorusinto groundwater and surface water resources.In areas where this may be a problem, growersneed to take special care to:
- Avoid using water with higher salt levelswhere possible and thus avoid the need toincrease the leaching fraction.
- Use trickle irrigation where possible.
- Manage irrigation efficiently (as described inSection 4.2).
- Manage fertilisers efficiently (as described inSection 3).
Corrosion of pumps and metallic components
Metallic corrosion increases with the total saltcontent and acidity of the water. To assess thecorrosiveness of water, particularly groundwater,special techniques are required to make sure thatthe sample is obtained without loss of dissolvedgases. Contact the Chemistry Centre of WesternAustralia (telephone 9325 5544) for details.
The only method to reduce corrosion bygroundwater is to use resistant materials, such asplastic piping and protective coatings on tanks,and bronze or stainless steel for pumps.
References
Agriculture Western Australia, 1995. Wateringrequirements of vegetables grown on sandy soils.Farmnote No. 66/95.
Anonymous (1990). International Standard ISO7749-2. Irrigation Equipment – Rotatingsprinklers Part 2: Uniformity of distribution andtest methods.
Bureau of Meteorology, 2002. Wind andevaporation records supplied on request.
Calder, T., (1992). Efficiency of sprinklerirrigation systems. Department of AgricultureWestern Australia Farmnote No. 48/92.
Calder, T. and Burt, J., 2001. Selection ofFertigation Equipment. Agriculture WAFarmnote 35/2001.
Calder, T., 1987. Selecting pipes for the farm.Department of Agriculture Western AustraliaFarmnote No. 65/87.
Calder, T., 2002. Pers. comm. Irrigation researchofficer, Department of Agriculture WesternAustralia.
Clemson University, USA, Regulatory andPublic Service Programs, 2001. ChemigationRegulations.
Gupta, K., Lantzke, N. and McPharlin, I., 2001.Evaluating sprinkler performance under windyconditions. ‘WA Grower’ , September, 2001.
Lantzke, N. and Calder, T., 1999. Water salinityand crop irrigation. Agriculture WesternAustralia Farmnote.
Luke, G., 1990. Scheduling for trickle, sprinklerand flood irrigation. Department of AgricultureWestern Australia, Farmnote No. 22/90.
Luke, G., 1998. Soil moisture monitoringequipment. Agriculture Western AustraliaFarmnote.
Luke, G.,1998. Tensiometers- preparation andinstallation. Agriculture Western AustraliaFarmnote.
Oliphant, J. C., (1999). SPACE ProTM SprinklerProfile And Coverage Evaluation. CaliforniaAgricultural Technology Institute, Publication#991003.
Rose, B., 1997. Preventing Erosion and SoilStructure Decline, a Soil Management PracticesGuide for Horticultural Farmers in the southwest High Rainfall Hills, Agriculture WesternAustralia miscellaneous publication 23/97.
Solomon, KH., 1990. Sprinkler Uniformity.California State University Centre for IrrigationTechnology, Irrigation Notes.http://www.atinet.org/newcati/cit/rese
Timebase Victorian Legislation, 2002.Agricultural and Veterinary Chemicals (controlof use) Regulations, 1996- ChemigationEquipment.
121
SEC
TIO
N 4

APPENDIX 4.1
Average daily evaporation rates
Table 3. Evaporation (mm) from a Class A pan evaporimeter at Perth, in relation to average and highwind speeds.
Wind velocity Jan Feb Mar Apr May Jun Jul Aug Sep Oct Nov Dec
Average for month 273 249 210 119 80 61 60 70 100 149 197 261
Highest for month 326 262 242 133 96 59 64 82 121 172 240 290
Average daily 8.8 8.9 6.8 4.0 2.6 2.0 1.9 2.3 3.3 4.8 6.6 8.4
Highest day 13.7 12.4 10.6 7.7 6.8 5.9 3.7 4.8 7.4 9.4 11.6 10.6
Department of Agriculture Western Australia,1982. Pumping water on the farm. Farmnote no.17/84.
Department of Agriculture Western Australia,1982. Water quality for home and garden.Farmnote No. 2/82.
Department of Agriculture Western Australia,1990. Evaluating sprinkler and trickle irrigationsystems. Farmnote No. 35/90.
Department of Agriculture Western Australia,1990. Irrigation scheduling, how and why.Farmnote No. 23/90.
Department of Agriculture Western Australia,1990. Soil moisture monitoring equipment.Farmnote No. 26/90.
122
SEC
TIO
N 4

123
APPENDIX 4.2
Average daily evaporation rates for vegetable growing areas in WA(Bureau of Meteorology, 2002)
Average daily evaporation mm
Month Kununurra Carnarvon Geraldton Gingin Upper Swan Month
Jan 11.5 11.6 10.5 10.6 10.5 JanFeb 11.3 12 10.6 10.6 10 FebMar 9.9 10.1 8.4 8.4 7.8 MarApr 7 6.9 5 5 4.5 AprMay 5.4 4.9 3.1 3.1 2.9 MayJun 3.9 3.4 2.2 2.2 2.1 JunJul 4 2.9 2 2 1.9 JulAug 4.8 3.6 2.9 2.9 2.8 AugSep 5.7 4.7 3.8 3.8 3.7 SepOct 8.2 7 5.6 5.6 5.2 OctNov 9.5 9.3 8 8 7.4 NovDec 9.7 11.8 10.4 10.4 9.8 Dec
Average daily evaporation mm
Month Perth Medina Donnybrook Manjimup Pemberton Month
Jan 8.5 8.8 7.1 6.8 5.8 JanFeb 8 8.8 6.7 6.2 5.5 FebMar 6.5 6.8 4.8 4.8 4.3 MarApr 4 4 2.8 2.9 2.5 AprMay 2.5 2.6 2 2.1 1.8 MayJun 2 2 1.6 1.6 1.7 JunJul 1.5 1.9 1.6 1.8 1.7 JulAug 2 2.2 2 1.9 1.9 AugSep 3 3.3 2.4 2.6 2.3 SepOct 4.5 4.8 3.5 3.2 2.9 OctNov 6.5 6.6 5 4.8 4 NovDec 8 8.4 6.5 6.4 5.3 Dec
SEC
TIO
N 4

APPENDIX 4.3
Table A4.3a.Wind velocities for Jandakot(Bureau of Meteorology, 2002)
Percent of the time that the wind speeds occur
Wind velocity Jan Feb Mar Apr May Jun July Aug Sep Oct Nov Dec4.30- 7.30 am
Calm 6 4 9 12 14 17 12 17 19 13 10 7
1 to 10 km/h 26 21 28 42 36 39 36 37 38 38 29 25
11 to 20 km/h 45 52 43 34 36 31 36 32 32 33 39 42
21-30 km/h 22 23 19 11 11 10 13 11 8 14 20 24
Above 30 km/h 1 0 1 0 2 3 3 3 3 1 1 1
Prevailing E,S, E,S, E,SE, E,SE, E,NE, NE,N, E,N, NE,E E-N E,s, E,S, E,S,
directions SE SE S S N E NE SE SE SE
Wind velocity 7.30- 10.30 am
Calm 2 4 3 7 18 20 15 10 9 5 1 1
1 to 10 km/h 12 13 15 25 31 30 26 28 20 21 16 14
11 to 20 km/h 42 41 38 38 32 29 37 38 45 39 41 43
21-30 km/h 39 39 39 27 17 16 15 20 21 29 37 35
Above 30 km/h 4 4 4 3 3 4 7 4 6 6 4 6
Prevailing E,S, E,SE, E,SE E,NE E,NE NE,N N,NE NE,N, N,NE, E E E,S,
directions SE NE E E SE
Wind velocity 1.30-4.30 pm
Calm 0 0 0 1 2 2 2 0 0 0 1 0
1 to 10 km/h 3 2 7 10 18 14 14 9 5 3 3 2
11 to 20 km/h 12 23 31 45 48 50 42 42 37 21 13 12
21-30 km/h 70 65 57 40 26 26 29 39 46 66 73 74
Above 30 km/h 15 10 5 4 6 9 13 9 12 9 10 12
Prevailing SW,W SW,W SW,W W,SW W W,N W,N W W,SW SW,W SW,W SW,W
directions
124
SEC
TIO
N 4

125
APPENDIX 4.3
Table A4.3b Wind velocities for Manjimup (Bureau of Meteorology, 2002)
Percent of the time that the wind speeds occur
Wind velocity Jan Feb Mar Apr May Jun July Aug Sep Oct Nov Dec 4.30- 7.30 am
Calm 4 4 3 3 3 0 3 0 0 3 3 2
1 to 10 km/h 25 36 48 43 45 38 45 39 47 51 33 45
11 to 20 km/h 69 61 48 50 48 58 42 52 37 36 58 48
Above 20 km/h 2 0 0 3 3 4 10 10 17 10 5 5
Prevailing E-S E-S E-S N,E N-E N,NW N,NE N,NW, N-W, E,SE, NE,E E,SE
directions SW SW S
Wind velocity 7.30-10.30 am
Calm 15 13 14 23 27 27 27 24 18 13 12 14
1 to 10 km/h 51 54 57 58 57 55 56 53 55 54 54 54
11 to 20 km/h 23 23 21 13 11 11 12 16 19 22 22 23
Above 20 km/h 7 10 9 7 4 6 5 8 9 11 12 9
Prevailing E-S SE,E, E-S, ALL N,W NW,N, NW,W, NW,W, W-N NW-S S-NW S,SE,
directions NE,S NE NW W N N E
Wind velocity 1.30- 4.30 pm
Calm 10 11 12 16 16 13 14 12 11 9 9 11
1 to 10 km/h 48 50 53 54 57 56 54 50 51 50 49 46
11 to 20 km/h 27 26 22 19 17 20 20 23 24 27 25 26
Above 20 km/h 15 12 13 12 9 11 12 16 14 14 17 17
Prevailing S,SW, S,SE, S,SE, S,W, NW,W, NW,W, NW,W, NW,W, W,NW, S,SW, S,SW, S,SW,
directions SE SW SW SW SW SW SW SW SW W W SE
SEC
TIO
N 4

APPENDIX 4.4
Effect of wind on sprinkler distributionuniformity
Figure A4.5 below shows the performance ofsprinkler HR46C double nozzle (4.76mm x3.2mm) under increasing wind conditions. Thissprinkler is suitable for spacings of 12m x 12mand 14m x 14m in square configuration, as the
DU is still greater than 75% at a wind speed of15 km/ hr. This configuration would be suitablefor most properties located in windy areas. Thesprinkler spacing of 15m x 15m may be usedwith caution only. As wind speed increasesabove 11.0 km/hr the DU drops below 75%. Thedistribution uniformity at 16m x 16m spacing(dotted line) is only acceptable at wind speedsup to 10.0 km/hr.
126
Fig. 4.1Effect of wind speed on distribution uniformity (DU %) and scheduling co-efficient (SC)
90
85
80
75
70
65
60
55
50
DU%
3.0 5.0 7.0 9.0 11.0 13.0 15.0
4
3.8
3.6
3.4
3.2
3
2.8
2.6
2.4
2.2
2
1.6
1.4
1.2
1
SC
Wind Speed, km/hr
HR DOUBLE NOZZLE 4.76 x 3.2 mm
Acceptable SC Level
SC CURVES
DU CURVES
16x16
16x16
12x12
12x12
14x14
14x14
15x15
15x15
SEC
TIO
N 4

127
APPENDIX 4.5
Installation and maintenance of tensiometersEquipment needed for installation
Obtain the following items to ensure thetensiometers are installed correctly:
• sets of Irrometers (or equivalent) to givemeasurements at the top, middle and bottom ofthe root zone (usually 30,60 and 90 cm)
• a service kit that includes a hand vacuumpump and instruction booklet
• boiled rainwater
• cloth for wrapping the cup
• a l3 mm hand auger, made by welding a l3 mmcoring bit on to a piece of steel rod
• a coring tool made from a one metre length ofl3 mm water pipe
• a white painted post to mark the position of thestation, so that tractor operators and pickerscan see it
• Rain gauges.
Installation
Using the auger, start digging at a slight angle.Keep checking the depth by placing thetensiometer in the hole. Stop digging when thereis about 10 cm between the bottom of the gaugeand the soil surface.
Having augered to the required depth, carefullyinsert the coring tool into the hole, centre it, andthen hammer it down a further seven cm.Remove the coring tool containing the soil core.
Place the cup of the tensiometer in the mouth ofthe cored hole. Force the cup into the hole bypushing directly down on the cap. Do notwobble or rotate the tensiometer shaft and do notpush on the gauge. When the cup of thetensiometer is properly positioned there must beit least three centimetres between the bottom ofthe gauge and the soil surface. If there is lessthan three centimetres or if the tensiometer canbe easily rotated, the installation should bestarted again in a fresh hole.
When you are satisfied with positioning the cup,place a small amount of water into the bottom ofthe hole and allow it to soak in. This helps thecup to make contact with the soil.
In gravelly soils it may be necessary to make alarger hole. Soil from this larger hole should belaid on the plastic sheet in the order in which itis removed.
Remove all gravel stones from the soil. If thestones are not removed, they will jam against theside of the tensiometer, causing air pockets toform. These air pockets can cause air to enter theporous cup, or hold more water than thesurrounding soil, leading to false readings.
The coring tool can still be used to finish thehole, which is again watered before thetensiometer is inserted and soil replaced.
Start replacing the soil around the tensiometerusing material from the bottom of the hole first.Every few handfuls, tap down the soil with theflat top of the coring tool or some other suitabletool. Continue repacking to the surface, finishingwith the topsoil to ensure that the original orderof soil layer is maintained.
Remove the cap and insert the hand vacuumpump. Apply a suction of about 60 centibars onthe gauge, for at least 15 to 20 seconds, whiletapping the side of the tensiometer. This removesair bubbles trapped in the instrument.
Slowly release the lip of the vacuum pump andreplace the cap and stopper. Screw the cap downuntil the rubber stopper just touches the base ofthe reservoir, then apply another quarter of aturn.
Install the white marker post near thetensiometers so that the site is clearly visible.
Install a rain gauge with every set oftensiometers in sprinkler irrigated crops torecord water application. Ensure that the raingauge does not ‘shade out’ the tensiometers.
SEC
TIO
N 4

Maintenance
Under normal use, air bubbles form in the watercolumn just below the stopper, resulting inincorrect gauge readings. To remove them,service tensiometers about every two weeks insummer and every month in winter.
• Remove the cap and stopper by holding thereservoir and gauge in one hand andunscrewing the cap with the other. Thisprocedure stops the tensiometer from rotatingin the soil.
• Jet-Fill tensiometers can be topped-up bypushing the plunger on the top of the reservoir.
• Top-up the water reservoir with boiledrainwater that has cooled.
• Remove air bubbles with the hand vacuumpump by applying and holding the suction atabout 60 centibars on the gauge for at least 15to 20 seconds, while tapping the side of thetensiometer.
• Slowly release the lip of the vacuum pump.
• Before replacing the cap check that its rubberstopper has not become flattened or perished.If so, replace it. Then replace the cap.
128
APPENDIX 4.6
Graph and interpretation of tensiometerreadings
The graphs in Figure A4.6 - Plotting tensiometerreadings show typical changes in tensiometerreadings. A tensiometer station or nest normallyconsists of three tensiometers, but for easier
interpretation, the readings from only two havebeen plotted.
The following interpretations were made on thechanges in the readings that lie below the labelssuch as ‘Comment 1’ on the graph. Look at thegraph first, then read the relevant comment inthe text overleaf.
50
40
30
20
10
00 5 10 15 20 25 30 35 40
rang
e cf
tens
iom
eter
rea
ding
s(c
ent b
ars
of s
uctio
n)
Comment 1 Comment 2 Comment 3 Comment 4 Comment 5 Comment 6
irrigation irrigation irrigation irrigationrainfall
10 h 10 h 20 mm 5 h 10 h
field capacity
Shallow tensiometerDeep tensiometerProjected trend
time to irrigate
time (days)
Figure A4.6 Plotting tensiometer readings
SEC
TIO
N 4
129
Comment 1
Tensiometer readings were increasing right up towhen the 10 hour irrigation (in this case, 65 mm)started. Note how quickly the tensiometerreadings fell when water reached the porous cupof both the deep and the shallow tensiometers.This indicates that the entire root zone waswetted.
In some soils, such as at Carnarvon, it may takemore than 24 hours for the water to reach thedeeper cup. The actual time for the water toreach the deeper cup and the amount of waterapplied will vary from property to property.
Comment 2
A 10 hour irrigation was applied. This wascompletely unnecessary, since the tensiometerreadings were still low, showing that topsoil andsubsoil were wet enough for plants to obtainwater.
Comment 3
Rainfall at this time slowed the rate of increasein tensiometer readings and delayed the need forirrigation.
Comment 4
The readings of the shallow tensiometer began toincrease rapidly and a short (five hour) irrigationwas applied to re-wet the upper root zone but notthe deeper root zone, which was still wetenough. The irrigation did not penetrate deepinto the root zone and the water did not reach thedeep tensiometer, so its readings continued torise.
Comment 5
The readings of the shallow and the deeptensiometers have increased, showing that a 10hour irrigation was needed to re-wet the entireroot zone. Immediately after the irrigation, bothtensiometer readings fell, showing that theirrigation was adequate but not excessive.
Comment 6
By observing the slope of the line produced byjoining the plotted tensiometer readings, andreferring to earlier irrigation cycles, it is quiteeasy to project ahead the number of days beforethe next irrigation is needed (see the dottedlines).
Of course, hot weather or a sudden rainfall willalter the projected trend. In these cases, thedecision when to irrigate will have to be basedon further tensiometer readings.
SEC
TIO
N 4

130
SEC
TIO
N 4
This plastic ‘rotator’ sprinkler type used at close spacing delivers a goodcombination of low application rate and acceptable performance inmoderate wind conditions.
Centre pivot irrigators are cost efficient and suitable for large areas ofeven terrain.


Water Resource ManagementSE
CTI
ON
5
This section contains information and bestenvironmental practices relating to:
1. Protecting the water quality and biodiversityvalues of surface water resources:
- How to manage riparian areas.
- How to establish vegetated buffer stripsaround surface waters to trap sediments.
- Factors that influence risk of chemicalcontamination of water resources, includinga table listing risk factor values for variouscommon pesticides.
2. Protecting the quality of groundwaterresources:
- Nitrates in groundwater.
- How to monitor the quality of bore water.
It refers to other sections of the BEMP Manualfor fuel and chemical storage, soil, irrigation,and biodiversity management techniques, whichare also crucial to maintaining good waterquality.
5.1 Minimise nutrients enteringsurface and groundwaters
Sources of nutrients and chemicals
Export of nutrients and/or chemicals is theprocess by which they move through (leach) andover soils dissolved in water or attached to soilparticles, and contaminate water resources. Onvegetable and potato cropping sites , nutrientsand chemicals are mainly exported from diffuse(extensive, non-concentrated) sources. The maindiffuse sources of nutrients and chemicals are(Moore,1998.):
- Fertilisers applied to crops are the source ofthe majority of nutrients exported from mostoperations.
- Animal wastes (if livestock are run on theproperty), particularly if streams are not fencedand stock can defecate and urinate in the water.
- Leguminous pastures, such as clovers are adiffuse source of nitrogen.
- Chemicals sprayed onto crops (Section 5.5).
Point sources, where high concentrations aregenerated at a particular point, can also accountfor a significant portion of the nutrients and/orchemicals exported. Manure heaps, waste heaps,fertiliser storage areas, waste from processingand septic tanks can be point sources of nutrients(Sections 3.2 and 9.1). Potential point sources ofchemical pollution are storage facilities andaccidental spills (Section 5.5).
Export of nutrients can be minimised by:
- Minimising leaching (Section 3.1)
- Minimising soil erosion (Section 2.1)
- Minimising nutrients in drainage(Section 2.3)
- Accurate placement of fertilisers (Sections 3.2, 4.1- Fertigation, 4.2).
Minimising leaching
Applying too much fertiliser, inaccurateplacement of fertiliser and poor timing ofapplication are major causes of leaching.
❑ Conducting best practice to avoid applyingfertiliser in excess of crop and soilrequirements is of prime importance inminimising leaching (Section 3.1).
If irrigation water is applied at a faster rate thanthe crop uptake and evaporation it will either runoff the surface and into waterways, or infiltratepast the root zone to the water table, carryingdissolved nitrogen and other nutrients.
❑ Irrigate according to crop needs andevaporation (Section 4.2).
Unacceptably high concentrations of nitrogenand phosphorus have been measured in sub-catchments with wet grey sandy soils in theEllen Brook, Peel and Scott River catchments.Poor fertiliser practice associated with cultivatedhorticulture has proved to be a majorcontributing cause of this.
132

SEC
TIO
N 5
❑ When cropping wet sandy sites, take specialcare in planning a fertiliser strategy(Sections 3.1 and 3.2).
Soil amendments such as clays and red mud‘alkaloam’ reduce leaching of nutrients byimproving soil nutrient retention and reducingwater repellence.
❑ Consider applying soil amendments to lightsandy soils (Section 2.2).
There are also risks of nutrient leaching fromactivities and facilities that concentrate nutrientrich materials such as manure heaps, septic tanksand fertiliser storage.
❑ In relation to the design and location ofnutrient producing activities andinfrastructure:
- Always locate them away fromwaterways and wetlands.
- Avoid sites that are prone towaterlogging.
- Design storage facilities to includeweather proof cover and waterproofbarrier underneath to prevent downwardleaching.
- Ensure that leach drains are surroundedby clay or iron rich soils that trapnutrients.
Nitrates in groundwater(Lantzke, 1995)
Nitrates from nitrogen fertiliser are readilyleached from all soils. Leaching is particularlyrapid on sandy soils because of their limitedcapacity for holding nutrients and moisture.
High nitrate concentrations in the groundwaterbelow horticultural properties are common onthe Swan coastal plain. This is of interest forthree reasons:
1. Health concerns from drinking water withhigh nitrate levels
2. The growth of algae in surface water
3. The amount of nitrogen applied to crops inirrigation water.
Health concerns
Drinking groundwater that has high levels ofnitrates is dangerous to health, especially that ofchildren.
In 1991, just under half the bores sampled (40market gardeners’ bores) containedconcentrations in excess of the World HealthOrganisation Guideline of 10 mg/L nitrate-nitrogen. Drinking water with nitrate levelsexceeding this limit is especially serious ininfants. It is important that people who drinkgroundwater from farm bores have it tested. TheChemistry Centre (WA) or a private laboratorycan analyse water samples for nitrate content.
If the domestic bore is located near a septic tankor poultry manure heap, also have a sampleanalysed for harmful bacteria that can causegastroenteritis. Samples taken by local healthsurveyors can be analysed by State HealthLaboratory Services.
The growth of algae in surface water
In saline estuaries and shallow coastal waters,nitrates can cause the growth of algae andphytoplankton. Algal blooms choke waterways,give off foul odours and may kill seagrass, fishand birds.
Groundwater flowing from agricultural andurban areas can carry nitrates, which mayultimately reach estuaries or the ocean andcontribute to algal blooms.
Nitrogen applied to crops in irrigation water
Irrigation with nitrogen rich groundwater canadd a considerable proportion of a crop’snitrogen requirement. Calculate the amount ofnitrogen applied in the irrigation water andadjust fertiliser programs accordingly. SeeSection 3.3 for how to do this.
Nitrogen in the groundwater can be so high thatthe crop suffers nitrogen toxicity. In this case,use no further nitrogen fertiliser, or mix thewater that is high in nitrogen with a different,uncontaminated source before irrigating.
133

SEC
TIO
N 5
Monitoring the quality of groundwater
It is recommended that growers using bore watermonitor the quality of the groundwater regularly.Monitoring provides an ongoing indication onthe trend in groundwater quality and a check forthe grower as to whether his water managementpractices are effective.
Refer to Appendix 5.2 for details of howgroundwater monitoring bores should beinstalled.
The water should be tested for EC (salinity),nitrogen and phosphorus. If the water is used fordrinking, tests for hydrocarbons and pathogenbacteria should be included.
Nitrogen levels in the groundwater are likely tobe higher in areas where horticulture has beenpractised for a long time and where thegroundwater source is shallow. It is important toregularly check the nitrogen concentration inbores and to readjust fertiliser programs ifnitrogen concentrations change.
❑ Growers using bore water or nutrient richsurface water should:
- Have the water tested twice yearly fornitrogen concentration.
- Take into account the nitrogen in theirrigation water when calculating thenitrogen fertiliser application requiredfor crops.
Take a sample of bore water and have it analysedto determine its nitrogen content (also ask forpotassium and phosphorus analyses). Take asample of at least 100 mL of water in a cleanbottle with a tight lid. Keep the sample cool inan ice pack or Esky® and deliver it to thelaboratory (Chemistry Centre WA or privatelaboratory) within a few hours. Frozen sampleswill last up to four weeks (fill the bottle onlytwo-thirds full, to allow for expansion duringfreezing).
The results of these analyses can be used tocalculate nitrogen applied in bore water (Section3.3). The nitrogen required as fertiliser can besignificantly reduced when bore water high innitrogen is used.
Best fertiliser management practices for reducingnitrogen leaching can be found in Section 3.3‘Minimise leaching of nitrogen’ and bestirrigation management practices for minimisingleaching are outlined in Section 4.2.
Minimising erosion
❑ To minimise export of nutrients andchemicals, conduct best practices tominimise soil erosion (refer to Section 2.1).
Minimising nutrients in drainage
Poorly designed, inappropriate or unprotecteddrains are major causes of nutrients andchemicals entering streams and water bodies. Inplanning, consideration needs to be given towhere drainage water from the farming propertywould flow to and the drainage route it wouldfollow. In catchments with wetlands or estuarieswith natural conservation values, there are strictrequirements for limiting nutrient concentrationsin the water.
❑ Conduct best drainage practice (refer toSection 2.3).
❑ Fence streams and major drains andestablish vegetated buffers (Section 5.3below).
Water re-use
❑ Tailwater dams are recommendeddownstream of vegetable and potatogrowing sites where practicable, to collectand re-use nutrient rich run-off.
Irrigating vegetated land with nutrient-richwastewater(Water and Rivers Commission, 2002; NHMRCet al, 1996)
These notes apply to the irrigation of treatedeffluent from intensive animal industries,recycled run-off from agricultural land, andtreated municipal wastewater, which is applied toland to promote the growth of healthyvegetation.
134
SEC
TIO
N 5
Detailed note assessments and more stringentrequirements are required for sensitive areas, i.e.in Public Drinking Water Source Areas(PDWSAs), within 200 metres of conservationvalue wetlands and managed estuaries, or wherethe depth to groundwater is less than 2 metres.PDWSAs include Underground Water PollutionControl Areas, Water Reserves and Public WaterSupply Catchment Areas declared in accordancewith the Metropolitan Water Supply Sewerageand Drainage Act 1909, or the Country AreasWater Supply Act 1947.
The following requirements reflect the Water andRivers Commission’s current position. They arerecommendations only and may be varied at thediscretion of the Commission.
Irrigation of wastewater with inadequateplanning has the potential to cause the followingimpacts:
- Soil erosion and turbidity in water resources
- Leaching of nutrients into water resourceswhich can produce eutrophication and toxiceffects
- Salinisation and water logging to land.
Site selection
Proponents intending to irrigate wastewater toland should design systems suited to theinfiltration capacity and the nutrient retentionability of the soil.
NB: PRI means Phosphorus Retention Index, ascientifically determined measure of the
phosphorus retention capacity of surface andnear surface soils.
Soil characteristics will influence the rate andfrequency of irrigation, and should be taken intoaccount to minimise waterlogging and theleaching of excess nutrients into waterways andsub-surface aquifers.
Irrigation rates
Irrigation schemes should be managed to avoidbuild-up of salts in the soil. Ideally wet seasonrainfall should flush accumulated salt away fromthe site prior to the commencement of theseasonal irrigation scheme.
Irrigation rates should take into considerationseasonal evapo-transpiration (ET) rates and thewater requirements of the selected vegetation.Watering requirements can be calculated at 60-80% of pan evaporation depending onapplication method. Rates will also varyaccording to the intended cropping and speciesuptake rates. Factors including soil type, soilmoisture content, irrigation method, land slopesand depth to water table will also influenceapplication rates.
For clay soils irrigation rates up to 5 mm/hourare reasonable, while sandy sites may accept 15mm/hour without run-off. Irrigated areas shouldideally have a slope of 0.5 – 10% to avoidponding or erosion. Irrigated water shouldalways be applied evenly and the irrigated areaallowed to dry out for 24 hours betweenapplications during hot, dry weather and 3 daysto 7 days during cool, wet weather.
135
Table 5.1: Soils and receiving environments have been divided into four vulnerability categoriesas follows:
Vulnerability Characteristics
Category A Coarse sandy soil/gravel draining to surface water with moderate/higheutrophication risk.
Category B Coarse sandy soil/gravel draining to water with a low risk of eutrophication.
Category C Loam/clay soil (PRI >10) draining to water with moderate/high eutrophication risk.
Category D Loam/clay soil (PRI > 10) draining to water with a low risk of eutrophication.
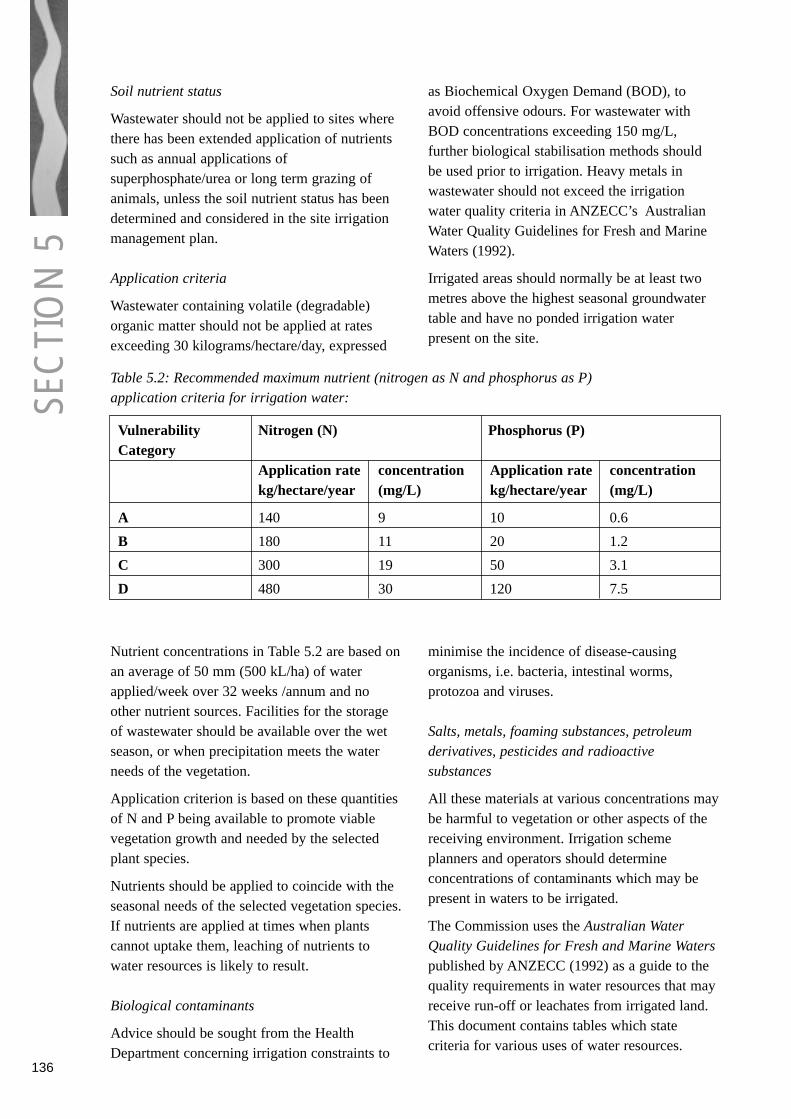
Nutrient concentrations in Table 5.2 are based onan average of 50 mm (500 kL/ha) of waterapplied/week over 32 weeks /annum and noother nutrient sources. Facilities for the storageof wastewater should be available over the wetseason, or when precipitation meets the waterneeds of the vegetation.
Application criterion is based on these quantitiesof N and P being available to promote viablevegetation growth and needed by the selectedplant species.
Nutrients should be applied to coincide with theseasonal needs of the selected vegetation species.If nutrients are applied at times when plantscannot uptake them, leaching of nutrients towater resources is likely to result.
Biological contaminants
Advice should be sought from the HealthDepartment concerning irrigation constraints to
minimise the incidence of disease-causingorganisms, i.e. bacteria, intestinal worms,protozoa and viruses.
Salts, metals, foaming substances, petroleumderivatives, pesticides and radioactivesubstances
All these materials at various concentrations maybe harmful to vegetation or other aspects of thereceiving environment. Irrigation schemeplanners and operators should determineconcentrations of contaminants which may bepresent in waters to be irrigated.
The Commission uses the Australian WaterQuality Guidelines for Fresh and Marine Waterspublished by ANZECC (1992) as a guide to thequality requirements in water resources that mayreceive run-off or leachates from irrigated land.This document contains tables which statecriteria for various uses of water resources.
SEC
TIO
N 5
Soil nutrient status
Wastewater should not be applied to sites wherethere has been extended application of nutrientssuch as annual applications ofsuperphosphate/urea or long term grazing ofanimals, unless the soil nutrient status has beendetermined and considered in the site irrigationmanagement plan.
Application criteria
Wastewater containing volatile (degradable)organic matter should not be applied at ratesexceeding 30 kilograms/hectare/day, expressed
as Biochemical Oxygen Demand (BOD), toavoid offensive odours. For wastewater withBOD concentrations exceeding 150 mg/L,further biological stabilisation methods shouldbe used prior to irrigation. Heavy metals inwastewater should not exceed the irrigationwater quality criteria in ANZECC’s AustralianWater Quality Guidelines for Fresh and MarineWaters (1992).
Irrigated areas should normally be at least twometres above the highest seasonal groundwatertable and have no ponded irrigation waterpresent on the site.
136
Table 5.2: Recommended maximum nutrient (nitrogen as N and phosphorus as P)application criteria for irrigation water:
Vulnerability Nitrogen (N) Phosphorus (P) Category
Application rate concentration Application rate concentrationkg/hectare/year (mg/L) kg/hectare/year (mg/L)
A 140 9 10 0.6
B 180 11 20 1.2
C 300 19 50 3.1
D 480 30 120 7.5

SEC
TIO
N 5
137
Assistance should be sought from qualified andexperienced people who are able to assess thelikely fate of these contaminants when theymove in the environment after application toland.
The Water and Rivers Commission employsenvironmental modelling techniques and riskassessment procedures to judge whether suchcontaminants are in sufficient concentrations tocause harm.
Monitoring and reporting
The Health Department and Water and RiversCommission normally require chemical andmicrobiological monitoring of reclaimed waterquality depending upon the extent of applicationand access afforded to the public.
Monitoring must be able to assess water qualityat three stages: the point of supply, that is thepoint of entry to the reclaimed water system; thequality recorded in water resource monitoringfacilities; and through periodical soil sampling.
The proponent should monitor the followingparameters:
- The quantity of wastewater irrigated(minimum of weekly intervals) and recordareas irrigated
- The pH, salinity of wastewater at monthlyintervals
- Total N and P in wastewater at thecommencement of the irrigation season and at3 monthly intervals until irrigation ceases
- Other contaminants in wastewater should bedetermined annually. Records of data shouldbe retained on site for scrutiny by regulatorybodies.
For small, rural or remote communities where itis not feasible to apply normal microbiologicalmonitoring, frequencies may be reduced. Thesewould be negotiated on an individual basis onapplication for approval of a scheme.
5.2 Maintain or restore thecharacter and bed stabilityof waterways
What is riparian land?
Simply put, riparian land is any land that adjoinsor directly influences a body of water. Itincludes:
- The land immediately alongside small creeksand rivers, including the riverbank itself
- Gullies and dips that sometimes run withsurface water
- Areas surrounding lakes and wetlands on riverfloodplains which interact with the river intimes of flood.
Good management of riparian lands is not asubstitute for good land management practiceselsewhere in a catchment. However, it is anessential component of sustainable managementof a property or landscape and can yieldnumerous benefits.
Best practices to protect the character andstability of streams are:
❑ Manage remnant native riparian vegetationto maintain or improve its health. Establishnative trees, shrubs and rushes alongdenuded sections of the stream.
❑ Consider rocked or logged riffle zones orchutes to stabilise eroding stream beds,increase habitats for aquatic life andoxygenate the water.
For information on constructing rocked chutes,refer to Section 2.1.
Stream bank erosion – what it is and why itoccurs (LWRRDC, 1999)
It is estimated that at least $50 million is spenteach year on preventing or remedying streambank erosion in Australia. Added to this is thecost of treatment to counter reduced waterquality. Given these costs, it is not surprising thatthere is a rapidly growing interest in techniquesto help stabilise streams and their banks.

Stream bank erosion occurs by two processes:
- Scour where sediment is removed from streambanks bit by bit, particle by particle
- Collapse where the bank fails and collapses ortopples forward suddenly.
Although collapse is the most obvious anddramatic form of bank erosion, scour is arguablymore destructive. If collapsed material is notremoved by scour, the bank will probably remainstable. It is scour that primes the bank for thenext collapse. Vegetation reduces scour byreducing water velocity (especially close to thebank) and will also ride down with a collapsedbank and protect its toe from scour.
Landholders and managers normally face threegeneral types of stream erosion.
1. Incised streams
The bed is deepening and the banks fail becausethey are too steep. There is little point instabilising stream banks until the stream bed hasbeen made stable. Vegetation on the gully floor,while being notoriously difficult to establish, isuseful in stabilising the bed, although someinitial grade control structures (such as rockedchutes) may be needed. It is important that densevegetation does not then fill the centre of thegully and divert flow into the banks.
In some cases the best management is simply tofence the stream off from grazing, stabilise thebed with rock chutes, and allow the bed andbanks to be colonised by grass.
2. Channel widening
This may or may not be related to incision. Ifboth banks of a stream are eroding, it may bethat:
- The stream cannot carry the increased flowswhich have resulted from clearing of thecatchment;
- The channel has deepened;
- Unusual rainfall has caused a large flood orseries of floods; or
- The banks have been over-cleared.
In large channels, the key is to establishvegetation as far down the face of the bank aspossible, as well as on the bank top. Specialattention needs to be given to stabilising the toeof eroding banks, and this may require rocks orother structures to help maintain the toe regionwhile vigorous vegetation becomes establishedabove it.
3. Erosion of the outer bank
This usually occurs on a steep bank on theoutside of a meander bend. It is the mostcommon erosion problem on larger streams. Theoutside bank of a meander is often steep or evenvertical, making it difficult to establishvegetation on the bank face. In general, thehigher the bank, the less useful vegetation on thetop of the bank is in reducing collapse. Inchannels under three metres high, establishingvegetation on the top of the banks will havesome value if the bank suffers rotational failureor topples.
In this case, vegetated blocks topple to the toe ofthe bank. If the vegetation is sufficientlyvigorous, and there is sufficient moisture, thismay stabilise the toe.
Causes of stream bank erosion
A stream may erode its bed because a dam builtupstream has altered its flow, or because thestream has been deliberately straighteneddownstream to increase its capacity to handlefloods. The subsequent increase in bank heightwill then lead to collapse.
Clearing for agriculture increases rates of surfaceflow, and this, combined with over-clearing ofvegetation from stream banks, leaves banksespecially vulnerable to erosion. The removal ofstream-side vegetation and its continuedsuppression through grazing, or other rural orurban management, is often an important triggerfor bank erosion.
138
SEC
TIO
N 5
139
How riparian vegetation affects stream banks (LWWRDC, 1999)
Root systems
The roots of vegetation reinforce the soil in thesame way that steel rods reinforce concrete. Fineroots are more important in this process than arethick roots. Root reinforcement by riparianvegetation is usually the most importantsafeguard against bank collapse.
Buttressing
Riparian vegetation which is present on the faceof a stream bank helps support (or buttress) thesoil above it so that it does not collapse. Whenbanks do collapse, the soil forms a slopingsection at the base. Revegetating this section willhelp buttress the upper section of the bank.
Reduced velocity
The velocity of water flow in a channel can bedecreased by vegetation growing either on thebank or in the water, and by debris or sedimentin the stream. The extent to which velocity isreduced is very dependent on the type ofvegetation – for example, grass is more effectivethan widely spaced trees. In some cases,vegetation is highly invasive and actually growsinto the river channel. Vegetation growing withinthe channel will reduce scour by decreasing theaverage flow velocity.
Water use
Riparian vegetation uses much of the waterpresent in stream banks and also improves thedrainage of the bank soils. As most bankscollapse when they are saturated with water,riparian vegetation, by using that water and byimproving drainage, can help stabilise the bankand reduce the risk of sudden collapse. Thiseffect is usually small.
Riparian vegetation reduces stream bank erosionby complex interaction of the above-mentionedfactors. In general, root systems, bystrengthening the bank, are the most importantway in which vegetation acts to minimise bankcollapse. Vegetation growing on the bank facealso reduces scour and, thereby, undercutting and
collapse. The importance of root systems andbuttressing in preventing collapse largelydepends on the height and angle of the bank, andthe cohesion (soil strength) of the bank material.
Revegetating stream banks(LWWRDC, 1999)
Maintaining or establishing healthy riparianvegetation are techniques that can providerelatively cheap and long-term stability as wellas numerous other benefits. However, in somesituations vegetation will have to be combinedwith other forms of protection to adequatelyprotect the banks.
Understand why erosion has occurred
This may require a simple survey of the riverreach or professional advice. Once the cause hasbeen determined, the design revegetation workscan be carried out with confidence, matching thetype and position of vegetation to the nature ofthe problem and combining it, if necessary, withstructural work.
Work with others
It is important to remember that the effects ofover-clearing or loss of vegetation, and ofrevegetation, may have impacts downstream.There is much to be gained by joint planning andrevegetation action by groups of landholders todeal with a whole section or reach of a riverrather than individual action by one or twolandholders.
Position of vegetation
In revegetating to reduce bank erosion, correctplacement is most important. Vegetation in thewrong place can increase local flow velocity andincrease erosion.
The best solution is to establish vegetation onthe bank face. The decreased flow velocityaround the vegetated face will reduce scour andprotect the bank toe, which is the most criticalerosion point.
Establish vegetation as far down the base of thebank as possible
SEC
TIO
N 5

This may require special work to stabilise the toeof the bank or to batter it to an angle wherehealthy riparian vegetation can become wellestablished and provide stability. Vegetation onthe floodplain and on banks has little impact onin-channel flow where the width of the channelis more than thirty times the depth.
Choose suitable species
Dense undergrowth can provide more resistanceto bank erosion than can tree trunks, particularlydown towards the channel and at the toe of thebank. Species with a dense, fibrous root systemand with flexible leaves or stems able to movewith the flow are to be preferred. Higher up thebank, which should preferably be sloping, largershrubs and trees can help to dry out the bank soilwhile their fine roots add substantially to soilstrength.
Simply re-establishing original species will notnecessarily work
The nature of many streams has changedsubstantially since European settlement.Revegetation will rarely completely reverse thisprocess and return the stream to its originalcondition. The type of vegetation needed mustbe determined once the reasons area becamedegraded in the first place are determined andthe intended land use is clear.
Introduced or non-local species may be requiredfor especially difficult situations, or to stabiliseactive erosion sites while native species get achance to become established. Ensure that anyintroduced species are not environmental weeds.
Use a range of plant species
Copy nature. Natural, stable stream bankssupport a range of grasses and reeds, shrubs andtrees. By replicating this variety, plantedvegetation can be self-perpetuating and requirelittle maintenance. Native grasses and reeds, andshrubs with flexible branches often occupy thelowest part of the bank, where they are subject tooccasional inundation. Their ability to bind soiland resist flood flows are highly prizedcharacteristics. Further up the bank, shrubs and
small trees may predominate, with either anunderstorey of grassy species or, if there isadequate shade and moisture, a strong mat offibrous roots present on the outside of the bank.At the top of the bank there may be large treeswith a shrub understorey, or a combination oftrees and grass.
Be careful with in-stream vegetation
If there is evidence that lack of channel capacityduring flood flow is a cause of bank erosion,vegetation should not be planted within thechannel or allowed to stabilise sediment bars.Although the impact of riparian vegetationdecreases with channel size, willows and reedschoking a 15 m-wide channel of about four mdepth will roughly halve channel capacity toconvey major flows.
Carefully consider woody debris
Vegetation and large, woody debris would needto occupy at least 10 per cent of the cross-section of the channel before having much effecton flow velocity and flooding. Snags draggedback against the banks at an angle of 40˚ havelittle effect in diverting water flow onto thebanks. Only in very choked channels has theremoval of large, woody debris led tomeasurable increases in the amount of flow achannel can carry.
5.3 Safeguard streams, waterbodies and drains
The clearing of catchments for agricultural land,soil disturbance during forestry operations orurban development, and bare areas such asgravel roads and stock paths, have led tosubstantial increases in the amounts of sediment(gravel, sand, silt and clay) entering our streamsand rivers. This sediment can contaminatehuman and stock water supplies, smotherbreeding sites for fish and other in-streamanimals, and deprive these animals of the deeppools which are a vital refuge in dry seasons andprolonged droughts.
140
SEC
TIO
N 5

141
The wetlands and other surface water resourcesof Western Australia are very low nutrientecosystems in their natural state. They areparticularly susceptible to contamination bymaterials including sediment (soil particles),nutrients, salts, agricultural chemicals, microbesand litter. Whatever the specific impact ofcontamination, the end result is likely to beseverely decreased water quality.
Vegetation within a riparian zone can slow theoverland movement of water, and cause sedimentand nutrients to be deposited on land before itreaches the stream channel. Plants can alsoabsorb some of the nutrients being transported.Trees and deep-rooted shrubs and grasses usesignificant quantities of sub-surface waters.Riparian vegetation can therefore also influencesub-surface water flows and, thus, the quantityof nutrients, salt or other contaminants enteringstreams by this route.
In addition to applying best soil and nutrientmanagement practices, surface water bodies needto be physically safeguarded by goodmanagement of the riparian land around them.
❑ Where riparian vegetation remains, don’tclear it.
A mix of native swamp and riparian species isexcellent for nutrient filtration, bank stabilisationand shade. In the natural state the mat of stems,roots and organic matter provided by the nativevegetation in broad shallow stream beds preventserosion. It also provides optimal conditions forin-stream stripping of nutrients.
Leaving vegetation in place confers all of thesebenefits at much less cost than re-planting. A 10-20 m wide strip along each bank – two tofour hectares per km of stream bank – is all thatis required. The small cost of fencing andforegoing livestock production from this area isfar outweighed by the shelter and wildlifebenefits. It is also insurance against futureerosion and encroachment of stram banks, whichis very expensive to rectify.
Fencing to protect riparian land
Experience in the Peel/Harvey and Scott Rivercatchments and elsewhere has shown that
fencing and exclusion of stock is a necessaryprerequisite for both stream bank rehabilitationand successful establishment of buffer strips.
Three or four wire electric fences have proved tobe by far the most cost effective, the capital costbeing about half that of conventional fencing.
Funding assistance for fencing and revegetationstream buffers can be obtained throughgovernment remnant vegetation fencingprogrammes.
❑ Fence to keep livestock off the banks andfringing vegetation (riparian areas) aroundwetlands, waterways and dams on streams.
❑ Where watering points are required forlivestock, construct rocked access points orpump water out into troughs.
Separation buffers for sensitive waterresources
Separation buffers to water resources are createdmainly to provide barriers to limit the passage ofcontaminants during normal land use activitiesor as a result of chemical spills or similaremergencies. Other functions of separationbuffers are:
- Maintenance of ecological processes and majorfood chains.
- Protection from nutrient inputs that could leadto eutrophication.
- Protection from increased salinity by reducingthe ingress of saline water.
Separation distances may not always be a stripof set width along a watercourse or wetland. Thedistance should match the risk and needs of thelocal environment. The separation distancesoutlined in Table 1, Section 13.2 of the Code ofPractice are recommended by the Water andRivers Commission for new or expandingvegetable and potato growing operationsproposed in the vicinity of water resources.
❑ In liaison with the Water and RiversCommission and neighbours, establishadequate buffers to protectenvironmentally sensitive wetlands andwells or reservoirs used for drinking watersupplies.
SEC
TIO
N 5

Vegetated buffer strips to trapnutrients (LWRRDC, 1999; Heady et al, 1994)
The fencing and revegetating of buffer strips oneach side of streams, dams and major drainsflowing through farmland, otherwise known asstreamlining, is an important technique to reducenutrient export. For example, over 300 km ofstreams and drains have been streamlined in thePeel-Harvey catchment during the past 8 years.This streamlining activity, implemented by morethan 20 community-based landcare groups, hascontributed significantly to reducing nutrient lossrates.
Recent studies in Australia have shown thatnatural vegetation and grassy filter strips cantrap up to 90 per cent of the sediment movingfrom up-slope. A recent study conducted in thePeel-Harvey catchment shows a specificreduction in nutrient load in a streamlined drainof up to 500% (or 5 times less) when comparedto an unprotected section of the same drain. Thissame study identified a 13 times reduction insediment load in the same drain due tostreamLining.
Although streamlining can be effective inpreventing sediment and nutrients from reachingstreams, and thereby help to protect and improvewater quality, they are not a substitute for goodland management. Riparian buffer strips will notbe effective if poor management practicesleading to excessive soil erosion are permittedon the broader lands of the catchment.
Why and how buffer strips work(LWWRDC, 1999)
Vegetation buffers can be equally effective intrapping or absorbing nutrients. Vegetation canquickly grow over and through the trappedsediments, thereby protecting them from futurestorms.
This reduction is due to the combined effects ofthree factors.
1. Preventing fertiliser from being spread in andadjacent to the stream and preventing foulingby stock
When nutrients are deposited directly intostreams or onto stream banks, a very highproportion of these nutrients is exported andcan pollute estuaries and wetlands. Althoughonly a small portion of nutrients may bedeposited in this way, it can amount to amuch higher portion (15-30%) of nutrientsexported, because there is little opportunityfor them to be trapped or filtered out. Fencingprevents this direct deposition of nutrientsfrom fertiliser and animal wastes.
2. Stripping of nutrients by the filtering effect offringing and in-stream vegetation.
Run-off , containing fine sediment withadsorbed nutrients is filtered and depositedwhere it flows through dense, fine-stemmedvegetation. A good cover or vegetation withfibrous roots is necessary to slow the flowsufficiently to prevent re-mobilisation oftrapped sediments. Native species such asrushes, sedges, tea trees and native perennialgrasses and introduced perennial grasses, suchas kikuyu, are ideal. Only native speciesshould be used around streams and wetlandswith natural biodiversity value.
A significant amount of the nutrients in thesediments can be absorbed into biomass bythe roots of the vegetation. If the vegetation istimber or pasture species, it can be harvestedfor timber or hay, thus valuable nutrients thatwould otherwise be wasted can be utilised forproduction.
3. Reducing stream bank erosion
Stream bank and headward erosion is commonon cleared tributaries and drains. Once thesurface mat of fibrous roots has beenremoved, and the banks are pulverised by thehooves of stock, the soils (particularly wetsands) become unstable.
Recorded erosion events on such streams havecoincided with higher measured particulatephosphorus loads, indicating that stream bankerosion is a major factor contributing to exportof nutrients attached to soil particles.
142
SEC
TIO
N 5

143
As part of a streamLining project, vegetationshould be established on the banks of thestream. This is one way of reducing streambank erosion and thus reducing the amount ofnutrients entering the stream.
Note that revegetation alone is sometimes notsufficient to achieve stream bed stability. Inthese cases, drop structures, riffle zones (Section2.1 under ‘Rocked or concreted chutes’), or logscan be strategically placed to reduce and/orredirect the flow velocity, thus reducing theerosive energy of the stream. If the stream bed isto be reconstructed, the profile should be broadand flat so that flow is shallow and slow.
Establishing vegetated buffers(LWWRDC,1999)
❑ Establish filtering vegetation along thebanks of streams, dams, wetlands anddrains and where necessary fencevegetation to exclude livestock.
Where to place buffers
To be effective, a buffer strip needs to beestablished or maintained at points where surfacewaters enter small river channels. In mostcatchments, this does not mean a strip of setwidth along both banks of a channel.Consideration needs to be given to those parts ofthe landscape where folds and dips collect water,which then flows into the tributary stream.
There may be large parts of the landscape wherelittle or no overland flow enters the channel. Thedecision may be to maintain healthy riparianvegetation in these areas to improve bankstability or wildlife habitat, but they are notimportant if the objective is to enhance waterquality. Instead, attention should be focused onany landscape depressions and where flowconcentrates. In such areas plan a broad well-grassed buffer zone that covers the entire area offlow concentration, because a concentrated flowmay break through a narrow grass buffer intimes of heavy rain.
What species to use
It is possible to combine natural riparianvegetation with a planted, rough grass bufferstrip between it and intensively used agriculturalland. The grass strip provides an initial slowingof overland flow and trapping of sediment, andthis process is continued in the naturalvegetation along the stream bank. The naturalvegetation should include rushes, sedges and teatrees that grow thickly and form a fibrous rootmat that helps to stabilise the bank and provideecological benefits.
How wide to make buffers
The most commonly asked question in relationto the design of buffer zones relates to the widthof the zone. If the prime purpose is to trapsediment and nutrients, the appropriate widthand management practice for riparian buffersdepends on the volumes of water and sedimentbeing transported and the nature of the landscapeadjacent to the stream channel. Factors affectingthe amount and type of sediment moving inoverland flow include soil type, intensity of landuse, presence of stock, vehicle tracks or gullieswhich generate sediment, and the likelihood ofthe surface flow being concentrated into anarrow pathway.
In general, as the volume of flow or the amountof sediment increases, the wider the riparian stripneeds to be. A general recommendation is that acombination of ten metres of grass buffer and tenmetres of natural vegetation adjacent to thestream will be effective in most situations. Widerbuffer strips may be required wherever factors,such as an intense source of pollutants, steepgradients adjacent to streams, and poorvegetation cover, conspire against trappingefficiency.
Whether the buffer strip required is narrow orwide, it is important that its use and managementis incorporated into the farm or local governmentplan. In many cases, a little thought and planningwill enable use of the buffer strip for productivepurposes while maintaining its integrity andeffectiveness.
SEC
TIO
N 5

144
How to use buffers
It is not always necessary to take buffer zonesout of production, but it is important to maintainthem so that there is almost complete groundcover and a good height of vegetation. This willmaximise their trapping potential. As these areasare often highly productive, it is important towork out how to maintain productivity while atthe same time keeping the grass cover forsediment trapping.
In many cases, it will be possible to build thisrequirement into the farm plan. For example, awide grassy area in a depression next to thestream channel could be left for grazing during acropping sequence, or grazed only lightly forthat season of the year when high rainfall isanticipated. Some landholders are experimentingwith the establishment of riparian agroforestryplantations, comprising widely spaced trees anda good grass understorey. The grass providesfeed for stock, especially during the early yearsof the plantation.
Such tree crops often have excellent growth ratesbut care needs to be taken to minimise soildisturbance when the trees are harvested,especially when the ground is wet. Suchproduction systems, whether in the south or thesub-tropics or tropics, offer the potential for farmdiversification and significant income, while atthe same time making a positive contribution toimproved water quality.
Managing stock access
Uncontrolled use of riparian lands by stockcontributes significantly to the amount ofsediment and nutrients moving into our streams.If not managed carefully, stock will often spendlong periods along stream banks, leading toovergrazing and baring of the soil surface. Stocktracks up and down or along banks are majorsources of soil erosion into the stream duringrain. They break up and pug the soil surface,which then washes away easily. Direct inputs ofnutrients by stock through manure and urine addsubstantially to the loads of nitrogen andphosphorus within the stream, and these
nutrients can then support excessive growth ofnuisance plants and algae.
Nutrient stripping areas(adapted from Evangelisti et al, 1998)
❑ Running drainage water through vegetatednutrient stripping areas is an optionalpractice that can further reduce nutrientconcentrations in run-off water.
Small swamps on the property that have littleenvironmental value can in some situations beused as nutrient stripping areas. They would onlyrequired fencing and drains leading into them.
Constructing wetlands is an expensive exerciseand in many cases would probably not be costeffective. It should only be considered as a lastresort option to reduce high concentrations ofparticulate nutrient concentrations in run-off,where the catchment is small. All other bestpractices for reducing erosion, run-off andnutrient export should be conducted beforeconsidering this option.
Feasibility and cost
The construction cost of a two hectare wetland islikely to exceed $10,000 including design,surveying, fencing, vegetation and a controlledoutlet. Cheaper options lacking any of thesefeatures are likely to fail and require expensiverepairs or modifications.
A wetland is not likely to provide any economicbenefit to the farmer except perhaps as a stockwater supply, which would need a pumpedwatering point as stock should be excluded fromthe wetland. There may be an economic cost ofup to $400 per year due to area lost to grazing.However there could be other production fromthe wetland, such as floral harvesting of rushesor tea tree, or aquaculture.
Wetlands are likely to be most cost effective forsmall catchments, less than 100 hectares in areaswhere there is intensive cultivation and/orfertiliser application, such as some horticulturesites. They are unlikely to be effective oreconomic on third or higher order streams withmany tributaries and large catchments. In these
SEC
TIO
N 5

the nutrients are generally more diluted and thehigh flows necessitate very large basins to obtainthe retention time necessary to significantlyreduce sediment load.
Design guidelines
To be effective constructed nutrient strippingbasins must be of adequate size for thecatchment area and projected flows. They mustalso be the right shape and adequately vegetated.It is essential to carefully calculate the catchmentarea and design the wetland carefully.
Area in relation to catchment
Recommendations for wetland areas vary from0.5% to 5% of the catchment but the 2% to 3%of the catchment area is most commonly used.
Retention time and volume in relation to flow
The wetland needs to be designed with a volumeand dimensions that will slow the flowsufficiently to allow suspended particles to fallto the bottom and be filtered out by vegetation.As a practical ‘rule of thumb’ criterion for highrainfall coastal plain catchments, a five-dayretention time is a practical compromise. Thiswill remove 20-60% of the phosphorus, which isthe critical nutrient/ pollutant. Nutrient removaldoes not increase proportionally with area andvolume. Increasing the size of the wetland by100 % will only give about 20% more nutrientremoval.
Given a retention time of 50 days wetlands couldremove 40-90 % of phosphorus, 40- 65% ofnitrogen and 80-00% of suspended solids.Retention times of this magnitude are notpractical for high rainfall coastal catchments asthe wetland area would have to be more than 5%of the catchment.
Length to width ratio
If the wetland is too short and wide, short-circuiting of the flow may occur and if it is toolong and narrow stream velocity may increase,causing re-mobilisation of sediments. Therecommended range of length to width ratios isfrom 3:1 to 10:1.
Depth, profiles and control of flow
A wetland of average depth 1 metre and area 2%of the catchment could be expected to provide aretention time of around 5 days for up to about 4mm of run-off per day. Average annual run-offfor a typical high rainfall south west coastalplain catchment with 900-1000 mm rainfall isapproximately 270 mm. Daily rainfall generallyvaries from 0-50 mm. Clearly, such a wetlandwould be ineffective in stripping nutrients duringpeak flows. However it would removesignificant amounts or nutrients during moderaterainfall intensity events during the wet season –where run-off does – up to 40 mm per day.
Wetlands should be designed with a sequentialprofile varying from open water (>1.5 m deep)to deep marsh (0.4- 0.7m deep) and shallowmarsh (<0.4 m deep), so that the water has toflow through all three phases at least once.Sedimentation will occur in the deeper areaswhere flow is slower and filtration will occur inthe shallower, vegetated areas.
A stable concrete outflow control structure isessential to prevent excessive flow velocitythrough the filter. To carry peak flows which arebeyond the stripping capacity of the wetland, aspillway area should be constructed beside theoutflow structure. This should be broad, shallowand vegetated to prevent erosion and re-mobilising of sediments.
Vegetation
Any vegetation that is not a declared orenvironmental weed and has dense thin stemmedgrowth such as sedges, rushes, tea tree, kikuyuor couch would be appropriate. Only nativespecies should be used if the wetland has anature conservation value.
Lining with nutrient fixing soil ameliorants
Wetlands excavated into clays or lined with redmud such as bauxite mining residues shouldhave greater efficiency. These phosphorus fixingmaterials should be placed in the deeper parts ofthe wetland. The shallow areas should bevegetated, as care must be taken not to allowflow velocity to increase sufficiently toremobilise the clay and silt particles. 145
SEC
TIO
N 5

Harvest or removal of biomass and sediments
To maintain nutrient stripping efficiency,sediments would need to be removed and couldbe spread on sandy areas in the paddocks.Trapped sediments will build up in the shallowvegetated areas, eventually filling them anddecreasing the size of the wetland. If sedimentexport rates were in the order of 10 cubic metresper hectare, a wetland was 2% of the catchmentarea and it trapped 50% of the sediment load, itwould accumulate about 25 mm of sedimentseach year. Hence, sediment removal would benecessary after 10-20 years.
How to avoid dam constructionfailures(State of Victoria Department of NaturalResources and Environment, 1997)
Disclaimer
Further, but without detracting from theforegoing disclaimer applying to this Manual,this information note may be of assistance to youbut the State of Victoria and its officers do notguarantee that it is without flaw of any kind or iswholly appropriate for your particular purposesand therefore disclaims all liability for any error,loss or other consequence which may arise fromyou relying on any information in thisinformation note.
Dam construction failures can cause significantdamage to property and the riparian environmentdownstream.
This Note gives information on how to minimisethe risk of either design failure or operationalfailure of farm dams located on waterways.
Dams that are to be constructed on waterwaysshould be referred to the Water and RiversCommission and local government authority toensure all authorisations have been obtainedprior to construction commencing.
How to prevent failures
Usually, the causes of the failure can be easilyfound. The owner may have been over-confident
in undertaking planning, and in doing so, failedto include soil testing in the investigatoryprogram. The other common cause of failure isin the use of inexperienced contractors. Nothingcan take the place of a reliable and reputablecontractor, and by using experienced machineoperators you can reduce the risks of failuredramatically. Their previous jobs can be checkedand a good outcome is considered the bestrecommendation.
Soil assessment and testing
It cannot be stressed too heavily that the soil onthe actual site should be examined beforedetailed planning starts. Many types of soil andsubsoil do not "hold" water and it is necessary toconfirm the existence of impervious clay to sealthe excavation and to form the core of the bank.It is also highly desirable to determine the
susceptibility of the soil to tunnel out and causebank failure.
Many potential failures can be prevented if thecontractor is fully aware of any soil limitationson the site. A further requirement is toinvestigate the materials along the centreline ofthe bank to ensure that the core trench reachesimpervious material.
Equipment
A bulldozer or a scraper is mainly used whenconstructing a farm dam, preferably inconjunction with a sheepsfoot roller on largerjobs. Scrapers generally give better bankcompaction, but bulldozers are moremanoeuvrable.
Designing bank and excavation
Design the bank and excavation so that theupstream edge of the pit will be covered whenthe dam is full. This will help to prevent erosionof the edge of the pit.
Completely clear and strip at least 150mm of topsoil from the excavation and the bank areas.Stockpile it in a convenient place, for later use.
146
SEC
TIO
N 5
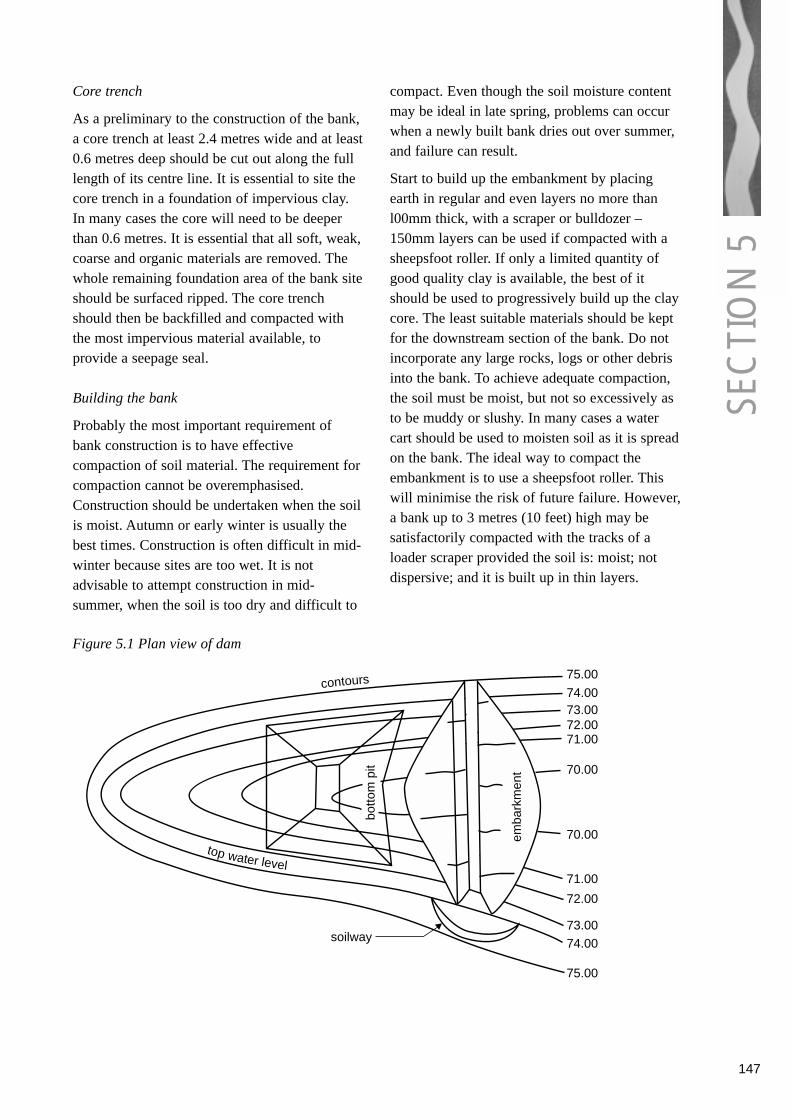
Core trench
As a preliminary to the construction of the bank,a core trench at least 2.4 metres wide and at least0.6 metres deep should be cut out along the fulllength of its centre line. It is essential to site thecore trench in a foundation of impervious clay.In many cases the core will need to be deeperthan 0.6 metres. It is essential that all soft, weak,coarse and organic materials are removed. Thewhole remaining foundation area of the bank siteshould be surfaced ripped. The core trenchshould then be backfilled and compacted withthe most impervious material available, toprovide a seepage seal.
Building the bank
Probably the most important requirement ofbank construction is to have effectivecompaction of soil material. The requirement forcompaction cannot be overemphasised.Construction should be undertaken when the soilis moist. Autumn or early winter is usually thebest times. Construction is often difficult in mid-winter because sites are too wet. It is notadvisable to attempt construction in mid-summer, when the soil is too dry and difficult to
compact. Even though the soil moisture contentmay be ideal in late spring, problems can occurwhen a newly built bank dries out over summer,and failure can result.
Start to build up the embankment by placingearth in regular and even layers no more thanl00mm thick, with a scraper or bulldozer –150mm layers can be used if compacted with asheepsfoot roller. If only a limited quantity ofgood quality clay is available, the best of itshould be used to progressively build up the claycore. The least suitable materials should be keptfor the downstream section of the bank. Do notincorporate any large rocks, logs or other debrisinto the bank. To achieve adequate compaction,the soil must be moist, but not so excessively asto be muddy or slushy. In many cases a watercart should be used to moisten soil as it is spreadon the bank. The ideal way to compact theembankment is to use a sheepsfoot roller. Thiswill minimise the risk of future failure. However,a bank up to 3 metres (10 feet) high may besatisfactorily compacted with the tracks of aloader scraper provided the soil is: moist; notdispersive; and it is built up in thin layers.
147
top water level
contours
emba
rkm
ent
botto
m p
it
75.00
74.0073.0072.0071.00
70.00
70.00
71.00
72.00
73.0074.00
75.00
soilway
Figure 5.1 Plan view of dam
SEC
TIO
N 5

Freeboard and batters
The correct amount of freeboard will vary withthe size of the dam, area of catchment and likelywave action. Minimum freeboard should not beless than 1 metre. Even with good compactionsome vertical settling of the bank should beexpected. Make a 10% allowance for settlement.
For banks up to 3 metres (10 feet) high, thestandard recommended slope of batters is 3:1 onthe upstream side of the bank and 2:1 on thedownstream side. Before building batters steeperthan this, it is important to ensure that it is safeto do so.
148
clay core
cutoff trench
downstream toe
topsoil andgrass cover
permeable material
top water level
upstreamtoe
Figure 5.2 Cross section through dam
Spillway
A correctly designed spillway is essential. Manydams fail due to faulty design or construction ofthe spillway. It must be large enough to handleflood flows without water overtopping the bank.Nor should the flows cause erosion of thespillway or disposal area below the dam. If thespillway has a newly formed earthen surface totake overflows from the dam, a heavy grasscover should be sown and established as quicklyas possible. Keep vehicles and stock off thespillway to maintain vegetative cover. A rule ofthumb for estimating the width of a spillway: itshould equal (in metres) the square root of thecatchment area (in hectares). For example, acatchment area of 9 hectares would require aspillway 3 metre wide. If trickle flows of waterare likely to be produced from the catchmentduring winter and spring, installation of a trickleflow pipe should be considered.
Settlement
Settlement of soil banks is common and anallowance must be made for settlement of thedam embankment. The embankment could settleto a level where it is overtopped by water andfailure will result. Allow 5% of the height of theembankment (along its length) to cater forsettlement. For example, if the intendedmaximum height of the crest is 5 m, theembankment must be built to a height of 5.25 m(an additional 5%) to allow for settlement to adesign crest height of 5 m.
Crest width
The required crest width is a function of thestability requirements of the embankment. At thesame time, the minimum crest width must allowthe safe operation of construction equipment.
SEC
TIO
N 5

149
In the absence of engineering design, a goodguide to estimating the required crest width ofthe embankment is to adopt a minimum width of2.5 m for embankments up to 5 m high. Forembankments higher than 5 m, allow anadditional 0.2 m for every metre in heightgreater than 5 m. For example, if the maximumheight of the embankment is 7 m, the crest widthwould be 2.9 m (the sum of 2.5 + 0.2 + 0.2).
Topsoil
When construction is completed, the stockpiledtopsoil should be spread over the bank. Suitablegrass species should then be sown to stabilise thebank and prevent it eroding. Trees should not beused on banks because their larger root systemcan disturb the compacted mass. Anotherimportant feature of placing topsoil back overthe bank is that, when grassed, it helps preventthe clay bank from drying out and cracking. Ifrilling of topsoil occurs, pack pasture sodscomplete with soil into any rills.
Stock traffic damage
Grazing stock will readily remove plant cover bygrazing and trafficking. Further, they are likelyto cause structural damage as they followpreferred routes.
Fencing-out of the dam (along with a reticulationsystem) should be considered. If this is not anoption, short lengths of fence could be used todeflect stock.
Outlet pipe(Water Authority of Western Australia, 1993)
An outlet pipe should be installed in all gullydams to satisfy the requirement to bypasssummer stream flow and allow flushing of salinewater and silt from the dam. They can bedifficult to install successfully and have beenknown to leak or fail. Outlet pipes should beinstalled according to engineers’ specifications,which would include cut-off collars, concreteencasement, inlet strainer, suitable gate valveand rock or concrete pitching at the outlet.
5.4 Minimise salinity of water
Minimising salinity of groundwater
Saline groundwater inflows can affect bores insome areas especially late in summer.
There is little that growers can do to reduce thesalinity of regional groundwater tables.However, they can ensure that their groundwaterabstraction bores do not become saline byingress of saline water.
❑ To prevent salinisation of irrigation bores,regularly test the salinity of the bore water.Reduce or cease drawing water from thebore when salinity increases.
Minimising salinity of surface water
Annual evaporation in the south west is around1600 mm, Therefore dam levels can be reducedby up to 1.5 metres, or more on windy, exposedsites, by evaporation alone. Although water islost, the amount of salts remains the same in alesser volume of water. This process, calledevapo-concentration, raises the salt levels in thedam.
❑ Monitor salinity of dam water regularly.
Salt in dam water comes from saline run-offfrom saline land or saline groundwater seepage.
❑ Reduce the risk of dams becoming saline byapplying best practices such as reducingdischarge from saline groundwater seepsand reducing run-off from saline land(described in Section 2.4 under ‘Soilsalinity’).
Strategically placed trees planted around damsreduce wind velocity and shade the watersurface, significantly reducing evapo-concentration of salt in the dam.
❑ Minimise the salinity of stream and damwater by planting windbreaks of nativetrees around dams to shelter and shade thewater surface, thus reducing evaporation.
The dam water remaining in autumn is alwayssaltier than in early summer. This water should
SEC
TIO
N 5

be allowed to flush through in early winter byopening the gate valve underneath the dam wall.Early winter creek flows are often also salinebecause salt evapo- concentrated on the soilsurface is washed into the stream. Growersshould test the salinity of the stream flow with ahand held EC meter, reducing flow from the gatevalve and allowing the dam to fill when thestream flow reaches its freshest level.
❑ Ensure that the water is allowed to flowthrough gully dams, especially in May andJune.
Wetlands, especially those in flat terrain, can beprotected to a degree by keeping an adequatebuffer of salt tolerant native vegetation aroundthem. Vegetation uses groundwater, helping tokeep the water table lower, and provides shade,reducing evapo- concentration of salts at the soilsurface
❑ Protect wetlands from salinity by creatingvegetated separation buffers and plantinghigh water use and salt tolerant vegetationin the buffer areas (Section 5.3).
5.5 Prevent contamination ofwater by chemicals andfuels
The main sources of chemical pollutants onfarms are:
Diffuse sources. Herbicides and insecticidesapplied to crops or soils that may enter waterresources by spray drift, leaching and run-offfrom rainfall or excessive irrigation.
Best practices for chemical application are theessential first step to minimising chemical exportfrom diffuse sources. Refer to Section 6.4 under‘The product label’ and ‘Choosing the safestchemical pesticide’ and this section ‘Chemicaluse near water resources’.
Soil and fertiliser management practices thatreduce nutrient export are also crucial tominimise export of chemicals from croppedland. These practices are described elsewhere inthis Manual:
- Minimise spray drift from the application ofpesticides (Section 10.1)
- Minimise leaching of nutrients (Section 3.3)
- Minimise or virtually eliminate erosion(Section 2.1)
- Correct drainage practice (Section 2.3).
Best practices for preventing pollution bychemicals and fuels from point sources aredescribed below and in Sections 6.2 and 6.3.
Point Sources. Spilt fuels and chemicals. Hazardareas are:
- chemical storage facilities
- fuel tanks
- transport and transfer of chemicals and fuels
Storing and dispensing fuels andchemicals
To protect water resources, growers shouldalways:
❑ Conduct best practice for storage,transport and dispensing of fuels andchemicals.
Details of these best practices can be found inSection 6.2 and 6.3, ‘Chemical Management’.
Fuel and chemical storage systems in PublicDrinking Water Source Areas (PDWSAs) andUnderground Water Pollution Control Areas(UWPCAs) require permit approval from theWater and Rivers Commission. Growersoperating in these areas should liaise with theCommission to ensure that their existing storagefacilities comply with control regulations.
The Water and Rivers Commission policy‘Pesticide Use in Public Drinking Water SourceAreas’ applies special controls in these areas.
❑ Pesticide formulations or concentratesshould not be stored, mixed or dilutedwithin the following areas without the priorapproval of the WRC:
- Reservoir protection zones.
- Priority 1 areas.
- Within 50 metres of any water body.
150
SEC
TIO
N 5

Toxicity of chemicals to aquatic life
The level of toxicity and persistence ofpesticides in the environment is generally notstated on the label. However, the label willcontain environmental warning statements asrequired under the relevant labelling code, forexample ‘dangerous to fish’. The LD50 andpoison schedule of a pesticide (Section 6.4) arenot good indications of how long it may persistin the environment or how toxic it may be toorganisms other than mammals. To be safe, allpesticides, except biological insecticides (e.g.Bacillus thuringensis) should be assumed to betoxic to aquatic life and used with cautionaccordingly.
Certain groups of insecticides are particularlytoxic to aquatic life, for example (AustralianBureau of Rural Sciences, 2001):
- All pyrethroids (active ingredient ending in -thrin, for example cypermethrin) and rotenone(a plant derivative) are very toxic to fish andcrustacea and may persist in the aquaticenvironment for several weeks.
- Most organo-phosphates (name of activeingredient generally contains -thion, -oate, -phos or -fos), for example clorpyrifos.
- Organo-chlorines.
- Some carbamates, for example, methiocarband propoxur.
Most wetting agents used with herbicides aretoxic to aquatic fauna, particularly frogs(Thompson, W.T.; 1998). Herbicides that areregistered for use near wetlands have ‘frogfriendly’ wetting agents.
The triazine group of soil pre-emergentherbicides, which includes atrazine, is anexample of chemicals that are at high risk ofbeing transported into streams, wetlands anddams by run-off and erosion. The herbicidalproperties of triazines can persist for up to fourmonths.
❑ When selecting pesticides and additives foruse near water bodies, be aware of thetypes that are particularly toxic to aquaticlife and avoid using them near sensitivewetlands or aquaculture ponds.
Selection of pesticides to minimiseenvironmental impact(Australian Bureau of Rural Sciences,Agriculture, Fisheries and Forestry, 2001)
Soil acts as a major sink for many pesticides thatare added through soil incorporation or aerialapplication. Soil properties, pesticide propertiesand environmental conditions govern thebehaviour of pesticides in the soil environment.Some of the factors that should be consideredwhen selecting pesticides to minimise impact onthe environment and water quality are:
1. Pesticide properties
The sorption coefficient, Koc, describes therelative affinity or attraction of the pesticide tosoil particles and therefore its mobility in soil.Low Koc’s indicate a low capacity to bind tosoil organic carbon and therefore highmobility. High Koc’s indicate the compound ismore likely to bind to soil organic carbon andhence, low mobility.
The chemical or biological degradation half-life, t1/2, is a measure of persistence of thepesticide in soil.
Aquatic toxicity, LC50, is a measure of theability of the pesticide to cause 50% mortalityin aquatic test species.
2. Soil properties
Hydraulic permeability or conductivity is ameasure of the soil’s ability to allow water topercolate through the soil profile.
Organic matter and clay are the important soilproperties that provide sites for pesticides tobind, thus reducing their mobility andincreasing their opportunity to be degraded bysoil micro-organisms.
Slope affects the potential for water to run offthe land surface.
3. Management practices
Pesticide application frequencies and ratesdetermine the total amount applied. Forexample, lower frequencies and rates reducethe potential for contamination.
151
SEC
TIO
N 5

Method of application (e.g. band spraying)affects the amount of pesticide subject totransport by water. For example, if applieddirectly to soil, there is a greater probabilitythat more of the applied pesticide will beavailable for leaching or run-off than if thechemical is applied to the foliage. If thepesticide is incorporated into the soil, leachingmay be the most important loss pathway.Pesticide applied to the foliage may be lost tothe atmosphere or decomposed by sunlightthereby reducing the amount available forwash-off and transport to water bodies.
4. Irrigation practices
Irrigation practices can also determine the losspathways of pesticides. Pesticides often movewith water, so the less excess water that isapplied, the less potential there is for aherbicide to move past the crop root zone orto run-off in surface water. Rainfall can alsowash off significant quantities of pesticidesfrom the treated zone.
Estimating risk of pesticide contamination ofwater resources(Australian Bureau of Rural Sciences,Agriculture, Fisheries and Forestry, 2001)
The risk of a particular pesticide contaminatingour waterways depends on field characteristics,application factors and pesticide properties.Considering the inadequacy of the availableinformation, it is proposed to estimate therelative risk of pesticides to surface orgroundwater using soil (organic matter andtexture) and pesticide properties (watersolubility, soil adsorption, degradation or
persistence and toxicity). These factors for achemical can be easily obtained. Soil adsorptionor binding is measured by Koc, which is thetendency of pesticide to be attached to soilparticles. Higher Koc values (> 1000) indicate achemical that is strongly attached to soil and isless likely to move unless soil erosion occurs.Lower Koc values (< 300-500) indicate thatchemicals tend to move with water and have thepotential to leach or move with surface run-off.Solubility is a measure of how easily a chemicalmay be washed off the treated site, leached intothe soil, or move with surface run-off.
Chemicals with solubilities of less than 1 mg/Lin water tend to remain on the soil surface. Theytend not to be leached, but may move with soilsediment in surface run-off if soil erosion occurs.Chemicals with water solubility greater than 30mg/L are more likely to move with water eitherthrough the soil profile or in surface run-off.
Persistence of a chemical is measured in termsof half-life. In general, the longer the half-life,the greater the potential for chemical transport tonon-treated sites.
Table 5.3 is designed to help the grower toassess the risk to water quality of some commonpesticides. It shows three factors that indicaterisk of chemical export – adsorption or bindingto soil particles, water solubility and degradationhalf-life – and two toxicological parameters –drinking water health guideline value andaquatic toxicology value. Not all the pesticidesregistered for use in crop production in Australiaare listed in the table, but some of those that arecommonly used or that have been detected insurface waters or groundwater are included.
152
SEC
TIO
N 5

153
SEC
TIO
N 5
Tabl
e 5.
3 R
elat
ive
risk
est
imat
es f
or c
onta
min
atio
n of
wat
er r
esou
rces
for
som
e co
mm
only
use
d pe
stic
ides
in
crop
pro
duct
ion
(A
ustr
alia
n B
urea
u of
Rur
al S
cien
ces,
Agr
icul
ture
, Fis
heri
es a
nd F
ores
try,
200
1)
*H
ighe
r so
lubi
lity=
high
leac
hing
and
run
-off
ris
ks.
**L
ow K
oc=
low
aff
inity
to s
oil p
artic
les=
hig
h m
obili
ty in
soi
l.
***
H
alf-
life
is th
e tim
e ta
ken
for
half
of
the
chem
ical
to d
egra
de in
the
soil.
****
Low
er d
rink
ing
wat
er h
ealth
gui
delin
e va
lues
= h
ighe
r to
xici
ty in
dri
nkin
g w
ater
to h
uman
s (N
HM
RC
/AR
MC
AN
Z, 1
996)
****
*L
ower
val
ues
of a
quat
ic L
C50=
hig
her
toxi
city
to f
ish
and
crus
tace
a
Pes
tici
deR
ate
of
W
ater
Sorp
tion
H
alf-
life
Rel
ativ
e ri
sk r
atin
g fo
rD
rink
ing
A
quat
ic
appl
icat
ion
so
lubi
lity
Koc
(day
s)
wat
erhe
alth
L
C50
(Lor
kg
(mg/
L)*
(mL
/g)*
***
*gu
idel
ine
****
*a.
i. /h
a)
valu
e
mg/
L)
****
Com
mon
nam
eT
rade
nam
eL
each
ing
Run
-off
2,4-
D a
min
e (H
) V
ario
us0.
25 –
2.3
30
0000
0 20
2
– 16
H
igh
Med
ium
0.03
10
0000
Atr
azin
e (H
) V
ario
us2
– 4.
0 35
39
– 1
7340
-10
0 H
igh
Hig
h 0.
02
4500
Bro
mox
ynil
(H)
Bro
mic
ide,
Buc
tril
0.5
– 1.
0 13
0 10
000
7 –
14
Low
L
ow0.
03
50
Car
bary
l (I)
B
ugm
aste
r1.
0 –
2.0
120
300
7 –
28
Med
ium
M
ediu
m0.
03
1300
Chl
orpy
rifo
s (I
) C
hlor
fos,
Lor
sban
0.5
– 2.
5 1.
4 60
70
30 -
120
Low
H
igh
0.01
3
Cyp
erm
ethr
in
(I)
Cym
bush
, C
yper
care
0.1
– 0.
5 0.
004
1000
00
4 –
60
Low
H
igh
na
2
Dic
amba
(H
) B
anve
l0.
25-
2.0
6500
2
7 –
28
Hig
h L
ow
0.1
1350
00
Dim
etho
ate
(I)
Rog
or,
Dan
adim
0.2
– 0.
5 23
800
16 –
52
2 –
16
Med
ium
L
ow
0.05
62
00
Diq
uat (
H)
Reg
lone
0.15
– 0
.3
7000
00
1000
1000
L
ow
Hig
h 0.
005
2100
0
Diu
ron
(H)
Diu
ron,
Diu
rex
0.9
– 2.
5 36
40
0 90
–18
0 M
ediu
m
Hig
h 0.
03
5600
End
osul
fan
(I)
Thi
odan
, End
osul
fan
1.0
– 2.
5 0.
32
1240
0 25
– 5
0L
ow
Hig
h 0.
03
1.5
Fena
mip
hos
(N)
Nem
acur
5 –
10.0
40
0 10
0 30
– 5
0 H
igh
Low
0.
0003
72
.1
Gly
phos
ate
(H)
Rou
ndup
Low
M
ediu
m1.
0 86
000
Imid
aclo
prid
(I)
C
onfi
dor
0.05
– 0
.1
610
320
– 48
0 40
-19
0 M
ediu
m
Med
ium
na
2110
00

Pes
tici
deR
ate
of
W
ater
Sorp
tion
H
alf-
life
Rel
ativ
e ri
sk r
atin
g fo
rD
rink
ing
A
quat
ic
appl
icat
ion
so
lubi
lity
Koc
(day
s)
wat
erhe
alth
L
C50
(Lor
kg
(mg/
L)*
(mL
/g)*
***
*gu
idel
ine
****
*a.
i. /h
a)
valu
e
m
g/L
) **
**C
omm
on n
ame
Tra
de n
ame
Lea
chin
g R
un-o
ff
Met
sulf
uron
A
lly0.
04 –
0.0
5 27
90
35
14 –
180
L
ow-H
igh
Low
0.
03
1500
00
met
hyl (
H)
Met
hom
yl (
F)
Lan
nate
, Mar
lin0.
45 –
1.0
57
900
72
14 –
30
Hig
h M
ediu
m0.
03
3400
Para
quat
(H
) G
ram
oxon
e, N
uqua
t0.
3 –
0.5
7000
00
1000
000
1000
L
ow
Hig
h 0.
03
3200
0
Pend
imet
halin
(H
) St
omp
0.6
– 1.
0 0.
3 50
00
90 -
120
Low
H
igh
0.3
140
Prom
etry
n (H
) G
esag
ard
0.5
– 2.
5 33
40
0 30
– 9
0 M
ediu
m
Hig
h na
55
00
Sim
azin
e (H
) G
esat
op1.
5 –
3.0
6.2
103
-277
27
-10
2 H
igh
Hig
h 0.
02
1000
00
Tri
flur
alin
(H
) T
rida
n, Y
ield
0.5
– 1.
0 0.
22
8000
45
– 2
40
Low
H
igh
0.05
20
154
Exa
mpl
es f
rom
Tab
le 5
.3
1.A
traz
ine
has
low
soi
l sor
ptio
n (K
oc),
mod
erat
e so
lubi
lity
and
high
leac
hing
ris
k, a
nd ta
kes
a lo
ng ti
me
to d
egra
de in
the
soil.
Thi
s in
form
atio
n, to
geth
er w
ithth
e fa
ct th
at a
traz
ine
is a
pplie
d to
the
soil
as a
her
bici
de, i
ndic
ates
that
ther
e is
a m
oder
ate
to h
igh
risk
of
it po
llutin
g gr
ound
wat
er. T
he a
ctua
l ris
k w
illde
pend
on
fact
ors
such
as
the
soil
type
, rai
nfal
l, tim
ing
of a
pplic
atio
n, c
hem
ical
use
and
irri
gatio
n pr
actic
es.
2.C
yper
met
hrin
is e
xtre
mel
y to
xic
to f
ish
and
crus
tace
a an
d m
oder
atel
y pe
rsis
tent
in th
e so
il. A
lthou
gh it
has
a lo
w le
achi
ng r
isk,
spe
cial
car
e is
req
uire
d to
prev
ent i
t fro
m e
nter
ing
sens
itive
wat
er b
odie
s in
spr
ay d
rift
or
run-
off.
SEC
TIO
N 5

155
SEC
TIO
N 5
Chemical use near water resources
Farm chemicals used in operations have thepotential to pollute water resources by run-offand spray drift into surface waters andinfiltration to groundwater.
The likelihood of a chemical being present in awater resource at levels high enough to affectpublic health or the aquatic biota is determinedby several factors:
- Level of use of the chemical in the catchment.
- Mobility of the chemical in the catchmentenvironment.
- Toxicity of the chemical and its metabolites.
- The length of time that the chemical or itsmetabolites remain in a toxic state in theenvironment.
- The sensitivity of individuals in a populationto the chemical or chemicals.
- The extent to which users adhere to thedirections for use on the product label, such asthe application rate.
- Container and waste disposal.
❑ To minimise the risk of water resourcecontamination when using chemicals nearwater bodies:
- Always use pesticides according to theirlabel directions (Section 6.4).
- Avoid mixing or transferring pesticidesand additives into spray tanks anywherenear water bodies.
- Minimise run-off; consider the impactsof irrigation weather, irrigation andslope.
- Leave sufficient time for chemicals to beabsorbed into plants or soil beforeirrigating.
This reduces the risk of the chemicals beingwashed off the site. Do not over-irrigate (Section4.2), as this increases leaching of chemicals andnutrients. Similarly, do not spray before orduring rain.
Sloping sites should be protected by surfacewater control earthworks (Section 2.1) andcultivated according to best practice, minimisingtillage. These practices minimise run-off anderosion, thereby minimising export of chemicalsfrom the site into water bodies.
❑ Triple rinse used chemical containers anddispose of them at DrumMuster recyclingfacilities (Section 9.1).
❑ Remove any unused chemical concentratesfrom drinking water source areas anddispose of old residual chemicals throughthe ChemCollect’ scheme (Section 9.1).
Care should be taken to avoid spray drift overdams, streams and wetlands, especially whenusing chemicals that are highly toxic to aquaticlife (Table 5.3).
❑ Use best practices to avoid spray drift(Section 10.1) when spraying any pesticidesnear water bodies and wetlands.
❑ On no occasion should misters or aerialspraying be used over or near water bodies.
Vegetation around water bodies may give some(but not complete) protection against spray driftentering water bodies.
❑ Maintain buffer areas that are not sprayedaround sensitive aquatic environments(Section 5.3, ‘Separation buffers for sensitivewater resources)
(Section 10.1 ‘Spray plans and spray driftawareness zones’).

156
References
Australian Bureau of Rural Sciences,Agriculture, Fisheries and Forestry, 2001.Managing Pesticides for Sustainable CropProduction and Water Quality Protection.
Cronin, D., 1998. The Effectiveness ofStreamLining in Improving the Water Quality ofAgricultural Drains in the Peel-HarveyCatchment, Western Australia. MurdochUniversity, Honours Thesis.
Evangelisti et al, 1998. A Manual for ManagingUrban Stormwater Quality in Western Australia.Water and Rivers Commission.
Heady, G. and Guise, N., 1994. StreamLining, anEnvironmentally Sustainable Drainage Networkfor the Swan Coastal Plain (Peel- HarveyCatchment).
Land and Water Resources Research andDevelopment Corporation (LWRRDC) NationalRiparian Lands Management and RehabilitationProgram, 1999. Streambank Stability. RiparianManagement Fact Sheet 2.
Land and Water Resources Research andDevelopment Corporation (LWRRDC) NationalRiparian Lands Management and RehabilitationProgram, 1999. Water Quality. RiparianManagement Fact Sheet 3.
Land and Water Resources Research andDevelopment Corporation (LWRRDC) NationalRiparian Lands Management and RehabilitationProgram, 1999. River Ecosystems. RiparianManagement Fact Sheet.
Lantzke, N. and Galati, A., 1999. Codes ofPractice for Vegetable Production on the SwanCoastal Plain. Agriculture Western AustraliaMiscellaneous Publication 37/99.
Lantzke, N., 1995. Nitrates in the GroundwaterBeneath Horticultural Properties. WesternAustralian Department of Agriculture WesternAustralia Farmnote 2/95.
NHMRC, ANZECC, ARMCANZ, 1996.National Water Quality Management StrategyGuidelines for Sewerage Systems: Use ofReclaimed Water.
Rose, B., 1998. Catchment Management SupportSystem Computer Simulation of Nutrient Flows,Scott River Catchment. Unpublished.
State of Victoria Department of NaturalResources and Environment, 1997. How to avoiddam construction failures. Landcare note.
Thompson, W.T., 1998. Agricultural Chemicals ,Book 1 Insecticides, 14th edition.
Water and Rivers Commission, 2002.Monitoring Bores (Slotted Casing). WaterQuality Protection Note.
Water Authority of Western Australia, 1993.Guidelines for the Design and Construction ofSmall Farm Dams in the Warren Area. ReportNo WP 159.
SEC
TIO
N 5

157
SEC
TIO
N 5
APPENDIX 5.1
Groundwater monitoring bore installation(Water and Rivers Commission, 2002)
These notes apply to construction of screened orslotted casing groundwater monitoring bores.Bores described in these notes are primarilyrequired to monitor the effects on groundwaterresulting from leakage of stored matter or thedisposal of wastes. Bores consist of a verticalcased hole, with the lower casing screened orslotted to permit ingress and extraction ofrepresentative samples of groundwater foranalysis. Bores must also permit standinggroundwater levels (SWLs) to be determined.
The location of the slotted/screened intervaldepends on the type of soil strata penetrated andthe nature of contaminant being monitored.Some contaminants float on the water table,others mix with the water body, and others willsink into the base of the aquifer. Sometimes anest of bores will be needed at a single locationto permit effective monitoring for concentrationsof contaminants at different depths.
Siting of bores
Bores are normally required both upstream anddownstream (in the direction of groundwaterflow) to monitor changes in water level andquality across a site. In hard rock areas, boresmust be located within geological features, forexample faults and weathered zones that aremost likely to transmit groundwater.
Where an existing production bore isstrategically located, it may be accepted formonitoring purposes in lieu of a new monitorbore, provided the construction technique isunlikely to interfere with the accuracy ofcontaminants under investigation. The boresshould be located as close as practical (at leastwithin 20 metres) to the sites shown on thegroundwater monitoring plan.
Bore construction
The recommended drilling methods forunconsolidated soils are hollow-flight auger,
dual wall reverse circulation, cable tool rig orsimilar. For hard rock areas, down-hole hammeror similar percussion techniques should be used.No drilling mud or other additive, which mayresult in permanent sealing-off of part of a bore,should be used during the bore construction,unless approved by the Water and RiversCommission.
Contamination of the bore or its surroundsshould be avoided during drilling and casinginstallation. Water contaminants, lubricants,oils, greases, solvents, coatings and corrosionprone materials may affect the suitability of thebore for subsequent groundwater monitoring.
When the bore is to be used to monitor for thepresence of contaminants, all drilling andsampling equipment should be thoroughlycleaned before drilling commences.
For bores monitoring trace contaminants, steamcleaning of the rig may be necessary beforedrilling each bore hole. Care must be taken thatcasing materials are free from contaminants priorto installation and any water used in constructionmust be tested to ensure it is free ofcontaminants.
Depth of bores
Shallow (S) bores should be drilled to terminateat least 5 metres below the standing water level(SWL) in an unconfined aquifer. They are usedto monitor water attributes at or near the watertable. Where no defined SWL is determined,drilling should continue to a depth where a lowpermeability (< 10–9 metres / second) soilhorizon limits further water intrusion, or asagreed with the Commission.
Intermediate (I) depth bores are used to monitorthe middle / lower levels of an non-confinedaquifer.
Deep (D) bores are used to monitor water qualitywithin confined aquifer. Confined aquifersrequire isolation from an upper aquifer by use ofpackers and an impervious sealant. Typical boreconfigurations are shown in Figure A5.1.

158
Drill core samples and bore logging
An accurate field drilling log should be recordedand a clean representative sample of the soilprofile collected at all changes of strata and at amaximum of 3 metre depth intervals for allbores. These samples should be stored in calicosample bags for examination by personnelcompetent and experienced in hydrogeology.These people should prepare comprehensivebore logs and submit this with relevant boreconstruction details to the Commission.
Drilling tolerance
All bores should be drilled and cased straightand not deviate from the vertical by more than200 millimetres, either cumulatively or betweenconsecutive six metre points. For non-standard50 mm internal diameter bores (if accepted), therecommended method of testing is by lowering a48 mm outside diameter x 500 mm long steelpipe section to the base of the bore withoutdetecting apparent resistance.
Drilling diameter
Bores should be drilled at least 70 mm in excessof the permanent casing diameter andtemporarily cased with drill pipe or rigid casing,except where temporary sealing material isapproved. Drilling may be un-cased throughmaterial that remains free-standing, e.g. rock.
Permanent casing
Casing material should be selected to suit boreengineering requirements and most importantlythe nature of the contaminant subject toinvestigation. Steel and glass fibre casings aresuitable for monitoring most organic substancesand generally where bores exceed 50 metres indepth. Polyvinyl chloride (PVC) or glass fibrecasings are suited to monitoring most inorganicsubstances particularly in corrosive waters.Where organic materials are being monitored,bore casing should have mechanical joints (withlocking mechanism) to avoid contamination bysolvents. Lubricants must not be used on casingjoints.
Unless otherwise approved, all bores should becased with at least an 80 mm internal diameter(ID) pipe placed to the depth described in thetable above. Bore casing as small as 50 mm IDmay be accepted where a suitably sizedsubmersible sampling pump is available on-siteat all times. The bore casing should extend 500-700 millimetres above the ground surface.
The bottom of the casing should be sealed withgrout or a cap. Any over-drilling below thebottom of the casing should be back-filled withmaterials equivalent to the original strata.
Screens / slotting of casing
Proprietary brand screens may be used whichexhibit the following characteristics:
- Not subject to corrosion either by groundwateror bore maintenance chemicals,
- Screen size suited to the monitored soil type,
- Not be subject to blockage and readilycleanable where bore maintenance is required.
For slotted PVC casing there should be aminimum of 100 slots per metre, each slot to be50-55 mm long on the inside of the casing, andhave between 0.2 and 1 mm opening width. Acommon width is 0.4 mm. The slots should behorizontal when the casing is installed, 25 mmapart in the vertical direction, arranged in threeequal spaced columns around the casing.External filter socks may be used to exclude veryfine soil from the casing.
Granular pack
Where fine soils may cause bore siltation, theannulus between the permanent casing and thehole perimeter should be carefully and evenlyfilled to a minimum of 2 metres above thescreened interval with a graded granular pack.The level of the granular material shall be keptabove the bottom of the temporary outer casingas it is withdrawn.
The pack should be uniformly graded between aminimum size material retained on a 1.0 to 1.6mm sieve and a maximum size passing a 3.2 mmsieve (unless otherwise approved). The granular
SEC
TIO
N 5
159
SEC
TIO
N 5
pack should consist of clean coarse silica sand orsimilar material which will not contaminate thebore.
Sealing of the annulus above or betweenmonitored intervals
Cement slurry or bentonite should be used toseal the bore casing annulus to prevent watermovement down the casing from the surface orbetween aquifers. The seal may be achievedusing bentonite pellets slowly inserted down theannulus with regular depth checks. Sufficientclean water should then be poured down theannulus to cause the pellets to fully hydrate.
Centralising of Casing
The permanent casing should be inserted insideany temporary casing. The temporary casingshould be withdrawn vertically as the hole isevenly back-filled to ensure the permanentcasing remains centrally located, straight andvertical.
Bore development
Bores should be fully developed by pumping,bailing, valve surging or air lifting and cleanedprior to cementing around the top of the bore.Where any nearby soil strata may becontaminated, care must be taken to preventwater re-circulation via the bore annulusresulting in contamination of other strata levels.
At suspected contaminated sites, extracted soiland groundwater should be contained andexported to a secure site for disposal as approvedby the Department of Environmental Protection’sWaste Management Division.
Bore head completion
Shallow bores should be completed by back-filling their casing annulus up to 1.5 metresbelow the surface with a suitable stone-free,non-lumpy and free running soil. Intermediateand deep bores should be back-filled withcement grout or Bentonite seal above a packer.
A 1.3 metre minimum length of steel casingprotruding a maximum 700 millimetres above
the surface should be concreted in to protect thetop of the bore(s). Typical bore-head details areshown in Figure A5.1. Where traffic is likelyover or near the bore-head, it should finish justbelow the surface and be fitted with a trafficablecover avoiding a loading on the bore casing andminimising the threat of contaminants enteringthe bore.
The steel protection casing should be fitted witha lockable steel cap or other vandal resistantdevice approved by the Commission. All boresshould have their registration numberpermanently affixed at an easily visible site tothe outer casing (embossed plaque or weldedcharacters, not painted).
Taking water samples from bores
In order of preference, the following samplingmethods may be used:
- Dedicated pump i.e each monitor bore has itsown installed pump
- Mobile borehole pump i.e pump is movedbetween successive bores, with carefuldecontamination of equipment with eachmove.
- Through flow bailer (sampling tube fitted withflap valve in base which closes as bailer israised).
- Bucket style tube bailer.
The Commission recommends the followingmeasures as good practice to enhance monitoringaccuracy:
- Sample progressively from upstream todownstream groundwater flow monitor points.
- Sample bores expected to be less contaminatedbefore moving to more contaminated bores.
- Use blank or known quality samples toconfirm laboratory analytical accuracy.
- Keep sampling equipment in a clean dust freecontainer when not in use.
- Ensure that a well-trained and experiencedperson is used to take measurements andcollect samples.
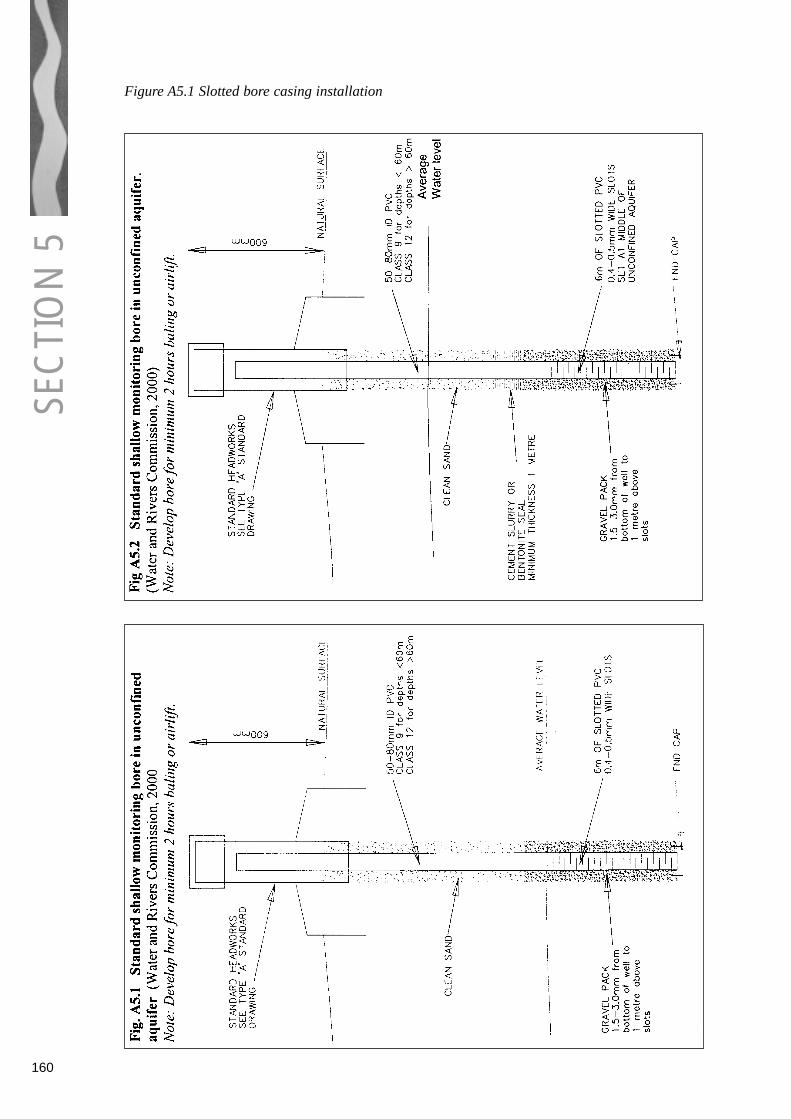
Figure A5.1 Slotted bore casing installation
160
SEC
TIO
N 5

Chemical ManagementSE
CTI
ON
6
This section outlines best practices for chemicalmanagement. It contains extra technicalinformation on:
- Transport of fuels and chemicals
- Loading and unloading of pesticides
- Pesticide spills
- Storage of fuels and chemicals
- Protective clothing
Other best practices that relate to good chemicalmanagement can be found in:
• Section 5.5 ‘Toxicity of chemicals to aquaticlife’.
• Section 10.1 ‘Minimise spray drift from theapplication of pesticides’.
6.1 Minimise use of chemicalsthat are toxic to humans orthe environment
The first and most obvious way to reduce theimpacts of those chemicals that pose risks to theenvironment and human health is to use less ofthem. The main way to achieve this is byimplementing an Integrated Pest and DiseaseManagement (IPDM) strategy. There are manymanagement practices that do not involve theuse of toxic pesticides and that will reduce theincidence and severity of pest and diseaseoutbreaks. IPDM is an approach to make pestcontrol more effective by coordinating thesenon-chemical and chemical methods of pestcontrol. Non-chemical and ‘soft’ chemicaloptions are used where possible before resortingto more toxic pesticides. IPDM is outlined inSection 7 ‘Controlling Pests and Diseases’.
❑ Use Integrated Pest and DiseaseManagement Strategy to minimise use ofchemicals (Sections 7.1- 7.3).
❑ Where possible, select chemicals that areleast hazardous to the surrounding naturaland human environment (Section 5.5).
A table of common pesticides and environmentalrisk factors such as acute toxicity, persistence inthe environment and leaching can be found inSection 5.5 ‘Toxicity of chemicals to aquaticlife.’
6.2 Transport chemicals andfuels safely
Safe transport of fuels on-farm
❑ Ensure that mobile fuel tankers on-farmare fabricated to approved, `AustralianStandards Association (ASA) design, withfail-safe spill prevention devices.
Mobile fuel tankers over 250 litres capacityshould be parked on a containment pad whenfilling and dispensing fuel. Figure 6.2 showsspecifications for an approved containment padand dispensing area for mobile fuel tankers.
When transporting and dispensing fuel fromdrums of 40- 250 litres capacity, ensure that thedrums are secured on a vehicle tray with raisededges, so they cannot fall off. Dispense fuel byhand pump from the top of the drum with thedrum standing upright.
Safe transport of chemicals
The following best practices should always beadhered to when transporting chemicals (WADept of Agriculture, 2001).
❑ Never carry chemicals in the cabin of avehicle, or on any vehicle containing food,feedstuffs or fertiliser.
❑ Transport chemicals safely and securely inthe back of a truck or utility that has a traywith sides and a tailgate, lined with animpervious material.
Non-porous tray beds are preferred to woodenbeds because they can be easily decontaminatedin the event of accidental spillage. Make surevehicle is in good operating condition to helpreduce the chance of an accident.
162

SEC
TIO
N 6
❑ Always carry correct documentation,displayed in a prominent position in thecab, describing the dangerous goods thatare on board.
❑ If required, comply with other provisions ofthe Dangerous Goods (Transport, Road andRail) Regulations 1999, such as theplacarding of vehicles, personal protectiveclothing and public liability insurance.
❑ Always carry a spill kit and set ofappropriate protective clothing in thevehicle and be prepared for pesticide spill(see ‘Chemical spills’, Section 6.3).
❑ In the event of a spill in a public place,advise the local shire. In the event of amajor spill local government would contactthe Department of EnvironmentalProtection and emergency organisations toinitiate appropriate actions.
If a chemical spill occurs in a public place, forexample on a road or in a town, or is likely toendanger public health and safety, advise thelocal government authority so that they canmanage the clean-up. If the spill is massive,then the LGA will get the Fire and RescueService involved, and call out the HealthDepartment, Department of EnvironmentalProtection and Water and Rivers Commissionspecialists if necessary.
If a spill is likely to cause serious environmentalpollution, then the Department of EnvironmentalProtection must be alerted. If residue inagricultural produce is a possible consequence,then the Department of Agriculture WesternAustralia should be alerted, as the AgriculturalProduce (Chemicals Residues) Act 1983 mayneed to be invoked. If the spill was caused by alicensed Pest Control Operator, then under theterms of their licence, they must notify theHealth Department.
Loading and unloading pesticides(University of Nebraska Cooperative Extension,
2001)
Wear work clothing and chemical resistantgloves even when handling unopened pesticide
containers, in case the container should leak.Also, carry protective clothing and equipment inthe cabin of the vehicle. It will be needed if aspill or other pesticide-related accident shouldoccur.
Thoroughly inspect all containers at the time ofpurchase before loading. Accept them only if thelabels are legible and firmly attached. Check allcaps, plugs or bungs and tighten them ifnecessary. If leakage has occurred, do not acceptthe container.
Handle containers carefully when loading; don’ttoss or drop them. Avoid sliding containers overrough surfaces that could rip bags or puncturerigid containers. Know safe handling procedureswhen using fork lifts. Secure all containers to thetruck to prevent load shifts and potentialcontainer damage. Protect containers made ofpaper, cardboard or similar materials from rainor moisture.
Unloading pesticides
Never leave pesticides unattended. You arelegally responsible if people are accidentallypoisoned from pesticides left unattended in yourvehicle. Move the pesticides into the storagefacility as soon as possible. Inspect the vehiclethoroughly after unloading to determine if anycontainers were damaged or any pesticide leakedor spilled.
6.3 Store chemicals and fuelssafely
The impacts of chemical and fuel pollution onwater resources are outlined in Section 5.5.
Safe storage of fuels (Water and Rivers Commission, 2000)
Leakage and spillage of fuels are the commonestaccidents resulting in pollution of water and soilon farms.
Common causes of accidental spillage arejamming of dispensing nozzles, broken hoses,leaking or broken fuel lines in motors and
163
SEC
TIO
N 6
accidental rupture of mobile fuel tanks. The risksof occurrence of these accidents can be greatlyreduced by using appropriate, well-maintainedequipment:
❑ Ensure that all tanks, pumps, hoses andfittings for storage, transport anddispensing of fuels are fabricated andinstalled to Australian StandardsAssociation (ASA) designs and properlymaintained to safeguard against leaks andaccidental spillage.
Simplified best practices for the fabrication andinstallation of fuel storage tanks on farms are asfollows:
Tank and equipment fabrication
Fuel tanks should be constructed to ASAStandards AS 1692, 1989. ‘Tanks for flammableand combustible liquids’.
ASA approved valves and hoses should be fitted.The transfer nozzle should be of an approvedhand held design such as that used at retail fueloutlets, with a valve that is held open by handpressure and that cannot be left jammed openduring transfer.
Containment pads
Storage tanks should be located on acontainment pad that can effectively capture andcontain spills. Figures 6.1 and 6.2 illustratespecifications for containment pads for fixed andmobile fuel tanks. They should include thefollowing:
• Construction of reinforced concrete and cleansand fill with a waterproof membraneunderneath.
• Tank footings of concrete, not extendingthrough the waterproof membrane.
• With raised kerb around the edge and/or slopedto drain into a sump, preventing liquid run-offinto the environment. The sump should be atleast 110% of the capacity of the storage tank.
• The containment pad should include a transferapron, also sloping inwards towards the sumpto contain any spillage during transfer from thetanker vehicle.
• Stormwater from the surrounding area shouldbe diverted by bunds or drains, or having thecontainment compound on a raised pad.
• The sump should be fitted with a waterdrainage tap so that water can be drained offfrom underneath fuel if necessary.
Fuel or chemical spills should be cleaned up ondiscovery.
The containment compound should bemaintained to prevent accumulation of stormwater and litter.
For operations in Public Drinking Water SupplyAreas, there are more stringent requirements forfuel and chemical storage. The Water QualityProtection Note ‘Above Ground Fuel andChemical Storage Tanks in Public DrinkingWater Source Areas’, prepared by the Water andRivers Commission outlines the required design.
164

SEC
TIO
N 6
165
Figure 6.1 Specifications for containment pad, dispensing area and installation of fuel storage tank
(Water and Rivers Commission, 2000a).

SEC
TIO
N 6
166
Figure 6.2 Specifications for containment pad and dispensing area for a mobile fuel tanker
greater than 250 L capacity.(Water and Rivers Commission, 2001b)
SEC
TIO
N 6
Safe storage of chemicals(Water and Rivers Commission, 2000)
Chemical storage site selection
Several points must be considered whenselecting the site for a chemical storage facility:
• Sensitive areas. Locate the facility well awayfrom sensitive areas, such as houses, workareas, play areas, feedlots, animal shelters orwater resources.
• Wind direction. The best location is downwindof sensitive areas.
• Flooding. The site should be in an area whereflooding is unlikely, where stormwater fromoutside the site run-off can be diverted anddrainage from the site cannot contaminatesurface or groundwater.
• Fire. Locate chemical storage facilities awayfrom bushland. Bushland presents high fire andpollution risks. Toxic fumes may be released inthe event of the containers being destroyed in abushfire.
❑ A properly equipped chemical shed,purpose-built to an approved design isessential.
• Limit access to authorised personnelonly.
• Locate the facility well away from waterresources.
• The site needs to be clear, to minimisefire risk.
Chemical storage shed design(Department of Agriculture Western Australia,2001)
In all cases, store chemicals according toAustralian Standard 2507-1998, ‘The storageand handling of agricultural and veterinarychemicals’.
If relatively small quantities of chemicals are tobe stored, as on most farms, the ‘minor storage’conditions of AS 2507 should be followed. Insummary, these are:
• An impervious floor with waterproofmembrane (as for a house slab).
• Spill containment of at least the capacity of thelargest container, plus 25% of the total volumeof the stored products.
• Good ventilation.
• Adequate separation distances from otherbuildings, water courses or drains.
• Secured doors and windows to preventunauthorised access.
• Appropriate signage at the entrance.
• Segregation of incompatible chemicals.
• Access to running water, first aid and otherfacilities required by the MSDS.
• An exhaust fan and fire alarm.
• Wooden pallets or metal shelves should beprovided, on which to store dry formulations inwater permeable containers or sacks, and metaldrums, which need to be kept dry. This helpsreduce potential deterioration, corrosion andleakage of these containers.
If large quantities of chemicals are to be stored,a ‘storage factor’ may need to be applied in thedesign of the storage shed. This is calculatedfrom the class of dangerous goods and thequantity in storage. Growers intending to storelarge amounts of chemicals should contact theExplosives and Dangerous Goods Division ontelephone 9222 3333, to determine whether theywill require a licence and what storage factorsmay need to be applied.
Storage of bulk chemicals(Water and Rivers Commission, 2000)
This section outlines general best practice forcorrect storage and transfer of toxic andhazardous substances (THS) on farms, in bulkquantities greater than 25 litres. For examplelarge containers or tanks of pesticides such asmetham sodium fumigant.
General requirements
All facilities should be designed so that undernormal operation THS cannot escape to theenvironment. THS should be stored in securecorrosion-resistant containers. Facilities should
167
SEC
TIO
N 6
be designed to minimise the risk of escapeduring abnormal operations or emergencies.
Storage of THS should also comply with theregulatory requirements of other agencies,including
• Explosive and Dangerous Goods Act (contact:Department of Minerals and Energy)
• The Environmental Protection Act (contact:Department of Environmental Protection(DEP))
• Occupational Safety and Health Act (contact:Worksafe)
• Council planning, health and building controls(contact: your local government authority)
Storage buildings
THS that are liquid or can be mobilised by watershould be stored on an impervious base such assealed concrete. The base must be resistant toheat damage and reaction with the storedmaterials. The building should be weatherproofand fire-resistant and maintained in goodcondition. Separate buildings or separatecompartments within a building are required toisolate materials that, if mixed, would causeundesirable reactions to occur such as fires andexplosions. The building floor should eitherhave a perimeter bund or slope inwards to acentral grated sump to fully contain spills andfacilitate clean-up.
Handling areas
External areas where THS are handled,temporarily stored, loaded or unloaded shouldhave an impervious paved base as describedabove for storage buildings. Handling areasneed to be kerbed and graded to contain spills,stormwater or fire fighting liquid. They shouldnot have ‘speed bumps’ or irregular surfaces thatmay cause accidents with containers. Externalpavement for buildings or compartments used toprovide isolation of incompatible materialsshould be surrounded by bunding, raised edgesor a grade break. This is to contain liquids in thelocal area and to avoid mixing.
Drainage gully pits
Gully pits used for collecting THS spills shouldhave a sealed base and be easily accessible forpump-out. Pits should never discharge direct tosoaks where contaminated waste could easilyleach into groundwater or surface water.
Toxic and hazardous liquid management
Bulk containers used to decant THS should befitted with drip trays. Minor spills should becleaned up immediately using absorbentmaterials, which should then be placed in storageskips for later removal to an approved wastedisposal facility.
The minimum storage capacity required for alined storage basin used to contain THS spillsmay be calculated by adding the followingvolumes together:
• The volume of the largest containment vesselswhich may lose their contents by spillage.
• Fire-fighting water which may discharge to thebasin in one hour.
• The volume of stormwater falling within thecontainment area, resulting from a 6 hour, 2year return frequency storm event (calculatedin accordance with the Australian Rainfall andRun-off published by the Institution ofEngineers, Australia).
Unless the storage basin has been designed toallow for complete evaporative liquid disposal,the basin should be emptied after each stormevent. Under no circumstances shouldcontaminated water entering the storage basin,or liquid within the storage basin, be allowed tooverflow to the ground or an off-site drainagesystem. Since testing of the stored liquid forcontaminants is recommended before release, areserve capacity must be incorporated to allowfor the time for testing, and any necessarytreatment prior to disposal.
Stormwater management
Stormwater from paved areas that are not usedfor handling of THS and from roofs should bedirected away from buildings or bunded
168
SEC
TIO
N 6
compounds that contain THS. Uncontaminatedstormwater can be drained to soaks or off-sitedrainage systems.
Emergency procedures
The site operator should develop a set ofoperating procedures to cover foreseeableemergency situations. Copies of these proceduresshould be lodged with the Fire and RescueService of WA, Perth, C/- WAHMEMSCoordinator. The procedures should nominatethe personnel who will act for the site operatorin the event of any emergency (with contacttelephone numbers), and the normal goodsinventory at the site. All staff at the site shouldbe trained in the hazards associated with thestored chemicals and procedures to follow in theevent of an emergency. Signs within the storeshould reinforce adherence to these procedures.
Chemical spills
❑ Have properly equipped chemical ‘spillkits’ located in the vicinity of the chemicalstorage and mixing areas.
Equipment required in a spill kit(ChemCert, 2000)
• Absorbent material to soak up liquids, such assawdust, vermiculite or sand
• Open topped leakproof drums in which to putwaste and contaminated absorbent material
• Shovel
• Broom
• Bleach or washing soda
• Gloves and protective clothing
• Protective clothing and equipment appropriatefor the chemicals being handled.
❑ If a spill occurs, soak it up with the spill kitmaterials, place them in a markedcontainer and hand them in atChemCollectTM venues (Section 9.1).
Dealing with chemical spills(University of Nebraska Cooperative ExtensionEC 01-2507)
If a pesticide is spilled on a person’s body orclothing, the person should leave thecontaminated area immediately. Allcontaminated clothing should be removed asquickly as possible; this is no time for modesty!Wash affected areas of the body thoroughly withdetergent or soap and water. In any pesticidecontamination accident, follow the instructionsgiven in the label’s first aid treatment guidelines.If necessary contact the Poisons InformationCentre.
Spilled chemicals must be contained. If thechemical starts to spread, contain it by bundingwith soil or sorbent materials, if this can be donesafely without contacting the pesticide orbreathing the fumes. Never hose down acontaminated area. This will cause the chemicalto spread and infiltrate into the soil, possiblyreaching groundwater. If the spill is liquid, useactivated charcoal, absorbtive clay, vermiculite,‘kitty litter’ or sawdust to cover the entire spillarea. Sufficient absorbing materials should beused to completely soak up the liquid. Sweep orshovel the material into a leak proof drum.Dispose of the material through theChemCollectTM scheme.
As a precaution, it is wise to read all productlabels carefully at the time of purchase and/ ordelivery to be able to deal quickly and safelywith any pesticide emergency.
Chemical records
❑ Keep comprehensive records of chemicalpurchases and uses(Department of Agriculture Western Australia,2001)
The following records must be kept, under theOccupational Safety and Health Act 1984:
• An inventory list or database of all chemicalsstored or used
• An up to date copy of the MSDS for everychemical stored and used
169
• Risk assessments, workplace monitoring orhealth surveillance results that are requiredunder legislation.
Cleaning of spraying equipment
Residual chemicals left in spray tanks or onmachinery may increase the risk of operatorpoisoning and can corrode or block deliverymechanisms. In some cases, the toxicity andeffectiveness of chemicals may be altered whenthey are mixed.
❑ Spray all of the contents of the spray tankonto crop or pasture. Wash fresh waterthrough it and hose down the equipmentafter each operation. Do this in the field,away from water resources to avoidpollution or concentration of chemicals at asingle wash point.
6.4 When using pesticides,minimise risks to humanhealth
When used excessively or inappropriately,pesticides can have adverse effects on humanhealth:
- Operators may be poisoned by direct contactwith the chemicals.
- The health of the wider community may beindirectly affected through ingestion ofpesticide residues in produce and groundwateror inhalation of spray drift.
❑ Growers and operators who use pesticidesfrequently should undergo pesticide residuetests to guard against over-exposure.
❑ If poisoning is suspected:
• Follow first aid and safety directions onthe label of the pesticide container andMaterial Safety Data Sheet.
• Contact the Poisons Information Centreon 131126 (all hours).
• See a doctor or take the affected personto hospital. Write down the name of theproduct and or active ingredients and
concentration, or take an empty, rinsedcontainer with you.
Antidotes for organophosphate or carbamatepoisoning such as atropine should be prescribedand administered only by a doctor (ChemCertWestern Australia, 2000).
The product label
The essential information for safe use of achemical is always included on the product label.The Agricultural and Veterinary Chemical CodeAct 1994 requires that all farm chemicalproducts must have a label printed in accordancewith a national code of practice on labelling. Italso requires that all pesticides, herbicides andcrop regulators must be registered for specificuses in each State of Australia and that this isshown on the label. Part of the registrationprocess is an assessment of how effective thepesticide is and how hazardous it is to humanand environmental health.
❑ It is crucial that all operators read andunderstand the directions on the productlabel before using any farm chemical.
❑ By law, pesticides must not be stored inunlabelled containers.
All pesticides are scheduled according to howhazardous they are, and information on this isincluded in the following warning statements onthe label:
SCHEDULE 7 PESTICIDES, label signal wordsare ‘DANGEROUS POISON’. These are themost dangerous and only licensed pest controloperators and other authorised persons arepermitted to purchase and use them.
SCHEDULE 6 PESTICIDES, label signal wordsare ‘POISON’. Moderately toxic, more freelyavailable but retailers may require a permit tosell them.
SCHEDULE 5 PESTICIDES, label signal wordsare ‘CAUTION’. Low toxicity, with norestrictions on their sale.
UNSCHEDULED PESTICIDES require no labelsignal words. Very low toxicity.
170
SEC
TIO
N 6

The ‘Directions for Use’ panel of the productlabel clearly shows the States of Australia andpurposes for which the chemical is registered.
❑ Do not use any chemical other than in themanner and for the purposes shown on thelabel.
To do so may harm operators, neighbours or theenvironment and may constitute an offenceunder the Health (Pesticides) RegulationsWestern Australia 1956.
The withholding time is the minimum time thatmust elapse between applying a chemical andharvesting the crop. If a withholding period isrequired, it will always be stated on the label. Itis most important that this is observed, toprevent excessive pesticide residues in producefor human consumption or in crop residues to befed to livestock.
❑ Be aware of the withholding time stated onthe label before applying any chemical to acrop.
The product label will always specify the type ofprotective clothing and handling precautionsrequired. More details can be found in theMaterial Safety Data Sheet for the chemical.Chemicals are most hazardous in theirconcentrated form.
Preventing poisoning (ChemCertTM, 2000)
The most hazardous situations are handling anyconcentrated chemical, particularly S7chemicals, for example adding concentrate to thespray tank or applying seed dressings. Followingsafety directions and wearing protective clothingis particularly crucial when conducting high-riskactivities. To avoid poisoning:
❑ Wear the recommended protective clothingas stated on the product label whendecanting, mixing and applying chemicals.
❑ Adopt methods to avoid manual handlingor pouring of the chemical concentrate; forexample, use a suction probe or pump.
❑ Take special care when handlingconcentrated chemicals.
❑ Keep children away from applicationequipment , mixing and storage areas.
❑ Have water and soap on hand and if anychemical contacts the skin, wash it offimmediately.
❑ Don’t eat or smoke when handlingchemicals.
❑ Wash and decontaminate the cabs of sprayvehicles and change filters on enclosed cabsregularly.
❑ Do not blow out nozzles by mouth.
❑ Wash or shower after handling chemicals.
❑ Wash spray clothes after each use,separately from family clothes.
❑ Do not store spray clothes or protectiveequipment in the chemical shed.
❑ Do not use pesticides or wash chemicalequipment near water resources.
Mixing pesticides(University of Nebraska Cooperative Extension,2001)
To prepare for pesticide applications, remove thepesticide containers from storage and take themto an open area. Always measure and mixpesticides in an open, well-lit, well-ventilatedlocation. Regardless of whether they are partiallyor completely emptied, never leave pesticidecontainers open or unattended while thepesticide is being applied. Return all containersto storage prior to application to preventaccidental spills, ingestion or exposure to people,pets, livestock or wildlife.
❑ Use of ‘sucker flusher’ systems to transferconcentrated pesticides to the mixing tankis recommended as this reduces thepotential for the concentrate to contact theoperator.
171
SEC
TIO
N 6
Protective clothing and equipment forpesticide spraying operations(Tremlett, 1997)
Personal protective clothing is an essential partof safe pesticide handling. Protective clothingmust worn when:
• mixing the concentrated pesticide with wateror oil,
• spraying, or apply dusts or granules,
• entering a sprayed or treated area, such as anorchard, crop or glasshouse before thepesticide has either dried or dissipated orbefore a statutory re-entry period has expired,and
• handling treated crops within a day or two oftreatment, or handling grain that has beentreated with seed protectant.
The type of protective clothing required isspecified on the product label, according totoxicity and concentration of the pesticide andthe conditions in which it is used. For example, afull face respirator is often specified in additionto other protective clothing when using S6 andS7 chemicals.
Protective clothing varies in quality, manufactureand type of materials used. Suppliers are nowproviding ‘special purpose’ protective clothingspecially designed for particular uses such ashorticultural applications. Always follow therecommendations listed below when selecting,wearing, and caring for protective clothing.
Gloves
Always wear gloves when handling or applyingpesticides. The gloves should be unlined, madeof flexible material and long enough to cover asfar up the forearm as possible. Check all glovesregularly to ensure there are no tears or holes inthem. Never wear leather or canvas gloves, sincethese absorb chemicals.
Nitrile gloves are recommended because they areimpervious to most solvents used in pesticideformulations. They are also tight fitting and givea good feel for delicate work. This type of glove
is available as a gauntlet, which gives goodforearm protection.
Heavy duty PVC gauntlet gloves have goodchemical resistance and forearm protection, butthey are considered too cumbersome for use ondelicate jobs.
Disposable and surgical gloves are suitable onlyfor delicate jobs, such as cleaning nozzles,provided they are used once only for a shortperiod, and then discarded properly.
Overalls
Wear full-length overalls during all sprayingoperations. Lighter cotton/polyester fabricoveralls can be worn in summer. Bib-and-bracetype overalls are not suitable.
Disposable overalls, such as Tyvek® orKleenguard® are very light, comfortable andeffective. These overalls can be washed up tofive times, and are shower proof. Their mainproblem is their tendency to tear under heavyuse.
Another lightweight but more durable type ofoverall is the Breathalon Overall®. This is madefrom a coated nylon fabric that allows watervapour to escape, but does not allow chemical topenetrate. It has good strength and durability andis useful for a number of spraying operations.
PVC pants and jackets are recommended whenthere is the risk of becoming wet from spray,mist or spillage of pesticides. They are essentialfor the more hazardous operations, such as inglasshouses and during some horticulturalspraying operations. This type of protectiveclothing is durable and strong, but it is alsoextremely uncomfortable to wear, being very hotand sweaty and tending to restrict movement.
When wearing PVC suits or overalls, leave thetrouser legs outside the boots and the sleevesoutside the gloves. This helps stop pesticidesfrom getting inside the gloves or boots.
The Farm Master® two piece suit is anotheruseful item of protective clothing. It can be usedin place of the PVC suit, since it is morecomfortable and practical and has a highresistance to chemical penetration.
172
SEC
TIO
N 6

Aprons
It is essential to wear a PVC apron when mixingand pouring concentrates and carrying drums ofpesticides. Put a PVC apron on before pickingup pesticide drums for pouring. Any spillage canthen be quickly washed off without affecting theoveralls. Aprons should cover the body from theshoulder to below the tops of the boots.
Boots
Never wear leather or canvas boots whilespraying, or boots that leak. Unlined rubberboots are acceptable, but PVC boots are best.Steel caps in the toe provide extra safety, but arenot essential when spraying.
Hats
Hats protect the scalp, which is one of the mostabsorptive areas of the body. A wide-brimmedwashable hat made from a non-absorptivematerial is best. A hood fitted with respiratorfilters can also be worn.
Goggles
When handling pesticides, especiallyconcentrates, eye protection is essential. While aface shield protects the whole face, it is difficultto wear with the conventional half-maskrespirator. Goggles and safety glasses protect theeyes and can be worn with a respirator. Gogglesshould comply with the Australian Standard1337-1992 (‘Eye protectors for industrialapplications’). Non-fogging goggles are best.
Respirators and filters
Respirators and respirator filters should complywith the Australian Standard 1716-1991(‘Respiratory protective devices’).
A half-face mask respirator satisfies most broad-scale spraying requirements. Good facial fit is aprime factor in obtaining good protection, andsome brands come in three sizes to suit variousface shapes. To ensure good fit, refer to thesection on testing respirator fit. Make sure thatthe respirator has a low breathing resistance, iseasy to adjust and feels comfortable.
Ensure that the respirator seals well. Men withbeards, long sideburns, moustaches or anyamount of stubble on their face will not be ableto obtain a good seal. The leakage of air into arespirator is up to 200 times greater for men withbeards. For men, respirators will only providethe best seal on a cleanly shaven face.
Hoods, which incorporate visor and filters,provide eye, face and respiratory protection.Always use them when handling Schedule 7pesticides or when there is risk of becoming wetfrom spray or mist. Hoods are available in PVC,Breathalon®, or Tyvek® material.
When choosing a respirator filter for generalspraying conditions, be sure it contains bothparticle and organic vapour filter elements. Theparticle filter may consist of cotton, paper orplastic foam. Medium efficiency, or class Mparticulate filters are suitable for most situations.Cotton and paper masks are satisfactory forfiltering dusts, such as sawdust or soil, but arenot suitable where organic solvents are used.Only organic vapour filters will remove thesevapours. The organic vapour filter consists ofactivated charcoal. When both particle andvapour filter elements are fitted, dust or droplets,and organic vapour are removed.
For hazardous situations, such as mixing highlytoxic and volatile pesticides in confined areas,dusting or spraying on a hot calm day, orspraying in a glasshouse, a full face mask withhigh efficiency vapour and particulate filters isrecommended.
There may be rare situations where theconcentration of pesticides in the air, even forpesticides of low toxicity, requires a supplied-airdevice to be worn. For further advice, contactthe pesticide manufacturer or protective clothingsuppliers.
Testing respirator fit
Respirator fit can be tested using a positive ornegative pressure test.
Negative pressure test. While wearing therespirator, completely seal over the flat exposedsurface of the filters with the palms of the hands.
173
SEC
TIO
N 6

Inhale gently so that the face piece collapsesslightly, and hold for 10 seconds. If the facepiece remains collapsed and no inward leakageof air is detected, then the fit is suitable. If not,then readjust the face piece, ensuring that it isstill comfortable, and repeat the test. If there isstill leakage, then try a different size or shapedface piece.
Positive pressure test. Seal over the exhalevalve(s), put on the respirator and exhale gently.A slight pressure should build up inside the facepiece without any outward leakage of air. If not,then readjust the face piece comfortably andrepeat the test. If there is till leakage, then try adifferent size or shaped face piece.
Care of protective clothing
Keep all items of protective clothing clean andin working order. Wash hats, boots, gloves,overalls, aprons and visors or goggles at the endof each day or after each spray operation,whichever comes first. Launder overalls in hotwater, separately from the household domesticwash. Wash the other items in warm water andsoap, rinsing well.
Check gloves carefully for tiny (pin-point)holes.Fill gloves with water and squeeze; discardglove if holes are evident. Also, discard gloves ifpesticide can be smelt on the inside of thegloves. Organic solvents in pesticideformulations will remove the elasticisers ingloves, making them brittle and liable to split –especially between the fingers. Therefore, beprepared to renew them regularly.
Keep eye goggles clean, especially the head-band. The head-band is often made of materialthat absorbs pesticides and is in contact with theforehead, one of the most absorptive areas of thebody.
Respirators and filters
After use, remove filters and set aside. Washface piece with soap and warm water. Ifpossible, valves should be removed and washedalso. Valve seats may need to be scrubbed with asoft brush. Rinse well, dry with a clean cloth,
and leave to air in a well-ventilated area awayfrom sunlight and extreme temperatures. Storerespirator in a sealed plastic bag or unused lunchbox away from direct sunlight and extremetemperatures.
The outside surface of respirator filters can bewiped with a damp cloth, but do not allow waterto enter the filter. Activated charcoal filters needto be stored properly to maximise their usefullife. They continually absorb organic vapours,even petrol and diesel. After use, also store themin a sealed container, such as an unused lunchbox, or a plastic bag.
Periodically check the one-way valves on therespirator to make sure that they are still soft,pliable and functioning. Also, check that the facepiece of the respirator has not deteriorated and issoft, comfortable and maintains a good face seal.
Make sure that filters are changed and used inaccordance with the manufacturer’srecommendations. Charcoal filters can be testedby determining if a strong perfume can be smeltwhile wearing the respirator (with the respiratorwell-fitted with no leakage). If the perfume canbe smelt, filters must be replaced. Dust filtersmust also be replaced when it becomes hard tobreathe or draw air through them.
Choosing the safest chemical pesticide
When all physical and biological measures havebeen considered and use of a chemical pesticideis the only practical option, the safest, mostselective chemical option should be chosen(Section 7 ‘Controlling Pests and Diseases’).
The toxicity of chemical pesticides is expressedas an LD50 number, which is the number ofmilligrams (thousandths of a gram) per kg ofbody weight required to kill 50% of a populationof animals. LD50 is not stated on the productlabel. However, it is related to the poisonschedule, for example S7 poisons have an LD50
of less than 50 mg/kg and unscheduled poisonshave an LD50 of greater than 5,000 mg/kg(ChemCertTM, 2000). The poison schedule signalheading on the label is a good indicator of theacute toxicity hazard of the chemical to humans.
174
SEC
TIO
N 6

❑ If there is a choice of pesticides choose theone with the lowest poison schedule ratingto minimise the human health hazard.
Training and licensing(ChemCert, 2000)
The risks to the human and natural environmentare too great for untrained staff to be allowed touse chemicals or conduct spraying operations.The rationale behind this is the same as drivershaving to be licensed before they drive on roads,where incompetence will endanger the lives orhealth of other people. ChemCert is a goodexample of a one-day course, which covers allaspects of chemical use including pestmanagement, legislation, pesticide residues,pesticide labels, formulations, applications,personal safety and records. A currentChemCert certificate is a prerequisite for anyoneundertaking the SQF 2000 cm or SQF 1000 cm
quality assurance programs.
Growers and staff aspiring to a career inhorticulture are encouraged to become qualifiedin chemical use. Units of Competence that canbe accredited towards Certificates in Horticultureare listed in Appendix 1 of this manual.
❑ Under Occupational Safety and Healthlegislation, all users of pesticides and otherhazardous chemicals must be accredited ina current, approved chemical user-trainingcourse.
❑ When using a contract pesticide sprayer,ensure that they are licensed with theDepartment of Health.
❑ Have knowledge or current referenceinformation (Avcare, 2001), as to:
• Which chemicals are registered for use onvarious pests in Western Australia.
• The modes of action, environmentalimpacts and toxicity of the variouspesticides.
• How to rotate pesticide groups to minimisebuild-up of pesticide resistance (Section 7.3)
To check if pesticide uses and products areregistered, refer to the National RegistrationAuthority for Agricultural and VeterinaryChemicals website. (http://www.nra.gov.au)
Material Safety Data Sheets (ChemCert, 2000)
The Material Safety Data Sheet (MSDS)contains additional information about thechemical such as its density (whether it isheavier than water), volatility (whether it formsgases) and whether it is flammable (burnseasily). This information is necessary for theoperator to assess the hazard presented in theevent of spillage, fire or other accidents. TheMSDS is not part of, or a substitute for theproduct label.
Suppliers are required under the OccupationalSafety and Health Regulations 1996 to providean MSDS on the first sale of a hazardoussubstance and thereafter on request. MSDSs ofall chemicals registered for use in Australia areavailable on the ‘Infopest’ CD produced byQueensland Department of Primary Industries,or the ‘Infinder’ CD produced by PrimaryIndustries and Resources South Australia.
Employers are required to obtain Material SafetyData Sheets (MSDS) and make them available topersons using hazardous substances.
Mixing different chemicals in the spray tank(Piper, 2001)
At least half the herbicides used in WesternAustralia are applied as mixtures, primarilybecause no single product will control all weedspresent in a paddock. Herbicides may also bemixed with insecticides that need to be appliedat the same time. Combining sprays minimisesthe fuel used, spray unit wear, and physicaldamage to the crop. It also makes best use of thebest spraying weather.
175
SEC
TIO
N 6
Constraints on tank-mixing
Not all herbicides and insecticides can be tank-mixed to advantage. Several reasons for twoproducts being incompatible are summarisedhere.
Formulation incompatibility. This usuallyhappens when emulsifiable and flowableproducts are mixed. The emulsifiable productcan cause the flowable product to settle out.Spraying oils can do the same thing, andemulsifiable products that require oil may beincompatible with some flowables. Mixes ofSpray Seed® and a flowable product can alsoflocculate, especially if the mixing order iswrong. Granular products in general give lessproblems and should be used if available.
Manufacturers may change the emulsifiers anddispersants in their formulations from time totime in response to supply or price changes.Thus a mix that was stable one year cannot beassumed to be stable later. It should always bejar tested first.
Chemical incompatibility. Some products withionically active ingredients will react whenmixed.
Biological incompatibility antagonism. Somechemicals reduce the activity of others. This isknown as antagonism. Antagonistic herbicidesmust not be mixed. The chemicals must beapplied at least 10 days apart.
It is not possible to determine biologicalincompatibilities by doing test mixings. Thechemicals may be perfectly stable in the tank. Itis only after the tank mix is applied that theproblem becomes apparent. Weeds may not dieif there is antagonism.
A jar test for compatibility
Before making up a full tank of mixture for thefirst time, check the compatibility of thecomponents. This can be done conveniently on asmall scale by making up a medium size screw-top jar of the mixture.
To 500 mL of water in the jar, add 10 mL ofeach product for every 1 L/ha that will beapplied in the field. Use 1/4 teaspoon of granulesfor each 10 g/ha. This will give the sameconcentration of products as a tank-mix to beapplied at a spray volume of 50 L/ha.
Then cap the jar and shake it well. Look for anyobvious incompatibility such as flocculation orprecipitation.
Then store the jar for at least two hours, andpreferably overnight. Again look for any sign ofinstability of the mixture. Some settling offlowable or powder products is normal, but noteany difficulty in re-suspending sediment; if thereis, extra agitation may be needed while spraying.
If the mixture remains stable, it is free fromformulation and chemical incompatibilities.However, biological incompatibilities are notrevealed by this test.
Take care that the jar is not re-used for foodstuff.
Mixing order
Whether conducting a jar test or making asprayer full of tank-mix, the correct order ofaddition is important. At least two thirds of thewater should be added, the agitation started, thenthe products added in the order: granules,powders, flowables, emulsifiables, water-based,and finally any wetters or oils.
Dissolve water soluble solids such as Pacer®separately and then treat them as water-basedproducts. In this way the products most likely tocause difficulty are added when there are lessother products present to compound thoseproblems.
Never try to make a tank-mix in a small portionof the final water volume. The mix will be muchmore concentrated than necessary, and problemswill be more likely.
176
SEC
TIO
N 6
References
AVCARE, 2001. National Association for CropProduction and Animal Health(Web site): http://www.avcare.org.au
ChemCert WA, 2000. Chemical Users’ TrainingManual.
National Registration Authority for AgriculturalChemicals, 2002. Internet website. http://www.nra.gov.au
Piper, T., 2001. Herbicide- Insecticide TankMixing. Agriculture Western Australia Farmnote53c/95.
Standards Association of Australia (1991).Respiratory Protective Devices. AustralianStandard 1716-1991. Sydney, Australia.
Standards Association of Australia (1992). EyeProtectors for Industrial Applications.Australian Standard 1337-1992. Sydney,Australia.
Tremlett, P., 1997. Protective Clothing forPesticide Spraying Operations. AgricultureWestern Australia Farmnote.
University of Nebraska Cooperative ExtensionEC 01-2507, 2001. Safe Transport, Storage andDisposal of Pesticides.
Water and Rivers Commission, 2000a. AboveGround Chemical Storage Tanks In PublicDrinking Water Source Areas. Water QualityProtection Note.
Water and Rivers Commission, 2000b.Temporary Above Ground Chemical Storage inPublic Drinking Water Source Areas. WaterQuality Protection Note.
Water and Rivers Commission, 2000c. Toxicand Hazardous Substance Storage. WaterQuality Protection Note.
Water and River Commission, 2000. TemporaryTrailer Mounted Mobile Fuel Transfer in PublicDrinking Water Source Areas. Water QualityProtection Note
Department of Agriculture Western Australia,2001. Code of Practice for the Use ofAgricultural and Veterinary Chemicals in WA.
Further Reading
Water and Rivers Commission. Policy onPesticide Use in Public Drinking Water SourceProtection Areas (draft).www.wrc.wa.gov.au/protect/policy
Government of Western Australia, State LawPublisher. Health (Pesticides) Regulations 1956.
Standards Australia, 1998. Australian StandardAS 2507–1998. The Storage and Handling ofAgricultural and Veterinary Chemicals.
177
SEC
TIO
N 6
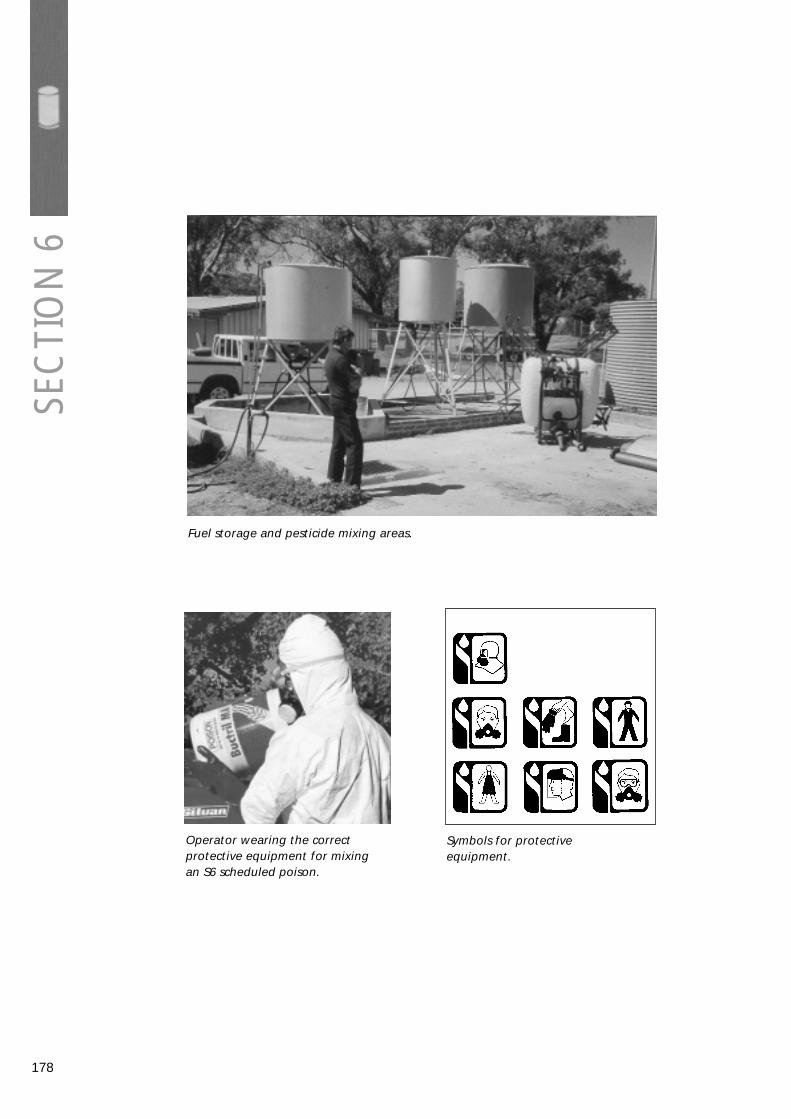
178
SEC
TIO
N 6
Fuel storage and pesticide mixing areas.
Operator wearing the correctprotective equipment for mixingan S6 scheduled poison.
Symbols for protectiveequipment.

179

Controlling Pests and DiseasesSE
CTI
ON
7
Integrated Pest and Disease Management(IPDM) is an approach that aims to minimise therisk to human health and the environment whilemaintaining pest populations below levels atwhich crop damage may occur. IPDM makespest control more effective by coordinating non-chemical and chemical methods of pest control.IPDM can be defined as: ‘Utilising a range ofpest management tools to provide economically,environmentally and socially sustainableproduction’.
This section outlines best IPDM practices forvegetable and potato growing:
- Hygiene and crop cultural practices thatminimise the incidence of pest and diseases.
- Monitoring and pest treatment methods thatminimise the use of chemicals
A methodical approach to pest control, withstringent adherence to hygiene practices, goodrecord keeping and regular crop monitoring paysdividends in terms of fewer pest outbreaks thatrequire treatment and less expenditure onchemicals. This approach also reduces the risk ofthe emergence of pesticide resistant pest strains.
Most important are the environmental outcomes:reduced environmental impacts of chemicals invegetable and potato growing and fewer pestoutbreaks.
7.1 Minimise occurrence of pestand disease outbreaks
Hygiene practices (Floyd, 1990)
Use clean certified planting material
Clean seed is crucial to preventing viral,bacterial and fungal diseases in all horticulturecrops. Check the quality of the nursery used tosupply seedlings, and how their seed and pottingmixes are treated.
Infection of a paddock by soil-borne diseases,such as clubroot in cauliflowers and Sclerotiniarots, is virtually permanent, incurring ongoing
costs of control with pesticides. Onceintroduced, there is a greatly increasedprobability of infection of neighbouringpaddocks through transport of spores by wind,water and transported soil (fungal diseases) or byinsect vectors (virus and bacterial diseases).
❑ Use of clean certified planting material iscrucial to preventing viral, bacterial andfungal diseases in all horticulture crops.
❑ Check the quality of the nursery used tosupply seedlings and how their seed andpotting mixes are treated.
Nursery accreditation(Nursery and Garden Industry Australia, 2002)
Nurseries accredited under the Nursery IndustryAccreditation Scheme, Australia (NIASA) arerecommended as they adhere to prescribedhygiene practices.
The aims of the NIASA are:
- Improve consumer confidence at all levels ofthe distribution chain.
- Improve the profitability of NIASA accreditedbusinesses through the adoption of bestpractice.
- Encourage the use of environmentally soundwork practices.
- Encourage the continuous improvement ofNIASA accredited businesses.
- Focus research to critically analyse andimplement best practice.
- Promote the benefits of trading with NIASA-accredited businesses.
NIASA accreditation is available to productionnurseries and growing media manufacturers.
The Nursery and Garden Industry Australia(NGIA) has, through its national AccreditationCommittee, a coordinating and supervisory role.In particular, it must ensure the Best PracticeGuidelines and the administration Guidelines areapplied accurately and fairly by each State orTerritory Committee and their technical officers.
180
SEC
TIO
N 7
Lists of NIASA accredited nurseries and detailsof the Best Practices Guidelines can be found onthe NGIA website:http://members.ozemail.com.au/nian
Seedlings – hygiene
Strictly control the purchase of seedlings,particularly of small lots to complete a paddockplanting. Where plants are needed and cannot begrown on the property, check the quality of thenursery chosen to supply material. Check and besatisfied with their hygiene standards.
Treat bare-rooted seedlings from open beds withconsiderable caution. Despite fumigation ofbeds, the risk of reinfection from surroundingsoil is high. For maximum safety, seedlingsshould be grown in trays, preferably in singleplant blocks using a steam-sterilised, inertmedium such as a sawdust or peat-basedcompost. The trays should be standing onbenches or clean aggregate. At no time shouldthe plants be in contact with the soil or plantresidues until planting.
Certified seed potatoes(Department of Agriculture Western AustraliaPlant Laboratories et al, 1998)
Potato growers in WA should always use seedthat is certified under the Western AustralianSeed Potato Certification Scheme. This schemeis administered by the Department of AgricultureWestern Australia Plant Laboratories andenforces industry-agreed production andmarketing guidelines.
Laboratories from which mini-tuber or plantletseed stocks are sourced must maintain stocks ofthe required varieties. Stocks must beperiodically tested to ensure that they are free ofsoft rot organisms, bacterial wilt, ring rot,powdery scab, black scurf, gangrene, wilt, dryrot, black dot and potato viruses.
Vegetable seed treatments(Floyd, 1988)
Seed can be treated to kill disease-causingorganisms in or on the seed, and to protect the
seed when it is planted. Hot water treatment cankill a wide range of bacteria, fungi and viruses inor on seed of many crops. Fungicide dusts canprotect seed from soil-borne organisms and aresometimes used to control organisms on or in theseed. For particular problems, insecticide dustscan be used.
Seed treatments are an important means ofcontrolling disease but are most effective whencombined with other disease control practices.
Hot water treatment
Hot water treatment controls many seed bornediseases by using temperatures hot enough to killthe organism but not quite hot enough to kill theseed. It must be carefully and accurately done. Afew degrees cooler or hotter than recommendedmay not control the disease or may kill the seed.
Hot water treatment can be damaging or notpractical for seeds of peas, beans, cucumbers,lettuce, sweet corn, beets and some other crops.Some hybrid varieties of cauliflower may bedamaged by the recommended treatment. Seedsthat can be treated by hot water are listed in theTable 7.1.
Method
Hot water treatment of fresh seed at thetemperatures recommended should not reducegermination. However, check seed packetscarefully to ensure that the seed has not alreadybeen treated by the seed company. Seed shouldnot be treated twice. Also, treating old, out-of-date seed will reduce germination.
Follow these steps for accurate treatment:
Put a few grams of seed in a small porous bag,such as cheesecloth. The amount of seed shouldbe just sufficient to allow thorough andimmediate wetting. The bag may need to beweighted down.
Fill an insulated container with water slightlyhotter than the temperature required (see tablebelow). Use an accurate thermometer to checkthe temperature and immerse the thermometer tohalf way down the container.
181

When the water reaches the correct temperature,wet the bag and seed with warm water andsuspend them in the container of water.
Stir the water and the bag of seed regularlyduring treatment to ensure that all the seed isheated evenly. Check the temperature regularlyand add just enough hot water to maintain thetemperature needed.
Spread the seed out to dry in a thin layer onpaper in a shady area.
Plant the seed as soon as it is thoroughly dry. Donot store treated seed.
Fungicide seed treatments
Fungicides may be dusted on to seed to providea thin protective layer. These treatments canprevent attack by fungi carried by the seed itselfor in the soil around the seed. Diseases thatattack germinating seeds and seedlings includedamping-off caused by Pythium, and wire-stem(Rhizoctonia solani). As well as these seedlingdiseases, dusting can control other problems thatcan become evident on more mature plants.
Fungicides registered for vegetable seed use inWestern Australia are thiram (Thiram 800®),metalaxyl (Apron®) and a mixture of thiram and
thiabendazole (P-Pickel T®). Before using anyof these materials on seed of a particular crop,the labels must be checked to ensure that theyare registered for use on that crop.
Prevention – quarantine (Floyd, 1990)
The list of plant diseases that may be transportedin soil and water is long and many of thediseases have considerable economic impact.Bacterial, fungal, viral and nematode disordersmay all be moved around in soil and water, bothwithin and between properties and for thatmatter, countries.
The introduction of club root disease of crucifersin the Manjimup-Pemberton area has highlightedthe danger to farm income from soil-bornediseases. A recent and very damaging outbreakof potato cyst nematode in the Perth area hasalready indicated to potato growers the dangersin indiscriminate soil movement and this newproblem serves to alert growers of otherhorticultural crops to the problem.
Quarantine is the first line of defence againstsoil-borne disease; that is, prevention is betterthan cure. Once a soil-borne disease isestablished, it is a matter of living with the pest
SEC
TIO
N 7
Table 7.1 Recommended water treatment temperatures and times(Floyd, 1988)
Vegetable Temperature Time, minutes Diseases controlled
Cabbage 52˚C 30 black rot, bacterial leaf spot, black leg, damping off, ring spot
Broccoli 50˚C 20 black rot, bacterial leaf spot, black leg, damping off, ring spot
Brussels sprouts 50˚C 20 black rot, bacterial leaf spot, black leg, damping off, ring spot
Cauliflower 52˚C 25 ring spot
Tomato 56˚C 30 damping off, bacterial canker, speck and spot
Celery 50˚C 30 blights, damping off
Carrot 50˚C 20 Alternaria, bacterial blight
Pumpkin 55˚C 15 Fusarium
Some hybrid varieties may be damaged by this treatment.
182

SEC
TIO
N 7
183
through management strategies. An establishedpathogen is very rarely eradicated.
Water supplies and irrigation
Water supplies can be a source of infectivematerial. For example, potato soft rot organismshave been recovered from water supplies.Surface water supplies are more at risk than deepbores.
Control of soil erosion, run-off from paddocksand drainage from wash sites is essential toprevent contamination of surface-storedirrigation water and spread of infection.
Packing houses
Although farmers have the primaryresponsibility to control and examine materialsto be brought on to their properties,organisations such as packing houses providingsecond-hand containers have an obligation tosupply those containers in as clean as possiblecondition. Clean bins and tubs should beprovided to at least ensure that the producesupplied for packing and sale is clean and freefrom soil or other contaminant.
Cleaning equipment coming onto the farm(Floyd, 1990)
Quarantine depends upon hygiene. All used orsecondhand equipment brought on to a propertymust be checked and proved to be clean. Thisincludes bags, boxes, bulk bins, machinery,trucks and contractors’ equipment. It is goodpractice to restrict visitors’ cars and trucks to ahard standing area near the main area or to roadsand raceways. Any vehicles, including one’sown, obviously carrying mud and soil should beleft on the entry hard standing or washed beforemoving on to the farm.
If in doubt, wash down or refuse entry of suspectitems. Washing down must be carried outcorrectly to eliminate risk of diseasetransmission.
The important potato disease bacterial wiltPseudomonas solanacearum (see below) is a
good example of a disease spread by movementof soil or water.
Drainage from infected sites on to new croppingland has been implicated in outbreaks of thisdisease. The quantities of soil or water needed tomove these diseases are often small. As little soilas that adhering to a tuber or the content of aplanting plug is sufficient to enable a disease toinfect that plant and potentially to spread withinthe field.
Soil carried on bins or vehicles may also beintroduced into a crop and establish an infection.The widespread use of half tonne field bins inhorticulture poses a particular threat from theircapacity to transfer quantities of soil longdistances. Since these bins are taken into thefield, any infected soil carried on them isbrought into direct contact with the crop. Inthese circumstances, diseases are readilyestablished and can become well entrenchedbefore being noticed.
The role of water in disease movement can beimportant. Seepage from infected fields or fromwashing facilities into creeks and dams can betransferred on to planting fields or seedbeds.Many of the soil-borne pathogens are welladapted to life in water and persist in seepages,creeks and ponds.
❑ Check and clean all equipment and visitors’vehicles carrying mud that come onto theproperty. Remove soil, plant material andseeds.
Check and clean all used or second-handequipment and visitors’ vehicles carrying mudthat come onto the property. Set up a washstation at or near the entrance to the property forthis purpose (see below).
Removal of soil from vehicles, machinery andboots is the most effective hygiene measure forsoil-borne diseases. Fungicide dips can be usedas an extra measure for disinfecting boots andsmall items.
Cleaning of any items contaminated with soil isimportant:
- First remove the bulk of soil by hosing down.
- Then disinfect the equipment.
- Dip small items such as bags, boxes or plasticcrates in a disinfectant solution.
- Spray down larger items such as field binswith a suitable disinfectant if large enoughdipping tanks are not available.
- If the disinfectant used is corrosive, completethe treatment with a final water rinse.
Dip treatments are preferred for disinfection,since all parts of the item are treated and thetime of treatment can be controlled. Spraying fordisinfection can allow some parts to be missedand the time for exposure to the chemical maybe inadequate.
Time of exposure to the disinfectant isimportant. Most commonly used materialssuitable for food handling equipment require anexposure of 10 minutes. Formaldehyde solutionis no longer recommended because of itstoxicity, the long exposure needed (30 minutes)and its corrosiveness to metal surfaces. Suitablematerials are listed below, together withcomments on suitability and methods of use.
Disinfect equipment before it is brought to theproperty, so that all contaminated water can becontained. If it is necessary to treat equipment onthe property, the area where this treatment iscarried out is of great importance.
Chemicals for disinfecting(Floyd, 1990)
Chlorine
The most suitable materials availablecommercially for cleaning and surface-sterilisingequipment are those containing free chlorine asan oxidising agent. These include sodiumhypochlorite, the active ingredient of householdbleach, and swimming pool chlorine. The liquidformulations may be safer to handle than powderbleaches, which can pose a fire or explosion riskif stored with fuels.
The level of available chlorine in the wash waterwill fall with use, in the presence of organicmaterial and soil. If possible, give a preliminary
pressure wash with clean water, possibly with adetergent added, to remove gross contamination.After sterilisation, a rinse with fresh clean waterwill reduce the corrosive effect of the chlorine.
The strength of the disinfectant solution iscalculated as available chlorine; a 0.1 % solutionis recommended. Make up commercial sodiumhypochlorite (12.5%) to this strength by diluting1:125 with water. Other sources will needdilution calculated from their publishedconcentration of chlorine. Further details on theuse of chlorine for disinfection are given inFarmnote No. 9/90 ‘Chlorination in postharvesthorticulture’ (Agdex 200/56).
Quaternary ammonium compounds
Quaternary ammonium compounds are readilyavailable and suitable disinfectants for foodhandling equipment. Unlike chlorine bleachesthey are not inactivated by organic material andare not very corrosive.
Iodine
Iodine compounds, available as dairy sanitisers,are also suitable for disinfection of containersand equipment.
Phenol compounds
Some phenol compounds are also available.They have the advantage of longer residualactivity on treated surfaces than the other typesof disinfectants. One disadvantage of thesecompounds is that they are poisonous and somust be used with caution.
Note that formaldehyde or formalin is no longerregistered for surface sterilisation. It must not beused for cleaning food containers.
Wash station(Floyd, 1990)
❑ A wash station should be set up at or nearthe entrance to the property for cleaningequipment coming onto the farm. Fungicidedips can be used as an extra measure fordisinfecting boots and small items.
SEC
TIO
N 7
184

SEC
TIO
N 7
185
The essentials for a wash station are as follows:
- Hard standing, with an impervious surfacesuch as concrete or bitumen, properly gradedand sloped to contain the wash water andchannel it to a sump.
- Drainage from the sump leading away fromcropped areas and water storage.
- A source of clean wash water that is not likelyto act as a source of infection on its ownaccount .
- If scheme water is unavailable, a pressurisedsupply able to dislodge caked and ingraineddirt is essential.
- A small, portable, holding tank and firefightingtype pump would be adequate in most cases.High-pressure sprayers suitable for washingdown vehicles and bins are also available.
- A knapsack sprayer could then be used toapply disinfectant such as chlorine bleach orquaternary ammonium compounds.
- The set-up chosen should be for this purposeonly and thus available at short notice if, forexample, equipment arrives at night forimmediate use.
- As far as possible, a wash station should benear the main entry of the farm so that allentries may be scrutinised and treated as theyarrive. Any materials that come in and arestored without immediate treatment are likelyto be used untreated.
Contractors’ machinery are the most likelyintroductions to go directly to the back paddockin the middle of the night, so a portable anddedicated wash plant must be available at shortnotice for this use. Complaints have been madeabout introduction of weeds such as doublegeeon tyres of contractors’ equipment. Contractorsmust be aware of the risks involved in movingfrom property to property. Precautions to betaken should be discussed with and agreed to bythem, before the season begins and contracts arefinalised.
Potato disease example – bacterial wilt (Floyd and Delroy, 1988)
Bacterial wilt of potatoes (Pseudomonassolanacearum) is a destructive disease, notknown to occur in WA to date, which is mostactive during the summer months with hightemperatures and abundant moisture.
It is important to the potato industry and anysuspect crops must be reported to theDepartment of Agriculture WA. Several Actscover the effect of bacterial wilt and these aredesigned to protect the industry.
The disease can attack potatoes at all stages ofgrowth and will remain infective indefinitely.The disease is easily spread, but difficult tocontrol. The method of handling infected cropswill largely determine the likelihood of furtherspread of the disease.
Field symptoms are usually similar to those ofother wilt diseases, including blackleg, and toinsect damage. Wilting is usually only seenduring high temperatures and may be confusedwith localised water stress.
Bacterial wilt is most commonly transferredfrom property to property by the seed. As far ascan be determined, all local outbreaks have beencaused by use of diseased seed. No guaranteecan be given that even with approved seed therewill be no risk of contamination. However, therisks are less than when table stock is planted.Check all seed before planting for the presenceof any suspicious symptoms.
Cutting the seed increases the spread of bacterialwilt from infected tubers. Frequent sterilisationof cutting knives in 2% sodium hypochloritesolution is a worthwhile precaution duringcutting.
When borrowing any potato machinery,thoroughly clean it down and sterilise it with ahypochlorite solution for control of bacterial wiltand other soil-borne diseases.
The recommended material for sterilisation ofequipment and machinery is a solution ofsodium hypochlorite. The commercial product

contains 12.5 per cent available chlorine and isdiluted by adding 1 L of product to 12 L of waterfor a 1 per cent solution (or 8 L in 100 L water).As the chlorine is lost when in contact with soil,very dirty machinery may need a second washwith the solution to remove softened clods.
Crop rotation strategies
Most diseases require plants of certain species as‘hosts’ on which they can breed and producemore spores. The life cycle of the diseaseorganism can be broken by ensuring that othercrops or pastures of non-host species are grownin the period between cropping of the speciessusceptible to the disease.
It is crucial that sufficient time is allowed undernon-host crops or pastures. For most diseasesthis is at least three years and in many caseslonger. Though it is not a guarantee againstinfection, crop rotation will help to reduce theimpact of the disease if it does occur (Lancaster,2001).
An adequate inter-rotation period is crucial tocontrol soil-borne fungal diseases andnematodes. For most diseases this is at leastthree years under non-host crops or pastures andin many cases longer.
Though it is not a guarantee against infection,crop rotation will help to reduce the impact ofthe disease if it does occur. Details of croprotation requirements for different diseases canbe found in vegetable growing handbooks.
Example
Rotation of cruciferous crops with non-
cruciferous crops is important to reduce the
clubroot spore load in the soil. For example
cauliflowers followed by potatoes, then sweet
corn and finally three years in pasture. Lowering
the number of spores in the soil will lead to
healthier crops. The time between cruciferous
crops should be at least five years.
❑ Where possible select inter-rotation cropsor pastures with biofumigation or pestdeterrent properties.
Biofumigation crops
Biofumigation is the sowing of plant species thatcontain natural chemicals toxic to soil-borneinsect pests. These plants may be grown asinter-row ‘nurse crops’ or between rotations andincorporated into the soil. The potential of someBrassica species containing high levels ofbiofumigant chemicals called glucosinolates iscurrently being researched, but provenbiofumigation strategies are yet to beestablished.
Rotations to control soil insect pests inpotatoes (Learmonth, 2002)
Whitefringed weevil
It is known that grasses and cereals are poorfood plants for whitefringed weevil adults toproduce eggs. In paddocks under a legume basedpasture rotation where the weevil is known to bea problem, it is worth trying a cereal ‘breakcrop’ such as oats directly prior to plantingpotatoes. It would be important to minimise thegrowth of any clover or other broad-leafed plant.This is likely to decrease the number of weevillarvae in the soil.
African black beetle
Black beetle adults would lay more eggs wherepastures consist of grasses or cereals. Therefore,by replacing a grass-based pasture with arotation crop of a plant such as lupin may helpreduce the abundance of subsequent generations.Where black beetle is the dominant soil insectpest, and whitefringed weevil is not a threat, thisstrategy is worth trying
However, where both pests are known to bepresent, the cereal break crop to deter the moreserious whitefringed weevil pest isrecommended. This is because with currentknowledge black beetle is more reliablycontrolled with insecticides.
Monitoring for these pests prior to planting asdescribed in Section 7.1 ‘Monitoring for soil-borne pests’ is essential to decide whetherchemical control will be necessary.
SEC
TIO
N 7
186

SEC
TIO
N 7
187
Crop cultural strategies
Take care with how, when and where the crop isgrown, to minimise the risk of many pests anddiseases becoming established in the crop. Thefollowing practices are important:
- Ensure breakdown of crop residues and,removal of pest hosts and over-winteringhabitats (see below).
- Monitor for pests and diseases regularly beforeand during cropping.
- Ensure good crop nutrition and watering –healthy crops resist insect pests.
- Minimise and where possible, avoid soilfumigation for soil health reasons (Section2.2).
Over the years, many of our cropping plantshave been selected for their yield, productquality and resistance to specific pests.Unfortunately, a strain bred specifically forresistance to one pest or disease may be moresusceptible to another. Today through plantbreeding, many disease and pest resistantvarieties are available worldwide.
❑ First consider resistance to locallyoccurring diseases when selecting thevariety of potato or vegetable.
❑ Consider conditions for pests and diseaseswhen timing irrigation schedules.
Examples
Irrigating after sunset is a good practice to
prevent build- up of diamondback moth
numbers immediately after they are first seen in
the crop as it disrupts egg laying.
Delay irrigation for as long as possible after
applying chemicals to the crop, to maximise the
time they can take effect before being washed
off or diluted.
Plant spacings affect the humidity, light andtemperature conditions in the growing crop andcan thereby influence the incidence of diseases.
❑ Consider conditions for pest and diseasethreats when deciding on optimum plantspacings.
Pest habitats and hosts
Fungal root diseases such as Rhizoctonia sp anddamping off fungi such as Sclerotium sp. thriveon rotting plant material. For this reason, avoidplanting straight into a seed bed which hasrecently had green plant matter ploughed in.From a soil conservation perspective, the bestway to ensure adequate breakdown of pastureresidues is to spray off the pasture and leave itfor several weeks to break down on the surfacebefore cultivation.
❑ Spray off pastures several weeks beforecultivation for cropping.
Coarse residues may require chopping up on thesurface using a mulching implement to aidbreakdown (Section 2.2 ) and in some casesshallow incorporation. Tillage should be minimaland shallow for soil health reasons except inexceptional cases where deeper tillage may berequired to control some diseases.
Most crops can then be planted soon after soilpreparation, thus minimising both the risk of soilerosion and at the same time ensuring that therewill be minimal rotting plant material present inthe seed bed.
If a "break crop" is to be green mulched prior toplanting a vegetable crop, incorporate it tominimal depth and leave adequate time for it tobreak down. To minimise destruction of soilstructure and risk of erosion, avoid inverting thesoil profile and leave some plant materialexposed to protect the soil surface. Surface watercontrol measures may also be needed to protectthe cultivated soil from erosion, (Section 2.1)particularly if deep ploughing has been practicedto control Sclerotinium diseases.
❑ Ensure that plant residues are broken downwell before planting, to decrease thelikelihood of disease outbreak.
❑ Chop and lightly incorporate crop residuesinto the soil.
Make sure that all crop plants are killed as soonas practicable after harvest and that the area iskept free of "volunteer plants", which can act ashosts, allowing many crop pests and diseases tocarry over and infect the next crop

188
❑ Destroy pest life-cycle habitats and controlpest hosts.
Disease carrier species
Some invertebrate pest species are carriers(vectors) of diseases and in many casescontrolling the pest vector is an important part ofthe strategy to control the disease.
❑ Control disease carrier species
Example
Although they do not generally cause economic
damage to plants directly, the green peach
aphid and potato aphid are the main carriers of
the potato leaf roll virus. Potato crops grown
for certified seed are inspected twice during the
growth period and are rejected if aphids are
found to be present above threshold tolerance
levels. Ensuring that seed potatoes are grown a
long way from and preferably up-wind of
cropping areas that are infested with the aphid
is another important practice in controlling the
virus in Western Australian potato crops.
Lures, traps and deterrents
Poison baits and lures in traps can be a goodoption to avoid application of pesticides onto theproduct and are often used by organic producers.Potent attractants such as sex pheromones can beused to attract insects into traps or to attractnatural predators into the crop under attack.Baits containing the pests’ preferred food can beplaced around the crop to divert and kill thepests.
❑ Use lures and traps where possible tomonitor for and control invertebrate pests.
Examples
- Pheromone traps are a recommended early
detection monitoring method for diamondback
moth.
- Attractants such as yellow sticky traps reduce
the abundance of whitefly in glasshouses.
- Metaldehyde or methiocarb baits are effective
in reducing snail and slug numbers.
- Bran bait mixed with maldison can be used to
control wingless grasshoppers.
- Baits of cracked wheat, sunflower oil and
chlorpyrifos can be used to control some soil
insect pests and European earwig.
❑ Use netting and deterrents for vertebratepests.
Examples
- Fencing cropping paddocks with secure mesh
fences is common practice to prevent damage
by rabbits and kangaroos.
- Bird scaring gas guns are used to deter wood
duck, or maned duck, which can uproot
vegetable seedlings soon after planting.
7.2 Monitor for pests anddiseases and base decisionsto spray on ‘economicinjury’ thresholds
Monitoring of cropping paddocks should bethorough, ongoing and properly recorded:
❑ Monitor all cropping sites prior to soilpreparation to detect the incidence of pestsand diseases.
❑ Monitor all crops at regular intervalsduring crop growth to detect when insectpest numbers have reached threshold levels.
Unfortunately, there is little publishedinformation on disease thresholds for vegetablecrops in Western Australia. It is a specialisedsubject that is beyond the scope of this Manual,although an example is given under ‘Regularcrop monitoring’ below. Research to developthresholds is an important area for WA industrygroups to consider.
Good records of the incidence of pest anddiseases on the site should be kept to build up asite history. This enables growers to improvetheir pest and disease control strategies, byknowing which actions have worked and whichhave consistently not worked. It is important torecord:
SEC
TIO
N 7
- The results of monitoring for soil-borne pests.
- Any outbreaks of pests or diseases.
- The dates that any pests and diseases wereobserved during daily field inspections.
- The cost – in terms of time, operating costsand chemicals – and results of all pest controlmeasures (Section 7.3 ‘The spray diary’).
Soil-borne pests
Routine fumigation or application of chemicalsto the soil is undesirable because of the soilstructure damage and operator risks it entails(Section 2.2 ‘Minimising the impacts of soilfumigation’). It is also unnecessary in mostsituations.
By using simple, reliable soil monitoringprocedures prior to site preparation, the growercan determine whether the disease or pest ispresent at levels likely to cause economicdamage. This enables confident decisions as towhether soil treatment will be necessary.
❑ Use prescribed techniques to monitor forsoil-borne pests prior to soil preparation.
Monitoring for white fringed weevil (Learmonth, 2001)
In areas where whitefringed weevil is a problem,potato paddocks should be monitored prior toplanting potato crops by using the followingsimple procedure:
Monitor for the presence of whitefringed weevilsin the summer before planting.
Conduct six 30 minute searches of the pasture at3-4 week intervals during the summer periodmid-December to May. Inspect green grassypatches and random points on dry pasture. If noadult weevils are observed over this period, it isa good indication that the paddock is notinfected and in this situation fumigation is notrequired. If several adult whitefringed weevilsare found in any one search, there will be a riskof damage to the crop and the soil should betreated to prevent this.
Inspection of the soil for larvae by taking 100shovelfuls of soil from the paddock in winterbefore planting, is recommended as a finalprecaution. If no weevil larvae are found, soilfumigation should not be necessary.
Regular crop monitoring
Effective IPDM can only be achieved by thegrower being involved in an active monitoringprogramme involving the estimation of thenumbers of pests and predators, and their rate ofincrease, at regular intervals. Initially, growersmight need to engage consultants or farmadvisers specialising in IPDM to monitor thedynamics of the pest and predator populations todetermine if it is necessary to take additionalaction. This should lead to a sound practicalknowledge of insect behaviour in the crop andgradually lead to less and less time actuallyspent in crop monitoring. The crop may beinspected less frequently, concentrating on thecritical times in the insect’s growth cycle andduring periods of unseasonable weatherconditions.
With experience, a grower can undertake theregular monitoring of disease, pest and predatorpopulations in his or her crop and be able todetermine when intervention may be necessary.All growers in the area should be monitoringtheir crops to ensure a coordinated approach toinsect control in the area.
❑ Obtain expert assistance in cropmonitoring to gain a sound practicalknowledge of insect behaviour in the crop.
Knowledge of the basic biology of the pests thataffect crops and at what stage of the life cyclethey should be treated enables more effectivecontrol.
❑ Know the life cycles and basic biology ofpest species.
The majority of organisms are not pests, in factmost are beneficial in that they prey on or inhibitpest and disease organisms. Field guides areavailable for the correct identification of pests,diseases and beneficial insects in vegetable andpotato crops. Examples are:
189
SEC
TIO
N 7

Heisswolf and Brown (1997). Donald et al (2000). Llewellyn (2000).
❑ Be able to identify pest and beneficialspecies.
❑ Monitor the crop regularly for pests anddiseases.
Pests and diseases do not respect propertyboundaries. Growers need to know what pestsare occurring in the area and what measures arebeing taken to control them.
❑ Participate in pest monitoring networks,communicating with other growers in thearea to ensure a coordinated approach topest control.
Such a strategy could be used to coordinatespraying of wild radish, which is a serious weedand host plant for many pests of brassicavegetables.
Example- carrot leaf blights (Department of Agriculture NSW, 1981)
Leaf blight (caused by the fungus Alternariadauci) and leaf spot (caused by the fungusCercospora carotae) are two diseases affectingthe leaves of carrots, common in damp weather.The symptoms of leaf blight are leaf spottingand scorching. The symptoms of leaf spot arecircular tan or grey spots on the leaves withsunken elongated spots on the stalks.
Monitor the crop regularly for early signs ofinfection. If either or both of these diseases isdetected, they can be controlled by promptchemical treatment with appropriate fungicidesregistered for that purpose, such as copperoxychloride or zineb.
For control of both diseases, it is essential topractice crop rotation and hygiene to minimisethe incidence of disease outbreaks. Grow carrotson the same land only once every three or fouryears. Destroy diseased trash by burning orturning in promptly.
Spray strategies based on ‘economicinjury’ thresholds
Traditionally, some growers have sprayedaccording to a pre-set program, whether pestswere present in damaging numbers or not. Thisis poor practice because it is over-use ofchemicals, is often unnecessary and is costly
❑ Do not spray to a pre-set program.
Growers need to be aware of the market qualityspecifications for the product. Some damage isusually acceptable with minimal down-grading.
A fundamental principle of IPDM is for thegrower to be content to allow pest populations toexist at levels that will not cause damage, inmonetary terms, in excess of the value of thecontrol measures, i.e. the ‘economic injurylevel’. Growers should estimate the economicinjury level, depending on the crop type, growthstage and pest species.
❑ Consider the use of chemical pesticides asthe last option, when the economic injurylevel of a crop is likely to be exceeded andthere are no feasible biological controlmethods available.
Examples
Monitoring for diamondback moth numbers
during the growth of brassica crops is essential
to ensure that the crop is protected and that
spraying is cost effective. In the Manjimup area
several professional crop scouts are paid to
monitor diamondback moth numbers. Moth
numbers often decrease as summer progresses
and it may cost more to spray low-density
infestations at this time than can be justified by
the small gain in product harvested.
For organic growers, spraying with all butnatural and some mineral formulations is notpermissible. They must rely on physical andbiological controls and hope that reductions inyield and quality incurred by pest invasions willbe compensated for by the higher price receivedfor the organically grown product.
190
SEC
TIO
N 7
7.3 Control weeds andinvertebrate pests by timelyphysical, biological andchemical means
In many cases the old adage ‘a stitch in timesaves nine’ holds true with pest populations. Theuse of physical and biological control measurespre-planting or when a pest is first detected isalways preferable to using chemical pesticidesafter pest populations have reached damagingnumbers.
New weed threats
There are many examples of weeds that causeserious damage to horticulture in other countriesand the eastern States of Australia. One of thegreat advantages of Western Australianhorticulture is that most of these weeds have notbecome established here and grower vigilancecan prevent this from happening.
❑ Be vigilant for new noxious weeds andreport their occurrence to the Departmentof Agriculture immediately.
The serious weeds listed below pose particularthreats to our industry as they have causedserious economic damage to horticultureoverseas and in some areas of Australia.
Examples of serious weeds that occur in Western
Australia and would cause serious damage if
introduced to vegetable and potato growing
areas are.
Orobanche Mimosa bush
Small-seeded dodder Parkinsonia
Ragwort Mesquite
Skeleton weed Bathurst burr
Golden dodder
Orobanche or broomrapes(Agriculture Western Australia, 1999)
The Orobanche, or broomrapes, are parasiticplants that attack the roots of a considerablenumber of crops including pulses, pasturelegumes, oilseeds and a wide range ofvegetables. Broomrapes were identified asthreats under the Grain Guard and Hort Guardinitiatives.
Of the numerous broomrapes worldwide, fiveare particularly weedy and cause heavy damagein Mediterranean countries, Europe, Asia andAmerica. These are O. aegyptiaca, O. cernuavar cernua, O. crenata, O. cumana and O.ramosa. Major crops will be seriously affected ifthese weedy Orobanche enter the country andbecome established. One of these (O. ramosa)has been recorded in South Australia and is thesubject of an eradication campaign. Anotherstrain of Orobanche has been found attackingcarrots on a property in Tasmania.
Don’t be complacent – report any Orobanche oncrops to Agriculture Western Australiaimmediately.
Hosts
Broomrape seeds are triggered to germinate bythe presence of suitable host roots. Dependingon the species of broomrape, potential hostsinclude: beans, broadbeans, cabbages,cannabis/fibre hemp, canola, capsicums, carrots,cauliflowers, celery, chickpeas, chrysanthemums,clover, cucumbers, eggplant, lentils, lettuce,lupins, melons, peas, potatoes, sunflowers,tobacco, tomatoes and vetch.
Vigilance is necessary but, to compound theproblem, two other Orobanche species arenaturalised in Australia. O. cernua varaustraliana is a rare native never recorded asattacking crops. Common broomrape (O. minor)is common and widespread in Western Australiaand doesn’t seem to cause any harm. It attacksseveral common pasture plants, weeds andgarden plants including capeweed, clover,flatweed, nasturtiums and petunias.
Biology and effects
Orobanche are true parasites. They have nochlorophyll (green pigment) and can onlysurvive when attached to a host. Broomrapesattach to the host plant via a specially adaptedroot system and deprive their hosts of nutrientsand water. The relationship with the host variesfrom a benign partner to causing significantyield loss or death. This depends on variousfactors including species of Orobanche, degree
191
SEC
TIO
N 7

of parasitisation, time of sowing and hostsusceptibility.
Broomrape seeds are small, like dust, and lastfor many years in the soil. A single Orobancheplant can produce up to 500,000 seeds, withdormancy of 10 years or more being common.Once they have flowered, broomrapes willproduce seeds even after they have been pulledout.
All Orobanche are AQIS prohibited imports butthe seeds could enter the country undetected.The seeds can be spread by contaminated soil,produce, machinery, livestock or clothing. Ifthese parasites become established, even in smallareas, all Australian export markets could beaffected as many of our trading partners prohibitall Orobanche.
Control
The only way to control pest broomrapes is soilfumigation with methyl bromide being the mosteffective. Some herbicides control pestbroomrapes but they develop herbicideresistance. They have also overcome Orobancheresistance bred into crops. For severeinfestations the only viable option may be toswitch to non-host crops such as orchard cropsor vines.
What the grower can do
Look for pest broomrapes in crops. Dig upOrobanche plants to determine which plant isthe host. Mark the site in some way so it can befound easily later. Report any crops affected byOrobanche to the nearest office of Departmentof Agriculture WA. Use the free Grain Guard orDepartment of Agriculture Plant Laboratories kitto submit samples for identification.
Inter-rotation crops for weed control
Weeds such as wild radish can be a real problemwhen coming out of a weed infested pasturephase. Many weed species have seed dormancyof more than one year and do not seed orgerminate evenly, making their control duringthe vegetable cropping operation particularlydifficult.
❑ Planting a break crop is a good practice toreduce risk of weed competition in thevegetable or potato crop.
The cultivation will kill a large portion of theweed population and more will be killed bycompetition from the fast growing cereal crop.The numbers of viable weed seeds left in theground will be greatly reduced. Break cropshave added benefits when lightly mulched in,providing soil stability and increasing soilorganic matter. Money saved by reducing weedspraying and the soil health benefits gained arealmost certain to outweigh the cost of growing abreak crop and any grazing value that may beforegone.
Treating weeds(Sindel, 2000)
It is far easier to remove a few weed plants whenthey are first seen on the property than to waituntil a large-scale control effort is necessary.This is particularly true of persistent species withlong seed dormancy such as doublegees orPatterson’s curse.
❑ Where a few weeds are found, pull or spotspray them by hand before they haveseeded. Check the area for a few years andspot spray any re-infestation that mayoccur from dormant seed.
Pre-planting weed control measures
Seed of the species previously occurring on thesite will be in the soil and likely to germinateafter cultivation. The species of weeds in cropsor pasture should be recorded in the spray diaryfor future reference. Knowing the speciespresent will influence decisions as to whetherpre-emergent herbicide application will beneeded, how much and what type of herbicide touse.
Pre-planting weed control measures such ascultivation or spraying with pre-emergentherbicides are far preferable and less costly thanattempting to treat a weed population in a crop.
192
SEC
TIO
N 7
Early control of weeds in crops
Control of large weed populations in vegetableand potato crops is very difficult and usuallyuneconomic once the plants are more than 10 cmin height.
❑ Control emergent weeds when they arevery small, by selective herbicides,mechanical or hand weeding or flaming.
Weeds in access ways and waterways
These should be controlled because they are asource of seed for further spread and also mayharbour pest and diseases. In these situations,weeds should not be controlled by cultivation asthe risk of erosion is high.
❑ To control weeds in access ways andwaterways, do not cultivate. Use thefollowing alternatives:
- Mow or slash at or before flowering,leaving the mulch to protect the surface.
- Use selective herbicides instead ofcultivation.
Preventing herbicide resistance(Avcare, 2001)
Herbicide resistance has developed a strongfoothold in Australian agriculture since it wasfirst reported in annual ryegrass in 1982. It hasspread and diversified to become a keyconstraint to crop production in all States with ahistory of intensive herbicide use.
Today resistance has been confirmed in agrowing number of grass and broad leaf weedspecies. More worrying still, resistance has nowdeveloped to seven distinctly different herbicidechemical groups. This significantly reducesherbicide options for the grower. Cases ofmultiple resistance have also been commonlyreported where, for example, annual ryegrassproves resistant to two or more chemical groups.
Avcare with support from the CRC for WeedManagement Systems (Weeds CRC) and theGrains Research and Development Corporation(GRDC) introduced a classification system forherbicides enabling farmers and advisors to
understand the mode of action grouping. Since1996 all herbicide product labels have had tocarry the designated mode of action group letterin a prominent position. This was a world firstfor Australia. A recent survey of growers andagronomists (Kondinin, 1998) revealed that 85%of growers are aware of herbicide mode ofaction groups and consider this important whenmaking buying decisions. This is a good start butanti-resistance strategies require continualimplementation to keep the problem at bay.
❑ To prevent herbicide resistance:
- Rotate the herbicide groups used.
- Reduce frequency of herbicideapplication by considering physicalalternatives such as mechanical weeding,cultivation and flaming.
To achieve effective herbicide rotations it isnecessary to carefully record when and whatchemicals were used and what and where weedoutbreaks occurred (see ‘7.3 ‘The spray diary’).
Herbicide modes of action(Avcare, 2001)
Herbicides act by interfering with specificprocesses in plants; this is their mode of action.
Herbicide product labels carry a letter codeA,B,C, .... N representing their specific mode ofaction group.
The main reason resistance has developed isbecause of the repeated and often uninterrupteduse of herbicides with the same mode of action.Selection of resistant strains can occur in as littleas 3-4 years if no attention is paid to resistancemanagement. Remember that the resistance riskis the same for products having the same modeof action. Continuing to use products with thesame mode of action and not following an anti-resistance strategy creates future problems.
Herbicides are now grouped by mode of action.
Growers and agronomists are now better aided tounderstand the huge array of herbicide productsin the marketplace in terms of mode of actiongrouping and resistance risk by reference to the
193
SEC
TIO
N 7
SEC
TIO
N 7
mode of action chart (Appendix 7.1). Allherbicide labels now carry the mode of actiongroup clearly displayed such as:
GROUP B HERBICIDE
Know the herbicide groups to make use of this!
Not all mode of action groups carry the samerisk for resistance development.
❑ To effectively manage herbicide resistance,get to know your herbicide groups andfollow these simple steps.
- Design anti-resistance strategies aroundintegrated weed management guidelines.
- Check this chart for herbicides in the samegroup (the resistance risk is the same).
- Where possible reduce reliance on high riskgroups.
- Rotate between groups across years.
- Seek advice and further information aboutanti-resistance strategies.
- Keep accurate records of herbicideapplications on a paddock basis.
How to rotate mode of action groups(Avcare, 2001)
Specific guidelines are below for productsrepresented in Group A (mostly targeted atannual ryegrass and wild oat) and Group B(broadleaf weeds) – HIGH-RISK herbicides –for use of these products in winter croppingsystems. Guidelines for the use of Group Cproducts (annual ryegrass, radish) are alsoprovided.
The guidelines should be incorporated into anIntegrated Weed Management (IWM) program.In all cases try and ensure surviving weeds fromany treatment do not set and shed seed. For allGroups ensure rotation between products fromdifferent mode of action groups.
Group A (fops and dims) herbicides
1. Apply only one application of a Group Aherbicide per season. ‘Fops ‘ and ‘dims ‘ areboth Group A herbicides and carry the samehigh resistance risk.
2. Where a Group A herbicide has been used ona particular paddock for control of any grassweed, do not use the same Group in thefollowing season, irrespective of theperformance it gave.
3. Where resistance to Group A exists, use othercontrol methods to reduce populations tomanageable levels and apply other herbicidegroups in a future integrated approach.
Group B (ALS inhibitors)
1. Apply only one application of a Group Bherbicide per season.
2. If a Group B herbicide has been applied as a pre-emergent application, DO NOT applyfurther Group B herbicides to that crop. Makeany further post-emergent applications withherbicides from a different mode of actiongroup.
3. Apply no more than two Group B herbicidesin any four year period on the same paddock.
4. If a post-emergent application is made with aGroup B herbicide, this should preferably beas a tank-mix with another mode of actionthat controls or has significant activity againstthe target weed. If any further applications arerequired in that season, it should be with anon-ALS mode of action herbicide thatcontrols the target weed.
5. A Group B herbicide may be used alone onflowering wild radish only if a Group B
herbicide has not been previously used on thatcrop.
Group C (including triazine herbicides)
1. Do not use Group C herbicides in consecutiveyears or on winter legume crops.
2. Apply only one application of a Group Cherbicide per crop per season.
3. For use of triazines in triazine tolerant canola(TT):
a) Pre-emergent or post-sowing pre emergentonly. (Annual ryegrass plus other specified
194

grasses and broadleaf weeds, see label fordetails)Rate 1 – 2 kg ai / ha
b) Post-emergent application (radish, turnips,mustards, see label for details)Rate 0.5 – 1 kg ai / ha
c) Consult the triazine ‘Code of Practice’ foruse in TT canola.
d) A maximum of no greater than 2 kg ai / haof either atrazine or simazine or combinationof both is to be applied in any one season onTT canola.
4. The resistance status of the ‘at-risk’ weedsshould be determined prior to sowing.
Biological control of invertebrate pests
Biological control is the utilisation of predators,parasites, nematodes, fungi, bacteria and virusesto attack many insect pests. In an undisturbedenvironment, the number of pest insects andtheir natural enemies remains relatively stable.The abundance of any pest species depends uponthe amount of food, the competition from otherspecies and the number of predators.
Nearly all insect pests have natural enemies(termed ‘beneficial species’) and if theenvironment or their breeding habits can bemanipulated to achieve a large population, theycan control the pest.
❑ Use biological control as the first choice forearly intervention against insect pests.
Example
A predatory mite can be obtained and
introduced against the pest two spotted mite in
strawberries.
‘Soft’ pesticides for control ofinvertebrate pests
❑ Encourage beneficial species by using softoptions.
If a crop must be sprayed to control a pest, softoptions – those that are most pest specific andleast toxic to humans – should always beconsidered first.
Use of toxic, broad spectrum pesticides shouldbe avoided because they often kill the beneficial,predator species which help to keep pestnumbers down. The result is often thatsubsequent pest outbreaks are more severebecause there are fewer predators to controlthem.
The major ‘soft options’ are biologicalpesticides, commonest of which is Bacillusthuringensis, a stomach pathogenic bacteriawhich is non-toxic to humans and specific in itsaction against leaf eating caterpillars.
Some chemicals are specific in their actionagainst certain insect pests. There are manyothers that are ‘predator friendly’– they do notharm beneficial species.
❑ Wherever possible, use the most pestspecific pesticides, that is biologicalpesticides or those chemicals that arelabelled ‘predator friendly’.
Examples of ‘soft options’
Bacillus thuringensis (Bt) sprays are animportant part of strategies to control leaf eatingcaterpillars such as diamondback moth (HRDC,Agriculture Western Australia, 2001). Bt spraysare recommended to control diamondback mothduring early growth of brassica crops, when themoth larvae (grubs) are small. For control in midto late crop stages, rotating spraying withdifferent chemical insecticides minimises therisk of the insect developing resistance to achemical. Use of extremely toxicorganophosphate insecticides such as Mevinphoscan usually be avoided.
Pirimicarb is the best chemical to use againstaphids as it does not affect beneficial insectspecies (Learmonth, 2001).
Soil treatment for control of African blackbeetle without soil fumigation(Learmonth, 2001).
If monitoring and past experience indicates thatblack beetle will be a problem, these can becontrolled by applying pesticide to the soil.Spray chlorpyrifos on the soil in front of the
195
SEC
TIO
N 7

planter or incorporate it using only a single passwith tines and a crumbler. This is not asdamaging to the soil as fumigation because thepesticide acts only on insects, not other soilorganisms such as fungi that may be beneficialto soil structure.
The method of incorporation is also much lessdestructive of soil structure than the rotaryhoeing. However, for chlorpyrifos to have someeffect on controlling whitefringed weevil as wellas black beetle, thorough incorporation with arotary implement is necessary.
The spray diary
Keeping a spray diary enables growers to referto prior spray treatments and results to:
- Identify the most specific, least toxic pesticideand the minimum quantity required for controlof the target pests.
- Improve the efficiency and cost effectivenessof their pesticide use.
- Review suitability of chemicals for futureapplications.
- Prevent build-up of pesticide resistance in thepest species.
❑ Maintain a detailed spray diary and recordin it:
- The dates when the occurrence of thepests were observed in the crop, whentheir population increased
- Pesticides used, rate of application, cost
- Date of spraying
- Crop sprayed, crop growth stage andcrop vigour
- Effectiveness of the treatment
- Other factors that can influence theeffectiveness of a control measure, suchas weather conditions, site history of thepest.
The spray diary records for each crop should bekept, together with crop monitoring records andrecords of other IPDM control measures.
Comparison of these records will determine theeffectiveness of the pest control strategies.
Records of pest control costs and crop returnscan be used to estimate economic injury levelsfor the different crops and pests.
Insecticide resistance management(Insecticide Resistance Action Committee, 2002)
❑ Implement insecticide resistancemanagement strategies.
❑ Minimise the use of insecticides byIntegrated Pest and Disease Management.
❑ Use insecticides from different groups inrotation.
Genetics and intensive application of pesticidesare responsible for the quick build-up ofresistance in most insects and mites. Naturalselection by an insecticide allows some insectswith resistance genes to survive and pass theresistance trait on to their offspring. Thepercentage of resistant insects in a population continues to multiply while the insecticideeliminates susceptible insects.
Eventually, resistant insects outnumbersusceptible ones and the pesticide is no longereffective. How quickly resistance developsdepends on several factors, including howquickly the insects reproduce, the migration andhost range of the pest, the crop protectionproduct’s persistence and specificity, and therate, timing and number of applications made.Resistance increases fastest in situations such asgreenhouses, where insects or mites reproducequickly. There is little or no immigration ofsusceptible individuals, and the grower mayspray frequently.
General insecticide use is no longer the answerto pest control. Insects have developedwidespread, insecticide-defeating resistance tomany traditional treatments, and the industrymay not have enough resources to continuallydevelop and supply the market with newproducts precisely when needed to replace oldones. Growers with resistance problems do nothave enough time to wait for new chemistry. By
196
SEC
TIO
N 7

working together, insecticide resistance can bemanaged! It is imperative growers maintain thatthe effectiveness of available insecticidesthrough adoption of the management principlesdescribed below.
Resistance is costly; management is economical
It has been estimated that insecticide resistancein the United States adds $40 million to the totalinsecticide bill in additional treatment costs oralternative controls. Better management ofpesticides by farmers and the crop expertsassisting them, industry specialists say, couldreduce this bill and lead to more effective, moreefficient use of products.
Causes of resistance
Resistance is defined as a reduction in thesensitivity of a population. This is reflected inrepeated failure of a product to achieve theexpected level of control, when used accordingto the label recommendations for that pestspecies. There are several ways insects canbecome resistant to crop protection products:
- Metabolic resistance. Resistant insects maynaturally detoxify or destroy the toxin fasterthan susceptible insects, or quickly rid theirbodies of the toxic molecules.
- Altered target-site resistance. The site wherethe toxin usually binds in the insect has beengenetically modified to reduce the product’seffects.
- Penetration resistance. Resistant insects mayabsorb the toxin slower than susceptibleinsects.
- Behavioural resistance. Resistant insects maydetect or recognise a danger and avoid thetoxin.
Pests often utilise more than one of thesemechanisms at the same time.
Integrating control strategies for resistance
An integrated approach prevents resistance. Theultimate strategy to avoid insecticide resistanceis prevention. More and more crop specialists
recommend insecticide resistance managementprograms as one part of a larger integrated pestand disease management (IPDM) approach.
Insecticide resistance management, involvesthree basic components of IPDM described inSections 7.2 and 7.3:
- Monitoring pest complexes for populationdensity and trends.
- Focusing on economic injury levels.
- Integrating control strategies.
Monitoring is just one element of an insecticideresistance management program. To avoidresistance, specialists say growers should take anintegrated approach. Incorporate as manydifferent control mechanisms as possible. IPDM-based programs will include beneficial insects(predator/parasites), cultural practices, croprotation, pest-resistant crop varieties andchemical attractants or deterrents, together withthe use of synthetic insecticides and biologicalinsecticides:
- Cultural practices. For example, destroyingover-wintering areas, can play a role inmanaging resistance.
- Preserve susceptible genes. Some programs tryto preserve susceptible individuals within thetarget population by providing a haven forsusceptible insects, such as unsprayed areaswithin treated fields, adjacent ‘refuge’ fields,or habitat attractions within a treated field thatfacilitate immigration. These susceptibleindividuals may outcompete and interbreed with resistant individuals, diluting the impactof resistance.
- Consider crop residue options. Destroyingcrop residue can deprive insects of food andoverwintering sites. This cultural practice willkill pesticide-resistant pests (as well assusceptible ones) and prevent them fromproducing resistant offspring for the nextseason. However, farmers should review theirsoil conservation requirements beforeremoving residue.
197
SEC
TIO
N 7
Planning and conducting spraying accordingto best practice(Avcare, 2001)
Avoid broad-spectrum insecticides when anarrow or specific insecticide will suffice. Selectinsecticides with care and consider the impact onfuture pest populations.
Protect beneficials. Select insecticides in amanner that causes minimum damage topopulations of beneficial arthropods. Applyinginsecticides in a band over the row rather thanbroadcasting or using a product in-furrow willhelp maintain certain natural enemies.
Time applications correctly. Time insecticide andmiticide applications against the most vulnerablelife stage of the insect pest. Use spray rates andapplication intervals recommended by themanufacturer.
Mix and apply carefully. As resistance increases,the margin for error in terms of insecticide dose,timing, coverage, etc., assumes even greaterimportance. The pH of water used to dilute someinsecticides in tank-mixes should be adjusted to6 to 8. In the case of aerial application, the swathwidths should be marked, preferably bypermanent markers. Sprayer nozzles should bechecked for blockage and wear, and be able tohandle pressure adequate for good coverage.Spray equipment should be properly calibratedand checked on a regular basis. Use applicationvolumes and techniques recommended by themanufacturers and local advisors.
Rotating insecticide groups (Avcare, 2001)
Do not repeatedly use, year after year, the sameinsecticide or related products in the same class.Rotate insecticides across all available classes toslow resistance development. (refer to Appendix7.2 for insecticides and their groups).
In addition, growers should avoid tank-mixingproducts from the same product class. Rotateproduct classes and modes of action, considerthe impact of pesticides on beneficial insects,and use products at labelled rates and sprayintervals.
Cross-resistance occurs when a population ofinsects that has developed resistance to oneproduct exhibits resistance to one or moreproduct(s) it has never encountered. Cross-resistance is different from multiple resistance,which occurs when insects develop resistance toseveral compounds by expressing multipleresistance mechanisms. A classic example ofcross-resistance was when many speciesdeveloped resistance to DDT and subsequentlyhad cross-resistance to pyrethroids.
If resistance is suspected
If growers encounter control failure and suspectthey have a case of insecticide resistance, it’sbest not to jump to any conclusions until theyconsult with crop specialists. Several otherproblems have similar symptoms, so if poorcontrol is experienced, growers should firstcheck for:
Application error. Were the timing of theapplication and the dosage correct? Were properproduct carriers used? Was the correctapplication method followed? Was the timing fortreatment evaluation incorrect, or does theproduct require more than one application?
Equipment failure. Were the spray nozzlesblocked? Were all parts of the applicatorfunctioning properly? Was the equipmentcalibrated for accurate application usingrecommended spray volumes and pressures?
Environmental conditions. Did rain or overheadirrigation occur too soon after application? Weretemperature, wind or other environmentalconditions less than ideal for application?
Be certain it’s resistance
If resistance is suspected, there are several stepsgrowers can take to keep the problem frommushrooming. First and foremost, they shouldnot respray with an insecticide of the samechemical class. Their crop protection sales agentshould be contacted to help evaluate the cause ofcontrol failure. He or she will call additionalexperts as needed to accurately confirminsecticide resistance.
198
SEC
TIO
N 7
To confirm resistance, an evaluation of thesurviving insects for the level of detoxifyingenzymes or the presence of resistant genes willbe made by professionals using a number ofmethods. In some cases, diagnostic doses of aspecific product are applied to surviving insectsfrom the field. Depending on availableresources, insects may be taken to a laboratoryfor immunological or DNA diagnostictechniques. Producers should always work withlocal crop specialists to determine appropriatemonitoring and diagnostic programs for theirresistance-related situations.
To manage resistant insect populations, cropspecialists may want to counsel growers on thefollowing:
- Short-term spray decisions.
- Resistance management tactics.
- Evaluating the success of a resistancemanagement program.
- Tracking resistance status on a farm or field-by-field basis.
- Determining relative tolerance of pests andbio-control agents.
References
AGWEST Plant Laboratories et al, 1998.Western Australian Certified Seed PotatoScheme Production Rules. Bulletin.
Agriculture Western Australia, 1999. Orobanche:Parasitic Weed Threats to the Pulse, Oilseed andVegetable Industries. Farmnote 81/99.
Avcare, 2001. Mode of Action Classification forInsecticides.Website: http://www.avcare.org.au/documents
Avcare, 2001. Herbicide Resistance, Reducingthe Impact. Website: http://www.avcare.org.au/documents
Avcare, 2001. Herbicide Modes of Action.Website: http://www.avcare.org.au/documents
Department of Agriculture NSW, 1981. Diseasesof Carrots. Agfact H8.AB.17.
Department of Primary Industries, Qld., 1999.Diamondback Moth in Selected BrassicaVegetable Crops.
Donald, C., Enderby, N., Ridland, P., Porter, I.and Lawrence, J., 2000. Field Guide to Pests,Diseases and Disorders of Vegetable BrassicasISBN 0 7311 44740. Department of NaturalResources and Environment, Vic.
Endersby, N and Ridland, P., 1996. IntegratedPest Management Tactics For DiamondbackMoth. Natural Resources and Environment InfoNotes.
Floyd, R., 1988. Vegetable Seed Treatments.Agriculture Western Australia Farmnote 84/88.
Floyd, R. and Delroy, N., 1988. Bacterial Wiltof Potatoes. Agriculture Western AustraliaFarmnote 84/88.
Floyd, R.,1998. Sclerotinia Disease ofVegetables. Agriculture Western AustraliaFarmnote.
Floyd, R., 1990. Soil-borne Diseases inHorticulture. Agriculture Western AustraliaFarmnote 79/90.
HRDC, Agriculture Western Australia, 2001.Resistance Management Strategy forDiamondback Moth in Brassica Crops in WA.(leaflet).
Heisswolf, S and Brown, E., 1997. Pests andBeneficials in Brassica Crops. Agdex 253/620Qld Department of Primary Industries.
Insecticide Resistance Action Committee, 2002.Insecticide Resistance, the Facts. Website:www.plantprotection.org/irac/general resources
Lancaster, 2001. Pers. comm. Department ofAgriculture Western Australia.
Learmonth, S., 1993. Insect Pests of Potatoes.Agriculture Western Australia Bulletin 4259.
Learmonth, S., 2001. Pers. comm. Department ofAgriculture Western Australia.
Llewellyn, R., 2000. Sweet Corn Insect Pestsand their Natural Enemies- an IPM Field Guide.ISBN 1 86423 972 7. Bio Resources P/L.Greenridge Press.
199
SEC
TIO
N 7

Nursery and Garden Industry Australia, 2002.Introduction to the Nursery IndustryAccreditation Scheme.http://members.ozemail.com.au/nian
Porter, I., Donald, C. and Lancaster, R., 1997.Integrated Strategies to Control and Prevent theSpread of Clubroot. HRDC.
Sindel, BM., 2000. Australian WeedManagement Systems. Cooperative ResearchCentre for Weed Management.
Further Reading
Agriculture Western Australia, 1985. Diseasesand Pests of Carrots. Farmnote 26/85.
Agriculture Western Australia, 1994. Control ofPest Snails and Slugs: Chemical. Farmnote 113b/94.
Agriculture Western Australia, 1994. Control ofPest Snails and Slugs: Cultural and Biological.Farmnote 113a /94.
Agriculture Western Australia, 1995. TheWestern Flower Thrips. Farmnote.
Burt, J., 1998. Growing Cabbages. AgricultureWestern Australia Bulletin 4346.
Burt, J.R., 1996. Guide to the OrganicProduction of Vegetables. Agriculture WesternAustralia Bulletin 4319.
Floyd, R., 1991. Fungal Diseases of Potatoes.Agriculture Western Australia Farmnote 74/91.
Floyd, R., 1988. Diseases of Crucifers.Agriculture Western Australia Farmnote 84/88.
Stanton, J., 1988. Sugar Beet Nematode onVegetables. Agriculture Western AustraliaFarmnote 88/88.
200
SEC
TIO
N 7

APPENDIX 7.1
Herbicide Resistance Groups(Avcare, 2001)
HIGH RISK
GROUP AInhibitors of fat(lipid) synthesis–ACC’aseinhibitors.Aryloxyphenoxypropionates ("Fops"): Correct ®, Falcon ®, Fusilade ®, Fusion ®,Hoegrass ®, Puma S ®, Shogun ®, Targa ®,Topik ®, Tristar ®, Verdict ®, Wildcat ®,diclofopCyclohexanediones ("Dims"): Achieve ®,Fusion ®, Select ®, Sertin ®, Sertin ® Plus
GROUP BInhibitors of the enzyme acetolactatesynthase–ALS inhibitors.Sulfonylureas: Ally ®, Brush-Off ®, Cut-OutTM,Glean ®, Harmony ® M, Logran ®, Londax ®,Monza ®, Oust ®, Renovate ®, Titus ®,metsulfuron, chlorsulfuronImidazolinones: Arsenal ®, Flame ®, OnDuty ®, Spinnaker ®Sulfonamides: Broadstrike ®, Eclipse ®
MODERATE RISK
GROUP CInhibitors of photosynthesis and photosystem II.Triazines: Agtryne ® MA (also contains MCPA– Group I ), Bladex ®, Gesagard ®, Gesaprim ®, Igran ®, atrazine, simazine,terbutrynTriazinones: Lexone ®, Sencor ®, Velpar ®,metribuzinUreas: Afalon ®, Cotoran ®, Graslan ®,Karmex ®, Tribunil ®, Probe ®, Tupersan ®,Ustilan ®, diuron, linuronNitriles: Buctril ® 200, Buctril ® MA (alsocontains MCPA -Group I), Jaguar ® (alsocontains diflufenican – Group F), Totril ®,bromoxynilBenzothiadiazoles: Basagran ®Acetamides: Ronacil ®
Uracils: Hyvar ®, Krovar ®, Sinbar ®Pyridazinones: Pyramin ®Pheny-pyridazines: Tough ®
GROUP DInhibitors of tubulin formation.Dinitroanilines: Relay ®, Surflan ®, Stomp ®,Treflan ®, Yield ®, trifluralinBenzoic acids: Chlorthal ®Pyridines: Visor ®
GROUP EInhibitors of mitosis.Thiocarbamates: Avadex ® BW, Eptam ®,Ordram ®, Saturn ®, Tillam ®, Vernam ®,molinateCarbamates: chlorprophamOrganophosphorus: bensulide
GROUP FInhibitors of carotenoid biosynthesis.Nicotinanalides: Brodal ®, Jaguar ® (alsocontains bromoxynil - Group C ), Tigrex ® (alsocontains MCPA – Group I)Triazoles: amitrolePyridazinones: Solicam ®Isoxazolidinones: Command ®, Magister ®Pyrazoles: Taipan ®
GROUP GInhibitors of protoporphyrinogen oxidase.Diphenyl ethers: Affinity ®, Blazer ®, Goal ®,Spark TM Oxidiazoles: Ronstar ®
GROUP HInhibitors of protein synthesis.Thiocarbamates: Saturn ®
GROUP IDisrupters of plant cell growth.Phenoxys: 2,4-D, 2,4-DB, MCPA, Barrel ® ,(also contains bromoxynil and dicamba – GroupC and Group I ), Buctril ® MA (also containsbromoxynil – Group C ), Tigrex ® (also containsdiflufenican – Group F), Tillmaster ® (alsocontains glyphosate -Group M)
201
SEC
TIO
N 7

Benzoic acids: Banvel ®, Cadence ®, dicambaPyridines: Garlon DS ®, Lontrel ®, Tordon ® 242, Tordon ® 75-D, Starane ® ,triclopyr
LOW RISK
GROUP JInhibitors of fat synthesis.Alkanoic acids: Propon
GROUP KHerbicides with multiple sites of action.Amides: Devrinol ®, Dual Gold ®, Enide ®,Kerb ® WP, Ramrod ®, napropamide,metolachlorCarbamates: Asulox ®, Betanal ®, Carbetamex ®, asulamAmino propionates: Mataven L ®Benzfurans: Tramat ®, ethofumesatePhthalamates: Alanap ®Nitriles: dichlobenil
GROUP LInhibitors of photosynthesis at photosystem I.Bipyridils: Gramoxone ®, Reglone ®,SpraySeed ®, paraquat, diquat
GROUP MInhibitors of EPSP synthase.Glycines: Roundup ®, Tillmaster ® (alsocontains 2,4-D – Group I), Touchdown,glyphosate
GROUP NInhibitors of glutamine synthetase.Glycines: Basta ®
Note: Groups are listed by resistance risk. Thelisting of trade names does not represent anexhaustive record of registered products.Products listed are primary registered productsonly and are arranged in alphabetical order.Active ingredient names are additionallyincluded where multiple products are registered.
202
SEC
TIO
N 7

APPENDIX 7.2
Mode of Action Classification for Insecticides, by active constituent. (Avcare, 2001)
Active Constituent Group Active Constituent Group Active Constituent Group
abamectin 6A cypermethrin 3A maldison (malathion) 1B
acephate 1B cypermethrin (zeta) 3A methamidophos 1B
aldicarb 1A cyromazine 18A methomyl 1A
allethrin 3A deltamethrin 3A methoprene 7A
alpha-cypermethrin 3A diafenthiuron 12B methyl bromide 8A
aluminium phosphide 8B diazinon 1B mevinphos 1B
amitraz 19A dichlorvos 1B milbemycin 6B
avermectin 6A dicofol 2B monocrotophos 1B
azamethiphos 1B diflubenzuron 15A omethoate 1B
azinphos methyl 1B dimethoate 1B oxamyl 1A
azinphos-ethyl 1B disulfoton 1B parathion 1B
Bacillus thuringiensis 11C emamectin benzoate 6A parathion-methyl 1Baizawai
Bacillus thuringiensis 11B endosulfan 2A permethrin 3Aisraelensis
Bacillus thuringiensis 11C esfenvalerate 3A phorate 1Bkurstaki
Bacillus thuringiensis 11D ethion 1B phosmet 1Bsphaericus
Bacillus thuringiensis 11A fenbutatin oxide 12A phosphine 8Btenebrionis
Bacillus thuringiensis 11E fenitrothion 1B pirimicarb 1Atolworthi
bendiocarb 1A fenoxycarb 7B pirimiphos-methyl 1B
betacyfluthrin 3A fenpyroximate 21A profenofos 1B
bifenthrin 3A fenthion 1B propargite 14A
bioallethrin 3A fipronil 2C propoxur 1A
bioresmethrin 3A flutriafol 3A prothiofos 1B
buprofezin 17A fluvalinate 3A pymetrozine 9A
cadusafos 1B furathiocarb 1A pyrethrins 3A
carbaryl 1A hexaflumuron 15A pyridaben 21A
carbofuran 1A hexythiazox 10A
carbosulfan 1A hydramethylnon 20A
chlorfenapyr 13A hydroprene 7A
chlorfenvinphos 1B imidacloprid 4A
chlorpyrifos 1B indoxacarb 22A
chlorpyrifos-methyl 1B isofenphos 1B
clofentezine 10A lamda-cyhalothrin 3A
cryolite 9B magnesium phosphide 8B
cyfluthrin 3A methidathion 1B
203
SEC
TIO
N 7

204
SEC
TIO
N 7
A weed-free carrot crop on the Swan Coastal Plain.
Cleaning machinery is an important hygiene measure.


Maintaining our Native Flora & FaunaSE
CTI
ON
8
In addition to providing refuge for threatenednative flora and fauna species, native bush hasmany other values, such as protecting waterresources and producing wildflowers, honey andcraft wood. It also contains part of a uniqueresource, our natural biodiversity, which is thevariety of all forms of life, including plants,animals and micro-organisms and the naturalecosystems in which they live. With propermanagement, native bush can provide all ofthese benefits and enhance the value of aproperty.
Even on one farm, a range of ecosystem typesmay exist, with each requiring a differentmanagement strategy. Landcare or Bushcaregroups exist in most districts. One of their mainroles is to provide advice and funding to takeeffective action to rehabilitate native vegetation.Farmers seeking help with these issues areencouraged to contact these groups.
This section contains information for growerswith native bush on their property, or whoseproperties adjoin native bush. There are sectionson:
- protecting, replanting and direct sowing ofnative bush species
- controlling environmental weeds
- controlling feral animals
Specific information is provided on controllingfoxes and rabbits, and about aquatic weeds andstarlings, species not yet established here butwhich pose a serious threat to our native floraand fauna.
8.1 Manage remnant vegetationon the farm to enhance itsquality
Fencing native vegetation
❑ Fencing to exclude stock is the firstmeasure that should be taken to allowremnant native vegetation to regeneratenaturally. It is important to maintain accessfor weed control and fire management.
The type of fence depends on the livestock onthe property and growers’ preferences. Electricfences are the most cost effective for broad acreproperties where cattle are run. Netting fencesare much more expensive but are often used tokeep out pest species, or where both sheep andcattle are run.
Part-funding to fence remnant vegetation isavailable through the Remnant VegetationProtection Scheme (contact Department ofAgriculture WA) and the Bushcare program(contact Department of Conservation and LandManagement or local Community LandcareCoordinator). For approved fencing projects toprotect native bush, these organisations provide$600 per km or $1200 per km where the farmeragrees to a caveat to protect the bush.
Managing native vegetation
It is much easier to manage existing nativevegetation properly and keep it in a healthycondition than to replant or rehabilitate after ithas died off or become weed infested.
The following measures, if undertakenappropriately, can keep native vegetation healthyand protect native fauna:
❑ Minimise disturbance of healthy nativebush.
Grazing or in any way disturbing native bushallows weeds to establish, which are difficult andcostly to remove.
❑ Plan the timing and intensity of controlburns to maintain or increase the diversityof native plant species.
The appropriate fire management will depend onthe type of species association present.Department of CALM or Bushcare officers canprovide advice.
❑ Control introduced weed species in thenative vegetation area.
❑ Control the numbers of feral animalswithin the native vegetation area.
206

SEC
TIO
N 8
❑ Plant native under-storey species alongstream and water body buffers and windbreaks to encourage native fauna. (seebelow).
Infestations of environmental weeds, weeds thatcompete with and replace native species, shouldbe sprayed when they are most actively growing(late winter to early summer depending on thespecies), at or before flowering.
Care should be taken not to spray any nativespecies as these need to grow over and replacethe weed species, thus preventing re-infestation.
Revegetating unproductive areas
❑ Where possible, revegetate unproductiveland to become part of a windbreak andwildlife corridor system on the farm.
Site preparation for establishing native treesand shrubs(Agriculture Western Australia, 1997)
Site preparation is the vital step whenestablishing native trees and shrubs. The aim ofsite preparation is to maximise survival andgrowth of tree seedlings by providing the bestenvironment for plant establishment. Forsuccessful establishment of native vegetation,weeds and pests must be controlled. There arealso soil problems that can slow early rootgrowth:
- compacted layers
- low organic matter and nutrient levels
- waterlogging
- salinity
- low moisture availability due to non-wettingsoil and poor infiltration
Managing these problems enables fast earlygrowth of plants to help them survive their firstsummer and autumn.
Ideally, site preparation should start in latesummer or early autumn for a winter planting.This will allow the most effective ripping andmore efficient weed control on mounded areasbefore planting. Where summer-active perennial
species such as couch, kikuyu or sorrel arepresent it will be necessary to spray to controlthese species before ripping and mounding.Techniques for site preparation are describedbelow.
Ripping
Ripping has been shown to improve tree growthon all farmland soils. It fractures the compactionzone (usually located 200 to 400 mm below thesurface), allowing penetration of tree roots, andit improves moisture infiltration. On most soils,aim to rip to at least 500 mm deep, as a singlerip line per row of trees. Ripping works bestwhen the soil is dry. Also a winged ripping tineresults in better shattering of the subsoil thanwith a conventional tine. Sites which have hardpans (hard or rocky cemented layers at depth)may require deeper ripping (to 1000 mm) with abulldozer.
Ploughing
Broadscale ploughing is not usually practisedbecause of the cost and danger of erosion.However, ploughing can help make tree plantingeasier and improve moisture conservation. It is auseful adjunct to using herbicides to controlweeds such as couch grass (Cynodon dactylon).Also, on heavy soils, ploughing beforemounding benefits the formation of the mound.
Mounding
Mounding is recommended on all but deep, drysandy soils. It concentrates topsoil, which isbeneficial for survival and early growth.
Mounding is essential on wet sites. A 1993 studyshowed that tree survival improved from 65 percent to over 95 per cent by mounding on a siteprone to seasonal waterlogging. On wet sitesmounds should be aligned to allow excess waterto drain off the site without causing erosion. Thedrainage furrows created on each side of themound provide important additional drainage.For maximum effect, these should be continuous,and connected into the drainage network. Themound should be constructed at least 200 mm to300 mm high, about 1000 mm wide and located
207
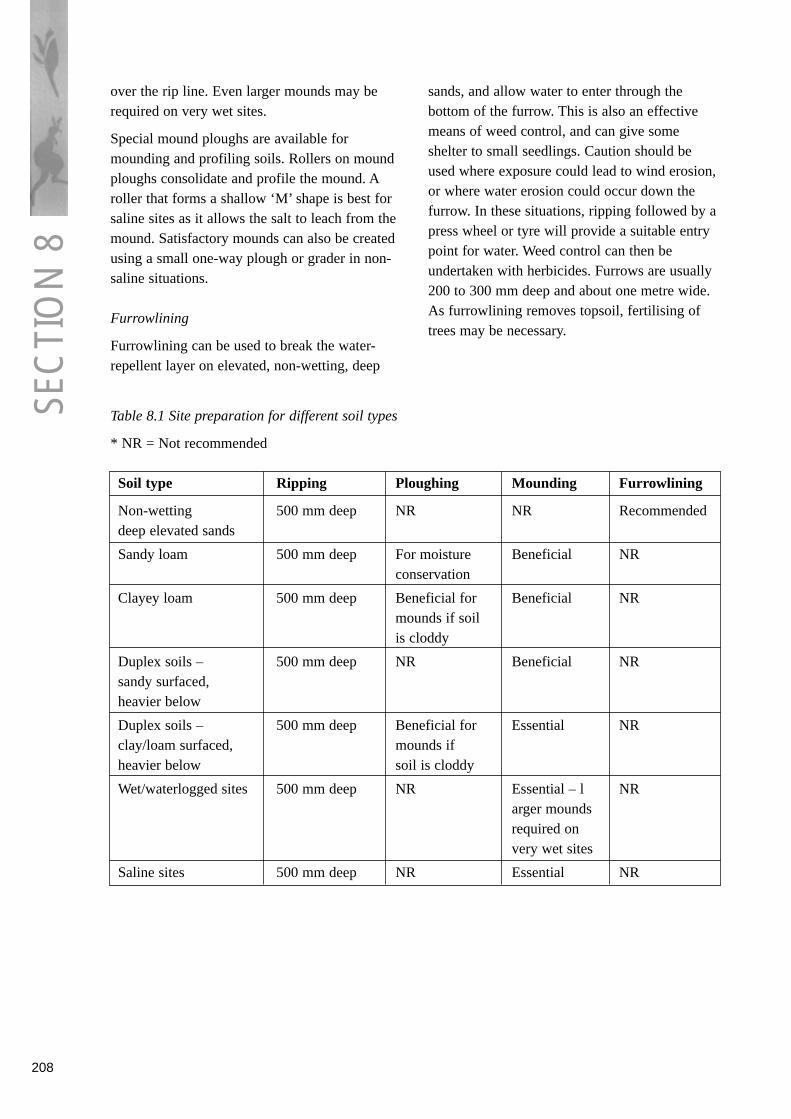
Table 8.1 Site preparation for different soil types
* NR = Not recommended
Soil type Ripping Ploughing Mounding Furrowlining
Non-wetting 500 mm deep NR NR Recommended deep elevated sands
Sandy loam 500 mm deep For moisture Beneficial NR conservation
Clayey loam 500 mm deep Beneficial for Beneficial NRmounds if soil is cloddy
Duplex soils – 500 mm deep NR Beneficial NR sandy surfaced, heavier below
Duplex soils – 500 mm deep Beneficial for Essential NR clay/loam surfaced, mounds ifheavier below soil is cloddy
Wet/waterlogged sites 500 mm deep NR Essential – l NRarger mounds required on very wet sites
Saline sites 500 mm deep NR Essential NR
SEC
TIO
N 8
over the rip line. Even larger mounds may berequired on very wet sites.
Special mound ploughs are available formounding and profiling soils. Rollers on moundploughs consolidate and profile the mound. Aroller that forms a shallow ‘M’ shape is best forsaline sites as it allows the salt to leach from themound. Satisfactory mounds can also be createdusing a small one-way plough or grader in non-saline situations.
Furrowlining
Furrowlining can be used to break the water-repellent layer on elevated, non-wetting, deep
sands, and allow water to enter through thebottom of the furrow. This is also an effectivemeans of weed control, and can give someshelter to small seedlings. Caution should beused where exposure could lead to wind erosion,or where water erosion could occur down thefurrow. In these situations, ripping followed by apress wheel or tyre will provide a suitable entrypoint for water. Weed control can then beundertaken with herbicides. Furrows are usually200 to 300 mm deep and about one metre wide.As furrowlining removes topsoil, fertilising oftrees may be necessary.
208

SEC
TIO
N 8
209
Tree planting (Agriculture Western Australia,1990)
The information in this section is for treeplanting in the medium and high rainfall zone ofWestern Australia.
In Western Australia, most planting ofcommercial trees is done by hand, usingseedlings grown in peat ‘jiffy’ pots, or inspecially moulded plastic trays. Purpose-builtplanting machines are used in some areas, andare particularly suited to planting bare-rootedseedlings.
Ordering seedlings from nurseries
Order in October/November to ensure that thespecies you want can be obtained. Nurseries sowtree seeds into trays of potting mix fromDecember to February. The seedling trees arethen ready for planting after the ‘break ofseason’ in May.
For larger quantities, most nurseries grow toorder, so early ordering helps them meetrequirements. Most nurseries factor in a level ofdiscard plants. Check with the nursery howmany healthy seedlings can be expected in eachtray. Order 5 to 10 per cent more trees than areneeded, to replace seedlings that becomedamaged or that die when transplanted.
If possible, buy seedlings in trays designed forroot training. Seedlings that are pot-bound orhave tightly coiled roots are likely to developroot problems later. Before taking delivery,remove a few seedlings from their trays or potsand check their root structure.
A good size for seedlings is between 15 and 30cm. The stem of tree seedlings should be strong,and have a diameter greater than 2.5 mm at thebase.
Before planting, ensure the seedlings have been‘hardened’, that is, ‘weaned off’ shade andnutrients, at the nursery. Deep green, lush andsoft foliage indicate unhardened seedlings thatmay suffer from transplant shock, dry conditionsand frost. Reputable nurseries sell only‘hardened’ seedlings.
Collecting, transporting and storing seedlings
If possible, collect your seedlings from thenursery close to the date of planting out. Protectthem from sun and wind during transport. Storethe seedlings in an open position protected fromstrong winds. If they must be stored for a longperiod, place them on raised mesh benches or oncoarse blue metal to stop their roots growing intothe soil, and to prevent fungal diseases.Seedlings need a light watering every day duringfine weather. Wash ice off the leaves in themorning if the weather is frosty. On the day theyare to be planted, give the seedlings a thoroughwatering to reduce transplant shock and makethem easier to remove from their pots or trays.
When to plant
Early June to mid-August is the optimum timefor tree planting in southern Western Australia –starting as soon as the soil is thoroughly wetwith winter rains and adequate weed control hasbeen achieved. On dry sites, for example deep,elevated sands, it is best to plant trees before themiddle of July. Very wet sites can be left untilthe end of August to minimise stress on theseedlings from waterlogging.
Planting
Remove seedlings from their cells in plastictrays by pushing up from the bottom while at thesame time gently pulling on the stem. If theseedlings are pot bound, with tightly coiledroots, make two shallow vertical cuts down theroot ball with a knife and gently tease out someof the roots.
If the seedlings are in peat ‘jiffy’ pots, cut offany large roots protruding from the pots, andbreak off the bottom and one side of the pot toprevent root coiling. Also remove any excesspeat from the top rim of the jiffy pot. If notburied properly, the jiffy pot’s exposed rim canact as a wick and dry out the roots.
Plant only healthy, actively growing seedlings –discard others. Prepare only 50 to 100 trees at atime on planting trays, to prevent them dryingout, and to reduce transplant shock.

210
Planting depth
Plant seedlings deeper than they were growing inthe nursery, to make sure the roots stay moistwhile getting established (without beingwaterlogged). Bare rooted seedlings have a soilmark on the stem, showing how deep they weregrowing in the nursery. For seedlings grown intrays, make sure the entire root ball is buried.
Choose a depth of planting to suit the soilconditions. On dry sites (especially dry sandysites), plant the seedlings so the top of the rootball or soil mark is 5 to 7 cm below the soilsurface. For heavier soils with adequatemoisture, plant the seedlings 2 to 3 cm deep. Onvery wet sites, plant closer to the surface, orbetter still, delay planting until the end of winter.
Make sure the roots are planted into mineral soil,not mulch or loose organic matter, and that soilis firm around the roots, that is ‘heeling’ forhand planting or using press wheels for machineplanting.
Planting position for seedlings
Plant in the centre of the mound on moundedsites. If hand planting on sites that have beenripped only, place the seedling about 15 cmaway from the ripline on the uphill side. Forsites that have been furrowlined (usually onlythe deep non-wetting sands of the Swan CoastalPlain), plant in the centre of the furrow. Only useknockdown (non-residual) herbicides onfurrowlined sites.
Planting methods
Trees can be planted by hand, or by mechanicalplanters. To plant small numbers of trees, anarrow or cut down spade will do the trick. Forlarger hand planting projects, the easiest andquickest way is to use a planting tube such as the‘Pottiputki’. Using these devices, more than2000 seedlings can be planted per day.
To plant using a planting tube:
- Adjust the planting tube to give the desireddepth of planting.
- Push planting tube into the ground and press
on depth limiter until it reaches the correctdepth.
- Take the seedling out of its container, or fromthe planting tray and drop it into the tube(roots first!).
- Step on jaw-opening pedal.
- Lift planting tube out of the ground with atwisting motion to loosen any soil stuck to thejaws.
- Press the soil firmly around the seedling withboot pressure on either side, to close airpockets, making sure the seedling ends upvertical. Leave a small depression around theplant to collect water (except on wet sites).
- A simple check to see if the trees have beenfirmly planted is to lightly pull a seedling bythe stem. If it pulls out of the ground easily ithas not been firmed in well enough.
- Close the jaws of the planting tube using therelease lever, and move to the next plantingposition.
Suppliers of planting tubes
Pottiputki Planting Tube – Prospectors, Unit 4,195 Prospect Highway, Seven Hills, NSW 2147
Nufab Hand Planter – Lot 28, Moore Road,Dongara, WA (08) 9927 1297
Pottiputki hand planting tube – Namaco, Perth(08) 9354 9200 Fax (08) 9354 9300
Note: These are examples only; please enquireabout other suppliers in the area.
Using a spade (for small scale plantings)
Dig a small hole which should be just bigenough to hold the teased-out root system of theseedling.
Place the seedling in the hole at the desireddepth. Make sure the roots are arranged in anatural position and are not coiled or bendingupwards.
Fill the hole making sure the seedling tree isupright. Gently firm the soil around the tree stemwith your feet.
SEC
TIO
N 8

Fertilising
Adequate nutrition gives trees a good start, withrapid early root and shoot development. Test thesoil before planting to find out if fertiliser isneeded. If the site has a good fertiliser history itis usually unnecessary to fertilise in the firstyear. However, the trees may need a fertiliserapplication in later years. Tree nutrition will becovered in more detail in a separate TreeNote.
As a general rule of thumb, for sites which needfertiliser in the year of planting, give eachseedling about 50 g (equivalent to a smallhandful) of a general purpose fertilisercontaining phosphorous and nitrogen. Suitablefertilisers include DAP, Agras No1, or NPKBlue. Use a spade or planting tube, and bury thefertiliser in a lump, 15 to 20 cm away from thebase of the seedling, on the downhill side. Thisconcentrated lump of fertiliser has an extendedrelease period, similar to compressed tree tablets(which cost more, but are easy to use). Buryingthe fertiliser prevents nitrogen being lost to theatmosphere and reduces potential growth ofweeds near the seedling.
Apply fertiliser at the time of planting (tominimise labour costs), or some weeks laterwhen the seedlings have become established (tomaximise the effectiveness of the fertiliser).Later fertilising is recommended for wet sites, tominimise the loss of fertiliser by leaching, beforethe tree roots have grown enough to use it.Fertilising should be completed by the end ofSeptember.
Note: Fertilise only if weed control has beensuccessful, otherwise it will accelerate weedgrowth at the expense of the seedlings.
Direct seeding (Holt, 1998)
Revegetation with woody perennials will play amajor role in reversing land degradation trendsin Western Australian agriculture. Direct seedingis seen as a technology with potential forlowering establishment costs. It has distinctadvantages in building revegetation areas withbiodiversity and nature conservation objectives.
‘Direct seeding’ means applying seed directly tothe site where plants are wanted, rather thangrowing seedlings in a nursery, then plantingthem on a site.
Direct seeding has several advantages:
- Areas can be revegetated quickly and cheaply.A mixture of trees, shrubs and groundcoverscan be sown at the same time. The differentrates of germination mimics naturalregeneration. This creates better habitats andprovides more of the needs of native animals.Direct seeded windbreaks can be moreeffective because of the mixture of tall, middleand understorey plant species.
- Seeds cost less than seedlings. For example: tosow a 5 km windbreak that is 15 metres wide,seed is sown at a rate of 400 grams perhectare. The 7.5 hectares will require 3 kg ofseed. This will cost around $900 in seed(depending on species and availability, butassuming the average seed price is 30c pergram). Purchasing 4000 seedlings for the sameproject (five km long, four rows of seedlingsand five metres between seedlings) will costbetween $1200 and $1600, depending onseedlings costs (30c to 40c each).
Direct seeding requires less time and labour thanseedlings.
Seed is much easier and cheaper to transport andstore than the seedlings.
Direct seeding contractors and advisors
Consultants and contractors who conduct directseeding can be found in the ‘Yellow Pages’telephone directory.
A network of Bushcare support workers in theagriculture areas provide advice on remnant bushmanagement and revegetation for natureconservation.
Contact your local landcare group or:
Greening WA 10 The Terrace, Fremantle.Tel: (08) 9355 8933, Fax: (08) 9355 9203.
211
SEC
TIO
N 8

Table 8.2. Local native species for planting around streams and dams in >800 mm rainfall south west(Rose et al, 2001)
Botanical Name Common name Habit Notes – propagation/uses/soil
Acacia saligna Golden –wreath Large shrub Grows on banks of creeks and rivers.wattle to small tree, Propagate by seed, brushing.
5 metres
Agonis flexuosa peppermint Med Sands and gravels with shallow freshspreading tree water table.to 10 m
Agonis junipera Warren River cedar Med tree to Fringing plant for creeks, lakes &15 m swamps. Propagate by seed, brushing,
cuttings.
Agonis linearifolia Swamp peppermint Shrub to Cut flower trade. Fringes swamps &Rosa/ coarse 5 metres watercourses – stream stabiliser. tea-tree. Seed, brushing, cuttings.
Agonis parviceps White/ fine tea tree Med shrub Cut flowers, commercial, stream stabiliser.
Allocasuarina Karri sheoak Med tree to Craft timber.decussata 15 m
Allocasuarina Med tree to Valuable furniture timber.fraseriana 15 m
Allocasuarina humilis Dwarf sheoak Small tree likes sandy soils
Astartea fascicularis Open weeping Grows along watercourses & dampshrub to 2-3 soils near winter-wet depressions andmetres swamps. Seed, brushing, cuttings.
Banksia attenuata
Banksia illicifolia Holley-leafed Med- large Dry to damp sandy soils.banksia tree
Banksia littoralis Swamp banksia Tree to Winter-wet depressions and the 12 metres edges of swampy areas.
Seed, collect autumn to late winter. Good craft timber.
Beaufortia sparsa Swamp bottlebrush Shrub to Winter-wet depressions and along 2 metres watercourses. Propagate by seed,
brushing, cuttings. Cut flowers, likes winter-wet peaty sands.
Boronia molloyae Tall boronia Tall shrub to Winter-wet depressions & the edges3 metres of swampy areas. Propagation
method unknown, try seed with smoke.
212
SEC
TIO
N 8

213
Botanical Name Common name Habit Notes – propagation/uses/soil
Bossieae aquifolia Water bush, netic Shrub, legume Understorey to karri-marri.
Brachysema sp. (?) Black pea Low spreading Stock like it. Could be goodshrub/ ground understorey for river foreshores. cover Grows along Perup River.
Callistemon glauca/ Albany bottlebrush Med shrub Cut flowers (red)speciosus
Callistemon phoeniceus Fiery bottlebrush shrub Cut flowers
E. decipiens Moit; marlock Med spreading Fresh damp areas often perchedtree often amid saline soils, 500-800 mmmallee form. rainfall. Red timber; poor form.
E. ficifolia Red flowering gum Med tree to Needs well drained soil.15 m
E. patens WA blackbutt Large tree to Lower slopes, deep well-drained50 m soils, good timber tree, needs dense
planting, heavy culling and form pruning to produce timber.
E. rudis Flooded gum Med-large Seasonally waterlogged clays onspreading tree. flood plains, salt tolerant up to EM38
of 90; leaf miners attack it; 600-800 mm rainfall; poor form and poor timber.
Eucalyptus megacarpa Bullich Med tree to Clay subsoils.15 m white trunk
Hakea oleifolia Olive-leafed hakea Small tree to Ornamental, windbreak, screen.5 m
Hakea varia Variable-leafed Medium shrub Grows in seasonally wet areas in hakea to small tree. winter wet depressions and in
watercourses. Propagate by seed.
Homolospermum Common tea tree Shrub to 4 m Forms thickets in permanently wet firmum areas along watercourses
Hovea elliptica Hovea Small shrub Purple pea flower.
Melaleuca alternifolia Oil ti-tree Shrub Commercial oil, not WA native.
Melaleuca diosmaefolia Bottlebrush Shrub
Melaleuca incana Grey honey -myrtle Shrub to Winter-wet depressions and along5 metres watercourses. Propagate by seed,
brushing, cuttings.
Melaleuca microphylla Small shrub to Fringing plant for creeks, lakes &medium tree swamps. Propagate by seed, brushing.
Melaleuca nesophila Honey myrtle Shrub Honey, cut flowers.
Melaleuca priessiana Paperbark Small-med spreading tree to 10 m
SEC
TIO
N 8
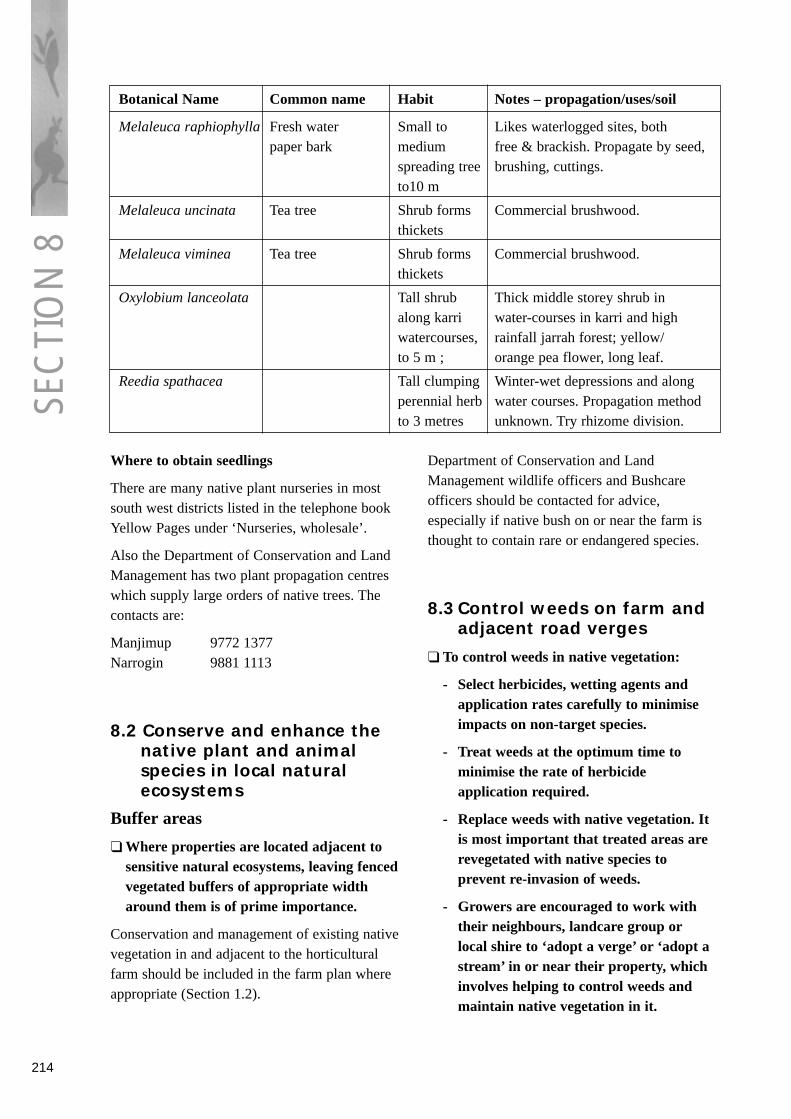
Where to obtain seedlings
There are many native plant nurseries in mostsouth west districts listed in the telephone bookYellow Pages under ‘Nurseries, wholesale’.
Also the Department of Conservation and LandManagement has two plant propagation centreswhich supply large orders of native trees. Thecontacts are:
Manjimup 9772 1377Narrogin 9881 1113
8.2 Conserve and enhance thenative plant and animalspecies in local naturalecosystems
Buffer areas
❑ Where properties are located adjacent tosensitive natural ecosystems, leaving fencedvegetated buffers of appropriate widtharound them is of prime importance.
Conservation and management of existing nativevegetation in and adjacent to the horticulturalfarm should be included in the farm plan whereappropriate (Section 1.2).
Department of Conservation and LandManagement wildlife officers and Bushcareofficers should be contacted for advice,especially if native bush on or near the farm isthought to contain rare or endangered species.
8.3 Control weeds on farm andadjacent road verges
❑ To control weeds in native vegetation:
- Select herbicides, wetting agents andapplication rates carefully to minimiseimpacts on non-target species.
- Treat weeds at the optimum time tominimise the rate of herbicideapplication required.
- Replace weeds with native vegetation. Itis most important that treated areas arerevegetated with native species toprevent re-invasion of weeds.
- Growers are encouraged to work withtheir neighbours, landcare group orlocal shire to ‘adopt a verge’ or ‘adopt astream’ in or near their property, whichinvolves helping to control weeds andmaintain native vegetation in it.
214
Botanical Name Common name Habit Notes – propagation/uses/soil
Melaleuca raphiophylla Fresh water Small to Likes waterlogged sites, bothpaper bark medium free & brackish. Propagate by seed,
spreading tree brushing, cuttings.to10 m
Melaleuca uncinata Tea tree Shrub forms Commercial brushwood.thickets
Melaleuca viminea Tea tree Shrub forms Commercial brushwood.thickets
Oxylobium lanceolata Tall shrub Thick middle storey shrub inalong karri water-courses in karri and highwatercourses, rainfall jarrah forest; yellow/ to 5 m ; orange pea flower, long leaf.
Reedia spathacea Tall clumping Winter-wet depressions and alongperennial herb water courses. Propagation methodto 3 metres unknown. Try rhizome division.
SEC
TIO
N 8

215
Table 8.3 Control of common environmental weeds (Manjimup LCDC and Agriculture Western Australia, 2000)
Common name Description/ toxicity Methods of control
Arum lily Large lily with wide, arrow shaped Remove all traces of root and burnshiny leaves with a big white funnel them.shaped flower with an orange rod Orinside. Toxic to cattle and humans. Spray green leaves with 1 g Brushoff
plus 25 mL wetting agent to 10 L of water before flowering.
Blackberry Thorny, fast spreading dense briar Spray at or before flowering in early bushes up to 4 m high; edible black late spring/ summer with 1g Brushoffor red berries and white flowers. plus 100 mL Roundup plus 25mL
wetting agent in 10 L of water.
Cape tulip Dark green strap like leaf, salmon Spray actively growing foliage withpink flowers in spring, poisonous 1 g Brushoff plus 25 g mL wettingto stock. agent in 10 L of water.
Double gee Broad leafed plant with seeds Spray with 0.2 g Brushoff or 100 mLbearing 3 sharp spines Roundup in 10 L water in early winter
and spring each year for at least four years. Manually remove and burn seeds.
Pampas grass Large, up to 2 m round clump of Cut off and burn flower plumes. Spraygrass with sharp edged leaves and with 100 mL Roundup plus 25 mLlong, 2-4 m stalks holding 1 m long wetting agent in 10 L water. Burnfeathery seed heads. when dead and re-spray regrowth.
Watsonia and Tall, flat leaved lilies with long, Spray with 100mL Roundup , 25 mLgladiolus species 1- 2 m stems carrying orange, wetting agent in 10 L water in August-
pale lilac, white, pink or red funnel October before seeds or cormlets shaped flowers and a large bulb form.underground. Reported to be Orpoisonous Use 100 g 2,2 DPA (Dalpon) plus 25
mL wetting agent in 10 l of water. (this is less harmful to native broad leaved vegetation).
SEC
TIO
N 8

Aquatic weeds(Agriculture Western Australia, 1999)
Some declared species of aquatic weeds arebanned throughout Western Australia. Theseinclude salvinia, water hyacinth, senegal tea,alligator weed and horsetails. There have beenseveral recent finds, mostly around Perth, butsome as far afield as Kununurra and Albany.
- Protecting agriculture and the environment iseveryone’s business. Report any suspectdeclared plants to the nearest Department ofAgriculture Western Australia office.
- Declared aquatic weeds must not be kept orsold, and must not be imported. If you haveany of these plants in a pond or aquarium, theymust be destroyed.
The aquatic weeds presented in this section arebanned throughout Western Australia. HoweverAgriculture Western Australia has recently foundseveral of them in cultivation. Most finds havebeen around Perth, but salvinia and waterhyacinth have been found as far afield asKununurra and Albany. These plants must not bekept or sold, and must not be imported. If youhave any of these plants in a pond or aquarium,they must be destroyed.
Senegal tea, alligator weed and horsetails havealso been found in cultivation in Perth. Alligatorweed has been mistakenly cultivated as a leafyvegetable or herb. It can grow in water, on thebanks, or in gardens – it has even been foundinfesting lawns in eastern Australia. These weedsall have the potential to block rivers and waterways and pose a serious threat to irrigationchannels. A common feature of all these weedsis their ability to spread rapidly and form a densemat above or below the water. This mat stopslight entering the water and depletes the waterbody of oxygen. Fish and other creatures will dieand all the native plants will be shaded out.
Horsetails or scouring rushes (Equisetum spp.)are primitive relatives of ferns. Horsetails havedeep, invasive rhizomes and have becomeserious weeds in other parts of the world. Theygrow in damp soil and are a threat to wetlands,watercourses, irrigated pastures and horticulture.
Horsetails are also toxic to livestock. AllEquisetum spp. must be destroyed.
- Do not dispose of any plant from an aquariumor pond in or near any waterway or drain.
Apart from horsetail, all of these plants can bekilled by being dried out on newspaper. Whenthe plants are dead, bury them or dispose ofthem with other green waste in accordance withCouncil by-laws. Salvinia and water hyacinthcan also be killed by composting. Horsetails areextremely difficult to kill; seek advice ondisposal from Agriculture Western Australia ifyou have any horsetail (Equisetum spp.) plants.
Aquatic weeds cost!
Apart from environmental damage they cause,aquatic weeds are extremely expensive toeradicate. It cost more than a quarter of a milliondollars to eliminate hydrocotyl from WesternAustralia’s Canning River. In Barren Box swampnear Griffith in NSW over $1 million has beenspent to eradicate a two year old infestation ofalligator weed.
Prevention is the cheaper option!Report suspect plants.
Report these plants to the local AgricultureProtection Officer:
Fanwort Lagarosiphon
Horsetail Alligator weed
Arrowhead Salvinia
Water hyacinth Leafy elodea or Dense waterweed
Sagittaria Parrot’s feather
Submit suspect plant samples to the WeedScience Group at:
Agriculture Western Australia, 3 Baron Hay Court, South Perth .or by post to:
Locked Bag 4,Bentley Delivery Centre, WA 6983.
For more information, see Agriculture WesternAustralia’s Weed Science Website.
216
SEC
TIO
N 8

8.4 Control feral animals
Humane ways of controlling feral animal pestsare outlined in this section. Further advice canbe obtained from the local Western Australian ofAgriculture District Protection Officer orDepartment of Conservation and LandManagement (CALM) Wildlife Officer.
❑ It is recommended that the followingmeasures be taken to control feral animals:
- Bait foxes in liaison with neighbours,Western Australian of Agriculture andDepartment of Conservation and LandManagement.
- Control rabbits by destroying burrowsand poisoning.
- Control feral dogs, cats and pigs bybaiting, trapping or shooting.
- Watch for new introduced pest speciessuch as sparrows and starlings andreport sightings to Agriculture Protectionofficers immediately.
❑ If control of native animals such as ring-neck parrots or kangaroos is necessary,use deterrents, netting or fences or cullas a last resort with permits fromDepartment of Conservation and LandManagement.
Poison baiting can be very effective in reducingfox numbers. Used with care, it can be safe forhumans, non-target animals and theenvironment.
1080 poison baits (Agriculture Western Australia, 2000)
1080 is a naturally occurring compound, whichis quickly broken down in the environment.Many native animals have developed a highdegree of tolerance to 1080 while foxes (anddomestic dogs and cats) are very susceptible tothe poison.
There is no antidote for 1080 poisoning.
A Farmnote, Guide to the Safe Use of 1080Poisoning (Agriculture Western Australia, 2000)details important precautions when using 1080,including:
- notification of neighbours
- erection of warning signs
- careful use of 1080 in high risk areas
- responsible security and disposal of baits
- effective personal safety.
To obtain dried meat baits and eggs containing1080 (sodium fluoroacetate), landholders mustfollow the following process (AgricultureWestern Australia, 2001d):
- Submit a 1080 Baiting Application Formtogether with a map of the proposed baitingarea to the local Department of AgricultureWA. An authorised officer will complete a1080 Baiting Risk Assessment and ApprovalForm based on the information submitted bythe landholder.
- When the authorised officer approves theapplication he will provide an ApplicationVoucher to the applicant, and an approvedsupplier, for example a Licensed Pest ControlOfficer or S7 poisons retailer may supply the1080 product on presentation of this voucher.
- The Western Australian Department of Agriculture authorised officer should ensurethat the landholder has received appropriate1080 training.
Fox baiting with 1080 poison(Agriculture Western Australia, 2001e)
Effective poisoning periods
The most effective fox control is achievedduring late winter and spring. At this time fooddemands are high as foxes are rearing young.Foxes are also less mobile and so reinfestation isdelayed.
At other times (especially autumn) foxes aremore mobile. Numbers will only be temporarilyreduced by baiting as new animals will move into replace resident animals which have beenkilled. Consequently repeat baiting may berequired.
Community baiting drives
A district-wide campaign involving communitygroups can reduce the extent and speed of
217
SEC
TIO
N 8
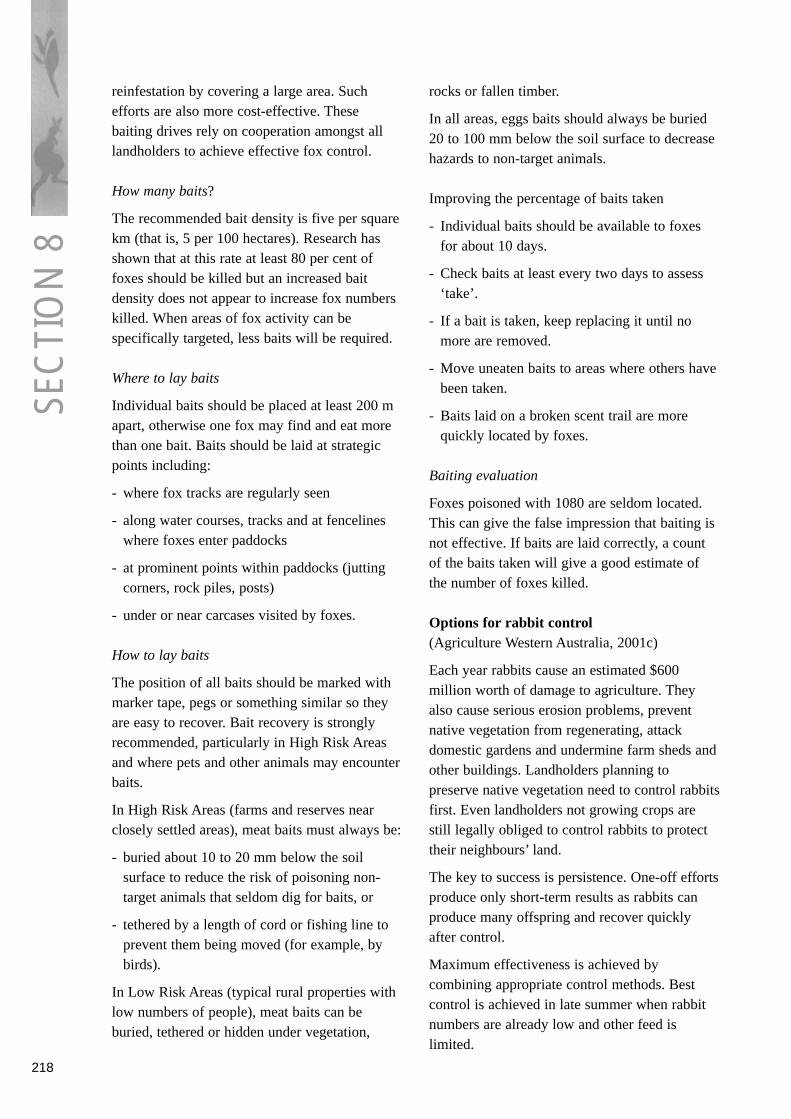
reinfestation by covering a large area. Suchefforts are also more cost-effective. Thesebaiting drives rely on cooperation amongst alllandholders to achieve effective fox control.
How many baits?
The recommended bait density is five per squarekm (that is, 5 per 100 hectares). Research hasshown that at this rate at least 80 per cent offoxes should be killed but an increased baitdensity does not appear to increase fox numberskilled. When areas of fox activity can bespecifically targeted, less baits will be required.
Where to lay baits
Individual baits should be placed at least 200 mapart, otherwise one fox may find and eat morethan one bait. Baits should be laid at strategicpoints including:
- where fox tracks are regularly seen
- along water courses, tracks and at fencelineswhere foxes enter paddocks
- at prominent points within paddocks (juttingcorners, rock piles, posts)
- under or near carcases visited by foxes.
How to lay baits
The position of all baits should be marked withmarker tape, pegs or something similar so theyare easy to recover. Bait recovery is stronglyrecommended, particularly in High Risk Areasand where pets and other animals may encounterbaits.
In High Risk Areas (farms and reserves nearclosely settled areas), meat baits must always be:
- buried about 10 to 20 mm below the soilsurface to reduce the risk of poisoning non-target animals that seldom dig for baits, or
- tethered by a length of cord or fishing line toprevent them being moved (for example, bybirds).
In Low Risk Areas (typical rural properties withlow numbers of people), meat baits can beburied, tethered or hidden under vegetation,
rocks or fallen timber.
In all areas, eggs baits should always be buried20 to 100 mm below the soil surface to decreasehazards to non-target animals.
Improving the percentage of baits taken
- Individual baits should be available to foxesfor about 10 days.
- Check baits at least every two days to assess‘take’.
- If a bait is taken, keep replacing it until nomore are removed.
- Move uneaten baits to areas where others havebeen taken.
- Baits laid on a broken scent trail are morequickly located by foxes.
Baiting evaluation
Foxes poisoned with 1080 are seldom located.This can give the false impression that baiting isnot effective. If baits are laid correctly, a countof the baits taken will give a good estimate ofthe number of foxes killed.
Options for rabbit control(Agriculture Western Australia, 2001c)
Each year rabbits cause an estimated $600million worth of damage to agriculture. Theyalso cause serious erosion problems, preventnative vegetation from regenerating, attackdomestic gardens and undermine farm sheds andother buildings. Landholders planning topreserve native vegetation need to control rabbitsfirst. Even landholders not growing crops arestill legally obliged to control rabbits to protecttheir neighbours’ land.
The key to success is persistence. One-off effortsproduce only short-term results as rabbits canproduce many offspring and recover quicklyafter control.
Maximum effectiveness is achieved bycombining appropriate control methods. Bestcontrol is achieved in late summer when rabbitnumbers are already low and other feed islimited.
218
SEC
TIO
N 8

A district-wide campaign can reduce the problemof re-infestation by covering a large area.Sometimes it will not be possible to use poisonbut other methods are available.
Areas intended for planting or conservationefforts, especially near rabbit harbourage, shouldbe thoroughly checked for rabbit populations.This is particularly important in areas whererabbits have previously been a problem.
Rabbit activity is usually indicated byscratchings, dung heaps and active burrows orwarrens. More revealing checks can be madelate in the day or at night by spotlighting whenrabbits are active and more observable.
1080 baits
Baiting is the most cost-effective way to reducerabbit populations, particularly over large areas.Several types of 1080 rabbit bait are available.When approved, landholders may lay 1080 baitsthemselves.
1080 is quickly broken down in theenvironment. Many native animals havedeveloped a high degree of tolerance to 1080 butdomestic stock and pets are very susceptible tothe poison in both the baits and poisoned rabbits.
Pindone baits
Pindone is an anticoagulant with an effectsimilar to products used in some rat poisons. Itcan sometimes be used near settlements wherepets might be at risk from 1080, because anantidote is available for pindone.
Pindone poses a risk to native animals includingkangaroos, birds of prey and perhaps bandicoots.The poison must not be used in the presence ofthese animals.
Warren fumigation
Rabbits use warrens as refuges and for breeding.Fumigation is the best method to use when a fewrabbits live in widely scattered warrens orinaccessible areas. Fumigant tablets are placed inburrows to release poisonous phosphine gas.
Warren ripping
Areas where warrens have been destroyed bycross-ripping the soil are much less likely to bere-colonised. A tractor-mounted ripper is used topenetrate the soil to a depth of at least 60centimetres.
Harbourage destruction
Areas that rabbits use for harbourage/refugeinclude rock piles, deadfall timber and stumps,old buildings and abandoned farm machinery.Such material should be removed, buried orsurrounded with rabbit-proof fences.
Rabbit-proof fencing
Rabbit-proof fences can be effective inpreventing animals moving into or re-infestingan area. Well-maintained fences can provide apermanent solution to rabbit problems. Fencingcan also be used to contain rabbits in an areawhere they can be more efficiently poisoned.
Myxomatosis and rabbit calicivirus disease(RCD)
These viruses have been introduced to reducerabbit numbers, and can be difficult tomanipulate. Their benefits can be enhanced byfollowing up immediately with other controlmethods.
Shooting, trapping and the use of ferrets can beuseful additional tools when very few rabbits arepresent.
Further information
Contact any Department of Agriculture WesternAustralia office.
Control of pest native animals
It is illegal to kill most native animals. Goodfencing and netting to protect crops is the mostsatisfactory option from an environmentalperspective. However, it is occasionallynecessary to control excessive numbers of somenative animals if they are damaging cropssignificantly. Permits must be obtained from theDepartment of Conservation and LandManagement for culling to be conducted. 219
SEC
TIO
N 8
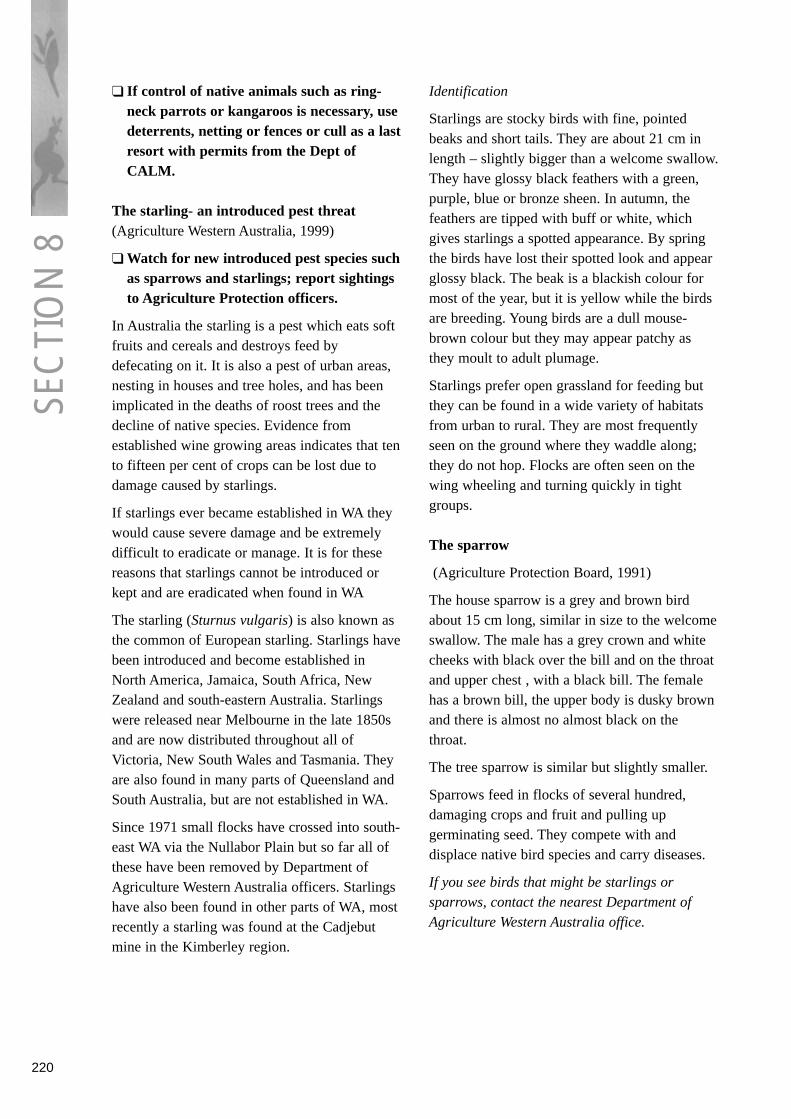
❑ If control of native animals such as ring-neck parrots or kangaroos is necessary, usedeterrents, netting or fences or cull as a lastresort with permits from the Dept ofCALM.
The starling- an introduced pest threat(Agriculture Western Australia, 1999)
❑ Watch for new introduced pest species suchas sparrows and starlings; report sightingsto Agriculture Protection officers.
In Australia the starling is a pest which eats softfruits and cereals and destroys feed bydefecating on it. It is also a pest of urban areas,nesting in houses and tree holes, and has beenimplicated in the deaths of roost trees and thedecline of native species. Evidence fromestablished wine growing areas indicates that tento fifteen per cent of crops can be lost due todamage caused by starlings.
If starlings ever became established in WA theywould cause severe damage and be extremelydifficult to eradicate or manage. It is for thesereasons that starlings cannot be introduced orkept and are eradicated when found in WA
The starling (Sturnus vulgaris) is also known asthe common of European starling. Starlings havebeen introduced and become established inNorth America, Jamaica, South Africa, NewZealand and south-eastern Australia. Starlingswere released near Melbourne in the late 1850sand are now distributed throughout all ofVictoria, New South Wales and Tasmania. Theyare also found in many parts of Queensland andSouth Australia, but are not established in WA.
Since 1971 small flocks have crossed into south-east WA via the Nullabor Plain but so far all ofthese have been removed by Department ofAgriculture Western Australia officers. Starlingshave also been found in other parts of WA, mostrecently a starling was found at the Cadjebutmine in the Kimberley region.
Identification
Starlings are stocky birds with fine, pointedbeaks and short tails. They are about 21 cm inlength – slightly bigger than a welcome swallow.They have glossy black feathers with a green,purple, blue or bronze sheen. In autumn, thefeathers are tipped with buff or white, whichgives starlings a spotted appearance. By springthe birds have lost their spotted look and appearglossy black. The beak is a blackish colour formost of the year, but it is yellow while the birdsare breeding. Young birds are a dull mouse-brown colour but they may appear patchy asthey moult to adult plumage.
Starlings prefer open grassland for feeding butthey can be found in a wide variety of habitatsfrom urban to rural. They are most frequentlyseen on the ground where they waddle along;they do not hop. Flocks are often seen on thewing wheeling and turning quickly in tightgroups.
The sparrow
(Agriculture Protection Board, 1991)
The house sparrow is a grey and brown birdabout 15 cm long, similar in size to the welcomeswallow. The male has a grey crown and whitecheeks with black over the bill and on the throatand upper chest , with a black bill. The femalehas a brown bill, the upper body is dusky brownand there is almost no almost black on thethroat.
The tree sparrow is similar but slightly smaller.
Sparrows feed in flocks of several hundred,damaging crops and fruit and pulling upgerminating seed. They compete with anddisplace native bird species and carry diseases.
If you see birds that might be starlings orsparrows, contact the nearest Department ofAgriculture Western Australia office.
220
SEC
TIO
N 8

References
Agriculture Protection Board, 1991. TheSparrow. Infonote 13/91.
Agriculture Western Australia, 1997. Preparingsites for tree planting in the greater than 600mm rainfall zone of Western Australia. TreeNote No. 2
Agriculture Western Australia, 1999. TheStarling. Farmnote 69/99.
Agriculture Western Australia, 2000, Guide tothe Safe Use of 1080 Poisoning. Farmnote
Agriculture Western Australia, 2001a.Landholder Use of 1080 One Shot Oat RabbitBait. Farmnote 58/2001.
Agriculture Western Australia, 2001b. Optionsfor Fox Control. Farmnote 57/2001.
Agriculture Western Australia, 2001c. Optionsfor Rabbit Control. Farmnote 56/2001.
Agriculture Western Australia, 2001d. Supply,Use and Possession of 1080 Products.Agriculture Protection Circular 4/01.
Agriculture Western Australia, 2001e. FoxBaiting. Farmnote 59/2001
Agriculture Western Australia, 1990. TreePlanting on Farms in High Rainfall Areas.Bulletin No. 4174.
Agriculture Western Australia, 1999. Wetlandsnot Weedlands. Weednote 1/99
Agriculture Western Australia. Trees for Farms.Bulletin No. 4206.
Farm Forestry Advisory Service, 1999. Insectpests of Eucalypts and pines. Treenote no. 21.
Farm Forestry Advisory Service, 1999. WeedControl in Eucalypts and Pines. Treenote No.20.
Holt, C., 1998. Direct Seeding of Native Plantsfor Revegetation. Agriculture Western AustraliaFarmnote 40/98.
Manjimup Landcare District Committee andAgriculture Western Australia, 2000. Stop theSpread, a Weed Guide for Landholders in theShire of Manjimup. Information Brochure.
Rose, B., Dewing, J and Cranfield, R., 2001.Table of Local Native Species for PlantingAround Streams and Dams in >800 mm RainfallSouthwest. (Unpublished).
221
SEC
TIO
N 8

222
SEC
TIO
N 8
Riparian and remnant native vegetation provides a refuge for native faunaspecies.
Wetland surrounded by a vegetated buffer – a valuable flora andfauna area.


Waste ManagementSE
CTI
ON
9
This section outlines practices for wasteminimisation by recycling and re-use.
Waste materials generated during modernhorticultural operations fall into three categories:
1. Residual farm chemicals, for example residuesleft in empty containers and on sprayingequipment.
2. Solid non-biodegradable wastes, for exampleempty chemical containers, plastic wrapping,plastic mulch and plastic irrigation pipe, scrapmetal.
3. Biodegradable wastes, for example cropresidues, manures, and domestic putresciblewastes.
All of these wastes can be managed so that theywill not pollute the environment, by using therecommended practices described below.
9.1 Reduce, re-use and recyclewastes where possible
Used chemical containers
All farm chemicals are now packaged incontainers that are either:
- Re-useable
- Recyclable, or
- Water-soluble packs that dissolve in the spraytank.
All of these containers can be disposed ofwithout harm to the environment for re-use orrecycling.
- Never leave used, unwashed chemicalcontainers lying around, where they maypoison people or stock, contaminate of foodproducts or pollute water bodies.
- Do not burn any chemical containers. Thispractice produces toxic emissions and isillegal.
- Do not bury empty chemical containers on thefarm. Plastic materials will not break down inthe soil and chemical residues maycontaminate groundwater.
Some suppliers of large containers of farmchemicals now offer a return packaging policyfor their re-useable containers. Using andreturning re-useable containers is the bestpractice and should be adopted where possible.
All chemical containers that are not returnableare recyclable. If rinsed and recycled, chemicalcontainers do not pose a threat to theenvironment.
How to properly rinse(Avcare, 1999)
There are three acceptable methods of rinsingchemical containers.
Manually rinsing by triple rinsing
❑ Triple rinse all used chemical containers.Return the rinse water to the mixing tank.
- When preparing sprays, empty the containerinto the sprayer mixing tank and drain for atleast 30 seconds until empty.
- Recommended practice is to fill emptiedcontainers about 1/5th full with water andshake or roll the container for at least 30seconds, with cap on. Add the rinse water tothe chemical tank in the place of an equivalentquantity of make-up water.
- Repeat at least three times.
- Check the container thread, cap and outside ofcontainer and rinse with a hose into the spraytank.
- Let the container dry completely and replacethe cap.
Pressure rinsing
Pressure rinsing is generally faster and easierthan manual triple rinsing and can be used withplastic (non-refillable) and non- pressurisedmetal containers.
A special nozzle designed to pierce the containeris attached to the end of a hose.
224

SEC
TIO
N 9
- Remove the cap from the container and emptycontents into the spray tank, allowing to drainfor at least 30 seconds after the flow reduces todrops.
- Insert the pressure nozzle by puncturingthrough the lower side of the container. Turnthe water on and rinse until the rinsate comingfrom the container is clear (at least 30seconds). Gyrate the nozzle to rinse all insidesurfaces.
- Rinse the outside of the container, thread andcap and allow to dry as for triple rinsing(above).
Probes and ‘sucker-flusher’ transfer systems
Some farmers use chemical concentrate transfersystems that incorporate a flushing operation.These systems typically involve connection of aprobe to the container opening to extract thechemical concentrate.
These types of systems have the addedadvantage of reducing significantly the potentialfor exposure of the operator to the concentratewhile transferring it to the spray tank.
When the contents are removed, a rinse cycle isactivated. In all cases the manufacturer’srecommendations should be followed. Generallyspeaking the rinse cycle should last at least 30seconds. Check and rinse the outside of thecontainer, thread and cap as for triple rinsingabove.
DrumMusterTM scheme for recycling of usedchemical containers(Avcare, 1999)
There are adequate facilities available forgrowers to recycle their used chemicalcontainers. The DrumMuster program hascollection points in most south west areas andthe shires provide details of the local collectionvenues.
❑ Recycle all rinsed chemical containers byeither returning them to the manufactureror depositing them at a DrumMustercollection point.
Enquire at the local shire council for details ofthe local DrumMuster program.
For some shires, such as Manjimup, theDrumMuster collection is at the local refuse andrecycling centre. Farmers can ring the sitemanager to arrange a time to deposit drums.
DrumMuster is the national program for thecollection and recycling of empty, cleaned, non-returnable crop protection and animal healthchemical containers over one litre or kilogram incontent.
It has been set up to provide finance andplanning to councils across Australia forchemical drum recycling. DrumMuster is asolution to the disposal problem of containers forfarmers and a cleaner environment for thecommunity. It is cost-neutral and provides aservice to ratepayers in that less containers endup as landfill in municipal tips,
DrumMuster involves farmers, councils,chemical manufacturers and resellers.
Manufacturer
- Identifies non-returnable containers byapplying DrumMuster sticker
- Pays 4 cent/ L or kg levy to DrumMuster andinvoices distributor/ reseller
Containers that are designed for multiple use orto minimise waste (such as water solublepackaging that dissolves in the spray tank) arenot subject to the DrumMuster levy.
Reseller
- Explains DrumMuster levy to farmer.
- Invoices 4 cent/ L levy to farmers/farmchemical users.
Farmer
- Flushes, pressure rinses or triple rinses usedcontainers.
- Brings containers with DrumMuster stickerinto DrumMuster collection centre ondesignated days.
225
Augusta-Margaret River Shire Council
Beverley Shire Council
Boyup Brook Shire Council
Bridgetown-Greenbushes Shire Council
Bunbury City Council
Busselton Shire Council
Capel Shire Council
Chittering Shire Council
Collie Shire Council
Coorow Shire Council
Cuballing Shire Council
Cunderdin Shire Council
Dalwallinu Shire Council
Dardanup Shire Council
Donnybrook-Balingup Shire Council
Dumbleyung Shire Council
Esperance Shire Council
Gnowangerup Shire Council
Harvey Shire Council
Jerramungup Shire Council
Katanning Shire Council
Kent Shire Council
Kondinin Shire Council
Manjimup Shire Council
Merredin Shire Council
Mingenew Shire Council
Nannup Shire Council
Narembeen Shire Council
Nungarin Shire Council
Pingelly Shire Council
Quairading Shire Council
Wagin Shire Council
West Arthur Shire Council
Wickepin Shire Council
Williams Shire Council
SEC
TIO
N 9
Council
- Establishes collection centre and informsfarmers of dates it will be open.
- Inspects containers and accepts cleanedcontainers.
- Employs materials recovery contractor toprocess empty containers.
- Costs eligible to be reimbursed byDrumMuster.
Processor
- Processes empty containers, sending materialback into recycling stream
- Costs eligible to be reimbursed byDrumMuster.
DrumMuster is a joint initiative developed underthe Industry Waste Reduction Scheme, by theNational Farmers Federation (NFF), Avcare, theVeterinary Manufacturers and DistributorsAssociation (VMDA) and the Australian LocalGovernment Association (ALGA).
226
Table 9.1 WA shires participating in the DrumMuster scheme

SEC
TIO
N 9
227
Disposing of residual chemicals, oilsand dip solutions
Many growers have containers of residualchemicals that can no longer be used becausethey are out of date, no longer registered for useor unidentified. These pose a threat to humanhealth and the environment, particularly if theyare in unlabelled or corroding containers.
❑ To avoid having left-over chemicals:
- Only purchase enough of the chemicalfor the job on hand.
- Avoid mixing more spray than isrequired. Systems that automaticallyinject the pesticide into the spray line arerecommended.
Residual pesticides and other farm chemicalsthat can no longer be used should not be kept onthe farm and particular care needs to be taken intheir disposal. The only safe way to dispose ofthem is through the ChemCollectTM scheme.
❑ Place containers of residual chemicals inlarger leak proof containers for safe storageand transport. Keep them in a lockedchemical shed until they can be taken to thenearest ChemCollectTM venue for disposal.
ChemCollectTM is a scheme for the safecollection of residual chemicals. Enquires maybe directed to local government authorities or theDepartment of Environmental Protection (DEP)for details of collection points and times.
The Code of Practice ‘Disposal of PesticideResidues from Pesticide Spray Applications’ bythe Health Department of Western Australiaoffers practical advice to pesticide users.
Burning of oils is not acceptable as toxic airpollutants are produced. Neither should used oilsbe emptied onto the ground as they pollute soiland water for long periods of time. Used engineoils may also contain contaminants such as metalparticles, heavy metals, fuel, rust and carbon.
❑ Store used engine oils in leak proofcontainers and deposit these at places withapproved receptacles for recycling used oilssuch as service stations or refuse andrecycling centres.
These facilities arrange transport of used engineoils to recovery plants to be recycled and re-used.
Used engine oils should be stored in leak proofcontainers in a bunded area to contain anyaccidental spillage. Never mix engine oils withother chemicals.
Dipping solutions
Dipping solutions are sometimes used to treatvegetables, for example where quarantineconditions for export require this to be done.Dipping solutions are much lower inconcentration than dip concentrates but can stillpose hazards to the environment and operators.They should not be emptied directly onto theground. Various pre-treatments can be used todeactivate the chemicals. Commonest of these ishydrated lime but this is not suitable for all dipchemicals.
❑ Approved practices for disposal of dipsolutions are:
- Pre-treating the solution and spreading itonto pasture or cereal crop, where it willbe biodegraded naturally. Avoid grazingthe pasture for 28 days.
Or
- Store in a safe chemical storage tank forcollection and off-site disposal by anapproved hazardous waste contractor.
Disposal of plastic and other solidwastes (Smart, 1997)
Most plastics, such as the polyethylene used foragricultural plastic sheeting and irrigation tube,do not degrade. They take up large volumes inlandfill sites, and are classified as hazardouswastes in some States.
Burying of polyethylene plastic waste on-farm isnot a good option, as it will remain undegradedindefinitely and may be unearthed, creatingproblems in the future.
Low temperature (open air) burning of plasticsis illegal because toxic gases and particulates areproduced.
228
Currently the best option for disposal of plasticwaste is recycling. In the United Kingdom theplastics industry has started a plastics recyclingscheme, funded by a levy on agricultural plasticsbut such a scheme is not yet operating in WA.
However, plastic sheeting can be recycled,although plastic film is bulky and difficult tohandle. To make handling easier it can be baledusing standard hay balers, or purpose-built wastebalers.
Biodegradable plastic mulches, which can beploughed in and break down in the soil, arebeing developed. They should be used inpreference to polyethylene mulches wherepossible and when commercially available.
❑ Separate plastic wastes into their plasticgroups. Press and bale the waste using acommercial baling unit. In some cases, haybalers can be used. Deposit the bales at oneof the many recycling depots provided bylocal government.
❑ Use biodegradable plastic mulch productswhen they become commercially available.
Scrap metal waste has a lasting negativeaesthetic impact when dumped in theenvironment. This is unnecessary as many scrapmetals have an economic value.
❑ Separate scrap metals into metal groupsand re-use on farm, deposit at recyclingdepots or have them collected by scrapmetal companies.
The lead contained in batteries is a toxic heavymetal that can contaminate land and waterresources, resulting in poisoning of stock andnative fauna. Lead can be absorbed through thehuman skin. Batteries should not be buried ormixed with other wastes. Lead can easily berecycled.
❑ Use the facilities provided by localgovernment or scrap metal companies todeposit batteries for recycling.
Disposal of plant, putrescible anddomestic wastes
Do not dump putrescible wastes in heaps to rot.Discarded vegetables or other putrescible wastesare a potential source for fly breeding andvermin.
Do not dump garden or any other solid waste inbushland. Some domestic plant species canshoot and have the potential to becomeenvironmental weeds within areas of nativevegetation.
Do not bury green wastes in landfill. Thispractice causes the waste to break downanaerobically, producing methane, which is apowerful greenhouse gas (Section 10.3).
Green wastes
The best practice options for disposal of greenwastes on farm are:
❑ Vegetable wastes and crop residues can bechopped up, spread in the paddock andincorporated into the soil. Used in this waythey increase soil organic matter andimprove soil health (Section 2.2 ‘Increasingsoil organic matter’).
❑ Green wastes are readily composted undercontrolled conditions and the compost mayultimately be returned to the soil.
Composting can be conducted on-farm. Ifconducted correctly, with acceptable mixes offeed-stocks and regular aeration, the hightemperatures generated prevent the breeding offlies and vermin (Section 2.2 ‘Compost forsustainable horticulture production systems’).Compost heaps can be aerated by turning with afront-end loader or custom-built machine.Composting should be conducted away fromresidential areas and water resources.
Domestic wastes
Domestic wastes are often a mixture of paper,plastic, metal and putrescible waste that isdifficult to sort but requires regular disposal.
SEC
TIO
N 9
❑ Where possible, use local governmentrefuse and recycling facilities to dispose ofdomestic waste.
❑ In situations where this is impracticable,the alternative is to bury it on the farm at asuitable site. The water table should bemore than 3 metres from the surface, thesite should be well away from waterwaysand wetlands and preferably within claysubsoils.
This alternative should only be used wherehousehold wastes are not contaminated by farmchemicals and in circumstances where it isimpractical to use shire refuse and recyclingfacilities.
Compact the landfill and cover it with at least300 mm of soil, to prevent breeding of flies andvermin.
Disposal of wastewater
Wastewater includes contaminated water anddrainage from processing or storage sites. It maycontain contaminants such as pathogens,pesticides and high levels of nutrients andchemicals.
❑ Drain wastewater into impermeablestorage/ treatment ponds and dispose bycontrolled on-site irrigation.
Irrigating vegetated land with nutrient-richwastewater(Water and Rivers Commission, 2002)
Scope
These notes apply to the irrigation of treatedeffluent from intensive animal industries,recycled run-off from agricultural land, andtreated municipal wastewater, which is appliedto land to promote the growth of healthyvegetation.
These notes do not apply in sensitive areaswhere detailed risk assessment is necessary, i.e.in Public Drinking Water Source Areas(PDWSAs), within 200 metres of conservationvalue wetlands, managed estuaries, or where thedepth to groundwater is less than 2 metres.PDWSAs include Underground Water PollutionControl Areas, Water Reserves and Public WaterSupply Catchment Areas declared in accordancewith the Metropolitan Water Supply, Sewerageand Drainage Act 1909, or the Country AreasWater Supply Act 1947.
Preamble
The following requirements reflect the Water andRivers Commission’s current position. They arerecommendations only and may be varied at thediscretion of the Commission.
Irrigation of wastewater with inadequateplanning has the potential to cause the followingimpacts:
- Soil erosion and turbidity in water resources
- Leaching of nutrients into water resourceswhich can produce eutrophication and toxiceffects
- Salinisation and waterlogging to land
229
Table 9.2: Vulnerability categories for soils and environments receiving wastewater
Vulnerability Characteristics
Category A Coarse sandy soil/gravel draining to surface water with moderate/high eutrophication risk.
Category B Coarse sandy soil/gravel draining to water with a low risk of eutrophication.
Category C Loam/clay soil (PRI >10) draining to water with moderate/high eutrophication risk.
Category D Loam/clay soil (PRI > 10) draining to water with a low risk of eutrophication.
Note: PRI means Phosphorus Retention Index, a scientifically determined measure of the phosphorusretention capacity of surface and near surface soils.
SEC
TIO
N 9

Site selection
Proponents intending to irrigate wastewater toland should design systems suited to theinfiltration capacity and the nutrient retentionability of the soil.
Soil characteristics will influence the rate andfrequency of irrigation, and should be taken intoaccount to minimise waterlogging and theleaching of excess nutrients into waterways andsub-surface aquifers.
Irrigation rates
Irrigation schemes should be managed to avoidbuild-up of salts in the soil. Ideally, wet seasonrainfall should flush accumulated salt away fromthe site prior to the commencement of theseasonal irrigation scheme.
Irrigation rates should take into considerationseasonal evapo-transpiration (ET) rates and thewater requirements of the selected vegetation.Watering requirements can be calculated at 60-80% of pan evaporation depending onapplication method. Rates will also varyaccording to the intended cropping and speciesuptake rates. Factors including soil type, soilmoisture content, irrigation method, land slopesand depth to water table will also influenceapplication rates.
For clay soils, irrigation rates up to 5 mm/hourare reasonable, while sandy sites may accept 15mm/hour without run-off. Irrigated areas should
ideally have a slope of 0.5 – 10% to avoidponding or erosion. Irrigated water shouldalways be applied evenly and the irrigated areaallowed to dry out for 24 hours betweenapplications during hot, dry weather, and 3 to 7days during cool, wet weather.
Soil nutrient status
Wastewater should not be applied to sites wherethere has been extended application of nutrientssuch as annual applications of superphosphate orurea or long term grazing of animals, unless thesoil nutrient status has been determined andconsidered in the site irrigation managementplan.
Application criteria
Wastewater containing volatile (degradable)organic matter should not be applied at ratesexceeding 30 kilograms/hectare/day expressed asBiochemical Oxygen Demand (BOD), to avoidoffensive odours. For wastewater with BODconcentrations exceeding 150 mg/L, furtherbiological stabilisation methods should be usedprior to irrigation. Heavy metals in wastewatershould not exceed the irrigation water qualitycriteria in ANZECC’s Australian Water QualityGuidelines for Fresh and Marine Waters (1992).
Irrigated areas should normally be at least twometres above the highest seasonal groundwatertable and have no ponded irrigation waterpresent on the site.
230
Vulnerability Nitrogen (N) Phosphorus (P) Category
Application rate concentration Application rate concentrationkg/hectare/year (mg/L) kg/hectare/year (mg/L)
A 140 9 10 0.6
B 180 11 20 1.2
C 300 19 50 3.1
D 480 30 120 7.5
Table 9.3 Recommended maximum nutrient (nitrogen as N and phosphorus as P) application criteriafor irrigation water
SEC
TIO
N 9

Nutrient concentrations in Table 9.3 are based onan average of 50 mm (500 kL/ha) of waterapplied/week over 32 weeks /annum and noother nutrient sources. Facilities for the storageof wastewater should be available over the wetseason, or when precipitation meets the waterneeds of the vegetation.
The application criteria are based on thesequantities of nitrogen and phosphorus beingavailable to promote viable vegetation growthand needed by the selected plant species.
Nutrients should be applied to coincide with theseasonal needs of the selected vegetationspecies. If nutrients are applied at times whenplants cannot uptake them, leaching of nutrientsto water resources is likely to result.
Biological contaminants
Advice should be sought from the HealthDepartment concerning irrigation constraints tominimise the incidence of disease-causingorganisms, i.e. bacteria, intestinal worms,protozoa and viruses.
Salts, metals, foaming substances, petroleumderivatives, pesticides and radioactivesubstances
All these materials at various concentrations maybe harmful to vegetation or other aspects of thereceiving environment. Irrigation schemeplanners and operators should determineconcentrations of contaminants which may bepresent in waters to be irrigated.
The Commission uses the Australian WaterQuality Guidelines for Fresh and Marine Waterspublished by ANZECC (1992) as a guide to thequality requirements in water resources, whichmay receive run-off or leachates from irrigatedland. This document contains tables which statecriteria for various uses of water resources.Assistance should be sought from qualified andexperienced people who are able to assess thelikely fate of these contaminants when theymove in the environment after application toland.
The Commission employs environmentalmodelling techniques and risk assessmentprocedures to judge whether such contaminantsare in sufficient concentrations to cause harm.
Monitoring and reporting
The Health Department and Water and RiversCommission normally require chemical andmicrobiological monitoring of reclaimed waterquality depending upon the extent of applicationand access afforded to the public.
Monitoring must be able to assess water qualityat three stages: the point of supply, that is thepoint of entry to the reclaimed water system; thequality recorded in water resource monitoringfacilities; and through periodical soil sampling.
The proponent should monitor the followingparameters:
- The quantity of wastewater irrigated(minimum of weekly intervals), and recordareas irrigated
- The pH, salinity of wastewater at monthlyintervals
- Total nitrogen and phosphorus in thewastewater at the commencement of irrigationseason and at 3 monthly intervals untilirrigation ceases
- Other contaminants in wastewater should bedetermined annually. Records of data shouldbe retained on site for scrutiny by regulatorybodies.
For small, rural or remote communities where itis not feasible to apply normal microbiologicalmonitoring, frequencies may be reduced. Thesewould be negotiated on an individual basis onapplication for approval of a scheme.
231
SEC
TIO
N 9
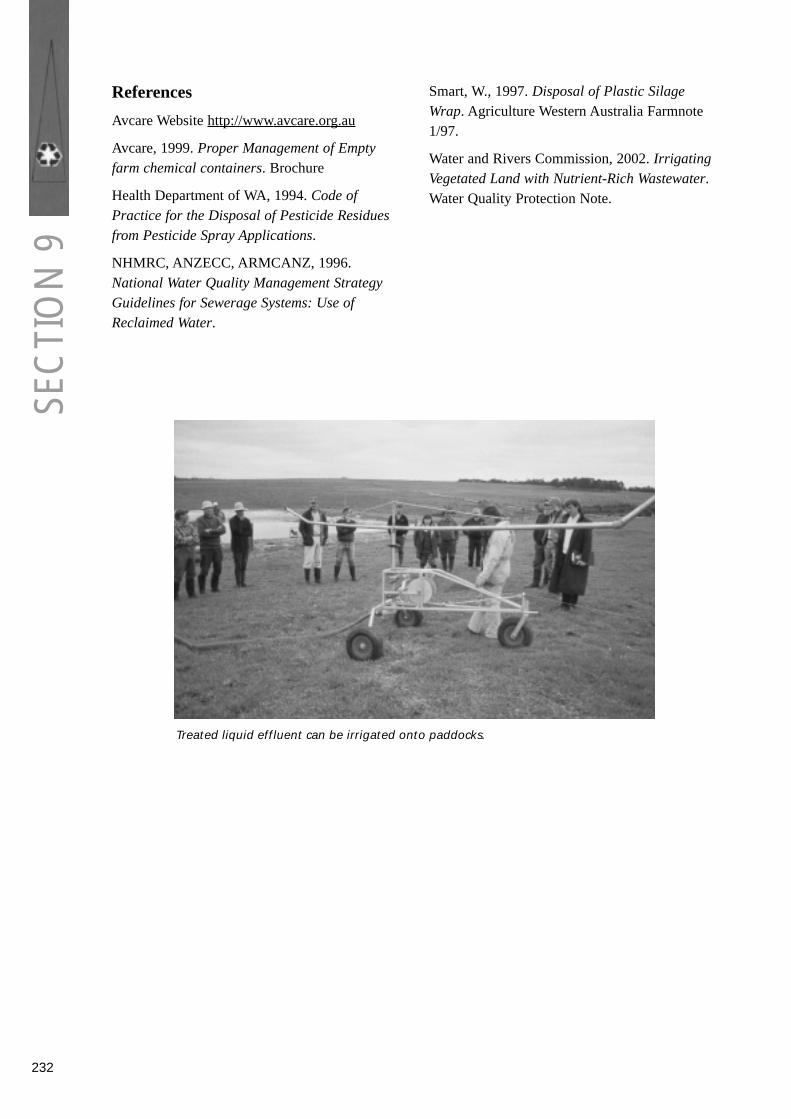
References
Avcare Website http://www.avcare.org.au
Avcare, 1999. Proper Management of Emptyfarm chemical containers. Brochure
Health Department of WA, 1994. Code ofPractice for the Disposal of Pesticide Residuesfrom Pesticide Spray Applications.
NHMRC, ANZECC, ARMCANZ, 1996.National Water Quality Management StrategyGuidelines for Sewerage Systems: Use ofReclaimed Water.
Smart, W., 1997. Disposal of Plastic SilageWrap. Agriculture Western Australia Farmnote1/97.
Water and Rivers Commission, 2002. IrrigatingVegetated Land with Nutrient-Rich Wastewater.Water Quality Protection Note.
232
SEC
TIO
N 9
Treated liquid effluent can be irrigated onto paddocks.


Minimising Air PollutionSE
CTI
ON
10
The main issues in air pollution for horticultureare at a farm, neighbourhood and global scale.They are, for the farm and neighbourhood:
- Chemical spray drift
- Odours and flies
At the global scale, the issue of greenhouse andozone depleting gases emission relates tovegetable and potato growing as for otherindustries, to the extent that these gases areproduced by the operation.
Chemical spray drift is discussed in detailbecause it has the highest potential impact on thesurrounding neighbourhood. All growers shouldadopt the practice of spray planning, with spraydrift awareness zones.
10.1 Minimise spray drift fromthe application ofpesticides
Spray drift of pesticides(Schulze et al, 2001)
Spray drift of pesticides away from the target isan important and costly problem facing bothcommercial and private applicators. Driftcauses many problems including:
- Environmental contamination, such as waterpollution and illegal pesticide residues.
- Damage to susceptible off-target sites.
- A lower application rate than intended whichcan reduce the effectiveness of the pesticide,wasting pesticide and money.
Drift occurs by two methods: vapour drift andparticle drift. This section mainly focuses onconditions that cause particle drift and methodsto reduce the drift potential from sprayingpesticides.
Drift dynamics
Particle drift is the actual movement of spraydroplets away from the target area. Many factorsaffect this type of drift, but the most important isthe initial size of the droplet.
A solution sprayed through a nozzle divides intodroplets that are spheric or nearly spherical inshape. Droplets smaller than 100 microns areconsidered highly driftable and are so small thatthey cannot be readily seen unless in highconcentrations such as fog.
Small droplets fall through the air slowly, andare carried farther by air movement. With agreater proportion of the total spray volume insmaller droplets, the potential drift onto offtarget sites increases.
Small droplets also evaporate quickly, leavingminute quantities of the pesticide in the air.
Larger droplets are more likely to be depositedon the intended target.
Selecting equipment and nozzle types (Schulze et al, 2001)
All nozzles produce a range of droplet sizes.Some spraying equipment produces largeamounts of very fine droplets below 100-150microns, which are the main cause of spray drift.A droplet size in the range 300-500 microns willensure good coverage and minimise spray drift.The small, drift-prone particles cannot beeliminated but they can be reduced and keptwithin reasonable limits.
Altering droplet size
Nozzle type, orifice size and operating pressureare the three factors that affect droplet size.
Nozzles produce a wide range of droplet sizes. Anozzle that can produce only one size of dropletis not available at the current time. Therefore,the goal in the proper application of pesticides isto achieve a uniform spray distribution whileretaining the spray droplets within the intendedtarget area.
Examples of different nozzle types and the waythey produce droplets are:
- Fan nozzles force the liquid under pressurethrough an elliptical orifice and the liquidspreads out into a thin sheet that breaks up intodifferent-sized droplets.
234
SEC
TIO
N 1
0
- Flood nozzles deflect a liquid stream off aplate that causes droplets to form.
- Whirl chamber nozzles swirl the liquid out anorifice with a circular motion that aids thedroplet formation with a spinning force.
- Full cone nozzles produce the largest dropletswhich results in lower drift potential.
For many herbicide applications, a large dropletwill give good results but for good plantcoverage (i.e. post emergence application), largedroplets may not give good pest control.
❑ Select suitable equipment and operate itproperly to minimise spray drift.
Spray nozzles
❑ Use larger orifice sizes where possible.Avoid using nozzles that produce largeamounts of very fine droplets under 150microns.
❑ Use drift reduction nozzles where possible,for example nozzles that produce bubblesthat burst and produce fine droplets onlywhen they contact the crop.
❑ Nozzle spacing- as a general guideline, donot exceed a 75 cm nozzle spacing or elsethe spray pattern uniformity begins todegrade. To allow low boom heights andattain uniform coverage, use a combinationof nozzle spacing, height and directionwhich gives 100% overlap.
❑ Wide angle nozzles are preferred, as thesecan be used with low boom heights and stillgive uniform coverage.
Boom height and travel speed
Operating the boom as close to the sprayedsurface as possible (within manufacturer’srecommendation) is a good way to reduce drift.A wider spray angle allows the boom to beplaced closer to the target. Booms that bouncewill cause uneven coverage and drift. Wheel-carried booms stabilise boom height, which willreduce the drift hazard, provide more uniformcoverage, and permit lower boom height.Shielded booms also reduce the drift from
excessive air movement from travel speed andwind.
❑ When using conventional boom sprays,operate the boom at a low height and keepit stable. Using wide-angle nozzles enableslower boom height.
❑ Keep travelling speed below 8 km/ hour.
❑ Use shielded booms and shroud coverswhen band spraying, especially foroperations near residential areas.
Setting up spray equipment
Spray equipment can be set up to reduce theamount of over-spray and spray drift that maylead to off-site contamination. All sprayers needto be calibrated, with trial runs (using water) toensure the rate of application is even and correctbefore application of chemicals commences.
Spray Pressure
❑ Avoid using high operating pressure as itcreates finer droplets and more spray drift.The recommended maximum forconventional broadcast spraying is 40 PSI(276 kPa) and sprayers can usually beoperated at 25-35 PSI (172-240 kPa).
Spray pressure influences the formation of thedroplets. The spray solution emerges from thenozzle in a thin sheet, and droplets form at theedge of the sheet. Higher pressures cause thesheet to be thinner and the sheet breaks up intosmaller droplets.
If the application rate needs to be increasedselect a higher volume nozzle tip with a largerorifice size, rather than increasing the pressure.
For example, if an operator tried to double theflow rate through the same nozzle, a four- foldincrease in pressure would be required. Thisaction would produce many more small droplets,and greatly increase the potential for spray drift.
Calibration of boom sprays
Calibration of a sprayer is the process ofensuring that the sprayer is operating the way theoperator wants. That is, if the operator wants toapply 40 L/ha, then the sprayer is applying 40
235

SEC
TIO
N 1
0L/ha evenly distributed across the boom.Calibrate the sprayer at least at the start of everyseason and preferably more often.
If the sprayer is not properly calibrated, moneywill be wasted by either the application of morechemical than necessary or a poor pest kill.Directions for calibration are given in thepublications listed under ‘Further reading’.
Following directions for use ofchemicals
❑ Read and follow the pesticide label.
Instructions on the pesticide label are given toensure that pesticides are used safely andeffectively with minimal risk to the environment.Each pesticide is registered for use on specificsites or locations.
Surveys indicate that approximately 65% of thedrift complaints involved application proceduresin violation of the label. Apply a pesticide only ifeconomic thresholds warrant an application.
❑ It is important to use pesticides and sprayadditives within label guidelines.
Spray additives include surfactants, whichinfluence droplet size and pesticide effectiveness,and wetting agents, which have been shown toreduce spray drift. Some spray additives act asspray thickeners when added to a spray tank.These materials increase the number of largerdroplets and decrease the number of finedroplets. They tend to give water-based sprays a‘stringy’ quality and reduce drift potential.
Non-volatile chemicals are much less likely tocause spray drift. Information on volatility canbe found on the Material Safety Data Sheets.
❑ Use low or non-volatile pesticides inpreference to volatile types.
Droplets formed from an oil carrier tend to driftfurther than those formed from a water carrierbecause oil droplets are usually smaller, lighterand remain airborne for longer periods but don’tevaporate quickly.
Weather conditions (Schultz et al, 2001; Department of AgricultureWestern Australia, 2001)
Wind Speed and direction
The amount of pesticide lost from the target areaand the distance it moves both increase withwind velocity. As a rule of thumb, spray drift ismanageable when wind velocity is under 15km/h if appropriate equipment is used. Usingshielded booms and lower boom height willminimise the effect of wind on spray drift.
❑ Monitor and record wind direction, windspeed, temperature and humidity prior to(and if necessary during) every sprayingoperation and check that they are withinacceptable limits.
❑ Avoid spraying when wind speed is greaterthan 15 km/h or blowing towards sensitivecrops, gardens, dwellings, livestock, watersources or wetlands.
Wind speed should be between about 3 and 15km/hr for most operations. If necessary, use ananemometer to accurately measure wind speed.Be aware that spraying when the wind is lightand variable, or is dead still, can lead tounpredictable spray drift.
Do not spray when the wind is blowing towardssensitive crops or areas, unless an appropriatevegetation buffer or buffer distance is imposed.Where possible, spray with a cross-windworking towards the unsprayed area. Be alert tochanges in wind direction and be prepared tomodify or cancel a spray operation as necessary.
Air Stability
❑ Avoid spraying in conditions wheretemperature inversions exist.
Vertical air movement is often overlooked whenchoosing suitable conditions for spraying.Temperature inversion is a condition wherecool air near the soil surface is trapped under alayer of warmer air. This can keep spray driftclose to the ground where it is most likely toaffect people in the surrounding area.
236
SEC
TIO
N 1
0
A strong inversion potential occurs when groundair is 1-3˚C. cooler than the air above.Temperature inversions sometimes occur on stillmornings when cold air forms a layer near theground, preventing the normal upwarddispersion of air pollutants.
Observing smoke is a way to identify inversions.Smoke plumes moving horizontally close to theground would indicate a temperature inversion.This can be detected by the use of a smokegenerator.
Spray drift can be severe under inversionconditions. Small spray droplets can besuspended and move several miles with a gentlebreeze to susceptible areas. Spraying should nottake place when conditions indicate the risk ofan inversion.
Relative Humidity and Temperature
Low relative humidity and/or high temperatureconditions cause faster evaporation of spraydroplets and thus, a higher potential for drift.During evaporation, the droplets become smaller,so evaporation increases the drift potential.
❑ Avoid spraying in conditions of hightemperature and low humidity.
Spray during lower temperature and higherhumidity conditions. As a rule of thumb, if therelative humidity is above 70%, the conditionsare ideal for spraying. However, a relativehumidity below 50% is critical enough towarrant special attention.
Aerial spraying (Department of Agriculture Western Australia,2001)
Of all spray application methods, aerial sprayingpresents the greatest risk of spray drift. Aerialspraying in inappropriate weather conditions orusing poor practice can cause airbornecontamination up to kilometres from the site ofapplication.
❑ Do not conduct aerial spraying unlessweather conditions are optimal.
❑ Be aware of those pesticides for whichregulations prohibit aerial application.
- Spray only when the aircraft is straight andlevel above the crop.
- Fit smoker devices to aircraft to monitorchanges in wind direction and turbulence.
- Fit micronair spray nozzles with transducersto monitor rotational speed.
- Consider spraying only the upwind section ofthe area in order to provide a practicablebuffer distance, having regard for thechemical, its formulation, the sensitivity of theadjoining area and the wind speed anddirection.
The spray operator’s duty of care tominimise air pollution (Extracted from: Department of AgricultureWestern Australia, 2001)
Operators should conduct operations accordingto the best practices outlined in this section.Operators should also be aware of their duty ofcare to:
• Be responsible for the safety of workmates,the general public and the environment,before, during, and after use of agriculturalchemicals. This responsibility is at twolevels:
- A statutory responsibility under currentCommonwealth and State legislation.
- A common law ‘duty of care’ to ensure thatno harm is done to oneself, to any otherperson, or to their property.
• Not carry out a task known to be illegal orunsafe. If aware of any risks to safety forwhich they have not been adequately trained,or which they consider are not being managedeffectively, cease the task until correctiveaction has been taken.
• Ensure that they have received propertraining in the safe handling and applicationfarm chemicals. Table A1in Appendix 1includes suitable training courses.
237
SEC
TIO
N 1
0• If applying chemicals as a contractor,
obtain a current Health Departmentlicence. For details, contact the PesticidesSafety Section by telephoning 08 9383 4244.
• Ensure that they apply chemicals strictly inaccordance with any spray driftagreement(s) that exist between theOwner/Manager and any neighbours.
• Ensure that they have been given a sprayplan that shows the location of sensitive areasor crops.
• Notify neighbours and erect signs ifappropriate, to prevent inadvertent entry intosprayed areas within a safe period.
Spray plans and spray drift awarenesszones(Department of Agriculture Western Australia,2001)
Some areas are particularly sensitive tocontamination by some chemicals. These areasshould be identified in spray plans
Have a spray plan for all routine sprayingoperations. Once spray plans are prepared foreach paddock, these can be used for futurespraying operations and updated as the areas orconditions change. The plan should consist of amap showing:
The area to be sprayed
The spray drift awareness zone (SDAZ, seebelow).
All sensitive areas in the SDAZ, such asresidential or public areas, aquaculture dams,sensitive vegetation, crops and buildings in thevicinity of the property.
Other notes for the operator, such as prevailingwind strength and direction, sensitive areas, driftreduction buffer zones and safety measures.
❑ Ensure that the operator has an up to datecopy of the spray plan before each sprayingoperation.
Regularly notify all immediate neighbours andothers in the locality as appropriate, havingregard for:
- the spray plan
- the chemicals to be used
- the sensitivity of their crops or enterprises
- the length of notice they would need tominimise their risk of damage.
If your neighbours’ enterprises are particularlysensitive to the chemicals you use, you couldconsider offering to enter into an agreement withthem to specify the conditions under which youmay and may not apply chemicals.
Spray drift awareness zones
❑ Adopt the concept of spray drift awarenesszones (SDAZ), as part of the spray plans.
A spray drift awareness zone (SDAZ) is a meansof identifying all potentially sensitive areasaround each paddock to be treated withchemicals.
Bear in mind that each part of the property to betreated will have a slightly different SDAZ as thefocus of the zone shifts from paddock topaddock across the property.
The SDAZ is a zone for consideration of impactsof spraying operations. Under mostcircumstances, the awareness zone for groundspraying could extend up to 1 km from thepaddock to be treated. For aerial application, itis likely to extend well beyond that distance.
The following are some factors that should beconsidered within SDAZs:
Method of application. Aerial spraying may haveimpacts kilometres away. Ground applicationwhere hooded booms and drift reduction nozzlesare used may not have impacts more than 50metres from the operation.
The nature of the sensitive environment, forexample, an A-class wetland bird breedingreserve or a residential area would requiremaximum precautions.
238

SEC
TIO
N 1
0
Toxicity of the chemicals to the particularsensitive environment. For example, pyrethroidsshould not be used where spray drift maycontaminate aquaculture ponds. Hormoneherbicides must not be used anywhere nearvineyards (see ‘Hormone herbicides, thissection).
Example
The Department of Environmental Protection
has set a guideline minimum separation distance
of 500 metres between vegetable and potato
growing operations and residential development
in areas zoned residential.
The SDAZs should take into account allbuildings, crops or areas outside the paddockthat may be sensitive to spray drift, e.g. schools,dwellings, wetlands, aquaculture ponds, organicfarms etc.
However, remember that the SDAZ is anawareness zone. It does not necessarily meanthat spray drift damage will always occur withinthat zone, depending on the sensitivity of thecrop or area, the weather and applicationconditions at the time of spraying, and the sizeof the zone. Also, the presence of any physicalor vegetative buffers downwind of the sprayingoperation will reduce the risk of damage.
239
Figure 10.1 Example of spray drift awareness zone shown on a spray plan,identifying sensitive areas
AWARENESSFIELD TO BESPRAYED ZONE
House
River
School
Sensitive crop

SEC
TIO
N 1
0Hormone herbicides(Fisher and Hawley, 1999)
Hormone herbicides have the potential todamage surrounding sensitive crops by spray orvapour drift. The Agriculture and RelatedResources Protection (Spraying Restrictions)Regulations 1979 restrict the use of hormoneherbicides. There is a ‘duty of care’ forlandholders and spray contractors not to causeoff-target spray damage. Please read thisdocument before using hormone herbicides,especially if the intention is to spray within a10km radius of a sensitive crop.
Symptoms of damage by hormone herbicides
Hormone herbicides are so called because theyfunction in a similar way to plant growthregulators. They may also be called ‘phenoxy’herbicides, as the most common are derivativesof phenoxy-acetic and phenoxy-butyric acids.Low dose rates can sometimes stimulate growthor assist fruit set. High dose rates can causereduced and abnormal growth.
Hormone herbicides are translocated throughplants after uptake through leaves and sometimesroots, and concentrate in the growing points(meristematic tissue).
They interfere with cell division, which results inthe development of malformed leaves and stems.Adventitious roots are also often formed.
The leaf twisting caused by hormone herbicidesmeans that off-target damage is very obvious,and can be noticed almost immediately (refer tophotos).
Herbicides which fall into the category of ahormone are those which contain the activeingredients of the following:
MCPA, MCPB, 2, 4-D, 2,4-DB, Dicamba,Picloram, Triclopyr, Clopyralid, or combinationsof these and other herbicides.
Note that neither triclopyr nor clopyralid arecovered by the regulations discussed in‘Restrictions on use of hormone herbicides’
below, as they came into use after the regulationswere gazetted, and no amendments have beenmade. Users of the chemicals are still bound by a‘duty of care’ and are liable if they causedamage.
Drift hazards of hormone herbicides
Off-target spray damage can occur by:
- droplet drift
and
- vapour drift.
Droplet drift is the movement in the wind ofsmall droplets that fail to settle onto the targetplants. This type of drift could result frommisting by spray equipment and spraying instrong winds. All chemicals are subject todroplet drift.
Vapour drift is caused by the herbicideevaporating (due to its volatility) and moving asa vapour with the wind. Evaporation occursmainly from the soil and plants after the sprayhas landed but it can be from a droplet.Evaporation can occur several hours after thespraying activity and the evaporation rate willdepend upon the volatility of the chemical. Theformulations therefore pose the added hazard ofvapour drift (see tables on page 243 forexamples).
Formulations of the hormone herbicides
Hormone herbicides are amines, sodium andpotassium salts and ester formulations. Thedegree of volatility of the ester formulationsdepends on the particular alcohol used to makethe ester.
Table 10.1 below shows the vapour pressures ofsome hormone herbicides and other commonlyused herbicides, simazine and trifluralin.
Amines and the sodium and potassium salts arenon-volatile.
240

241
SEC
TIO
N 1
0
Table 10.1 Volatility (vapour pressure) of some common herbicidesNote that higher vapour pressure = higher volatility
Herbicide Vapour pressure Comments
Simazine 0.00000083 Pa Known to be non-volatile
Trifluralin 0.0073 Pa Known for its volatility
MCPA iso-octyl ester 0.0038 Pa Volatile
2,4-D iso-octyl ester 0.0023 Pa Volatile
2,4-D butyl ester 0.054 Pa Highly volatile
2,4-D ethyl ester 0.15 Pa Highly volatile
As can be seen from Table 10.1 above, the butyl and ethyl esters have the highest vapour pressures andhence are the most volatile and therefore the most hazardous in terms of potential off-site damage.
Table 10.2 Some common commercial hormone herbicides
Active ingredient Commercial products ®
MCPA Davison MCPA 500 Selective Herbicide Farmco MCPA – 500 Selective Weedkiller Nufarm MCPA 500 Selective Herbicide Tigrex Selective Herbicide (also contains diflufenican).
MCPB Tropotox Selective HerbicideFarmco MCPB – 400 Selective Herbicide
2,4 – D Farmco D – 500 Selective WeedkillerAmicide 500 Selective Herbicide Davison 2,4 – D Amine 500 Nufarm Amacide GC – 500 Selective Herbicide *National 2,4 – DLV Ester 600 Herbicide**Farmco D – 800 Selective Weedkiller ** Estercide 800 Herbicide ** Davison 2,4 – D Ester 800 ** Rhone Poulenc 2,4 – D Ester 800 Herbicide
2,4 – DB Buticide 2,4 – DB Herbicide Davison 2,4 – DB Selective Herbicide Legumex Herbicide
Dicamba Banvel 200 Hebicide Nufarm Dicamba 200 Herbicide
Picloram DowElanco Tordon 50 – D Herbicide (Also contains 2,4-D) DowElanco Tordon 242 Herbicide (also contains MCPA) *DowElanco Grazon DS Herbicide (also contains triclopyr)
Triclopyr *DowElanco Garlon 600 Herbicide*DowElanco Grazon DS Herbicide (also contains picloram)
Clopyralid DowElanco Lontrel L Herbicide
*Low volatile ester formulation **Volatile ester formulation
242
Restrictions on use of hormone herbicides
Under the ‘Agriculture and Related ResourcesProtection (Spraying Restrictions) Regulations1979 the use of the restricted hormoneherbicides is controlled within a 10 km radius ofcommercial vineyards and tomato gardens (seebelow). Their use near other sensitive crops isnot controlled by the Regulations, butlandholders and spray contractors shouldexercise a ‘duty of care’ when spraying. Underthe Regulations:
- Within a 5km radius of commercial vineyardsor tomato gardens only amine and sodium andpotassium salt formulations are approved forspraying under permit.
- Between 5 and 10 km radius of these cropsboth amine, sodium and potassium salts andlow volatile ester formulations can be usedwithout permit.
- Outside of a 10km radius all formulations, thatis amine, sodium and potassium salts and lowvolatile and volatile ester formulations can beused without permit.
Note: Landholders and spray contractors in theGeraldton, Swan Valley and Ord IrrigationDistricts need to consult the Regulations formore precise information on restricted sprayingareas. They vary in these districts from theabove.
Permits
Permits are issued, with conditions, by officersauthorised on behalf of the Chief ExecutiveOfficer of Agriculture Western Australia, for thepurpose of regulations 4 and 5 of theRegulations. The permits take into account:
- Name of property owner, address andtelephone number.
- Location numbers and area (ha) to be sprayed.
- Weed species.
- Herbicide, formulation and rate of application.
- Method of application.
- Approximate distance and direction to thenearest commercial vineyard or tomato garden.
- Wind velocity and direction.
- Period in which spraying is to be conducted.
- Special conditions required for safe applicationsuch as water volume, operating pressure,operating speed and temperature. These arevaried according to the time of the year,depending on the weather and stage ofdevelopment of the sensitive crop. The mostcritical time when spray damage may occur isearly growth to fruit development.
Future restrictions on use of hormone herbicides
The ‘Agriculture and Related ResourcesProtection (Spraying Restrictions) Regulations1979’ are currently under review. It is expectedthat the regulations 4 and 5 of the Regulationwill be repealed which means that there will beno requirement for permits. However, it isexpected that the new legislation will focus on a‘duty of care’ for all users of all chemicals in allsituations.
In addition to this, in the Agriculture ChemicalSpraying Review of 1997, the ReviewCommittee recommended that, ‘The legislationprovides for the mandatory notification of newand diversified crops by growers to a Register,created and maintained preferably by LocalGovernment Authorities’. If this eventuates,landholders and spray contractors could refer tothis register to exercise ‘duty of care’. It wouldbe in the best interest of growers of all new anddiversified crops to have them registered.
SEC
TIO
N 1
0
243
10.2 Minimise impacts of dust,odours and flies
Dust and odours and flies from poorly managedhorticulture often evoke complaints from nearneighbours. This is not surprising, as thesenuisances are likely to result in health problems,especially in aged or sensitive individuals.
Dust
Most dust problems are from on-site machineryoperations and vehicle traffic on unsealed farmtracks. For the health and welfare of humans andother sensitive environments, dust should be kept ata minimum.
❑ Practices to minimise dust problems include:
- Avoiding cultivating at high speeds when thesoil is dry.
- Driving at moderate speeds especially onunsealed roads.
- Establishing vegetated screening buffers.
- Irrigating bare cultivated soils during windyconditions.
- Protecting bare cultivated soil by leavingstubble or crop residues on the surface.(Section 2.1).
Wind strengths and directions should be observed,to determine the likely directions in which dust willbe blown. Vegetation screens are an important partof dust control and their location will be determinedby the orientation of buildings, prevailing winddirection and proximity to neighbours.
Odours and flies
Burning of plastics and other solid wastes producessmoke, which is a nuisance to neighbours and oftencontains toxic air pollutants. It is known that certaintoxins produced from burning plastics can remain inthe human body for long periods of time and thatsome of these, such as dioxins, are carcinogenic.These wastes should never be burned and there aredisposal alternatives (Section 9.1).
Managing fly breeding when using manure(Paulin, 1997)
Manures are useful organic fertilisers as they aregood sources of nutrients and provide organicmatter for the soil. However, pig and poultrymanures are common sources of odours andbreeding places for flies, when used in their rawform.
Stable fly, a stinging insect that affects livestockand humans, is a particularly problematic pest thatbreeds in raw, damp manures.
❑ Treat manures to eliminate odours and flies byeither:
- Composting with other organic wastes togive the required carbon:nitrogen ratio foruse as soil amendments.
or
- Transporting them to factories where theyare dried and granulated to produce organicfertiliser products such as Dynamic LifterTM.
Storage of manure
If manure is to be stored on-farm it must be driedand kept dry at all times. Manure heaps must belocated outside the range of sprinklers andcompletely covered. Covers need to be durable,waterproof, a single sheet and secured so that fliesand water cannot make contact with the manure.Such covers will prevent flies that may be present inthe manure on delivery from hatching, providingthey are left in place for at least 10 days.
Use of manure
Use manure that is free of clumps and incorporate itimmediately. Manure and rotting organic mattershould be covered with at least 50 mm of soil toprevent flies from laying eggs.
Avoid side dressings of manure, particularly duringthe warmer months October to April.
On established land, for vegetable crops, therecommended maximum application rate is 30 cubicmetres per hectare per crop, up to a maximum of 75cubic metres per hectare per year.
SEC
TIO
N 1
0
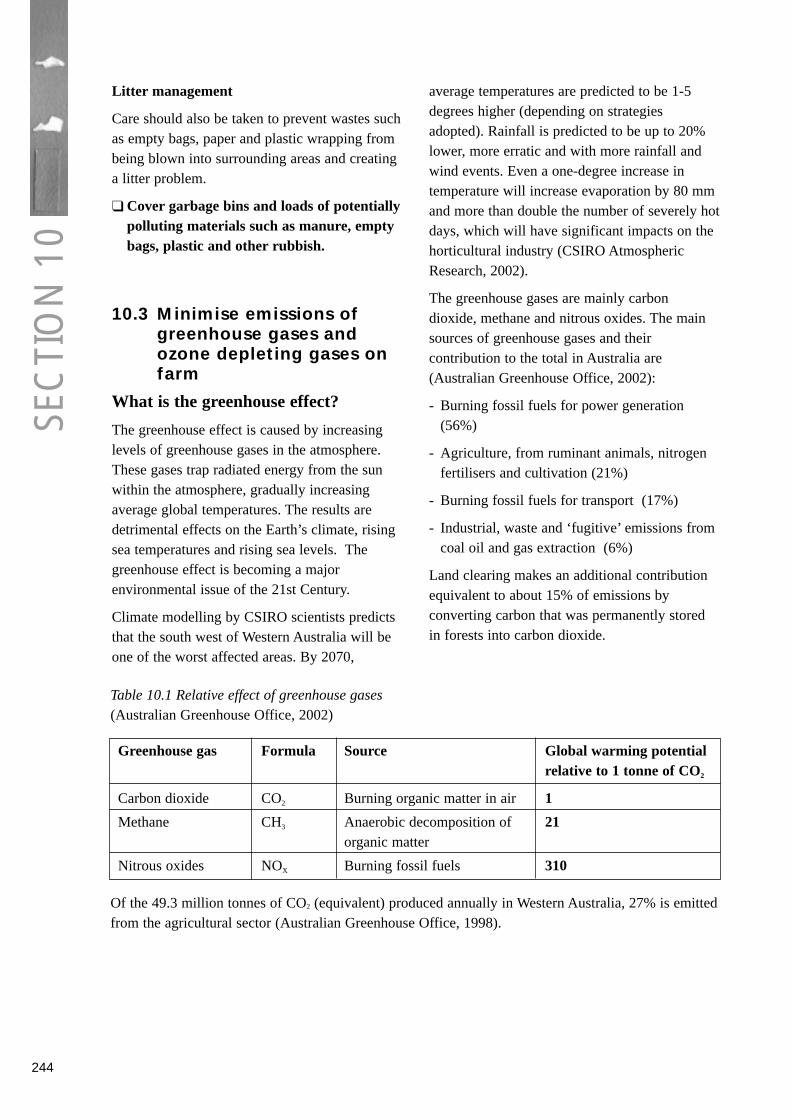
Litter management
Care should also be taken to prevent wastes suchas empty bags, paper and plastic wrapping frombeing blown into surrounding areas and creatinga litter problem.
❑ Cover garbage bins and loads of potentiallypolluting materials such as manure, emptybags, plastic and other rubbish.
10.3 Minimise emissions ofgreenhouse gases andozone depleting gases onfarm
What is the greenhouse effect?
The greenhouse effect is caused by increasinglevels of greenhouse gases in the atmosphere.These gases trap radiated energy from the sunwithin the atmosphere, gradually increasingaverage global temperatures. The results aredetrimental effects on the Earth’s climate, risingsea temperatures and rising sea levels. Thegreenhouse effect is becoming a majorenvironmental issue of the 21st Century.
Climate modelling by CSIRO scientists predictsthat the south west of Western Australia will beone of the worst affected areas. By 2070,
average temperatures are predicted to be 1-5degrees higher (depending on strategiesadopted). Rainfall is predicted to be up to 20%lower, more erratic and with more rainfall andwind events. Even a one-degree increase intemperature will increase evaporation by 80 mmand more than double the number of severely hotdays, which will have significant impacts on thehorticultural industry (CSIRO AtmosphericResearch, 2002).
The greenhouse gases are mainly carbondioxide, methane and nitrous oxides. The mainsources of greenhouse gases and theircontribution to the total in Australia are(Australian Greenhouse Office, 2002):
- Burning fossil fuels for power generation(56%)
- Agriculture, from ruminant animals, nitrogenfertilisers and cultivation (21%)
- Burning fossil fuels for transport (17%)
- Industrial, waste and ‘fugitive’ emissions fromcoal oil and gas extraction (6%)
Land clearing makes an additional contributionequivalent to about 15% of emissions byconverting carbon that was permanently storedin forests into carbon dioxide.
244
Table 10.1 Relative effect of greenhouse gases (Australian Greenhouse Office, 2002)
Greenhouse gas Formula Source Global warming potential relative to 1 tonne of CO2
Carbon dioxide CO2 Burning organic matter in air 1
Methane CH3 Anaerobic decomposition of 21organic matter
Nitrous oxides NOX Burning fossil fuels 310
Of the 49.3 million tonnes of CO2 (equivalent) produced annually in Western Australia, 27% is emittedfrom the agricultural sector (Australian Greenhouse Office, 1998).
SEC
TIO
N 1
0

Table 10.2 Source of greenhouse gas emissions from agriculture in Australia (Australian GreenhouseOffice, 2002)
Source of greenhouse gas emissions % of total net emissions Australia
Livestock 13.7
Agricultural soils and burning vegetation 6.6(soils about 2/3 of this)
Fossil fuel use Not available for agriculture
Rotting of manures and mulches <0.1%
245
Reducing greenhouse gas emissions onthe farm
Horticultural operations are relatively largeproducers of greenhouse gases.
The main sources of greenhouse emissions fromvegetable and potato growing operations are:
- Nitrous oxides from nitrogen fertilisers.
- Methane and carbon dioxide from cultivationof soil and crop mulching practices.
- Consumption of fossil fuels by motorisedvehicles and machinery such as irrigationpumps and tractors, which emits carbondioxide and nitrous oxides.
- Rotting of mulches and manures in piles thatare not aerated, producing methane.
- Land clearing (if this is conducted).
Every effort should be made to minimisegeneration of greenhouse gases on-farm.
The practices used in several aspects ofmanagement of vegetable and potato growingoperations greatly influence the quantity ofgreenhouse gases produced.
Nitrogen fertilisers produce nitrous oxides,which are 310 times more powerful greenhousegases than carbon dioxide. The most importantpractices to minimise greenhouse gas emissionsfrom vegetable and potato growing relate tomanagement of nitrogen fertilisers:
❑ Minimise quantity of nitrogenous fertilisersused and use best practice for efficientapplication (see Section 3).
❑ Do not apply nitrogen to waterloggedground.
Good soil management reduces greenhouse gasemissions by increasing the soil organic carbonsink. A carbon sink is something that removes orstores carbon dioxide from the atmosphere. Soilorganic carbon, forests and permanent nativevegetation are large carbon sinks. Increasing thesoil organic carbon content by 1% over onehectare would prevent over 10 tonnes of CO2
emissions. Mulching of crop residues near thesoil surface increases soil organic carbon, whileimproving soil health and minimising methaneproduction.
❑ Ensure that organic wastes are compostedor mulched on or near the soil surface.
Excessive tillage is to be avoided because itaccelerates the rate of oxidation of soil organicmatter thus producing carbon dioxide andmethane.
❑ Minimise tillage to maintain high soilorganic carbon levels.
Although most vegetable and potato growers arenot usually involved in clearing land,revegetation is to be encouraged because it hasthe opposite effect to land clearing. Woodyvegetation removes carbon dioxide from theatmosphere and converts it to wood, a carbonsink.
❑ Avoid clearing woody vegetation and wherepossible revegetate with woody species.
Fossil fuel usage is a major source of greenhousegases on horticultural farms, chiefly from theoperation of irrigation pump motors and tractors.A large operation with annual fuel usage of60,000 litres is equivalent to running about 30cars. This would emit 180 tonnes of C02.
SEC
TIO
N 1
0

246
❑ Reduce fossil fuel use by making irrigation,cultivation and transport as fuel-efficient aspossible.
Natural gas is more ‘greenhouse friendly’ thanother fossil fuels. Petrol, diesel and coal produceincreasing amounts of greenhouse gases perkilogram used. Conversion of engines to gas isto be encouraged particularly where propertieshave access to piped natural gas.
❑ Where there are economic alternativeenergy sources consider the one with leastgreenhouse impact.
Solar hot water systems are an economic optionfor domestic and industrial purposes and theonly greenhouse gases produced are in themanufacture of the hot water system. Solar waterheating can reduce fossil fuel consumption in atypical household by over 30%.
❑ Use solar hot water and other renewableenergy systems to supplement householdand industrial requirements where possible.
Bio-fuels are a ‘renewable energy’ source andare ‘greenhouse friendly’ fuels. There is thepotential to set up commercial bio-fuelproduction from crop wastes and otherrenewable energy generation such as wind powerand solar power on large farms and at packing orfood production operations. Power generated atprivate premises can now be sold through theState power grid.
❑ Current and future efforts towards on-farm production of renewable energy aregreatly encouraged.
Ozone depleting gases
These gases are mainly man-madechlorofluorocarbon chemicals produced inrelatively small quantities for specific purposes,such as refrigerants. However, they havedevastating effects on the atmosphere bydestroying ozone and causing ‘ozone holes’ inhigher latitudes, resulting in increased ultra-violet radiation reaching the earth’s surface.
❑ Take old refrigeration equipment and fireextinguishers (the yellow ones) to licensedrefrigeration technicians for degassing.
They will store the ozone depletingchemicals for treatment.
❑ Methyl bromide, which was used as a soilfumigant, is an ozone depleting substanceand its use for soil fumigation is nowprohibited.
References
Australian Greenhouse Office, 2002. NationalGreenhouse Gas Inventory. Fact Sheets 1- 8.Website:http://www.greenhouse.gov.au/inventory/facts/hsfacts content.html
CSIRO Atmospheric Research, 2002.Greenhouse Effect. Website:http://www.dar.csiro.au/information/greenhouse.html
Department of Agriculture, Western Australia,2001. Code of Practice for the Use ofAgricultural and Veterinary Chemicals inWestern Australia.
Fisher, D., Hawley, K. and Piper, T., 1999.Hormone Herbicides: What you Should KnowBefore you Spray. Agriculture Western AustraliaFarmnote 61/99.
Paulin, R., 1997. Best Crop Production Practicesfor Managing Fly Breeding and for UsingManure. Agriculture Western AustraliaMiscellaneous Publication 7/97.
Schulze, Grisso, R and Stougaard, R., 2001.Spray Drift of Pesticides. University of NebraskaNebGuide publication. http://www.ianr.unl.edu/pubs/pesticides
Further Reading
National Guidelines for Spray Drift Reduction ofAgricultural Chemicals, 2000.
Department of Natural Resources andEnvironment, Victoria, 1999. Code of Practicefor Farm Chemical Spray Application.
NSW Agriculture, 1998. Principles of SprayDrift Management.
SEC
TIO
N 1
0

247
Training – Units of Competency
The Units of Competency listed in Table A11.1are recommended for growers and operatorswishing to obtain formal qualifications in aspectsof environmentally sustainable vegetable andpotato growing. In general the 2-300s units areat operator level and 4-500s units are at
supervisory and managerial level.
These units can all be accredited towardsCertificates or Diplomas in Horticulture and arefrom the Rural Training Council of AustraliaHorticulture Training Package(www.rtca.com.au/hortpdf/HORTICUL.pdf)
Table A11.1 Units of Competency relevant to environmentally sustainable vegetable and potatogrowing
BEMP Unit Unit Title CommentsSection number
All Core 2A Meet workplace health and safety Prerequisite for all other requirements units
9 and 521A Implement sustainable horticulture Includes conducting an others practices environmental audit
2 319A Prepare field soils for planting Soil testing, preparation, disinfestation
2 358A Survey soil characteristics
2 312A Install a drainage system
3 359A Implement a plant nutrition program
3 438 A Develop a plant nutrition program
4 226A Undertake irrigation system maintenance activities
4 315A Operate irrigation systems
4 313A Install irrigation systems
4 532A Maintain, monitor and evaluate irrigation systems
424A Manage irrigation drainage and treatment systems
4 515A Design irrigation, drainage and water treatment systems
5 530 Manage wetlands
6 Core 3A Use hazardous substances safely A prerequisite. Storage, transport, handling, use, emergency.
6 212A Apply chemicals and biological agents
6 216A Maintain supplies of chemical and Includes chemical recordsbiological agents
6 353A Select chemicals and biological agents
6 432A Manage and notify a chemical spillage and/or leakage
Appendix 11.1
APP
END
IX 1
1.1

248
BEMP Unit Unit Title CommentsSection number
6, 7 201A Treat weeds
6, 7 202A Treat pests and diseases
7 316A Control weeds
7 317A Control pests and diseases
7 219A Maintain a crop Watering, monitoring.
7 352A Implement an Integrated Pest Management (IPM) program
7 530A Manage weed, pest and disease Managerial levelinfestations
7 413A Develop and IPM program
8 237A Support vegetation works
8 306A Establish planted areas
8 531A Conduct vegetation surveys
Table A11.1 (continued)
APP
END
IX 1
1.1

249
For the purposes of this Code, the terms used are assumed to have the following meanings:
TERM DEFINITION
aquifer Discrete underground water resource.
best environmental The best practical methods of meeting expectedmanagement practice environmental outcomes.
biodiversity The variety of all forms of life, including the different plants, animals and micro-organisms, the genetic material they contain and the ecosystems they live in.
brassica Family of vegetables including cauliflowers and broccoli.
conservation Protecting and preserving natural life forms or resources.
environmental About the surrounding conditions that sustain all forms of life.
Environmental Management A voluntary, audited system, which growers can develop for System their operation to improve environmental sustainability.
evapo-concentration Process by which salts become more concentrated and may crystallise when evaporation occurs on the surface of saline water or soils.
eutrophication Nutrient enrichment of waterways leading to algal growth and deterioration in water quality.
export of nutrients and Process by which nutrients and chemicals can move throughchemicals and over soils dissolved in water or attached to soil particles.
expected environmental Expected general condition or state of any aspect of the outcome environment resulting from the practices of growers.
farm chemicals Commercially produced substances with specific uses in agriculture or horticulture. Includes pesticides, spray additives, solvents, cleaning agents and veterinary chemicals.
fertigation Application of soluble fertiliser through an irrigation system.
fertiliser Chemical or organic products that contain nutrients to promote plant growth.
flow line Area on a hill slope where run-off will tend to collect and flow. Smooth open depression, which is not a creek bed, on a hill slope.
fossil fuel Fuel originating from fossil plant or animal remains, such as coal, oil and natural gas.
genetically modified organism Any living thing, which has genes that have been altered bymankind.
greenhouse gas Gas that contributes to the global warming phenomenon known as the greenhouse effect.
integrated pest and disease Utilising a range of pest management tools to providemanagement (IPDM) economically, environmentally and socially sustainable
production. The aim of IPDM is to minimise the risks to human health and the environment while maintaining pest populations below levels at which crop damage may occur.
invertebrate pests Adult and larval forms of pests that are ‘animals without backbones’, such as insects, mites and nematodes.
Glossary
GLO
SSA
RY

250
GLO
SSA
RYirrigation scheduling Monitoring soil moisture and evaporation to decide when and
how much a crop needs to be irrigated.
legislative Relating to laws.
natural ecosystem System of interacting native plants and animals in a particular area or habitat.
nutrient Chemical elements of fertilisers or manures, which are essential for plant growth, for example phosphorus, nitrogen, potassium, calcium, sulphur and trace elements.
pan evaporation rate Standard measure of evaporation, equal to millimetres of water evaporated off a still water surface.
pesticides Chemicals (or in exceptional cases biological or fungal agents), usually man-made, used to kill pests or diseases. Includes herbicides, insecticides and fungicides.
phosphorus retention Numerical index expressing the ability of a soil to hold on toindex (PRI) phosphorus. Low numbers denote a low capacity to hold
phosphorus.
principles (of environmental Fundamental element of the code of practice, stated inmanagement) general terms that guides best management practices in
relation to a particular aspect of management.
renewable energy source Energy source that can be replaced, such as wind or solar energy and bio-fuels. Fossil fuels are not renewable.
riparian (land and Adjoins or directly influences a body of water, including vegetation) • immediately alongside small creeks and rivers, including
the riverbank itself and flood plain • gullies and dips which sometimes run with surface water • surrounding lakes and wetlands
sodic soil A soil containing sufficient sodium to interfere with the growth of most crops plants.
soil structure decline When excessive cultivation of or traffic on the soil breaks down the aggregates that make up soil types with clay and loam content. The result is a compacted, poorly aerated soil that forms clods when cultivated.
sustainable Describes land uses or development that has the capacity to be continued in perpetuity without due impact on environmental, social or economic values.
sustainable production A system of agricultural production that aims to reduce environmental degradation, maintain agricultural productivity, promote economic viability in both the short and long term and maintain stable rural communities and quality of life.
tensiometer Simple instrument that measures soil water content. Underground Water Public Drinking Water Source Areas for underground water,Pollution Control Areas which are proclaimed and protected by the Water and
Rivers Commission under government Acts. The WRC can regulate potentially polluting activities and land use, inspect premises and to take steps to prevent or clean up pollution.
251
Access – all weather, 30-31,66Aerial photo, 6-7Aerial spraying, 237Air pollution, 234Air stability (for spraying), 236-237Aluminium toxicity, 64
Basin tillage, 14Biofumigation acrops, 186Biological control of invertebrate pests, 195Boom height and travel speed, 235Boomspray application, 78
Cadmium, 63Calibration of spray equipment, 235-236Capacitance probes, 116Certification of seed potatoes, 180-181Chemical management, 162Chemical spills, 169Chemicals
ChemCollect scheme, 227chemical pollution, sources, 150following directions for use of, 170-171mixing in the spray tank, 171-175choosing the safest chemical, 195chemical records, 169storage of chemicals, 167toxicity of to aquatic life, 151-154use near water resources, 155
Chemigation, 101Claying of light sands, 52-53Clinometer – to survey grade furrows, 20Coefficient of uniformity – of irrigation, 90 Colwell P test, 71Compost, 49-52Containment pads
for fuel and chemical storage, 164-166Controlling pests and diseases, 180Corrosion
of pumps and metallic components, 121Cover crops
post-harvest cover crops, 24-28cover crops and grazing, 26
Crop cultural strategy, 187Cropping rotations, 24, 48, 186 Cross slope cultivation, 14Cultivation
guidelines for best practice, 45
implements, 46minimising cultivation, 44-45, 47
Dam construction, 146-149Deep ripping, 46,48Dip solutions, 227Direct drilling- to re-establish pasture, 23Direct seeding of shrubs, 211-213 Disease – carrier species, 188Disease prevention, 182-186Drainage
best practice, 54-56minimising nutrients in, 56, 140-143
Drains, 55sub-surface, 60-61 shallow broad-based, 55
DrumMuster Scheme, 225Dust, 243Duty of care (of spray operator), 239
‘Economic injury’ thresholds, 188-189Erosion, 12-13
water erosion risk, 13, 14prevention, 14
Evaporation, 108-109evaporation losses, 110average daily evaporation rate tables, 122-123
Evaporimeter, 109Export of nutrients and chemicals, 132
Farm plan mapping services, 7Farm planning, 6-9
fences, 9access tracks, 30,66other infrastructure, 9safe disposal areas for run-off water, 8surface water control earthworks, 8 overlay maps, 7materials for mapping, 6-7
Fencing -to protect vegetation, 141, 206Fertigation, 100
injection methods, 102-103warning when mixing fertilisers, 103
Fertiliser application rates, 70-71, 83-85choosing the right fertiliser, 73-75post-plant applications, 81loss of into the environment, 76
Index
IND
EX

252
management, 70-88 management on sandy soils, 79-81 method of application, 76-79of brassicas, 77storage and handling of, 76broadcasting, 78-79nutrient content of, 74-75phosphorus, 71-73, 83-85
Filtration unit, 99Flies – controlling breeding of, 243Foxes – control of, 217-218Fuels – storing and dispensing, 163-166
Grade banks, 15-18Grassed waterways, 17-19, 22Green mulching, 49Greenhouse effect, 244Greenhouse gas emissions, 244
reducing on the farm, 245Groundwater
analysis of nutrients, 134monitoring bore installation, 157-160nitrates in, 133taking water samples from bores, 159salinity of, 149
Gully filling procedure, 31-32Gypsum application, 64
Heavy metals, 63Herbicide resistance, 193-194Hormone herbicides, 240-242Hygiene practices, 180-185
Insecticide resistance management, 196-197 Integrated pest and disease management, 180Inter-rotation crops for weed control, 192Irrigation, 90
determining frequency of, 111-112efficiency factor – sprinklers, 110efficiency factor – drippers, 110leaching fraction (for salty water), 111, 120precipitation rate, 111reliability of fittings, 99replacement rate, 109scheduling of, 108-109under windy conditions, 96-97using salty water, 120
Irrigation salinity, 62 site risk of, 62
factors practices to avoid, 62Irrigation system
components and layout, 92-93checks and maintenance, 103- 104evaluating system, 104-107fittings- reliability of, 99system design, 93-99system pressure, 104, 105selecting the right type, 91-92distribution uniformity, 90
Land capability assessment, 5Landslips – treatment of, 34Laser level – to survey earthworks, 221Laterals – layout, 98Leaching, 79, 54,
of nitrogen, 79of phosphorus, 81
Leaching fraction, 120Liming, 56-59Lures, traps and deterrents, 188
Mainlines – specification and layout, 98Maps
of the farm, 6-7AGMAPS, 4
Material safety data sheets, 175Minimum tillage, 44-48Monitoring
of pests in crops, 189-191of evaporation rate, 109-110of groundwater quality, 134, 117-118, 149-150of soil moisture, 113of whitefringed weevil, 189
Neutron probes, 116Neutralising value of lime, 58Nitrogen , 79- 81
Leaching, 79nitrates in groundwater, 80, 86
Nursery accreditation, 180Nurse crops, 30Nutrient and chemical export, 54, 132Nutrient stripping areas, 144
construction of , 144-146Nutrients
optimise application of , 70in surface and groundwaters, 132-133
IND
EX

253
Odours, 243Orobanche weed, 191-192Over-irrigating – avoiding, 117Ozone depleting gases, 246
Pest habitats and hosts, 187-188Pesticides
and human health, 170-171soft pesticides, 195mixing, 171 loading and unloading, 163risk of polluting water resources, 151-155
Phosphorus management application methods, 73, 76-78 rates for soil types, 71-72, 83-85
Phosphorus retention index (PRI), 71Pipe sizing, 98Ploughs – disc, mouldboard, 46Poisoning – preventing, 171Pollutants – sources of , 132, 150Potassium, 81-82, 85Product label, 170-171Protecting bare cultivated soil, 13, 30 Protective clothing
for pesticide spraying operations, 172-174Pump
performance, 104selection, 98
Public Drinking Water Supply Areas, 150
Rabbits – control of, 218-219 Rehabilitation – of eroded or landslip areas, 31-34Relative humidity (for spraying), 237Replacement rate –irrigation, 109Revegetation
of stream banks, 139-140with native species, 211-213of saline land, 60-67
Riparian land, 137vegetation on, 139
Rocked chutes, 32-33Rotary hoes, 45-46
Saline land, management, 59-62of irrigation salinity risk factors, 62
Salinity of water, 149 testing for, 117of groundwater, 150of surface water, 150
Salty waterirrigation with salty water, 120effect on vegetable crops, 118-119
Seed treatment, 181-182Separation buffers- for water resources, 141, 142Site selection and planning, 5Soil management strategies, 13Soil
amendments , 49-54compaction, 44conservation equipment, 23, 48erosion, 27, 31fumigation, 45, 189organic matter, 38, 48, 49
Soil acidity, 56Soil-borne pests, 186, 189
control of African black beetle, 186, 195 Soil fertility, health, 34-35
treating soil health problems, 43-44biological health, 34-35
Soil salinity, 56-60measuring soil salinity, 59-60
Soil sampling, 70Soil survey, 5, 7-8Soil testing, 70-71
chemical tests, 10, 42dispersion, 37, 41infiltration rate, 37, 40organic carbon, 10, 42profile description, 37, 41recording sheets, 39-42slaking, 37, 41sodicity, 64ten simple field tests, 36-42texture, 37, 41
Sparrows, 220Spill kit, 161Spray diary, 198Spray drift, 234
spray drift awareness zones, 238- 239Spray equipment
setting up, 235-236cleaning of, 171spray nozzles, 235spray pressure, 235
Spray plans, 238
IND
EX

Sprinkler Selection, 93-95pressure and jet size, 96wind resistance, 96-97
Sprinkler system testing uniformity, 105-107measuring the depth of water applied, 106 measuring the discharge from outlets, 106checking components, 105checking nozzle and emitter sizes, 106checking pressures at the sprinkler, 104, 105
Starlings, 222Storage
of chemicals, 167of fertilisers, 76of fuels, 163-166shed (chemical), 167
Straw mulching, 48‘Streamlining’, 142Stream bank erosion, 137-138 Surface water control earthworks, 14-22
types of, 15-16planning, 14-15
Sulphur (on sandy soils), 81
Temporary grade furrows, 19-21Tensiometers, 113-116, 128-129Toxicity of chemicals, 170
toxicity to aquatic life, 151-154Trace elements, 75Training and licensing to use chemicals, 175, 237Training Units of Competency, 247-248Transport of fuels on farm, 162, 166Transport of pesticide chemicals, 162-163Tree planting, 211-213
Vegetated buffers why and how buffer strips work, 141-142establishment of, 143, 144
Waste disposal, 224plastics, 227-228domestic wastes, 228-229green wastes, 228-229oils, 227batteries, 228wastewater, 229-231used chemical containers, 225
Water erosion risks, 13-14 Water quality for irrigation, 117-119Water resources
Management, 132pesticide contamination of, 152-154
Water repellent soils, 43-44Water supply assessment and plan, 5-6Watering
at night, 112-113determining frequency, 113
Waterlogged sites, 13, 54-55, 60-61Waterways
constructed, 17-19, 33establishing grass cover on, 23-24
Weather conditions (for spraying), 236-237Weeds
control, 192environmental weeds, 214-216treatment, 192-193new weed threats, 191
Whitefringed weevil, 189Wind
Protection, 30wind conditions (for spraying), 236wind velocity tables, 124-125
Windbreaks, 27-29suitable species for, 29
254
IND
EX
Related Documents