Acknowledgement This is an assignment of a case analysis for Shell Corporation. First and foremost, we need to understand and research on Shell Corporation and its existing vision, mission, objectives and strategies are identified. Then, the vision and mission statements for Shell Corp. are developed. Other important factors that we have analyzed are to identify the organization’s external opportunities and threats. Two major competitors of Shell are Exxon Mobil and BP which have been analyzed with Competitive Profile Matrix (CPM). These companies are global extension. The External Factor Evaluation (EFE) Matrix is constructed to illustrate the external factors for Shell Corporation. The organization’s internal strengths and weaknesses are identified in order to construct an Internal Factor Evaluation (IFE) Matrix. The SWOT matrix, SPACE Matrix, IE Matrix, BCG Matrix, and Grand Strategy Matrix are prepared to analyze and evaluate the organization’s current situation and strategies to be adopted for the portfolios. Besides, the QSPM is constructed to evaluate the pros and cons for the alternative strategies. In addition, specific strategies and long-term objectives are recommended. These included the costs for each projected year. Our recommendations are compared to the actual strategies that have been planned by the company. Meanwhile, we have specified how our recommendations can be implemented and the results we expected. Lastly, we have recommended specific annual objectives and policies as well as the procedures for strategy review and evaluation for Shell Corporation.

Welcome message from author
This document is posted to help you gain knowledge. Please leave a comment to let me know what you think about it! Share it to your friends and learn new things together.
Transcript

Acknowledgement
This is an assignment of a case analysis for Shell Corporation. First and foremost, we
need to understand and research on Shell Corporation and its existing vision, mission,
objectives and strategies are identified. Then, the vision and mission statements for Shell
Corp. are developed. Other important factors that we have analyzed are to identify the
organization’s external opportunities and threats.
Two major competitors of Shell are Exxon Mobil and BP which have been analyzed with
Competitive Profile Matrix (CPM). These companies are global extension.
The External Factor Evaluation (EFE) Matrix is constructed to illustrate the external
factors for Shell Corporation.
The organization’s internal strengths and weaknesses are identified in order to construct
an Internal Factor Evaluation (IFE) Matrix. The SWOT matrix, SPACE Matrix, IE
Matrix, BCG Matrix, and Grand Strategy Matrix are prepared to analyze and evaluate the
organization’s current situation and strategies to be adopted for the portfolios. Besides,
the QSPM is constructed to evaluate the pros and cons for the alternative strategies.
In addition, specific strategies and long-term objectives are recommended. These
included the costs for each projected year. Our recommendations are compared to the
actual strategies that have been planned by the company. Meanwhile, we have specified
how our recommendations can be implemented and the results we expected. Lastly, we
have recommended specific annual objectives and policies as well as the procedures for
strategy review and evaluation for Shell Corporation.

Content Page Number
1.0 Identify the firm’s existing vision, mission, objectives, and
strategies
2.0 Develop vision and mission statements for the organization.
3.0 Identify the organizations external opportunities and
threats
4.0 Construct a Competitive Profile Matrix (CPM)
5.0 Construct an External Factor Evaluation (EFE) Matrix
6.0 Identify the organization’s internal strengths and
weaknesses
7.0 Construct an Internal Factor Evaluation (IFE) Matrix
8.0 Tools for Matching Stage and Decision Stage
8.1 Strengths-Weaknesses-Opportunities-Threats
(SWOT) Matrix
8.2 Strategic Position and Action Evaluation (SPACE)
Matrix
8.3 Boston Consulting Group (BCG) Matrix
8.4 Internal-External (IE) Matrix
8.5 Grand Strategy Matrix
8.6 Quantitative Strategic Planning Matrix (QSPM)
8.6.1 Advantages and Disadvantages of Alternative
Strategies
9.0 Specific Strategies and Long-term Strategies
9.1 Project Costs
9.2 Comparison of Strategies
10.0 Implementation of Recommended Strategies
10.1 Result Expected
10.2 Projected Financial Statements
10.3 Timetable for Action
11.0 Recommended Specific Annual Objectives and Policies
12.0 Recommended Procedures for Strategy Review and
3
4
5
6
7
8
9
10
10
11
12
14
16
17
18
19
20
20
21
21
22
23
24
24
1
Evaluation
13.0 References
25
2

1.0 Identify the firm’s existing vision, mission, objectives, and strategies
Vision
Shell does not have any existing vision stated in their website or annual report.
Mission
Shell is a global group of energy and petrochemical companies. Our aim is to meet the
energy needs of society, in ways that are economically, socially and environmentally
viable, now and in the future.
Objectives
The objectives of the Shell Group are to engage efficiently, responsibly and profitably in
oil, oil products, gas, chemicals and other selected businesses and to participate in the
search for and development of other sources of energy to meet evolving customer needs
and the world’s growing demand for energy.
Strategies
• More Upstream, Profitable Downstream remains on track.
• Shell’s strategy to invest in the development of major growth projects, primarily in
the upstream businesses of Exploration & Production and Gas & Power
• Our strategy has four portfolio themes: sustaining our heartlands, core countries that
have the infrastructure, expertise and remaining growth potential we need; focusing
on new oil and gas projects where technology is a differentiator; building integrated
gas opportunities; and continuing to unlock unconventional oil and gas resources.
• Our strategy is to be the leading oil sands operator by focusing on operational
excellence and profitable growth.
• To remain a global leader in the downstream business, our strategy is to:
Ensure continued asset integrity and operational safety;
Continue reshaping our portfolio by investing selectively in key markets and
divesting non-strategic assets;
3
Enhance our focus on delivering operational excellence and being a cost leader
in the downstream businesses;
Reinforce our leading global brand position across the downstream businesses
by focusing on initiatives such as differentiated fuels, lubricants and building a
material alternative fuels business;
Continue to maximize the value of our integrated hydrocarbon value chain by
working towards a tighter integration of the Oil Sands, Oil Products and
Chemicals businesses;
Maintain discipline in our capital spending; and
Continue to develop our people
• The Chemicals strategy remains focused on our portfolio of crackers and selected
first-line derivatives, which supply bulk petrochemicals to large industrial customers.
Our strategy is to strengthen our asset base in the Americas and Europe through
operational excellence and highly targeted investments, and to achieve profitable
growth in Asia-Pacific and in the Middle East as projects with the right combination
of feedstock, costs, and portfolio are developed and mature.
2.0 Develop vision and mission statements for the organization.
Vision
To be the largest environmental friendly energy provider company in the world.
Mission
• Provide clean and sustainable energy to meet society demand all over the world.
• Emphasize safety and healthy working environment for our employees.
• Be a socially and environmentally responsible company.
4

3.0 Identify the organizations external opportunities and threats
List of opportunities
• Increase usage for energy
• Increasing price of energy
• Increasing propensity of people to spend
• Increasing mobility of labor, capital and technology
• Demand shifts for renewable energy
List of threats
• Regulations restricted excessive emission of CO2
• Depletion of natural energy resources
• Exxon Mobil is rivalry in the industry
• The credit crisis and volatile commodity prices that emerged in the second half of
2008 affected many aspects of the business environment
• The hurricane impact in the US Gulf Coast region, currency exchange impact
• Disruption in gas supply to the Nigeria LNG venture
• Currency exchange losses of $650 million in 2008 were mainly driven by the
appreciation of the US dollar
5

4.0 Construct a Competitive Profile Matrix (CPM) SHELL EXXON MOBIL BP Critical success factors Weight Rating
Weighted score Rating
Weighted score Rating
Weighted score
Advertising
0.20 3 0.60 3 0.60 3 0.60
Product quality
0.10 4 0.40 2 0.20 3 0.30
Management 0.07 3 0.21 3 0.21 4 0.28 Financial position
0.10 2 0.20 3 0.30 3 0.30
Customer loyalty 0.05 3 0.15 3 0.15 2 0.10
Global expansion 0.20 4 0.80 4 0.80 3 0.60
Market share 0.09 3 0.27 4 0.36 3 0.27 Logistic 0.15 3 0.45 3 0.45 3 0.45 Production capacity
0.04 3 0.12 4 0.16 3 0.12
Total 1 3.20 3.23 3.02
The CPM identifies a firm’s major competitors and its particular strengths and
weaknesses in relation to a sample firm’s strategic position. Critical success factors in a
CPM include both internal and external issues; therefore, the ratings refer to strengths and
weaknesses, where 4= major strength, 3 = minor strength, 2 = minor weakness, and 1 =
major weakness. In a CPM, the ratings and total weighted scores for rival firms can be
compared to the sample firm.
The table that we shown are critical success factors between Shell, Exxon Mobil and BP.
In this table, advertising and global expansion are the most important critical success
factors, as indicated by a weight of 0.20. Shell’s and Exxon Mobil’s global expansion is
very well, as evidenced by a rating of 4; product quality of Shell is good, as indicated by
a rating of 4; Exxon Mobil is the lowest, as indicated by a rating of 2. Exxon Mobil’s
market share is the highest, as evidenced by a rating of 4, BP’s and Shell’s market share
is not bad too, as evidenced by a rating of 3.
Besides, by using this table, note that Exxon Mobil has the best market share and
production capacity; Shell has the best product quality; and BP has the best management
in the company as indicated by the ratings. For a total weighted score, Exxon Mobil
6

achieves the highest weighted score of 3.23, Shell’s weighted score of 3.20 and BP‘s
weighted score is 3.02.
5.0 Construct an External Factor Evaluation (EFE) Matrix
KEY EXTERNAL FACTORS WEIGHT RATING
WEIGHTED
SCORE
Opportunities
1. Increase usage for energy 0.12 3 0.36
2. Increasing price of energy 0.13 2 0.26
3. Increasing propensity of people to spend 0.06 2 0.12
4. Increasing mobility of labor, capital and technology 0.08 2 0.16
5. Demand shifts for renewable energy 0.05 3 0.15
Threats
1. Regulations restricted excessive emission of CO2 0.08 4 0.32
2. Depletion of natural energy resources 0.12 3 0.36
3. Exxon Mobil is rivalry in the industry 0.09 1 0.09
4. The credit crisis and volatile commodity prices that
emerged in the second half of 2008 affected many aspects
of the business environment
0.10 1 0.10
5. The hurricane impact in the US Gulf Coast region,
currency exchange impact
0.07 1 0.07
6. Disruption in gas supply to the Nigeria LNG venture 0.06 1 0.06
7. Currency exchange losses of $650 million in 2008 were
mainly driven by the appreciation of the US dollar
0.04 1 0.04
Total 1.00 2.09
7

6.0 Identify the organization’s internal strengths and weaknesses
List of strength
• Strong financial position with income of $26.5 Billion and capital investment
$38.4 Billion
• High production capacity - producing 2% of the world’s oil, 3% of the world’s
gas and selling 7.5% of the world’s LNG
• Worldwide customer base
• Investment in R&D more than $1.2 Billion
• Spending on alternative energy and CSS $1.7 Billion in the last 5 years
• Generating wind power for nearly 250,000 homes
• Operating in more than 100 countries and with around 45,000 service stations
worldwide
• Running more than 25 refineries and chemical plants
List of weakness
• Loss of $474 millions in chemical and corporate portfolios
• LNG sales of 13.05 million tonnes, down 1%
• Oil Sands – higher operating costs, lower bitumen production volumes
• Chemicals – significantly lower margins, lower income from equity-accounted
investments and higher operating expenses
8

7.0 Construct an Internal Factor Evaluation (IFE) Matrix
KEY INTERNAL FACTORS WEIGHT RATING
WEIGHTED
SCORE
Strength
1. Strong financial position with income of $26.5 Billion and
capital investment $38.4 Billion 0.11 4 0.44
2. High production capacity - producing 2% of the world’s
oil, 3% of the world’s gas and selling 7.5% of the world’s
LNG 0.09 4 0.36
3. Worldwide customer base 0.07 3 0.21
4. Investment in R&D more than $1.2 Billion 0.08 4 0.32
5. Spending on alternative energy and CSS $1.7 Billion in the
last 5 years 0.06 3 0.18
6. Generating wind power for nearly 250,000 homes 0.05 3 0.15
7. Operating in more than 100 countries and with around
45,000 service stations worldwide
0.09 3 0.27
8. Running more than 25 refineries and chemical plants 0.09 3 0.27
Weakness
1. Loss of $474 millions in chemical and corporate portfolios 0.12 1 0.12
2. LNG sales of 13.05 million tonnes, down 1% 0.04 2 0.08
3. Oil Sands – higher operating costs, lower bitumen
production volumes 0.09 1 0.09
4. Chemicals – significantly lower margins, lower income
from equity-accounted investments and higher operating
expenses
0.11 1 0.11
Total 1.00 2.60
9

8.0 Tools for Matching Stage and Decision Stage
8.1 Strength-Weakness-Opportunity-Threats (SWOT) Matrix STRENGTH - S
1. Strong financial position with income of $26.5 Billion and capital investment $38.4 Billion
2. High production capacity - producing 2% of the world’s oil, 3% of the world’s gas and selling 7.5% of the world’s LNG
3. Worldwide customer base 4. Investment in R&D more than $1.2
Billion 5. Spending on alternative energy and
CSS $1.7 Billion in the last 5 years 6. Generating wind power for nearly
250,000 homes 7. Operating in more than 100 countries
and with around 45,000 service stations worldwide
8. Running more than 25 refineries and chemical plants
WEAKNESS - W 1. Loss of $474 millions in chemical and
corporate portfolios 2. LNG sales of 13.05 million tonnes,
down 1% 3. Oil Sands – higher operating costs,
lower bitumen production volumes 4. Chemicals – significantly lower
margins, lower income from equity-accounted investments and higher operating expenses
OPPORTUNITIES - O 1. Increase usage for energy 2. Increasing price of energy 3. Increasing propensity of people to
spend 4. Increasing mobility of labor, capital
and technology 5. Demand shifts for renewable energy
SO STRATEGIES 1. Extend number of service station to
more rural are capture more market share (S1, S7, O1, O3)
2. Promote renewable energy worldwide (S3, S7, O5)
3. Research for renewable energy and alternative energy (S4, S5, O5)
4. Increase number of refineries and chemical plant worldwide (S8, S7, S3, O4, O2)
WO STRATEGIES 1. Promote LNG energy as the most cost
effective alternative energy for petrol vehicles (W2, O2)
2. Relocate chemical plants to more cost effective location to cut down operating expenses (W4, O4)
THREATS - T 1. Regulations restricted excessive
emission of CO2 2. Depletion of natural energy resources 3. Exxon Mobil is rivalry in the industry 4. The credit crisis and volatile
commodity prices that emerged in the second half of 2008 affected many aspects of the business environment
5. The hurricane impact in the US Gulf Coast region, currency exchange impact
6. Disruption in gas supply to the Nigeria LNG venture
7. Currency exchange losses of $650 million in 2008 were mainly driven by the appreciation of the US dollar
ST STRATEGIES 1. Promote alternative energy (S5, S3,
S7, T2) 2. Develop alternative way of supplying
gas which will reduce disruption (S4, S2, T6)
WT STRATEGIES 1. A 2. B
10

8.2 Strategic Position and Action Evaluation (SPACE) Matrix
Strategic Position Ratings
Financial Strength • Income of $26.5 billion and capital investment of $38.4 billion. • Invest in R&D for more than $12 billion. • Revenue has increased about $ 100 billion compare with last
year. • Income has decreased about $ 5 billion compare with last year.
4.0
4.0 4.0 2.0 14.0
Industry Strength • The demand of energy usage is increasing tremendously. • The company has investing for alternative energies. • High capital investment and the use of technology have created
the barriers of entry.
5.0 4.0
3.0 12.0
Environment Stability • The economic environment is unstable especially in under
developing countries. • The fluctuation of oil price affects business environment. • The risk of expanding the business is greater due to natural
disasters.
-4.0 -5.0
-3.0 -12.0
Competitive Advantage • Operating in more than 100 countries and around 4500 service
station worldwide. • It runs more than 25 refineries and chemical plants. • Shell has the high production capacity.
-1.0 -2.0 -1.0 -4.0
Conclusion
FS Average is 14.0 / 4 = 3.5
ES Average is -12.0 / 3 = -4.0
IS Average is 12.0 / 3 = 4.0
CA Average is -4.0 / 3 = -1.3
Directional Vector Coordinates: x-axis: 4.0 + (-1.3) = 2. 7
y-axis: 3.5 + (-4.0) = -0.5
11

FS
ES
IS CA 0
-0.5
2.7
Conservative Aggressive
Defensive Competitive
x
The company should pursue competitive strategies (backward, forward, and horizontal
integration; market penetration; market development; product development and joint
venture).
8.3 Boston Consulting Group (BCG) Matrix Division Revenues
($ million)Revenues
(%)Profits
($ million)Profits
(%)Market
share (%) Growth rate (%)
1. Exploration and Production
20,841 4 20,235 77 25 39.28
2. Gas and Power
24,576 5 5,328 20 60 53.77
3. Oil Sands
558 1 941 4 35 (47.8)
4. Oil Products
368,853 80 446 2 25 30.49
5. Chemicals
43,494 9 (405) (2) 20 5.96
6. Corporate
39 1 (69) (1) 5 (31.57)
Total 458,361 100 26,476 100
12

High Low
Medium
Low
50
-50
0
100 50 0
Medium
Industry Sales Grow
th Rate (%
)
14
Relative Market Share Position
5
2
3
6
Stars
Cash Cow
Question mark
Dog
The BCG matrix portrayed the differences among the divisions of Shell in terms of
relative market share position and industry growth rate. The gas and power division is
located in stars quadrant, which is high in relative market share position and high growth
rate. The divisions in question mark are explorations and production, oil products and
chemical. Whilst the oil sands and corporate are in the dog’s quadrant.
The suitable strategies for gas and power division (stars quadrant) are forward, backward
and horizontal integration; market penetration; market development and product
development. Strategies should be adopted for explorations and production, oil products
and chemical divisions (question mark quadrant) are intensive strategies – market
penetration, market development and production development; or to sell them. In the oil
sands and corporate divisions (dog quadrant), retrenchment will be the best strategy to
pursue.
13
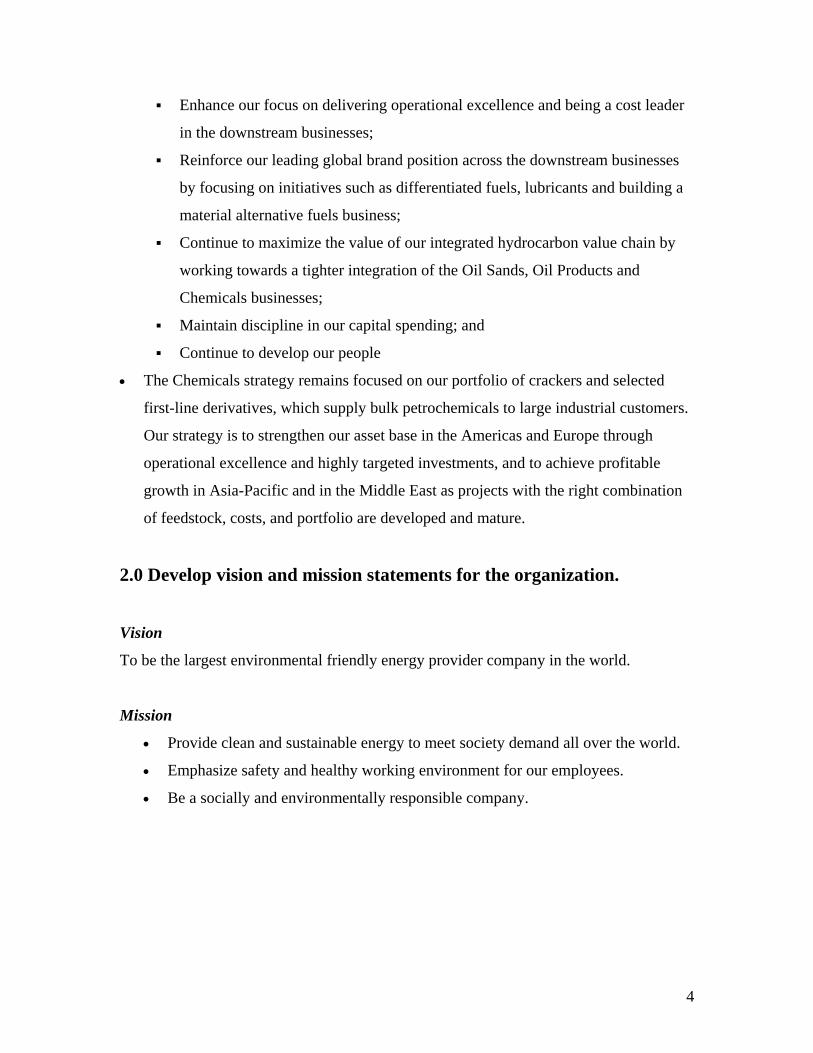
8.4 Internal-External Matrix (IE Matrix)
Division Revenues
($ million)
Revenues
(%)
Profits
($ million)
Profits
(%)
EFE
scores
IFE
scores
1. Exploration and
Production
20,841 4 20,235 77 3.1 2.8
2. Gas and Power
24,576 5 5,328 20 2.9 2.7
3. Oil Sands
558 1 941 4 2.4 2.7
4. Oil Products
368,853 80 446 2 2.1 1.8
5. Chemicals
43,494 9 (405) (2) 2.1 2.4
6. Corporate
39 1 (69) (1) 1.3 1.7
Total 458,361 100 26,476 100
14

4 123
3
2
1
High
Low
Low
The IFE Total Weighted Scores
The E
FE T
otal Weighted Scores
3 5
6
4
2 1
I II III
IV V VI
VII VIII IX
The exploration and production division is located in the quadrant II; the company should
grow and build this portfolio, strategies should be adopted are intensive strategies and
integrative strategies. The gas and power, oil sands and chemical divisions are positioned
in the quadrant V; the hold and maintain strategies should be used for these divisions,
such as market penetration and product development. Meanwhile the oil products and
corporate divisions are positioned in quadrant VI and IX respectively. However, these
portfolios should adopt harvest or divest strategies.
15

8.5 Grand Strategy Matrix
Rapid Market Growth
Slow Market Growth
Strong Competitive Position
Weak Competitive Position
Quadrant II 1. Market development 2. Market penetration 3. Product development 4. Horizontal integration 5. Divestiture 6. Liquidation
Quadrant I 1. Market development 2. Market penetration 3. Product development 4. Forward integration 5. Backward integration 6. Horizontal integration 7. Related diversification
Quadrant III 1. Retrenchment 2. Related diversification 3. Unrelated diversification 4. Divestiture 5. Liquidation
Quadrant IV 6. Related diversification 7. Unrelated diversification 8. Joint ventures
Shell has rapid growth in market and has strong competitive position. Based on this grand
strategy matrix, Shell is positioned in quadrant I, therefore it can consider to use
strategies such as market development, market penetration, product development,
forward integration, backward integration, horizontal integration and related
diversification.
16

8.6 Quantitative Strategic Planning Matrix (QSPM) STRATEGIC ALTERNATIVES
INVEST IN SOLAR &
WIND ENERGY
INVEST IN BIOFUEL
KEY FACTORS WEIGHT AS TAS AS TAS Opportunities
1. Increase usage for energy 0.12 2 0.24 4 0.48 2. Increasing price of energy 0.13 2 0.26 4 0.52 3. Increasing propensity of people to spend 0.06 2 0.12 3 0.18 4. Increasing mobility of labor, capital and technology 0.08 2 0.16 3 0.24 5. Demand shifts for renewable energy 0.05 4 0.20 3 0.15
Threats
1. Regulations restricted excessive emission of CO2 0.08 3 0.24 1 0.08 2. Depletion of natural energy resources 0.12 2 0.24 3 0.36 3. Exxon Mobil is rivalry in the industry 0.09 - - - - 4. The credit crisis and volatile commodity prices that
emerged in the second half of 2008 affected many aspects of the business environment
0.10 - - - -
5. The hurricane impact in the US Gulf Coast region, currency exchange impact
0.07 2 0.14 1 0.07
6. Disruption in gas supply to the Nigeria LNG venture 0.06 - - - - 7. Currency exchange losses of $650 million in 2008 were
mainly driven by the appreciation of the US dollar 0.04 - - - -
1.00 Strength
1. Strong financial position with income of $26.5 Billion and capital investment $38.4 Billion
0.11 3 0.33 4 0.44
2. High production capacity - producing 2% of the world’s oil, 3% of the world’s gas and selling 7.5% of the world’s LNG
0.09 - - - -
3. Worldwide customer base 0.07 2 0.14 3 0.21 4. Investment in R&D more than $1.2 Billion 0.08 2 0.16 3 0.24 5. Spending on alternative energy and CSS $1.7 Billion in the
last 5 years 0.06 - - - -
6. Generating wind power for nearly 250,000 homes 0.05 4 0.20 1 0.05 7. Operating in more than 100 countries and with around
45,000 service stations worldwide 0.09 1 0.09 4 0.36
8. Running more than 25 refineries and chemical plants 0.09 1 0.09 3 0.27 Weakness
1. Loss of $474 millions in chemical and corporate portfolios 0.12 - - - - 2. LNG sales of 13.05 million tonnes, down 1% 0.04 2 0.08 1 0.04 3. Oil Sands – higher operating costs, lower bitumen
production volumes 0.09 - - - -
4. Chemicals – significantly lower margins, lower income from equity-accounted investments and higher operating expenses
0.11 - - - -
1.00 2.69 3.69
17

8.6.1 Advantage and disadvantages
Strategy 1: Invest in solar and wind energy
Advantages
• Solar and wind energy are cleaner and produced more naturally
• Require less labor to monitor the energy production as the energy created and
transmitted to the end-user directly
• Global warming could be due our energy craving lifestyle, so we should look into
more environmentally friendly energy sources
Disadvantages
• The solar technology is costly due to high price of the solar generating
equipments
• The solar energy depends to heat while the wind energy depends to continuous
wind, it is logically hard to get the continuous wind and solar energy unless
battery is used to store the excessive energy and reused later
Strategy 2: Invest in biofuel
Advantages
• Biofuel is more acceptable and easily target-able to the market because the fuel
market is matured while the natural resource depleting and the demand for fuel
remain high.
• Biofuels substantially reduces greenhouse gas emissions when compared to
petroleum and diesel.
• Biofuel is less explored as it requires high investment which Shell affords because
of their continuous investment in R&D.
• The UK Government in particular has introduced many incentives to drivers of
'green cars' based on emissions - with reduced taxation dependent on how
environmentally friendly consumer’s vehicle is. This would gradually generate
demand for biofuels.
18

• Save costs for the consumers because biofuel is lower price compare to fossil
fuels.
Disadvantages
• Many first generation biofuels are not sustainable. It is necessary to create
sustainable biofuel production that does not effect food production, and that
doesn’t cause environmental problems.
• If biofuels become lucrative for farmers, they may grow crops for biofuel
production instead of food production. Less food production will increase prices
and cause a rise in inflation.
• To develop biofuels, large number of oil plantation land would be required and
therefore large numbers of rainforests need to be sacrificed.
9.0 Recommend specific strategies and long-term objectives
Recommending strategy
We are recommending the Shell to invest and focus in Biofuel to produce cost effective
fuels as an alternative to the current depleting fossil fuels. Biofuel is encouraged by
government through tax reduction for consumers who uses Biofuel or environmental
friendly cars. This would gradually increase demand for the biofuel from the consumers
and if Shell take the initiatives to execute the strategy, they would become the leader in
producing cost effective biofuels that would cater the demand.
Recommending long-term objective
1. Become the leading biofuel supplier in the world by promoting the biofuel
advantages throughout the world and supply the biofuel in every service station.
2. Make biofuel the main contributor to Shell’s energy resources as much as 30% in
8 years time.
3. Improve the productivity and utilization of biofuel energy by continuous R&D.
19
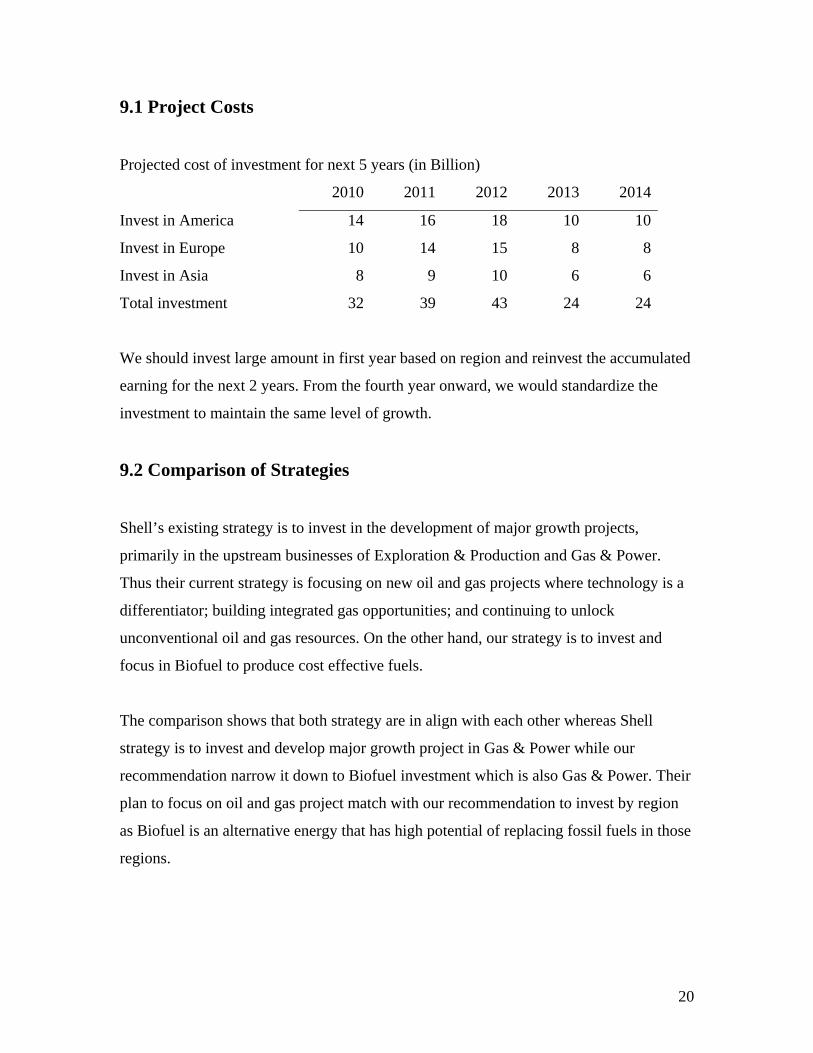
9.1 Project Costs
Projected cost of investment for next 5 years (in Billion)
2010 2011 2012 2013 2014
Invest in America 14 16 18 10 10
Invest in Europe 10 14 15 8 8
Invest in Asia 8 9 10 6 6
Total investment 32 39 43 24 24
We should invest large amount in first year based on region and reinvest the accumulated
earning for the next 2 years. From the fourth year onward, we would standardize the
investment to maintain the same level of growth.
9.2 Comparison of Strategies
Shell’s existing strategy is to invest in the development of major growth projects,
primarily in the upstream businesses of Exploration & Production and Gas & Power.
Thus their current strategy is focusing on new oil and gas projects where technology is a
differentiator; building integrated gas opportunities; and continuing to unlock
unconventional oil and gas resources. On the other hand, our strategy is to invest and
focus in Biofuel to produce cost effective fuels.
The comparison shows that both strategy are in align with each other whereas Shell
strategy is to invest and develop major growth project in Gas & Power while our
recommendation narrow it down to Biofuel investment which is also Gas & Power. Their
plan to focus on oil and gas project match with our recommendation to invest by region
as Biofuel is an alternative energy that has high potential of replacing fossil fuels in those
regions.
20

10.0 Implementation of Recommended Strategies We should invest large amount in the first year based on region and reinvest the
accumulated earning for the next 2 years. We should invest region by region and the costs
are different for each of the region. This is because the cost is an investment planned
based on the region’s population and their popularity for biofuel.
For the first year, we invest 14 billion in America region followed by 10 billion in Europe
and 8 billion in Asia. The investment would be used to acquire current biofuel plantations,
develop new plantations, build biofuel processing plant, develop biofuel supply network,
increase biofuel specialized service stations, and advertise widely to create consumer
awareness on biofuel.
10.1 Result Expected We forecasted that the investment would returns the sales of 50% over the investment.
The income generated in the first year would be used to reinvest for the next year. Again
the investment would be used at the same way but slightly larger than before. On third
year, we will implement the same method. On the fourth year onward, we will reduce and
standardized the investment as we will reduce cost on advertisement. We will maintain
the same investment figure because we encourage the same level of growth for biofuel.
21

10.2 Projected Financial Statements Forecast Statement of Income ($ million) 2010 2011 2012 2013 2014
Revenue Exploration & Production Gas & Power Oil Sands Oil Products Chemicals Corporate
30,011 35,389
734 492,293
44,956 32
36,013 42,467
778 539,878
48,990 27
43,216 50,960 1,096
559,712 51,003
23
51,859 61,153 1,259
612,839 56,223
25
62,231 73,384 1,593
698,531 58,861
30 Total 603,415 668,153 706,010 783,358 894,630
Cost of sales 482,447 534,882 552,980 631,992 708,291
Gross profit 120,968 133,271 153,030 151,366 186,339 Selling, distribution and
administration expenses Exploration Share of profit of equity-accounted
investments Interest and other income Interest expenses
17,982 2,211
7,391 1,092 1,209
18,921 2,309
8,434 1,380 1,938
20,487 2,746
8,587 1,487 2,321
21,942 2,866
9,342 1,032 1,993
22,133 3,003
9,873 1,447 2,207
Income before taxation 108,049 119,917 137,550 134,939 170,316 Taxation 43,397 46,213 53,909 56,210 61,219 Income for the period 64,652 73,704 83,641 78,729 109,097
Income attributable to minority interest
234 126 656 715 455
Income attributable to Royal Dutch Shell plc shareholders
64,418 73,578 82,985 78,014 108,642
22
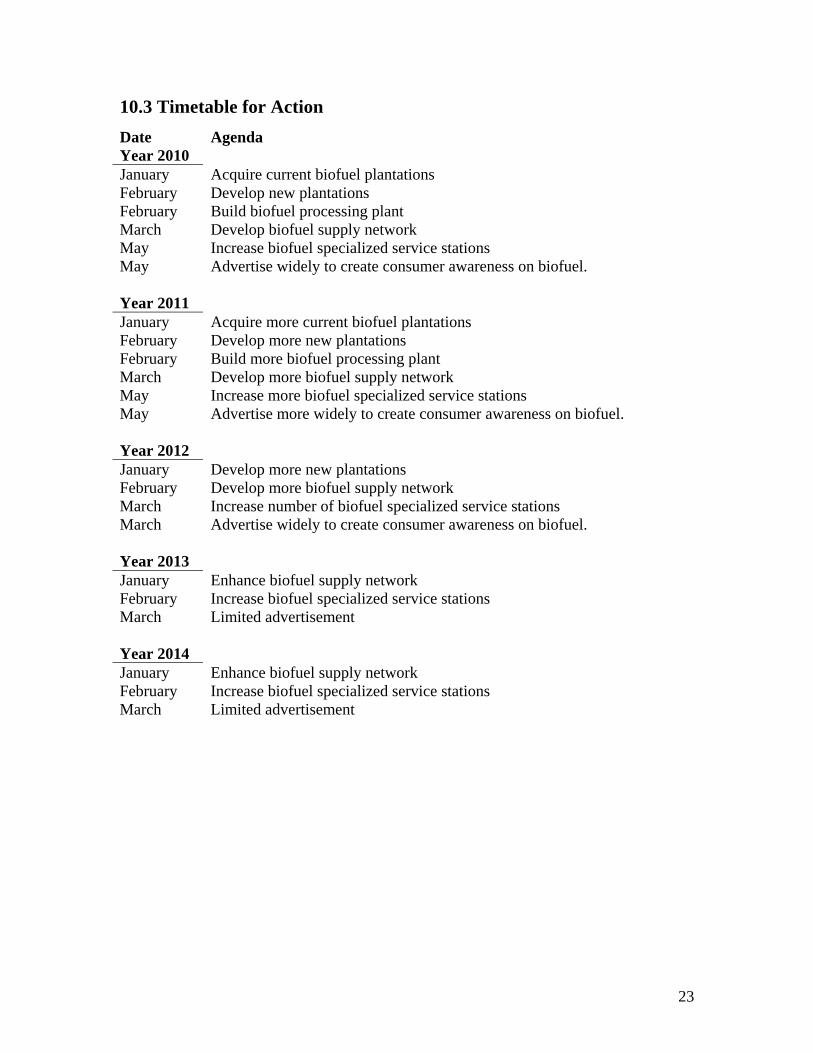
10.3 Timetable for Action Date Agenda Year 2010 January Acquire current biofuel plantations February Develop new plantations February Build biofuel processing plant March Develop biofuel supply network May Increase biofuel specialized service stations May Advertise widely to create consumer awareness on biofuel. Year 2011 January Acquire more current biofuel plantations February Develop more new plantations February Build more biofuel processing plant March Develop more biofuel supply network May Increase more biofuel specialized service stations May Advertise more widely to create consumer awareness on biofuel. Year 2012 January Develop more new plantations February Develop more biofuel supply network March Increase number of biofuel specialized service stations March Advertise widely to create consumer awareness on biofuel. Year 2013 January Enhance biofuel supply network February Increase biofuel specialized service stations March Limited advertisement Year 2014 January Enhance biofuel supply network February Increase biofuel specialized service stations March Limited advertisement
23

11.0 Recommend specific annual objectives and policies Annual objectives
• Make biofuel the main contributor to Shell’s energy resources increase every year
by 4%
• Increase the sales of biofuel by minimum 10% every year
• Improve biofuel energy quality and utilize the production
• Advertise continuously to create brand awareness and retain requirement for
biofuel
• Enhance service of biofuel supply and continuously establish wider supply
network
Policies
• Encourage employees to use biofuel for their vehicles as the first step of internal
marketing the biofuel ensures healthier environment.
• Promote all advertising materials in green and ensure the materials used in the
management are environmental friendly.
• Ensure employees working in good and safety environment all the time.
12.0 Recommend procedures for strategy review and evaluation Review and evaluation helps the firm to ensure the strategies are implemented and
carried out appropriately resulting to the desired outcomes. For Shell, the evaluation will
be done through review over the sales figures. The analysis will be done by the managers
and later reviewed by department managers. Interviews and presentations will be
conducted by the department managers presenting the current evaluation of the strategies
to the department heads.
The sales report and presentation would be the evaluation tool for the department heads
to judge the result of strategies. A good strategy implementation would result to a good
evaluation as the forecasted sales achieved and objectives fulfilled from time to time.
24
13.0 References 1. Royal Dutch Shell Plc Annual Review and Summary Financial Statements 2008
2. Royal Dutch Shell Plc Sustainability Report 2008
3. Fred R. David, Strategic Management concepts and cases, 2007, 11th Edition,
Pearson Education International
25
Related Documents