1 | Page Acknowledgement I Dedication II Abstract III List of Tables IV List of Abbreviations V ……………………………………………………………………………………………………… Table of Contents Chapter No. 1 ................................................................................................................................................ 4 Introduction ................................................................................................................................................... 4 1.1Introduction: ......................................................................................................................................... 4 1.2Objectives: ........................................................................................................................................... 7 1.3Conditions to be the SME: ................................................................................................................... 8 1.4 Significance of the Study: ................................................................................................................... 8 1.5 Organization:....................................................................................................................................... 8 Chapter No.2 ................................................................................................................................................. 9 Literature Review.......................................................................................................................................... 9 2.1 The SME’S Performance in Pakistan: ................................................................................................ 9 2.2 Organizational Learning: .................................................................................................................. 10 2.3 Technological Innovation: ................................................................................................................ 14 2.4 Entrepreneurship skills: .................................................................................................................... 18 2.5 Marketing activities in SME’S:......................................................................................................... 21 2.6 The Financial resources: ................................................................................................................... 22 Chapter No. 3 .............................................................................................................................................. 24 Methodology ............................................................................................................................................... 24 3.1 Introduction: ...................................................................................................................................... 24 3.2 Research Design: .............................................................................................................................. 24 3.2.1 Nature of the Research: .............................................................................................................. 24

Welcome message from author
This document is posted to help you gain knowledge. Please leave a comment to let me know what you think about it! Share it to your friends and learn new things together.
Transcript

1 | P a g e
Acknowledgement I
Dedication II
Abstract III
List of Tables IV
List of Abbreviations V
………………………………………………………………………………………………………
Table of Contents
Chapter No. 1 ................................................................................................................................................ 4
Introduction ................................................................................................................................................... 4
1.1Introduction: ......................................................................................................................................... 4
1.2Objectives: ........................................................................................................................................... 7
1.3Conditions to be the SME: ................................................................................................................... 8
1.4 Significance of the Study: ................................................................................................................... 8
1.5 Organization:....................................................................................................................................... 8
Chapter No.2 ................................................................................................................................................. 9
Literature Review .......................................................................................................................................... 9
2.1 The SME’S Performance in Pakistan: ................................................................................................ 9
2.2 Organizational Learning: .................................................................................................................. 10
2.3 Technological Innovation: ................................................................................................................ 14
2.4 Entrepreneurship skills: .................................................................................................................... 18
2.5 Marketing activities in SME’S: ......................................................................................................... 21
2.6 The Financial resources: ................................................................................................................... 22
Chapter No. 3 .............................................................................................................................................. 24
Methodology ............................................................................................................................................... 24
3.1 Introduction: ...................................................................................................................................... 24
3.2 Research Design: .............................................................................................................................. 24
3.2.1 Nature of the Research: .............................................................................................................. 24
2 | P a g e
3.2.2 Descriptive Research: ................................................................................................................ 24
3.2.3 Quantitative Research: ............................................................................................................... 24
3.2.4 Type of the Investigation: .......................................................................................................... 25
3.3 Theoretical Frame-Work: .................................................................................................................. 25
3.4 Generating the Hypothesis: ............................................................................................................... 26
3.5 Questionnaire Survey: ....................................................................................................................... 26
3.5.1 Questionnaire Design: ................................................................................................................ 26
3.5.2 Questionnaire Details: ................................................................................................................ 26
3.5.3 Measurement and Scaling: ......................................................................................................... 27
3.6 Population and Sampling: ................................................................................................................. 28
3.6.1 Population: ................................................................................................................................. 28
3.6.2 Sampling: ................................................................................................................................... 28
3.6.3 Unit of the Analysis: .................................................................................................................. 28
3.6.4 Study Setting: ............................................................................................................................. 28
3.7 Data Entry and analysis techniques: ................................................................................................. 28
Chapter No. 4 .............................................................................................................................................. 29
Results and Analysis ................................................................................................................................... 29
4.1 Reliability Analysis: .......................................................................................................................... 29
4.2 Descriptive Statistics: ........................................................................................................................ 30
4.3 Correlation: ....................................................................................................................................... 32
4.4 One Way ANOVA: ........................................................................................................................... 35
4.4.1 One Way ANOVA (Age Group): .............................................................................................. 35
4.4.2 One Way ANOVA (Industry Wise): .......................................................................................... 37
4.4.3 One Way ANOVA (Education Wise): ....................................................................................... 39
4.4.4One Way ANOVA (Annual Turnover): ...................................................................................... 41
4.4.5 One Way ANOVA (Location): .................................................................................................. 43
4.5 Independent Sample T test: ............................................................................................................... 45
4.6 Regression: ........................................................................................................................................ 49
4.6.1 Model Summary:........................................................................................................................ 49
4.6.2 ANOVA: .................................................................................................................................... 50
Chapter No. 5 .............................................................................................................................................. 52
Conclusion Limitations and Implications ................................................................................................... 52

3 | P a g e
5.1. Conclusion: ...................................................................................................................................... 52
5.2. Limitations: ...................................................................................................................................... 53
5.3 Future Implications: .......................................................................................................................... 53
References: .................................................................................................................................................. 54
Appendix ................................................................................................................................................. 64
4 | P a g e
Chapter No. 1
Introduction
1.1Introduction:
The small and medium enterprises are becoming symbol of development in this
era for every country in the world, and the SME’s is contributing for improve better employment
rate, increase level of income and helps to decreasing the level of poverty in many countries of
the world. In Pakistan the SME’s was established in the decade of 90, it was too late due to lack
of interest in this segment of old governments. But in this era our governments are committed to
make strong and better SME’s sector than past eras in Pakistan. So the Pakistan government
established “SME’s Bank”, this bank provide loan and financial support to them (e-g ABD,
World Bank ILO, UNDP). This bank made by Pakistan government with the help of World
Bank. A big issue is in Pakistan the SME’s data not sufficient for making an authentic policies or
we can depend on this data and appoint limits and policies there, we have only one source or
means for collecting data “Census of establishment”(Government of Pakistan, 1988)& directory
of industrial establishment (Government of Punjab, 2002).For the SME’s the Punjab University
took a survey in the year 2003, “Gauge the health” for this segment, during this activity team
took the data from 651 different industries were executing in 10 districts of Pakistan, and the
small and medium enterprise’s share was 50% in the whole industry of Pakistan (Government of
Pakistan,1988). This research has different questions about the performance of the small and
medium enterprises consist of different elements of owner and industry. This activity recognized
the different variables those were impacted on the health of the SME’s (Khan and Rocha, 1982;
Ibrahim and Goodwin, 1986; O’ Regan et al, 2005). The purpose of this research activity was to
judge the relation among the entrepreneurial and the health and waste of the SME’s (Raja, 2004).
First of all keep it in your mind and understand without research any organization could not find
new advantages of edge or not able to earn sustain profit. Why this research is necessary the
answer is continually change in the taste of the customer than past eras, How a company can
attain competitive advantage the answer is the company sources and way of research about the
your target market and competitors, after that on the base of your resources and allocation of all
means within SME’s you able to take competitive advantage if you face competition in the
market (Makadok, 2001). In world the business of small and medium enterprises has long past

5 | P a g e
about providing services locally people and this is a chance for them (Merrilees, 2007). The
SME’s has large contribution in the economy of every country in the world may it is developing
or developed. Pakistan is a developing country, So in Pakistan the SME’s can spread its roots in
the depth of industry sector effectively, and this sector is enough suitable because its budget not
in large amount than large industry required, the reason of this matter in Pakistan the average
class has high ratio than upper class(Gilmore et al., 2001). In Pakistan the environment enough
good and favorable for SME’s, but few hindrances also existing here like lack of advance
technology, new way but cheap method of production not avail as compared to the developed
countries(Dangayach and Deshmukh,2005). In Pakistan the SME’s executing under the SMEDA
it is monitor by ministry of industries and improved the segment of SME’s in Pakistan. The IT
system and its knowledge necessary for SME’s sector in Pakistan, Pakistan located in South Asia
the IT system much better roots here than other industries are existing(Pasha,2010). A good luck
for Pakistan is here people have good abilities in IT sector and they have expertise in this
segment. The IT sector gives lot of authentic solutions for many different types of industries
frequently like for banking sector, retailers, departmental store, medical transcription utilities and
insurance applications (PASHA, 2010). They are doing good job in Pakistan reducing poverty
rate, decreasing unemployment and bringing the economic stability (PASHA, 2010). If
developing countries focus and do something extra than past then it can be solved different
problems faced by the general public here, it can reduce poverty and decreasing the
unemployment rate (Randall, 2000; Salzer-Morling and Strannegard, 2004). The THINK
TANKS of Pakistan have positive think about this sector that it is useful for our economic, So
“SAARC” countries are making many policies seeing importance of the SME’s, on the base they
can enhance this segment over the South Asia and taking lot of benefits. Even Pakistan pay good
and sufficient attention on this sector then we can increase our export and increase GDP. But in
Pakistan the issue is the Government not pays proper attention on it, many issue can existing
there, but the major issue is well established industries are working in this country. In
October,2005 Pakistan have no any source of plan and no available any mean to established
infrastructure for the SME’s with strong and effective shape, and not able to make any useful
policies by government for this sector, and we have not tools for check and balance performance
of the SME’s(Abimbola and Kocak, 2007; Krake, 2005). It’s an understood thing the decision
making a vital part in every organization it may large and small industry, therefore all success
6 | P a g e
depend upon on right decision making if you are not able to make good decision according to
situation then you will fail in future it will be not possible then your top management has not
ability to make authentic decision(Brodbeck et al, 2007).This issue seems like not a necessary
hindrance in those companies where director and higher management not qualified, but results
and outcome they will get in future(Perr et al., 2007). The support of the financial loan from the
different institutions is very useful for the small and medium enterprises; through to this help
they could grow and become useful segment in the sight of economy of a developing country
(GFPI 2011). McKenzie (2010) did a research and gives different indicators that the financial
loans have very important role in small and medium enterprises sectors. Gertler et al. (2011) give
an effective detailed information and infer completely that the impact of financial loan have
positive on the technology and way of producing goods like other large and rich industries doing
in the world . Bauchet et al. (2011) said that the informal financial support and loan to poor
SME’s owners a good step for them and for the economy of the developing countries provide an
excellent. Winters, Salazar, and Maffioli (2010) gives different arguments the effect of small
loan and support to small and medium enterprises owners in the field of agriculture enough
useful. The latest search tells to us that in this era women too much taking interest in
entrepreneurship and become partner as manager in many enterprises [GCU, 2004]. The SME’s
now making engines of petrol and diesel, instruments of machinery, the human operating
instruments, fans and other small good, this industry was executing at the time of separation of
Pakistan and India [Kibria, 1998]. But this industry lose its performance day by day in Pakistan
small and medium industries, therefore only the lack of skilled full management and not have
good experienced for run this segments in this region (Aftab and Rahim, 1986). Few methods of
production in an effective can impact strongly and giving a bright future as a survivor for
developing of the SME’s in Pakistan sector [Aftab and Rahim, 1986]. Many different enterprises
has lot of different links internally and externally on the base of these links they could not get
success and stability for long term in every industry, but the government policy and support can
established in a proper way[Staley and Morse, 1965]. They should have and careful about the
license for import for the latest technology, raw materials, and ability to purchase low price
machinery, and the power of purchasing raw material all of these good for the health of the small
and medium enterprises also directly favored to large industry too [Ahmed, and Amjad
1984].The best examples of ITTEFAQ steel industry of LAHORE this firm putting capital

7 | P a g e
intended to investment in small and medium enterprises beyond the future and focus on combine
economic benefits for the best for business[Aftab, 1985]. If we say that the small and medium
enterprises contributing for the development of the economy of any country in this era and give
more opportunities for the jobs to the people and reducing the unemployment, and improving
overall economy not a single sector [Aftab and Rahim (1986), Berry, et al, (1991)].The WTO
give relaxation to the Pakistani small and medium enterprises especially and decreased the
exports duty and tariffs, these are bigger challenge for the Pakistan SME’s sector[Berry, 1999].
The SME;s sector in Pakistan adopting the latest technology and going on the peak particularly
in the field of engineering, and appointing new and latest innovative technology [Aftab and
Rahim, 1986 ].There a need of significant policy it is create a equally balance in the middle of
small and medium enterprises, and both of industries could get useful benefits from this policy
[Fransman, (1984), Rosenberg, (1982)]. The approach of finance it is lead only limited group,
this is not good for the health of small and medium enterprises (TAF, 2001).
1.2Objectives:
How government policies play an important and useful role in small and medium
enterprises in Pakistan.
How government can reduce the risk of loss, if entrepreneurial shows willingness to
investment money in the small and medium enterprises.
How government can interact to stake holders that the small and medium enterprise is a
profit able sector for them-selves.
How entrepreneurial feel happy if they agree to take interest in small and medium
enterprises, and also start invest the money that they will be run this business without risk
and fare.
How marketing activities can play a vital role that local customer get necessary
information about the small and medium enterprises in Pakistan.
How skillful management have a key role in this segment and able to push the small and
medium enterprises on equal level for contributing in economy of Pakistan.
How skillful management improves the performance of the small and medium enterprises
that our product can compete international market.
How technology improves our SME’S information and production system.
8 | P a g e
1.3Conditions to be the SME:
(a) In the case of the enterprises engaged in the manufacture or production of goods pertaining to
any industry specified in the First Schedule to the Industries (Development and Regulation) Act,
1951, as—
(i) a micro enterprise, where the investment in plant and machinery does not exceed twenty-five
lakh rupees;
(ii) a small enterprise, where the investment in plant and machinery is more than twenty-five
lakh rupees but does not exceed five crore rupees; or
(iii) a medium enterprise, where the investment in plant and machinery is more than five crore
rupees but does not exceed ten crore rupees;
(b) in the case of the enterprises engaged in providing or rendering of services, as—
(i) a micro enterprise, where the investment in equipment does not exceed ten lakh rupees;
(ii) a small enterprise, where the investment in equipment is more than ten lakh rupees but does
not exceed two crore rupees; or
(iii) a medium enterprise, where the investment in equipment is more than two crore rupees but
does not exceed five crore rupees.
1.4 Significance of the Study:
The significance of the study means the uniqueness of the research
in this study we carefully find-out the relationship of the different variables like the marketing
activities, technological innovation, learning activities, financial factors and the entrepreneurial
skills with the performance of the SME’s in the Southern Punjab and also check the most
important for the growth of the SME’s in Pakistan.
1.5 Organization:
The remaining thesis is completed in the following manner:
The Chapter 2 provides the comprehensive and detailed literature review of the different
variables While the Chapter 3 provides the methodology used to analyze the whole research. The
Chapter 4 provides the detailed analysis of the research which includes the reliability and validity
analysis, descriptive analysis, correlation, independent t-test, one way ANOVA and the
regression to analyze the whole research. The Chapter 5 includes the conclusion, limitation,
future implications and the managerial implications of the whole study.
9 | P a g e
Chapter No.2
Literature Review
2.1 The SME’S Performance in Pakistan:
In the world good and wise countries have
knowledge about the importance of the SME’s, and they are performing many activities for
stable this sector in their region. So Pakistani government took initiated in the 1998 and created
infrastructure under shadow the “SMEDA”, further tool step and made a bank with the help of
“WORLD BANK”. Now the united nation in the world are making policies and developing this
segment and took step by International Labor organization realized the popularity and increased
its contribution in the economy from last half decade (Bhutta et al; 2007).Few reports avail about
the structure of the management in Pakistan’s small and medium enterprises that here the owner
way of thinking rather different the manager of SME’s (Kureshi et al; 2009). A study pay
attention and can influenced to rebuilding SME’s sector (Saunder et al; 2008). Lot of things are
becoming impedes for improving the SME’s sector, the most important thing we can’t denied
from it that is lack of availability scientific data(Bhutta et al). In the year of 2006 and 2007 these
couples of years the SME’s provided low quantity scientific data (Bhutta et al; 2009). Any type
of product the customer require and quality, accuracy, durability and need outstanding
performance from its single product, customer purchase a product from the store and showroom,
and attached some expectations with this product before purchased (Allen;2006). There a good
sign that we are using TQM 22, 3318 it’s a world class and standardized level of quality in
production business in this region, but here the level of quality decreasing day by day and low
quality of products producing in this segment, this is liability of department of “SMEDA”. Some
experts said about the future of SME’s in Pakistan that segment has bright future here in coming
days Brodie et al. (2008). You can check SME’s performance in Pakistan through its ratio of
export it is near about 5% only. Many problems and hurdles faced by SME’s in Pakistan, but an
important hurdle is the poor quality of raw material for production goods (Coviello et al., 2001,
2002). An economic survey conducted by experts in 2005 about SME’s that in Pakistan the
environment suitable for this sector when outcomes of this research tell to us the SME’s sector
can easily put its roots here and become a well established department or sector, if Pakistan
10 | P a g e
improves all of these weakness then the performance of this sector surly better than its past
performance.
2.2 Organizational Learning:
In the world many countries has awareness about the
importance of the SME’S, it is can make better and strong economy of every country
(Tambunan, 2009). They have knowledge if they established this segment and made useful
policies then they can take lot of benefits regarding to development of their economy. So
Pakistan same like other countries surviving in this segment since from last 2 decade and the
year was 1998, When Pakistan took initiative for this segment that was year Pakistan made a
bank with the help of ”World bank”. For encourage SME’S segment in those countries where
this segment are growing slowly especially in developing countries and these countries owner of
suitable environment for SME’S, these countries taking support from many worldwide
organizations Asian Development Bank, International labor organization and other many
organizations executing role for enhancing this segment in the world (Brodie et al., 2008;
Coviello et al., 1997, 2001). The purpose of all these efforts for making SME’S healthy and
sharp (Bhutter et al; 2007). Experts said and also giving suggestions for improving this segment
that how u can improve your SME’S in your country, They mention 3 useful tricks and points if
different Government of the world apply all of 3 tricks in own country, then it can get wonderful
results by Pakistani Government. 1)The Government providing support to entrepreneurial and
managers of SME’S how they can improve their SME’S and execute to them effectively, and
provide help to them directly who have no experience for executing SME’S in accurate
way(Carson and Cromie, 1990; Gilmore et al., 2001; Hogarth-Scott et al., 1996). Redesign their
old process they are using in SME’S (Manning, 1998; Oey, 1998). The Government should
encourage those entrepreneurial who are taking interest in exports, The Government should give
relief to them and providing significant awareness regarding to international market, give to them
new policies through to this they able to face foreigner competition with own production. 2)
The Government should provide all those services that are requiring in Pakistan, same other
developed countries providing to their entrepreneurial (SME’S sector). But seeing the Pakistani
environment it is easily adjusting there. 3) The main and important issue is we have no an
authentic way to understand ups and downs of International market sand what is right and wrong
for us if we want to go in this market, Pakistani Government should provide assessment to their
11 | P a g e
Entrepreneurial for International market’s related knowledge and news through establishing
institute those provide every information and training about the International Market atmosphere.
4) The Pakistani Government should focus on SME’S policies made by other developed
countries like U.K and U.S.A. There we have been gotten some useful results of different
research (Crik, 1992), in the world several governments focused on services segments forcefully
rather than production, even service segment have no need for export into next country. This
segment cannot take place of exporting products, doing by few developed countries like U.K and
U.S.A (Crick and Cninkota, 1995).Both countries made policies for SME’S in 1995 at the time
they took decision that providing support to the SME’S in their sector particularly that segment
of the SME’S it was consist of exporting. There researchers founded that some elements are
belong to impact of adopting help about the exports segment in the SME’S and have knows
importance of government made policies for service and also progress of export segment(de
Chernatony, 2001; Kessler, 2007; Opoku et al., 2007). Another study found about England
region it was conducted from the North and called Northeast, There policies for SME’S made by
Government but all of these consider not enough for SME’S, and help for the entrepreneurial not
enough or not able to motivates themselves for SME’S, this is impede in the way of developing
of SME’S. And not supported to entrepreneurial that they take interest and play vital role in this
segment and make healthy and stable the SME’S in this region of England (Atherton and Sea
1997).But in Pakistan the Government not executing useful policies those enough for stability of
SME’S, if the Pakistani government sincere with this segment then our SME’S will give good
result and we can contribute on large scale in this segment. Our SME’S sector can compete with
U.K and U.S.A’s products (Gilmore et al., 2001; Hogarth-Scott et al., 1996). Our government
should learn and copy policies from the upward both countries and make policies who matched
with international standard. Again I show you previous example where the export rate of SME’S
rather better regarding to support of government, in Northeast through the support of government
the export rate 5 to 3%.This percentage of export the result of England government policies
Carson and Gilmore (2000). There in Pakistan the people have not sufficient awareness for
SME’S, and they have no lot of money on the base they can take risk and can invested money in
SME’S (Datta et al., 2005, p. 69). This is occurred only lack of guidelines and lack of
information and government unsuccessful for attract and safe to the entrepreneurial money, this
is only lack of good policies, lack of government support and lack of encouragement this
12 | P a g e
government should give to them, because our country is a developing country(Abimbola and
Vallaster, 2007; Merrilees, 2007; Ojasalo et al., 2008) . We can say in short in Pakistan not exist
an authentic infrastructure for SME’S (Krake, 2005). The main issue with our government is lack
of resources. So the government should change the policies and can allocate our resources with
effectiveness by Pakistani govt. The government should make new and particular plans seeing
situation SME’S, these consist of purely for export segment. While the SME’S not about of any
single industry it is included in many different industries (Teaser, 1977). The new program and
policies may be more effective and beneficial for us and our SME’S sector can get more
stability. The government should deeply evaluation and can take deeply overview what are
hurdles faced by SME’S. After that the government able to recognizing what is requirements
need for making a healthy SME’S for exporting front of foreigner competitors (Crick; 1997;
Moini; 1998).At the end of many researches the result of research was the government should
pay attention on latest and new policies for developing SME’S sector particularly consist of
export related SME’S(Kabanoff, 1991). Our government should focus especially on those
regions and provide support where we can become more stable and can compete to any country,
Where resources avail on high quantity on cheap rate i.e. in Pakistan the clean water have lot of
quantity, if we try and produce fishes without sea water, then no doubt we can contribute in our
economy through to this segment easily Mohr and Spekman (1994). Many developed countries
take initiate in SME’S from the export product industry, but these countries made their SME’S
industry on those regions where from they easily send their products ahead like they build
SME’S near the port or airport (Moini; 1998).The SME’S can improve by our government
through using different tools like redesign structure and compare with developed countries
SME’S policies for SME’S. So Pakistani government should support with big heart and
encourage to all entrepreneurial for SME’S and should make short time policies (Das and Teng,
2000). First the governments deeply observed what needs of SME’S in this country are? And
then provide all things require for this sector in this region (Tambunan, 2009). The government
should appoint high qualified experts for this sector who have lot of information for SME’S. And
polices will be made by economic experts and they guide to SME’S experts at the time of
making policies (MacNeil, 1985). After all this process we can get accurate and positive results
from it (Miles et al., 1992. Many research’s results I conduct in this LITERATURE REVIEW, if
the government want to enhance this segment successfully then it should be focus on making

13 | P a g e
useful policies and secondly pay attention on export segment in this sector. There many debates
and researches available done by developed countries like U.S.A and U.K, The system if we
convert into internationalization without good policies then the consequences not good and we
will be fail in future, for this purpose we have to make policies and execute locally, if these
policies getting good results then we putt step forward in export in the SME’S sector. But in
Pakistan we have don’t enough good the level of SME’S and how we can convert SME’S into
internationalization. So we have to take sharp and useful decision for improving SME’S on local
level. If we focus on export segment then you will put extra attention and efforts in SME’S
sector(Bilkey;1978;Cavusgil;1983;Crick;1992;Ginkota;1982;Moini 1998;Naida and Roa;1993).
Further more in the world many developed countries set some targets seeing government polices
and they attempted to achieve them, after government agree to provide all support and give help
for next they can enhance SME’S in future (Canon; Wills ). In Pakistan the government should
conduct a research and putt different questions in it about the different policies made by our
government for SME’S and also taking response from the entrepreneurial and managers through
to these questioner before the implement of these policies in our region for SME’S. When this
search will be complete then seeing its result and all policies will be making seeing all policies
not exceeds to them (Gankem et al; 2000).Few impedes can stop the development of SME’S like
the lack of sources and what time is require for any process in the SME’S. There we show some
maturity and should use our experience that how we can handle all of these problems with good
wise. How we can manage if a demand suddenly increase for an item in the market it is relevant
to the SME’S, in this case the time is a big issue what type of policy and logic we should to make
there(Badrinath;1994;)JSBED 14,166. We should make a department that control the export
segment in the SME’S effectively, and this department reshape the export department and
appoint and set standards those are acceptable in this sector. If we get success and established
this type of department in Pakistan for SME’S then we can compete with foreigner small and
medium companies (Kinyanjui & McCormick, 2009; McCormick et al., 2007). This department
does focus only on export segment in SME’S then performance of the SME’S will improved day
by day. The government should introduce a fast mean of convey the message and policies for the
target audience it may consist of direct or indirect, and this message full of information and in
simple process and every one can understand easily, then the result of this campaign can be
14 | P a g e
good, and government should make a department that funding to different small and medium
enterprises (Kettenger; 1994).
2.3 Technological Innovation:
We can check here many proofs about the use of technology in
SME’s sector for creating innovation and novelty, and these innovations are symbol of success in
this segment and key of sure achieved accomplished goal set by SME’s (Hoffman et al, 1998).
Even this ability of innovation push to SME’s on top and feasibility of success must be come,
SME’s rely on this segment ,sources, pay attention on it, physical worth last one the atmosphere
in the business is executing(Burrone and Jaiya 2005). Especially in this segment the production
process is much difficult under in various determinants (Becheikh et al. 2006). Many studied tell
to us the electronic data interchange system only used in large industry, and this god and suitable
for only big industry not for SME’S. But now if we use EDI in SME’S then we can take good
results and may improve SME’S sector effectively. So we need to understand how we should
introduce this method EDI in the SME’S and can get benefits, what is process should be use for
introducing the EDI in SME’S, then if we putt efforts in SME’S in result we can get only
positive outputs(Blattberg and Deighton, 1991; Kessler, 2007). In SME’S the first barrier is weak
infra structure of the information system, if your communication source not good and fast then
your performance will be impacted. Many issues for adopting EDI we are facing lack of interest
of employees they are not ready to leave old methods and manual system, if we conduct training
and providing learning opportunity then may they can reduced their hesitation about EDI(Cragg ;
Zinatelli 1995).
Even in SME’S sector in accounting department the computer is using frequently and for this
department has no objection by any one in SME’S this is also advanced thing not old means of
managing accounting record (Heikkila et al.1991).But old way of using now has been replaced
with new methods of technology before last several years in SME’S sector. This is understood
thing that the SME’S sector has improved after the implementation of new
technology(Dall’Olmo Riley and Lacroix, 2003) .The EDI is already using in accounting
department it is proof the SME’S sector have little bit confidence on EDI, this will be enhance in
future and if it is possible then the results also increase, but the way of using of EDI on low scale
in developing countries like Pakistan than developed countries where this technology a basic and
common thing for success of small and medium enterprises, the first reason of this difference is
15 | P a g e
lack of awareness in developing countries about EDI, the second reason is SME’S have limited
budget so they cannot afford new technology due to its high cost for appointing in this sector, the
third reason is the SME’S owner and manager think if we appoint EDI and spent money on this
system may be its not work properly due to uncertain reasons and it become reason of waste of
money and time, this type of risk exist in the mind of them that’s way they avoid EDI in their
business for executing(Cheung; Lam; 1995). Further the SME’S have no any big customer like a
large industry retains. So before adopting the EDI in SME’S we should take complete view of
different regions of SME’S in which EDI is execute and measure its performance, after we have
to make an authentic infra structure for our SME’S sector(Ind and Riondino, 2001). If we adopt
EDI without observing other regions then we can face harsh situations. The EDI is working
totally different in large industry and in SME’S according to its size and nature of work (Hung
and Li, 2007). For adopting EDI in SME’S we should compare all segments with large industries
customer wise, cost wise, nature of business and Location wise then seeing the results of this
comparison and make decision on the base of this comparison Opoku et al. (2007).
The EDI’s influence on large industry since from last decade with force on demand from the
large industry management not in small and medium enterprises (Premkumar; Rammurthy ;1997
and Massetti; Zmud; 1996).But some experts conducted different researches and observed how
many SME’S industries has been adopted new technology, hats is its ratio (Lacovou;1995).The
purpose of both researches are judging the impact of EDI in small and medium enterprises and in
large industry, for this purpose they took response to both industries employees through different
method and conducted surveys and through questioner what they thinking about the
EDI(Grandori and Soda, 1995). After this few researches conducted by different experts
performance of different industries but one by one and see difference among those industries
those adopted EDI and IS, and also took view of those were not adopted EDI and IS system (Das
and Teng, 1998; Grandori and Soda, 1995). But one thing is there may be the use of EDI in this
sector due to rich owner or May he has lot of information about EDI, may he residence of
developed country than developing(Das and Teng, 1998). So conducted any research we have
must overview of all situation and environment of selected industry (Woolthuis et al., 2005).
Even these results not enough for making any conclusion about EDI ,we need a proper
infrastructure and that give us authentic results and way of action for making useful policy that
how we can appoint in SME’S and can bring a revolution in this sector like we brought in large

16 | P a g e
industry in past(Dhanaraj and Parkhe, 2006). The big problem we can’t get separate research it
was consist of only SME’S not on both small and medium industry or large industry, because
from the mixed research we could not exact data and not observed how EDI can be good for
SME’S(Hoffmann and Schlosser, 2001). In 1990 the different researches took a start through
asking questions in questionnaire, and after measure the response of respondents, then they able
to providing sufficient help to the SME’S for putt foot ahead in EDI Ngugi et al. (2010). This is
reality for introducing new technology in SME’S rather difficulties that was time, because many
problems existed in the way of adopted EDI (De Jong and Vermeulen, 2006). First of all we
searched problems those stopped the way of EDI in SME’S ,if it was find out successfully then
we could appointed EDI in SME’S sector without any impede faced by SME’S and made
policies those providing help to SME’S sector for introducing EDI(Batterink et al., 2010). This
research was incomplete for adopting new technology in SME’S sector not good sign for
researchers, those were spending efforts for this (Lacovou; 1995).The main three elements
focused by any organization for adopting any new thing in its industry;
Organization readiness
External pressure
Perceived benefits
The size of target market should be not enough small for SME’s, they should included 7 different
SME’S in this research Rubin (1990). Through to this act if they increased sample before
conducted the research then result will be accurate and exact (Pfeffer and Salancik, 1978), after it
should be used accurate and authentic method for collected data from two hundred sixty eight
small and medium enterprises Mohr and Spekman (1994).
If researchers get good and useful result then they able to influenced to entrepreneurial that they
take this system and should apply in your industry after this your results of SME’S output will be
increased (Chouelos; Lacovou 2001).The willing companies more excited after adopted this
system in their sectors about SME’S (Dahl, 1957). The EDI system rather beneficial in many
developed countries, they are taking lot of benefits from this technology in their business (Blau,
1964). In Hong Kong the SME’S sector directly using this system in many different segment.
The numbers of these segments are 575, this is a huge ration and this segment rather developed
than those are not using EDI in their business (Provan et al., 1980). The world in converting into
global village and every field of life is adopting new and latest technology, So the SME’S sector

17 | P a g e
knows the importance of the new technology seeing competition and want to better and strong
place in SME’S sector in different segments (Raymond and St-Pierre, 2004). The government
should support to them in this system and give complete help for adopting EDI in this sector
(Oliver, 1990).. Now Hong Kong adopted new technology in SME’S sector increased from 575
to 644,there they see only future benefits with expected cost, they careful about their business
what need of its business they will served and execute with easily, and get benefits and they also
made relation with government at the time of need they demand help from government. For
developing countries like in Pakistan they should this technology in small portion of the SME’S
sector and evaluate performance of this system if u getting success and performance better than
old method then you should apply this system on your whole business (Pfeffer and Salancik,
1978).
Different researchers tell to us what are elements we should take on the base we increased
pressure on the SME’S that they show their willing to adopt EDI there (Sutcliffe and Zaheer,
1998). All of these studies about the EDI this was depended on case study techniques; this is a
better and useful way but hypothesis more accurate than. There few problem exist and we can
interpreted to them clearly the reason is the big size of population (Dhanaraj and Parkhe, 2006).
So we should arranged more researches with carefully and practically then we able to generate
valid and accurate statically data. The error was in last researches conducted by different
researches focus globally not only on Asian countries (Park et al., 2002). If the SME’S adopt
ISO in their segments then first priority is future benefits and development of SME’S like the
large industry captured now in the every region of the world, it is possible then when SME’S
have believe in EDI and IS for their businesses, current era if we say this is consist of latest
technology then we can say absolutely right (Gulati and Singh, 1999). If we focus on benefits
and our consideration after adopting the EDI those we can take in future, then the SME’S sector
ready to adopt this technology without any hesitation in their segments(Chwelos;2001).The
benefits of appointing the new technology in SME’S, that you can improved your working
capacity of employees and results of your input will be accurate and exact your cost must be
decreased, and the other hand you can get benefits indirect that your employees communication
rather fast with your customer than in past they have. Many researches done different studies
with the help of variables those relevant to the latest technology and it was improving with the
passage of time (Premkumar; Ramamurthy; 1997).Furthermore two experts done a research
18 | P a g e
about the latest technology that different values and advantages are attached with adopting EDI
in SME’ sector, So they can insist to entrepreneurial that they take interest in new and latest
technology (Moove; Benbasat; 1996).
A expert build a structure for adopting new technology about information and data collecting in
SME’S, in which he focused only on expecting benefits after adopt this system any SME can get
from the system it is consist of latest technology, So the SME’S owners and managers want to
improve this sector they should introduce in every department IS ,due to this all departments
works better than old methods they can share information and discuss every matter when they
want to do share or having need for it. Therefore, the entrepreneurial thinking about it in Asian
country seeing its expecting advantages and benefits those are linked with every new
technology(Chwelos ;2001).If you will accept this system in your small and medium enterprises
then you’re working process will be enhance by functionally and cost will decreases. If goals
multiple in any SME’S then you have to work on multiple direction for completed and achieve to
them, So for multiple direction the company should adopted innovation or new technology. The
multiple goals force to them that they hire different people in their SME’S, So for handle
different goals in every department they need latest technology for completed every single task
accomplished .If in chain of departments single department not use latest technology, then it can
impacted badly on overall performance of that act we organized for achieving goals. The
selection of IT must be moveable and ease to use for employees(Gani; 1992).Because the new
technology will be more feasible and ease to adopted, if the SME’S performing multiple goals,
and every goal need different tool for completing its function. An expert deeply done a research
about the multiple goals set by SME’S till to end (Harris; 1999), we have concern about the
different aspects of advantages in future we can get in SME’S.
2.4 Entrepreneurship skills:
The different researches say ,in SME’S an unavoidable able
error is lack of managements expertise skills for managing many significant process there, due to
insufficient skills for managing different functions executing in this sector(APEC, 1999). If the
department in SME’S not running by experts people, those can’t see beyond the future and not
able to diagnostic harsh problem for the health of SME’S in Pakistan, then how this segment can
developing there with healthy environment. For running every department we need experienced
and expertise people .In Pakistan the recruitment system of many large and SME’S not like
19 | P a g e
developed countries (Tambunan, 2009), where every employee do the job according to its
qualification not other differ department, but there we see opposite situation a financial qualified
person doing the job in HR department and a marketing specialized person is doing in finance
department, then how this firm can work properly. So removing these wrong recruitments
stopped by an expert manager and entrepreneurial in SME’S not that person who not knows
about it (Syahrir, 1986; Rusdillah, 1987).
The entrepreneurial involvement in management decision a reason mismanagement in SME’S
,because mostly the owners of SME’S has no internal knowledge but they interrupt and shows
their ownership and authority, then the balance of this sector going to loss. The entrepreneurial
have must information and knowledge about the SME’S, how they can executing to this in
effective way, if they have knowledge for SME’S then make useful and exact plans for this
sector and can implement very well(Manning, 1998; Oey, 1998). So after this the run plans and
set direction for achieving all task and goals they made in the start, the key of success in now
days in SME’S sector that is every owner and quiet his down another person his involvement not
limited in this sector griped sufficient skills for controlling management in good way
here(Temtime;2001).A expert manager has ability to collect data about target market or any plan
,after it he evaluate deeply to this, and will take analysis with critical sight then he organized any
plan and policy after this process, so chances of failure of this plan enough low (TAF, 2001). If
we take view of different research then we can observed the entrepreneurial have not significant
knowledge related to management in SME’S they only invested money into it. They use and
appoint immediate policies and plan, they not made any contingency plan for achieving
goals(Temtime;2002),so results not regarding to expectation, the lack of expertise and
experienced .Some suggestions given by experts to the entrepreneurial those plan’s ratio is
252,in which they were giving counsels to entrepreneurial that you should make different
policies for internal stockholder like employees, and second policies you separately prepare for
external stakeholder only, Therefore different policies for internal and external then you can
easily executing your plans that you made for achieving goals for maximizing your
profits(Loecher, 2000).
The lack of expertise skills in this sector’s head of department, so they take much time to solve
these problems those are not enough complex problems regarding to time taking by the heads
(Krake, 2005; Storey, 1997; Wynarcyk et al., 1993). Such owners or manager not execute and
20 | P a g e
runs their small and medium enterprises in smooth way like a qualified and experienced manager
can handle problems in this sector with good way (Carson and Cromie, 1990). Different
techniques and tools can handle and reduced the chances of failure in the small and medium
enterprises, the manager should to knows these techniques then the government providing to him
opportunity for learning these skills, and established institute where from they learn new and
latest knowledge about runs the small and medium enterprises with confidence in this sector. A
entrepreneurial and manager of the SME’S can make its firm more developed and good through
making good relation with internal and external stakeholder for long term. In Pakistan the small
and medium enterprises are facing many issues like the HR and second one is poor infrastructure
of SME’S, if HR department is sharp and qualified then all recruitment will on the merit and then
every employee do the job on right time on right place Mason (1996, p. 91).
In Pakistan we have need of such people who hard working, risk taker, immediate decision
maker and ability to lead the people with good confidence this is issue for entrepreneurial and for
manager hiring the new personnel in small and medium enterprises(Aldrich; Langton;1997).This
is understood thing if the entrepreneurial and managers are skilled then they monitor to all
employees and also say to head of departments, that they evaluate performance of their
coordinates and report to him about all activities of personals(Patton, 2002; Robson, 2002). The
entrepreneurial can take lot of benefits if they participate in different training relevant to the
small and medium enterprises and can handle their employees in good way (Boyatzis, 1998;
Strauss and Corbin, 1998). A skilled full entrepreneurial can recruit employees effectively and
do the job as an institution for them, so if employees will be qualified and skilled full then take
interest in innovation and hardworking toward the attaining the goals set by its owners and
managers (Miles and Huberman, 2002). They follow the policies made by expert management
and focus on their jobs with good passion, if all process of production works in right direction
then the results of outputs positive and profits will be increases and cost going to reduced, when
cost is reduce then you have an opportunity for conducting training for your employees through
to this performance of themselves will be improved for future (Carney, 1990). The expert
entrepreneurial try to see target market with deeply and checkout its environment, then they
makes policies for attaining goals (Bazeley and Richards, 2000; Flick, 2006; Gibbs, 2002).
Recently, interest in supporting women’s entrepreneurship has increased among policy makers,
academics, and practitioners in Indonesia (Boyatzis, 1998). This interest comes from the

21 | P a g e
recognition that women’s entrepreneurship, especially in rural areas, will contribute to the
creation of new rural enterprises that will increase local capabilities to generate economic growth
(Tambunan, 2009).
Statistics from the National Agency for Statistics for various years indicate that women
entrepreneurs in Indonesia, especially in SMEs, have increased since the 1980s, when the
country achieved rapid economic growth leading to a rapid increase in per capita income. One
contributing factor is the increase of women’s education and the economic pressure women
faced in their households, i.e. they are “pushed” to work to earn extra income (Manning, 1998;
Oey, 1998). This filed critical decision for women because they could not leave home for long
time (Tambunan, 2009). Therefore without her who perform the house activities like make the
food and dusting and main issue who look after the Childs (Tambunan, 2009).The lack of
purchasing power of their husband compelled to them they participate in economic activities and
do the job may they have job enough far away their home (Syahrir, 1986; Rusdillah, 1987).
2.5 Marketing activities in SME’S:
An understood thing is the SME’s have different types in
marketing activities than a sequence of activities executing in many large companies (e.g.
Carson, 1990). All of these activities explained the different attitude and way of thinking
personally by the manager and owner of the SME’s (Brodie et al., 2008; Day, 1998; Kotler,
1991). May be this is showing quite personal & enhance the physically and level of the company
that have been promoted (Sears, 1990).These types of boundaries we can explain like: Lack of
sources like the shortage of time, shortage of finance, low level of skill in specialization in
specific field, the focus of manager and owner in generalists rather than in specific segment, and
use are specific sources of marketing in small place and insufficient awareness about marketing
(Axelsson and Easton, 1992; Berry, 1995; Coviello et al., 2001; Gro¨nroos, 1996; Hakansson,
1982). Further the way of marketing in SME’s can take turn according to situation and position
than a formal way of decision making, the reason of this turn the method of decision making of
entrepreneurial personally and in depended like a partnership business do (Piercy and Cravens,
1995), this is quiet personally and seeing first preferences then any decision made by owner of
the business (Scase and Goffee, 1980).
The SME’s is not adopting theoretical guideline for executing marketing activities in their
business. In SME’s the use of network shows different type of “network” are using in this

22 | P a g e
segment (Carson, 1990; Loecher, 2000). The personal interest existing in this “network” then the
limits of network consist on personal relationship (Knoke and Kuklinski, 1982), social networks,
business networks, industry (Andersson and Soderlund, 1988) and marketing networks. But an
important issue is the manager of SME’s how managed these networks and increased outputs
(Curran and Blackburn, 1994). The main purpose of network in every type of business is
achieved to a same goal in future, share information putting efforts together and exchange
technology (Dean et al., 1997). The SME’s mangers some time include the potential customer
and consumers in their networks(Donckels and Lambrecht, 1997), the purpose of this activity
they want to take their opinion for the best business according to customer needs and wants and
expectation for your product in SME’s (Hagel, 1999).
2.6 The Financial resources:
The financial institute focuses on the weak SME’s owner and
those have lack of money for run their small and medium enterprises but they are committed to
pay return money at the right time (Zeller and Sharma, 1998). Few researches (Holcombe, 1995,
Otero and Rhyne, 1994) tell that the way of giving loan on small scale has good effect on the
small and medium enterprises. This interest rates need to be much higher so that the financial
institution’s revenue can cover the total expenditure (Carson and Cromie, 1990; Gilmore et al.,
2001; Mount et al., 1993; Schollhammer and Kuriloff, 1979). The payback money by clients and
charged expense by institutions against the using money enough sufficient through to this they
able to overcome on their expenses they have been beard at the time of giving the loan (Hulme
and Mosley, 1996).Through the charged in the shape of interest a financial help (Robinson,
2003). Advantages are getting from the community the customer’s replaced with large expenses
paid by them instead of interest (Rosenberg, 1996). So the customer should be enough trained
having good expertise for making products in an effective way and can control their activities
toward the target markets, and used the means of finance they got from financial institution in a
beneficial way (Bennett, 1994). Through providing finance support and loan to poor
entrepreneurs they can corrections the system of small and medium enterprises with the help of
payment they took from financial institutions and bring change in IT system and especially they
could used for bringing new technology in agriculture segments (Hiedhues, 1995).
Main purpose of the financial support is modify and increased the way of producing in positive
way, and give help to the small and medium enterprise’s owners before to this the large financial
23 | P a g e
institution not giving to them this type of credit Navajas et al, (2000) . Buckley (1997) said and
gives advice, if you want to get more improvements in SME’s then you should have consistency
in this program and enhancing the loan for them. Zeller and Sharma (1998) both said that the
small and informal loan could make better and strong this segment, and could decreased the
poverty, infer to them this facility make their future bright and safe in the reasonable perspective.
Berger (1989) identifies the informal and small loan bring stability in their business activities
instead of enhancing the living hood of them, and give large opportunities for the jobs.
To give authority and rewards also help to become successful of an innovative firm (Chandler et
al., 2000).Competitive structure and strategic orientation are help to find the performance of a
firm that uses innovation and the firms which use risky strategies (Salavou et al., 2004). The
activities such as; market analysis, vision improvement, risk taking, strategic orientation,
acquisition of knowledge, networking, financial commitment, research & development and uses
of new technology which are adopted by innovative SMEs, included in innovative activities.
Pakistan is full of natural resources but mismanagement of government and non-government
authorities, lack of new technology adoption, negligence to pay attention in natural resources and
political instability are the reasons of poor performance of SMEs in Pakistan (Salavou et al.,
2004).
Innovation firms use product, process, marketing and organizational innovation but mostly focus
on process innovation. These types of SMEs give high priority to process innovation and give
low priority to product innovation (Chandler et al., 2000). Due to complexity and innovation
process the measure of performance to compute the innovation is too much difficult (Parker et
al., 2010). To eliminate this complexity OSLO-Mannual (2005) define innovative SMEs are, the
firms and its processes improve under a specific period of time, which take review by adopting
new technology. According to OSLO-Mannual (2005) the technological, organizational,
financial, commercial and scientific activities which we done for innovation, called the
innovative activities. Networking and benchmarking also include in this type of activities
(Terziovski, 2003; Massa and Testa, 2004).
24 | P a g e
Chapter No. 3
Methodology
3.1 Introduction:
This chapter covers all the steps involved in the completion of the research
from research design to the final report of the research, including data collection, Sample size
and area, setting of the questionnaire, setting of the hypothesis. First of all, this chapter will
identify the research nature. Then, conceptual framework will be presented. Thirdly, set up of the
research hypothesis will be displayed. Fourthly, designing of the questionnaire will be presented,
then, data collection process will be explained.
3.2 Research Design:
Research design involves the nature of the research, type of investigation
etc. This research used both descriptive research and quantitative research.
3.2.1 Nature of the Research:
This research is conducted with a combination of Descriptive and
quantitative research to measure the performance of the SME’s in the Southern Punjab.
Descriptive research is used to gain preliminary knowledge and literature about the study and for
better understanding of the research topic. Quantitative research is used to determine the
response of the respondent towards the variables of this study.
3.2.2 Descriptive Research:
In the descriptive research, it attempts to measure the performance
of the SME”s In the Southern Punjab. For the research, the preliminary literature about the
research topic is collected through different articles, academic journals, books, etc. to define the
research topic better and to develop an approach to research topic and interpreting the primary
data better. It will help to provide the necessary knowledge and secondary data to the research.
3.2.3 Quantitative Research:
Quantitative research is also used in the research. This was
necessary to collect response in measureable units. Questionnaires are used for the collection of
quantitative data of consumer to check the impact of independent variables on the dependent
25 | P a g e
variable in Punjab, Pakistan. This will help to provide facts and estimation that will help to
accurately predict the relationship of independent and dependent variables. Details about the
setting and design of the Questionnaire will be discussed in this chapter later.
3.2.4 Type of the Investigation:
This research is a Causal Research as this research attempt to
examine the influence of the independent variables on the dependent variable the performance of the
SME”s in Pakistan.
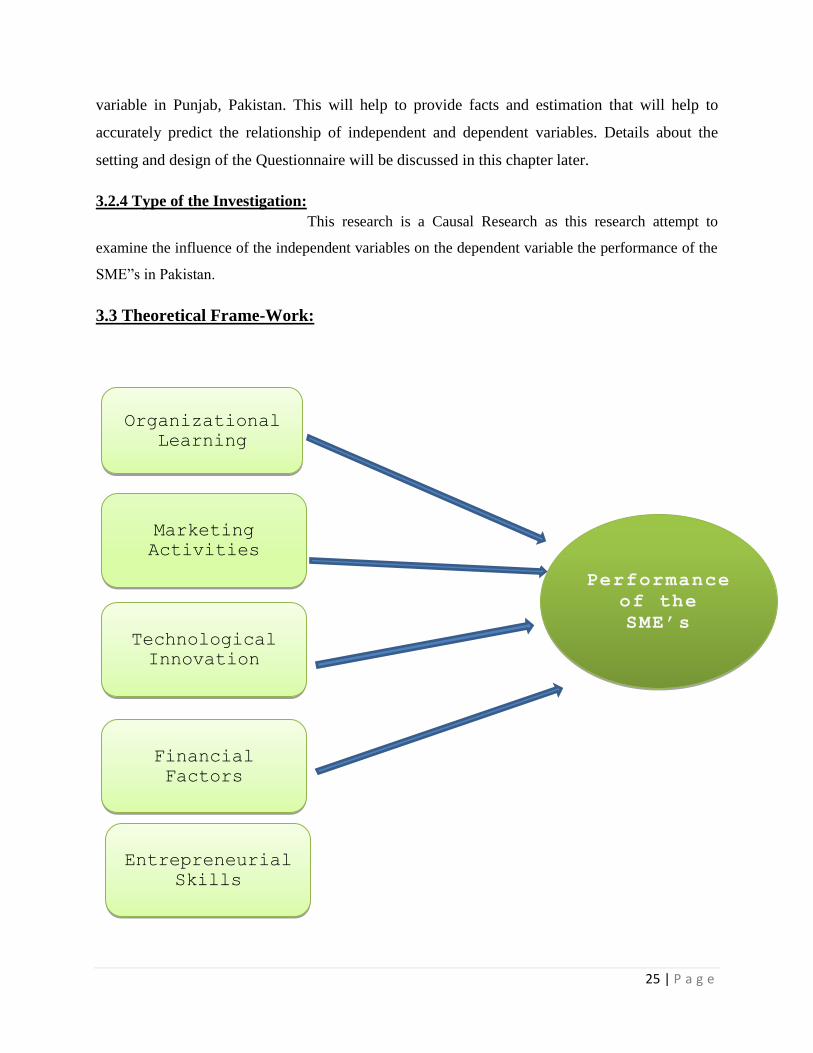
3.3 Theoretical Frame-Work:
Organizational
Learning
Marketing
Activities
Technological
Innovation
Financial
Factors
Performance
of the
SME’s
Entrepreneurial
Skills
26 | P a g e
3.4 Generating the Hypothesis:
H1: The organizational innovation has positive relation with the performance of the SME’s.
H2: The skilled management and entrepreneurial has positive relation with the SME’s
performance.
H3: The technological innovation has positive and useful relation with the performance of the
SME’s.
H4: The marketing activities have positive relation in the perspective to enhance the awareness
of customer about the SME’s segment.
H5: The financial factors have positive relation with the SME’s performance.
H6: There is the positive relationship between the technological innovation and the marketing
activities.
H7: There is the positive relationship between the marketing activities and the learning
organization.
3.5 Questionnaire Survey:
A questionnaire is a set of different questions that can achieve the
needed information and evidences from the respondent for the research purpose. The
requirements and needs of the research are translated into a set of particular questions. These
questions should be easy to read and understand and respondent should will to answer it.
3.5.1 Questionnaire Design:
For this research, structured questions with Scale were used for
data collection. This was necessary to get a specific type of response format that will easy for
analysis. Before distribution of the questionnaire to respondents, a pilot test having sample of 30
respondents was held to check the accuracy and reliability of the questionnaire.
3.5.2 Questionnaire Details:
The formation of the questionnaire is divided into 6 different parts
to achieve needed information form the respondent. This information includes such type of
responses from respondents which will help in measuring the effectiveness of social media
marketing. This information will also explore the difference of demographic information towards
the variable such as gender response difference towards variable or other demographic
information such as age and education level toward the variables.
27 | P a g e
3.5.2.1 Part First (Marketing Innovation):
The questions of the marketing innovation are taken
from the article “Effects of Innovation Types on Firm Performance: an Empirical Study on
Pakistan’s Manufacturing Sector” by the Naidoo (2010) for measuring the results of the study.
3.5.2.2 Part Second (Organizational Learning):
The questions of the marketing innovation
are taken from the article “Effects of Innovation Types on Firm Performance: an Empirical
Study on Pakistan’s Manufacturing Sector” by the Calantone et al. (2002) for measuring the
results.
3.5.2.3 Part Third (Technological Innovation):
The questions of the technological
innovation are taken from the article “Effects of Innovation Types on Firm Performance: an
Empirical Study on Pakistan’s Manufacturing Sector” by the Huang & Liu (2005) for
measurement of the results.
3.5.2.4 Fourth Part (Financial Factors):
The questions of the financial factors are taken from
the article “Impact of the organizational learning and the innovation of performance” by the
Camisón & Villar-López (2012) for the measurement of the results.
3.5.2.5 Fifth Part (Entrepreneurial Skills):
The questions of the entrepreneurial skills are taken
from the article “Impact of the organizational learning and the innovation of performance”
by the Sok & O’ Cass (2011) for the measurement of the results.
3.5.2.6 Sixth Part (Performance of the SME’s):
The questions of the performance of the
SME’s are taken from the article “Impact of the organizational learning and the innovation
of performance” by the Baer & Frese (2003) for the measurement of the results.
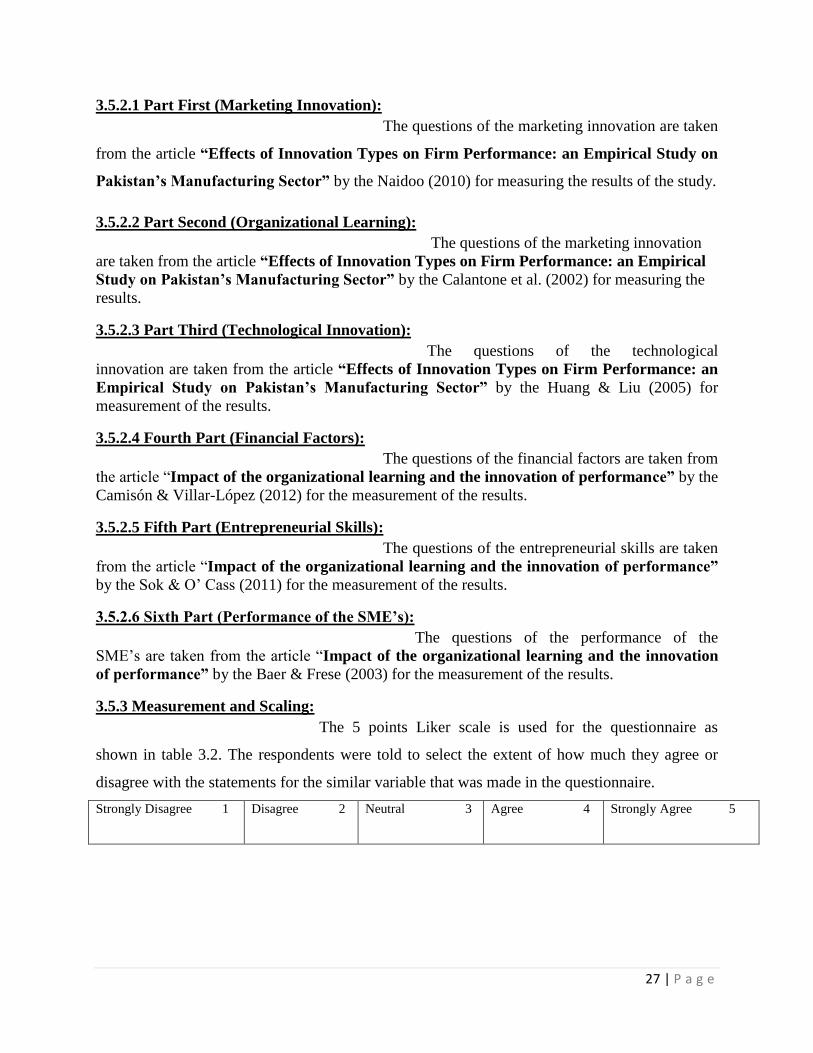
3.5.3 Measurement and Scaling:
The 5 points Liker scale is used for the questionnaire as
shown in table 3.2. The respondents were told to select the extent of how much they agree or
disagree with the statements for the similar variable that was made in the questionnaire.
Strongly Disagree 1 Disagree 2 Neutral 3 Agree 4 Strongly Agree 5
28 | P a g e
3.6 Population and Sampling:
3.6.1 Population:
The population for this study the SME’s of the Southern area of the Punjab
which is in the total number. This is the size of the total population from which we target the 20
SME’s from the different cities.
3.6.2 Sampling:
Sample Size:
We take the sample of the 250.
Sampling Technique:
We follow the probability sampling design by using simple
random sampling. Simple random sampling is also known as unrestricted probability sampling
design. In this sampling every element in the population has a known and equal chance of being
selected as a subject.
3.6.3 Unit of the Analysis:
The respondents who fill-out the questionnaire are the unit of the
analysis in this study the unit of the analysis are the employees of the SME’s who have different
kind of the age level and have the different experience in SME’s.
3.6.4 Study Setting:
This research is field investigation because we are working in a natural
environment. This is not a 100 percent controlled study because there are many factors that may
affect our study commonly known as “Nuisance Variable”.
3.7 Data Entry and analysis techniques:
Data is collected within 7 days from May 29, 2015
to 4 May, 2015. The data is collected with the help of friends. After data collection, Data is
entered into the IBM Statistical Package of Social Science (SPSS) for Windows V 20.0.0. Many
techniques are used for analysis, such as Reliability statistics, Descriptive statistics, Pearson
Correlation, Independent Sample t test, One Way ANOVA and Regression Analysis technique.
All these techniques are helpful to reach the objectives of the research which are helpful to
understand effect of the different factors on the performance of the SME’s.
29 | P a g e
Chapter No. 4
Results and Analysis
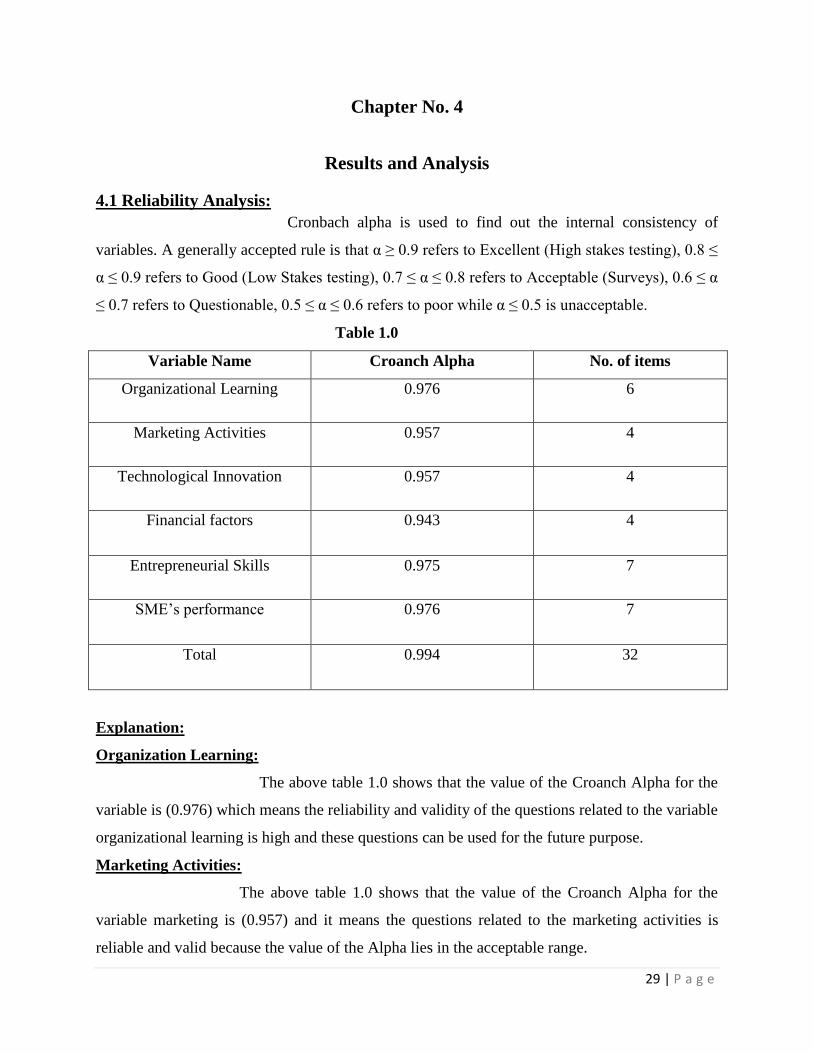
4.1 Reliability Analysis:
Cronbach alpha is used to find out the internal consistency of
variables. A generally accepted rule is that α ≥ 0.9 refers to Excellent (High stakes testing), 0.8 ≤
α ≤ 0.9 refers to Good (Low Stakes testing), 0.7 ≤ α ≤ 0.8 refers to Acceptable (Surveys), 0.6 ≤ α
≤ 0.7 refers to Questionable, 0.5 ≤ α ≤ 0.6 refers to poor while α ≤ 0.5 is unacceptable.
Table 1.0
Variable Name Croanch Alpha No. of items
Organizational Learning 0.976 6
Marketing Activities 0.957 4
Technological Innovation 0.957 4
Financial factors 0.943 4
Entrepreneurial Skills 0.975 7
SME’s performance 0.976 7
Total 0.994 32
Explanation:
Organization Learning:
The above table 1.0 shows that the value of the Croanch Alpha for the
variable is (0.976) which means the reliability and validity of the questions related to the variable
organizational learning is high and these questions can be used for the future purpose.
Marketing Activities:
The above table 1.0 shows that the value of the Croanch Alpha for the
variable marketing is (0.957) and it means the questions related to the marketing activities is
reliable and valid because the value of the Alpha lies in the acceptable range.

30 | P a g e
Technological Innovation:
The above table 1.0 shows that the value of the Croanch Alpha for
the variable marketing is (0.957) and it means the questions related to the technological
innovation is reliable and valid because the value of the Alpha lies in the acceptable range.
Financial Factors:
The above table 1.0 shows that the value of the Croanch Alpha for the
variable financial factors is (0.943) and it means the questions related to the financial factors are
reliable and valid because the value of the Alpha lies in the acceptable range.
Entrepreneurial Skills:
The above table 1.0 shows that the value of the Croanch Alpha for the
variable entrepreneurial skills are (0.975) and it means the questions related to the
entrepreneurial skills are reliable and valid because the value of the Alpha lies in the acceptable
range.
SME’s Performance:
The above table 1.0 shows that the value of the Croanch Alpha for the
variable SME’s performance is (0.976) and it means the questions related to the SME’s
performance are reliable and valid because the value of the Alpha lies in the acceptable range.
4.2 Descriptive Statistics:
The descriptive statistics tell you that where the respondent lays
your research and this analysis also tells you that the reliability of the whole data. This analysis
also tells you both the data lies in the acceptable region normally we set a standard of the
questions, answers and this is also known as the “Allowable Error”. The first is the mean value
which shows that the response of the respondents the value more closer to the 4 means that the
respondents are agree with the questions and the value closer to the 2 which means that the
respondents are disagree with the questions and the next is the standard error and the value
exceeds from the (0.05) or the 5% means that the theirs is error among the questions and the last
is the standard deviation the more value closer to the 1 means respondents have the different
kinds of the responses towards the variable and that means that the respondents gave the
different kinds of the responses towards the different variables.
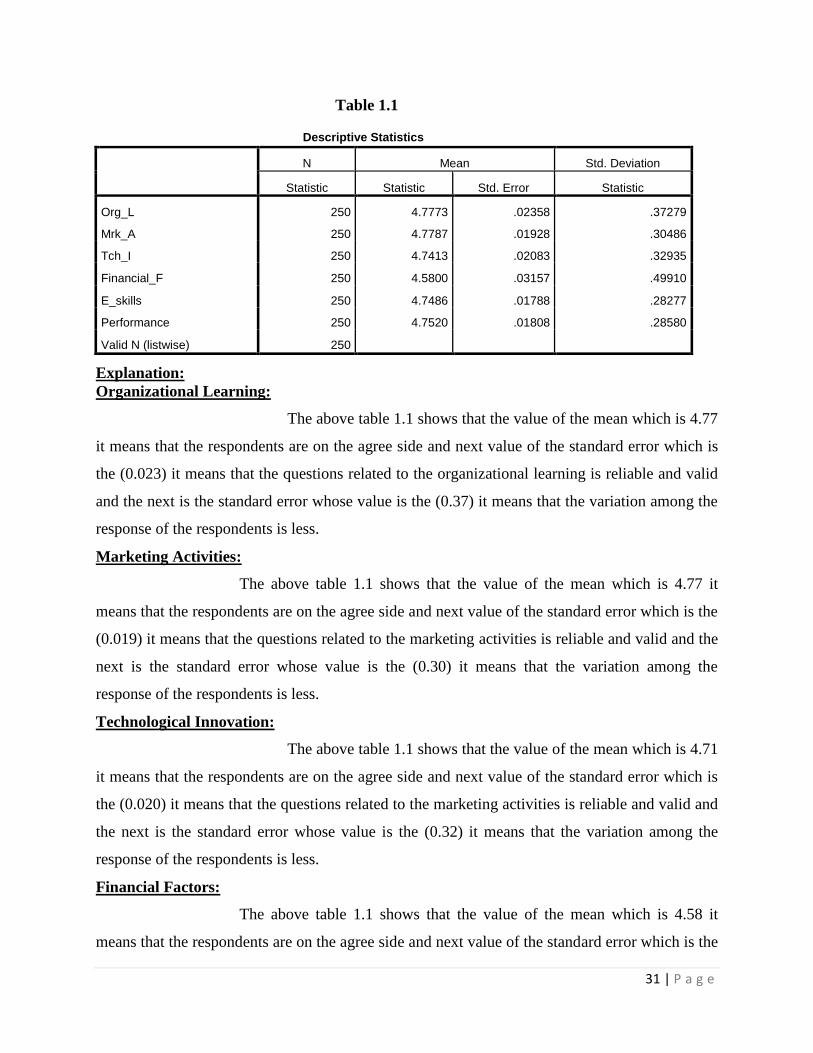
31 | P a g e
Table 1.1
Descriptive Statistics
N Mean Std. Deviation
Statistic Statistic Std. Error Statistic
Org_L 250 4.7773 .02358 .37279
Mrk_A 250 4.7787 .01928 .30486
Tch_I 250 4.7413 .02083 .32935
Financial_F 250 4.5800 .03157 .49910
E_skills 250 4.7486 .01788 .28277
Performance 250 4.7520 .01808 .28580
Valid N (listwise) 250
Explanation:
Organizational Learning:
The above table 1.1 shows that the value of the mean which is 4.77
it means that the respondents are on the agree side and next value of the standard error which is
the (0.023) it means that the questions related to the organizational learning is reliable and valid
and the next is the standard error whose value is the (0.37) it means that the variation among the
response of the respondents is less.
Marketing Activities:
The above table 1.1 shows that the value of the mean which is 4.77 it
means that the respondents are on the agree side and next value of the standard error which is the
(0.019) it means that the questions related to the marketing activities is reliable and valid and the
next is the standard error whose value is the (0.30) it means that the variation among the
response of the respondents is less.
Technological Innovation:
The above table 1.1 shows that the value of the mean which is 4.71
it means that the respondents are on the agree side and next value of the standard error which is
the (0.020) it means that the questions related to the marketing activities is reliable and valid and
the next is the standard error whose value is the (0.32) it means that the variation among the
response of the respondents is less.
Financial Factors:
The above table 1.1 shows that the value of the mean which is 4.58 it
means that the respondents are on the agree side and next value of the standard error which is the
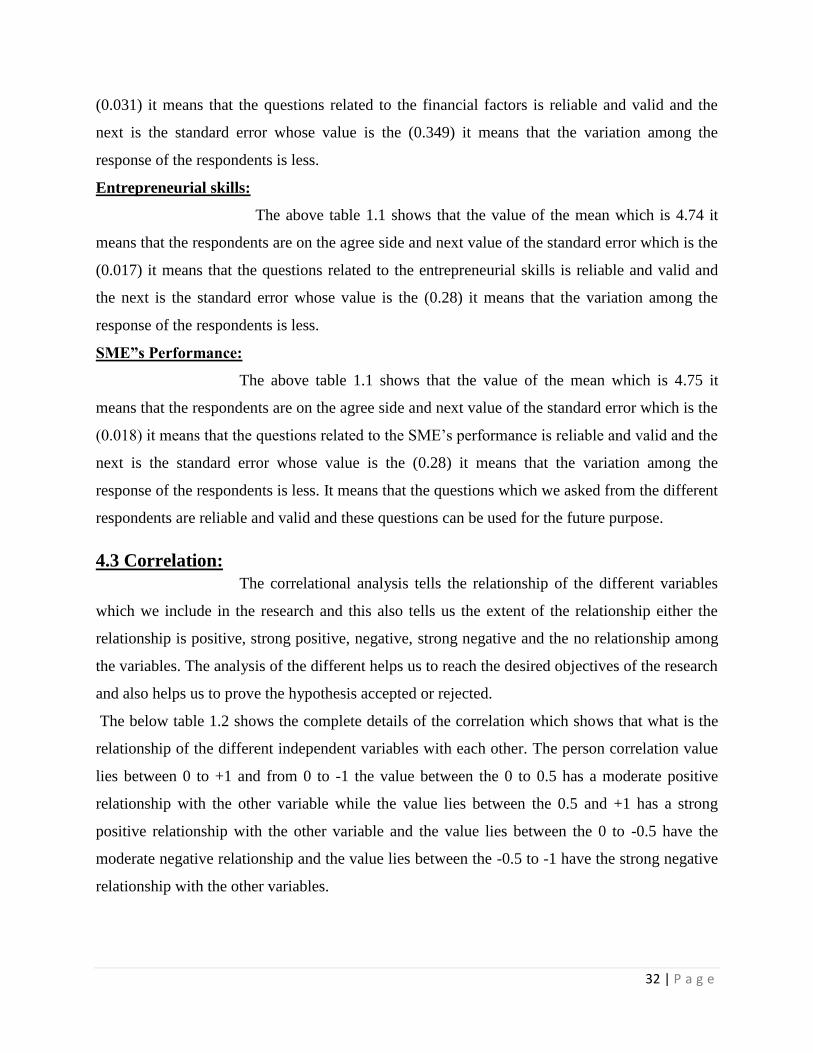
32 | P a g e
(0.031) it means that the questions related to the financial factors is reliable and valid and the
next is the standard error whose value is the (0.349) it means that the variation among the
response of the respondents is less.
Entrepreneurial skills:
The above table 1.1 shows that the value of the mean which is 4.74 it
means that the respondents are on the agree side and next value of the standard error which is the
(0.017) it means that the questions related to the entrepreneurial skills is reliable and valid and
the next is the standard error whose value is the (0.28) it means that the variation among the
response of the respondents is less.
SME”s Performance:
The above table 1.1 shows that the value of the mean which is 4.75 it
means that the respondents are on the agree side and next value of the standard error which is the
(0.018) it means that the questions related to the SME’s performance is reliable and valid and the
next is the standard error whose value is the (0.28) it means that the variation among the
response of the respondents is less. It means that the questions which we asked from the different
respondents are reliable and valid and these questions can be used for the future purpose.
4.3 Correlation:
The correlational analysis tells the relationship of the different variables
which we include in the research and this also tells us the extent of the relationship either the
relationship is positive, strong positive, negative, strong negative and the no relationship among
the variables. The analysis of the different helps us to reach the desired objectives of the research
and also helps us to prove the hypothesis accepted or rejected.
The below table 1.2 shows the complete details of the correlation which shows that what is the
relationship of the different independent variables with each other. The person correlation value
lies between 0 to +1 and from 0 to -1 the value between the 0 to 0.5 has a moderate positive
relationship with the other variable while the value lies between the 0.5 and +1 has a strong
positive relationship with the other variable and the value lies between the 0 to -0.5 have the
moderate negative relationship and the value lies between the -0.5 to -1 have the strong negative
relationship with the other variables.

33 | P a g e
Table 1.2
Correlations
Org_L Mrk_A Tch_I Financial_F E_skills Performance
Org_L
Pearson Correlation 1 .615** .649
** .236
** .576
** .583
**
Sig. (2-tailed) .000 .000 .000 .000 .000
N 250 250 250 250 250 250
Mrk_A
Pearson Correlation .615** 1 .630
** .339
** .737
** .728
**
Sig. (2-tailed) .000 .000 .000 .000 .000
N 250 250 250 250 250 250
Tch_I
Pearson Correlation .649** .630
** 1 .359
** .612
** .625
**
Sig. (2-tailed) .000 .000 .000 .000 .000
N 250 250 250 250 250 250
Financial_F
Pearson Correlation .236** .339
** .359
** 1 .424
** .402
**
Sig. (2-tailed) .000 .000 .000 .000 .000
N 250 250 250 250 250 250
E_skills
Pearson Correlation .576** .737
** .612
** .424
** 1 .744
**
Sig. (2-tailed) .000 .000 .000 .000 .000
N 250 250 250 250 250 250
Performance
Pearson Correlation .583** .728
** .625
** .402
** .744
** 1
Sig. (2-tailed) .000 .000 .000 .000 .000
N 250 250 250 250 250 250
**. Correlation is significant at the 0.01 level (2-tailed).
Organizational Learning:
The above table 1.2 shows that the organizational learning has the
strong positive relationship with the marketing activities and the relationship value is the (0.615)
at the level of the significance 95%. The second variable is the technological innovation which
also has the strong positive relationship with the organizational learning and the relationship
value is the (0.649) at the level of the significance 95%. The third variable is the financial factors
which have the moderate positive relationship with the organizational learning and the
relationship value is the (0.236) at the level of the significance 95%. The fourth variable is the
entrepreneurial skills which have the strong positive relationship with the organizational learning
and the relationship value between these two variables is the (0.576) at the level of the
significance 95%. The last variable is the SME’ performance which has the strong positive
relationship with the organizational learning and the relationship value is the (0.583) at the level
of the significance 95%.

34 | P a g e
Marketing Activities:
The above table 1.2 shows the relationship of the marketing activities and
technological innovation and the relationship between these two variables is strong positive and
the relationship value between these variables is the (0.630) at the level of the significance 95%.
The second is the relationship between marketing activities and the financial factors are
moderate positive and the relationship value is the (0.339) at the level of the significance 95%.
The third is the relationship of the marketing activities and the entrepreneurial skills and the
above table shows that the strong positive relationship is present between these two variables and
the relationship value between these two variables is the (0.737) at the level of the significance
95%. The last is the relationship of the marketing activities and the SME’s performance and the
above table shows that the strong positive relationship present between these two variables and
the relationship value is the (0.728) at the level of the significance 95%.
Technological Innovation:
The above table 1.2 shows the relationship between the
technological innovation and the financial factors and the above the above table shows that the
moderate positive relationship between these two variables and the relationship value is the
(0.359) at the level of the significance 95%. The second is the relationship between the
technological innovation and the entrepreneurial skills and the according to the above table the
strong positive relationship is present between these two variables and the relationship value is
the relationship value is the (0.612) at the level of the significance 95%. The third is the
relationship between the technological innovation and the SME”s performance and the above
table shows that the strong positive relationship present between these two variables and the
relationship value is the (0.625) at the level of the significance 95%.
Financial Factors:
The above table 1.2 shows the financial factors with the different variables
first is the relationship of the financial factors and the entrepreneurial skills and the above table
shows the moderate positive relationship is present between these two variables and the
relationship value is the (0.424) at the level of the significance 95%. The last is the relationship
of the financial factors and the SME”s performance and the according to the above table the
relationship between these two variables are moderate positive and the relationship value is the
(0.402) at the level of the significance 95%.

35 | P a g e
Entrepreneurial Skills:
The last is the relationship between the entrepreneurial skills and the
SME’s performance and the above table shows that the strong positive relationship is present
between these two variables and the relationship value is the (0.744) at the level of the
significance 95%.
4.4 One Way ANOVA:
The one way ANOVA is used when we have the groups more than
2 and the explanation of the ANOVA as the independent t-test this one way ANOVA can be
interpreted by seeing the significance value and the this value tells us that either the different
groups have the same responses towards the particular level or not.
4.4.1 One Way ANOVA (Age Group):
The one way ANOVA for the age group is available in
the table 2.1 which has the different values and all these values explains the either the difference
lies among the group or not and the confidence interval is 95%. The categories as follows:
18-25 years
25-32 years
32-40 years
Above than 40 years
These are the different age groups of the different respondents we need to analyze the response
of these respondents. The standard values of significance (0.05) if the value above than the
significance than the same response is present otherwise the difference in the response.
Organizational learning:
The below table 1.3 shows that the respondents from the different age
groups have the same kind of the response above the organizational learning because the value of
the significance (0.955) is above than the (0.05) at the level of the significance 95% which means
that the same kind of the response is present between the different age groups.
Marketing Activities:
The below table 1.3 shows that the respondents from the different age
groups have the same kind of the response above the marketing activities because the value of
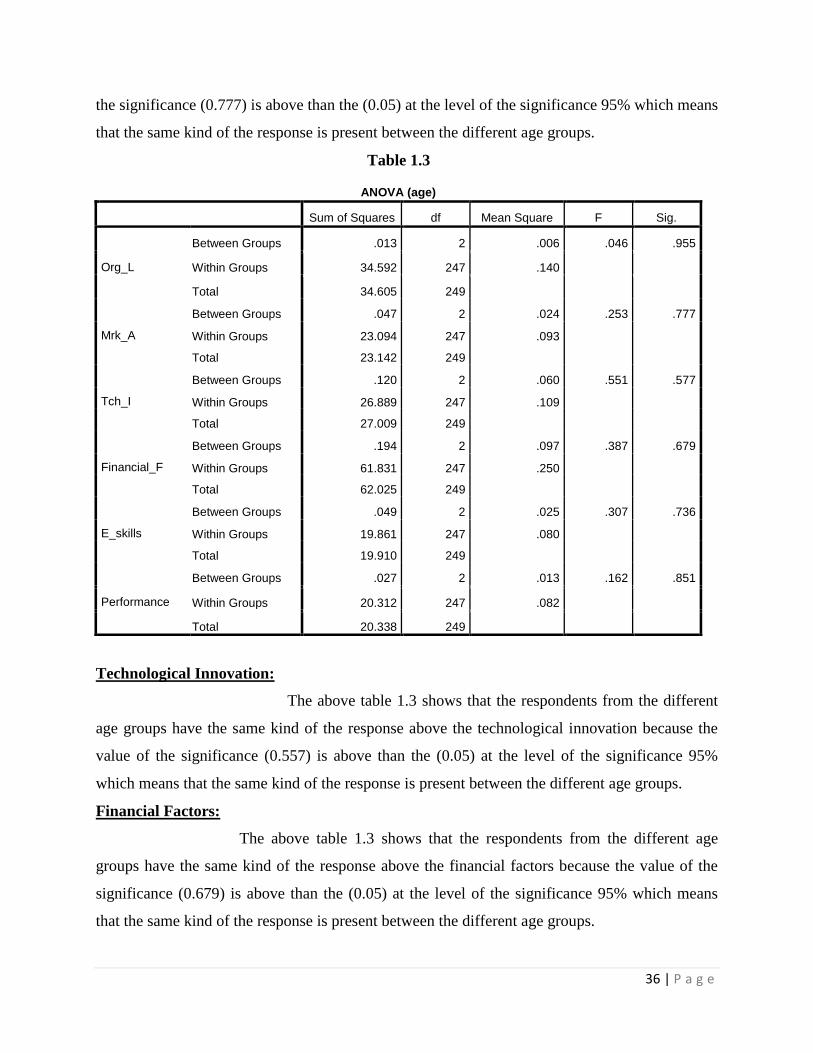
36 | P a g e
the significance (0.777) is above than the (0.05) at the level of the significance 95% which means
that the same kind of the response is present between the different age groups.
Table 1.3
ANOVA (age)
Sum of Squares df Mean Square F Sig.
Org_L
Between Groups .013 2 .006 .046 .955
Within Groups 34.592 247 .140
Total 34.605 249
Mrk_A
Between Groups .047 2 .024 .253 .777
Within Groups 23.094 247 .093
Total 23.142 249
Tch_I
Between Groups .120 2 .060 .551 .577
Within Groups 26.889 247 .109
Total 27.009 249
Financial_F
Between Groups .194 2 .097 .387 .679
Within Groups 61.831 247 .250
Total 62.025 249
E_skills
Between Groups .049 2 .025 .307 .736
Within Groups 19.861 247 .080
Total 19.910 249
Performance
Between Groups .027 2 .013 .162 .851
Within Groups 20.312 247 .082
Total 20.338 249
Technological Innovation:
The above table 1.3 shows that the respondents from the different
age groups have the same kind of the response above the technological innovation because the
value of the significance (0.557) is above than the (0.05) at the level of the significance 95%
which means that the same kind of the response is present between the different age groups.
Financial Factors:
The above table 1.3 shows that the respondents from the different age
groups have the same kind of the response above the financial factors because the value of the
significance (0.679) is above than the (0.05) at the level of the significance 95% which means
that the same kind of the response is present between the different age groups.
37 | P a g e
Entrepreneurial Skills:
The above table 1.3 shows that the respondents from the different age
groups have the same kind of the response above the entrepreneurial skills because the value of
the significance (0.736) is above than the (0.05) at the level of the significance 95% which means
that the same kind of the response is present between the different age groups.
SME’s Performance:
The above table 1.3 shows that the respondents from the different age
groups have the same kind of the response above the SME’s performance because the value of
the significance (0.851) is above than the (0.05) at the level of the significance 95% which means
that the same kind of the response is present between the different age groups.
4.4.2 One Way ANOVA (Industry Wise):
The next One Way ANOVA is to check the response
of the industry wise that either employee of the different SME’s have the same response or not
about the different variables. We consider the four groups for this purpose:
Rice Mills
Flour Mills
Cotton Mills
Ice Mills
These are the employees belongs to different industry groups of the different respondents we
need to analyze the response of these respondents. The standard values of significance (0.05) if
the value above than the significance than the same response is present otherwise the difference
in the response.
Organizational Learning:
The above table 1.4 shows that the employees from the different
industries have the same kind of the response because the value of the significance (0.001) less
than the (0.05) at the level of the significance 95% is means that the different kind of the
response is present between the groups. Through the use of the standard value the response of the
different respondents is analyzed and through this the different research objectives which made
earlier is achieved.

38 | P a g e
Table 1.4
ANOVA(Industry)
Sum of Squares Df Mean Square F Sig.
Org_L
Between Groups 2.151 3 .717 5.434 .001
Within Groups 32.454 246 .132
Total 34.605 249
Mrk_A
Between Groups 1.378 3 .459 5.191 .002
Within Groups 21.764 246 .088
Total 23.142 249
Tch_I
Between Groups 2.084 3 .695 6.855 .000
Within Groups 24.925 246 .101
Total 27.009 249
Financial_F
Between Groups 5.044 3 1.681 7.258 .000
Within Groups 56.981 246 .232
Total 62.025 249
E_skills
Between Groups 1.023 3 .341 4.439 .005
Within Groups 18.888 246 .077
Total 19.910 249
Performance
Between Groups 1.555 3 .518 6.789 .000
Within Groups 18.783 246 .076
Total 20.338 249
Marketing Activities:
The above table 1.4 shows that the employees from the different industries
have the same kind of the response because the value of the significance (0.002) less than the
(0.05) at the level of the significance 95% is means that the different kind of the response is
present between the groups.
Technological Innovation:
The above table 1.4 shows that the employees from the different
industries have the same kind of the response because the value of the significance (0.000) less
than the (0.05) at the level of the significance 95% is means that the different kind of the
response is present between the groups.
Financial Factors:
The above table 1.4 shows that the employees from the different industries
have the same kind of the response because the value of the significance (0.000) less than the
39 | P a g e
(0.05) at the level of the significance 95% is means that the different kind of the response is
present between the groups.
Entrepreneurial Skills:
The above table 1.4 shows that the employees from the different industries
have the same kind of the response because the value of the significance (0.005) less than the
(0.05) at the level of the significance 95% is means that the different kind of the response is
present between the groups.
SME’s Performance:
The above table 1.4 shows that the employees from the different industries
have the same kind of the response because the value of the significance (0.000) less than the
(0.05) at the level of the significance 95% is means that the different kind of the response is
present between the groups.
4.4.3 One Way ANOVA (Education Wise):
This One Way ANOVA is used to know the
response of the respondents who have the different level of the education. The different
education level of the respondents is as follows:
Metric
Intermediate
Graduate
Masters
These are the employees belongs to different level of the education of the different we need to
analyze the response of these respondents. The standard values of significance (0.05) if the value
above than the significance than the same response is present otherwise the difference in the
response.
Organizational Learning:
The above table 1.5 shows that the respondents from the different
level of the education have the different kind of response towards the organizational learning and
this is because of the fact that the value of the significance is (0.000) is less than the (0.05) at the
level of the significance 95% that’s why the different is response of the respondents is present
between these groups.

40 | P a g e
Table 1.5
ANOVA (Education Level)
Sum of Squares Df Mean Square F Sig.
Org_L
Between Groups 3.289 2 1.644 12.970 .000
Within Groups 31.316 247 .127
Total 34.605 249
Mrk_A
Between Groups 1.653 2 .827 9.502 .000
Within Groups 21.488 247 .087
Total 23.142 249
Tch_I
Between Groups 2.296 2 1.148 11.473 .000
Within Groups 24.713 247 .100
Total 27.009 249
Financial_F
Between Groups .142 2 .071 .283 .754
Within Groups 61.883 247 .251
Total 62.025 249
E_skills
Between Groups .963 2 .482 6.278 .002
Within Groups 18.947 247 .077
Total 19.910 249
Performance
Between Groups 1.433 2 .716 9.359 .000
Within Groups 18.906 247 .077
Total 20.338 249
Marketing Activities:
The above table 1.5 shows that the respondents from the different level of
the education have the different kind of response towards the marketing activities and this is
because of the fact that the value of the significance is (0.000) is less than the (0.05) at the level
of the significance 95% that’s why the different is response of the respondents is present between
these groups.
Technological Innovation:
The above table 1.5 shows that the respondents from the different
level of the education have the different kind of response towards the technological innovation
and this is because of the fact that the value of the significance is (0.000) is less than the (0.05) at
the level of the significance 95% that’s why the different is response of the respondents is
present between these groups.

41 | P a g e
Financial Factors:
The above table 1.5 shows that the respondents from the different level of
the education have the same kind of response towards the financial factors and this is because of
the fact that the value of the significance is (0.754) is greater than the (0.05) at the level of the
significance 95% that’s why the different is response of the respondents is present between these
groups.
Entrepreneurial Skills:
The above table 1.5 shows that the respondents from the different level of
the education have the different kind of response towards the entrepreneurial skills and this is
because of the fact that the value of the significance is (0.002) is less than the (0.05) at the level
of the significance 95% that’s why the different is response of the respondents is present between
these groups.
SME’s Performance:
The above table 1.5 shows that the respondents from the different level of
the education have the different kind of response towards the SME’s performance and this is
because of the fact that the value of the significance is (0.000) is less than the (0.05) at the level
of the significance 95% that’s why the different is response of the respondents is present between
these groups.
4.4.4One Way ANOVA (Annual Turnover):
The next One Way ANOVA is used to analyze the
response of the different employees which are working in different annual turnover. The groups
of the different annual turnover are as follows:
1-1.5 Million
1.5-2 Million
2-2.5 Million
Above than 2.5 Million
These are the employees belongs to different industry which has different annual turnover of the
different respondents we need to analyze the response of these respondents. The standard values
of significance (0.05) if the value above than the significance than the same response is present
otherwise the difference in the response.

42 | P a g e
Table 1.6
ANOVA (Annual Turnover)
Sum of Squares Df Mean Square F Sig.
Org_L
Between Groups 6.862 3 2.287 20.282 .000
Within Groups 27.743 246 .113
Total 34.605 249
Mrk_A
Between Groups 4.837 3 1.612 21.666 .000
Within Groups 18.305 246 .074
Total 23.142 249
Tch_I
Between Groups 6.035 3 2.012 23.596 .000
Within Groups 20.974 246 .085
Total 27.009 249
Financial_F
Between Groups 8.074 3 2.691 12.271 .000
Within Groups 53.951 246 .219
Total 62.025 249
E_skills
Between Groups 3.761 3 1.254 19.095 .000
Within Groups 16.150 246 .066
Total 19.910 249
Performance
Between Groups 5.802 3 1.934 32.727 .000
Within Groups 14.537 246 .059
Total 20.338 249
Organizational Learning:
The above table 1.6 shows that the employees of the different
annual turnover SME’s have the different kind of the response about the organizational learning
because the value of the significance is (0.000) which is less than the (0.05) at the level of the
significance 95%. It means that the different kind of the response is present among the
employees of the different annual turnover SME”s.
Marketing Activities:
The above table 1.6 shows that the employees of the different annual
turnover SME’s have the different kind of the response about the marketing activities because
the value of the significance is (0.000) which is less than the (0.05) at the level of the
significance 95%. It means that the different kind of the response is present among the
employees of the different annual turnover SME”s.

43 | P a g e
Technological Innovation:
The above table 1.6 shows that the employees of the different
annual turnover SME’s have the different kind of the response about the technological
innovation because the value of the significance is (0.000) which is less than the (0.05) at the
level of the significance 95%. It means that the different kind of the response is present among
the employees of the different annual turnover SME”s.
Financial Factors:
The above table 1.6 shows that the employees of the different annual
turnover SME’s have the different kind of the response about the financial factors because the
value of the significance is (0.000) which is less than the (0.05) at the level of the significance
95%. It means that the different kind of the response is present among the employees of the
different annual turnover SME”s.
Entrepreneurial Skills:
The above table 1.6 shows that the employees of the different annual
turnover SME’s have the different kind of the response about the entrepreneurial skills because
the value of the significance is (0.000) which is less than the (0.05) at the level of the
significance 95%. It means that the different kind of the response is present among the
employees of the different annual turnover SME”s.
SME’s Performance:
The above table 1.6 shows that the employees of the different annual
turnover SME’s have the different kind of the response about the SME’s performance because
the value of the significance is (0.000) which is less than the (0.05) at the level of the
significance 95%. It means that the different kind of the response is present among the
employees of the different annual turnover SME”s.
4.4.5 One Way ANOVA (Location):
The last One Way ANOVA is used to know the response of
the different respondents who belongs to the different locations. In this study only four different
locations is targeted and employees of that cities fill-out the questionnaire and we need to
analyze the response of the different respondents. The four different cities which are the part of
the research are as follows:
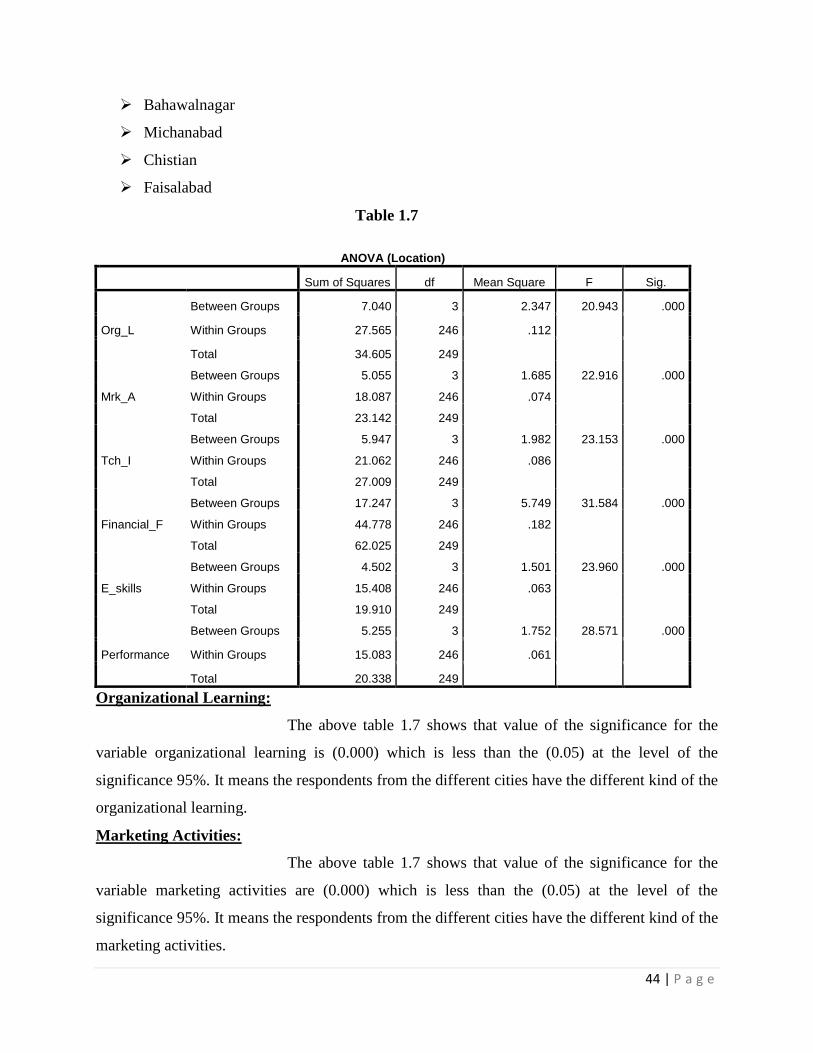
44 | P a g e
Bahawalnagar
Michanabad
Chistian
Faisalabad
Table 1.7
ANOVA (Location)
Sum of Squares df Mean Square F Sig.
Org_L
Between Groups 7.040 3 2.347 20.943 .000
Within Groups 27.565 246 .112
Total 34.605 249
Mrk_A
Between Groups 5.055 3 1.685 22.916 .000
Within Groups 18.087 246 .074
Total 23.142 249
Tch_I
Between Groups 5.947 3 1.982 23.153 .000
Within Groups 21.062 246 .086
Total 27.009 249
Financial_F
Between Groups 17.247 3 5.749 31.584 .000
Within Groups 44.778 246 .182
Total 62.025 249
E_skills
Between Groups 4.502 3 1.501 23.960 .000
Within Groups 15.408 246 .063
Total 19.910 249
Performance
Between Groups 5.255 3 1.752 28.571 .000
Within Groups 15.083 246 .061
Total 20.338 249
Organizational Learning:
The above table 1.7 shows that value of the significance for the
variable organizational learning is (0.000) which is less than the (0.05) at the level of the
significance 95%. It means the respondents from the different cities have the different kind of the
organizational learning.
Marketing Activities:
The above table 1.7 shows that value of the significance for the
variable marketing activities are (0.000) which is less than the (0.05) at the level of the
significance 95%. It means the respondents from the different cities have the different kind of the
marketing activities.
45 | P a g e
Technological Innovation:
The above table 1.7 shows that value of the significance for the
variable technological innovation is (0.000) which is less than the (0.05) at the level of the
significance 95%. It means the respondents from the different cities have the different kind of the
technological innovation.
Financial Factors:
The above table 1.7 shows that value of the significance for the variable
financial factors is (0.000) which is less than the (0.05) at the level of the significance 95%. It
means the respondents from the different cities have the different kind of the financial factors.
Entrepreneurial Skills:
The above table 1.7 shows that value of the significance for the variable
entrepreneurial skills is (0.000) which is less than the (0.05) at the level of the significance 95%.
It means the respondents from the different cities have the different kind of the entrepreneurial
skills.
SME’s Performance:
The above table 1.7 shows that value of the significance for the variable
SME’s performance is (0.000) which is less than the (0.05) at the level of the significance 95%.
It means the respondents from the different cities have the different kind of the SME’s
performance.
4.5 Independent Sample T test:
The independent t test is used to know the response of the
respondents which are classify the two groups like male and female. The value of the
significance is standard to analyze the response of the different respondents like if the value of
the significance is less than standard which is the (0.05) than the male and female have the
different kind of the about the different variables similarly if the value of the significance is
greater than the standard (0.05) than the male and female have the same kind of the response
about the different variables. The below is the tables one table shows the response of the male
and female about the different variables that either they are on the agree stage and the standard
error and the standard deviation which shows that the reliability and validity of the questionnaire
that the questionnaire can be used for the future purpose or not.

46 | P a g e
Table 1.8
Group Statistics
The gender of the
respondents.
N Mean Std. Deviation Std. Error Mean
Org_L Male 163 4.8691 .24827 .01945
Female 87 4.6054 .49029 .05256
Mrk_A Male 163 4.8569 .21347 .01672
Female 87 4.6322 .38725 .04152
Tch_I Male 163 4.8303 .25908 .02029
Female 87 4.5747 .38019 .04076
Financial_F Male 163 4.6135 .45997 .03603
Female 87 4.5172 .56264 .06032
E_skills Male 163 4.8142 .21066 .01650
Female 87 4.6256 .35279 .03782
Performance Male 163 4.8221 .19251 .01508
Female 87 4.6207 .37407 .04010
Organizational Learning:
The above table 1.8 shows that the male and female both are on the
agree side about the organizational learning variable and the values of the standard deviation and
standard error also lies in the acceptable region which means that the questionnaire is reliable
and valid.
Marketing Activities:
The above table 1.8 shows that the male and female are on the agree side
about the marketing activities variable and the values of the standard error and the standard
deviation lies in the acceptable region which means that the questionnaire is reliable and valid .
Technological Innovation:
The above table 1.8 shows that male and female on the agree side
about the variable technological innovation and the value of standard error and standard
deviation also lies in the acceptable region which means that the questionnaire is reliable and
valid.
Financial Factors:
The above table 1.8 shows that male and female on the agree side about
the variable financial factors and the value of standard error and standard deviation also lies in
the acceptable region which means that the questionnaire is reliable and valid.
47 | P a g e
Entrepreneurial skills:
The above table 1.8 shows that male and female on the agree side about
the variable entrepreneurial skills and the value of standard error and standard deviation also lies
in the acceptable region which means that the questionnaire is reliable and valid.
SME’s Performance:
The above table 1.8 shows that male and female on the agree side about
the variable SME’s performance and the value of standard error and standard deviation also lies
in the acceptable region which means that the questionnaire is reliable and valid.
Independent t test:
The second table shows the response of the male and female about the
different variables like the organizational learning, marketing activities, technological
innovation, financial factors, entrepreneurial skills and the SME’s performance the standard to
know the difference in response of the male and female is the significance value if the value of
the significance is greater than the (0.05) then the same perception of male and female about the
variables and the if the value of the significance is less than (0.05) than the difference in response
is exists among the male and female about the different variables.
Organizational Learning:
The below table 1.9 shows the response of the male and female
about the variables organizational learning according to the above table the male and female
have the different kind of the response about the organizational learning because the value of the
significance is (0.00) is less than the (0.05) at the level of the significance 95%.
Marketing Activities:
The below table 1.9 shows the response of the male and female about the
variables marketing activities according to the above table the male and female have the different
kind of the response about the marketing activities learning because the value of the significance
is (0.00) is less than the (0.05) at the level of the significance 95%.
Technological Innovation:
The below table 1.9 shows the response of the male and female about the
variables technological innovation according to the above table the male and female have the
different kind of the response about the technological innovation because the value of the
significance is (0.00) is less than the (0.05) at the level of the significance 95%.

48 | P a g e
Table 1.9
Independent Samples Test
Levene's Test
for Equality of
Variances
t-test for Equality of Means
F Sig. t df Sig.
(2-
tailed)
Mean
Difference
Std. Error
Difference
95% Confidence
Interval of the
Difference
Lower Upper
Org_L Equal variances assumed 29.653 .000 5.650 248 .000 .26376 .04668 .17181 .35570
Equal variances not assumed 4.706 110.057 .000 .26376 .05605 .15269 .37483
Mrk_A Equal variances assumed 40.748 .000 5.917 248 .000 .22467 .03797 .14989 .29945
Equal variances not assumed 5.020 114.559 .000 .22467 .04476 .13601 .31333
Tch_I Equal variances assumed 18.445 .000 6.279 248 .000 .25555 .04070 .17539 .33572
Equal variances not assumed 5.613 129.683 .000 .25555 .04553 .16547 .34564
Financial_F Equal variances assumed 5.434 .021 1.456 248 .147 .09626 .06612 -.03397 .22648
Equal variances not assumed 1.370 148.285 .173 .09626 .07026 -.04259 .23510
E_skills Equal variances assumed 19.769 .000 5.288 248 .000 .18858 .03566 .11834 .25883
Equal variances not assumed 4.570 119.549 .000 .18858 .04127 .10688 .27029
Performance Equal variances assumed 26.869 .000 5.624 248 .000 .20140 .03581 .13087 .27192
Equal variances not assumed 4.701 110.857 .000 .20140 .04285 .11649 .28630
Financial Factors:
The above table 1.9 shows the response of the male and female about the
variables financial factors according to the above table the male and female have the same kind
of the response about the organizational learning because the value of the significance is (0.173)
is greater than the (0.05) at the level of the significance 95%.
Entrepreneurial Skills:
The above table 1.9 shows the response of the male and female about the
variables entrepreneurial skills according to the above table the male and female have the
different kind of the response about the entrepreneurial skills because the value of the
significance is (0.00) is less than the (0.05) at the level of the significance 95%.
SME”s Performance:
The above table 1.9 shows the response of the male and female about the
variables SME’s performance according to the above table the male and female have the

49 | P a g e
different kind of the response about the SME’s performance because the value of the significance
is (0.00) is less than the (0.05) at the level of the significance 95%.
4.6 Regression:
The regression analysis is used to know the relationship between the dependent
and independent variables. Through the use of that analysis we know the most variable which
affect the dependent variables a lot and we can concentrate on that variable and paid the less
attention towards the other variable. The below is the table of the regression which shows the
complete detail about the results.
4.6.1 Model Summary:
The model summary is used to know the importance of the different
variables and also know that how much the dependent variable is affected through the use of the
independent variables. The value of the Durbin Watson shows that the relationship of the
different independent variables and the value of the R square shows the change in the dependent
variables due to the independent variables the higher the value of the R square means that the
variables have so much impact on the dependent variable.
Table 2.0
Model Summaryb
Model R R Square Adjusted R Square Std. Error of the
Estimate
Durbin-Watson
1 .806a .650 .643 .17076 1.632
a. Predictors: (Constant), E_skills, Financial_F, Org_L, Tch_I, Mrk_A
b. Dependent Variable: Performance
Explanation:
The above table 2.0 shows that the value of the Durbin Watson is (1.632) which
means that there is non-auto colinerity among the different variables which mean that the
different doesn’t affect each other. It means that if we increase or decrease the one variable the
other variable is not affected. The value of the R square means that the dependent variable is
65% change due to the independent variables.

50 | P a g e
4.6.2 ANOVA:
The next analysis is used to know that either the model fits statically or not. The
value of the significance if closer to (0.000) then it means that the model which we establish is
statically fits.
Table 2.1
ANOVAa
Model Sum of Squares Df Mean Square F Sig.
1
Regression 13.224 5 2.645 90.704 .000b
Residual 7.115 244 .029
Total 20.338 249
a. Dependent Variable: Performance
b. Predictors: (Constant), E_skills, Financial_F, Org_L, Tch_I, Mrk_A
Explanation:
The above table 2.1 shows that the value of the significance is (0.000) it means
that the model fits statically and the theoretical frame which we established in the Chapter 3
actually exists. So we can further expand the research and include more variables which are not
the part of that research but they can be used in future research. These variables may be the HR
practices and top management involvement in the firms decision making so these different also
affect the performance of the SME’s in Pakistan.
Table 2.2
Coefficientsa
Model Unstandardized Coefficients Standardized
Coefficients
T Sig.
B Std. Error Beta
1
(Constant) .618 .195 3.169 .002
Org_L .067 .041 .087 1.621 .106
Mrk_A .283 .057 .302 4.938 .000
Tch_I .114 .048 .132 2.359 .019
Financial_F .047 .024 .081 1.917 .056
E_skills .360 .061 .356 5.870 .000
a. Dependent Variable: Performance
51 | P a g e
Organizational Learning:
The above table 2.2 shows that the value of the significance for the
variable organizational learning is the (0.106) which is greater than the (0.05) it means that this
variable doesn’t have too much impact on the dependent variable that’s why the value of the beta
is also low which is the (0.087).
Marketing activities:
The above table 2.2 shows that the value of the significance is (0.000) it
means that this variable have so much impact on the dependent variable which is the SME’s
performance and the value of the Beta which is the (0.302) it means that the dependent variable
is so much affected by this variable. So if we want to increase the performance of the SME’s in
Pakistan than we must focus on the marketing activities. It also means that the marketing
activities is important variable to increase the performance of SME’s.
Technological Innovation:
The above table 2.2 shows that the value of the significance is
(0.019) which is less than the (0.05) it means that this variable also has the impact on the
dependent variable which is the SME”s performance and the Beta value for the variable is
(0.132) it means that only 13% change is due to the technological innovation. So this variable is
important to increase the performance of the SME’s.
Entrepreneurial Skills:
The value of the significance for the variable is the (0.000) which is less
than the (0.05) it means that the entrepreneurial skills has the impact on the dependent variable
which is the SME’s performance and the value of the Beta for this variable is (0.356) it means
that the 35% change is occurs due to the entrepreneurial skills of the employees. It means that the
entrepreneurial skill is most factors to increase the performance of SME’s in Pakistan.
Financial Factors:
The above table 2.2 shows that the financial factors are also the important
variable to increase the performance of the SME’s. The value of the significance for the variable
financial factors is (0.056) which this variable has some sort of the impact on the SME’s
performance and the Beta value is (0.081) which shows that the 8% change occur through
financial factors.
52 | P a g e
Chapter No. 5
Conclusion Limitations and Implications
5.1. Conclusion:
The research is conducted to know the response of those factors that affect
the SME’s performance is Pakistan. According to above analysis it is proved that the different
variables which are the part of the research like the organizational learning, marketing activities,
technological innovation, financial factors and the entrepreneurial skills all these factors affect
the performance of the SME’s in Pakistan. The regression analysis is also tells us that the most
important variable in the research is the entrepreneurial skills which clearly means that those
SME’s which adopt new and methods of innovation and which take the risky decision they
automatically increase their performance in competition. The next important variable of the
research is the marketing activities which affect the performance of the SME’s in Pakistan. It
means if we want to increase the performance of SME’s and we don’t afford to take the risky
decisions then we must go with the marketing activities and make the marketers efficient and
delegated towards their jobs. The research main objective knows those factors which affect the
SME’s performance in Pakistan and this objective is achieved through the above analysis.
The next important part of the research is that the SME’s shows a great contribution in the
growth of the country the more the SME’s performance high the more the chances that the
country grows in the respect of economically. The study shows that because of the different
factors we can easily increase the performance of the SME’s in Pakistan. The other main
objective of the research is to know the relationship of the different independent variables and
the research proves that the different independent variables have the strong or moderate positive
relationship with each other. It means that the different variables which are the part of that
research cannot be ignored in the future because these variables are the important part of the
research but only the one variable which is organizational learning become the part of the
research because the regression analysis shows that this variable is not have much impact of the
dependent variable which is the SME’s performance is Pakistan. We also carefully understand
the impact of the other variables on the dependent variable which is the SME’s performance in
Pakistan and through the use of the regression analysis we also know the importance of that
variable in performance of SME’s.

53 | P a g e
5.2. Limitations:
Due to some reasons some limitations exist in the research. These
limitations are as follow:
According to the economies of Pakistan (2005) total (0.16) million SMEs are working in whole
Pakistan. Major portion are exist at Punjab. But I collect data only from the (90) respondents of
thirty SMEs.
Simply prepared the questionnaire and collect the data from SMEs and by using the SPSS
analyze the whole data. I can’t see or take data actually from the financial statements of the
respondents SMEs.
Under a specific period of time I conduct this research and I can’t take the data from the SMEs in
whole Punjab. I get data only from some districts of Punjab.
Due to scarcity of resource the SMEs can’t hire the educated and skills employees. Therefor
most of persons whose from I get the data not are higher educated persons.
The people of SMEs feel fear when an unknown person asks the question about the progress of
their SMEs. They feel hesitation to give true answer about their current progress and about the
new installments if any exist.
5.3 Future Implications:
The future implications which means that in future this research
continues in some respective are as follows:
The dependent variable is only changes to the 67% due to the effect of the different independent
factors involved in this research so if include other variables like HR activities, and top
management collaboration than the performance of the SME’s in Pakistan.
The targeted cities for the purpose of the data collection belongs to the lower level cities which
doesn’t gave the accurate results about the research because in the lower cities less educated
persons is in good position in the SME so they cannot gave the accurate response towards the
study.
If anyone wants to carry the same topic in the future than they can choose the top management
response only because they are more educated and they can give the right response about the
SME.
The last implication is that the study only follows the primary methods for the analysis and if we
include the secondary data in the research then the response may be changed.
54 | P a g e
References:
Acs, Z.J. and Audretsch, D.B. (1988), “Innovation in large and small firms: an empirical
analysis”,
Acs, Z.J. and Audretsch, D.B. (1988), “Innovation in large and small firms: an empirical
analysis”,
Adair, J. Leadership for Innovation. London: Kogan Page Limited, 2009, ISBN 978-0-7494-
5479-1 Burns, P., Dewhurs, J. Small Business and Entrepreneurship. London: Mac Millan Press
Ltd, 2003, ISBN 0-333-64587-1.
Adegbite, S. A., Ilori, M. O., Irefin, I. A., Abereijo, I. O. and Aderemi, H. O. S. (2007).
Evaluation of the Impact of Entrepreneurial Characteristics on the Performance of Small Scale
Manufacturing Industries in Nigeria.
Anderson, A. (2009), ‘Firm performance: An Analysis from the Theory of Innovation,’
Australian Graduate School Entrepreneurship.
Arundel, A. and Kabla, I. (1998), “What percentage of innovations are patented? Empirical
Atkins, M.H. and Lowe, J.F. (1997) „Sizing up the small firm: UK and Australian experience‟,
International Small Business Journal, Vol. 15, No. 3, pp.42–55.
Bala-Subrahmanya, M. H. (2005). 'Technological Innovations in Indian small enterprises:
dimensions, intensity and implications', Int. J. Technology Management Vol. 30 Nos 1/2, pp. 188
- 204.
Bala-Subrahmanya, M.H. (2006) „Technological innovations in Indian Small and Medium
Enterprises (SMEs) sector: does firm size matter?‟, Int. J. Innovation andLearning, Vol. 3, No.
5, pp.499–517.
Barney, J. B. (1991): Firms resources and sustained competitive advantage. Journal of
Management, 17: 99-120.
Beaver, G. (2002), Small Business, Entrepreneurship and Enterprise Development, Pearson
Education Ltd, United Kingdom.
Becheikh, N., R. Landry, and N. Amara (2006). ‘Lessons from Innovation Empirical Studies in
the Manufacturing Sector: A Systematic Review of the Literature from 1993–2003’
Technovation, 26 (5/6): 644–64.

55 | P a g e
Birley, S. and Westhead, P. (1990), ‘Growth and Performance Contrast Between ‘Types’ of
Small Firms,’
Bottazzi, G., G. Dosi, M. Lippi, F. Pammolli and M. Riccaboni (2001), ‘Innovation and
Corporate
Branzei, O. and Vertinsky, I. (2006), “Strategic pathways to product innovation capabilities in
Brouwer, E. and Kleinknecht, A. (1999), “Innovative output, and a firm’s propensity to patent:
Calvo, J.L. (2006), “Testing Gibrat’s law for small, young and innovating firms”, Small Business
Cambridge, MA.
Camison C. and Lopez A.V. (2010), ‘An Examination of the Relationship between
Manufacturing Flexibility and Firm Performance: The Mediating Role Of Innovation,’
International Journal of Operations & Production Management, 30(8), 853-878.
Capon, N., Farley, J.U. and Hoenig, S.M. (1990), ‘A meta-analysis of Financial Performance,’
Management Science, 36 (10), 1143-1160.
Cardinal, L. (2001), Technological innovation in the pharmaceutical industry: the use of
organizational control in managing research and development, Organization Science, 12 (1), 19-
36.
Chanaron, J. J. (1998). ‘Managing Innovation in European Small and Medium-Sized
Enterprises’. Nijmegen Lectures on Innovation Management. Antwerp: Catholic University,
Nijmegen Business School.
Chandler. G. N, Keller. C and Lyon. D. W, (2000), “Unraveling the determinants and
consequences of an innovation-supportive organizational culture”, Entrepreneurship Theory and
Practice, Vol. 25 No. 1, pp. 59-76.
Chen, H.H., Kang, Y.K., Xing, X., Lee, A.H.I. and Tong, Y. (2008): Developing new products
with knowledge management methods and process development management in a network.
Computers in Industry, 59 (2/3): 242–253.
Chen, Y. (2006). Marketing innovation. Journal of Economics & Management Strategy, 15(1),
101-123.
Cohen, W. M. and S. Klepper (1996), ‘A Reprise of Size and R&D’, The Economic Journal 106,
925-
Cohen, W. M., & Levinthal, D. A. (1990). Absorptive capacity: a new perspective on learning
and innovation. Administrative Science Quarterly, 35(1) 128-152.
56 | P a g e
Companies: An Empirical Study,’ Product and Operations Management, 2 (1), 90-101.
Cosh, A.D. and Hughes, A. 2000. Innovation activity and performance in SMEs in Cosh, A.D.
and Hughes, A. (eds.) British Enterprise in Transition: Growth Innovation and Public Policy in
the small and medium sized enterprise sector 1994-1999 ESRC Centre for Business Research,
Cambridge.
Craig, A. and Hart, S. (1992), ‘Where to Now in New Product Development Research,’
European Journal of Marketing, 26 (11), 1-49.
Cranfield University School of Management.
Danneels, E., and E. J. Kleinschmidt (2001). ‘Product Innovativeness from the Firm’s
Perspective: Its Dimensions and their Relation with Project Selection and Performance’ The
Journal of Product Innovation Management, 18: 357–73.
Drew, S. A. W. (1997). From knowledge to action: the impact of benchmarking on
organizational performance. Long Range Planning, 30(3), 427-441.
Ettlie, J. E., & Reza, E. M. (1992). Organizational integration and process innovation Academy
of Management Journal, 35(4), 795-827.
Evangelista, R., Perani, G., Rapiti, F., & Archibugi, D. (1997). Nature and impact of innovation
in manufacturing industry: some evidence from the Italian innovation survey Research Policy,
26(4-5), 521-536.
Fabling, R.B. and Grimes, A. (2007), “Practice makes profit: business practices and firm
success”,
Fagerberg, J., Mowery, D. C., & Nelson, R. R. (2006). The Oxford handbook of innovation:
Oxford University Press, USA.
for 16 countries”, Small Business Economics, Vol. 33 No. 1, pp. 59-75.
Forker, L. B., Vickery, S. K. and Droge, C. L. (1996), ‘The Contribution of Quality to Business
Performance,’ International Journal of Operations and Production Management, 16 (8), 44-62.
Frappaolo, C. Knowledge Management. Chichester: Capstone Publishing Ltd., 2006, ISBN 1-
84112-705-1.
Freel, M. (2000), “Do small innovating firms outperform non-innovators?”, Small Business
Freel, M. and Robson, P.J.A. (2004), “Small firm innovation, growth and performance, evidence
Freel, M.S. (2000), Do Small Innovating Firms Outperform Non-Innovators? Small Business
Economics 14: pp. 195-210.
57 | P a g e
Freeman, C. and Soete, L. (1997), The Economics of Industrial Innovation, 3rd ed., MIT Press,
from Scotland and Northern England”, International Small Business Journal, Vol. 22 No. 6,
Garcia, R. and Calantone, R. (2002), A critical look at technological innovation typology and
innovativeness terminology: a literature review, The Journal of Product Innovation
García-Muiña, Fernando E. and Navas-López, José E. (2007). Explaining and measuring success
in new business: The effect of technological capabilities on firm results.
Garvin, D. A. (1987), ‘Competing on the eight dimensions of quality,’ Harvard Business Review,
65 (6), pp 101-109.
Gaskins, D.W. (1971), Dynamic Limit Pricing: Optimal Pricing Under Threat of Entry, Journal
of Economic Theory 3: pp. 306-322.
Geroski, P. A., S. Machin and C. F. Walters (1997), ‘Corporate Growth and Profitability’, The
Journal
Geroski, P. and M. Mazzucato (2002), ‘Learning and the Sources of Corporate Growth’,
Industrial
Gopalakrishnan, S. and Damanpour, F. (1997), ‘A Review Economics of Innovation Research in
Sociology and Technology Management,’ Omega, 25 (1), 15-28.
Gort, M., S Klepper (1982), Time paths in the diffusion of product innovations, Economic
Journal 92, pp. 630-653.
growth history and growth expectations”, International Entrepreneurship and
Growth in the Evolution of the Drug Industry’, International Journal of Industrial Organization
Hadjimanolis, A. (2003). The Barriers approach to Innovation. In: Shavinina, L. V. (Ed.), The
International Handbook on Innovation. Elsevier Science, Oxford.
Han, J. K., Kim, N. and Srivastava, R. K. (1998), ‘Market Orientation and Organizational
Performance: Is
Henderson, J. 2002. Building the Rural Economy with High-Growth Entrepreneurs. Economic
Review. 87(3): 45-70.
Henderson, R. M., & Clark, K. B. (1990). Architectural innovation: The reconfiguration of
existing product technologies and the failure of established firms. Administrative
Hitt, M. A., Hoskisson, R. E., Ireland, R. D., & Harrison, J. S. (1991). Effects of acquisitions on
R&D inputs and outputs. Academy of Management Journal,34(3), 693- 706.

58 | P a g e
Ho¨lzl, W. (2009), “Is the R&D behaviour of fast-growing SMEs different? Evidence from CIS
data
Hoffman, K., M. Parejo, J. Bessant, and L. Perren (1998). ‘Small Firms, R&D, Technology and
Innovation in the UK: A Literature Review’. Technovation, 18 (1): 39–55.
Hoffmann, W.H. and Schlosser, R. (2001): Success Factors of Strategic Alliances in Small and
Medium-sized Enterprises—An Empirical Survey. Long Range Planning, 34: 357-381.
Huggins, R. and Johnston, A. (2009): Knowledge Networks in an Uncompetitive Region: SME
Innovation and Growth. Growth and Change, 40 (2): 227–259.
ICE (1999), ‘Cost Effective IC Manufacturing 1998-1999’, Technical Report, Integrated Circuit
indicators: the Italian experience”, Research Policy, Vol. 25 No. 5, pp. 689-711.
Jáč, I., Rydvalová, P., Žizka, M. Inovace v malém a středním podnikání. Brno: Computer Press,
2005, ISBN 80-251-0853-8.
Jansen, J. J. P., Van Den Bosch, F. A. J., & Volberda, H. W. (2006). Exploratory innovation,
exploitative innovation, and performance: Effects of organizational antecedents and
environmental moderators Management Science,52(11), 1661-1674.
Johansen K (2005): Collaborative Product Introduction within Extended Enterprises. PhD,
Linköpings University.
Jong, J. P. J. and Vermeulen, P. A. M. (2006), ‘Determinants of Product Innovation in Small
Firms: A Comparison across Industries,’ International Small Business Journal, 24 (6), 587-609.
Journal 12, 61-74.
Kao, J.J. (1989), ‘Entrepreneurship, Creativity and Organization: Test, Cases and Reading,
Prentice Hall, New Jersey.
Kickul, J. and Gundry, L. 2002. Prospecting for Strategic Advantage: The Proactive
Entrepreneurial Personality and Small Firm Innovation. Journal of Small Business Management.
40(2): 85-97.
Koellinger, P. (2008), “The relationship between technology, innovation, and firm performance –
Krishnaswamy K.N., Bala-Subrahmanya, M.H. and Mathirajan, M. (2010): Process and
outcomes of technological innovations in electronics industry SMEs of Bangalore: A case study
approach. Asian Journal of Technology Innovation,18 (2): 143-167.
Kuratko, D.F. and Hodgetts, R.M. (2004), ‘Entrepreneurship: Theory, Process and Practices, 6th
edition, Smith western, USA.
59 | P a g e
Langley, D.J., Pals, N. and Ort, J.R. (2005), ‘Adoption of Behaviour: Predicting Success for
Major
Lehtimaki, A. (1991) Management of the Innovation Process in Small Companies in Finland
IEEE
Lesáková, D. Strategický marketingový manažment. Bratislava: Vydavateľstvo SPRINT, 2007,
ISBN 80-88848-90-3.
Lesáková, Ľ. Small and Medium Enterprises in the Slovak Republik after Slovakia´s Accession
to European Union. In: Small and MediumEnterprises in Era of Globalisation and Integration.
Banská Bystrica: Faculty of Economics, Matej Bel University, 2006, ISBN 80-8083-296-X.
Lieberman, M. B., & Montgomery, D. B. (1998). First-mover (dis) advantages: Retrospective
and link with the resource-based view. Strategic Management Journal, 19(12), 1111-1125.
Lumpkin, G.T. and Dess, G.G. (1996), ‘Clarifying the Entrepreneurial Orientation Construct and
Linking It to Performance,’ Academy of Management Journal, 21 (1), 135-72.
MA, and London: The Belknap Press.
Markides, C. (1998), “Strategic innovation in established companies”, Sloan Management
Review,
Massa. S and Testa. S, (2004), “Innovation or imitation? Benchmarking: a knowledge-
management process to innovate services”, Benchmarking: An International Journal, Vol. 11 No.
6, pp. 610-20.
McCormick, D., Gebre-Egeziabher, T.K. and Kuzilwa, J. A. (eds). 2009. Industrializing Africa
in the Era of Globalization: Challenges to Clothing and Footwear Nairobi: University of Nairobi
Press.
Mellahi, K., Frynas, J. G., Finlay, P. Global Strategic Management. Oxford: Oxford University
Press, 2005, ISBN 0-19-926 615-8.
Mojžitová, S. Analýza inovačnej stratégie a inovačná aktivita malých a stredných podnikov v
SR. In: Determinanty inovačnej aktivity malých a stredných podnikov v SR. Banská Bystrica:
Ekonomická fakulta UMB, 2008, s. 52 – 74. ISBN 978-80-8083-675-7.
Moskowitz, T.J. and Vissing-Jørgensen, A. (2002), “The returns to entrepreneurial investment:
NARMSP. Pripravenosť malých a stredných podnikov na nebankové formy financovania.
Bratislava: EURO INFO CENTRE, 2005.
Nelson, R. R. (1991), ‘Why Do Firms Differ, and How Does It Matter?’, Strategic Management
60 | P a g e
Nelson, R. R. and S. G. Winter (1982), An Evolutionary Theory of Economic Change,
Cambridge,
Nelson, R.R. and Winter, S.G. (1977), “In search of useful theory of innovation”, Research
Policy,
Nohria, N., & Gulati, R. (1996). Is slack good or bad for innovation? Academy of Management
Journal, 39(5), 1245-1264.
Noke, H. and Hughes, M. (2010): Climbing the value chain Strategies to create a new product
development capability in mature SMEs. International Journal of Operations and Production
Management, 30 (2): 132-154.
OECD (2005). Oslo Manual: Proposed Guidelines for Collecting and Interpreting Technological
Innovation Data.
Oke, A., Burke, G. and Myers, A. (2004). Innovation Types and their Impact in UK SMEs.
Oliveira, B. and A. Fortunato (2006), ‘Testing Gibrat’s Law: Empirical Evidence from a Panel of
Olson, E. M., Walker Jr, O. C., & Ruekert, R. W. (1995). Organizing for effective new product
development: The moderating role of product innovativeness. The Journal of Marketing, 59(1),
48-62.
OSLO Manual (2005), (OECD) Organization for Economic Co-Operation and Development.
Guideline for collecting and interpreting innovation Data, 3rd Edition.
Oyefuga, I.O., Siyanbola, W.O., Afolabi, O.O., Dada, A.D. and Egbetokun, A.A. (2008) „SMEs
funding: an assessment of an intervention scheme in Nigeria‟, World Review of
Entrepreneurship, Management and Sustainable Development, Vol. 4, Nos. 2/3, pp.233–245.
Parker, S.C., Storey, D. and Witteloostuijn, A. (2010), “What happens to gazelles? The
importance of dynamic management strategy”, Small Business Economics, Vol. 35, pp. 203-26.
Polder, M., Leeuwen, G.V., Mohnen, P., & Raymond, W. (2010). Product, process and
organizational innovation: drivers, complementarity and productivity effects: UNUMERIT,
Maastricht Economic and Social Research and Training Centre on Innovation and Technology.
Popadiuk, S. and Choo, C. W. (2006). Innovation and knowledge creation: How are these
concepts related? International Journal of Information Management 26 (2006) 302–312.
Porter, M. E. (1990). The competitive advantage of nations: with a new introduction, Free Press,
New York.
Portuguese Manufacturing Firms’, International Journal of the Economics of Business 13, 65-81.
61 | P a g e
Ramachandran, V. (2002) „An assessment of the private sector in Nigeria‟, Regional Program
on Enterprise Development, Africa Private Sector Department, Small and Medium Enterprise
Department, The World Bank Group.
Rammer, C., H. Penzkofer, A. Stephan, C. Grenzmann (2004), FuE- und Innovationsverhalten
von KMU und Großunternehmen unter dem Einfluss der Konjunktur. Studien zum deutschen
Innovation system Nr. 22-2004.
regimes”, Journal of Business Venturing, Vol. 21 No. 5, pp. 687-703.
Roberts, P. W., & Amit, R. (2003). The dynamics of innovative activity and competitive
advantage: The case of Australian retail banking, 1981 to 1995. Organization Science,14(2),
107-122.
Roper, S. (1997), “Product innovation and small business growth: a comparison of the strategies
Roper, S. (1997), Product innovation and small business growth: a comparison of the strategy of
German, UK and Irish companies, Small Business Economics, 9(6), 523- 37.
Roper, S. (1997): Product Innovation and Small Business Growth: A Comparison of the
Strategies of German, UK and Irish Companies. Small Business Economics, 9: 523-537.
Salami, A.T. (2003) Guidelines and Stakeholders Responsibilities. SMIEIS in Seminar on Small
and Medium Industries Equity Investments Scheme (SMIEIS), Central Bank of Nigeria (CBN)
Training Centre, Lagos, No. 4, pp.45–60.
Salavou, H., Baltas, G. and Lioukas, S. (2004), “Organisational innovation in SMEs: the
importance of strategic orientation and competitive structure”, European Journal of Marketing,
Vol. 38 No. 9, pp. 1091-112.
Santarelli, E. and Piergiovanni, R. (1996), “Analyzing literature based innovation output
Scherer, F.M. (1980): Industrial market structure and economic performance. Chicago: Rand
McNally.
Souitaris, V. (2003). Determinants of technological innovation: Current state of the art, modern
research trends and future prospects. In: Shavinina L. V. (ed.), The International Handbook on
Innovation. Elsevier Science, Oxford.
Storey, D. J. Understanding The Small Business Sector. London: International Thomson
Business Press, 1997, ISBN 0-415-10038-0.
Storey,D.J. (2003) Entrepreneurship, Small and Medium Sized Enterprises and Public Policies
London: International Thompson Business Press.
62 | P a g e
Strategic Management Journal, 11(7), 535-557.
Terziovski, M. (2003), “The relationship between networking practices and business excellence:
a study of small to medium enterprises (SMEs)”, Measuring Business Excellence, Vol. 7 No. 2,
pp. 78-92.
Thompson, V. A. (1965). Bureaucracy and innovation. Administrative Science Quarterly, 10(1),
1-20.
Thornhill, S. (2006), “Knowledge, innovation and firm performance in high- and low-technology
Thornhill, S. and Gellatly, G. (2005), “Intangible assets and entrepreneurial finance: the role of
Turock, A. (2001), Strategic innovation, Executive Excellence, 19(9), 9-10.
Tushman, M. L. and Anderson, P. (1986). Technological discontinuities and organizational
environments. Administrative Science Quarterly 31, 439–466.
Ussman, A. M., A. Almeida, A., J. Ferreira, M. Franco, and L. Mendes (2001). ‘SMEs and
Innovation: Perceived Barriers and Behavioural Patterns’. The International Journal of
Entrepreneurship and Innovation, 2 (2): 111–18.
Utterback, J.M., W.J. Abernathy (1975), A Dynamic Model of Process and Product Innovation,
Omega: The international journal of Management Sciences 3, 639-655.
Vaessen, P. and Keeble, D. (1995), “Growth-oriented SMEs in unfavourable regional Vol. 39
No. 3, pp. 31-42.
Vonortas, N. S., and L. Xue (1997). ‘Process Innovation in Small Firms: Case Studies on CNC
Machine Tools’. Technovation, 17 (8): 427–38.
Wan, D., Ong, C.H. and Lee, F. (2005), ‘Determinants of Firm Innovation in Singapore,’
Technovation, 25 (3), 261-8.
Wang, C.L. and Ahmed, P.K. (2004), ‘The Development and Validation of the Organizational
Innovativeness Construct Using Confirmatory Factor Analysis,’ European Journal of Innovation
Management, 7 (4), 303-13.
Wanjiku, C. G. (2011), Industrial Innovation in the face of stiff competition from Chinese
imports; a study of small and medium scale garment firms in Nairobi Unpublished dissertation,
Nairobi University.
Welsch, J. (2006), Paradigmenwechsel beim Zusammenhang von Innovation und Beschäftigung?
Wirtschaftsdienst 2006 / 12: 811-820.

63 | P a g e
Wernerfelt, B. (1984): A resource-based view of the firm. Strategic Management Journal, 5 (2):
171-180.
Zahra, S. A. and Das, S. R. (1993), ‘Innovation Strategy and Financial Performance in
Manufacturing.

64 | P a g e
Appendix
Dear respondents, I am the student of the BBA (The Islamia University of Bahawalpur, Bahawalnagar Campus). My research topic is “The Determinants of SME’s performance in Southern Punjab (Pakistan)”. I will get information to you through to this questionnaire and this data will be used only for the research purpose. Abbreviations:
S.A = Strongly Agree 5 A = Agree 4 N = Neutral 3 D = Disagree 2 S.D = Strongly Disagree 1
Sr.# Particular S.A A N D S.D
Organizational Learning
1 Higher the learning innovation, higher the firm performance.
5 4 3 2 1
2 Organizational learning positively relates with the firm innovation.
5 4 3 2 1
3 Organizational innovation positive relationship with the firm performance.
5 4 3 2 1
4 External sources (reports, consultants, newsletters, etc.) are extremely important for the operations of our organization.
5 4 3 2 1
5 Our organization has employees whose job is related to searching for external information.
5 4 3 2 1
6 Our competitors are an extremely important source for learning new methods and services.
5 4 3 2 1
Marketing Activities
7 We manage to cope with market demands and develop new products quickly.
5 4 3 2 1
8 We continuously modify design of our products and rapidly enter new emerging markets.
5 4 3 2 1

65 | P a g e
9 Most of our marketing decisions are based on exchanging information with those in our personal and professional network.
5 4 3 2 1
10 Evaluating the critical determinants for adopting e-market in Pakistan small-and-medium sized enterprises.
5 4 3 2 1
Technological Innovation
11 Technological changes provide big opportunities in our industry.
5 4 3 2 1
12 A large number of new product ideas have been made possible through technological Breakthroughs in our industry.
5 4 3 2 1
13 The interaction between innovation capital and IT capital has a positive effect on firm performance.
5 4 3 2 1
14 Innovation is perceived as too risky and is resisted.
5 4 3 2 1
Financial Factors
15 This firm has committed resources that can quickly be used to fund new initiatives.
5 4 3 2 1
16
We strongly involve our suppliers in our research and development processes.
5 4 3 2 1
17 We are able to obtain resources at short notice to support new strategic initiatives.
5 4 3 2 1
18 This firm has committed resources that can quickly be used to fund new initiatives.
5 4 3 2 1
Entrepreneurial Skills 19 Innovation proposals are welcome in
the organization. 5 4 3 2 1
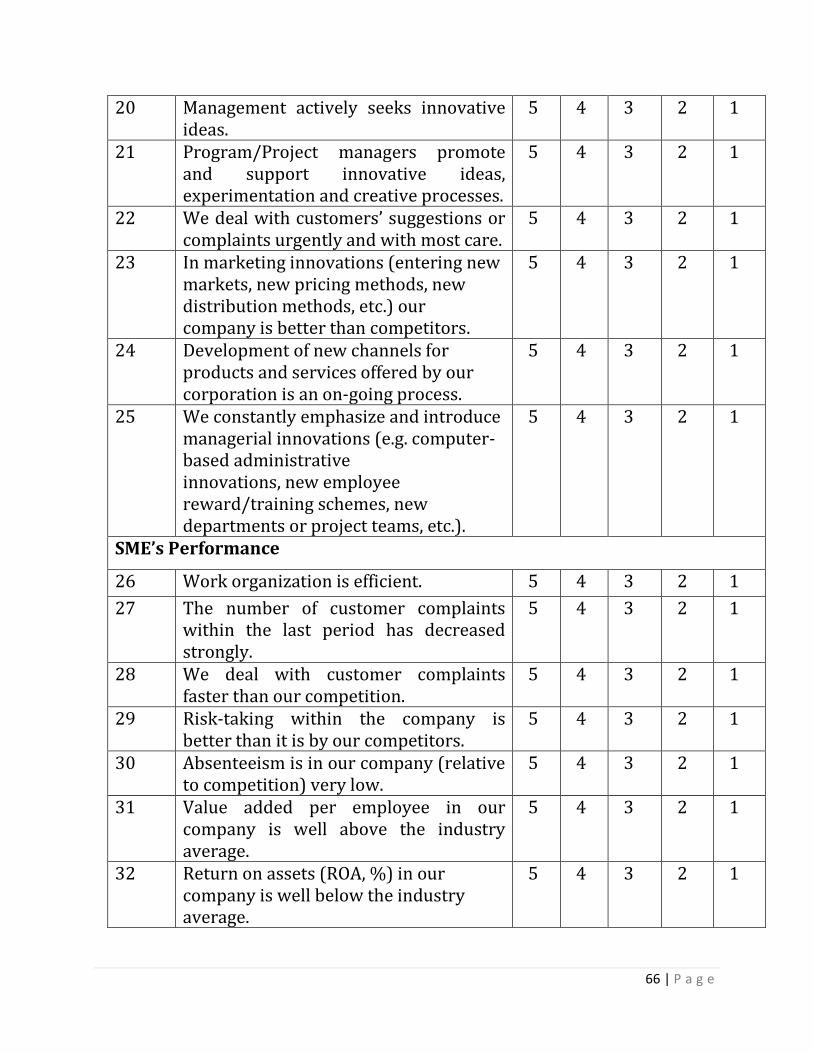
66 | P a g e
20 Management actively seeks innovative ideas.
5 4 3 2 1
21 Program/Project managers promote and support innovative ideas, experimentation and creative processes.
5 4 3 2 1
22 We deal with customers’ suggestions or complaints urgently and with most care.
5 4 3 2 1
23 In marketing innovations (entering new markets, new pricing methods, new distribution methods, etc.) our company is better than competitors.
5 4 3 2 1
24 Development of new channels for products and services offered by our corporation is an on-going process.
5 4 3 2 1
25 We constantly emphasize and introduce managerial innovations (e.g. computer-based administrative innovations, new employee reward/training schemes, new departments or project teams, etc.).
5 4 3 2 1
SME’s Performance
26 Work organization is efficient. 5 4 3 2 1
27 The number of customer complaints within the last period has decreased strongly.
5 4 3 2 1
28 We deal with customer complaints faster than our competition.
5 4 3 2 1
29 Risk-taking within the company is better than it is by our competitors.
5 4 3 2 1
30 Absenteeism is in our company (relative to competition) very low.
5 4 3 2 1
31 Value added per employee in our company is well above the industry average.
5 4 3 2 1
32 Return on assets (ROA, %) in our company is well below the industry average.
5 4 3 2 1
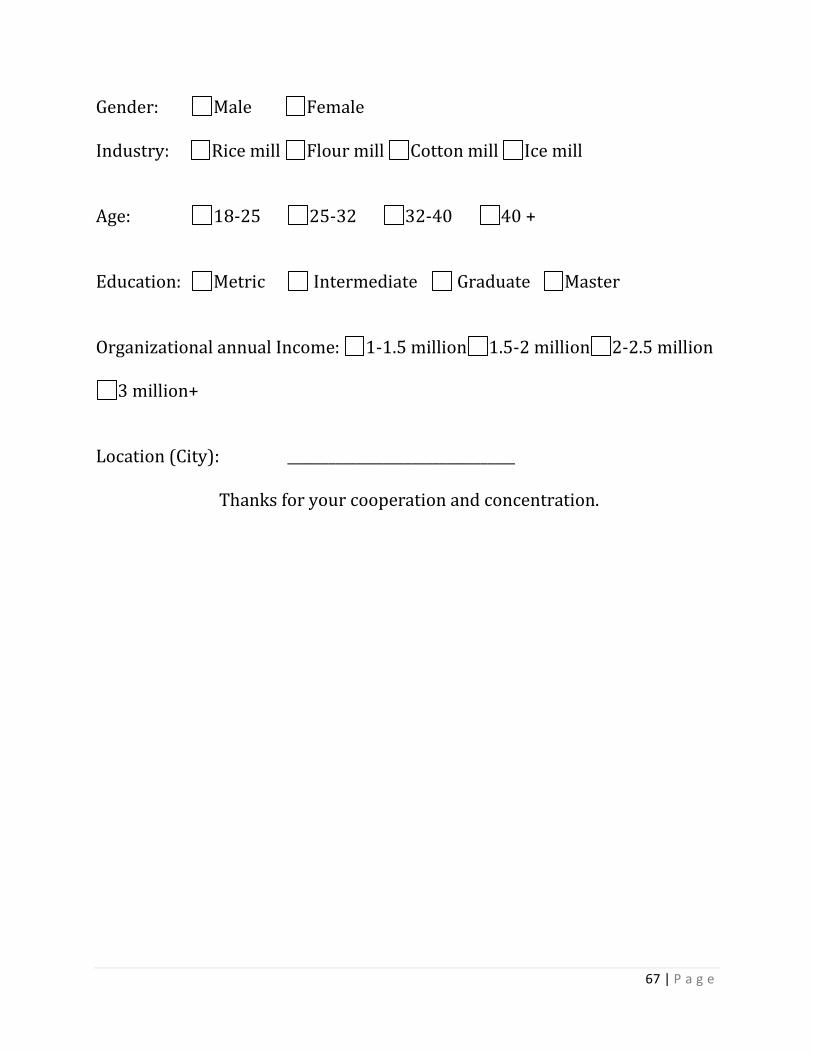
67 | P a g e
Gender: Male Female Industry: Rice mill Flour mill Cotton mill Ice mill Age: 18-25 25-32 32-40 40 + Education: Metric Intermediate Graduate Master Organizational annual Income: 1-1.5 million 1.5-2 million 2-2.5 million
3 million+ Location (City): _________________________________ Thanks for your cooperation and concentration.
Related Documents