Acid hydrolysis of Curcuma longa residue for ethanol and lactic acid fermentation Cuong Mai Nguyen a,b , Thanh Ngoc Nguyen c , Gyung Ja Choi b , Yong Ho Choi b , Kyoung Soo Jang b , Youn-Je Park d , Jin-Cheol Kim a,b,⇑ a Department of Green Chemistry and Environmental Biotechnology, University of Science and Technology, 217, Gajungro, Yuseong-gu, Daejeon 305-333, Republic of Korea b Research Center for Biobased Chemistry, Division of Convergence Chemistry, Korea Research Institute of Chemical Technology, Daejeon 305-600, Republic of Korea c Department of Phytochemistry, Viet Nam Institute of Industrial Chemistry, No. 2 Pham Ngu Lao Street, Hanoi, Viet Nam d Department of Food Science and Technology, College of Industrial Sciences, Kongju National University, 54, Yesan-eup, Yesan-gun, Chungcheongnam-do 340-702, Republic of Korea highlights Acid hydrolysis of Curcuma longa waste for non-detoxification fermentation was modelled. The selected optimum conditions were 4.91% sulfuric acid, 122.68 °C and 50 min. The hydrolysate contained 144 g RS/L, 2.59 g HMF/L and 0.79 g furfural/L. Lactic acid and ethanol were produced with high productivities and concentrations. article info Article history: Received 20 August 2013 Received in revised form 8 October 2013 Accepted 11 October 2013 Available online 19 October 2013 Keywords: Curcuma longa residue Lactic acid Ethanol 5-Hydroxymethylfurfural Furfural abstract This research examines the acid hydrolysis of Curcuma longa waste, to obtain the hydrolysate containing lactic acid and ethanol fermentative sugars. A central composite design for describing regression equa- tions of variables was used. The selected optimum condition was 4.91% sulphuric acid, 122.68 °C and 50 min using the desirability function under the following conditions: the maximum reducing sugar (RS) yield is within the limited range of the 5-hydroxymethylfurfural (HMF) and furfural concentrations. Under the condition, the obtained solution contained 144 g RS/L, 0.79 g furfural/L and 2.59 g HMF/L and was directly fermented without a detoxification step. The maximum product concentration, average pro- ductivity, RS conversion and product yield were 115.36 g/L, 2.88 g/L/h, 89.43% and 64% for L-lactic acid; 113.92 g/L, 2.59 g/L/h, 88.31% and 63.29% for D-lactic acid; and 55.03 g/L, 1.38 g/L/h, 42.66 and 30.57%, respectively, for ethanol using a 7-L jar fermenter. Ó 2013 Published by Elsevier Ltd. 1. Introduction Turmeric is derived from the rhizome of the plant Curcuma longa. It is a tropical herb of the Zingiberaceae family, which is native to Southern Asia. The powdered rhizome has been used since antiquity as a condiment, dye and medicinal aromatic stim- ulant. The curcuminoid pigments are major secondary metabo- lites in turmeric and comprise 2–8% of C. longa. They have demonstrated a remarkable variety of beneficial pharmacological activities, including antioxidant, antiarthritic, antimutagenic, antitumor, antithrombotic, antivenom, antimicrobial, nematacidal, choleretic and antihepatotoxic activities (Prasad and Aggarwal, 2011). After extraction of the oleoresin for its primary colouring com- ponents (curcuminoids), the major portion of the residue is pre- dominantly starch. This agro-industrial residue contains as much as 78.45–84.55% of the initial material, has high carbohydrate con- tent and no commercial value. Oleoresin is extracted using organic solvents such as acetone, ethyl acetate, chloroform, methanol, eth- anol or supercritical CO 2 modified with 10% ethanol. The oleoresin yields are 15.45–21.55% (g/g), depending on the solvent, material and isolation conditions. C. longa is 60–70% carbohydrate, 2–7% fi- bre, 3–7% mineral matter and 6–8% protein, which remain in the residue (Balakrishman, 2007; Nguyen et al., 2013). Unlike other agro-industrial residues or lignocellulosic bio- masses, such as wheat straw, cotton stalk, sugarcane bagasse, corn stover, corn cob, rice bran, switch grass, hardwood stems, softwood stems and green microalga (John et al., 2007b; Nguyen et al., 2012a,b; Sun and Cheng, 2002), which are composed of carbohydrate polymers (cellulose, hemicelluloses) and an aromatic 0960-8524/$ - see front matter Ó 2013 Published by Elsevier Ltd. http://dx.doi.org/10.1016/j.biortech.2013.10.039 ⇑ Corresponding author at: Research Center for Biobased Chemistry, Division of Convergence Chemistry, Korea Research Institute of Chemical Technology, Daejeon 305-600, Republic of Korea. Tel.: +82 42 8607436; fax: +82 42 8614913. E-mail address: [email protected] (J.-C. Kim). Bioresource Technology 151 (2014) 227–235 Contents lists available at ScienceDirect Bioresource Technology journal homepage: www.elsevier.com/locate/biortech

Welcome message from author
This document is posted to help you gain knowledge. Please leave a comment to let me know what you think about it! Share it to your friends and learn new things together.
Transcript
Bioresource Technology 151 (2014) 227–235
Contents lists available at ScienceDirect
Bioresource Technology
journal homepage: www.elsevier .com/locate /bior tech
Acid hydrolysis of Curcuma longa residue for ethanol and lactic acidfermentation
0960-8524/$ - see front matter � 2013 Published by Elsevier Ltd.http://dx.doi.org/10.1016/j.biortech.2013.10.039
⇑ Corresponding author at: Research Center for Biobased Chemistry, Division ofConvergence Chemistry, Korea Research Institute of Chemical Technology, Daejeon305-600, Republic of Korea. Tel.: +82 42 8607436; fax: +82 42 8614913.
E-mail address: [email protected] (J.-C. Kim).
Cuong Mai Nguyen a,b, Thanh Ngoc Nguyen c, Gyung Ja Choi b, Yong Ho Choi b, Kyoung Soo Jang b,Youn-Je Park d, Jin-Cheol Kim a,b,⇑a Department of Green Chemistry and Environmental Biotechnology, University of Science and Technology, 217, Gajungro, Yuseong-gu, Daejeon 305-333, Republic of Koreab Research Center for Biobased Chemistry, Division of Convergence Chemistry, Korea Research Institute of Chemical Technology, Daejeon 305-600, Republic of Koreac Department of Phytochemistry, Viet Nam Institute of Industrial Chemistry, No. 2 Pham Ngu Lao Street, Hanoi, Viet Namd Department of Food Science and Technology, College of Industrial Sciences, Kongju National University, 54, Yesan-eup, Yesan-gun, Chungcheongnam-do 340-702, Republic of Korea
h i g h l i g h t s
� Acid hydrolysis of Curcuma longa waste for non-detoxification fermentation was modelled.� The selected optimum conditions were 4.91% sulfuric acid, 122.68 �C and 50 min.� The hydrolysate contained 144 g RS/L, 2.59 g HMF/L and 0.79 g furfural/L.� Lactic acid and ethanol were produced with high productivities and concentrations.
a r t i c l e i n f o
Article history:Received 20 August 2013Received in revised form 8 October 2013Accepted 11 October 2013Available online 19 October 2013
Keywords:Curcuma longa residueLactic acidEthanol5-HydroxymethylfurfuralFurfural
a b s t r a c t
This research examines the acid hydrolysis of Curcuma longa waste, to obtain the hydrolysate containinglactic acid and ethanol fermentative sugars. A central composite design for describing regression equa-tions of variables was used. The selected optimum condition was 4.91% sulphuric acid, 122.68 �C and50 min using the desirability function under the following conditions: the maximum reducing sugar(RS) yield is within the limited range of the 5-hydroxymethylfurfural (HMF) and furfural concentrations.Under the condition, the obtained solution contained 144 g RS/L, 0.79 g furfural/L and 2.59 g HMF/L andwas directly fermented without a detoxification step. The maximum product concentration, average pro-ductivity, RS conversion and product yield were 115.36 g/L, 2.88 g/L/h, 89.43% and 64% for L-lactic acid;113.92 g/L, 2.59 g/L/h, 88.31% and 63.29% for D-lactic acid; and 55.03 g/L, 1.38 g/L/h, 42.66 and 30.57%,respectively, for ethanol using a 7-L jar fermenter.
� 2013 Published by Elsevier Ltd.
1. Introduction
Turmeric is derived from the rhizome of the plant Curcumalonga. It is a tropical herb of the Zingiberaceae family, which isnative to Southern Asia. The powdered rhizome has been usedsince antiquity as a condiment, dye and medicinal aromatic stim-ulant. The curcuminoid pigments are major secondary metabo-lites in turmeric and comprise 2–8% of C. longa. They havedemonstrated a remarkable variety of beneficial pharmacologicalactivities, including antioxidant, antiarthritic, antimutagenic,antitumor, antithrombotic, antivenom, antimicrobial, nematacidal,choleretic and antihepatotoxic activities (Prasad and Aggarwal, 2011).
After extraction of the oleoresin for its primary colouring com-ponents (curcuminoids), the major portion of the residue is pre-dominantly starch. This agro-industrial residue contains as muchas 78.45–84.55% of the initial material, has high carbohydrate con-tent and no commercial value. Oleoresin is extracted using organicsolvents such as acetone, ethyl acetate, chloroform, methanol, eth-anol or supercritical CO2 modified with 10% ethanol. The oleoresinyields are 15.45–21.55% (g/g), depending on the solvent, materialand isolation conditions. C. longa is 60–70% carbohydrate, 2–7% fi-bre, 3–7% mineral matter and 6–8% protein, which remain in theresidue (Balakrishman, 2007; Nguyen et al., 2013).
Unlike other agro-industrial residues or lignocellulosic bio-masses, such as wheat straw, cotton stalk, sugarcane bagasse, cornstover, corn cob, rice bran, switch grass, hardwood stems, softwoodstems and green microalga (John et al., 2007b; Nguyen et al.,2012a,b; Sun and Cheng, 2002), which are composed ofcarbohydrate polymers (cellulose, hemicelluloses) and an aromatic
228 C.M. Nguyen et al. / Bioresource Technology 151 (2014) 227–235
polymer (lignin), the carbohydrate residue of C. longa is mainlystarch, up to 50% (Nguyen et al., 2013). Hence, it is amenable tosaccharification and subsequent fermentation to end products suchas ethanol, lactic acid and succinic acid. Due to the crystallinestructure of cellulose, it is poorly amenable to hydrolysiswhen compared with starch. In addition, lignin is difficult touse as a fermentation substrate because it makes the biomassresistant to chemical and biological degradation. Furthermore,pentose sugars such as xylose and arabinose released from hemi-celluloses are unavailable to most microorganisms (Mosier et al.,2005; Okano et al., 2010). Due to the recalcitrant structure andthe inability to ferment the sugar units of lignocelluloses, apretreatment step is required in biological processes. The pretreat-ment cost is the second most expensive unit cost in the cellulosicethanol production process following the feedstock cost (Mosieret al., 2005).
Agro-industrial residues provide an attractive, abundant andlow cost renewable resource for biofuels, chemicals andbioplastics. Currently, ethanol and lactic acid are produced infermentation processes, in which yeast, fungi and ethanol- or lacticacid-producing bacteria convert fermentative sugars to end prod-ucts. The ethanol and lactic acid produced today are primarilymanufactured from sugar or starch-based raw materials(Abdel-Rahman et al., 2011; Almeida et al., 2007; Sun and Cheng,2002). However, very large scale use of ethanol and lactic acid willrequire production from agro-industrial residues, which cancontribute significantly to the future energy and global supply ofvalue-added chemicals without competing with the increasingfood demand for existing arable land. Moreover, use of thisbiomass would help to overcome many environmental problems(Abdel-Rahman et al., 2011, 2013; Gallezot, 2012).
The carbohydrates present in agro-industrial residues must behydrolysed to fermentative sugars. This step is typically based onacidic or enzymatic hydrolysis. Both hydrolysates can generate asugar solution that can be fermented to produce biotechnologicalproducts. For C. longa residue, pretreatment to remove hemicellu-loses and lignin in biomass is not necessary because of high starch,low fibre and low or non-lignin contents. Compared with enzy-matic starch hydrolysis, acid hydrolysis has some advantages, suchas a non-gelatinisation step and short reaction times. In addition,chemical hydrolysis is often favourable because the cost of enzymeproduction is high.
Due to the high temperature and acidic conditions of hydroly-sis, the released sugars are degraded and generate two furanderivatives: furfural and 5-hydroxymethylfurfural (HMF), whichremain in the glucose solution. These by-products are microbialgrowth inhibitors; therefore, they must be limited to lowconcentrations to allow subsequent fermentation. This is themain drawback of acid hydrolysis. The other drawback is thenecessity of neutralising the acid medium (Guerra-Rodrıguezet al., 2012a,b).
The generation of new material from waste by-products withgreat potential for industrial applications is expected. The basicidea is to make new material using secondary material and by-products from another industry. Although turmeric residue isattractive as a carbon- (mainly starch) and nitrogen-rich sourcefor biotechnological products, no strategy to optimise acid hydrol-ysates of C. longa residue for the production of ethanol and lacticacid, or any other biotechnological products, has been found inliterature.
This study examines the modelling and optimisation of the acidhydrolysis conditions using a combination of equations and thedesirability function in the following scenario: maximisation ofreducing sugar (RS) yield within the limited range of the HMFand furfural concentrations (4 g/L and 1 g/L, respectively), allowingstrains Lactobacillus paracasei LA104, Lactobacillus coryniformis
ATCC 25600 and Saccharomyces cerevisiae KCTC 7017 to produceL- and D-lactic acid and ethanol without detoxification step,respectively.
2. Methods
2.1. Hydrolysis of waste C. longa
2.1.1. Raw materialThe waste of C. longa (WCL) was collected from a curcuminoid
extraction pilot with a capacity of approximately 1200 tons ofraw material per year at the Department of Phytochemistry, VietNam Institute of Industrial Chemistry, Hanoi, Viet Nam. The meth-od for extraction and the composition of the C. longa residue weredescribed previously (Nguyen et al., 2013).
2.1.2. Acid hydrolysis and experimental designSulphuric acid hydrolysis was performed using a Wisecircu
fuzzy control system to control the temperature (±0.1 �C). Thesample was ground by a M20 Universal mill (IKA 160360X,Germany) and then loaded at a concentration of 200 g/L. Theexperiments were conducted in 50 mL bottles with a working vol-ume of 30 mL. The experimental design and operating conditionsare listed in Table 1 and use 3 independent variables and 5 levels,as described in Section 2.1.3. The hydrolysates were neutralised byCaCO3, then centrifuged at 8000 rpm for 10 min to remove thesolid part. The supernatants were used for analysis of glucose, RSand fermentation.
2.1.3. Modelling and statistical analysisResponse surface methodology (RSM), a collection of mathe-
matical and statistical techniques, is usually used for modellingand analysing systems in which the response of interest is influ-enced by several variables, allowing optimisation of the processes(Montgomery and Runger, 2002). Central composite design (CCD)determined the influence and optimisation of the 3 variables: acidconcentration, hydrolysis temperature and heating time. In thisstudy, three key variables and five concentration levels wereadopted (Table 1). According to this design, 17 experiments wereconducted, including 3 replications at the centre point for estimat-ing the purely experimental uncertainty variance in triplicate. InTable 1, the second, third and fourth columns are the levels ofthe variables expressed in coded values, whereas the real valuesare in columns 5, 6 and 7. In this way, the physical values of thefactor under study are changed to unit values that are independentof the numeric value of the factors. The value of a (a = 1.682, a con-ventional choice for the CCD) is the distance from the star points tothe central point (Barker, 2005).
The software Design-Expert (version 8.0.7.1; Stat-Ease Inc.,Minneapolis, USA) was used for experimental design, data analysisand quadratic model building. ANOVA was determined for the re-sponse function (Table 2). The relationships and interrelations ofvariables were identified by fitting the second polynomial Eq. (I)to the data obtained from the 17 experiments using mean valuesof triplicates for each experiment conducted thrice on differentoccasions:
Y ¼ a0 þX
aiXi þX
aijXiXj þX
aiiX2i ðIÞ
in which Y, predicted response is dependent variable; a0, off setterm (constant); ai, linear coefficients; aij (i – j), cross product coef-ficients; aii, quadratic coefficients; Xi, ith variable, which are codeindependent variables.
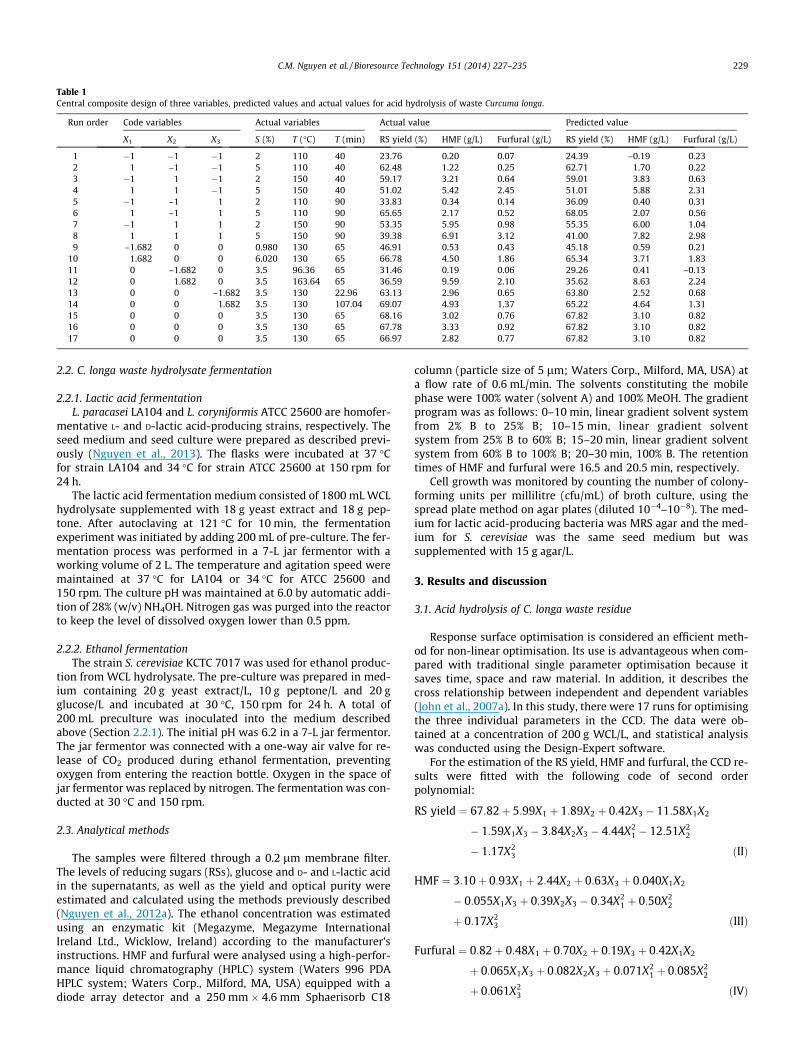
Table 1Central composite design of three variables, predicted values and actual values for acid hydrolysis of waste Curcuma longa.
Run order Code variables Actual variables Actual value Predicted value
X1 X2 X3 S (%) T (�C) T (min) RS yield (%) HMF (g/L) Furfural (g/L) RS yield (%) HMF (g/L) Furfural (g/L)
1 �1 �1 �1 2 110 40 23.76 0.20 0.07 24.39 –0.19 0.232 1 –1 �1 5 110 40 62.48 1.22 0.25 62.71 1.70 0.223 �1 1 �1 2 150 40 59.17 3.21 0.64 59.01 3.83 0.634 1 1 �1 5 150 40 51.02 5.42 2.45 51.01 5.88 2.315 �1 –1 1 2 110 90 33.83 0.34 0.14 36.09 0.40 0.316 1 –1 1 5 110 90 65.65 2.17 0.52 68.05 2.07 0.567 �1 1 1 2 150 90 53.35 5.95 0.98 55.35 6.00 1.048 1 1 1 5 150 90 39.38 6.91 3.12 41.00 7.82 2.989 –1.682 0 0 0.980 130 65 46.91 0.53 0.43 45.18 0.59 0.21
10 1.682 0 0 6.020 130 65 66.78 4.50 1.86 65.34 3.71 1.8311 0 –1.682 0 3.5 96.36 65 31.46 0.19 0.06 29.26 0.41 –0.1312 0 1.682 0 3.5 163.64 65 36.59 9.59 2.10 35.62 8.63 2.2413 0 0 –1.682 3.5 130 22.96 63.13 2.96 0.65 63.80 2.52 0.6814 0 0 1.682 3.5 130 107.04 69.07 4.93 1.37 65.22 4.64 1.3115 0 0 0 3.5 130 65 68.16 3.02 0.76 67.82 3.10 0.8216 0 0 0 3.5 130 65 67.78 3.33 0.92 67.82 3.10 0.8217 0 0 0 3.5 130 65 66.97 2.82 0.77 67.82 3.10 0.82
C.M. Nguyen et al. / Bioresource Technology 151 (2014) 227–235 229
2.2. C. longa waste hydrolysate fermentation
2.2.1. Lactic acid fermentationL. paracasei LA104 and L. coryniformis ATCC 25600 are homofer-
mentative L- and D-lactic acid-producing strains, respectively. Theseed medium and seed culture were prepared as described previ-ously (Nguyen et al., 2013). The flasks were incubated at 37 �Cfor strain LA104 and 34 �C for strain ATCC 25600 at 150 rpm for24 h.
The lactic acid fermentation medium consisted of 1800 mL WCLhydrolysate supplemented with 18 g yeast extract and 18 g pep-tone. After autoclaving at 121 �C for 10 min, the fermentationexperiment was initiated by adding 200 mL of pre-culture. The fer-mentation process was performed in a 7-L jar fermentor with aworking volume of 2 L. The temperature and agitation speed weremaintained at 37 �C for LA104 or 34 �C for ATCC 25600 and150 rpm. The culture pH was maintained at 6.0 by automatic addi-tion of 28% (w/v) NH4OH. Nitrogen gas was purged into the reactorto keep the level of dissolved oxygen lower than 0.5 ppm.
2.2.2. Ethanol fermentationThe strain S. cerevisiae KCTC 7017 was used for ethanol produc-
tion from WCL hydrolysate. The pre-culture was prepared in med-ium containing 20 g yeast extract/L, 10 g peptone/L and 20 gglucose/L and incubated at 30 �C, 150 rpm for 24 h. A total of200 mL preculture was inoculated into the medium describedabove (Section 2.2.1). The initial pH was 6.2 in a 7-L jar fermentor.The jar fermentor was connected with a one-way air valve for re-lease of CO2 produced during ethanol fermentation, preventingoxygen from entering the reaction bottle. Oxygen in the space ofjar fermentor was replaced by nitrogen. The fermentation was con-ducted at 30 �C and 150 rpm.
2.3. Analytical methods
The samples were filtered through a 0.2 lm membrane filter.The levels of reducing sugars (RSs), glucose and D- and L-lactic acidin the supernatants, as well as the yield and optical purity wereestimated and calculated using the methods previously described(Nguyen et al., 2012a). The ethanol concentration was estimatedusing an enzymatic kit (Megazyme, Megazyme InternationalIreland Ltd., Wicklow, Ireland) according to the manufacturer’sinstructions. HMF and furfural were analysed using a high-perfor-mance liquid chromatography (HPLC) system (Waters 996 PDAHPLC system; Waters Corp., Milford, MA, USA) equipped with adiode array detector and a 250 mm � 4.6 mm Sphaerisorb C18
column (particle size of 5 lm; Waters Corp., Milford, MA, USA) ata flow rate of 0.6 mL/min. The solvents constituting the mobilephase were 100% water (solvent A) and 100% MeOH. The gradientprogram was as follows: 0–10 min, linear gradient solvent systemfrom 2% B to 25% B; 10–15 min, linear gradient solventsystem from 25% B to 60% B; 15–20 min, linear gradient solventsystem from 60% B to 100% B; 20–30 min, 100% B. The retentiontimes of HMF and furfural were 16.5 and 20.5 min, respectively.
Cell growth was monitored by counting the number of colony-forming units per millilitre (cfu/mL) of broth culture, using thespread plate method on agar plates (diluted 10�4–10�8). The med-ium for lactic acid-producing bacteria was MRS agar and the med-ium for S. cerevisiae was the same seed medium but wassupplemented with 15 g agar/L.
3. Results and discussion
3.1. Acid hydrolysis of C. longa waste residue
Response surface optimisation is considered an efficient meth-od for non-linear optimisation. Its use is advantageous when com-pared with traditional single parameter optimisation because itsaves time, space and raw material. In addition, it describes thecross relationship between independent and dependent variables(John et al., 2007a). In this study, there were 17 runs for optimisingthe three individual parameters in the CCD. The data were ob-tained at a concentration of 200 g WCL/L, and statistical analysiswas conducted using the Design-Expert software.
For the estimation of the RS yield, HMF and furfural, the CCD re-sults were fitted with the following code of second orderpolynomial:
RS yield ¼ 67:82þ 5:99X1 þ 1:89X2 þ 0:42X3 � 11:58X1X2
� 1:59X1X3 � 3:84X2X3 � 4:44X21 � 12:51X2
2
� 1:17X23 ðIIÞ
HMF ¼ 3:10þ 0:93X1 þ 2:44X2 þ 0:63X3 þ 0:040X1X2
� 0:055X1X3 þ 0:39X2X3 � 0:34X21 þ 0:50X2
2
þ 0:17X23 ðIIIÞ
Furfural ¼ 0:82þ 0:48X1 þ 0:70X2 þ 0:19X3 þ 0:42X1X2
þ 0:065X1X3 þ 0:082X2X3 þ 0:071X21 þ 0:085X2
2
þ 0:061X23 ðIVÞ
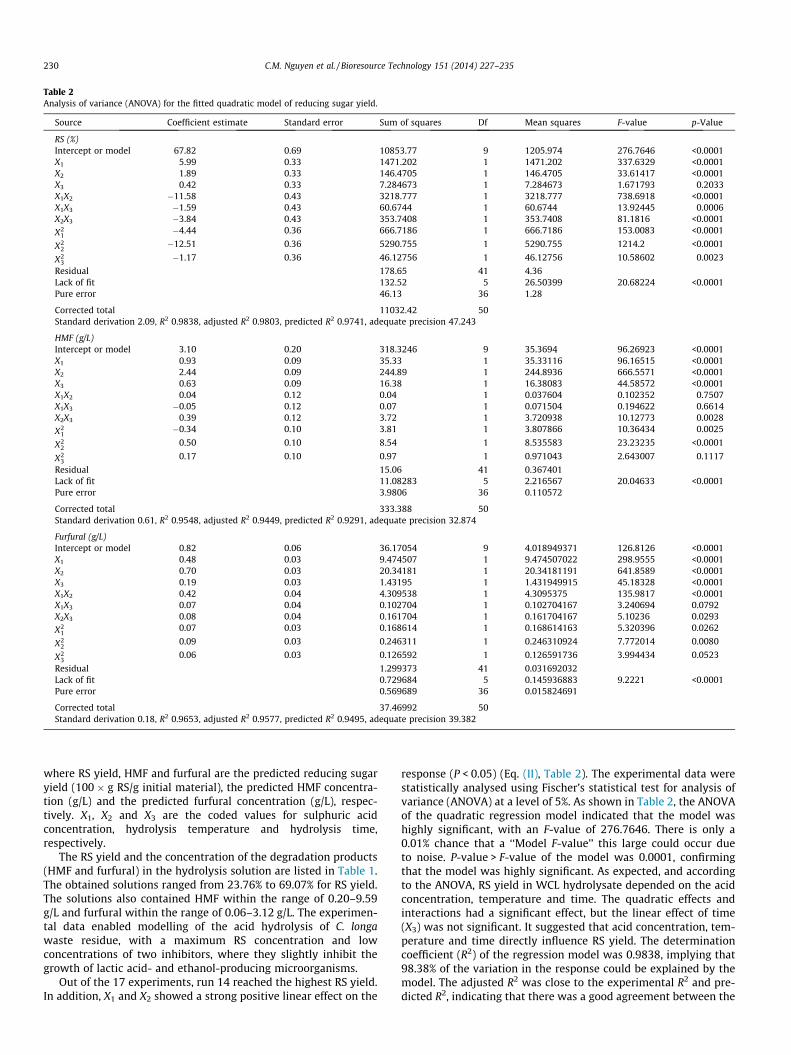
Table 2Analysis of variance (ANOVA) for the fitted quadratic model of reducing sugar yield.
Source Coefficient estimate Standard error Sum of squares Df Mean squares F-value p-Value
RS (%)Intercept or model 67.82 0.69 10853.77 9 1205.974 276.7646 <0.0001X1 5.99 0.33 1471.202 1 1471.202 337.6329 <0.0001X2 1.89 0.33 146.4705 1 146.4705 33.61417 <0.0001X3 0.42 0.33 7.284673 1 7.284673 1.671793 0.2033X1X2 �11.58 0.43 3218.777 1 3218.777 738.6918 <0.0001X1X3 �1.59 0.43 60.6744 1 60.6744 13.92445 0.0006X2X3 �3.84 0.43 353.7408 1 353.7408 81.1816 <0.0001
X21
�4.44 0.36 666.7186 1 666.7186 153.0083 <0.0001
X22
�12.51 0.36 5290.755 1 5290.755 1214.2 <0.0001
X23
�1.17 0.36 46.12756 1 46.12756 10.58602 0.0023
Residual 178.65 41 4.36Lack of fit 132.52 5 26.50399 20.68224 <0.0001Pure error 46.13 36 1.28
Corrected total 11032.42 50Standard derivation 2.09, R2 0.9838, adjusted R2 0.9803, predicted R2 0.9741, adequate precision 47.243
HMF (g/L)Intercept or model 3.10 0.20 318.3246 9 35.3694 96.26923 <0.0001X1 0.93 0.09 35.33 1 35.33116 96.16515 <0.0001X2 2.44 0.09 244.89 1 244.8936 666.5571 <0.0001X3 0.63 0.09 16.38 1 16.38083 44.58572 <0.0001X1X2 0.04 0.12 0.04 1 0.037604 0.102352 0.7507X1X3 �0.05 0.12 0.07 1 0.071504 0.194622 0.6614X2X3 0.39 0.12 3.72 1 3.720938 10.12773 0.0028
X21
�0.34 0.10 3.81 1 3.807866 10.36434 0.0025
X22
0.50 0.10 8.54 1 8.535583 23.23235 <0.0001
X23
0.17 0.10 0.97 1 0.971043 2.643007 0.1117
Residual 15.06 41 0.367401Lack of fit 11.08283 5 2.216567 20.04633 <0.0001Pure error 3.9806 36 0.110572
Corrected total 333.388 50Standard derivation 0.61, R2 0.9548, adjusted R2 0.9449, predicted R2 0.9291, adequate precision 32.874
Furfural (g/L)Intercept or model 0.82 0.06 36.17054 9 4.018949371 126.8126 <0.0001X1 0.48 0.03 9.474507 1 9.474507022 298.9555 <0.0001X2 0.70 0.03 20.34181 1 20.34181191 641.8589 <0.0001X3 0.19 0.03 1.43195 1 1.431949915 45.18328 <0.0001X1X2 0.42 0.04 4.309538 1 4.3095375 135.9817 <0.0001X1X3 0.07 0.04 0.102704 1 0.102704167 3.240694 0.0792X2X3 0.08 0.04 0.161704 1 0.161704167 5.10236 0.0293
X21
0.07 0.03 0.168614 1 0.168614163 5.320396 0.0262
X22
0.09 0.03 0.246311 1 0.246310924 7.772014 0.0080
X23
0.06 0.03 0.126592 1 0.126591736 3.994434 0.0523
Residual 1.299373 41 0.031692032Lack of fit 0.729684 5 0.145936883 9.2221 <0.0001Pure error 0.569689 36 0.015824691
Corrected total 37.46992 50Standard derivation 0.18, R2 0.9653, adjusted R2 0.9577, predicted R2 0.9495, adequate precision 39.382
230 C.M. Nguyen et al. / Bioresource Technology 151 (2014) 227–235
where RS yield, HMF and furfural are the predicted reducing sugaryield (100 � g RS/g initial material), the predicted HMF concentra-tion (g/L) and the predicted furfural concentration (g/L), respec-tively. X1, X2 and X3 are the coded values for sulphuric acidconcentration, hydrolysis temperature and hydrolysis time,respectively.
The RS yield and the concentration of the degradation products(HMF and furfural) in the hydrolysis solution are listed in Table 1.The obtained solutions ranged from 23.76% to 69.07% for RS yield.The solutions also contained HMF within the range of 0.20–9.59g/L and furfural within the range of 0.06–3.12 g/L. The experimen-tal data enabled modelling of the acid hydrolysis of C. longawaste residue, with a maximum RS concentration and lowconcentrations of two inhibitors, where they slightly inhibit thegrowth of lactic acid- and ethanol-producing microorganisms.
Out of the 17 experiments, run 14 reached the highest RS yield.In addition, X1 and X2 showed a strong positive linear effect on the
response (P < 0.05) (Eq. (II), Table 2). The experimental data werestatistically analysed using Fischer’s statistical test for analysis ofvariance (ANOVA) at a level of 5%. As shown in Table 2, the ANOVAof the quadratic regression model indicated that the model washighly significant, with an F-value of 276.7646. There is only a0.01% chance that a ‘‘Model F-value’’ this large could occur dueto noise. P-value > F-value of the model was 0.0001, confirmingthat the model was highly significant. As expected, and accordingto the ANOVA, RS yield in WCL hydrolysate depended on the acidconcentration, temperature and time. The quadratic effects andinteractions had a significant effect, but the linear effect of time(X3) was not significant. It suggested that acid concentration, tem-perature and time directly influence RS yield. The determinationcoefficient (R2) of the regression model was 0.9838, implying that98.38% of the variation in the response could be explained by themodel. The adjusted R2 was close to the experimental R2 and pre-dicted R2, indicating that there was a good agreement between the
C.M. Nguyen et al. / Bioresource Technology 151 (2014) 227–235 231
experimental values and predicted values. Another statistical mea-surement is ‘‘Adequate precision’’, which is related to the signal tonoise ratio. A ratio greater than 4 is desirable. In this study, the‘‘Adequate precision’’ was 47.243, indicating an adequate signal.Based on the equation coefficients, the effect of the acid concentra-tion and temperature are more important than the effect of thehydrolysis time.
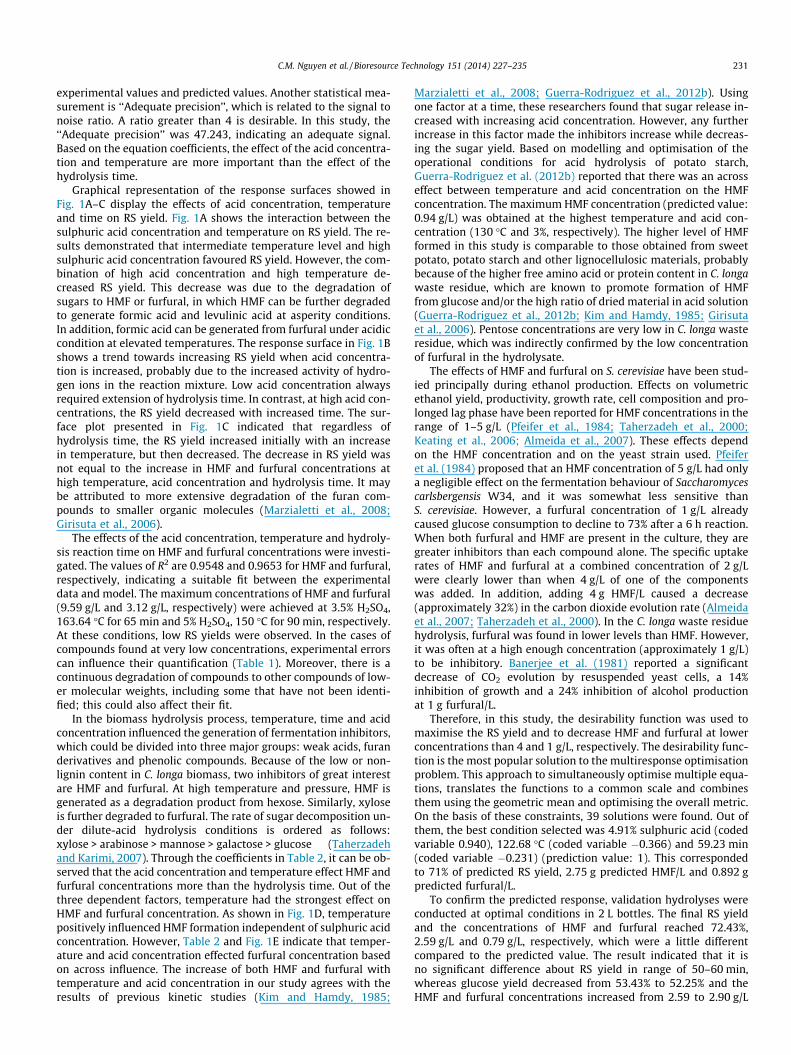
Graphical representation of the response surfaces showed inFig. 1A–C display the effects of acid concentration, temperatureand time on RS yield. Fig. 1A shows the interaction between thesulphuric acid concentration and temperature on RS yield. The re-sults demonstrated that intermediate temperature level and highsulphuric acid concentration favoured RS yield. However, the com-bination of high acid concentration and high temperature de-creased RS yield. This decrease was due to the degradation ofsugars to HMF or furfural, in which HMF can be further degradedto generate formic acid and levulinic acid at asperity conditions.In addition, formic acid can be generated from furfural under acidiccondition at elevated temperatures. The response surface in Fig. 1Bshows a trend towards increasing RS yield when acid concentra-tion is increased, probably due to the increased activity of hydro-gen ions in the reaction mixture. Low acid concentration alwaysrequired extension of hydrolysis time. In contrast, at high acid con-centrations, the RS yield decreased with increased time. The sur-face plot presented in Fig. 1C indicated that regardless ofhydrolysis time, the RS yield increased initially with an increasein temperature, but then decreased. The decrease in RS yield wasnot equal to the increase in HMF and furfural concentrations athigh temperature, acid concentration and hydrolysis time. It maybe attributed to more extensive degradation of the furan com-pounds to smaller organic molecules (Marzialetti et al., 2008;Girisuta et al., 2006).
The effects of the acid concentration, temperature and hydroly-sis reaction time on HMF and furfural concentrations were investi-gated. The values of R2 are 0.9548 and 0.9653 for HMF and furfural,respectively, indicating a suitable fit between the experimentaldata and model. The maximum concentrations of HMF and furfural(9.59 g/L and 3.12 g/L, respectively) were achieved at 3.5% H2SO4,163.64 �C for 65 min and 5% H2SO4, 150 �C for 90 min, respectively.At these conditions, low RS yields were observed. In the cases ofcompounds found at very low concentrations, experimental errorscan influence their quantification (Table 1). Moreover, there is acontinuous degradation of compounds to other compounds of low-er molecular weights, including some that have not been identi-fied; this could also affect their fit.
In the biomass hydrolysis process, temperature, time and acidconcentration influenced the generation of fermentation inhibitors,which could be divided into three major groups: weak acids, furanderivatives and phenolic compounds. Because of the low or non-lignin content in C. longa biomass, two inhibitors of great interestare HMF and furfural. At high temperature and pressure, HMF isgenerated as a degradation product from hexose. Similarly, xyloseis further degraded to furfural. The rate of sugar decomposition un-der dilute-acid hydrolysis conditions is ordered as follows:xylose > arabinose > mannose > galactose > glucose (Taherzadehand Karimi, 2007). Through the coefficients in Table 2, it can be ob-served that the acid concentration and temperature effect HMF andfurfural concentrations more than the hydrolysis time. Out of thethree dependent factors, temperature had the strongest effect onHMF and furfural concentration. As shown in Fig. 1D, temperaturepositively influenced HMF formation independent of sulphuric acidconcentration. However, Table 2 and Fig. 1E indicate that temper-ature and acid concentration effected furfural concentration basedon across influence. The increase of both HMF and furfural withtemperature and acid concentration in our study agrees with theresults of previous kinetic studies (Kim and Hamdy, 1985;
Marzialetti et al., 2008; Guerra-Rodriguez et al., 2012b). Usingone factor at a time, these researchers found that sugar release in-creased with increasing acid concentration. However, any furtherincrease in this factor made the inhibitors increase while decreas-ing the sugar yield. Based on modelling and optimisation of theoperational conditions for acid hydrolysis of potato starch,Guerra-Rodriguez et al. (2012b) reported that there was an acrosseffect between temperature and acid concentration on the HMFconcentration. The maximum HMF concentration (predicted value:0.94 g/L) was obtained at the highest temperature and acid con-centration (130 �C and 3%, respectively). The higher level of HMFformed in this study is comparable to those obtained from sweetpotato, potato starch and other lignocellulosic materials, probablybecause of the higher free amino acid or protein content in C. longawaste residue, which are known to promote formation of HMFfrom glucose and/or the high ratio of dried material in acid solution(Guerra-Rodriguez et al., 2012b; Kim and Hamdy, 1985; Girisutaet al., 2006). Pentose concentrations are very low in C. longa wasteresidue, which was indirectly confirmed by the low concentrationof furfural in the hydrolysate.
The effects of HMF and furfural on S. cerevisiae have been stud-ied principally during ethanol production. Effects on volumetricethanol yield, productivity, growth rate, cell composition and pro-longed lag phase have been reported for HMF concentrations in therange of 1–5 g/L (Pfeifer et al., 1984; Taherzadeh et al., 2000;Keating et al., 2006; Almeida et al., 2007). These effects dependon the HMF concentration and on the yeast strain used. Pfeiferet al. (1984) proposed that an HMF concentration of 5 g/L had onlya negligible effect on the fermentation behaviour of Saccharomycescarlsbergensis W34, and it was somewhat less sensitive thanS. cerevisiae. However, a furfural concentration of 1 g/L alreadycaused glucose consumption to decline to 73% after a 6 h reaction.When both furfural and HMF are present in the culture, they aregreater inhibitors than each compound alone. The specific uptakerates of HMF and furfural at a combined concentration of 2 g/Lwere clearly lower than when 4 g/L of one of the componentswas added. In addition, adding 4 g HMF/L caused a decrease(approximately 32%) in the carbon dioxide evolution rate (Almeidaet al., 2007; Taherzadeh et al., 2000). In the C. longa waste residuehydrolysis, furfural was found in lower levels than HMF. However,it was often at a high enough concentration (approximately 1 g/L)to be inhibitory. Banerjee et al. (1981) reported a significantdecrease of CO2 evolution by resuspended yeast cells, a 14%inhibition of growth and a 24% inhibition of alcohol productionat 1 g furfural/L.
Therefore, in this study, the desirability function was used tomaximise the RS yield and to decrease HMF and furfural at lowerconcentrations than 4 and 1 g/L, respectively. The desirability func-tion is the most popular solution to the multiresponse optimisationproblem. This approach to simultaneously optimise multiple equa-tions, translates the functions to a common scale and combinesthem using the geometric mean and optimising the overall metric.On the basis of these constraints, 39 solutions were found. Out ofthem, the best condition selected was 4.91% sulphuric acid (codedvariable 0.940), 122.68 �C (coded variable �0.366) and 59.23 min(coded variable �0.231) (prediction value: 1). This correspondedto 71% of predicted RS yield, 2.75 g predicted HMF/L and 0.892 gpredicted furfural/L.
To confirm the predicted response, validation hydrolyses wereconducted at optimal conditions in 2 L bottles. The final RS yieldand the concentrations of HMF and furfural reached 72.43%,2.59 g/L and 0.79 g/L, respectively, which were a little differentcompared to the predicted value. The result indicated that it isno significant difference about RS yield in range of 50–60 min,whereas glucose yield decreased from 53.43% to 52.25% and theHMF and furfural concentrations increased from 2.59 to 2.90 g/L
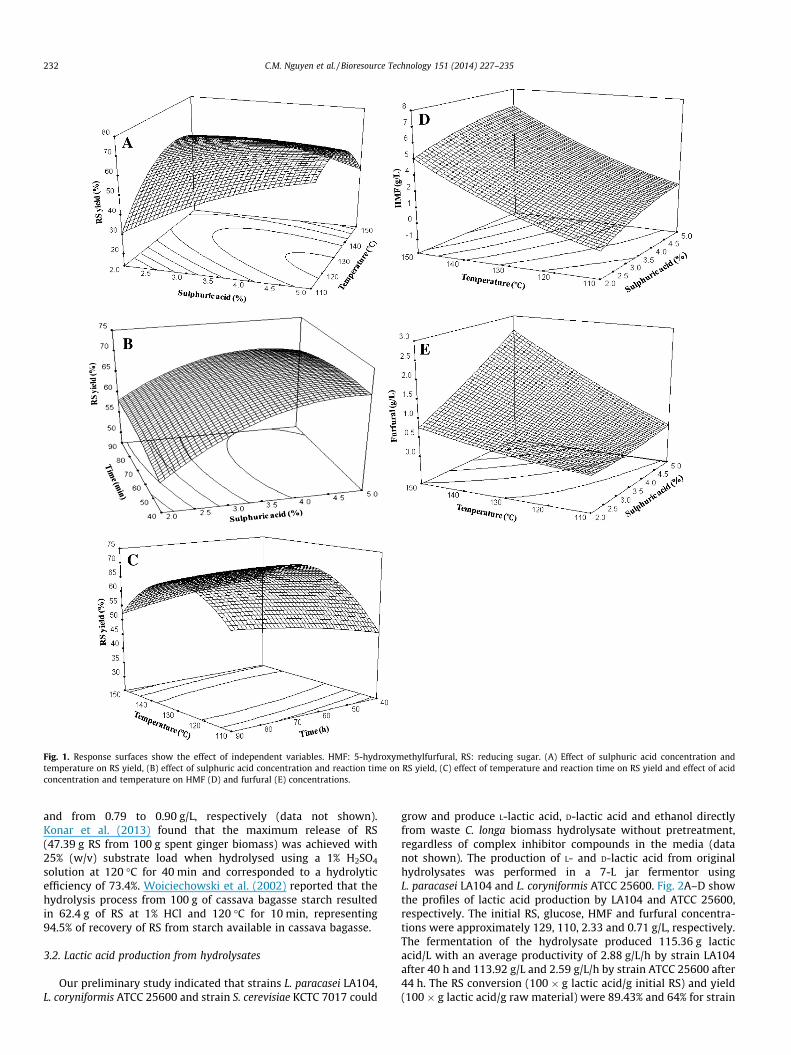
Fig. 1. Response surfaces show the effect of independent variables. HMF: 5-hydroxymethylfurfural, RS: reducing sugar. (A) Effect of sulphuric acid concentration andtemperature on RS yield, (B) effect of sulphuric acid concentration and reaction time on RS yield, (C) effect of temperature and reaction time on RS yield and effect of acidconcentration and temperature on HMF (D) and furfural (E) concentrations.
232 C.M. Nguyen et al. / Bioresource Technology 151 (2014) 227–235
and from 0.79 to 0.90 g/L, respectively (data not shown).Konar et al. (2013) found that the maximum release of RS(47.39 g RS from 100 g spent ginger biomass) was achieved with25% (w/v) substrate load when hydrolysed using a 1% H2SO4
solution at 120 �C for 40 min and corresponded to a hydrolyticefficiency of 73.4%. Woiciechowski et al. (2002) reported that thehydrolysis process from 100 g of cassava bagasse starch resultedin 62.4 g of RS at 1% HCl and 120 �C for 10 min, representing94.5% of recovery of RS from starch available in cassava bagasse.
3.2. Lactic acid production from hydrolysates
Our preliminary study indicated that strains L. paracasei LA104,L. coryniformis ATCC 25600 and strain S. cerevisiae KCTC 7017 could
grow and produce L-lactic acid, D-lactic acid and ethanol directlyfrom waste C. longa biomass hydrolysate without pretreatment,regardless of complex inhibitor compounds in the media (datanot shown). The production of L- and D-lactic acid from originalhydrolysates was performed in a 7-L jar fermentor usingL. paracasei LA104 and L. coryniformis ATCC 25600. Fig. 2A–D showthe profiles of lactic acid production by LA104 and ATCC 25600,respectively. The initial RS, glucose, HMF and furfural concentra-tions were approximately 129, 110, 2.33 and 0.71 g/L, respectively.The fermentation of the hydrolysate produced 115.36 g lacticacid/L with an average productivity of 2.88 g/L/h by strain LA104after 40 h and 113.92 g/L and 2.59 g/L/h by strain ATCC 25600 after44 h. The RS conversion (100 � g lactic acid/g initial RS) and yield(100 � g lactic acid/g raw material) were 89.43% and 64% for strain
C.M. Nguyen et al. / Bioresource Technology 151 (2014) 227–235 233
LA104 and 88.31% and 63.29% for ATCC 25600. During batchfermentation, the lactic acid concentration increased with fermen-tation time. As shown in Fig. 2A and C, the consumption profiles ofRS were almost similar to that of glucose for both strains.
Separate hydrolysis and fermentation (SHF) processes in thisstudy delayed the beginning of lactic acid production (the first4 h), which was not clearly observed in simultaneous saccharifica-tion and fermentation (SSF) from waste C. longa biomass in ourprevious study (Nguyen et al., 2013). The delay in SHF seems tobe due to the effects of inhibitor compounds in hydrolysate fromC. longa waste and/or higher glucose and RS concentrations inmedium. Laopaiboon et al. (2010) reported that the strainLactococcus lactis IO-1 could grow slightly in medium containingnon-detoxified sugarcane bagasse hydrolysate, but lactic acid wasnot produced. After an initial delay, lactic acid rapidly accumu-lated, with a maximum productivity of 3.27 and 3.15 g/L/h forstrain LA104 and ATCC 25600, respectively. Unlike the results
0.0
0.5
1.0
1.5
2.0
2.5
3.0
3.5
0
20
40
60
80
100
120
140
Prod
uctiv
ity (%
)
Glu
cose
, lac
tic a
cid,
RS
(g/l
);R
S con
vers
ion,
yie
ld (%
)
Glucose remainingRS remainingLactic acidYieldRS conversionProductivity
A
0.0
0.5
1.0
1.5
2.0
2.5
3.0
3.5
0
20
40
60
80
100
120
140
Prod
uctiv
ity (%
)
Glu
cose
, lac
tioc
acid
, RS
(g/l)
; RS
conv
ersio
n, y
ield
(%)
Glucose remainingRS remainingLactic acidYieldRS conversionProductivity
C
0.0
0.4
0.8
1.2
1.6
2.0
0
20
40
60
80
100
120
140
0 10 20 30 40 50 60
Prod
uctiv
ity(g
/l/h)
Glu
cose
, eth
anol
, RS
(g/l)
Fermentation time (h)
Glucose remaining
RS remaining
Ethanol
Productivity
E
Fig. 2. Time courses of lactic acid and ethanol production from waste Curcuma longa hydrand RS conversion, (B) and (D) log10 (cfu) and optical purity of lactic acid, (A) and (coryniformis ATCC 25600, (E) glucose, ethanol RS and productivity, (F) log10 (cfu), yield
observed from lactic acid production from Hydrodictyon reticula-tum by LA104 and ATCC 25600 (Nguyen et al., 2012a,b), themaximum cfu of both strains in lactic acid fermentation fromC. longa residue hydrolysates were lower than 9.31 and 6.09 times,respectively. At the same time, the stationary phases lasted only ashort time, approximately 12 h (Fig. 2B and D) and most of lacticacid was produced during this period. Then, the cells underwentdeath, resulting in a rapid decrease. This trend was almost thesame with the results obtained from sugarcane molasses and sugarbeet juice, but different from that obtained from sugarcane(Timbuntam et al., 2006; Calabia and Tokiwa, 2007). The rapiddecrease of cfu may be due to the additive or synergistic effectsof inhibitors and lactic acid present in hydrolysate. For both strains,approximately 10 g RS/L was left unused after 60 h. In comparisonwith SSF, SHF of lactic acid showed lower yield for both strains:64% for SHF and 69.38% for SSF for strain LA104, 63.29% for SHFand 65.43% for SSF for strain ATCC 25600 (Nguyen et al., 2013).
85
87
89
91
93
95
97
8.4
8.6
8.8
9.0
9.2
Opt
ical
pur
ity (%
)
Log1
0(cf
u)
Log10(cfu) Optical purity
B
84
86
88
90
92
94
96
98
100
8.0
8.2
8.4
8.6
8.8
9.0
9.2
9.4
Opt
ical
pur
ity (%
)
Log1
0(cf
u)
Log10(cfu) Optical purity
D
0
10
20
30
40
7.0
7.2
7.4
7.6
0 10 20 30 40 50 60
RS
conv
ersio
n, y
ield
(%)
Log1
0(cf
u)
Fermentation time (h)
Log10(cfu)
Yield
RS conversion
F
olysate. RS: reducing sugar, (A) and (C) glucose, lactic acid and RS, productivity, yieldB) from strain Lactobacillus paracasei LA104, (C) and (D) from strain Lactobacillusand RS conversion, (E) and (F) from strain Saccharomyces cerevisiae KCTC 7017.
234 C.M. Nguyen et al. / Bioresource Technology 151 (2014) 227–235
The optical purity of L-lactic acid depended on fermentation timeand was reduced from 96.38% to 95.06% when the reaction timeincreased from 40 to 60 h. The decreasing optical purity is likelydue to the conversion of L-lactic acid into D-lactic acid by thelactate racemisation (Goffin et al., 2005). In comparison, the opticalpurity of D-lactic acid was stable and reached a level of 99.5%.
3.3. Ethanol fermentation from hydrolysate
WCL hydrolysate was also used for ethanol production byS. cerevisiae KCTC 7017. The inoculum concentration was 10% andthe nitrogen sources were 10 g yeast extract/L and 10 g peptone/L.The profiles of anaerobic batch fermentation of hydrolysate in 7-Lbioreactor are shown in Fig. 2E and F. After 40 h, the fermentationgave a maximum ethanol concentration of 55.03 g/L with a yield of30.57% (100 � g ethanol/g raw material), corresponding to 94.48%of the theoretical yield, a productivity rate of 1.38 g/L/h and RSconversion of 42.66% (100 � g ethanol/g initial RS). The result clearlyindicates that S. cerevisiae KCTC 7017 acclimates well to thehydrolysates of C. longa residue without a detoxification step. Theacid hydrolysate could be used directly for ethanol production withhigh concentration, yield and productivity using the strain.
Because of the disadvantages of detoxification techniques, suchas sugar loss and cost increase, inhibitor-tolerant strains have beendeveloped using a directed adaption strategy to ferment non-detoxified lignocellulose hydrolysate (Almeida et al., 2007). Yanget al. (2011) reported that ethanol production from enzymatichydrolysis of non-detoxified steam-exploded corn stalk by Pichiastipitis-adapted strain produced 43.42 g ethanol/L with ethanolyield of 0.47 g/g, corresponding to 92.16% of the theoretical ethanolyield. Similar results were obtained using strain S. cerevisiae Y5 inethanol fermentation from hydrolysate of non-detoxified steam-exploded corn stover: 44.55 g ethanol/L, corresponding to 94.5%of the theoretical ethanol yield (Li et al., 2011). Kim and Hamdy(1985) revealed that in acid sweet potato hydrolysate cultures, S.cerevisiae produced 38 g ethanol/L from initial sweet potato of80 g/L. However, an ethanol concentration of 32.9 g/L, with a yieldof 0.343 g/g glucose (theoretical ethanol yield: 67%), was obtainedfrom acid potato tuber mash hydrolysate by Tasic et al. (2009).
In our study, by using the desirability function, HMF and furfu-ral concentrations were controlled within a limited range, allowingthe ethanol- or lactic acid-producing microorganisms to grow andproduce end products. This method can predict the relationshipbetween RS concentration and inhibitors (HMF and furfural). Basedon the results, the hydrolysis conditions could be set up to suit thegrowth of microorganisms and fermentations without a detoxifica-tion step. Similar to starch hydrolysis, the C. longa hydrolysateyields high fermentative sugar concentrations. This finding sug-gests that the concentration of hydrolysate is not necessarily re-lated to increased sugars concentration (Guerra-Rodriguez et al.,2012b). All these considerations make the acid hydrolysis of C.longa residue for fermentative purposes very valuable.
4. Conclusion
The C. longa residue could be hydrolysed with diluted acid, andRS was obtained as the main fermentative sugar. The obtainedmathematical models demonstrated that the main operationalvariables are acid concentration and temperature. The desirabilityfunction was used for the solution of multiresponse optimisationproblem to determine the optimal condition for microbial produc-tion of lactic acid and ethanol at low levels of HMF and furfural.The study demonstrated effective utilisation of an agro-industrial
residue C. longa biomass as a potential renewable material for lac-tic acid and ethanol production.
References
Abdel-Rahman, M.A., Tashiro, M.A., Sonomoto, K., 2011. Lactic acid production fromlignocellulose-derived sugars using lactic acid bacteria: overview and limits.J. Biotechnol. 156, 286–301.
Abdel-Rahman, M.A., Tashiro, Y., Sonomoto, K., 2013. Recent advances in lactic acidproduction by microbial fermentation processes. Biotechnol. Adv. http://dx.doi.org/10.1016/j.biotechadv.2013.04.002.
Almeida, J.R.M., Modig, T., Petersson, A., Hahn-Hagerdal, B., Liden, G.,Gorwa-Grauslund, M.F., 2007. Increased tolerance and conversion ofinhibitors in lignocellulosic hydrolysates by Saccharomyces cerevisiae. J. Chem.Technol. Biotechnol. 82, 340–349.
Balakrishman, K.V., 2007. Postharvest technology and processing of turmeric. In:Ravindran, P.N., Babu, K.N., Sivaraman, K. (Eds.), Turmeric: The Genus Curcuma.Taylor & Francis Group, Danvers, pp. 193–256.
Banerjee, N., Bhatnagar, R., Viswanathan, L., 1981. Inhibition of glycolysis by furfuralin Saccharomyces cerevisiae. Eur. J. Appl. Microbiol. Biotechnol. 11, 226–228.
Barker, T.B., 2005. Quality by Experimental Design, third ed. Chapman and Hall/CRC, New York.
Calabia, B.P., Tokiwa, Y., 2007. Production of D-lactic acid from sugarcane molasses,sugarcane juice and sugar beet juice by Lactobacillus delbrueckii. Biotechnol.Lett. 29, 1329–1332.
Gallezot, P., 2012. Conversion of biomass to selected chemical products. Chem. Soc.Rev. 41, 1538–1558.
Girisuta, B., Janssen, L.P.B.M., Heeres, H.J., 2006. A kinetic study on the conversion ofglucose to levulinic acid. Chem. Eng. Res. Des. 84 (A5), 339–349.
Goffin, P., Deghorain, M., Mainardi, J.L., Tytgat, J., Champomier-Verges, M.C.,Kleerebezem, M., Hols, P., 2005. Lactate racemization as a rescue pathway forsupplying D-lactate to the cell wall biosynthesis machinery in Lactobacillusplantarum. J. Bacteriol. 187 (19), 6750–6761.
Guerra-Rodrıguez, E., Portilla-Rivera, O.M., Jarquın-Enrıquez, L., Ramırez, J.A.,Vazquez, M., 2012a. Acid hydrolysis of wheat straw: a kinetic study. BiomassBioenergy 36, 346–355.
Guerra-Rodriguez, E., Portilla-Rivera, O.M., Ramirez, J.A., Vazquez, M., 2012b.Modelling of the acid hydrolysis of potato (Solanum tuberosum) forfermentative purposes. Biomass Bioenergy 42, 59–68.
John, R.P., Nampoothiri, K.M., Pandey, A., 2007a. Fermentative production of lacticacid from biomass: an overview on process developments and futureperspectives. Appl. Microbiol. Biotechnol. 74, 524–534.
John, R.P., Sukumaran, P.K., Nampoothiri, K.M., Pandey, A., 2007b. Statisticaloptimization of simultaneous saccharification and L(+)-lactic acidfermentation from cassava bagasse using mixed culture of Lactobacilli byresponse surface methodology. Biochem. Eng. J. 36, 262–267.
Keating, J.D., Panganiban, C., Mansfield, S.D., 2006. Tolerance and adaptation ofethanologenic yeasts to lignocellulosic inhibitory compounds. Biotechnol.Bioeng. 93, 1196–1206.
Kim, K., Hamdy, M.K., 1985. Acid hydrolysis of sweet potato for ethanol production.Biotechnol. Bioeng. XXVII, 316–320.
Konar, E.M., Harde, S.M., Kagliwal, L.D., Singhal, R.S., 2013. Value-added bioethanolfrom spent ginger obtained after oleoresin extraction. Ind. Crops Prod. 42, 299–307.
Laopaiboon, P., Thani, A., Leelavatcharamas, V., Laopaiboon, L., 2010. Acid hydrolysisof sugarcane bagasse for lactic acid production. Bioresour. Technol. 101, 1036–1043.
Li, Y., Gao, K., Tian, S., Zhang, S., Yang, X., 2011. Evaluation of Saccharomycescerevisiae Y5 for ethanol production from enzymatic hydrolysate of non-detoxified steam-exploded corn stover. Bioresour. Technol. 102, 10548–10552.
Marzialetti, T., Olarte, M.B.V., Sievers, C., Hoskins, T.J.C., Agrawal, P.K., Jones, C.W.,2008. Dilute acid hydrolysis of Loblolly Pine: a comprehensive approach. Ind.Eng. Chem. Res. 47, 7131–7140.
Montgomery, D., Runger, G., 2002. Applied Probability and Statistics to Engineering.McGraw Hill, Mexico.
Mosier, N., Wyman, C., Dale, B., Elander, R., Lee, Y.Y., Holtzapple, M., Ladisch, M.,2005. Features of promising technologies for pretreatment of lignocellulosicbiomass. Bioresour. Technol. 96, 673–686.
Nguyen, C.M., Kim, J.S., Hwang, H.J., Park, M.S., Choi, G.J., Choi, Y.H., Jang, K.S., Kim,J.C., 2012a. Production of L-Lactic acid from a green microalga, Hydrodictyonreticulum, by Lactobacillus paracasei LA104 isolated from the traditional Koreanfood, makgeolli. Bioresour. Technol. 110, 552–559.
Nguyen, C.M., Kim, J.S., Song, J.K., Choi, G.J., Choi, Y.H., Jang, K.S., Kim, J.C., 2012b.D-Lactic acid production from dry biomass of Hydrodictyon reticulatum bysimultaneous saccharification and cofermentation using Lactobacilluscoryniformis subsp. torquens. Biotechnol. Lett. 34, 2235–2240.
Nguyen, C.M., Kim, J.S., Nguyen, T.N., Kim, S.K., Choi, G.J., Choi, Y.H., Jang, K.S., Kim,J.C., 2013. Production of L- and D-lactic acid from waste Curcuma longa biomassthrough simultaneous saccharification and cofermentation. Bioresour. Technol.146, 35–43.

C.M. Nguyen et al. / Bioresource Technology 151 (2014) 227–235 235
Okano, K., Tanaka, T., Ogino, C., Fukuda, H., Kondo, A., 2010. Biotechnologicalproduction of enantiomeric pure lactic acid from renewable resources: recentachievements, perspectives, and limits. Appl. Microbiol. Biotechnol. 85, 413–423.
Pfeifer, P.A., Bonn, G., Bobleter, O., 1984. Influence of biomass degradation productson the fermentation of glucose to ethanol by Saccharomyces carlsbergensis W 34.Biotechnol. Lett. 6, 541–546.
Prasad, S., Aggarwal, B.B., 2011. Turmeric, the golden spice: from traditionalmedicine to modern medicine. In: Benzie, I.F.F., Wachtel-Galor, S. (Eds.), HerbalMedicine: Biomolecular and Clinical Aspects. CRC Press.
Sun, Y., Cheng, J., 2002. Hydrolysis of lignocellulosic material for ethanolproduction: a review. Bioreour. Technol. 83, 1–11.
Taherzadeh, M.J., Karimi, K., 2007. Acid-based hydrolysis processes for ethanol fromlignocellulosic materials: a review. Bioresources 2 (3), 472–499.
Taherzadeh, M.J., Gustafsson, L., Niklasson, C., Liden, G., 2000. Physiological effectsof 5-hydroxymethylfurfural on Saccharomyces cerevisiae. Appl. Microbiol.Biotechnol. 53, 701–708.
Tasic, M.B., Konstantinovic, B.V.M., Lazic, L., Veljkovic, V.B., 2009. The acid hydrolysisof potato tuber mash in bioethanol production. Biochem. Eng. J. 43, 208–211.
Timbuntam, W., Sriroth, K., Tokiwa, Y., 2006. Lactic acid production from sugar-canejuice by a newly isolated Lactobacillus sp. Biotechnol. Lett. 28, 811–814.
Woiciechowski, A.L., Nitsche, S., Pandey, A., Soccol, C.R., 2002. Acid and enzymatichydrolysis to recovery reducing sugars from cassava bagasse: an economicstudy. Braz. Arch. Biol. Technol. 45, 393–400.
Yang, X., Zhang, S., Zuo, Z., Men, X., Tian, S., 2011. Ethanol production from theenzymatic hydrolysis of non-detoxified steam-exploded corn stalk. Bioresour.Technol. 102, 7840–7844.
Related Documents