RESEARCH ARTICLE Open Access Achieving self-sustainability of service delivery in an eye care program in Madagascar using time-driven activity based costing Philippe Rakotondrajoa 1 , Tantely Rakotomamonjy 1 , Randrianaivo Jean Baptiste 2 , Lisa Demers 3 , Peter Kileo 4 , Michele Anholt 5 , Jaafar Aghajanian 3,6 and Ken Bassett 3,6* Abstract Background: In the absence of adequate and reliable external funding, eye care programs in developing countries need a high level of financial self-sustainability for maintenance and growth. To cope with these cost pressures, an eye care program in Sava, Madagascar adopted a Time-Driven Activity Based Costing (TDABC) methodology to better manage the cost of, and to improve revenue associated with, their three principle activities: consultation visits, cataract operations, and sale of glasses. Methods: Direct (variable) and indirect (fixed) cost estimates and revenue sources were gathered by activity (consultation, cataract operation, sale of glasses) and location (hospital or outreach) and TDABC models were established. Estimates were made of the proportion of the ophthalmologist ’ s time (by far the scarcest and most expensive resource) dedicated to consultation, cataract operation, or sale of glasses. These proportions were used to attribute costs by activity. The hospital manager and medical director modified staff roles, program activities, and infrastructure investments to reduce costs and expand revenue sources by activity while monitoring activity specific efficiency and profit. (Continued on next page) © The Author(s). 2020 Open Access This article is licensed under a Creative Commons Attribution 4.0 International License, which permits use, sharing, adaptation, distribution and reproduction in any medium or format, as long as you give appropriate credit to the original author(s) and the source, provide a link to the Creative Commons licence, and indicate if changes were made. The images or other third party material in this article are included in the article's Creative Commons licence, unless indicated otherwise in a credit line to the material. If material is not included in the article's Creative Commons licence and your intended use is not permitted by statutory regulation or exceeds the permitted use, you will need to obtain permission directly from the copyright holder. To view a copy of this licence, visit http://creativecommons.org/licenses/by/4.0/. The Creative Commons Public Domain Dedication waiver (http://creativecommons.org/publicdomain/zero/1.0/) applies to the data made available in this article, unless otherwise stated in a credit line to the data. * Correspondence: [email protected] 3 Seva Canada, 100 – 2000 West 12th Avenue, Vancouver, BC V6J 2G2, Canada 6 Department of Ophthalmology and Visual Sciences, British Columbia Centre for Epidemiologic and International Ophthalmology, University of British Columbia, 2550 Willow Street, Vancouver, BC V5Z 3N9, Canada Full list of author information is available at the end of the article Rakotondrajoa et al. BMC Health Services Research (2020) 20:205 https://doi.org/10.1186/s12913-020-05074-z

Welcome message from author
This document is posted to help you gain knowledge. Please leave a comment to let me know what you think about it! Share it to your friends and learn new things together.
Transcript

RESEARCH ARTICLE Open Access
Achieving self-sustainability of servicedelivery in an eye care program inMadagascar using time-driven activitybased costingPhilippe Rakotondrajoa1, Tantely Rakotomamonjy1, Randrianaivo Jean Baptiste2, Lisa Demers3, Peter Kileo4,Michele Anholt5, Jaafar Aghajanian3,6 and Ken Bassett3,6*
Abstract
Background: In the absence of adequate and reliable external funding, eye care programs in developing countries need ahigh level of financial self-sustainability for maintenance and growth. To cope with these cost pressures, an eye care programin Sava, Madagascar adopted a Time-Driven Activity Based Costing (TDABC) methodology to better manage the cost of, andto improve revenue associated with, their three principle activities: consultation visits, cataract operations, and sale of glasses.
Methods: Direct (variable) and indirect (fixed) cost estimates and revenue sources were gathered by activity (consultation,cataract operation, sale of glasses) and location (hospital or outreach) and TDABC models were established. Estimates weremade of the proportion of the ophthalmologist’s time (by far the scarcest and most expensive resource) dedicated toconsultation, cataract operation, or sale of glasses. These proportions were used to attribute costs by activity. The hospitalmanager and medical director modified staff roles, program activities, and infrastructure investments to reduce costs andexpand revenue sources by activity while monitoring activity specific efficiency and profit.
(Continued on next page)
© The Author(s). 2020 Open Access This article is licensed under a Creative Commons Attribution 4.0 International License,which permits use, sharing, adaptation, distribution and reproduction in any medium or format, as long as you giveappropriate credit to the original author(s) and the source, provide a link to the Creative Commons licence, and indicate ifchanges were made. The images or other third party material in this article are included in the article's Creative Commonslicence, unless indicated otherwise in a credit line to the material. If material is not included in the article's Creative Commonslicence and your intended use is not permitted by statutory regulation or exceeds the permitted use, you will need to obtainpermission directly from the copyright holder. To view a copy of this licence, visit http://creativecommons.org/licenses/by/4.0/.The Creative Commons Public Domain Dedication waiver (http://creativecommons.org/publicdomain/zero/1.0/) applies to thedata made available in this article, unless otherwise stated in a credit line to the data.
* Correspondence: [email protected] Canada, 100 – 2000 West 12th Avenue, Vancouver, BC V6J 2G2,Canada6Department of Ophthalmology and Visual Sciences, British Columbia Centrefor Epidemiologic and International Ophthalmology, University of BritishColumbia, 2550 Willow Street, Vancouver, BC V5Z 3N9, CanadaFull list of author information is available at the end of the article
Rakotondrajoa et al. BMC Health Services Research (2020) 20:205 https://doi.org/10.1186/s12913-020-05074-z

(Continued from previous page)
Results: The TDABC model for patient consultations showed that they were time consuming for the ophthalmologist andonly resulted in net profit for the institution if the ophthalmologist converted most cataract patients into accepting surgeryand refractive error patients into purchasing glasses from the hospital optical shop. The TDABC model for cataract surgeryshowed the programs needed to reduce the cost of imported consumable surgical products, reduce operation time, and,most importantly, reduce the number of very costly surgical camps providing essentially free surgery. In addition the modelpushed the hospital to train staff in marketing skills so that a higher proportion of cataract cases come directly to the hospitalwilling to pay for surgery. The TDABC model provided the optical shop manager, for the first time, data on both the cost ofsupplies (frames and lenses) and the price of glasses sold resulting in strategies to maximize profit through preferentialproduct presentation and customer experience. The eye program in the Sava region in northern Madagascar improved itscost recovery from 68 to 102% through patient revenue.
Conclusions: TDABC models helped the Sava eye care program develop more efficient service delivery and increase revenuein excess of steadily increasing costs.
Keywords: Financial self-sustainability, Eye care programs, Madagascar, Activity based costing
BackgroundMadagascar is among the poorest 20% of developingcountries with most people living below the poverty lineon US$1.21 per day; one-quarter of the average personalincome in sub-Saharan Africa [1]. The Malagasy govern-ment cannot provide even basic healthcare services leav-ing 25% of the population without access to any form ofprimary healthcare. The average distance to a health fa-cility is over ten kilometers [2]. Eye care services are alow priority due to competing demands for health carefunding including very high maternal and neonatal mor-tality, endemic debilitating infectious diseases, andchronic malnutrition [3].The Kilimanjaro Center for Community Ophthalmol-
ogy (KCCO), a community ophthalmology training insti-tution dedicated to reducing blindness in Africa, beganproviding ongoing support for management, trainingand program planning to the Sava eye unit (part of theSampan’asa Loterana Momba Ny Fahasalamana(SALFA) network in the Malagasy Lutheran ChurchHealth Department) in 2009. Sava has one ophthalmolo-gist, one ophthalmic nurse and two regular nurses andserves a primarily rural setting that relies on subsistencefarming and fishing. KCCO helped Sava develop a com-munity outreach plan which is the basis of its Vision2020 Program. The outreach program involved selectingunderserved but accessible sites for community visits,pre-visit marketing, on-site diagnosis including refrac-tion and medical treatment, as well as transportation ofpatients to the base hospital for surgery, primarily cata-ract. Due to the limited number of staff, the hospital eyeunit closed for outreach days.Sava was established, and primarily supported, by an
international non-governmental eye care organization. In2011 most of the funding from the international donorstopped and the local Lions Sight First Program signifi-cantly reduced support for surgical supplies (medicine and
intra-ocular lenses). As a result, the eye program turnedto financial self-sustainability models for its survival.In 2013, Seva Canada began training the Sava eye
unit manager in financial data collection, reportingand management. At the time, financial record keep-ing was limited to staff payroll, a ledger listing patientregistration fees, and receipts for expenditures includ-ing supplies, building and vehicle maintenance. Finan-cial data was not organized to assess the cost andrevenue of program activities. For the eye program,the principle activities were: outpatient consultation,surgical procedures (primarily cataract) and sale ofglasses.Detailed cost estimates were developed and assigned
as fixed or variable [4] (Table 1). Variable costs (suchas intra-ocular lenses and medicine) were affected bythe volume of work performed, while fixed expenses(such as electricity, internet, and bank charges) werenot.Modified Time-Driven Activity Based Costing
(TDABC) [5] models were established suitable for gen-eral management of the three principle activities (con-sultation, cataract operation, sale of glasses). TheTDABC model was used to determine the cost of eachactivity as patients flow through various hospital pro-cesses. The TDABC model used two basic parameters:1) the unit cost of resource input (labour and non-labour costs) and 2) the time and quantity of resourcesrequired to perform a transaction or an activity.The TDABC models provided an infrastructure for
understanding cost drivers [6] and revenue sources at anearly stage in developing financial systems in this institu-tion. To determine cost drivers six steps were followed:1) identify staff and their activities 2) determine salaries3) estimate practical capacity 4) calculate cost per timeunit 5) determine the required time units for each activ-ity and, 6) calculate cost per transaction.
Rakotondrajoa et al. BMC Health Services Research (2020) 20:205 Page 2 of 9
MethodsFixed expenses were distributed to the 3 activities (consult-ation, cataract operations, sale of glasses) for the TDABCmodels. Specifically, all fixed costs were divided the sameway, regardless of activity, according to the proportion ofthe ophthalmologist’s time spent on that activity. The pro-portion of the ophthalmologist’s time on each activity wasestimated by dividing the total time the doctor worked peryear by the total time spent on a given activity (time per ac-tivity times the total number of procedures per year) (Fig. 1).Revenue was distributed in the TDABC model by activity
and location (at the hospital, referred to as base, or at out-reach) (Table 2). This enabled evaluation of revenueachieved in relation to the unit cost of an activity. The unitcost reflected the time spent on the activity by the
ophthalmologist. As much as possible, each activity was con-sidered to involve a distinct time period with no overlap [4].Using the average revenue per activity, average variable
cost per activity and total fixed expenses, Sava was ableto calculate the number of activities needed to reach100% cost recovery. Sava set a goal of achieving at least120% cost recovery of service delivery in order to replaceaging ophthalmic equipment.In addition to striving for time and cost efficiencies,
the eye program recognized the need for, and value of,counselling by all clinical staff in order to increase theproportion of patients accepting cataract surgery andpurchasing glasses at the hospital optical shop.
ResultsSava gathered and reported data semi-annually by activ-ity and location in a standardized Excel spread sheetfrom 2013 to 2018. Total costs, sales and volume werereported from 2013 to 2018 (Table 3). Total revenueand expenses were gathered from 2011 to 2018 (Fig. 2).By 2013 the revenue from the sale of glasses exceeded
costs (Fig. 3). In 2018, glasses revenue covered 202% ofcosts. The programs increased the number of patientsseen and productivity levels (patients seen per hour par-ticularly by the ophthalmologist) without compromisingthe quality of care. In 2018, consultation fees recovered70% of their activity costs (Fig. 3). Concurrently, the oph-thalmologist recognized the need to improve his market-ing skills to convince more patients to purchase glasses inthe hospital optical shops. Sava reached the cataractbreakeven point every year from 2013 to 2018. The rev-enue received from patients who paid for their cataractoperations (direct patients) enabled an affordable fee forthose too poor to pay full price. The result was increasedrevenue with the same fixed costs and variable costs in-creasing slower in proportion to productivity (Fig. 3).Cost recovery differed significantly in the hospital versus
outreach settings (Fig. 4). Of the consultations and opera-tions performed at the base hospital, the 6-year average re-covery rate was 37 and 92% for consultations andoperations respectively. The comparable rates at outreachwere 29 and 30% respectively, indicating that the eye pro-gram was operating at a more self-sustained level at thebase hospital but relying on external funds for their out-reach activities.Sava covered 97% of their overall costs through patient
revenue (Fig. 5). Consultations were the leading revenuesource from patients followed by glasses and cataract oper-ations. Donations and grants remained consistently low asdid other revenue sources such as fundraising. Revenuefrom consultations and glasses grew steadily (Fig. 4). Surgi-cal outreach was not conducted in 2016, however this didnot significantly impact revenues, as these patients typicallyreceive surgery free of charge, nor expenses, as the cost
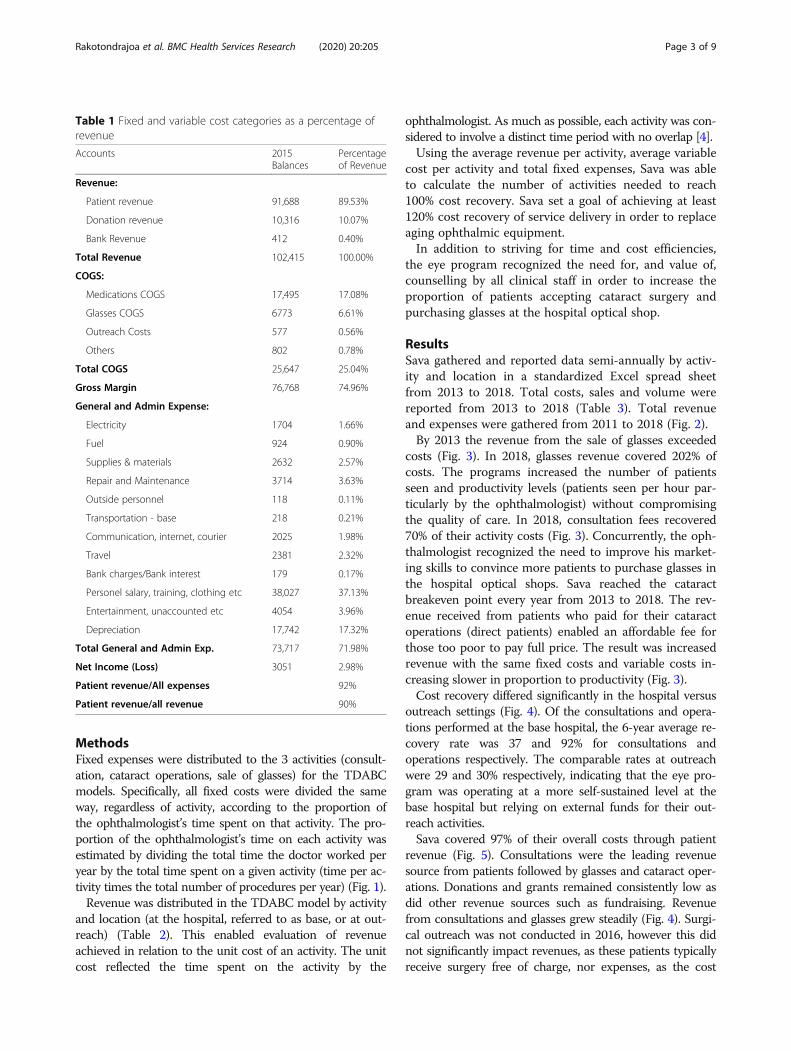
Table 1 Fixed and variable cost categories as a percentage ofrevenue
Accounts 2015Balances
Percentageof Revenue
Revenue:
Patient revenue 91,688 89.53%
Donation revenue 10,316 10.07%
Bank Revenue 412 0.40%
Total Revenue 102,415 100.00%
COGS:
Medications COGS 17,495 17.08%
Glasses COGS 6773 6.61%
Outreach Costs 577 0.56%
Others 802 0.78%
Total COGS 25,647 25.04%
Gross Margin 76,768 74.96%
General and Admin Expense:
Electricity 1704 1.66%
Fuel 924 0.90%
Supplies & materials 2632 2.57%
Repair and Maintenance 3714 3.63%
Outside personnel 118 0.11%
Transportation - base 218 0.21%
Communication, internet, courier 2025 1.98%
Travel 2381 2.32%
Bank charges/Bank interest 179 0.17%
Personel salary, training, clothing etc 38,027 37.13%
Entertainment, unaccounted etc 4054 3.96%
Depreciation 17,742 17.32%
Total General and Admin Exp. 73,717 71.98%
Net Income (Loss) 3051 2.98%
Patient revenue/All expenses 92%
Patient revenue/all revenue 90%
Rakotondrajoa et al. BMC Health Services Research (2020) 20:205 Page 3 of 9

savings were offset by cost increases elsewhere. The mostsignificant improvement occurred in 2017 when the pro-gram increased consultation fees from $8 to $11 USD. As aresult, consultations increased contributions to overall costrecovery from 36 to 41% (Fig. 5).In 2018, fixed costs accounted for 69% of total costs with
staff salaries and bonuses accounting for approximatelyone-third of costs. The largest proportion of fixed costs wasfound in consultations (70%) and reflect the number ofout-patients. The proportion of fixed costs attributed tocataract was 22%. The majority of variable costs consistedof medicine, cataract surgical consumables (such as intra-ocular lenses) and frames and lenses for the optical shop.
DiscussionThe program manager and ophthalmologist used theTDABC methodology to break down activities into timespent and resources used and to identify the key modifi-able variables that influenced productivity and net profit.In keeping with this low-income setting and the institu-tions’ first efforts at financial management and economicmodelling, the TDABC models they produced were lim-ited compared to high-income settings. That is, while theSava program was measuring and modelling the ophthal-mologist’s activities for the first time, TDABC models ofsurgical [7] or diagnostic activities [8] in an industrializedsetting such as Canada include multiple personnel, withtime charts and sequence analysis.Nevertheless, although the TDABC eye care models in
the Sava eye unit were relatively simplistic compared tolarge complex hospital programs, the eye unit manager and
ophthalmologist used them to effectively meet the chal-lenges of more than 200% increase in eye care costs overthe 5 year study period. In particular, they worked togetherto optimise clinical productivity, particularly time manage-ment of the ophthalmologist. This modified the uncontrol-lable cost increases (consumables, equipment and salaries)and allowed the investment in the optical shop and sale ofglasses to provide sufficient revenue to cover program costs.The Sava eye program clearly recognized that price could
affect coverage. Nevertheless, it was necessary for programsurvival that they increase prices for consultation, for all pa-tients, and for cataract, for people who could afford to pay.As shown in Table 1, the increased price did not signifi-cantly impact volume of consultations, glasses or cataractfrom year to year. More free surgery and more outreachwould have helped the program to achieve full populationcoverage, but that was not sustainable in this setting. Adonor-funded cataract surgery campaign (reduced price andsupplemental support for outreach) was available in 2013and it did result in the high cataract volume in that year.The cataract operation TDABC model was the most
complex and proved the most valuable in determining costdrivers, improving efficiency and increasing patient revenue[9]. Information from the model helped Sava increase feesfrom patients who came directly to the hospital (as opposedto those referred from outreach camps and had free sur-gery) in excess of the cost of their cataract operations.Reaching their overall (hospital and outreach) cataractbreak-even point was possible because these ‘direct’ patientssubsidised those referred from outreach camps. In recog-nizing the importance of and achieving the ‘break even’
Fig. 1 Calculation of ophthalmologist’s time spent on activities; Sava program data 2015
Rakotondrajoa et al. BMC Health Services Research (2020) 20:205 Page 4 of 9

volume for cataract surgery, the Sava program was able toincrease patient revenue to meet steadily increasing costs ofequipment, personnel and supplies.Techniques and addition of surgical assistants reduced
the time taken for cataract surgery throughout this pro-gram. Greater efficiency meant greater productivity pertime unit. However, the increased profit (more revenueper unit due to decreased time costs) was not reflectedin reduced price to patients. The price needed to bemaintained and, in fact, increased to meet the increasingcosts of equipment and consumables.
Cataract cost containment was greatly facilitated by col-laboration with KCCO, an external partner with access toforeign currency. It allowed savings by group purchasingof consumable items (intra-ocular lenses, needles, andmedicines) in US dollars and avoided additional 15% an-nual inflation costs of the Malagasy currency.For sale of glasses, the TDABC model provided useful
but relatively self-contained (within the eye program) infor-mation in terms of personnel, supplies, costs and revenue.While recognized as essential to overall hospital profit; op-tical shop management involved a separate type of time
Table 2 Cost and revenue distributed by activity
Description Total Amount Consultations Cataract Glasses
Base Outreach Base Outreach Base Outreach
Number of Procedures 4724 2563 517 44 1119 531
Direct/Variable Costs
Medications - Cost of goods sold 17,360 8567 2142 6130 522 – –
Glasses - Cost of goods sold 6773 – – – – 6129 644
Gas 78 – – 59 – 20 –
Medication & spectacle deliveries 272 50 18 20 3 163 18
Outreach 577 – 373 – 91 – 112
Supplies 452 452 – – – – –
Total Direct Costs 25,512 9069 2533 6208 615 6312 774
Indirect/Fixed Costs
Total Indirect Costs 71,587 34,499 18,717 14,155 1205 2042 969
Total Costs 97,100 43,568 21,251 20,363 1820 8355 1744
Revenues
Consultations 8299 8299 – – – – –
Care and treatment 406 393 12 – – – –
Hospitalization 128 55 – 72 – – –
Cataract Operations 22,331 – – 22,331 – – –
Cataract Operations outreach 2020 – – – 2020 – –
Prescription writing 25 25 – – – – –
Medication sales 22,316 22,316 – – – – –
Medication sales, outreach 5251 – 5251 – – – –
Eyeglass sales, base 24,880 – – – – 24,880 –
Eyeglass sales, outreach 1805 – – – – – 1805
Prosthesis 151 135 16 – – – –
Eyeglass accessories 21 – – – – 21 –
Others 48 48 – – – – –
Total Revenues: 87,680 31,271 5279 22,403 2020 24,901 1805
Excess of Revenues over Expenses/(Expenses over Revenues) (9420) (12,297) (15,971) 2040 200 16,546 61
Donations
Donations 16,294 3961 3721 2875 5391 235 111
Others revenues 400 193 104 79 7 11 5
Total Donations/Other Revenue: 16,694 4154 3826 2955 5397 246 117
Excess of All Revenues over Expenses (Expenses over All Revenues) 7274 (8143) (12,145) 4995 5598 16,792 178
Rakotondrajoa et al. BMC Health Services Research (2020) 20:205 Page 5 of 9

management for shop staff, specific expertise in purchaseand supply of frames and lenses, and patient (client) experi-ence. The overall eye program challenge was ensuring thata high proportion of patients prescribed glasses by the hos-pital ophthalmologist actually purchased glasses in the hos-pital optical shop.The optical personnel learned to conduct market assess-
ments and develop marketing strategies and materials.
Most of the new marketing strategies focussed on the op-tical shops, recognizing the need for substantial improve-ment in the physical space, the patient’s experience as acustomer, and the range of frames and lenses available.Staff began adopting specific sales techniques to increasethe proportion of customers purchasing glasses and select-ing higher priced frames. Staff also began, albeit informally,to solicit customer feedback on the reasons for and against
Table 3 Total costs, sales and volume, by activity and year
Sava Eye Clinic
Activity Description 2013 2014 2015 2016 2017 2018
Consultations Total Costs $43,766 $55,998 $64,819 $93,256 $103,712 $114,381
Total Sales $23,167 $32,236 $36,550 $52,356 $65,487 $79,923
% Cost Recovery 53% 58% 56% 56% 63% 70%
Price per unit 2.95 $4.87 $5.02 $7.90 10.71 11.47
Units 7852 6625 7287 6626 6113 6971
Glasses Total Costs $12,456 $12,460 $10,098 $18,250 $17,148 $29,998
Total Sales $23,475 $27,887 $26,706 $42,820 $44,569 $60,542
% Cost Recovery 188% 224% 264% 235% 260% 202%
Price per unit 11.93 $11.50 $16.19 $21.73 28.55 30.17
Units 1968 2424 1650 1971 1561 2007
Cataract Operations Total Costs $24,420 $27,745 $22,183 $30,987 $33,726 $36,919
Total Sales $25,960 $28,493 $24,423 $32,353 $37,285 $39,857
% Cost Recovery 106% 103% 110% 104% 111% 108%
Price per unit 30.76 $37.25 $43.54 $58.50 69.05 68.13
Units 844 765 561 553 540 585
Total Total Costs $81,851 $97,491 $99,379 $144,960 $158,798 $185,449
Total Sales $73,849 $90,087 $91,688 $132,951 $152,374 $186,459
% Cost Recovery 90% 92% 92% 92% 96% 101%
Fig. 2 Total eye program revenue and expenses, by year
Rakotondrajoa et al. BMC Health Services Research (2020) 20:205 Page 6 of 9

purchase decisions. In fact, the ophthalmologist came torecognize that a key factor influencing glasses sales fromthe hospital optical shop was whether he recommendedthe shop and if he actually escorted the patient to the shopfollowing consultation. While this activity by the ophthal-mologist increased the ‘cost’ of glasses (more ophthalmolo-gist’s time) the TDABC model was not adjusted to accountfor this relatively small change in ophthalmologist role.The Sava TDABC model provided the least value in
program planning around patient consultation. Costswere directly dependent on the time taken by the oph-thalmologist and revenue depended on a singleconsultation fee, which almost all patients were able topay. Some efficiency was achieved by involving allied
personnel to do measurement of visual acuity or refrac-tion, thereby freeing some of the ophthalmologists’ timeto see additional patients. The staff increased focus onwaiting times, patient experience and satisfaction bothto increase comfort and decrease waiting times.Sava recognized that improved productivity and profit
could not come at the cost of patient safety or quality ofcare and added much more rigorous monitoring of cata-ract surgical quality and began assessing patient and op-tical shop customer satisfaction, albeit informally.Sava also recognized that, despite the relatively high
cost of and low revenue generation from outreach ser-vices, providing these services in rural areas was an es-sential component of their Vision 2020 Program
Fig. 3 Proportion of cost recovery through revenue, by activity
Fig. 4 Cost recovery by activity, location, and year
Rakotondrajoa et al. BMC Health Services Research (2020) 20:205 Page 7 of 9

commitment. Sava did seek efficiencies through minim-izing outreach fixed costs by having fewer, larger campsthat lasted fewer days. However, the cost to the pro-grams of finding patients through outreach was com-pounded as most clinical staff are away from the eyeunit in order to provide outreach services.The Sava program, while achieving self-sufficiency in
terms of service delivery cost, did not achieve self-sufficiency in terms purchasing new or replacing oph-thalmic or anaesthetic equipment. These additionalcosts, estimated as much as 15–20% of operating costsper year, required continued donations from externalsources such as Seva Canada.
ConclusionTime-Driven Activity Based Costing methodology andits associated use in strategic decision-making became auseful tool to improve financial self-sustainability for aprivate eye care program in Sava, Madagascar.
AbbreviationsSALFA: Sampan’asa Loterana Momba Ny Fahasalamana; TDABC: Time-DrivenActivity Based Costing; KCCO: Kilimanjaro Center for CommunityOphthalmology
AcknowledgementsThe authors gratefully acknowledge Brenda Marsh for developing theactivity-based costing framework, the administrative and accounting staff atthe SALFA and Centre Hospitalier Universitaire hospitals for gathering andreporting the costing data and the Kilimanjaro Centre for Community Oph-thalmology for its logistical and program support.
Authors’ contributionsPR, TR, RJ, PK and MA made substantial contributions to the design of thework and the acquisition of data. KB conceived and designed the work,made major contributions to the analysis and interpretation of the data andwas the lead contributor in writing the manuscript. JA made substantialcontributions to the analysis and the interpretation of data and was a majorcontributor in writing the manuscript. LD made substantial contributions to
the design and data analysis and reviewed the study and manuscript. Allauthors have read and approved the manuscript.
FundingSeva Canada provided funding for the study and did not play any roleoutside of financial support.
Availability of data and materialsThe datasets used and/or analysed during the current study are availablefrom the corresponding author on reasonable request.
Ethics approval and consent to participateSampan’asa Loterana Momba Ny Fahasalamana provided permission toutilize routine administrative data in this study.
Consent for publicationNot applicable.
Competing interestsThe authors declare that they have no competing interests.
Author details1Sampan’asa Loterana Momba Ny Fahasalamana (SALFA) network,Ampandrozonana, 208 Sambava, Madagascar. 2Centre HospitalierUniversitaire (CHU) Toamasina - Service d’Ophtalmologie, 501 Toamasina,Madagascar. 3Seva Canada, 100 – 2000 West 12th Avenue, Vancouver, BC V6J2G2, Canada. 4Kilimanjaro Center for Community Ophthalmology, P.O. Box2254, Moshi, Tanzania. 5One Health, Faculty of Veterinary Medicine, Universityof Calgary, 3280 Hospital Drive NW, Calgary, AB T2N 4Z6, Canada.6Department of Ophthalmology and Visual Sciences, British Columbia Centrefor Epidemiologic and International Ophthalmology, University of BritishColumbia, 2550 Willow Street, Vancouver, BC V5Z 3N9, Canada.
Received: 7 October 2019 Accepted: 5 March 2020
References1. The World Bank. World Development Indicators. Country profile:
Madagascar. 2014. Available at: http://data.worldbank.org/country/madagascar. Accessed 12 April 2018.
2. Ministry of Economy and Industry, Madagascar. http://paperity.org/p/75573453/a-way-forward-for-healthcare-in-madagascar. Accessed 12 April 2018.
3. Institute for Health Metrics and Evaluation. Global burden of diseases,injuries, and risk factors study. Global Burden of diseasesprofile—Madagascar, 2010. Available at: http://www.healthdata.org/sites/
Fig. 5 Patient revenue as a proportion of overall program cost
Rakotondrajoa et al. BMC Health Services Research (2020) 20:205 Page 8 of 9

default/files/files/country_profiles/GBD/ihme_gbd_country_report_madagascar.pdf. Accessed 12 April 2018.
4. Chen, Jing (2016). The Unity of Science and Economics: A New Foundationof Economic Theory. https://www.springer.com/us/book/9781493934645.
5. Anderson SR, Kaplan RS. Time-driven activity-based costing. Harvard BusRev. 2004;82:131–8.
6. Bruggeman W, Everaert P. Time-driven activity-based costing: exploring theunderlying model. Cost Manage. 2007;21(2):16–20..
7. Gulati S, During D, Mainland J, Wong MF. Using the time-driven activity-based costing model in the eye Clinic at the Hospital for sick children: acase study and lessons learned. Healthcare Quarterly. 2018;20:48–53.
8. Tibor LC, Shultz SR, Menaker R, Weber BD, Ness J, Smith P, Young PM.Improving efficiency using time-driven activity-based costing methodology.J Amer Coll Radiology. 2017;14:353–8.
9. Pach A, Warren M, Chang I, et al. A qualitative study investigatingexperiences, perceptions, and healthcare system performance in relation tothe surveillance of typhoid fever in Madagascar. Clin Infect Dis. 2016;62(suppl 1):S69–75.
Publisher’s NoteSpringer Nature remains neutral with regard to jurisdictional claims inpublished maps and institutional affiliations.
Rakotondrajoa et al. BMC Health Services Research (2020) 20:205 Page 9 of 9
Related Documents


![Achieving Energy Sustainability - APESrobertsenvironment.weebly.com/uploads/3/8/1/7/38176221/chapter1… · Achieving Energy Sustainability [Notes/Highlighting] We can capture the](https://static.cupdf.com/doc/110x72/5eb4d3d73a7ffd686e071585/achieving-energy-sustainability-ap-achieving-energy-sustainability-noteshighlighting.jpg)


