FEDERATED STATES OF MICRONESIA’S The Next 20 Years: ACHIEVING ECONOMIC GROWTH & SELF-RELIANCE Vol II: Strategic Planning Matrices and Appendices

Welcome message from author
This document is posted to help you gain knowledge. Please leave a comment to let me know what you think about it! Share it to your friends and learn new things together.
Transcript
FEDERATED STATES OF MICRONESIA ’S
The Next 20 Years:
ACHIEVING ECONOMIC GROWTH & SELF-RELIANCE
Vol II: Strategic Planning Matrices and Appendices

Table of Contents
Volume I Polices and Strategies for Development
Table of Contents ii Terms and Abbreviations iii Foreword iv
1. The Macroeconomic Framework 1 2. Private Sector Development 27 3. Agriculture 55 4. Fisheries 103 5. Tourism 159 6. Environment 211 7. Health 297 8. Education 379 9. Gender 437
Volume II Strategic Planning Matrices and Appendices
Appendix A Strategic Planning Methodology 1 Appendix B Sector Planning Matrices 13
1. Private Sector 13 2. Agriculture 29 3. Fisheries 39 4. Tourism 59 5. Environment 83 6. Health 115 7. Education 127 8. Gender 141
Appendix C Statistical Tables 159 1. Gross Domestic Product 159 2. Tourist and Visitor Arrivals 164 3. Employment by Industry 167 4. Commercial Banking Survey 178 5. Consumer Price Index 179 6. Balance of Payment and External Debt 186 7. General Government Finances 189
ii
Terms and Abbreviations
ADB Asian Development Bank AusAID Australian Assistance for International Development CFA Compact of Free Association c.i.f. Price of traded goods inclusive of cost, insurance, and freight COM College of Micronesia CPUC Chuuk Public Utility Corporation CSG Core Stake Holder Group DOE Department of Education DTC&I Department of Transportation, Communications and Infrastructure EEZ Exclusive Economic Zone EPIC Economic Policy Implementation Council FAA US Federal Aviation Administration FIAS Foreign Investment Advisory Service FFA Forum Fisheries Agency FMI Fisheries and Maritime Institute f.o.b. Free on board price (traded goods) FPA Fiscal Procedures Agreement FSM Federated States of Micronesia FY Fiscal Year: October 1 – September 30 GDP Gross Domestic Product IDP Infrastructure Development Plan IMF International Monetary Fund IPIC Infrastructure Planning Implementation Committees MOU Memorandum of Understanding NDE National Division of Education NGO Non-Government Organization NSC National Steering Committee PFTAC Pacific Financial Technical Assistance Center PMU Program Management Unit PPA Pohnpei Ports Authority PSIP Public Sector Infrastructure Program PTA Parent Teachers Association PUC Pohnpei Utilities Corporation SDP Strategic Development Plan SEPA State Environmental Protection Agency SGS Sustained Growth Strategy USAID US Agency for International Development USDA US Department of Agriculture US DOI US Department of Interior UNDP United Nations Development Programme VAT Value-Added Tax WTO World Tourism Organization YSPA Yap State Ports Authority YSPSC Yap State Public Service Corporation
1
Appendix A: Strategic Planning Methodology
A.1 Review of the Planning Process in the FSM 1 In 1995 and 1996 the FSM and four states underwent the first round of Economic Summits and participatory planning process. The Summit process was initiated to achieve broad-based understanding and consensus for reform measures needed to adjust to the changing economic circumstances facing the FSM. Most importantly the FSM was preparing for the large declines in Com-pact funding resulting from the second step-down. The nation was also begin-ning to consider the implications of the Compact economic assistance negotia-tions that were looming on the horizon.
2 That first round of Summits was instrumental in changing the mindset prevalent at the time, especially in consolidating the realization that the public sector could no longer be relied upon to be the leading provider for the goods, services, and livelihood of the peoples of the FSM. It was clear that the FSM would need to reduce its reliance on external assistance and that the private sec-tor would need to be the leading force in securing needed economic growth and jobs. Coupled with the broad development principals adopted at the FSM-wide level, the state summits also under went a more detailed planning process. Each state formed a core group of sector committees (agriculture, fisheries, education, health, etc.), which identified key sector objectives, strategies to achieve the ob-jectives, and sets of projects and programs that would be adopted to implement the strategies.
3 The policy objectives of the 1st FSM Economic Summit were imple-mented throughout the period 1996-1999. The second Compact step-down en-tailed a severe reduction in external funding and required a series of painful ad-justments implemented through the Public Sector Reform Program (PSRP). The major component of the PSRP was the implementation of an Early Retirement Program (ERP), but this was supplemented through a series of supporting pro-grams aimed at restructuring the public sector and providing an environment more supportive to private sector development. As the PSRP neared completion it was decided to convene a 2nd FSM Economic Summit during September 1999, to maintain the reform momentum as the nation entered into negotiations for the renewal of the Compact with the U.S. The 2nd Summit adopted a similar structure although Kosrae state was the only state to conduct a state version. However, while the first Summit had been landmark in changing the mindset of the nation, the timing of the 2nd Summit coincided with a substantial element of reform fatigue resulting from the painful fiscal adjustments just completed. With the fiscal situation largely stabilized and concentration focusing on the Compact economic negotiations, the timing was not conducive to maintaining significant reform momentum.
2 FSM Strategic Development Plan
4 The structure of the 2nd Summit largely followed the first, although each sector was presented with a draft strategic policy matrix, entailing a hierar-chy of policy elements, strategies to attain the objectives, and series of programs and activities. To monitor and ensure implementation the Economic Policy Im-plementation Council (EPIC) was created during the Summit deliberations. At the first few meetings EPIC was presented with an update of the progress with the implementation of the policy matrices, but this was shortly abandoned as other more critical issues captured the attention of the Council. The creation of EPIC was a milestone in the development of policy in the FSM. However, early progress in monitoring the implementation the Summit resolutions and sector matrices was not maintained.
5 While the nation had undergone a round of two sets of Summits, behind the scenes each government was introducing a performance budgeting proc-ess. Instead of focusing attention on line inputs during budget hearings, legisla-tors were now asked to review budgets by strategic goals, activities, and the de-livery of outputs. Budgeting was becoming focused on deliverable results rather than purely on the line-item inputs purchased to attain the outputs. However, progress has been slow and after five years or more of implementation there re-mains considerable scope for improvement. Perhaps of greatest importance there is no comprehensive audit process to ascertain if the outputs committed for delivery have, in fact, been produced.
6 At the same time as the FSM was making its first attempt to introduce performance budgeting and management of public sector resources, the new arrangements under the Fiscal Procedures Agreement (FPA) of the amended Compact requires performance budgeting and reporting. The new FPA, in ef-fect, requires that the FSM implement performance budgeting. Importantly it is up to the FSM to design the specific elements of the system. The system pro-posed to achieve compliance is outlined in these notes and has been addressed in a series of leadership meetings and conferences of budget and finance officials in the FSM. While adopting many of the features of the previous systems the key difference is identification of quantifiable performance measures that can be used to clearly monitor the attainment of a strategic goals (by measuring out-comes) and the delivery of goods and services (by measuring outputs). Elements of the FSM’s Planning and Budgeting System.
A.2 Elements of the System
A.2.1 The Demand Side: Desired Outcomes of Public Policy
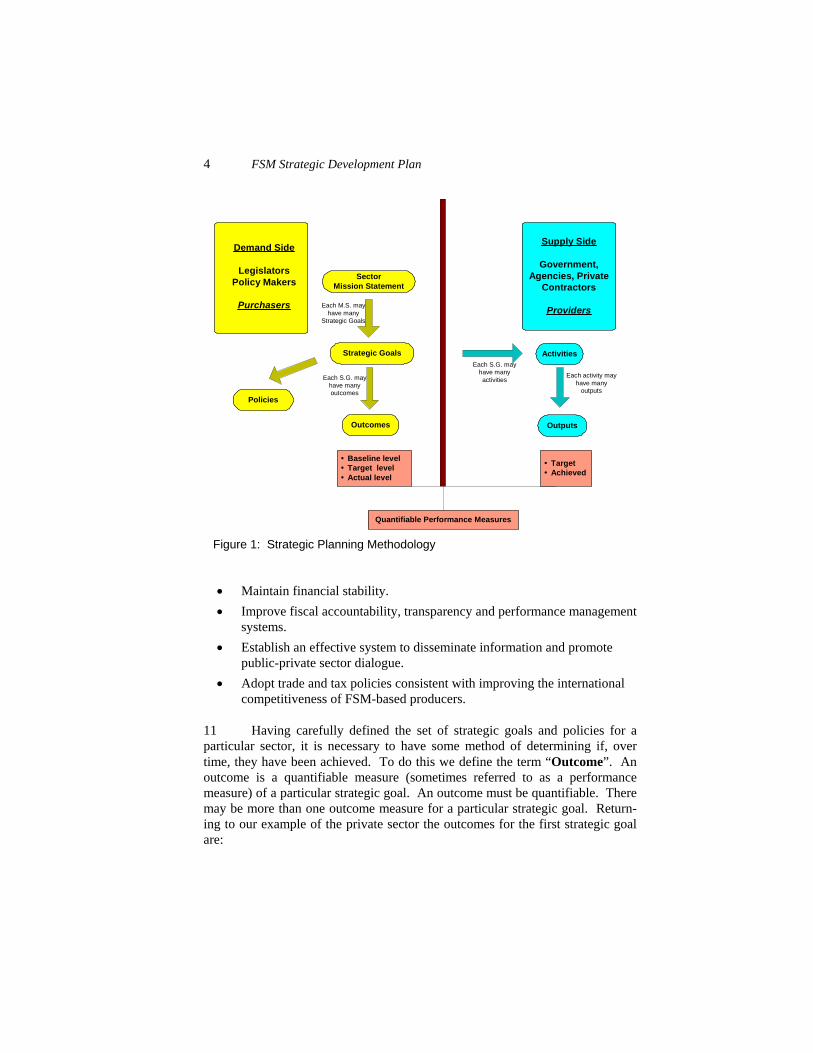
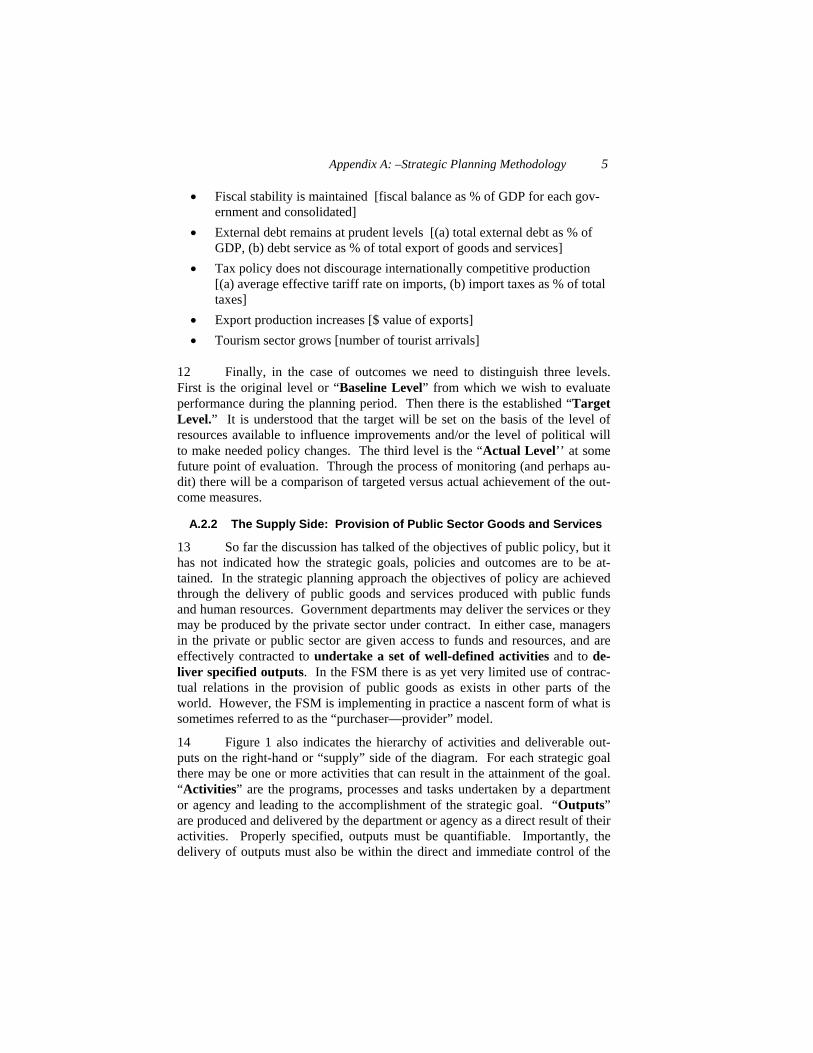
7 The critical starting point in any system of government is to define the key desired outcomes of public policy and public expenditure. Figure 1 indi-cates the elements and hierarchy of the planning and budgeting system under discussion. On the left-hand (demand) side of the system are broad areas of
Appendix A: –Strategic Planning Methodology 3
public policy: sector mission statements, strategic goals, and policies. While not exhaustive, in the 3rd FSM Economic Summit nine sectors working groups have been identified:
• Private Sector Development • Public Sector Management • Education • Health • Agriculture • Fisheries • Tourism • Environment • Gender
8 Note: Infrastructure has been addressed through lengthy and partici-patory preparation of the Draft Infrastructure Development Plan (IDP). The IDP will be reviewed and possibly amended by a special sub-committee of sectoral representatives. Each sector will be asked to review sector-specific components of the IDP to ensure consistency with the strategic planning matrices.
9 The list of sectors does not necessarily coincide with government de-partments, although in certain cases there is a unique match, such as with educa-tion and health. In the system being adopted by the FSM, each functional sector has a “Mission Statement”. The mission statement is a broad statement of the sector’s objectives. As an example using the private sector, the mission state-ment proposed is: to facilitate the development of an environment supportive of a competitive and growing private sector, and in the case of health: to promote and maintain a holistic system of health care that will provide an optimum qual-ity of life for its citizenry. Mission statements are broad statements of principle and will not likely change significantly over the planning period.
10 Beneath the statement of mission “Strategic Goals” have been defined as broad areas of critical importance. In the case of the private sector, the first strategic goal is: to create a sound economic policy environment to support out-ward-oriented, private sector-led growth, while the second is: to improve the competitiveness of the factors of production to promote private sector develop-ment. In the development of the strategic planning system in the FSM it was found desirable to permit a further layer of definition of public policy, which has been simply referred to as “Policy”. In many, but not all, cases these involve legislative action. Returning to our private sector example and in the case of the first strategic goal there are four associates policies:
4 FSM Strategic Development Plan
• Maintain financial stability. • Improve fiscal accountability, transparency and performance management
systems. • Establish an effective system to disseminate information and promote
public-private sector dialogue. • Adopt trade and tax policies consistent with improving the international
competitiveness of FSM-based producers.
11 Having carefully defined the set of strategic goals and policies for a particular sector, it is necessary to have some method of determining if, over time, they have been achieved. To do this we define the term “Outcome”. An outcome is a quantifiable measure (sometimes referred to as a performance measure) of a particular strategic goal. An outcome must be quantifiable. There may be more than one outcome measure for a particular strategic goal. Return-ing to our example of the private sector the outcomes for the first strategic goal are:
Activities
Outputs
SectorMission Statement
Strategic Goals
Outcomes
Policies
Demand Side
LegislatorsPolicy Makers
Purchasers
Supply Side
Government,Agencies, Private
Contractors
Providers
Baseline levelTarget levelActual level
Quantifiable Performance Measures
TargetAchieved
Each S.G. mayhave manyoutcomes
Each M.S. mayhave many
Strategic Goals
Each S.G. mayhave manyactivities
Each activity mayhave many
outputs
Figure 1: Strategic Planning Methodology
Appendix A: –Strategic Planning Methodology 5
• Fiscal stability is maintained [fiscal balance as % of GDP for each gov-ernment and consolidated]
• External debt remains at prudent levels [(a) total external debt as % of GDP, (b) debt service as % of total export of goods and services]
• Tax policy does not discourage internationally competitive production [(a) average effective tariff rate on imports, (b) import taxes as % of total taxes]
• Export production increases [$ value of exports] • Tourism sector grows [number of tourist arrivals]
12 Finally, in the case of outcomes we need to distinguish three levels. First is the original level or “Baseline Level” from which we wish to evaluate performance during the planning period. Then there is the established “Target Level.” It is understood that the target will be set on the basis of the level of resources available to influence improvements and/or the level of political will to make needed policy changes. The third level is the “Actual Level’’ at some future point of evaluation. Through the process of monitoring (and perhaps au-dit) there will be a comparison of targeted versus actual achievement of the out-come measures.
A.2.2 The Supply Side: Provision of Public Sector Goods and Services
13 So far the discussion has talked of the objectives of public policy, but it has not indicated how the strategic goals, policies and outcomes are to be at-tained. In the strategic planning approach the objectives of policy are achieved through the delivery of public goods and services produced with public funds and human resources. Government departments may deliver the services or they may be produced by the private sector under contract. In either case, managers in the private or public sector are given access to funds and resources, and are effectively contracted to undertake a set of well-defined activities and to de-liver specified outputs. In the FSM there is as yet very limited use of contrac-tual relations in the provision of public goods as exists in other parts of the world. However, the FSM is implementing in practice a nascent form of what is sometimes referred to as the “purchaser—provider” model.
14 Figure 1 also indicates the hierarchy of activities and deliverable out-puts on the right-hand or “supply” side of the diagram. For each strategic goal there may be one or more activities that can result in the attainment of the goal. “Activities” are the programs, processes and tasks undertaken by a department or agency and leading to the accomplishment of the strategic goal. “Outputs” are produced and delivered by the department or agency as a direct result of their activities. Properly specified, outputs must be quantifiable. Importantly, the delivery of outputs must also be within the direct and immediate control of the
6 FSM Strategic Development Plan
managers responsible. For example, in the private sector example under the first strategic goal: “to create a sound policy environment to support outward-orientated, private sector led growth” there are several activities:
• Formulate and implement sound economic policies • Improve financial management quality and timeliness to better support
private sector development • Proceed with tax reform agenda at national and state levels • Expand public information dissemination on key indicators and establish
improved public—private sector dialogue
15 In turn associated with each of the above activities there are groups of outputs. In the case of the first activity several outputs have been identified:
• Complete annual FSM Economic Review including review of PSD pro-gress (1)
• Complete annual State Economic Reviews (4) • Complete annual Economic Briefing for FSM Government at JEMCO
meeting (1) • Complete annual Compact Report (1) • Etc…
16 Each output is quantifiable and its delivery is under the control of the responsible manager. For each output there corresponds two performance meas-ures: a “target level,” for and the “actual level” attained during the reporting period.
17 Outputs differ in nature from Outcomes. Outputs come under the direct control of the responsible agencies and will be measured as often as monthly or quarterly. In the case of outcomes it is likely that their measurement will be less frequent and the movement of the outcome measure will be affected by many factors that are outside the control of the manager. In the above example, the output defined as the preparation of annual economic reviews is the direct re-sponsibility of staff working in the Department of Economic Affairs. Given sufficient resources they can (and should) deliver the target level. On the other hand, the attainment of the Outcome of fiscal stability, as measured by the deficit as a share of GDP, will be influenced by variety of factors, such as legislative appropriation levels, unanticipated revenue shortfalls, and other factors that are beyond the control the Department concerned. In the strategic planning exercise it is critical that the concepts of Outcomes and Outputs are clearly distinguished.
Appendix A: –Strategic Planning Methodology 7
A.2.3 Organizations
18 Organizations are defined in the system as the units that undertake the required activities and produce the deliverable outputs. Organizations will fre-quently be governments, their departments and agencies; although the private sector or non-government organizations (NGOs) may also be considered as an organization. Usually in a government there may be many levels, from the de-partmental level, to divisions, and subordinate sections. Any of these elements in the system may contribute to the delivery of a given activity and there need not be a unique relationship between an organizational unit and an activity. For example both the education and health departments may be jointly responsible for an activity to improve health education and awareness in the outer islands. While there is a need for integration of planning and coordination of activities, practical considerations need to be taken into account. Where there is such over-lap, it is quite likely best for an activity to appear in both the education and health sector policy matrices, and subsequently in the performance budgets of both the education and health departments of a particular government. This will simplify monitoring and reporting.
A.2.4 Resources and Inputs
19 In order for organizations to undertake activities and deliver outputs, access to resources is required. Governments may appropriate funds for outlays on payroll, purchase of goods and services, subsidies, transfers, and capital items. These outlays or expenditures are often referred to as inputs, and these were the center of focus of traditional line-item budgeting. In performance budgeting attention is directed to the activities and outputs in order to achieve an agreed upon strategic goal. In the full-blown purchaser—provider model, the legislative body will appropriate the needed resources (acting as a purchaser) for specific strategic goals and the organizations (acting as providers) will undertake the activities and deliver the outputs which, taken together can be reasonably expected to lead to achievement of the strategic goals.
A.3 The FSM Strategic Planning Process
A.3.1 The Strategic Development Plan
20 The FSM Strategic Development Plan (SDP), while similar to many development-planning exercises, is specifically designed with detailed imple-mentation in mind. The plan outlines a list of key strategic goals. However, associated with each strategic goal is a set of outcome performance measures through which it will be possible over time to monitor the success of the plan. The FSM SDP goes further in that it also outlines the activities and deliverable outputs, which, under reasonable assumptions, can be expected to lead to the achievement of the identified strategic goals. To each output is also associated a
8 FSM Strategic Development Plan
quantifiable performance measure, so that during plan execution it will be possi-ble to monitor if the activities and outputs have been fully implemented.
21 During the ongoing monitoring process it will be possible to determine if the SDP strategic goals have been achieved; furthermore, over time it will be possible to improve the accuracy of cost estimates to deliver specified levels of outputs. If the outcomes have been achieved it will be possible to fine-tune the delivery of activities in the most cost effective way. If, however, the outcomes have not been achieved, managers will first be asked if they undertook the planned activities and delivered the target level of outputs. If not, why not? If the activities were undertaken and the outputs were delivered as targeted, then reviewers (e.g. legislators and senior policy makers) will need to look deeper into why the expected impact on the outcome measure did not occur. In other words, the SDP provides a means not only to monitor progress, but a means over time to improve the management of public sector resources.
22 The FSM Strategic Development Plan will be comprised of a set of sector chapters. The layout of each chapter has been designed according to a specific template. Each chapter begins with a review of the sector, including: an assessment of the current situation and sector performance, analysis of problems, issues and constraints, and assessment of the sector’s development potential. Building on the introductory review, the second section presents the sector stra-tegic goals, which are supported by a descriptive rationale. Each strategic goal has been further elaborated if needed through appropriate sector policies. In order to assess performance in attainment of the strategic goals, a list of the as-sociated outcome performance measures has been presented and is discussed at the end of the section. In the case of the FSM SDP the outcome baseline and target measures have been specified where it is meaningful to do so at a national level. Since many outcomes are state specific, the associated baselines and targets have frequently been left unspecified.
23 The third section details the sector Strategic Planning Matrix (SPM), and indicates the activities and outputs associated with each strategic goal (see Appendix 1.) The SPM is the heart of the strategic plan and provides a working manual for each sector. Since activities and outputs are state specific the associated targets have only been specified when meaningful. The fourth section describes the SPM and the linkage between activities and outputs with the strategic goal. The linkage indicates how the delivery of the activities and outputs is assumed to contribute to the attainment of a strategic goal. This sec-tion also provides an assessment of linkage risks and weaknesses to facilitate the anticipated ex post performance evaluation efforts. Finally a fifth section refer-ences the Infrastructure Development Plan (IDP), and identifies the list of infra-structure projects that are critical to the fulfillment of the sector strategy. The
Appendix A: –Strategic Planning Methodology 9
list distinguishes between those projects whose major function is to directly sup-port sector development and those whose purpose is indirect or crosscutting.
24 A critical element in the preparation of the Strategic Development Plan is the convening of the third FSM Economic Summit. The Third Summit is planned to breakout into sector committees, which will have access to the draft chapters and strategic planning matrices. Each committee will debate the SPM in detail scrutinizing element by element with the intention of determining an acceptable matrix for the FSM that has wide endorsement from all states of the federation. On finalization of the Third Summit the recommendations of the sector committees and revised matrices will be presented to the Summit for en-dorsement and subsequent integration into the SDP.
A.3.2 Planning in the Federation: Need for State Variance
25 While the FSM SDP provides a blueprint for the nation’s development, many elements of the plan will have been deliberately generalized to allow for variation across the four states. It is hoped that there can be coherence and rela-tive uniformity wherever possible and whenever appropriate. However, it would make nonsense of the planning process to insist that a “one-size-fits-all” ap-proach could possibly work for all five of the national and state governments. Thus, while it is expected that there can be broad agreements on mission state-ments, strategic goals and the outcome measures of each strategic goal, it is fully understood that the five governments will fine-tune where needed to fit their specific needs. Since baseline levels differ across the states, surely target levels will be set differently. Where one state may place greater priority (and resource allocation) to achieve a greater improvement in, for example, infant mortality rate improvements; another may have already made progress in that area and want to focus on reducing the prevalence of certain lifestyle diseases.
26 The FSM planning and budgeting system will be uniform as a “proc-ess.” It should lead to greater accountability and improved allocation of scarce public resources. But at the same time it will enable each of the five govern-ments to “demand” public goods and services according to the priorities of the legislative bodies and policy makers. It is therefore anticipated that each state will develop its annual performance budgets using as a guide the outcomes of the 3rd FSM Economic Summit and the FSM SDP. It may be the case that one or more states will develop their own state-level SDP following in line with the FSM SDP. Whether each state will opt for a participatory process such as a Summit is for each state to decide.
A.3.3 The Annual Budget Process
27 Finally, the implementation of the FSM SDP will take place through the annual budget process. The budget will draw on the plan for direction and in
10 FSM Strategic Development Plan
particular from the identified strategic goals and policies. The list of activities and outputs, which may be undertaken in phases and delivered over a number of years, will require detailed specification for the upcoming budget year. While the SDP will clearly indicate the direction of development policy over a number of years, it is not intended to be cast in stone and it is anticipated that annual budgets may depart from the direction planned as circumstances necessitate.
A.4 Glossary of Terms • Activity: Programs, processes, tasks, and what a department does that, if
achieved, will lead to accomplishing the strategic goal; activities can be specified as major service areas or groupings of related services.
• Infrastructure Development Plan (IDP): the IDP is the FSM’s long-term planning document for public investment in infrastructure. The document has been drafted to cover a 20-year period; while recognizing that priorities outlined and the specific projects in each sector will be up-dated through the annual budget process. The IDP is comprehensive in that it covers all anticipated sources of investment, including local reve-nues, Compact sector grants, and other donor finance. With respect to Compact funding, the IDP is considered as a part of the Development Plan required under Compact section 211 (c) and specified in further de-tail in the Fiscal Procedures Agreement Article V (1)(e).
• Inputs: Financial and physical resources used to produce an output. Physical resources include human and material resources, typically meas-ured in dollars such as salaries, cost of computers, travel, or other ex-penses. Inputs were the focus of traditional line-item budgeting.
• Mission Statement: Describes what an organization currently does as its core function, how well it performs the function, for whom the function is provided, and when the function is provided. The mission does not often change.
• Outcome: The outcome is measured in order to indicate whether the strategic goal was accomplished. The outcome can also be considered the impact or the change attributable to an intervention, such as an action or process (e.g. policy, program, project, investment). It is noted that the outcome may be affected by factors outside of the control of the manager assigned to achieving improvements. There are three “levels” of outcome measures that will be collected and reported:
• Baseline level: measurement at the outset of the planning period; required to establish the level from which improvements will be made
Appendix A: –Strategic Planning Methodology 11
• Target level: Number that indicates the level to which improve-ments are planned for during a specified planning period (perhaps 3-5 years).
• Achieved level: Number that indicates the actual change in the outcome measure during the planning period. This may be meas-ured at periodic intervals as part of the budget monitoring and re-porting process.
• Outputs: Units or quantity of work completed or delivered. Work com-pleted includes goods and services provided by the government such as number of patients seen at the hospital, number of tickets issued, number of licenses revoked, or number of grant reviews completed. In the FSM budgeting system, the Output is the lowest level that may be associated with costs or budgets. It is also clear that the delivery of the output must be under the immediate and direct control of the manager assigned. Dur-ing the budget formulation process, outputs may be developed based on actual outputs produced in previous years as well as historical data on costs. Improvements in efficiency would be demonstrated by achieving more outputs for the same cost or the same level of outputs with reduced costs. There are two “levels” of output measures that will be collected and reported:
• Target level: quantity of the deliverable outputs expected (com-mitted) to be produced during the planning period (usually annual, broken down by quarter).
• Achieved level: quantity of the deliverable outputs actually pro-duced during the planning period.
• Performance Measure: quantifiable measures that can be collected in a consistent and reliable manner. In the FSM system, performance will be measured at two levels: outcome measures to determine achievement of (long-term) strategic goals; and output measures to verify the delivery of (committed) outputs (units of work). Over time measures of efficiency (unit cost measures) may also be added to the system.
• Policy: A course or method of action selected from among alternatives, and in light of given conditions designed to guide and determine present and future decisions and actions; a course of action, guiding principle, or procedure considered to be expedient, prudent, or advantageous.
• Strategic Development Plan (SDP): The document which outlines the FSM’s broad economic strategy and sectoral development policies. The SDP is comprised of descriptive narratives of each sector and the SPM
12 FSM Strategic Development Plan
for each sector. In addition to being the primary national economic plan-ning mechanism of the FSM, the SDP also provides the means of com-plying with the requirement under the Amended Compact section 211 (c) to prepare and maintain a “Multi-Year Rolling Development Plan.” As indicated therein, “the Development Plan shall be strategic in nature … updated through the annual budget process.”
• Strategic Planning Matrix (SPM): a matrix or table used to present in summary form a sector’s planning framework and including: mission statement, strategic goals (and policies), activities, and outputs.
• Strategic Goal: High level, long term goals established in the FSM eco-nomic summit that drive the performance-based budget. What an organi-zation needs to achieve to fulfill its 5-10 year strategy for mission accom-plishment. The strategic goal will likely be stated in such a manner that it is not in itself measurable; however, one or more outcome measures should be identified for each Strategic Goal to determine progress along the way and to ultimately determine if the strategic goal is achieved.
13
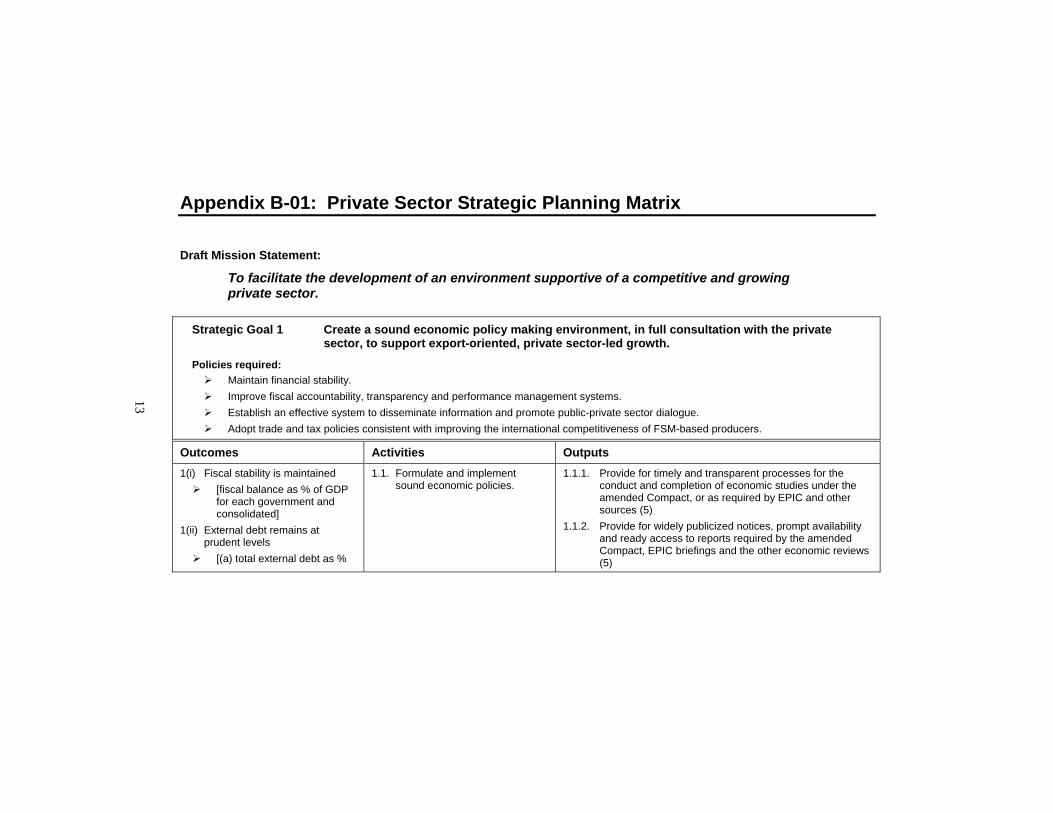
Appendix B-01: Private Sector Strategic Planning Matrix
Draft Mission Statement:
To facilitate the development of an environment supportive of a competitive and growing private sector.
Strategic Goal 1 Create a sound economic policy making environment, in full consultation with the private sector, to support export-oriented, private sector-led growth.
Policies required:
Maintain financial stability. Improve fiscal accountability, transparency and performance management systems. Establish an effective system to disseminate information and promote public-private sector dialogue. Adopt trade and tax policies consistent with improving the international competitiveness of FSM-based producers.
Outcomes Activities Outputs 1(i) Fiscal stability is maintained
[fiscal balance as % of GDP for each government and consolidated]
1(ii) External debt remains at prudent levels
[(a) total external debt as %
1.1. Formulate and implement sound economic policies.
1.1.1. Provide for timely and transparent processes for the conduct and completion of economic studies under the amended Compact, or as required by EPIC and other sources (5)
1.1.2. Provide for widely publicized notices, prompt availability and ready access to reports required by the amended Compact, EPIC briefings and the other economic reviews (5)
14 FSM
Strategic Developm
ent Plan
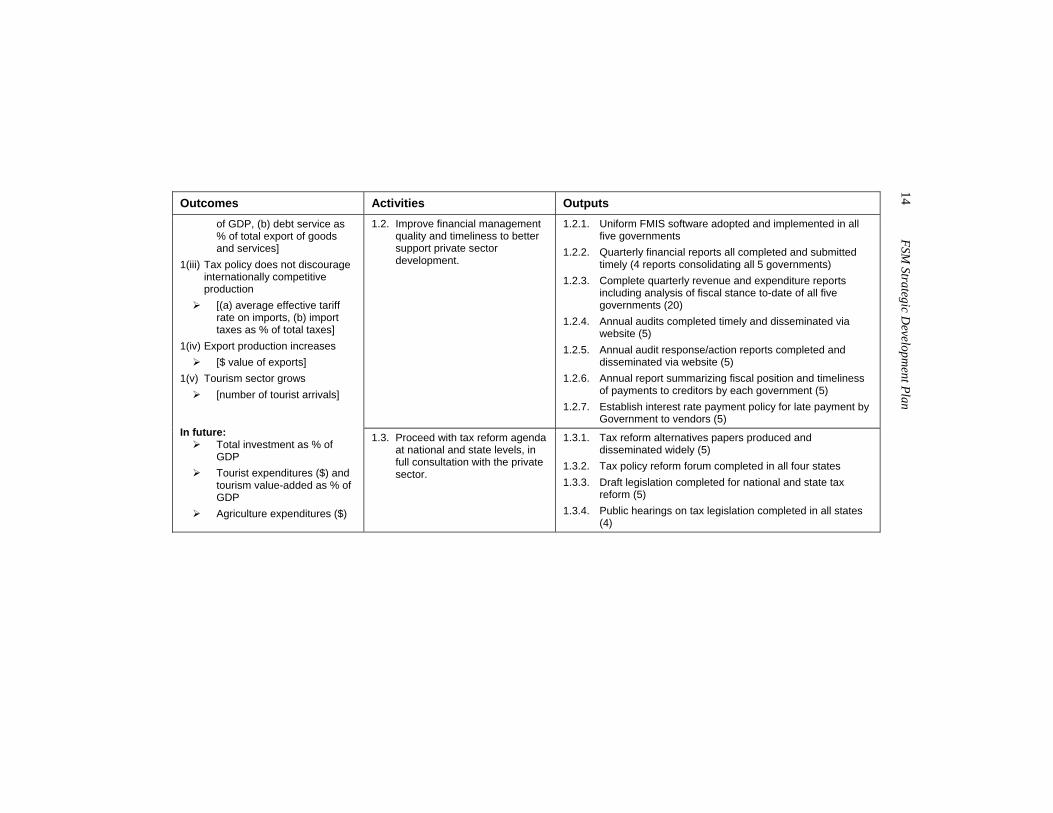
Outcomes Activities Outputs 1.2. Improve financial management
quality and timeliness to better support private sector development.
1.2.1. Uniform FMIS software adopted and implemented in all five governments
1.2.2. Quarterly financial reports all completed and submitted timely (4 reports consolidating all 5 governments)
1.2.3. Complete quarterly revenue and expenditure reports including analysis of fiscal stance to-date of all five governments (20)
1.2.4. Annual audits completed timely and disseminated via website (5)
1.2.5. Annual audit response/action reports completed and disseminated via website (5)
1.2.6. Annual report summarizing fiscal position and timeliness of payments to creditors by each government (5)
1.2.7. Establish interest rate payment policy for late payment by Government to vendors (5)
of GDP, (b) debt service as % of total export of goods and services]
1(iii) Tax policy does not discourage internationally competitive production
[(a) average effective tariff rate on imports, (b) import taxes as % of total taxes]
1(iv) Export production increases [$ value of exports]
1(v) Tourism sector grows [number of tourist arrivals]
In future:
Total investment as % of GDP
Tourist expenditures ($) and tourism value-added as % of GDP
Agriculture expenditures ($)
1.3. Proceed with tax reform agenda at national and state levels, in full consultation with the private sector.
1.3.1. Tax reform alternatives papers produced and disseminated widely (5)
1.3.2. Tax policy reform forum completed in all four states 1.3.3. Draft legislation completed for national and state tax
reform (5) 1.3.4. Public hearings on tax legislation completed in all states
(4)
Private Sector Strategic Planning M
atrix 15
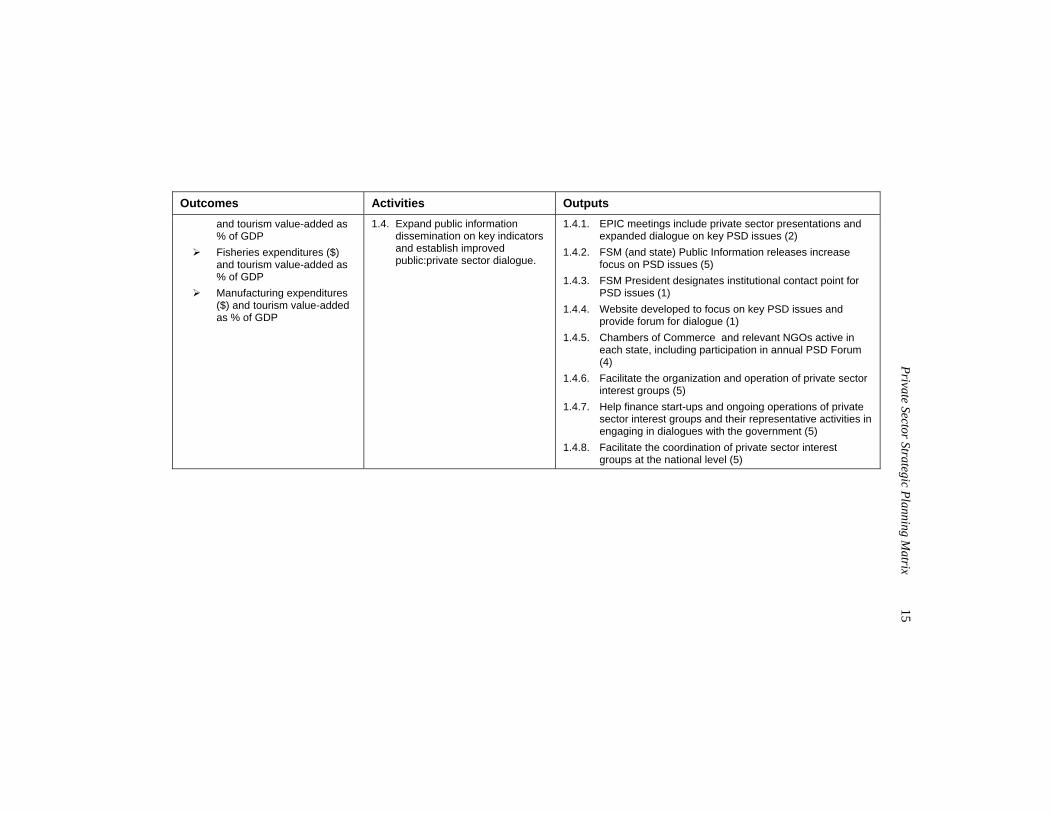
Outcomes Activities Outputs and tourism value-added as % of GDP
Fisheries expenditures ($) and tourism value-added as % of GDP
Manufacturing expenditures ($) and tourism value-added as % of GDP
1.4. Expand public information dissemination on key indicators and establish improved public:private sector dialogue.
1.4.1. EPIC meetings include private sector presentations and expanded dialogue on key PSD issues (2)
1.4.2. FSM (and state) Public Information releases increase focus on PSD issues (5)
1.4.3. FSM President designates institutional contact point for PSD issues (1)
1.4.4. Website developed to focus on key PSD issues and provide forum for dialogue (1)
1.4.5. Chambers of Commerce and relevant NGOs active in each state, including participation in annual PSD Forum (4)
1.4.6. Facilitate the organization and operation of private sector interest groups (5)
1.4.7. Help finance start-ups and ongoing operations of private sector interest groups and their representative activities in engaging in dialogues with the government (5)
1.4.8. Facilitate the coordination of private sector interest groups at the national level (5)
16 FSM
Strategic Developm
ent Plan
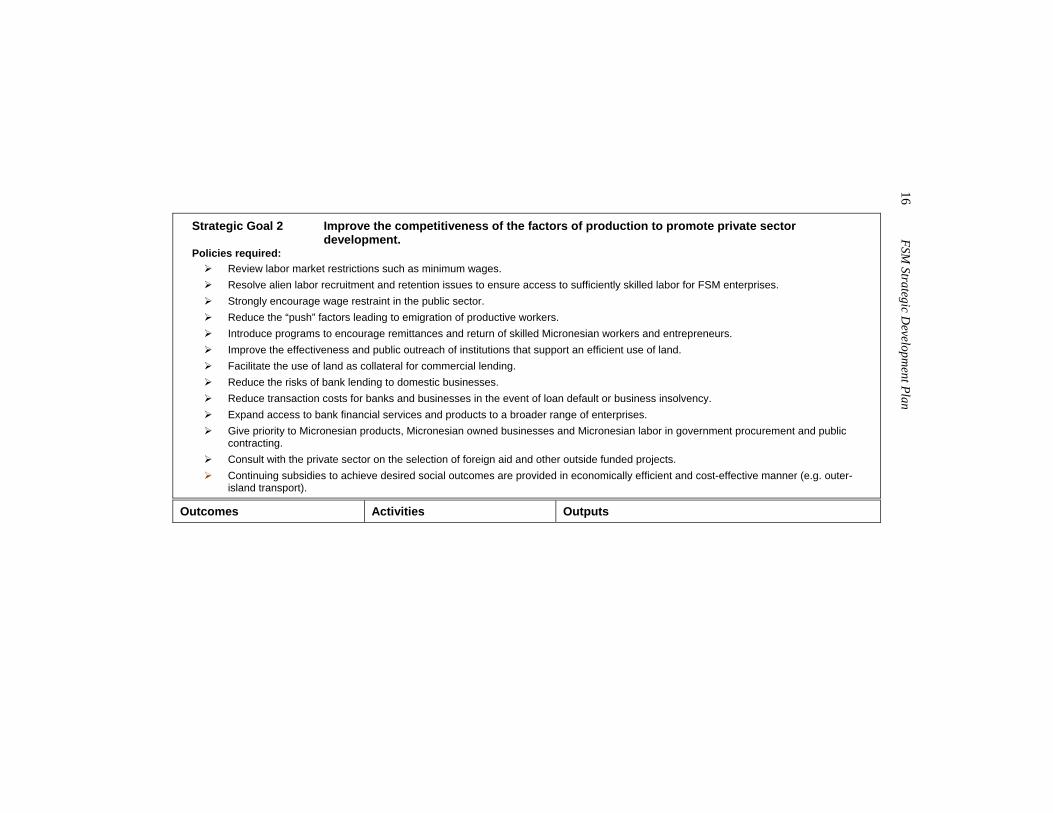
Strategic Goal 2 Improve the competitiveness of the factors of production to promote private sector
development. Policies required:
Review labor market restrictions such as minimum wages. Resolve alien labor recruitment and retention issues to ensure access to sufficiently skilled labor for FSM enterprises. Strongly encourage wage restraint in the public sector. Reduce the “push” factors leading to emigration of productive workers. Introduce programs to encourage remittances and return of skilled Micronesian workers and entrepreneurs. Improve the effectiveness and public outreach of institutions that support an efficient use of land. Facilitate the use of land as collateral for commercial lending. Reduce the risks of bank lending to domestic businesses. Reduce transaction costs for banks and businesses in the event of loan default or business insolvency. Expand access to bank financial services and products to a broader range of enterprises. Give priority to Micronesian products, Micronesian owned businesses and Micronesian labor in government procurement and public
contracting. Consult with the private sector on the selection of foreign aid and other outside funded projects. Continuing subsidies to achieve desired social outcomes are provided in economically efficient and cost-effective manner (e.g. outer-
island transport). Outcomes Activities Outputs
Private Sector Strategic Planning M
atrix 17
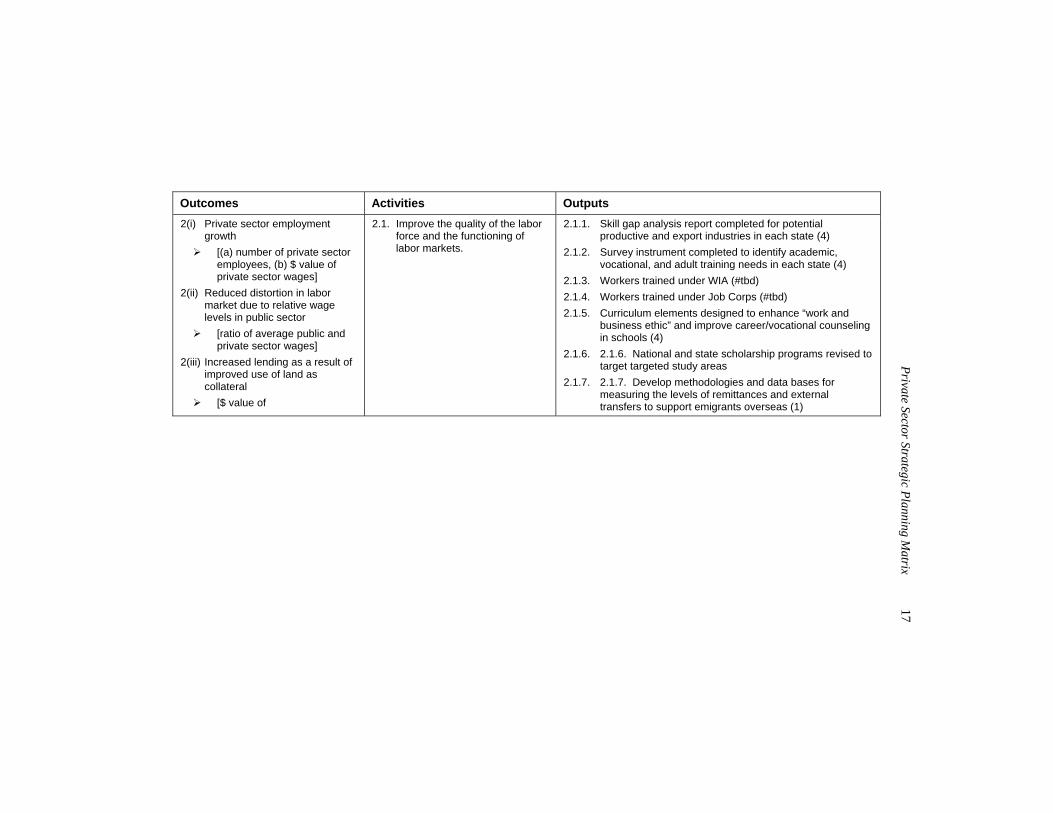
Outcomes Activities Outputs 2(i) Private sector employment
growth [(a) number of private sector
employees, (b) $ value of private sector wages]
2(ii) Reduced distortion in labor market due to relative wage levels in public sector
[ratio of average public and private sector wages]
2(iii) Increased lending as a result of improved use of land as collateral
[$ value of
2.1. Improve the quality of the labor force and the functioning of labor markets.
2.1.1. Skill gap analysis report completed for potential productive and export industries in each state (4)
2.1.2. Survey instrument completed to identify academic, vocational, and adult training needs in each state (4)
2.1.3. Workers trained under WIA (#tbd) 2.1.4. Workers trained under Job Corps (#tbd) 2.1.5. Curriculum elements designed to enhance “work and
business ethic” and improve career/vocational counseling in schools (4)
2.1.6. 2.1.6. National and state scholarship programs revised to target targeted study areas
2.1.7. 2.1.7. Develop methodologies and data bases for measuring the levels of remittances and external transfers to support emigrants overseas (1)
18 FSM
Strategic Developm
ent Plan
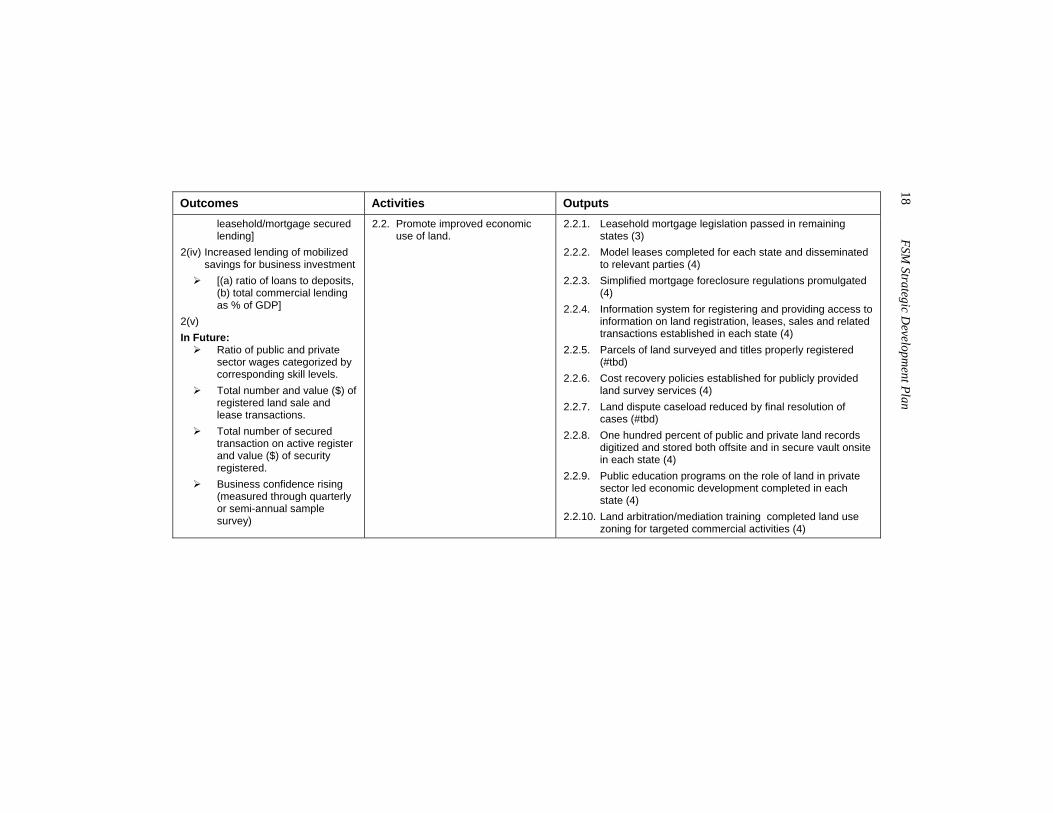
Outcomes Activities Outputs leasehold/mortgage secured lending]
2(iv) Increased lending of mobilized savings for business investment
[(a) ratio of loans to deposits, (b) total commercial lending as % of GDP]
2(v) In Future:
Ratio of public and private sector wages categorized by corresponding skill levels.
Total number and value ($) of registered land sale and lease transactions.
Total number of secured transaction on active register and value ($) of security registered.
Business confidence rising (measured through quarterly or semi-annual sample survey)
2.2. Promote improved economic use of land.
2.2.1. Leasehold mortgage legislation passed in remaining states (3)
2.2.2. Model leases completed for each state and disseminated to relevant parties (4)
2.2.3. Simplified mortgage foreclosure regulations promulgated (4)
2.2.4. Information system for registering and providing access to information on land registration, leases, sales and related transactions established in each state (4)
2.2.5. Parcels of land surveyed and titles properly registered (#tbd)
2.2.6. Cost recovery policies established for publicly provided land survey services (4)
2.2.7. Land dispute caseload reduced by final resolution of cases (#tbd)
2.2.8. One hundred percent of public and private land records digitized and stored both offsite and in secure vault onsite in each state (4)
2.2.9. Public education programs on the role of land in private sector led economic development completed in each state (4)
2.2.10. Land arbitration/mediation training completed land use zoning for targeted commercial activities (4)
Private Sector Strategic Planning M
atrix 19
Outcomes Activities Outputs
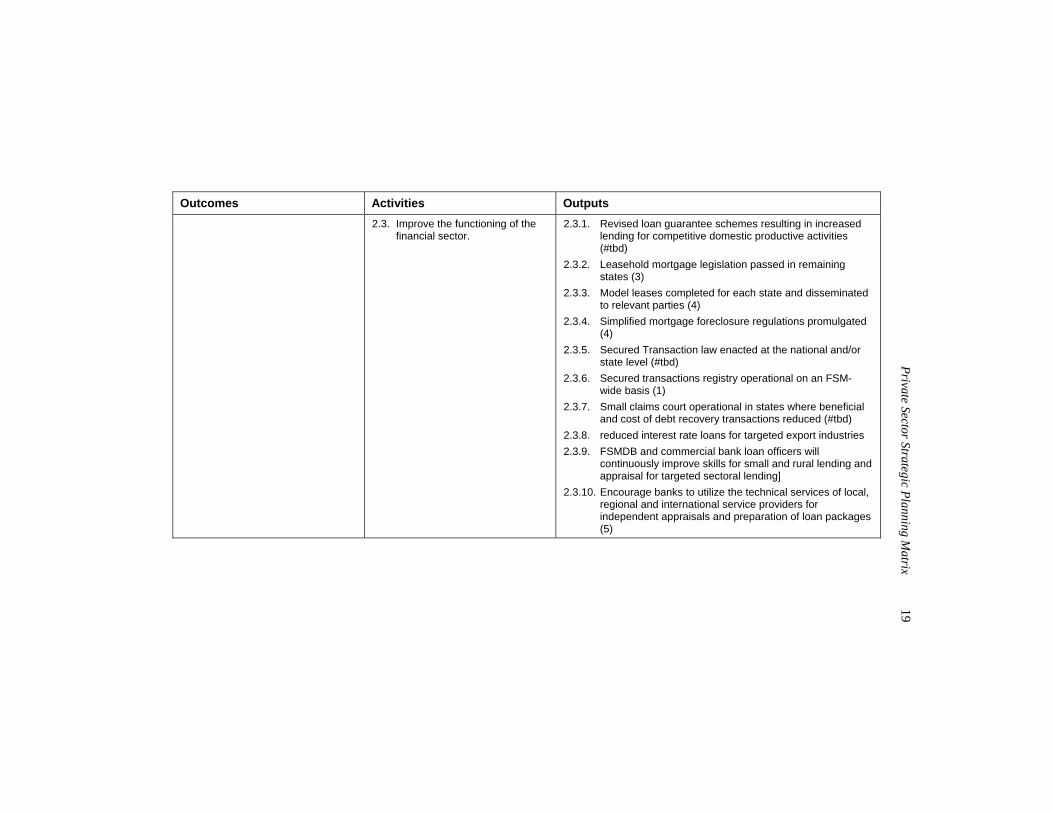
2.3. Improve the functioning of the financial sector.
2.3.1. Revised loan guarantee schemes resulting in increased lending for competitive domestic productive activities (#tbd)
2.3.2. Leasehold mortgage legislation passed in remaining states (3)
2.3.3. Model leases completed for each state and disseminated to relevant parties (4)
2.3.4. Simplified mortgage foreclosure regulations promulgated (4)
2.3.5. Secured Transaction law enacted at the national and/or state level (#tbd)
2.3.6. Secured transactions registry operational on an FSM-wide basis (1)
2.3.7. Small claims court operational in states where beneficial and cost of debt recovery transactions reduced (#tbd)
2.3.8. reduced interest rate loans for targeted export industries 2.3.9. FSMDB and commercial bank loan officers will
continuously improve skills for small and rural lending and appraisal for targeted sectoral lending]
2.3.10. Encourage banks to utilize the technical services of local, regional and international service providers for independent appraisals and preparation of loan packages (5)
20 FSM
Strategic Developm
ent Plan
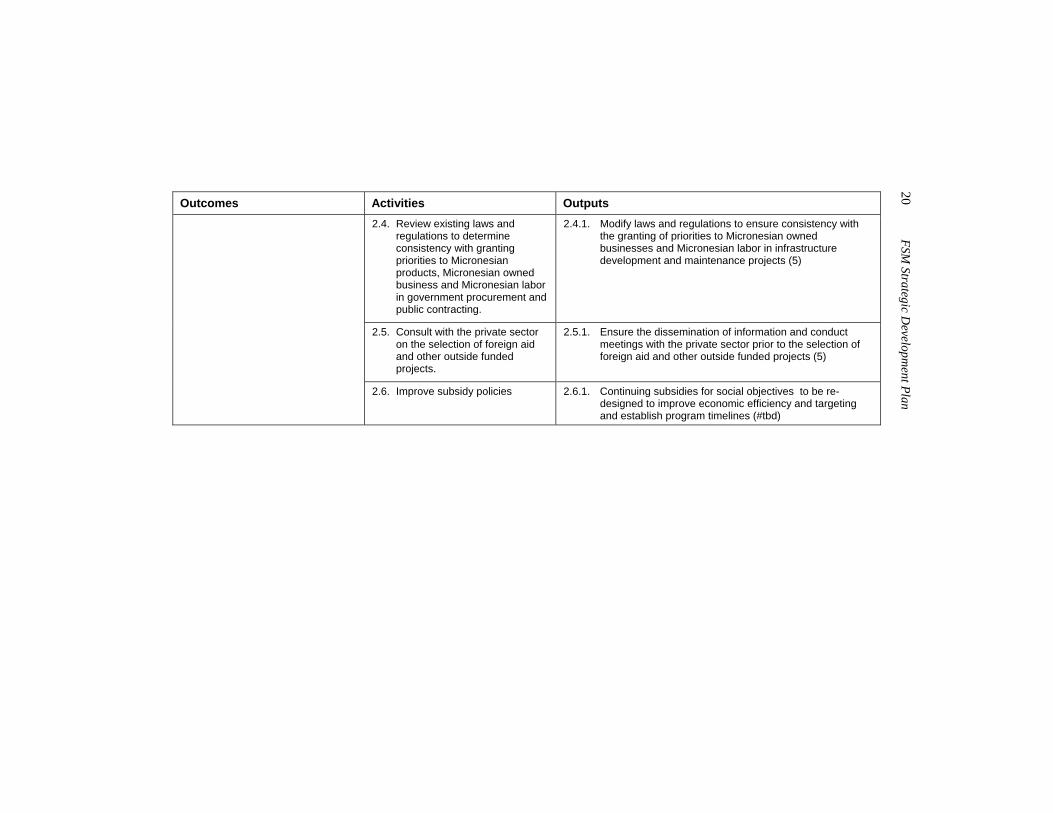
Outcomes Activities Outputs 2.4. Review existing laws and
regulations to determine consistency with granting priorities to Micronesian products, Micronesian owned business and Micronesian labor in government procurement and public contracting.
2.4.1. Modify laws and regulations to ensure consistency with the granting of priorities to Micronesian owned businesses and Micronesian labor in infrastructure development and maintenance projects (5)
2.5. Consult with the private sector on the selection of foreign aid and other outside funded projects.
2.5.1. Ensure the dissemination of information and conduct meetings with the private sector prior to the selection of foreign aid and other outside funded projects (5)
2.6. Improve subsidy policies 2.6.1. Continuing subsidies for social objectives to be re-designed to improve economic efficiency and targeting and establish program timelines (#tbd)
Private Sector Strategic Planning M
atrix 21
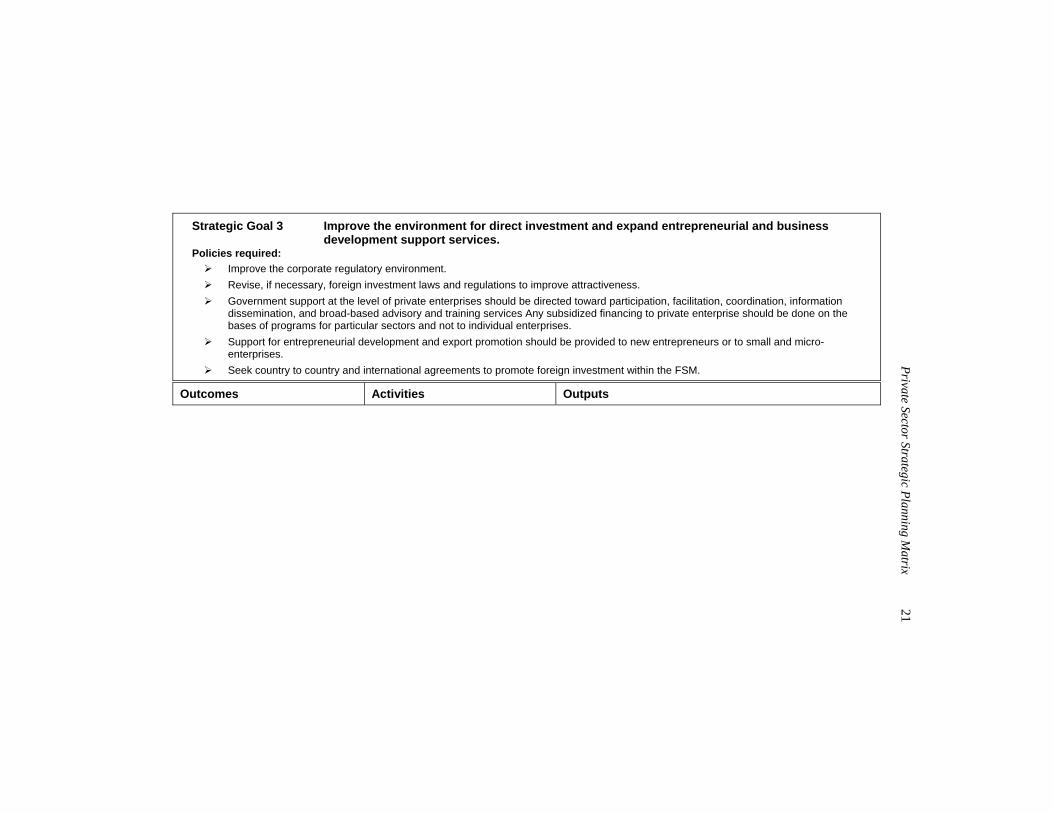
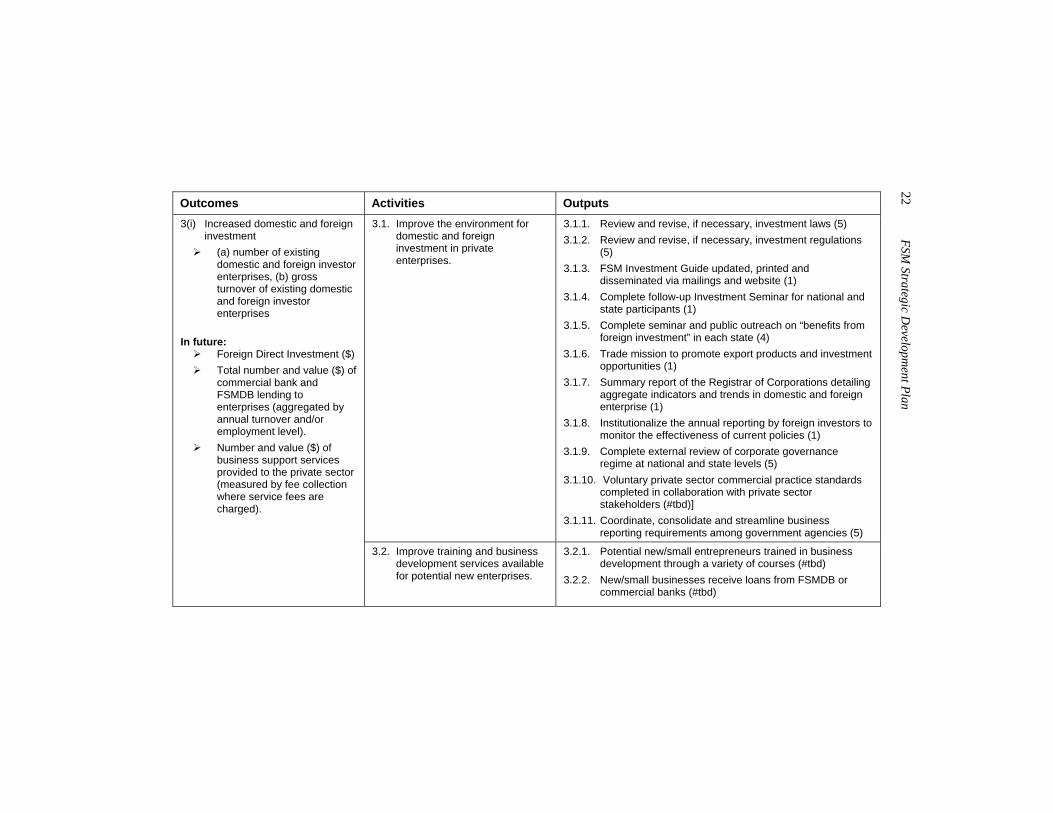
Strategic Goal 3 Improve the environment for direct investment and expand entrepreneurial and business
development support services. Policies required:
Improve the corporate regulatory environment. Revise, if necessary, foreign investment laws and regulations to improve attractiveness. Government support at the level of private enterprises should be directed toward participation, facilitation, coordination, information
dissemination, and broad-based advisory and training services Any subsidized financing to private enterprise should be done on the bases of programs for particular sectors and not to individual enterprises.
Support for entrepreneurial development and export promotion should be provided to new entrepreneurs or to small and micro-enterprises.
Seek country to country and international agreements to promote foreign investment within the FSM. Outcomes Activities Outputs
22 FSM
Strategic Developm
ent Plan
Outcomes Activities Outputs 3.1. Improve the environment for
domestic and foreign investment in private enterprises.
3.1.1. Review and revise, if necessary, investment laws (5) 3.1.2. Review and revise, if necessary, investment regulations
(5) 3.1.3. FSM Investment Guide updated, printed and
disseminated via mailings and website (1) 3.1.4. Complete follow-up Investment Seminar for national and
state participants (1) 3.1.5. Complete seminar and public outreach on “benefits from
foreign investment” in each state (4) 3.1.6. Trade mission to promote export products and investment
opportunities (1) 3.1.7. Summary report of the Registrar of Corporations detailing
aggregate indicators and trends in domestic and foreign enterprise (1)
3.1.8. Institutionalize the annual reporting by foreign investors to monitor the effectiveness of current policies (1)
3.1.9. Complete external review of corporate governance regime at national and state levels (5)
3.1.10. Voluntary private sector commercial practice standards completed in collaboration with private sector stakeholders (#tbd)]
3.1.11. Coordinate, consolidate and streamline business reporting requirements among government agencies (5)
3(i) Increased domestic and foreign investment
(a) number of existing domestic and foreign investor enterprises, (b) gross turnover of existing domestic and foreign investor enterprises
In future:
Foreign Direct Investment ($) Total number and value ($) of
commercial bank and FSMDB lending to enterprises (aggregated by annual turnover and/or employment level).
Number and value ($) of business support services provided to the private sector (measured by fee collection where service fees are charged).
3.2. Improve training and business development services available for potential new enterprises.
3.2.1. Potential new/small entrepreneurs trained in business development through a variety of courses (#tbd)
3.2.2. New/small businesses receive loans from FSMDB or commercial banks (#tbd)
Private Sector Strategic Planning M
atrix 23
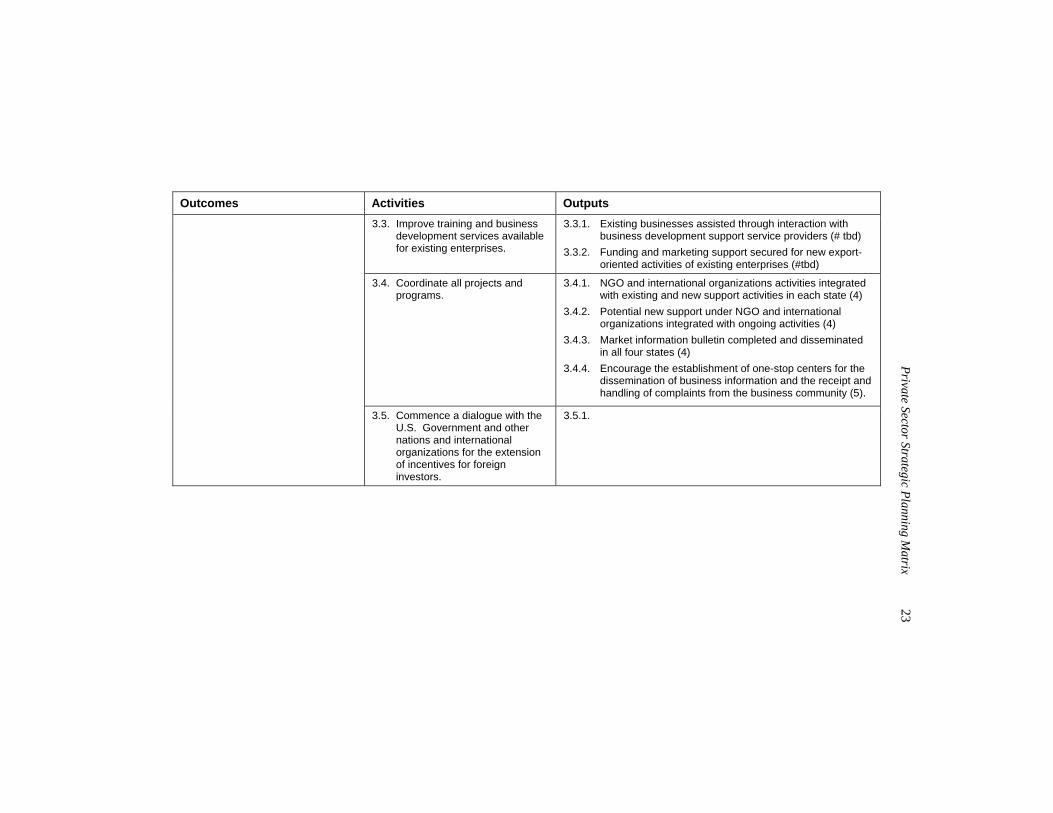
Outcomes Activities Outputs 3.3. Improve training and business
development services available for existing enterprises.
3.3.1. Existing businesses assisted through interaction with business development support service providers (# tbd)
3.3.2. Funding and marketing support secured for new export-oriented activities of existing enterprises (#tbd)
3.4. Coordinate all projects and programs.
3.4.1. NGO and international organizations activities integrated with existing and new support activities in each state (4)
3.4.2. Potential new support under NGO and international organizations integrated with ongoing activities (4)
3.4.3. Market information bulletin completed and disseminated in all four states (4)
3.4.4. Encourage the establishment of one-stop centers for the dissemination of business information and the receipt and handling of complaints from the business community (5).
3.5. Commence a dialogue with the U.S. Government and other nations and international organizations for the extension of incentives for foreign investors.
3.5.1.
24 FSM
Strategic Developm
ent Plan
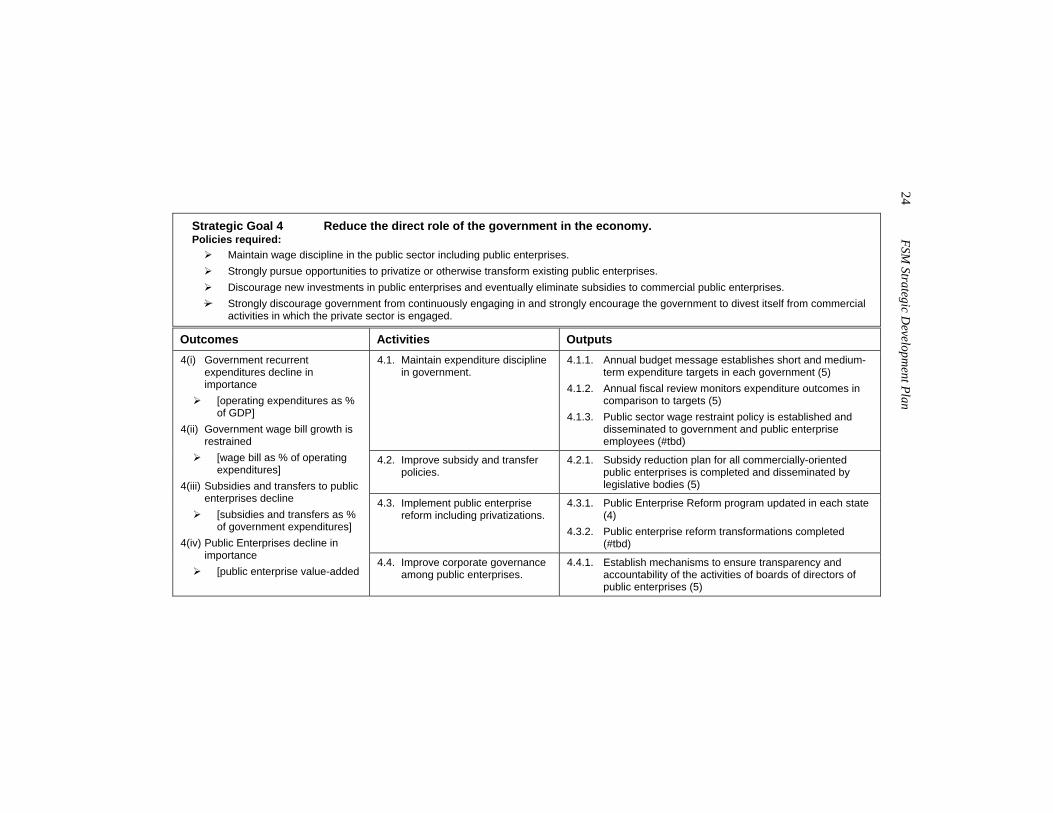
Strategic Goal 4 Reduce the direct role of the government in the economy. Policies required:
Maintain wage discipline in the public sector including public enterprises. Strongly pursue opportunities to privatize or otherwise transform existing public enterprises. Discourage new investments in public enterprises and eventually eliminate subsidies to commercial public enterprises. Strongly discourage government from continuously engaging in and strongly encourage the government to divest itself from commercial
activities in which the private sector is engaged. Outcomes Activities Outputs
4.1. Maintain expenditure discipline in government.
4.1.1. Annual budget message establishes short and medium-term expenditure targets in each government (5)
4.1.2. Annual fiscal review monitors expenditure outcomes in comparison to targets (5)
4.1.3. Public sector wage restraint policy is established and disseminated to government and public enterprise employees (#tbd)
4.2. Improve subsidy and transfer policies.
4.2.1. Subsidy reduction plan for all commercially-oriented public enterprises is completed and disseminated by legislative bodies (5)
4.3. Implement public enterprise reform including privatizations.
4.3.1. Public Enterprise Reform program updated in each state (4)
4.3.2. Public enterprise reform transformations completed (#tbd)
4(i) Government recurrent expenditures decline in importance
[operating expenditures as % of GDP]
4(ii) Government wage bill growth is restrained
[wage bill as % of operating expenditures]
4(iii) Subsidies and transfers to public enterprises decline
[subsidies and transfers as % of government expenditures]
4(iv) Public Enterprises decline in importance
[public enterprise value-added 4.4. Improve corporate governance
among public enterprises. 4.4.1. Establish mechanisms to ensure transparency and
accountability of the activities of boards of directors of public enterprises (5)
Private Sector Strategic Planning M
atrix 25
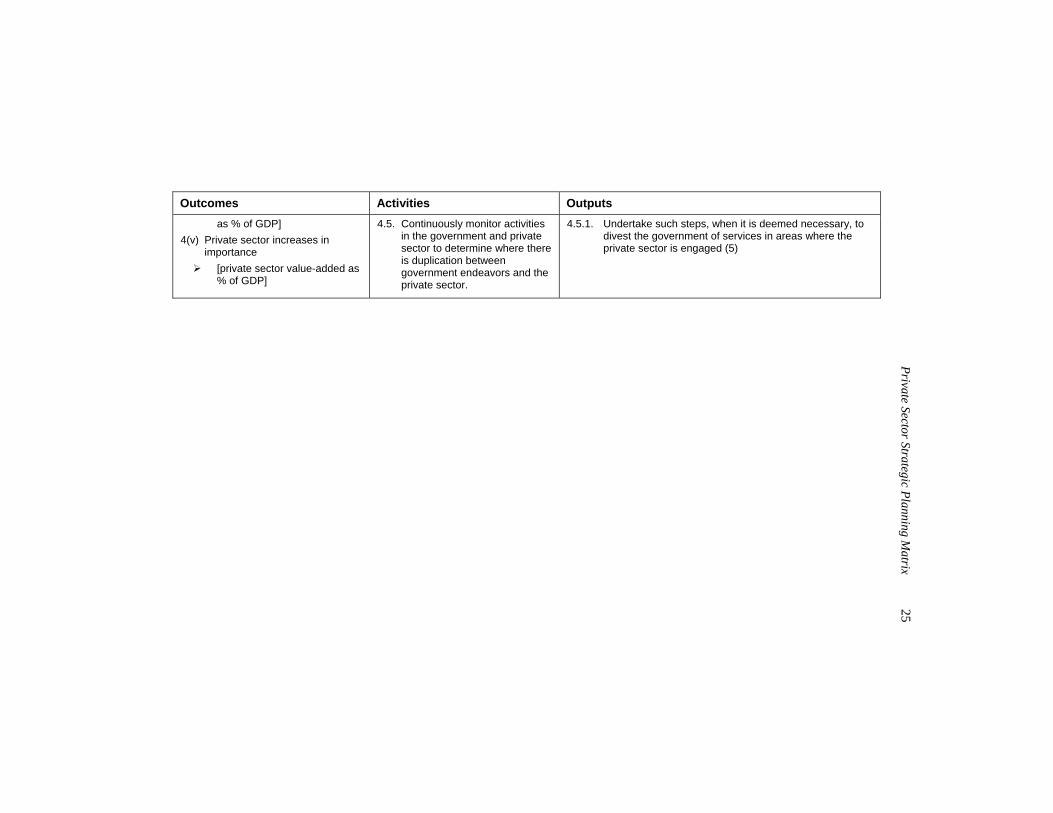
Outcomes Activities Outputs as % of GDP]
4(v) Private sector increases in importance
[private sector value-added as % of GDP]
4.5. Continuously monitor activities in the government and private sector to determine where there is duplication between government endeavors and the private sector.
4.5.1. Undertake such steps, when it is deemed necessary, to divest the government of services in areas where the private sector is engaged (5)
26 FSM
Strategic Developm
ent Plan
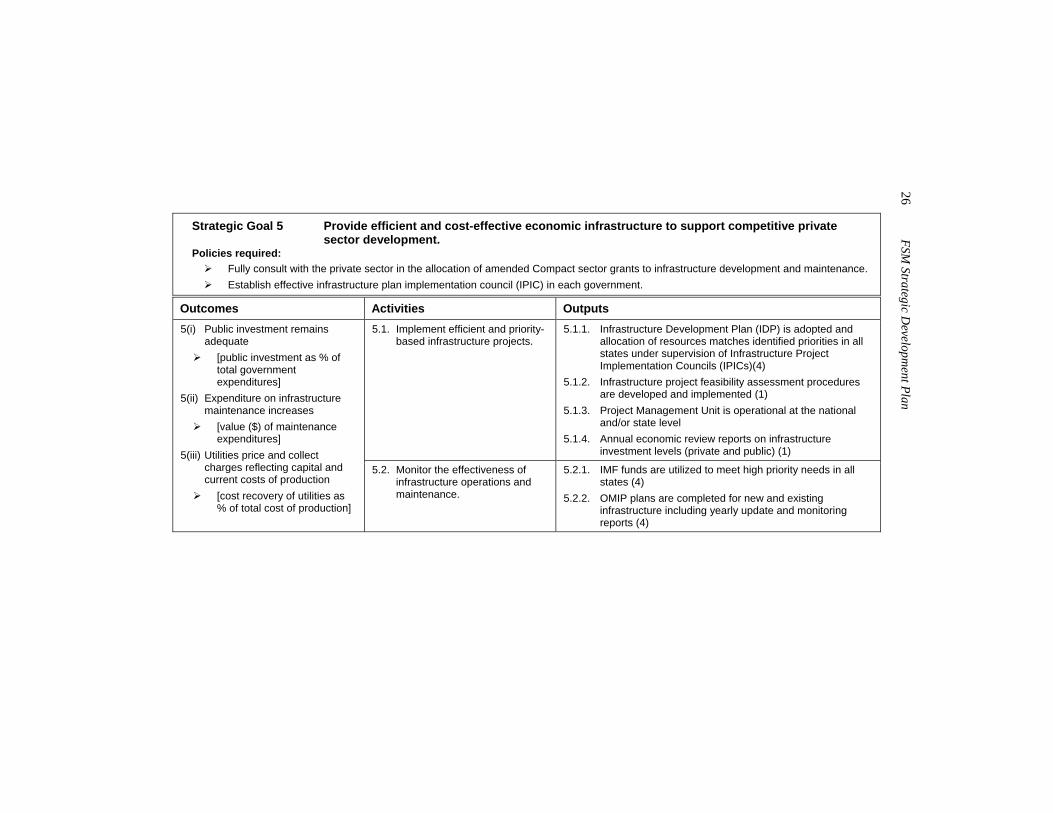
Strategic Goal 5 Provide efficient and cost-effective economic infrastructure to support competitive private
sector development. Policies required:
Fully consult with the private sector in the allocation of amended Compact sector grants to infrastructure development and maintenance. Establish effective infrastructure plan implementation council (IPIC) in each government.
Outcomes Activities Outputs 5.1. Implement efficient and priority-
based infrastructure projects. 5.1.1. Infrastructure Development Plan (IDP) is adopted and
allocation of resources matches identified priorities in all states under supervision of Infrastructure Project Implementation Councils (IPICs)(4)
5.1.2. Infrastructure project feasibility assessment procedures are developed and implemented (1)
5.1.3. Project Management Unit is operational at the national and/or state level
5.1.4. Annual economic review reports on infrastructure investment levels (private and public) (1)
5(i) Public investment remains adequate
[public investment as % of total government expenditures]
5(ii) Expenditure on infrastructure maintenance increases
[value ($) of maintenance expenditures]
5(iii) Utilities price and collect charges reflecting capital and current costs of production
[cost recovery of utilities as % of total cost of production]
5.2. Monitor the effectiveness of infrastructure operations and maintenance.
5.2.1. IMF funds are utilized to meet high priority needs in all states (4)
5.2.2. OMIP plans are completed for new and existing infrastructure including yearly update and monitoring reports (4)
Private Sector Strategic Planning M
atrix 27
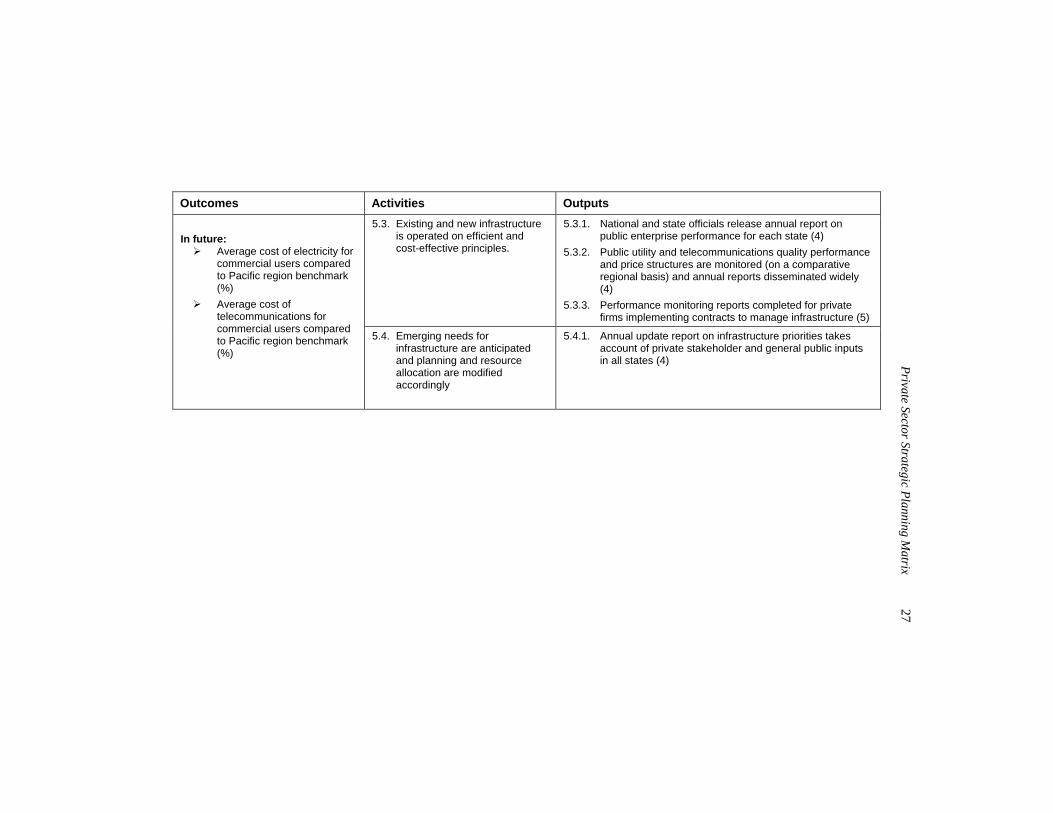
Outcomes Activities Outputs 5.3. Existing and new infrastructure
is operated on efficient and cost-effective principles.
5.3.1. National and state officials release annual report on public enterprise performance for each state (4)
5.3.2. Public utility and telecommunications quality performance and price structures are monitored (on a comparative regional basis) and annual reports disseminated widely (4)
5.3.3. Performance monitoring reports completed for private firms implementing contracts to manage infrastructure (5)
In future:
Average cost of electricity for commercial users compared to Pacific region benchmark (%)
Average cost of telecommunications for commercial users compared to Pacific region benchmark (%)
5.4. Emerging needs for infrastructure are anticipated and planning and resource allocation are modified accordingly
5.4.1. Annual update report on infrastructure priorities takes account of private stakeholder and general public inputs in all states (4)
29
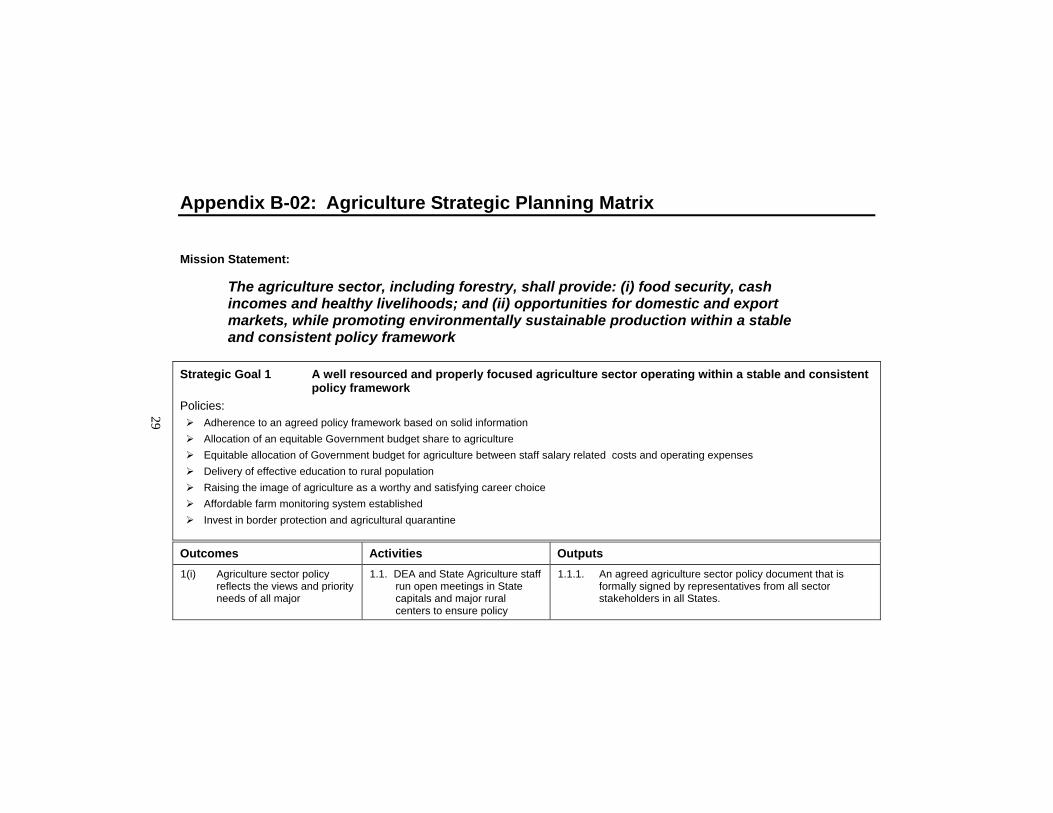
Appendix B-02: Agriculture Strategic Planning Matrix
Mission Statement:
The agriculture sector, including forestry, shall provide: (i) food security, cash incomes and healthy livelihoods; and (ii) opportunities for domestic and export markets, while promoting environmentally sustainable production within a stable and consistent policy framework
Strategic Goal 1 A well resourced and properly focused agriculture sector operating within a stable and consistent policy framework
Policies: Adherence to an agreed policy framework based on solid information Allocation of an equitable Government budget share to agriculture Equitable allocation of Government budget for agriculture between staff salary related costs and operating expenses Delivery of effective education to rural population Raising the image of agriculture as a worthy and satisfying career choice Affordable farm monitoring system established Invest in border protection and agricultural quarantine
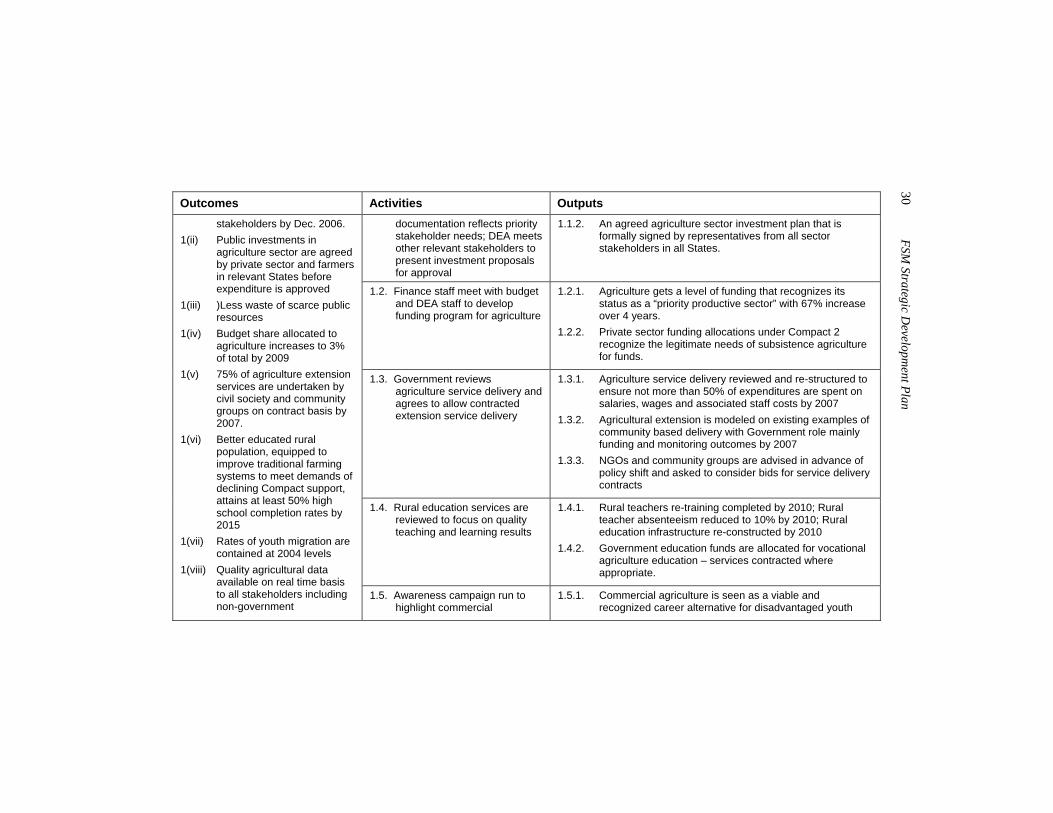
Outcomes Activities Outputs 1(i) Agriculture sector policy
reflects the views and priority needs of all major
1.1. DEA and State Agriculture staff run open meetings in State capitals and major rural centers to ensure policy
1.1.1. An agreed agriculture sector policy document that is formally signed by representatives from all sector stakeholders in all States.
30 FSM
Strategic Developm
ent Plan
Outcomes Activities Outputs documentation reflects priority stakeholder needs; DEA meets other relevant stakeholders to present investment proposals for approval
1.1.2. An agreed agriculture sector investment plan that is formally signed by representatives from all sector stakeholders in all States.
1.2. Finance staff meet with budget and DEA staff to develop funding program for agriculture
1.2.1. Agriculture gets a level of funding that recognizes its status as a “priority productive sector” with 67% increase over 4 years.
1.2.2. Private sector funding allocations under Compact 2 recognize the legitimate needs of subsistence agriculture for funds.
1.3. Government reviews agriculture service delivery and agrees to allow contracted extension service delivery
1.3.1. Agriculture service delivery reviewed and re-structured to ensure not more than 50% of expenditures are spent on salaries, wages and associated staff costs by 2007
1.3.2. Agricultural extension is modeled on existing examples of community based delivery with Government role mainly funding and monitoring outcomes by 2007
1.3.3. NGOs and community groups are advised in advance of policy shift and asked to consider bids for service delivery contracts
1.4. Rural education services are reviewed to focus on quality teaching and learning results
1.4.1. Rural teachers re-training completed by 2010; Rural teacher absenteeism reduced to 10% by 2010; Rural education infrastructure re-constructed by 2010
1.4.2. Government education funds are allocated for vocational agriculture education – services contracted where appropriate.
stakeholders by Dec. 2006. 1(ii) Public investments in
agriculture sector are agreed by private sector and farmers in relevant States before expenditure is approved
1(iii) )Less waste of scarce public resources
1(iv) Budget share allocated to agriculture increases to 3% of total by 2009
1(v) 75% of agriculture extension services are undertaken by civil society and community groups on contract basis by 2007.
1(vi) Better educated rural population, equipped to improve traditional farming systems to meet demands of declining Compact support, attains at least 50% high school completion rates by 2015
1(vii) Rates of youth migration are contained at 2004 levels
1(viii) Quality agricultural data available on real time basis to all stakeholders including non-government
1.5. Awareness campaign run to highlight commercial
1.5.1. Commercial agriculture is seen as a viable and recognized career alternative for disadvantaged youth
Agriculture Strategic Planning M
atrix 31
Outcomes Activities Outputs agriculture as a profitable and worthy profession
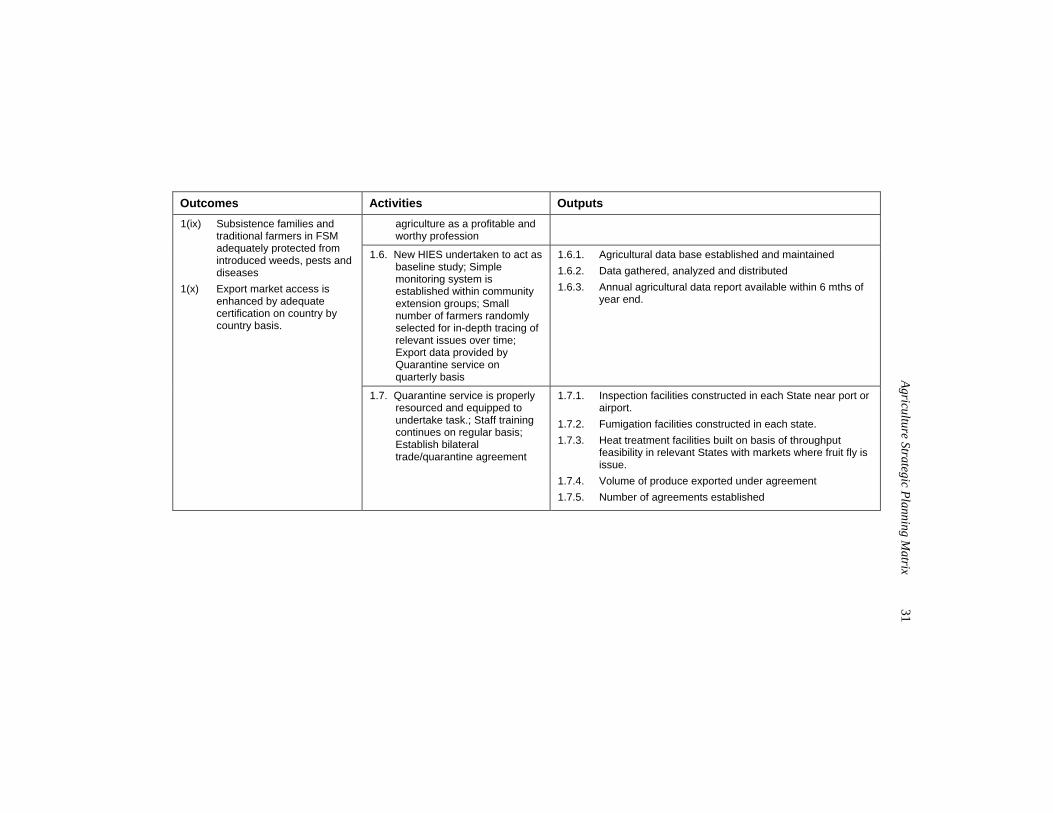
1.6. New HIES undertaken to act as baseline study; Simple monitoring system is established within community extension groups; Small number of farmers randomly selected for in-depth tracing of relevant issues over time; Export data provided by Quarantine service on quarterly basis
1.6.1. Agricultural data base established and maintained 1.6.2. Data gathered, analyzed and distributed 1.6.3. Annual agricultural data report available within 6 mths of
year end.
1(ix) Subsistence families and traditional farmers in FSM adequately protected from introduced weeds, pests and diseases
1(x) Export market access is enhanced by adequate certification on country by country basis.
1.7. Quarantine service is properly resourced and equipped to undertake task.; Staff training continues on regular basis; Establish bilateral trade/quarantine agreement
1.7.1. Inspection facilities constructed in each State near port or airport.
1.7.2. Fumigation facilities constructed in each state. 1.7.3. Heat treatment facilities built on basis of throughput
feasibility in relevant States with markets where fruit fly is issue.
1.7.4. Volume of produce exported under agreement 1.7.5. Number of agreements established
32 FSM
Strategic Developm
ent Plan
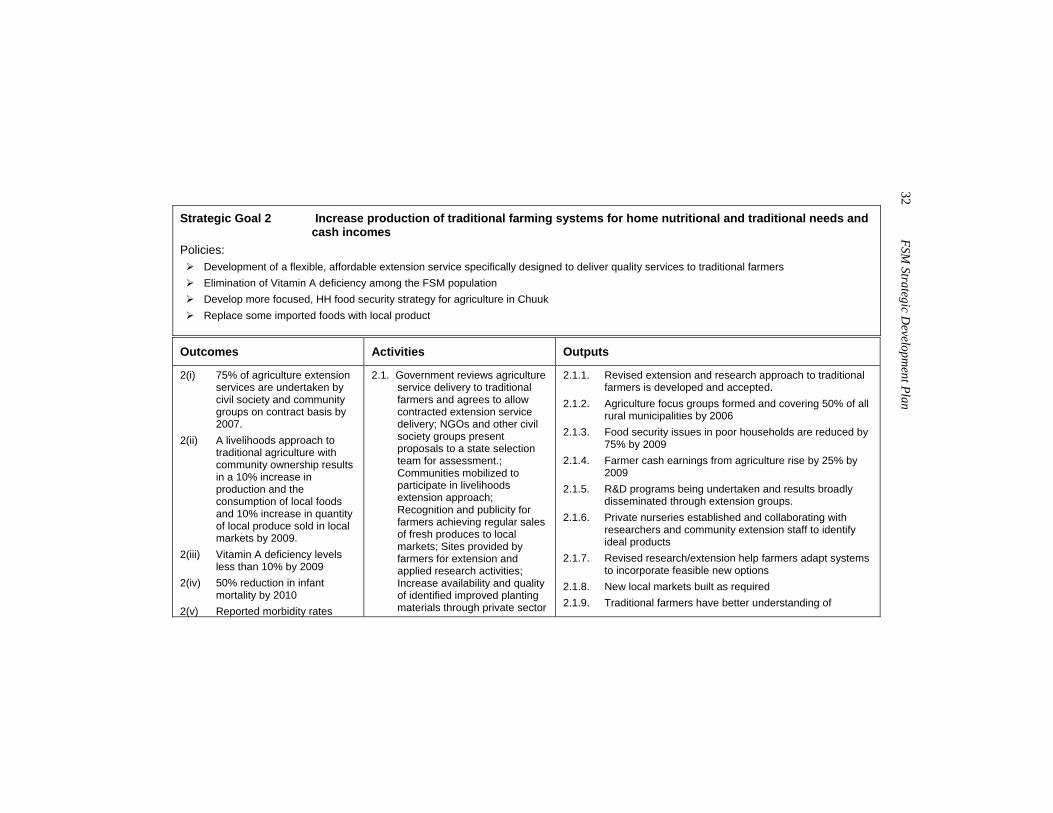
Strategic Goal 2 Increase production of traditional farming systems for home nutritional and traditional needs and
cash incomes Policies:
Development of a flexible, affordable extension service specifically designed to deliver quality services to traditional farmers Elimination of Vitamin A deficiency among the FSM population Develop more focused, HH food security strategy for agriculture in Chuuk Replace some imported foods with local product
Outcomes Activities Outputs
2(i) 75% of agriculture extension services are undertaken by civil society and community groups on contract basis by 2007.
2(ii) A livelihoods approach to traditional agriculture with community ownership results in a 10% increase in production and the consumption of local foods and 10% increase in quantity of local produce sold in local markets by 2009.
2(iii) Vitamin A deficiency levels less than 10% by 2009
2(iv) 50% reduction in infant mortality by 2010
2(v) Reported morbidity rates
2.1. Government reviews agriculture service delivery to traditional farmers and agrees to allow contracted extension service delivery; NGOs and other civil society groups present proposals to a state selection team for assessment.; Communities mobilized to participate in livelihoods extension approach; Recognition and publicity for farmers achieving regular sales of fresh produces to local markets; Sites provided by farmers for extension and applied research activities; Increase availability and quality of identified improved planting materials through private sector
2.1.1. Revised extension and research approach to traditional farmers is developed and accepted.
2.1.2. Agriculture focus groups formed and covering 50% of all rural municipalities by 2006
2.1.3. Food security issues in poor households are reduced by 75% by 2009
2.1.4. Farmer cash earnings from agriculture rise by 25% by 2009
2.1.5. R&D programs being undertaken and results broadly disseminated through extension groups.
2.1.6. Private nurseries established and collaborating with researchers and community extension staff to identify ideal products
2.1.7. Revised research/extension help farmers adapt systems to incorporate feasible new options
2.1.8. New local markets built as required 2.1.9. Traditional farmers have better understanding of
Agriculture Strategic Planning M
atrix 33
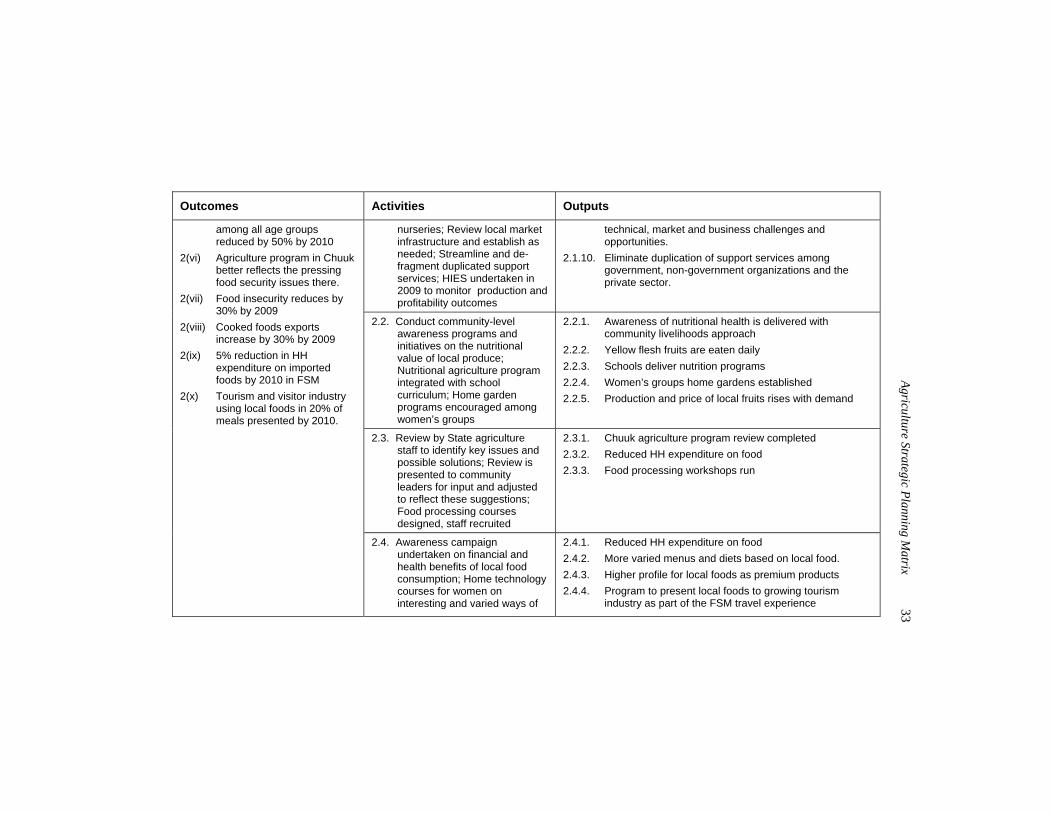
Outcomes Activities Outputs
nurseries; Review local market infrastructure and establish as needed; Streamline and de-fragment duplicated support services; HIES undertaken in 2009 to monitor production and profitability outcomes
technical, market and business challenges and opportunities.
2.1.10. Eliminate duplication of support services among government, non-government organizations and the private sector.
2.2. Conduct community-level awareness programs and initiatives on the nutritional value of local produce; Nutritional agriculture program integrated with school curriculum; Home garden programs encouraged among women’s groups
2.2.1. Awareness of nutritional health is delivered with community livelihoods approach
2.2.2. Yellow flesh fruits are eaten daily 2.2.3. Schools deliver nutrition programs 2.2.4. Women’s groups home gardens established 2.2.5. Production and price of local fruits rises with demand
2.3. Review by State agriculture staff to identify key issues and possible solutions; Review is presented to community leaders for input and adjusted to reflect these suggestions; Food processing courses designed, staff recruited
2.3.1. Chuuk agriculture program review completed 2.3.2. Reduced HH expenditure on food 2.3.3. Food processing workshops run
among all age groups reduced by 50% by 2010
2(vi) Agriculture program in Chuuk better reflects the pressing food security issues there.
2(vii) Food insecurity reduces by 30% by 2009
2(viii) Cooked foods exports increase by 30% by 2009
2(ix) 5% reduction in HH expenditure on imported foods by 2010 in FSM
2(x) Tourism and visitor industry using local foods in 20% of meals presented by 2010.
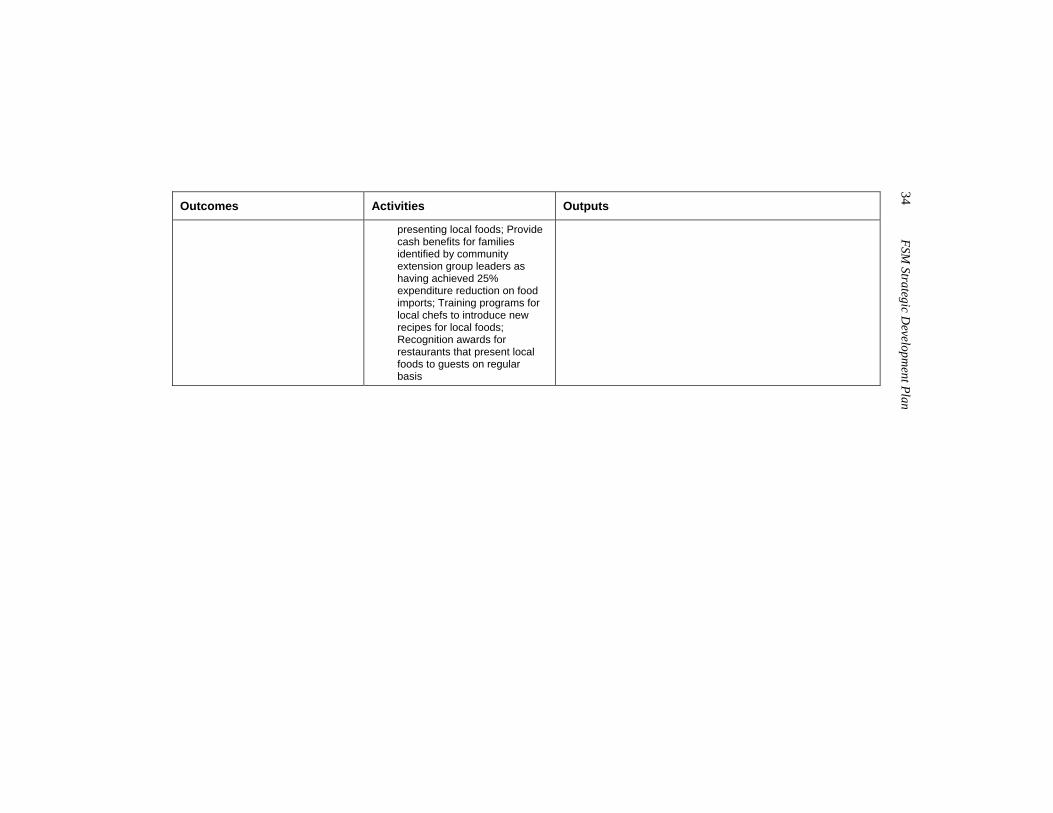
2.4. Awareness campaign undertaken on financial and health benefits of local food consumption; Home technology courses for women on interesting and varied ways of
2.4.1. Reduced HH expenditure on food 2.4.2. More varied menus and diets based on local food. 2.4.3. Higher profile for local foods as premium products 2.4.4. Program to present local foods to growing tourism
industry as part of the FSM travel experience
34 FSM
Strategic Developm
ent Plan
Outcomes Activities Outputs
presenting local foods; Provide cash benefits for families identified by community extension group leaders as having achieved 25% expenditure reduction on food imports; Training programs for local chefs to introduce new recipes for local foods; Recognition awards for restaurants that present local foods to guests on regular basis
Agriculture Strategic Planning M
atrix 35
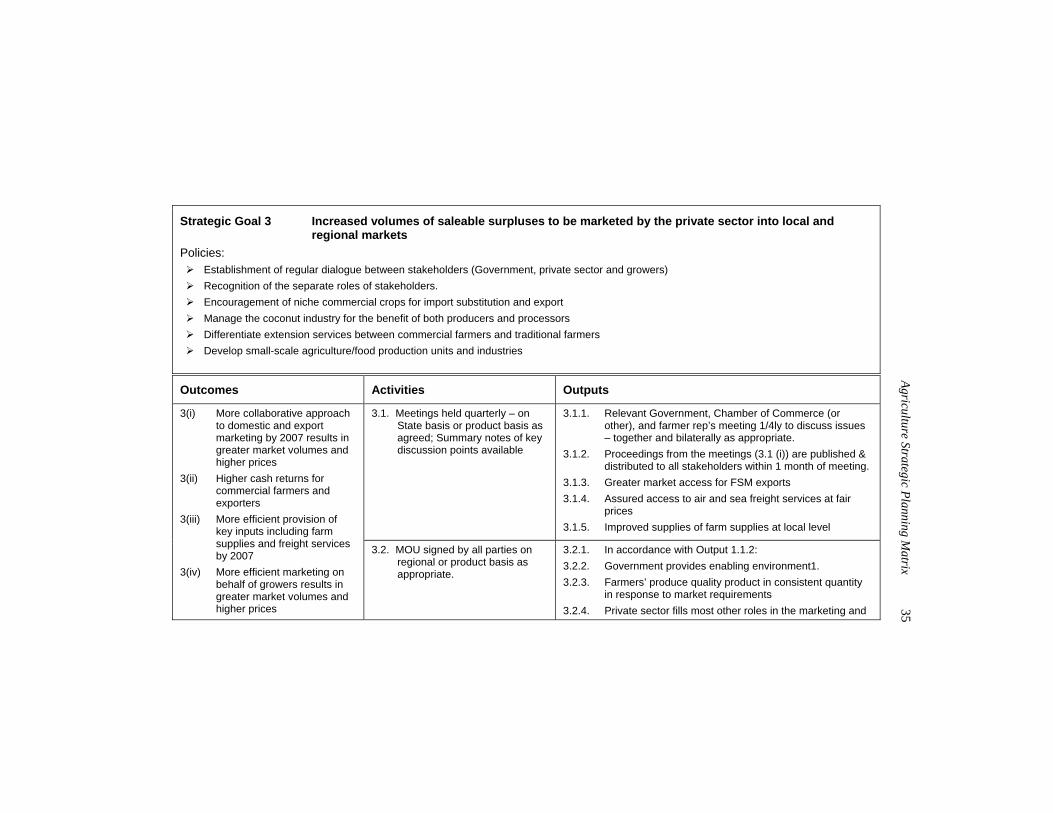
Strategic Goal 3 Increased volumes of saleable surpluses to be marketed by the private sector into local and regional markets
Policies: Establishment of regular dialogue between stakeholders (Government, private sector and growers) Recognition of the separate roles of stakeholders. Encouragement of niche commercial crops for import substitution and export Manage the coconut industry for the benefit of both producers and processors Differentiate extension services between commercial farmers and traditional farmers Develop small-scale agriculture/food production units and industries
Outcomes Activities Outputs
3.1. Meetings held quarterly – on State basis or product basis as agreed; Summary notes of key discussion points available
3.1.1. Relevant Government, Chamber of Commerce (or other), and farmer rep’s meeting 1/4ly to discuss issues – together and bilaterally as appropriate.
3.1.2. Proceedings from the meetings (3.1 (i)) are published & distributed to all stakeholders within 1 month of meeting.
3.1.3. Greater market access for FSM exports 3.1.4. Assured access to air and sea freight services at fair
prices 3.1.5. Improved supplies of farm supplies at local level
3(i) More collaborative approach to domestic and export marketing by 2007 results in greater market volumes and higher prices
3(ii) Higher cash returns for commercial farmers and exporters
3(iii) More efficient provision of key inputs including farm supplies and freight services by 2007
3(iv) More efficient marketing on behalf of growers results in greater market volumes and higher prices
3.2. MOU signed by all parties on regional or product basis as appropriate.
3.2.1. In accordance with Output 1.1.2: 3.2.2. Government provides enabling environment1. 3.2.3. Farmers’ produce quality product in consistent quantity
in response to market requirements 3.2.4. Private sector fills most other roles in the marketing and
36 FSM
Strategic Developm
ent Plan
Outcomes Activities Outputs
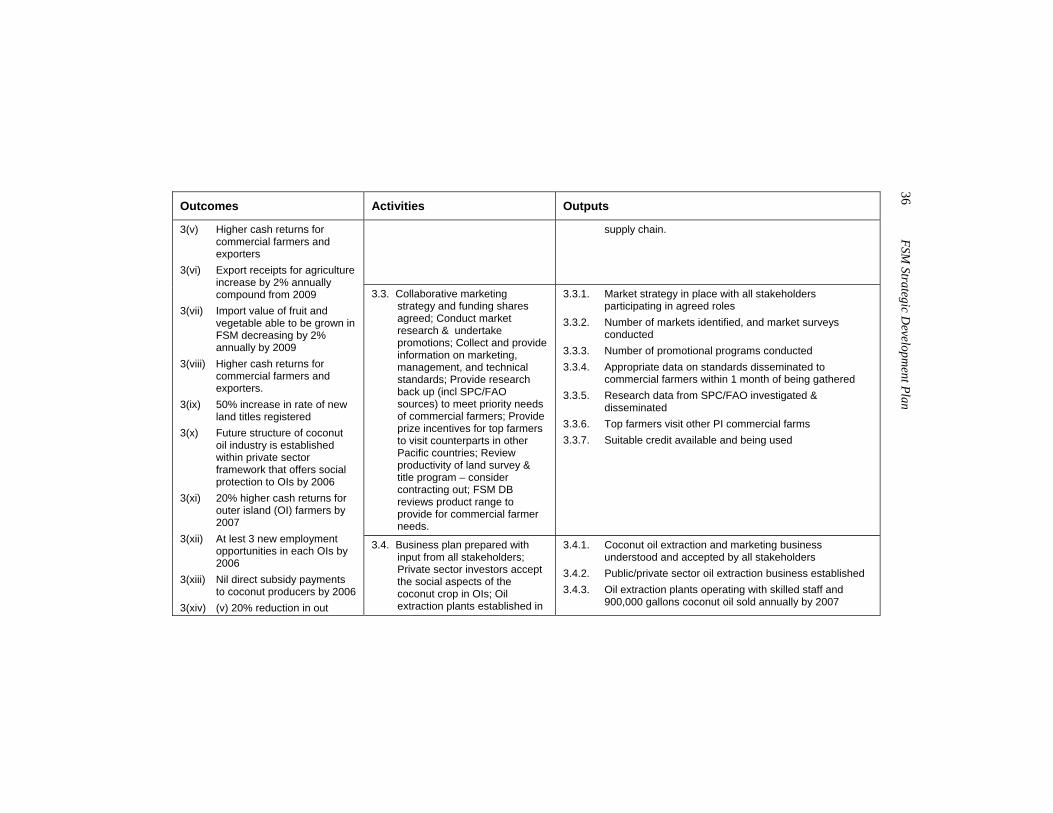
supply chain.
3.3. Collaborative marketing strategy and funding shares agreed; Conduct market research & undertake promotions; Collect and provide information on marketing, management, and technical standards; Provide research back up (incl SPC/FAO sources) to meet priority needs of commercial farmers; Provide prize incentives for top farmers to visit counterparts in other Pacific countries; Review productivity of land survey & title program – consider contracting out; FSM DB reviews product range to provide for commercial farmer needs.
3.3.1. Market strategy in place with all stakeholders participating in agreed roles
3.3.2. Number of markets identified, and market surveys conducted
3.3.3. Number of promotional programs conducted 3.3.4. Appropriate data on standards disseminated to
commercial farmers within 1 month of being gathered 3.3.5. Research data from SPC/FAO investigated &
disseminated 3.3.6. Top farmers visit other PI commercial farms 3.3.7. Suitable credit available and being used
3(v) Higher cash returns for commercial farmers and exporters
3(vi) Export receipts for agriculture increase by 2% annually compound from 2009
3(vii) Import value of fruit and vegetable able to be grown in FSM decreasing by 2% annually by 2009
3(viii) Higher cash returns for commercial farmers and exporters.
3(ix) 50% increase in rate of new land titles registered
3(x) Future structure of coconut oil industry is established within private sector framework that offers social protection to OIs by 2006
3(xi) 20% higher cash returns for outer island (OI) farmers by 2007
3(xii) At lest 3 new employment opportunities in each OIs by 2006
3(xiii) Nil direct subsidy payments to coconut producers by 2006
3(xiv) (v) 20% reduction in out
3.4. Business plan prepared with input from all stakeholders; Private sector investors accept the social aspects of the coconut crop in OIs; Oil extraction plants established in
3.4.1. Coconut oil extraction and marketing business understood and accepted by all stakeholders
3.4.2. Public/private sector oil extraction business established 3.4.3. Oil extraction plants operating with skilled staff and
900,000 gallons coconut oil sold annually by 2007
Agriculture Strategic Planning M
atrix 37
Outcomes Activities Outputs
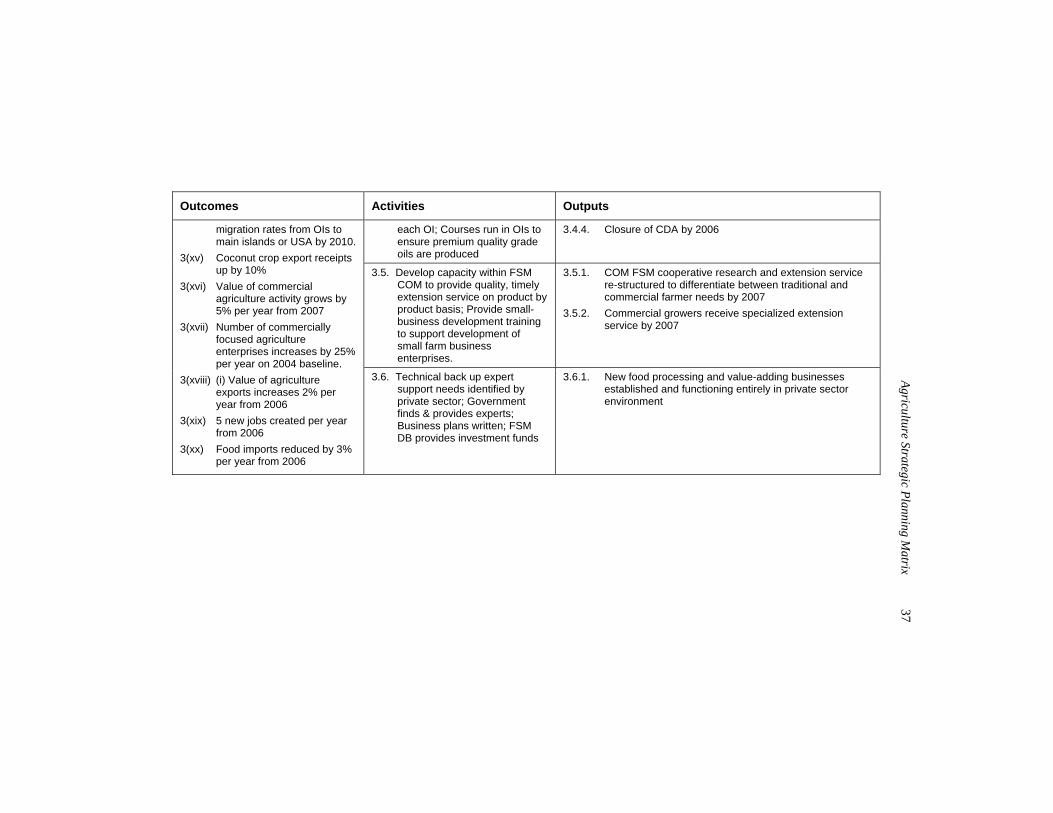
each OI; Courses run in OIs to ensure premium quality grade oils are produced
3.4.4. Closure of CDA by 2006
3.5. Develop capacity within FSM COM to provide quality, timely extension service on product by product basis; Provide small-business development training to support development of small farm business enterprises.
3.5.1. COM FSM cooperative research and extension service re-structured to differentiate between traditional and commercial farmer needs by 2007
3.5.2. Commercial growers receive specialized extension service by 2007
migration rates from OIs to main islands or USA by 2010.
3(xv) Coconut crop export receipts up by 10%
3(xvi) Value of commercial agriculture activity grows by 5% per year from 2007
3(xvii) Number of commercially focused agriculture enterprises increases by 25% per year on 2004 baseline.
3(xviii) (i) Value of agriculture exports increases 2% per year from 2006
3(xix) 5 new jobs created per year from 2006
3(xx) Food imports reduced by 3% per year from 2006
3.6. Technical back up expert support needs identified by private sector; Government finds & provides experts; Business plans written; FSM DB provides investment funds
3.6.1. New food processing and value-adding businesses established and functioning entirely in private sector environment
38 FSM
Strategic Developm
ent Plan
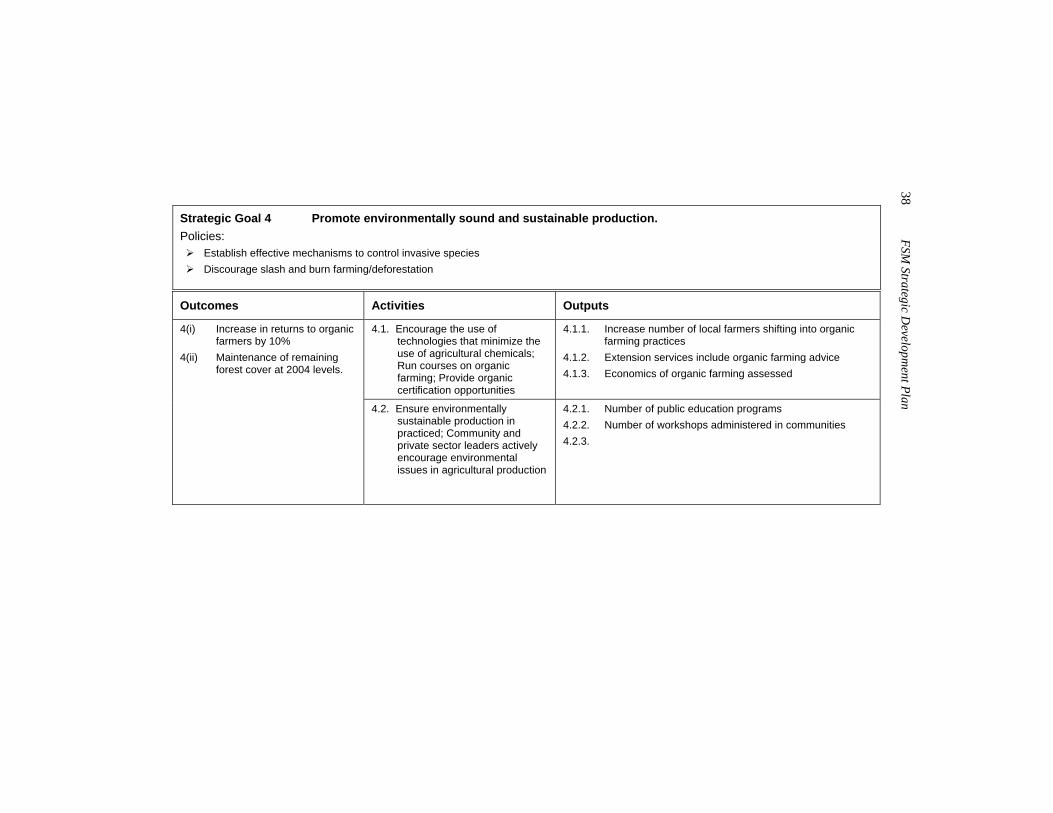
Strategic Goal 4 Promote environmentally sound and sustainable production. Policies:
Establish effective mechanisms to control invasive species Discourage slash and burn farming/deforestation
Outcomes Activities Outputs
4.1. Encourage the use of technologies that minimize the use of agricultural chemicals; Run courses on organic farming; Provide organic certification opportunities
4.1.1. Increase number of local farmers shifting into organic farming practices
4.1.2. Extension services include organic farming advice 4.1.3. Economics of organic farming assessed
4(i) Increase in returns to organic farmers by 10%
4(ii) Maintenance of remaining forest cover at 2004 levels.
4.2. Ensure environmentally sustainable production in practiced; Community and private sector leaders actively encourage environmental issues in agricultural production
4.2.1. Number of public education programs 4.2.2. Number of workshops administered in communities 4.2.3.
39
Appendix B-03: Fisheries Strategic Planning Matrix
Mission Statement:
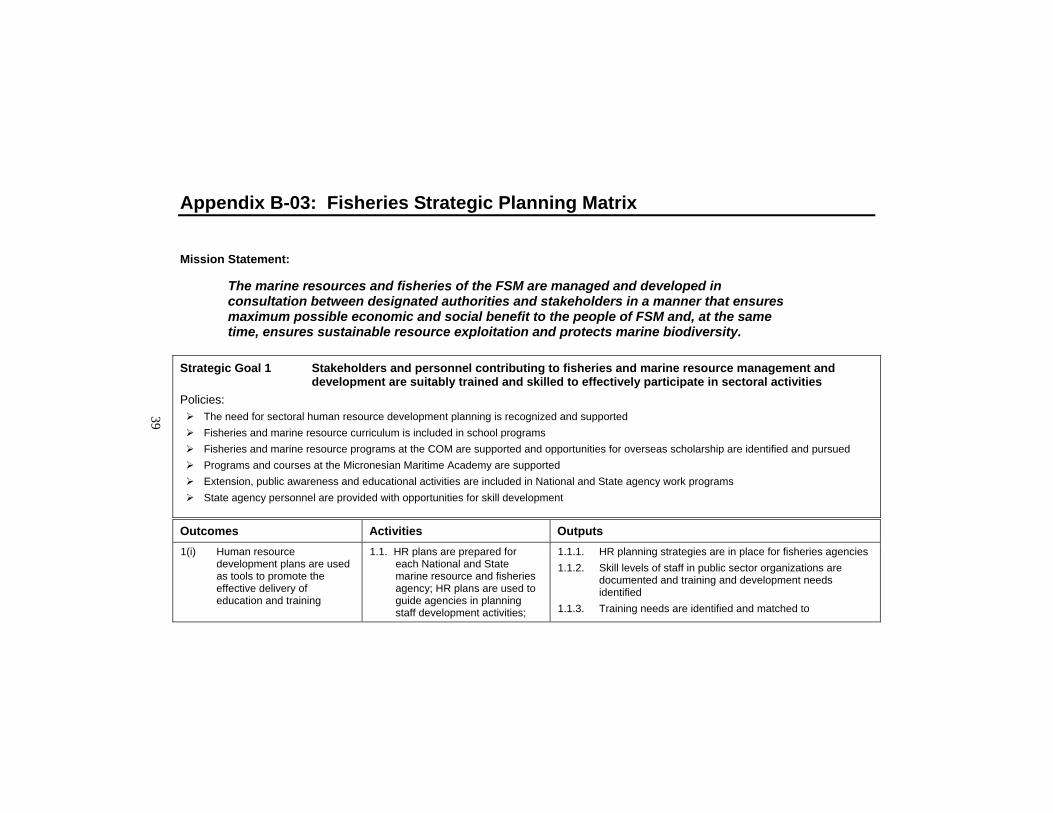
The marine resources and fisheries of the FSM are managed and developed in consultation between designated authorities and stakeholders in a manner that ensures maximum possible economic and social benefit to the people of FSM and, at the same time, ensures sustainable resource exploitation and protects marine biodiversity.
Strategic Goal 1 Stakeholders and personnel contributing to fisheries and marine resource management and development are suitably trained and skilled to effectively participate in sectoral activities
Policies: The need for sectoral human resource development planning is recognized and supported Fisheries and marine resource curriculum is included in school programs Fisheries and marine resource programs at the COM are supported and opportunities for overseas scholarship are identified and pursued Programs and courses at the Micronesian Maritime Academy are supported Extension, public awareness and educational activities are included in National and State agency work programs State agency personnel are provided with opportunities for skill development
Outcomes Activities Outputs 1(i) Human resource
development plans are used as tools to promote the effective delivery of education and training
1.1. HR plans are prepared for each National and State marine resource and fisheries agency; HR plans are used to guide agencies in planning staff development activities;
1.1.1. HR planning strategies are in place for fisheries agencies 1.1.2. Skill levels of staff in public sector organizations are
documented and training and development needs identified
1.1.3. Training needs are identified and matched to
40 FSM
Strategic Developm
ent Plan
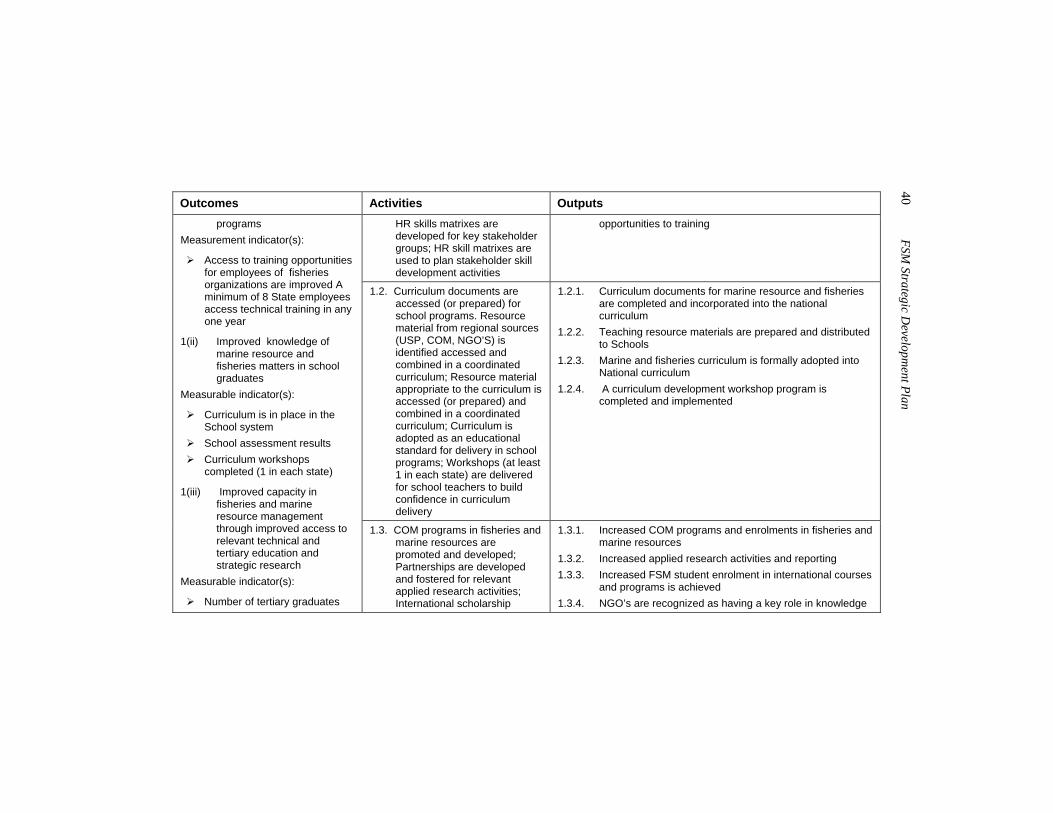
Outcomes Activities Outputs HR skills matrixes are developed for key stakeholder groups; HR skill matrixes are used to plan stakeholder skill development activities
opportunities to training
1.2. Curriculum documents are accessed (or prepared) for school programs. Resource material from regional sources (USP, COM, NGO’S) is identified accessed and combined in a coordinated curriculum; Resource material appropriate to the curriculum is accessed (or prepared) and combined in a coordinated curriculum; Curriculum is adopted as an educational standard for delivery in school programs; Workshops (at least 1 in each state) are delivered for school teachers to build confidence in curriculum delivery
1.2.1. Curriculum documents for marine resource and fisheries are completed and incorporated into the national curriculum
1.2.2. Teaching resource materials are prepared and distributed to Schools
1.2.3. Marine and fisheries curriculum is formally adopted into National curriculum
1.2.4. A curriculum development workshop program is completed and implemented
programs Measurement indicator(s):
Access to training opportunities for employees of fisheries organizations are improved A minimum of 8 State employees access technical training in any one year
1(ii) Improved knowledge of marine resource and fisheries matters in school graduates
Measurable indicator(s):
Curriculum is in place in the School system
School assessment results Curriculum workshops
completed (1 in each state)
1(iii) Improved capacity in fisheries and marine resource management through improved access to relevant technical and tertiary education and strategic research
Measurable indicator(s):
Number of tertiary graduates
1.3. COM programs in fisheries and marine resources are promoted and developed; Partnerships are developed and fostered for relevant applied research activities; International scholarship
1.3.1. Increased COM programs and enrolments in fisheries and marine resources
1.3.2. Increased applied research activities and reporting 1.3.3. Increased FSM student enrolment in international courses
and programs is achieved 1.3.4. NGO’s are recognized as having a key role in knowledge
Fisheries Strategic Planning M
atrix 41
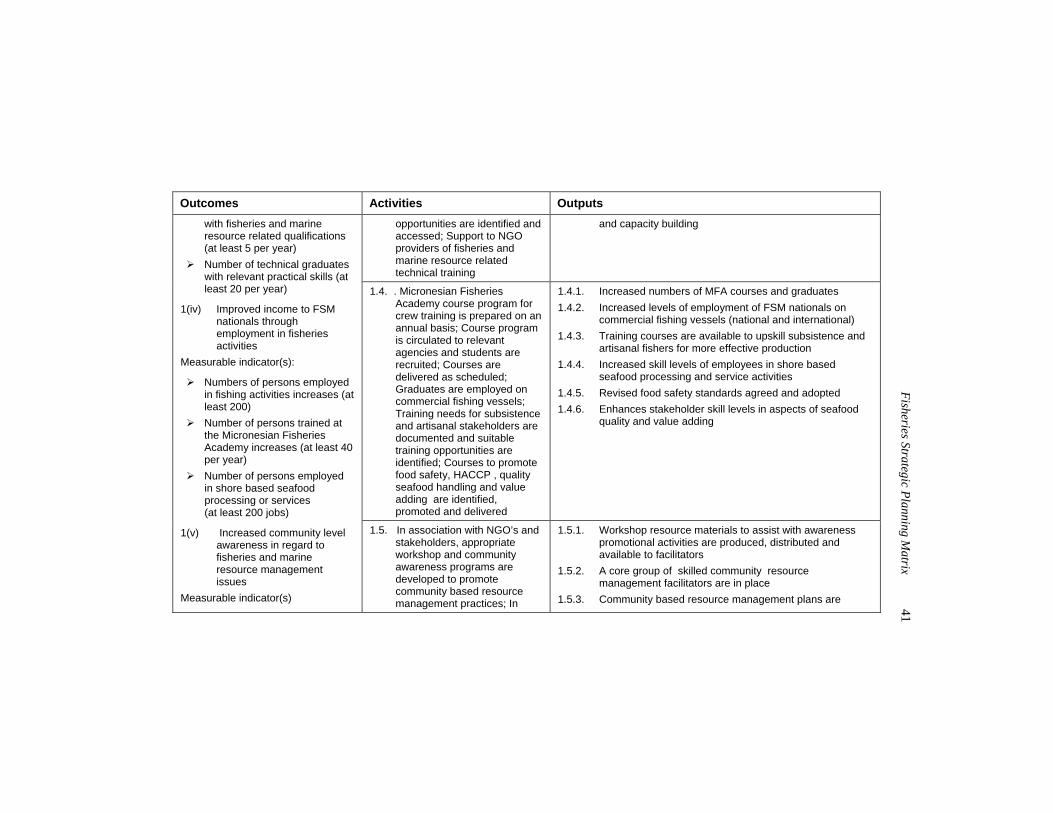
Outcomes Activities Outputs opportunities are identified and accessed; Support to NGO providers of fisheries and marine resource related technical training
and capacity building
1.4. . Micronesian Fisheries Academy course program for crew training is prepared on an annual basis; Course program is circulated to relevant agencies and students are recruited; Courses are delivered as scheduled; Graduates are employed on commercial fishing vessels; Training needs for subsistence and artisanal stakeholders are documented and suitable training opportunities are identified; Courses to promote food safety, HACCP , quality seafood handling and value adding are identified, promoted and delivered
1.4.1. Increased numbers of MFA courses and graduates 1.4.2. Increased levels of employment of FSM nationals on
commercial fishing vessels (national and international) 1.4.3. Training courses are available to upskill subsistence and
artisanal fishers for more effective production 1.4.4. Increased skill levels of employees in shore based
seafood processing and service activities 1.4.5. Revised food safety standards agreed and adopted 1.4.6. Enhances stakeholder skill levels in aspects of seafood
quality and value adding
with fisheries and marine resource related qualifications (at least 5 per year)
Number of technical graduates with relevant practical skills (at least 20 per year)
1(iv) Improved income to FSM nationals through employment in fisheries activities
Measurable indicator(s):
Numbers of persons employed in fishing activities increases (at least 200)
Number of persons trained at the Micronesian Fisheries Academy increases (at least 40 per year)
Number of persons employed in shore based seafood processing or services (at least 200 jobs)
1(v) Increased community level awareness in regard to fisheries and marine resource management issues
Measurable indicator(s)
1.5. In association with NGO’s and stakeholders, appropriate workshop and community awareness programs are developed to promote community based resource management practices; In
1.5.1. Workshop resource materials to assist with awareness promotional activities are produced, distributed and available to facilitators
1.5.2. A core group of skilled community resource management facilitators are in place
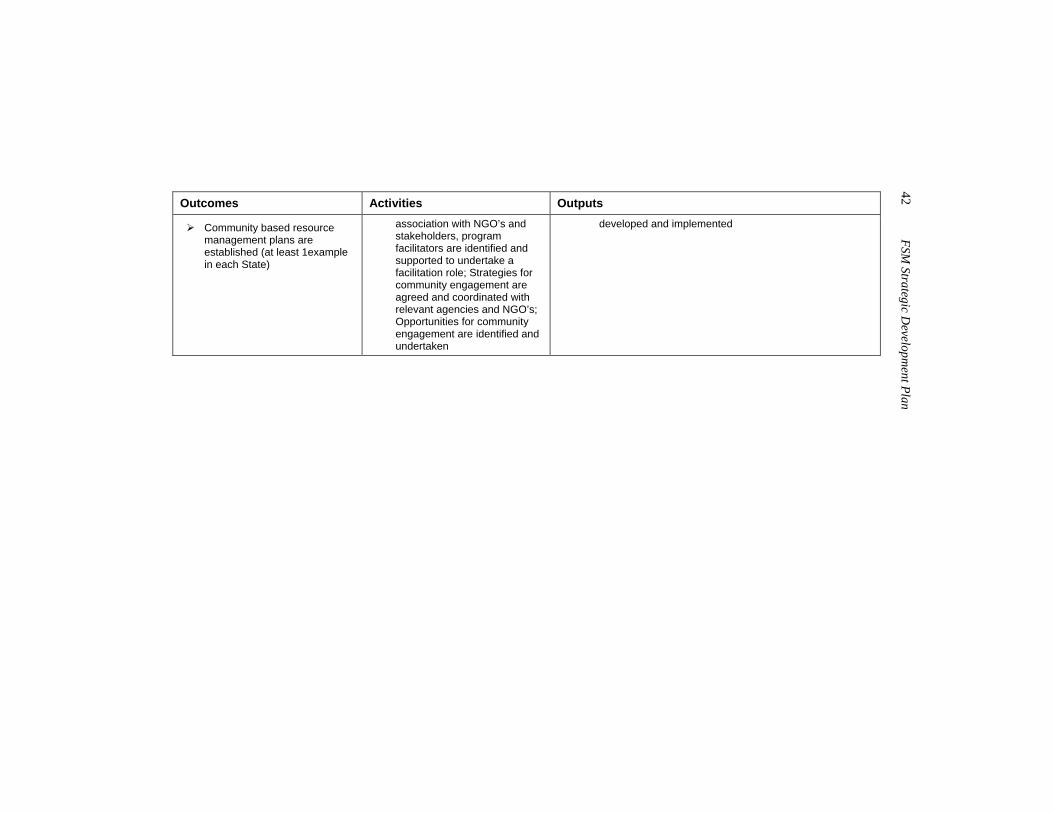
1.5.3. Community based resource management plans are
42 FSM
Strategic Developm
ent Plan
Outcomes Activities Outputs
Community based resource management plans are established (at least 1example in each State)
association with NGO’s and stakeholders, program facilitators are identified and supported to undertake a facilitation role; Strategies for community engagement are agreed and coordinated with relevant agencies and NGO’s; Opportunities for community engagement are identified and undertaken
developed and implemented
Fisheries Strategic Planning M
atrix 43
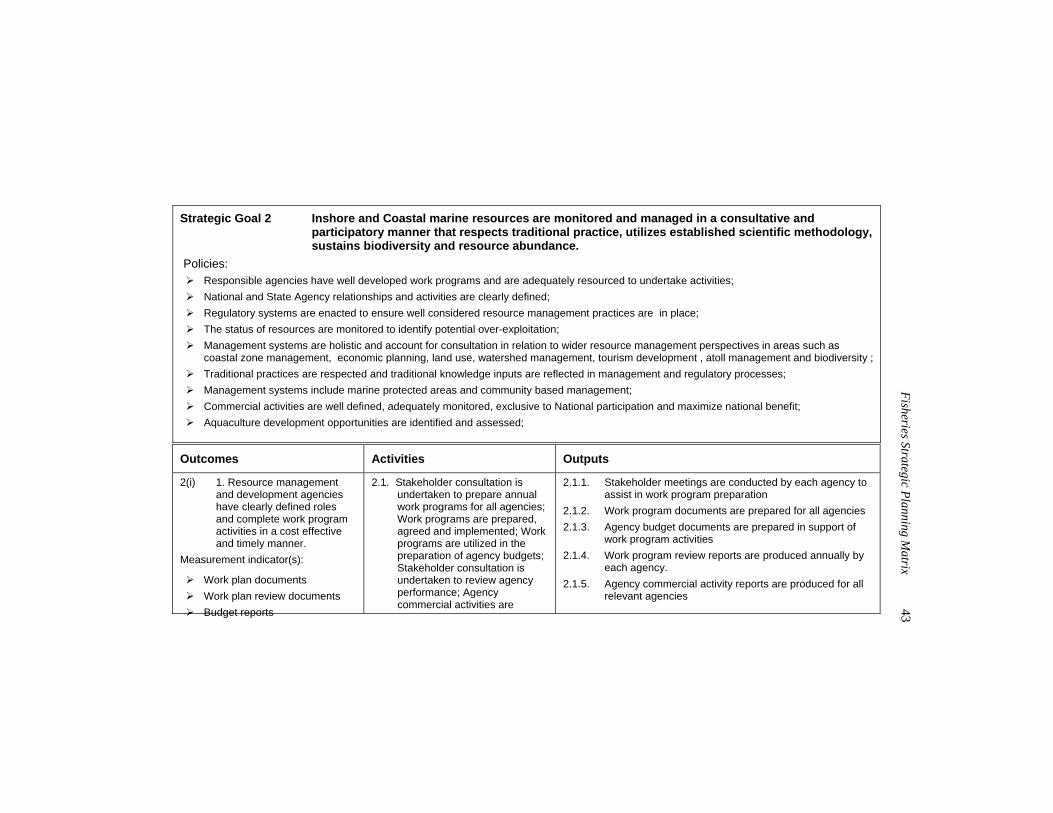
Strategic Goal 2 Inshore and Coastal marine resources are monitored and managed in a consultative and
participatory manner that respects traditional practice, utilizes established scientific methodology, sustains biodiversity and resource abundance.
Policies: Responsible agencies have well developed work programs and are adequately resourced to undertake activities; National and State Agency relationships and activities are clearly defined; Regulatory systems are enacted to ensure well considered resource management practices are in place; The status of resources are monitored to identify potential over-exploitation; Management systems are holistic and account for consultation in relation to wider resource management perspectives in areas such as
coastal zone management, economic planning, land use, watershed management, tourism development , atoll management and biodiversity ; Traditional practices are respected and traditional knowledge inputs are reflected in management and regulatory processes; Management systems include marine protected areas and community based management; Commercial activities are well defined, adequately monitored, exclusive to National participation and maximize national benefit; Aquaculture development opportunities are identified and assessed;
Outcomes Activities Outputs
2(i) 1. Resource management and development agencies have clearly defined roles and complete work program activities in a cost effective and timely manner.
Measurement indicator(s):
Work plan documents Work plan review documents Budget reports
2.1. Stakeholder consultation is undertaken to prepare annual work programs for all agencies; Work programs are prepared, agreed and implemented; Work programs are utilized in the preparation of agency budgets; Stakeholder consultation is undertaken to review agency performance; Agency commercial activities are
2.1.1. Stakeholder meetings are conducted by each agency to assist in work program preparation
2.1.2. Work program documents are prepared for all agencies 2.1.3. Agency budget documents are prepared in support of
work program activities 2.1.4. Work program review reports are produced annually by
each agency. 2.1.5. Agency commercial activity reports are produced for all
relevant agencies
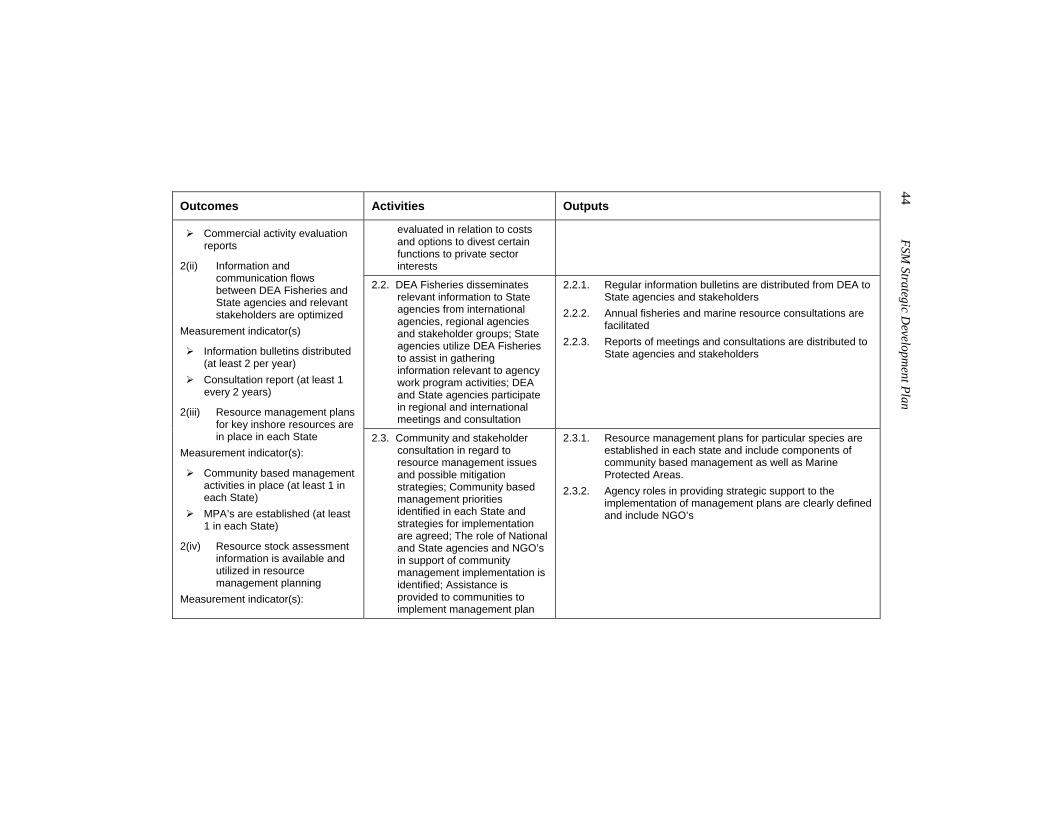
44 FSM
Strategic Developm
ent Plan
Outcomes Activities Outputs
evaluated in relation to costs and options to divest certain functions to private sector interests
2.2. DEA Fisheries disseminates relevant information to State agencies from international agencies, regional agencies and stakeholder groups; State agencies utilize DEA Fisheries to assist in gathering information relevant to agency work program activities; DEA and State agencies participate in regional and international meetings and consultation
2.2.1. Regular information bulletins are distributed from DEA to State agencies and stakeholders
2.2.2. Annual fisheries and marine resource consultations are facilitated
2.2.3. Reports of meetings and consultations are distributed to State agencies and stakeholders
Commercial activity evaluation reports
2(ii) Information and communication flows between DEA Fisheries and State agencies and relevant stakeholders are optimized
Measurement indicator(s)
Information bulletins distributed (at least 2 per year)
Consultation report (at least 1 every 2 years)
2(iii) Resource management plans for key inshore resources are in place in each State
Measurement indicator(s):
Community based management activities in place (at least 1 in each State)
MPA’s are established (at least 1 in each State)
2(iv) Resource stock assessment information is available and utilized in resource management planning
Measurement indicator(s):
2.3. Community and stakeholder consultation in regard to resource management issues and possible mitigation strategies; Community based management priorities identified in each State and strategies for implementation are agreed; The role of National and State agencies and NGO’s in support of community management implementation is identified; Assistance is provided to communities to implement management plan
2.3.1. Resource management plans for particular species are established in each state and include components of community based management as well as Marine Protected Areas.
2.3.2. Agency roles in providing strategic support to the implementation of management plans are clearly defined and include NGO’s
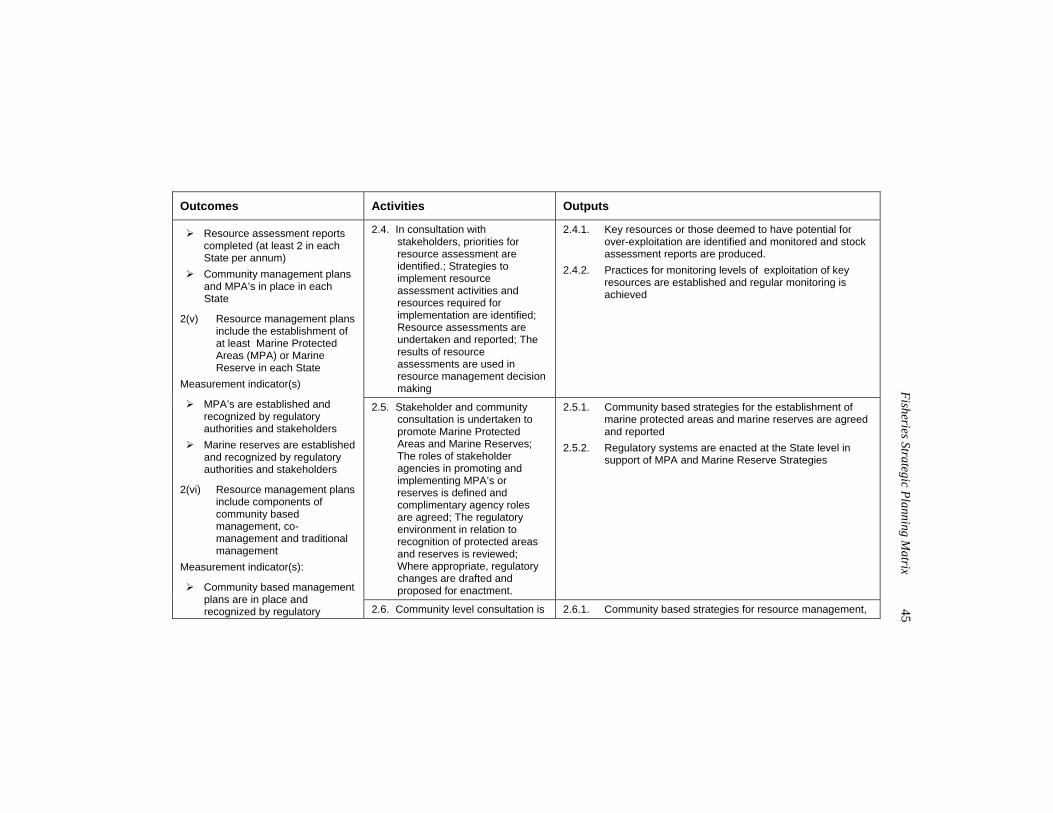
Fisheries Strategic Planning M
atrix 45
Outcomes Activities Outputs
2.4. In consultation with stakeholders, priorities for resource assessment are identified.; Strategies to implement resource assessment activities and resources required for implementation are identified; Resource assessments are undertaken and reported; The results of resource assessments are used in resource management decision making
2.4.1. Key resources or those deemed to have potential for over-exploitation are identified and monitored and stock assessment reports are produced.
2.4.2. Practices for monitoring levels of exploitation of key resources are established and regular monitoring is achieved
2.5. Stakeholder and community consultation is undertaken to promote Marine Protected Areas and Marine Reserves; The roles of stakeholder agencies in promoting and implementing MPA’s or reserves is defined and complimentary agency roles are agreed; The regulatory environment in relation to recognition of protected areas and reserves is reviewed; Where appropriate, regulatory changes are drafted and proposed for enactment.
2.5.1. Community based strategies for the establishment of marine protected areas and marine reserves are agreed and reported
2.5.2. Regulatory systems are enacted at the State level in support of MPA and Marine Reserve Strategies
Resource assessment reports completed (at least 2 in each State per annum)
Community management plans and MPA’s in place in each State
2(v) Resource management plans include the establishment of at least Marine Protected Areas (MPA) or Marine Reserve in each State
Measurement indicator(s)
MPA’s are established and recognized by regulatory authorities and stakeholders
Marine reserves are established and recognized by regulatory authorities and stakeholders
2(vi) Resource management plans include components of community based management, co-management and traditional management
Measurement indicator(s):
Community based management plans are in place and recognized by regulatory 2.6. Community level consultation is 2.6.1. Community based strategies for resource management,
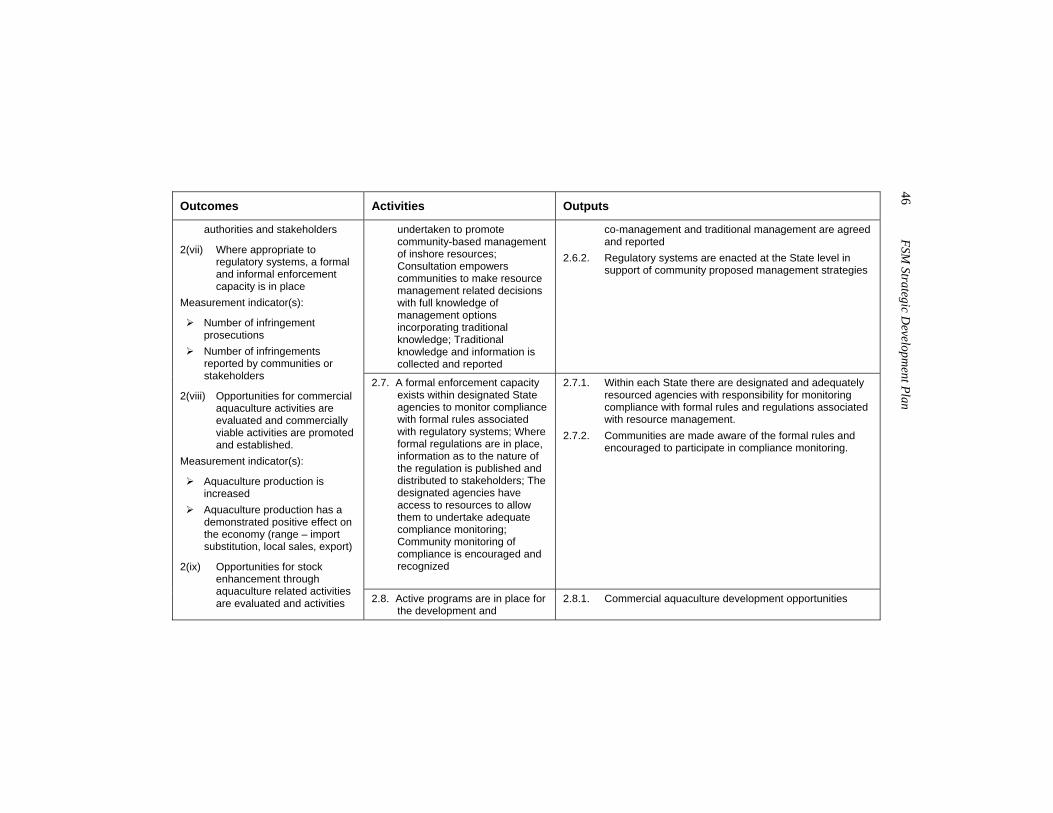
46 FSM
Strategic Developm
ent Plan
Outcomes Activities Outputs
undertaken to promote community-based management of inshore resources; Consultation empowers communities to make resource management related decisions with full knowledge of management options incorporating traditional knowledge; Traditional knowledge and information is collected and reported
co-management and traditional management are agreed and reported
2.6.2. Regulatory systems are enacted at the State level in support of community proposed management strategies
2.7. A formal enforcement capacity exists within designated State agencies to monitor compliance with formal rules associated with regulatory systems; Where formal regulations are in place, information as to the nature of the regulation is published and distributed to stakeholders; The designated agencies have access to resources to allow them to undertake adequate compliance monitoring; Community monitoring of compliance is encouraged and recognized
2.7.1. Within each State there are designated and adequately resourced agencies with responsibility for monitoring compliance with formal rules and regulations associated with resource management.
2.7.2. Communities are made aware of the formal rules and encouraged to participate in compliance monitoring.
authorities and stakeholders
2(vii) Where appropriate to regulatory systems, a formal and informal enforcement capacity is in place
Measurement indicator(s):
Number of infringement prosecutions
Number of infringements reported by communities or stakeholders
2(viii) Opportunities for commercial aquaculture activities are evaluated and commercially viable activities are promoted and established.
Measurement indicator(s):
Aquaculture production is increased
Aquaculture production has a demonstrated positive effect on the economy (range – import substitution, local sales, export)
2(ix) Opportunities for stock enhancement through aquaculture related activities are evaluated and activities 2.8. Active programs are in place for
the development and 2.8.1. Commercial aquaculture development opportunities
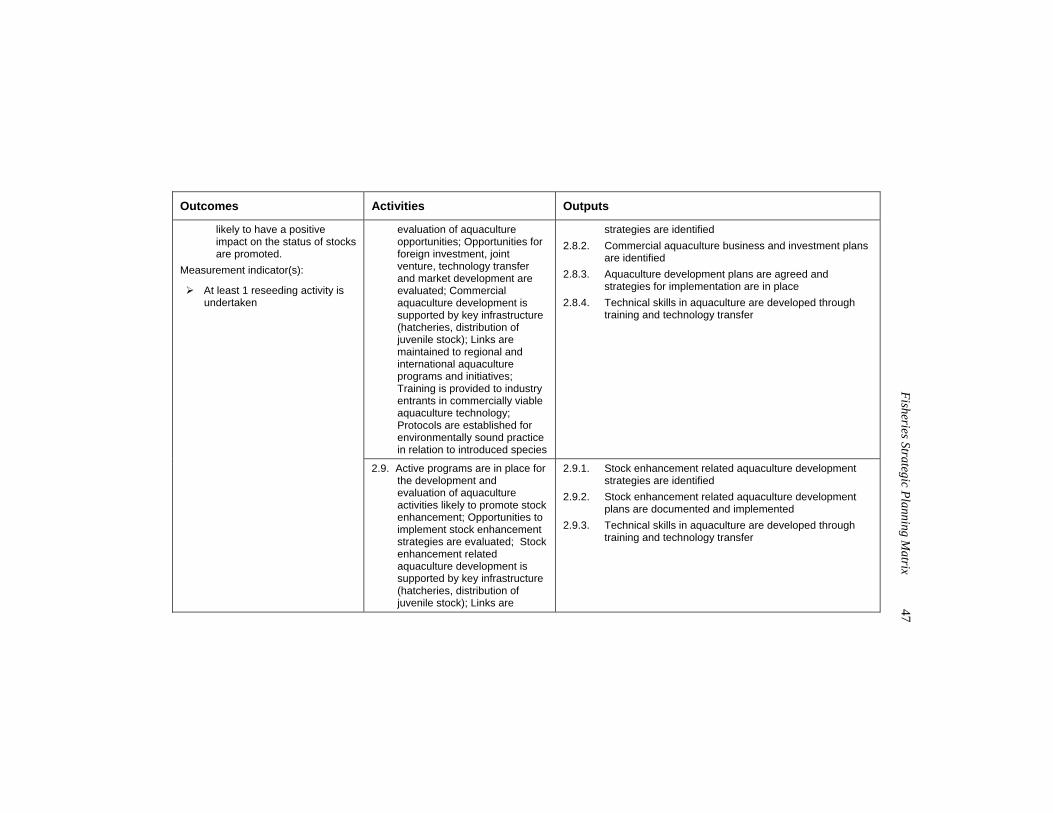
Fisheries Strategic Planning M
atrix 47
Outcomes Activities Outputs
evaluation of aquaculture opportunities; Opportunities for foreign investment, joint venture, technology transfer and market development are evaluated; Commercial aquaculture development is supported by key infrastructure (hatcheries, distribution of juvenile stock); Links are maintained to regional and international aquaculture programs and initiatives; Training is provided to industry entrants in commercially viable aquaculture technology; Protocols are established for environmentally sound practice in relation to introduced species
strategies are identified 2.8.2. Commercial aquaculture business and investment plans
are identified 2.8.3. Aquaculture development plans are agreed and
strategies for implementation are in place 2.8.4. Technical skills in aquaculture are developed through
training and technology transfer
likely to have a positive impact on the status of stocks are promoted.
Measurement indicator(s):
At least 1 reseeding activity is undertaken
2.9. Active programs are in place for the development and evaluation of aquaculture activities likely to promote stock enhancement; Opportunities to implement stock enhancement strategies are evaluated; Stock enhancement related aquaculture development is supported by key infrastructure (hatcheries, distribution of juvenile stock); Links are
2.9.1. Stock enhancement related aquaculture development strategies are identified
2.9.2. Stock enhancement related aquaculture development plans are documented and implemented
2.9.3. Technical skills in aquaculture are developed through training and technology transfer

48 FSM
Strategic Developm
ent Plan
Outcomes Activities Outputs
maintained to regional and international aquaculture programs and initiatives; Training is provided to stakeholders in aspects of stock enhancement related aquaculture; Protocols are established for environmentally sound practice in relation to introduced species
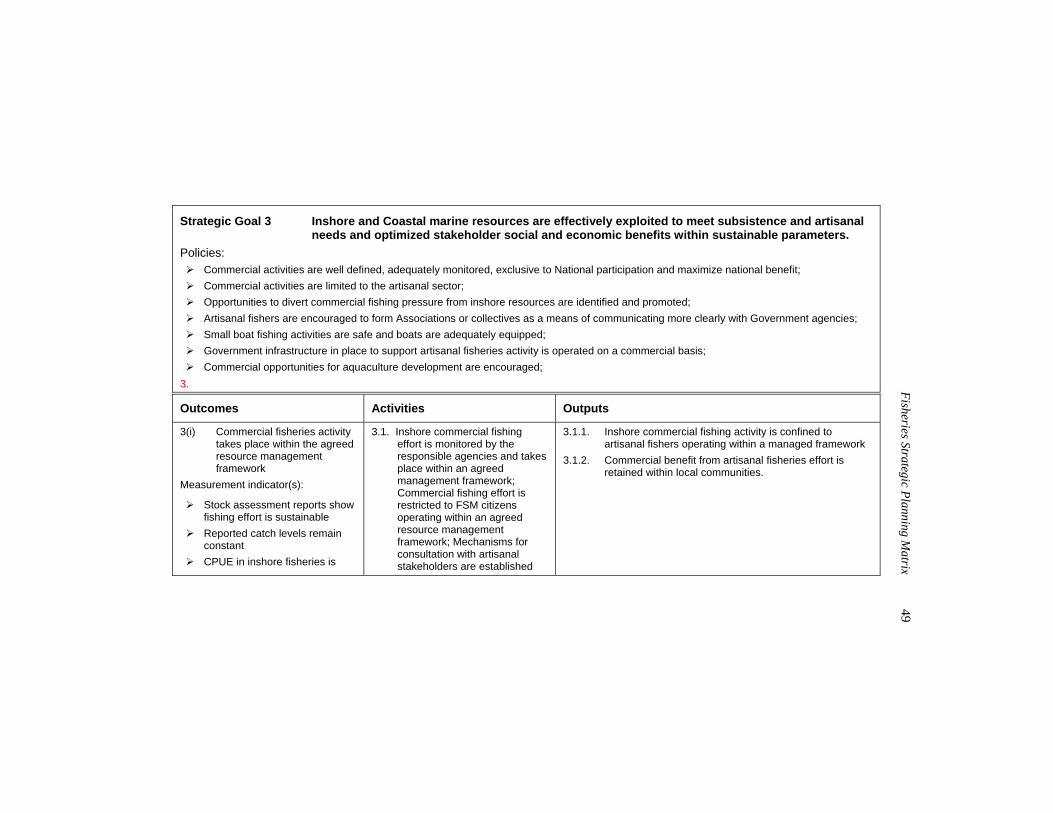
Fisheries Strategic Planning M
atrix 49
Strategic Goal 3 Inshore and Coastal marine resources are effectively exploited to meet subsistence and artisanal needs and optimized stakeholder social and economic benefits within sustainable parameters.
Policies: Commercial activities are well defined, adequately monitored, exclusive to National participation and maximize national benefit; Commercial activities are limited to the artisanal sector; Opportunities to divert commercial fishing pressure from inshore resources are identified and promoted; Artisanal fishers are encouraged to form Associations or collectives as a means of communicating more clearly with Government agencies; Small boat fishing activities are safe and boats are adequately equipped; Government infrastructure in place to support artisanal fisheries activity is operated on a commercial basis; Commercial opportunities for aquaculture development are encouraged;
3. Outcomes Activities Outputs
3(i) Commercial fisheries activity takes place within the agreed resource management framework
Measurement indicator(s):
Stock assessment reports show fishing effort is sustainable
Reported catch levels remain constant
CPUE in inshore fisheries is
3.1. Inshore commercial fishing effort is monitored by the responsible agencies and takes place within an agreed management framework; Commercial fishing effort is restricted to FSM citizens operating within an agreed resource management framework; Mechanisms for consultation with artisanal stakeholders are established
3.1.1. Inshore commercial fishing activity is confined to artisanal fishers operating within a managed framework
3.1.2. Commercial benefit from artisanal fisheries effort is retained within local communities.
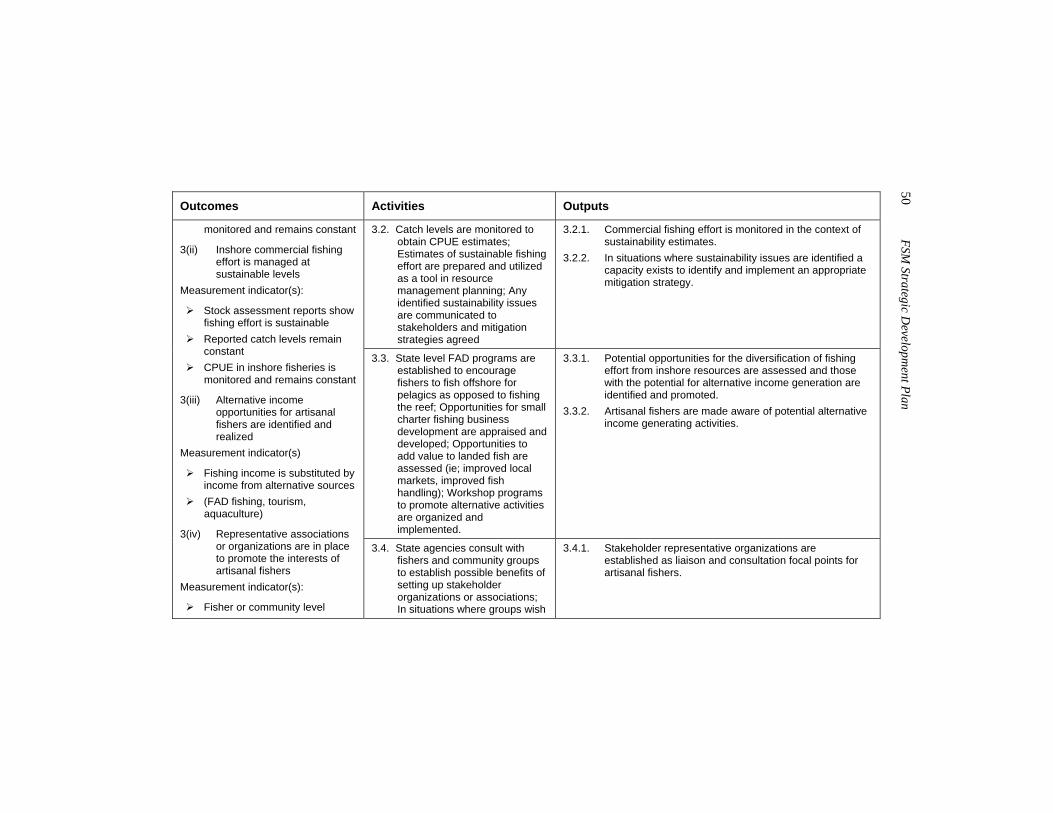
50 FSM
Strategic Developm
ent Plan
Outcomes Activities Outputs
3.2. Catch levels are monitored to obtain CPUE estimates; Estimates of sustainable fishing effort are prepared and utilized as a tool in resource management planning; Any identified sustainability issues are communicated to stakeholders and mitigation strategies agreed
3.2.1. Commercial fishing effort is monitored in the context of sustainability estimates.
3.2.2. In situations where sustainability issues are identified a capacity exists to identify and implement an appropriate mitigation strategy.
3.3. State level FAD programs are established to encourage fishers to fish offshore for pelagics as opposed to fishing the reef; Opportunities for small charter fishing business development are appraised and developed; Opportunities to add value to landed fish are assessed (ie; improved local markets, improved fish handling); Workshop programs to promote alternative activities are organized and implemented.
3.3.1. Potential opportunities for the diversification of fishing effort from inshore resources are assessed and those with the potential for alternative income generation are identified and promoted.
3.3.2. Artisanal fishers are made aware of potential alternative income generating activities.
monitored and remains constant
3(ii) Inshore commercial fishing effort is managed at sustainable levels
Measurement indicator(s):
Stock assessment reports show fishing effort is sustainable
Reported catch levels remain constant
CPUE in inshore fisheries is monitored and remains constant
3(iii) Alternative income opportunities for artisanal fishers are identified and realized
Measurement indicator(s)
Fishing income is substituted by income from alternative sources
(FAD fishing, tourism, aquaculture)
3(iv) Representative associations or organizations are in place to promote the interests of artisanal fishers
Measurement indicator(s):
Fisher or community level
3.4. State agencies consult with fishers and community groups to establish possible benefits of setting up stakeholder organizations or associations; In situations where groups wish
3.4.1. Stakeholder representative organizations are established as liaison and consultation focal points for artisanal fishers.
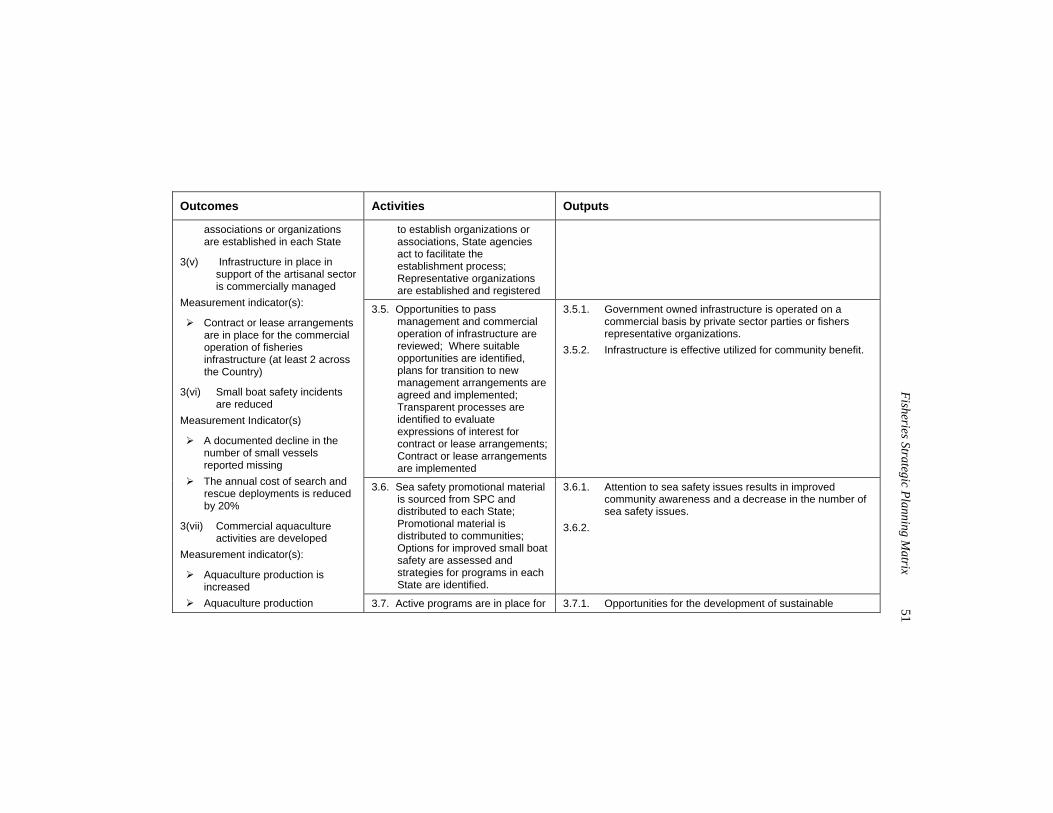
Fisheries Strategic Planning M
atrix 51
Outcomes Activities Outputs
to establish organizations or associations, State agencies act to facilitate the establishment process; Representative organizations are established and registered
3.5. Opportunities to pass management and commercial operation of infrastructure are reviewed; Where suitable opportunities are identified, plans for transition to new management arrangements are agreed and implemented; Transparent processes are identified to evaluate expressions of interest for contract or lease arrangements; Contract or lease arrangements are implemented
3.5.1. Government owned infrastructure is operated on a commercial basis by private sector parties or fishers representative organizations.
3.5.2. Infrastructure is effective utilized for community benefit.
3.6. Sea safety promotional material is sourced from SPC and distributed to each State; Promotional material is distributed to communities; Options for improved small boat safety are assessed and strategies for programs in each State are identified.
3.6.1. Attention to sea safety issues results in improved community awareness and a decrease in the number of sea safety issues.
3.6.2.
associations or organizations are established in each State
3(v) Infrastructure in place in support of the artisanal sector is commercially managed
Measurement indicator(s):
Contract or lease arrangements are in place for the commercial operation of fisheries infrastructure (at least 2 across the Country)
3(vi) Small boat safety incidents are reduced
Measurement Indicator(s)
A documented decline in the number of small vessels reported missing
The annual cost of search and rescue deployments is reduced by 20%
3(vii) Commercial aquaculture activities are developed
Measurement indicator(s):
Aquaculture production is increased
Aquaculture production 3.7. Active programs are in place for 3.7.1. Opportunities for the development of sustainable
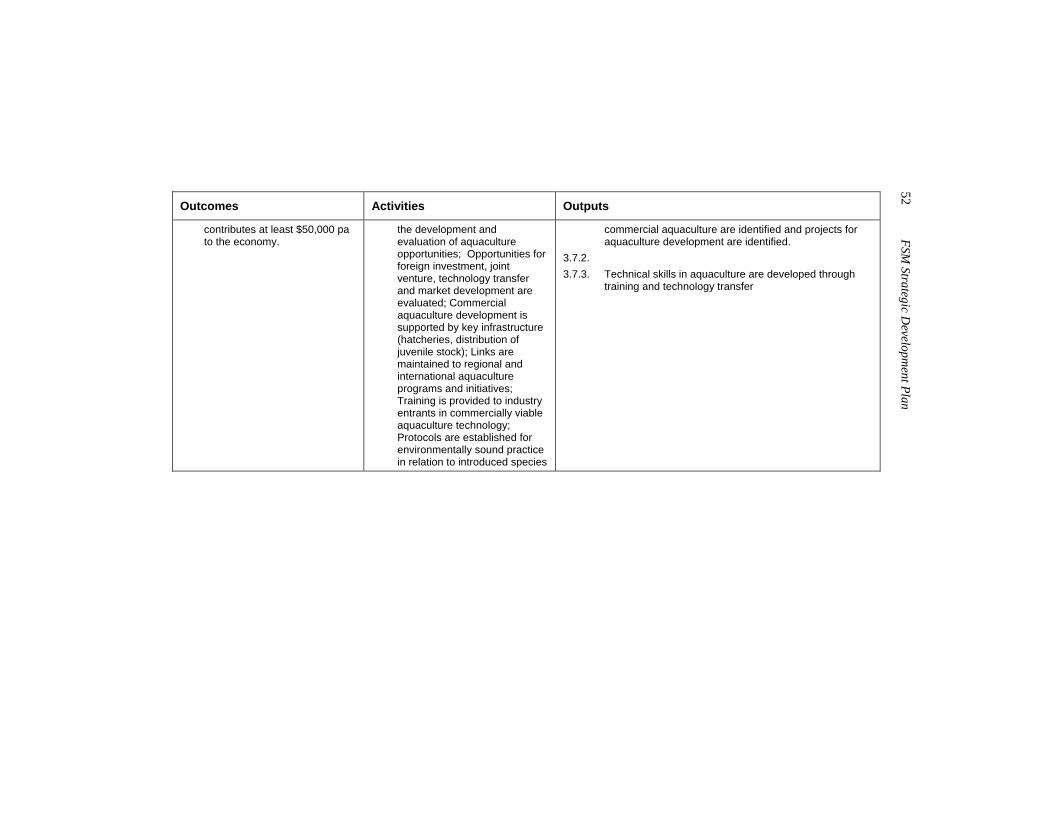
52 FSM
Strategic Developm
ent Plan
Outcomes Activities Outputs
contributes at least $50,000 pa to the economy.
the development and evaluation of aquaculture opportunities; Opportunities for foreign investment, joint venture, technology transfer and market development are evaluated; Commercial aquaculture development is supported by key infrastructure (hatcheries, distribution of juvenile stock); Links are maintained to regional and international aquaculture programs and initiatives; Training is provided to industry entrants in commercially viable aquaculture technology; Protocols are established for environmentally sound practice in relation to introduced species
commercial aquaculture are identified and projects for aquaculture development are identified.
3.7.2. 3.7.3. Technical skills in aquaculture are developed through
training and technology transfer
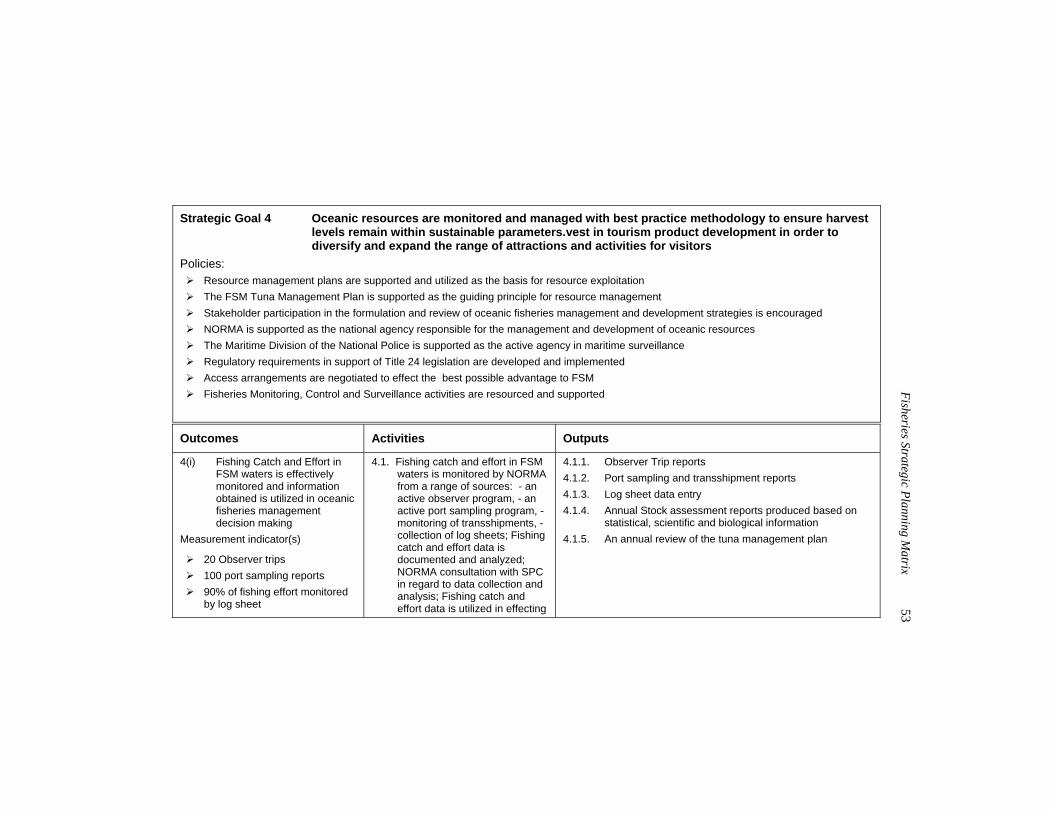
Fisheries Strategic Planning M
atrix 53
Strategic Goal 4 Oceanic resources are monitored and managed with best practice methodology to ensure harvest
levels remain within sustainable parameters.vest in tourism product development in order to diversify and expand the range of attractions and activities for visitors
Policies: Resource management plans are supported and utilized as the basis for resource exploitation The FSM Tuna Management Plan is supported as the guiding principle for resource management Stakeholder participation in the formulation and review of oceanic fisheries management and development strategies is encouraged NORMA is supported as the national agency responsible for the management and development of oceanic resources The Maritime Division of the National Police is supported as the active agency in maritime surveillance Regulatory requirements in support of Title 24 legislation are developed and implemented Access arrangements are negotiated to effect the best possible advantage to FSM Fisheries Monitoring, Control and Surveillance activities are resourced and supported
Outcomes Activities Outputs
4(i) Fishing Catch and Effort in FSM waters is effectively monitored and information obtained is utilized in oceanic fisheries management decision making
Measurement indicator(s)
20 Observer trips 100 port sampling reports 90% of fishing effort monitored
by log sheet
4.1. Fishing catch and effort in FSM waters is monitored by NORMA from a range of sources: - an active observer program, - an active port sampling program, - monitoring of transshipments, - collection of log sheets; Fishing catch and effort data is documented and analyzed; NORMA consultation with SPC in regard to data collection and analysis; Fishing catch and effort data is utilized in effecting
4.1.1. Observer Trip reports 4.1.2. Port sampling and transshipment reports 4.1.3. Log sheet data entry 4.1.4. Annual Stock assessment reports produced based on
statistical, scientific and biological information 4.1.5. An annual review of the tuna management plan
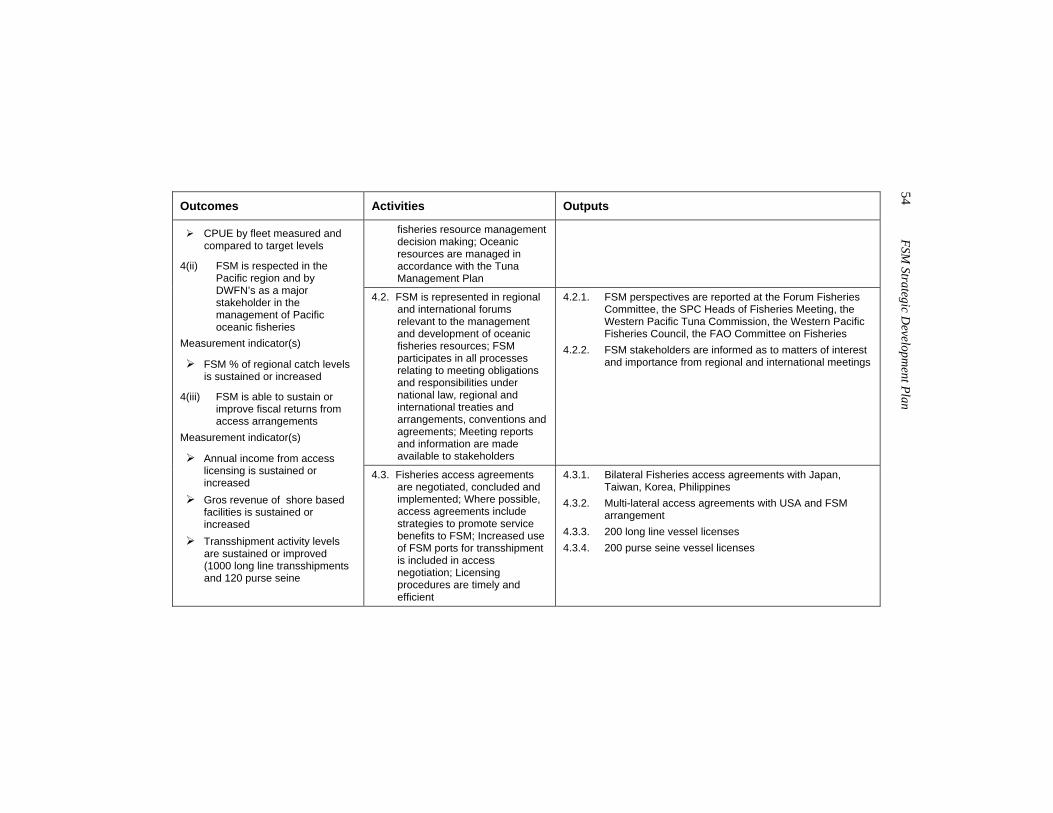
54 FSM
Strategic Developm
ent Plan
Outcomes Activities Outputs
fisheries resource management decision making; Oceanic resources are managed in accordance with the Tuna Management Plan
4.2. FSM is represented in regional and international forums relevant to the management and development of oceanic fisheries resources; FSM participates in all processes relating to meeting obligations and responsibilities under national law, regional and international treaties and arrangements, conventions and agreements; Meeting reports and information are made available to stakeholders
4.2.1. FSM perspectives are reported at the Forum Fisheries Committee, the SPC Heads of Fisheries Meeting, the Western Pacific Tuna Commission, the Western Pacific Fisheries Council, the FAO Committee on Fisheries
4.2.2. FSM stakeholders are informed as to matters of interest and importance from regional and international meetings
CPUE by fleet measured and compared to target levels
4(ii) FSM is respected in the Pacific region and by DWFN’s as a major stakeholder in the management of Pacific oceanic fisheries
Measurement indicator(s)
FSM % of regional catch levels is sustained or increased
4(iii) FSM is able to sustain or improve fiscal returns from access arrangements
Measurement indicator(s)
Annual income from access licensing is sustained or increased
Gros revenue of shore based facilities is sustained or increased
Transshipment activity levels are sustained or improved (1000 long line transshipments and 120 purse seine
4.3. Fisheries access agreements are negotiated, concluded and implemented; Where possible, access agreements include strategies to promote service benefits to FSM; Increased use of FSM ports for transshipment is included in access negotiation; Licensing procedures are timely and efficient
4.3.1. Bilateral Fisheries access agreements with Japan, Taiwan, Korea, Philippines
4.3.2. Multi-lateral access agreements with USA and FSM arrangement
4.3.3. 200 long line vessel licenses 4.3.4. 200 purse seine vessel licenses
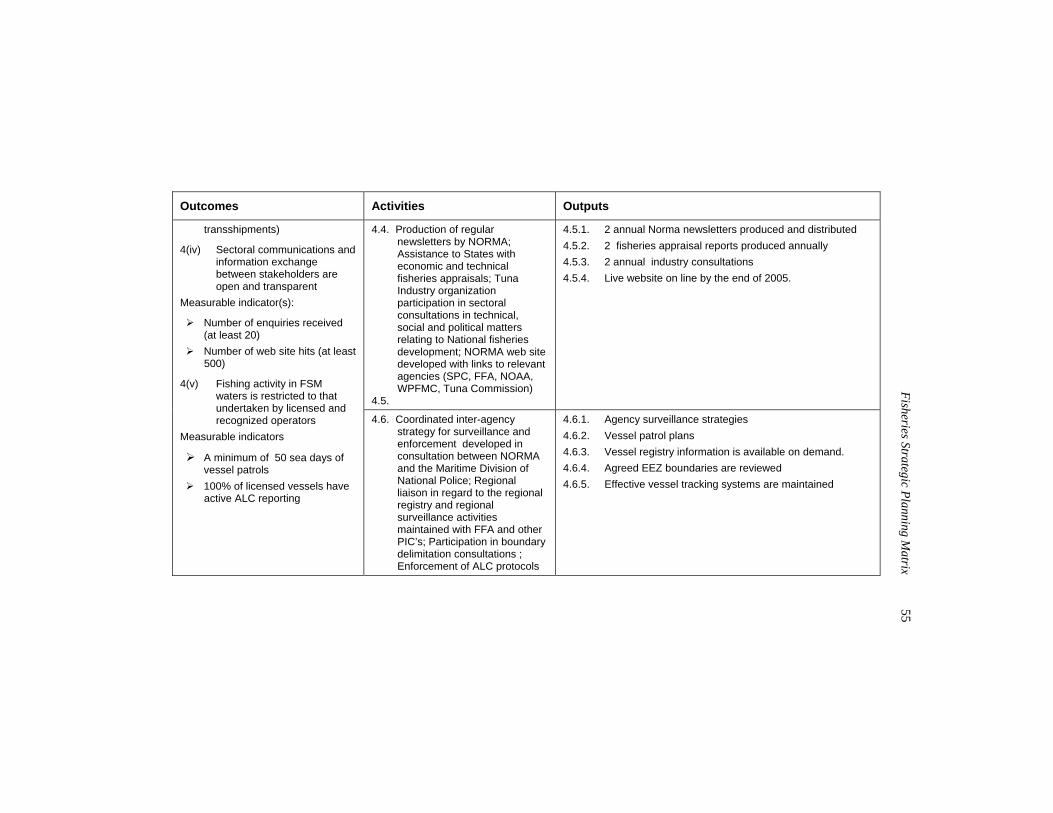
Fisheries Strategic Planning M
atrix 55
Outcomes Activities Outputs
4.4. Production of regular newsletters by NORMA; Assistance to States with economic and technical fisheries appraisals; Tuna Industry organization participation in sectoral consultations in technical, social and political matters relating to National fisheries development; NORMA web site developed with links to relevant agencies (SPC, FFA, NOAA, WPFMC, Tuna Commission)
4.5.
4.5.1. 2 annual Norma newsletters produced and distributed 4.5.2. 2 fisheries appraisal reports produced annually 4.5.3. 2 annual industry consultations 4.5.4. Live website on line by the end of 2005.
transshipments)
4(iv) Sectoral communications and information exchange between stakeholders are open and transparent
Measurable indicator(s):
Number of enquiries received (at least 20)
Number of web site hits (at least 500)
4(v) Fishing activity in FSM waters is restricted to that undertaken by licensed and recognized operators
Measurable indicators
A minimum of 50 sea days of vessel patrols
100% of licensed vessels have active ALC reporting
4.6. Coordinated inter-agency strategy for surveillance and enforcement developed in consultation between NORMA and the Maritime Division of National Police; Regional liaison in regard to the regional registry and regional surveillance activities maintained with FFA and other PIC’s; Participation in boundary delimitation consultations ; Enforcement of ALC protocols
4.6.1. Agency surveillance strategies 4.6.2. Vessel patrol plans 4.6.3. Vessel registry information is available on demand. 4.6.4. Agreed EEZ boundaries are reviewed 4.6.5. Effective vessel tracking systems are maintained
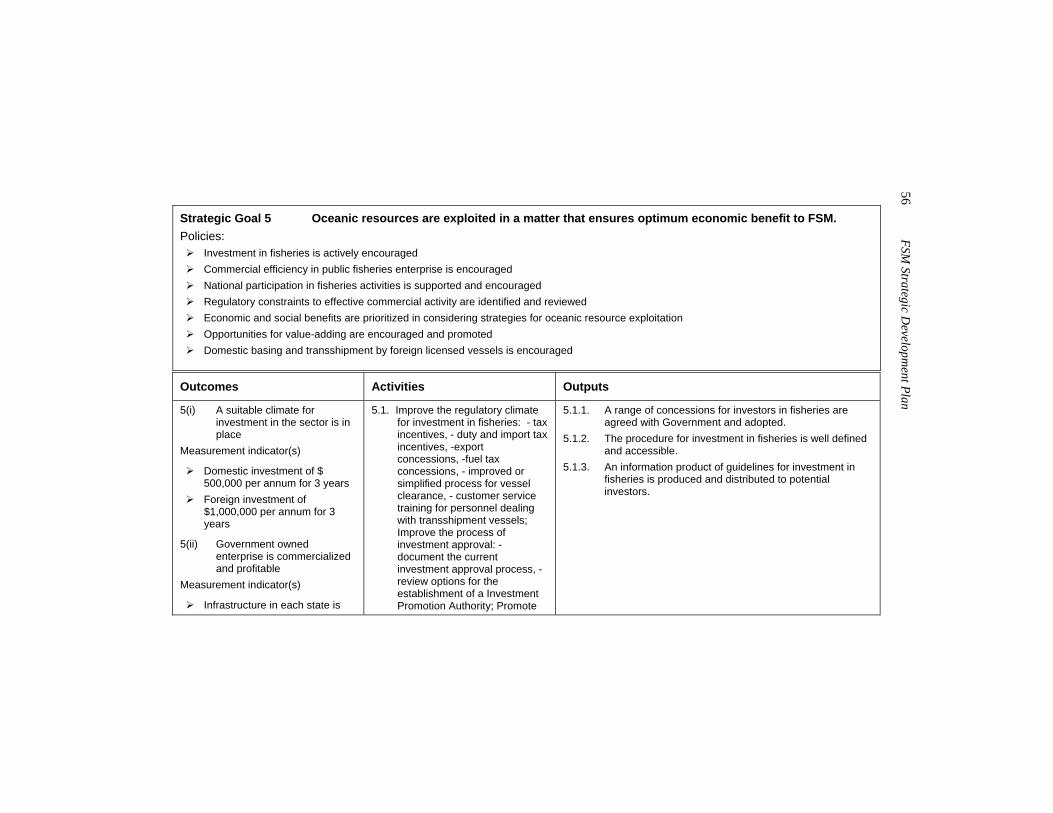
56 FSM
Strategic Developm
ent Plan
Strategic Goal 5 Oceanic resources are exploited in a matter that ensures optimum economic benefit to FSM. Policies:
Investment in fisheries is actively encouraged Commercial efficiency in public fisheries enterprise is encouraged National participation in fisheries activities is supported and encouraged Regulatory constraints to effective commercial activity are identified and reviewed Economic and social benefits are prioritized in considering strategies for oceanic resource exploitation Opportunities for value-adding are encouraged and promoted Domestic basing and transshipment by foreign licensed vessels is encouraged
Outcomes Activities Outputs
5(i) A suitable climate for investment in the sector is in place
Measurement indicator(s)
Domestic investment of $ 500,000 per annum for 3 years
Foreign investment of $1,000,000 per annum for 3 years
5(ii) Government owned enterprise is commercialized and profitable
Measurement indicator(s)
Infrastructure in each state is
5.1. Improve the regulatory climate for investment in fisheries: - tax incentives, - duty and import tax incentives, -export concessions, -fuel tax concessions, - improved or simplified process for vessel clearance, - customer service training for personnel dealing with transshipment vessels; Improve the process of investment approval: - document the current investment approval process, - review options for the establishment of a Investment Promotion Authority; Promote
5.1.1. A range of concessions for investors in fisheries are agreed with Government and adopted.
5.1.2. The procedure for investment in fisheries is well defined and accessible.
5.1.3. An information product of guidelines for investment in fisheries is produced and distributed to potential investors.
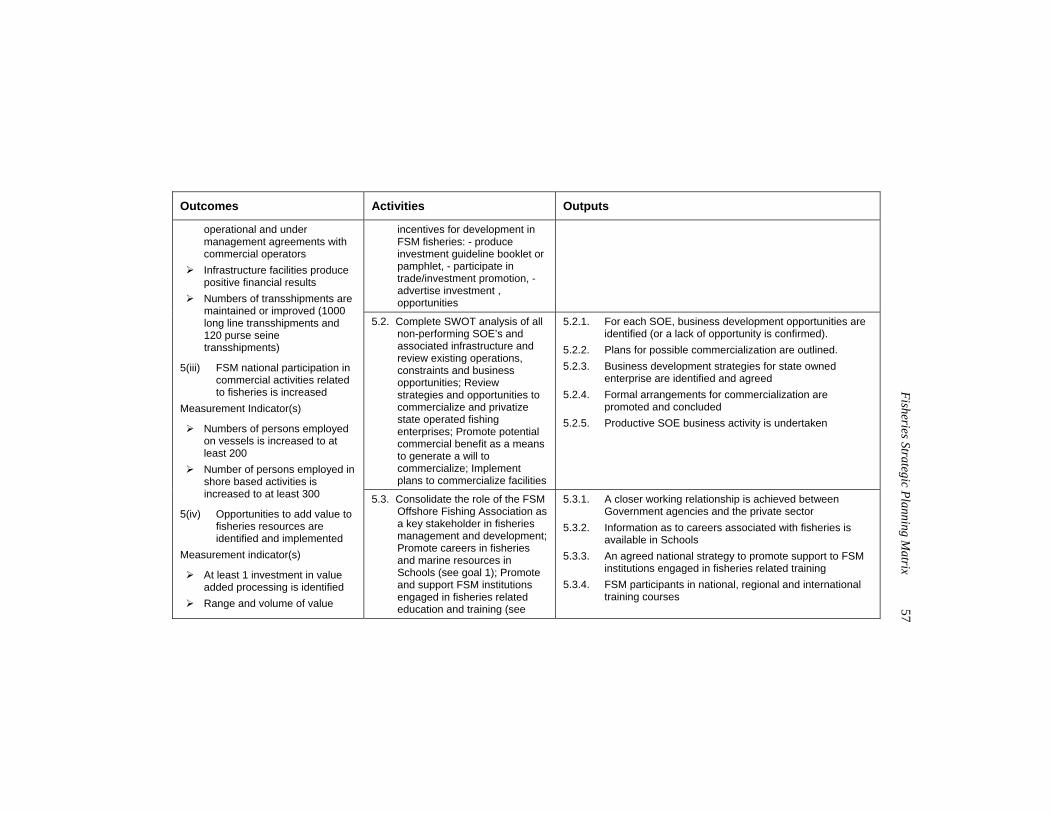
Fisheries Strategic Planning M
atrix 57
Outcomes Activities Outputs
incentives for development in FSM fisheries: - produce investment guideline booklet or pamphlet, - participate in trade/investment promotion, - advertise investment , opportunities
5.2. Complete SWOT analysis of all non-performing SOE’s and associated infrastructure and review existing operations, constraints and business opportunities; Review strategies and opportunities to commercialize and privatize state operated fishing enterprises; Promote potential commercial benefit as a means to generate a will to commercialize; Implement plans to commercialize facilities
5.2.1. For each SOE, business development opportunities are identified (or a lack of opportunity is confirmed).
5.2.2. Plans for possible commercialization are outlined. 5.2.3. Business development strategies for state owned
enterprise are identified and agreed 5.2.4. Formal arrangements for commercialization are
promoted and concluded 5.2.5. Productive SOE business activity is undertaken
operational and under management agreements with commercial operators
Infrastructure facilities produce positive financial results
Numbers of transshipments are maintained or improved (1000 long line transshipments and 120 purse seine transshipments)
5(iii) FSM national participation in commercial activities related to fisheries is increased
Measurement Indicator(s)
Numbers of persons employed on vessels is increased to at least 200
Number of persons employed in shore based activities is increased to at least 300
5(iv) Opportunities to add value to fisheries resources are identified and implemented
Measurement indicator(s)
At least 1 investment in value added processing is identified
Range and volume of value
5.3. Consolidate the role of the FSM Offshore Fishing Association as a key stakeholder in fisheries management and development; Promote careers in fisheries and marine resources in Schools (see goal 1); Promote and support FSM institutions engaged in fisheries related education and training (see
5.3.1. A closer working relationship is achieved between Government agencies and the private sector
5.3.2. Information as to careers associated with fisheries is available in Schools
5.3.3. An agreed national strategy to promote support to FSM institutions engaged in fisheries related training
5.3.4. FSM participants in national, regional and international training courses
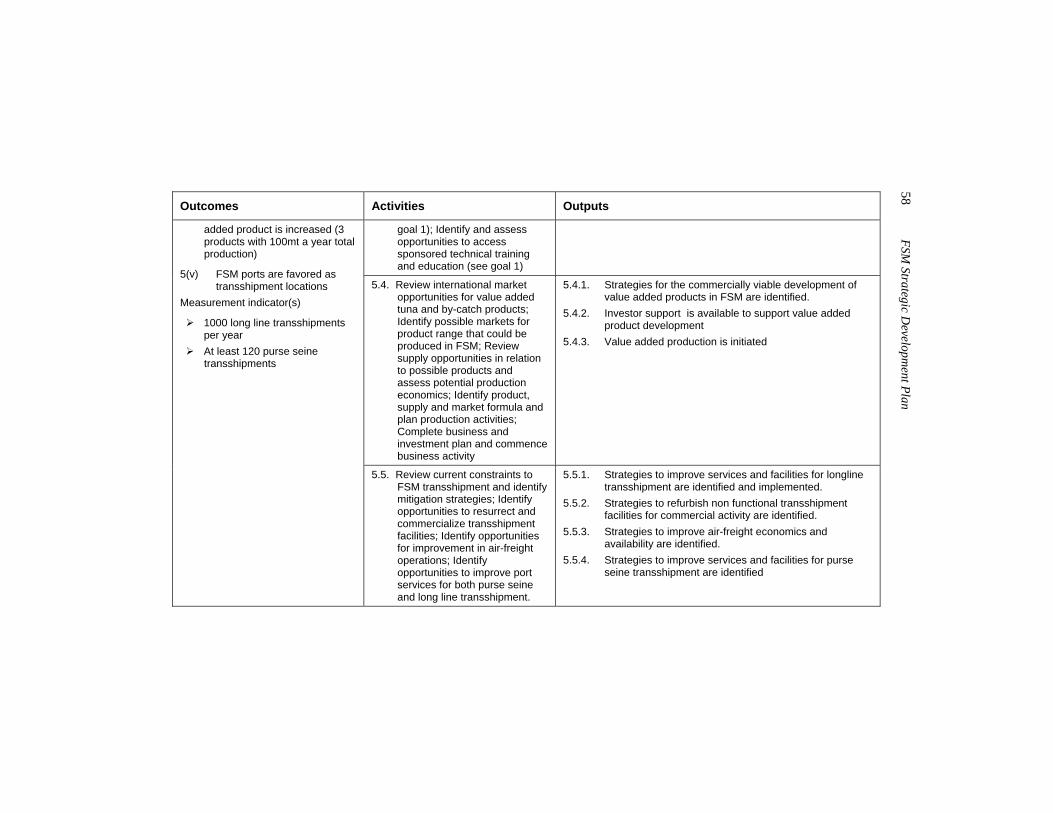
58 FSM
Strategic Developm
ent Plan
Outcomes Activities Outputs
goal 1); Identify and assess opportunities to access sponsored technical training and education (see goal 1)
5.4. Review international market opportunities for value added tuna and by-catch products; Identify possible markets for product range that could be produced in FSM; Review supply opportunities in relation to possible products and assess potential production economics; Identify product, supply and market formula and plan production activities; Complete business and investment plan and commence business activity
5.4.1. Strategies for the commercially viable development of value added products in FSM are identified.
5.4.2. Investor support is available to support value added product development
5.4.3. Value added production is initiated
added product is increased (3 products with 100mt a year total production)
5(v) FSM ports are favored as transshipment locations
Measurement indicator(s)
1000 long line transshipments per year
At least 120 purse seine transshipments
5.5. Review current constraints to FSM transshipment and identify mitigation strategies; Identify opportunities to resurrect and commercialize transshipment facilities; Identify opportunities for improvement in air-freight operations; Identify opportunities to improve port services for both purse seine and long line transshipment.
5.5.1. Strategies to improve services and facilities for longline transshipment are identified and implemented.
5.5.2. Strategies to refurbish non functional transshipment facilities for commercial activity are identified.
5.5.3. Strategies to improve air-freight economics and availability are identified.
5.5.4. Strategies to improve services and facilities for purse seine transshipment are identified
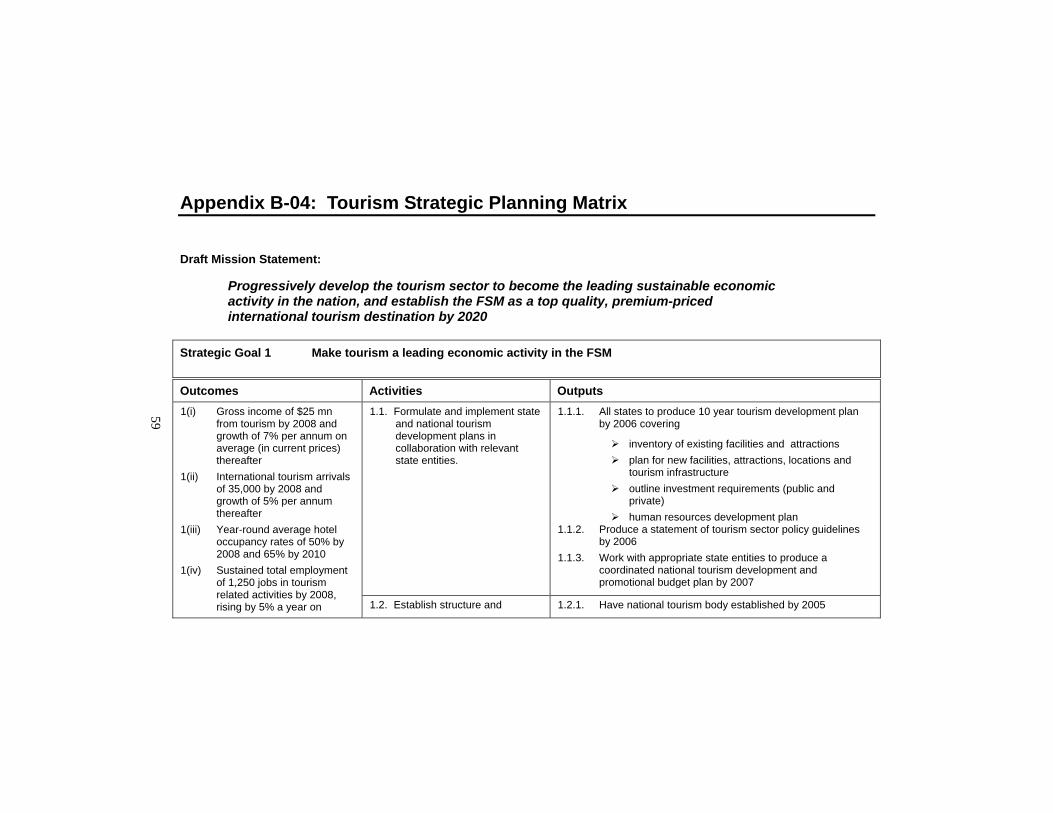
59
Appendix B-04: Tourism Strategic Planning Matrix
Draft Mission Statement:
Progressively develop the tourism sector to become the leading sustainable economic activity in the nation, and establish the FSM as a top quality, premium-priced international tourism destination by 2020
Strategic Goal 1 Make tourism a leading economic activity in the FSM Outcomes Activities Outputs
1.1. Formulate and implement state and national tourism development plans in collaboration with relevant state entities.
1.1.1. All states to produce 10 year tourism development plan by 2006 covering
inventory of existing facilities and attractions plan for new facilities, attractions, locations and
tourism infrastructure outline investment requirements (public and
private) human resources development plan
1.1.2. Produce a statement of tourism sector policy guidelines by 2006
1.1.3. Work with appropriate state entities to produce a coordinated national tourism development and promotional budget plan by 2007
1(i) Gross income of $25 mn from tourism by 2008 and growth of 7% per annum on average (in current prices) thereafter
1(ii) International tourism arrivals of 35,000 by 2008 and growth of 5% per annum thereafter
1(iii) Year-round average hotel occupancy rates of 50% by 2008 and 65% by 2010
1(iv) Sustained total employment of 1,250 jobs in tourism related activities by 2008, rising by 5% a year on 1.2. Establish structure and 1.2.1. Have national tourism body established by 2005
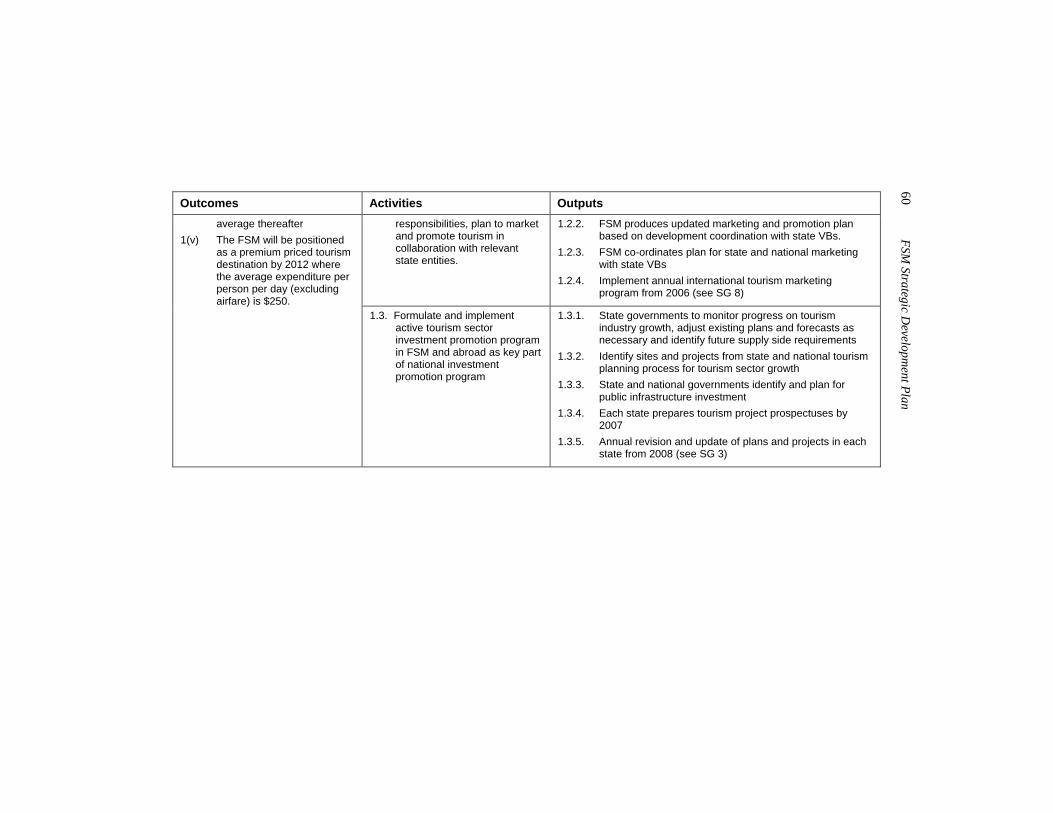
60 FSM
Strategic Developm
ent Plan
Outcomes Activities Outputs responsibilities, plan to market and promote tourism in collaboration with relevant state entities.
1.2.2. FSM produces updated marketing and promotion plan based on development coordination with state VBs.
1.2.3. FSM co-ordinates plan for state and national marketing with state VBs
1.2.4. Implement annual international tourism marketing program from 2006 (see SG 8)
average thereafter 1(v) The FSM will be positioned
as a premium priced tourism destination by 2012 where the average expenditure per person per day (excluding airfare) is $250.
1.3. Formulate and implement active tourism sector investment promotion program in FSM and abroad as key part of national investment promotion program
1.3.1. State governments to monitor progress on tourism industry growth, adjust existing plans and forecasts as necessary and identify future supply side requirements
1.3.2. Identify sites and projects from state and national tourism planning process for tourism sector growth
1.3.3. State and national governments identify and plan for public infrastructure investment
1.3.4. Each state prepares tourism project prospectuses by 2007
1.3.5. Annual revision and update of plans and projects in each state from 2008 (see SG 3)
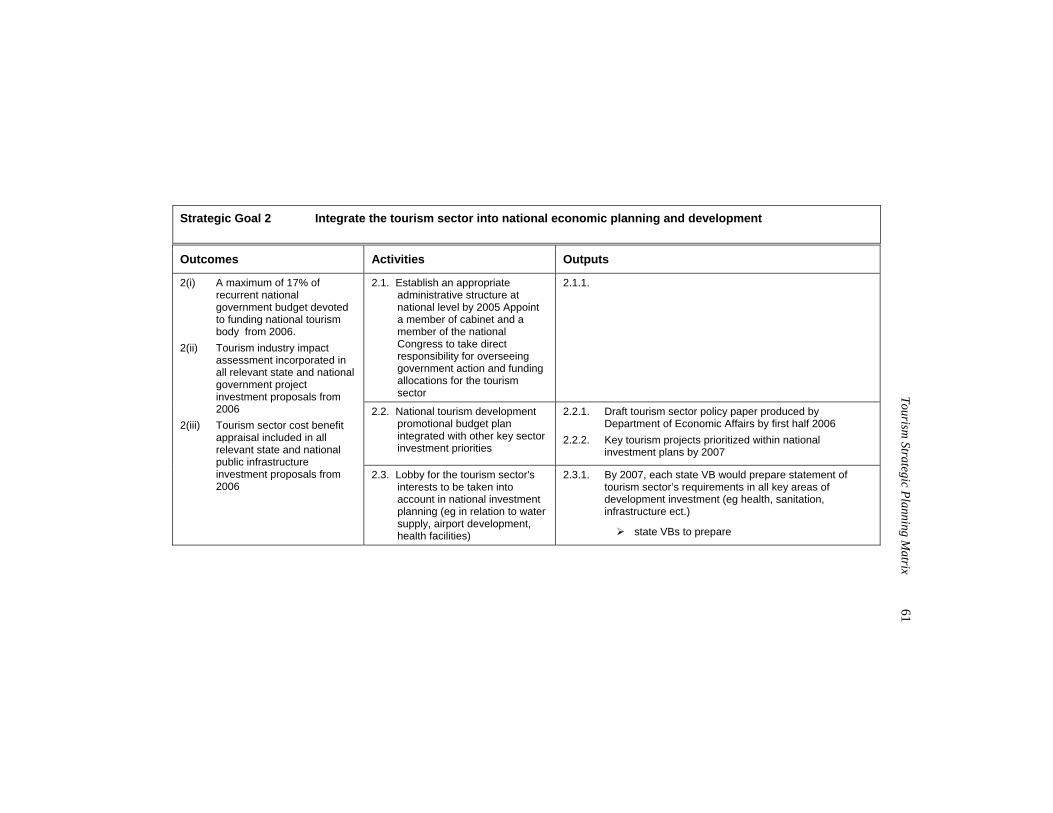
Tourism
Strategic Planning Matrix
61
Strategic Goal 2 Integrate the tourism sector into national economic planning and development Outcomes Activities Outputs
2.1. Establish an appropriate administrative structure at national level by 2005 Appoint a member of cabinet and a member of the national Congress to take direct responsibility for overseeing government action and funding allocations for the tourism sector
2.1.1.
2.2. National tourism development promotional budget plan integrated with other key sector investment priorities
2.2.1. Draft tourism sector policy paper produced by Department of Economic Affairs by first half 2006
2.2.2. Key tourism projects prioritized within national investment plans by 2007
2(i) A maximum of 17% of recurrent national government budget devoted to funding national tourism body from 2006.
2(ii) Tourism industry impact assessment incorporated in all relevant state and national government project investment proposals from 2006
2(iii) Tourism sector cost benefit appraisal included in all relevant state and national public infrastructure investment proposals from 2006
2.3. Lobby for the tourism sector's interests to be taken into account in national investment planning (eg in relation to water supply, airport development, health facilities)
2.3.1. By 2007, each state VB would prepare statement of tourism sector’s requirements in all key areas of development investment (eg health, sanitation, infrastructure ect.)
state VBs to prepare
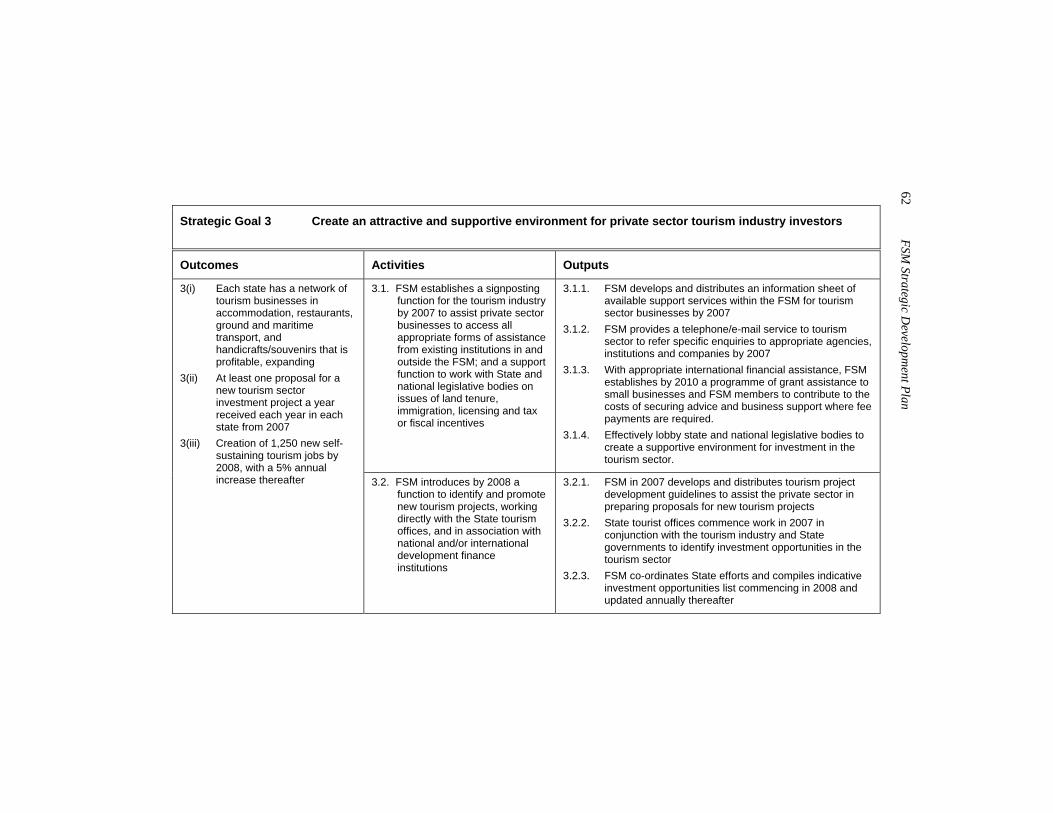
62 FSM
Strategic Developm
ent Plan
Strategic Goal 3 Create an attractive and supportive environment for private sector tourism industry investors Outcomes Activities Outputs
3.1. FSM establishes a signposting function for the tourism industry by 2007 to assist private sector businesses to access all appropriate forms of assistance from existing institutions in and outside the FSM; and a support function to work with State and national legislative bodies on issues of land tenure, immigration, licensing and tax or fiscal incentives
3.1.1. FSM develops and distributes an information sheet of available support services within the FSM for tourism sector businesses by 2007
3.1.2. FSM provides a telephone/e-mail service to tourism sector to refer specific enquiries to appropriate agencies, institutions and companies by 2007
3.1.3. With appropriate international financial assistance, FSM establishes by 2010 a programme of grant assistance to small businesses and FSM members to contribute to the costs of securing advice and business support where fee payments are required.
3.1.4. Effectively lobby state and national legislative bodies to create a supportive environment for investment in the tourism sector.
3(i) Each state has a network of tourism businesses in accommodation, restaurants, ground and maritime transport, and handicrafts/souvenirs that is profitable, expanding
3(ii) At least one proposal for a new tourism sector investment project a year received each year in each state from 2007
3(iii) Creation of 1,250 new self-sustaining tourism jobs by 2008, with a 5% annual increase thereafter 3.2. FSM introduces by 2008 a
function to identify and promote new tourism projects, working directly with the State tourism offices, and in association with national and/or international development finance institutions
3.2.1. FSM in 2007 develops and distributes tourism project development guidelines to assist the private sector in preparing proposals for new tourism projects
3.2.2. State tourist offices commence work in 2007 in conjunction with the tourism industry and State governments to identify investment opportunities in the tourism sector
3.2.3. FSM co-ordinates State efforts and compiles indicative investment opportunities list commencing in 2008 and updated annually thereafter
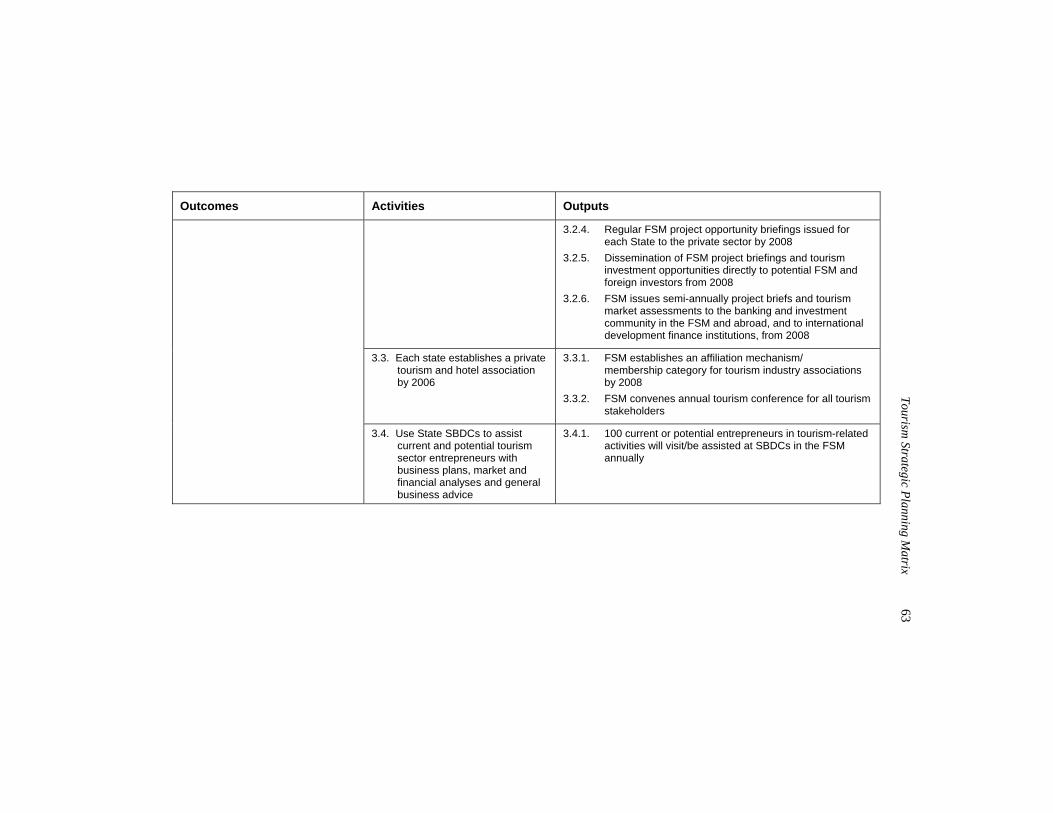
Tourism
Strategic Planning Matrix
63
Outcomes Activities Outputs
3.2.4. Regular FSM project opportunity briefings issued for each State to the private sector by 2008
3.2.5. Dissemination of FSM project briefings and tourism investment opportunities directly to potential FSM and foreign investors from 2008
3.2.6. FSM issues semi-annually project briefs and tourism market assessments to the banking and investment community in the FSM and abroad, and to international development finance institutions, from 2008
3.3. Each state establishes a private tourism and hotel association by 2006
3.3.1. FSM establishes an affiliation mechanism/ membership category for tourism industry associations by 2008
3.3.2. FSM convenes annual tourism conference for all tourism stakeholders
3.4. Use State SBDCs to assist current and potential tourism sector entrepreneurs with business plans, market and financial analyses and general business advice
3.4.1. 100 current or potential entrepreneurs in tourism-related activities will visit/be assisted at SBDCs in the FSM annually
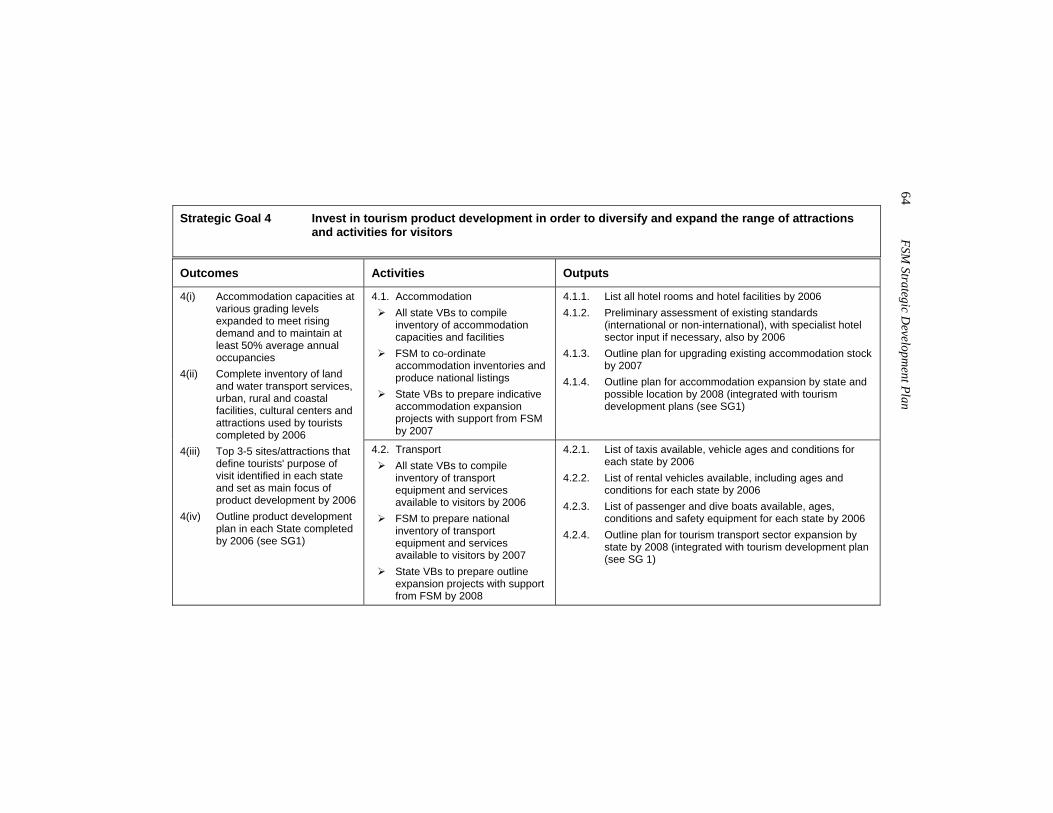
64 FSM
Strategic Developm
ent Plan
Strategic Goal 4 Invest in tourism product development in order to diversify and expand the range of attractions
and activities for visitors Outcomes Activities Outputs
4.1. Accommodation All state VBs to compile
inventory of accommodation capacities and facilities
FSM to co-ordinate accommodation inventories and produce national listings
State VBs to prepare indicative accommodation expansion projects with support from FSM by 2007
4.1.1. List all hotel rooms and hotel facilities by 2006 4.1.2. Preliminary assessment of existing standards
(international or non-international), with specialist hotel sector input if necessary, also by 2006
4.1.3. Outline plan for upgrading existing accommodation stock by 2007
4.1.4. Outline plan for accommodation expansion by state and possible location by 2008 (integrated with tourism development plans (see SG1)
4(i) Accommodation capacities at various grading levels expanded to meet rising demand and to maintain at least 50% average annual occupancies
4(ii) Complete inventory of land and water transport services, urban, rural and coastal facilities, cultural centers and attractions used by tourists completed by 2006
4(iii) Top 3-5 sites/attractions that define tourists' purpose of visit identified in each state and set as main focus of product development by 2006
4(iv) Outline product development plan in each State completed by 2006 (see SG1)
4.2. Transport All state VBs to compile
inventory of transport equipment and services available to visitors by 2006
FSM to prepare national inventory of transport equipment and services available to visitors by 2007
State VBs to prepare outline expansion projects with support from FSM by 2008
4.2.1. List of taxis available, vehicle ages and conditions for each state by 2006
4.2.2. List of rental vehicles available, including ages and conditions for each state by 2006
4.2.3. List of passenger and dive boats available, ages, conditions and safety equipment for each state by 2006
4.2.4. Outline plan for tourism transport sector expansion by state by 2008 (integrated with tourism development plan (see SG 1)
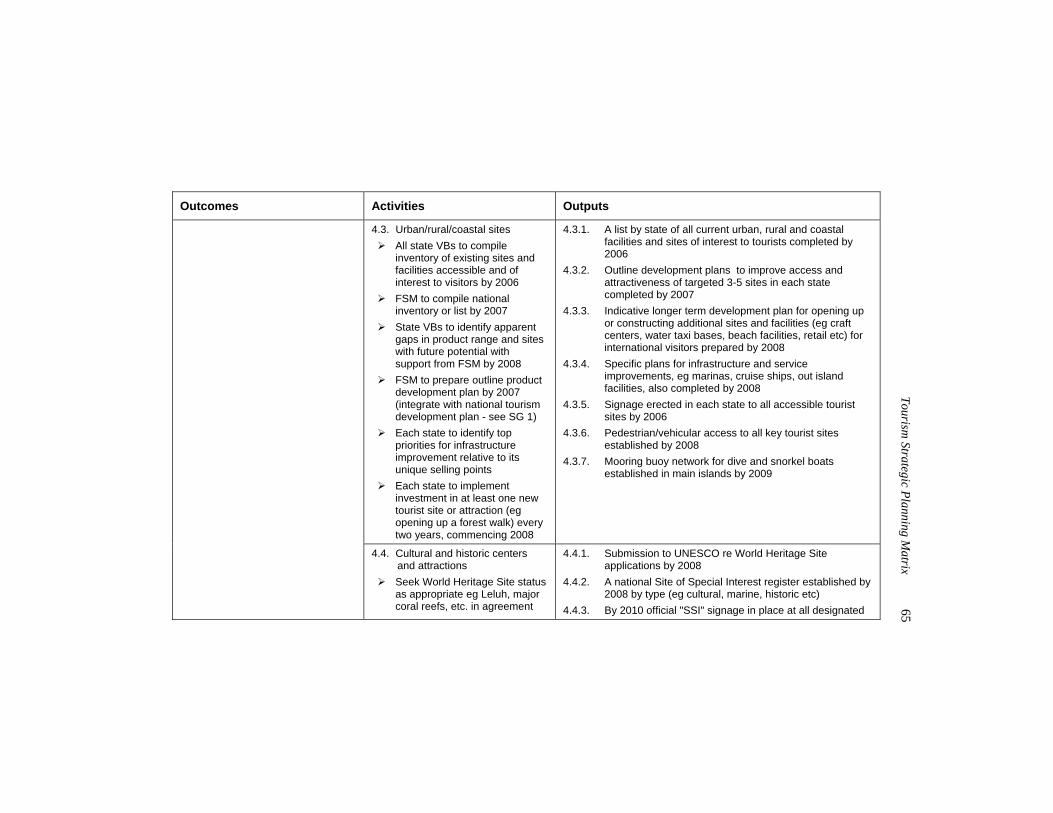
Tourism
Strategic Planning Matrix
65
Outcomes Activities Outputs
4.3. Urban/rural/coastal sites All state VBs to compile
inventory of existing sites and facilities accessible and of interest to visitors by 2006
FSM to compile national inventory or list by 2007
State VBs to identify apparent gaps in product range and sites with future potential with support from FSM by 2008
FSM to prepare outline product development plan by 2007 (integrate with national tourism development plan - see SG 1)
Each state to identify top priorities for infrastructure improvement relative to its unique selling points
Each state to implement investment in at least one new tourist site or attraction (eg opening up a forest walk) every two years, commencing 2008
4.3.1. A list by state of all current urban, rural and coastal facilities and sites of interest to tourists completed by 2006
4.3.2. Outline development plans to improve access and attractiveness of targeted 3-5 sites in each state completed by 2007
4.3.3. Indicative longer term development plan for opening up or constructing additional sites and facilities (eg craft centers, water taxi bases, beach facilities, retail etc) for international visitors prepared by 2008
4.3.4. Specific plans for infrastructure and service improvements, eg marinas, cruise ships, out island facilities, also completed by 2008
4.3.5. Signage erected in each state to all accessible tourist sites by 2006
4.3.6. Pedestrian/vehicular access to all key tourist sites established by 2008
4.3.7. Mooring buoy network for dive and snorkel boats established in main islands by 2009
4.4. Cultural and historic centers and attractions
Seek World Heritage Site status as appropriate eg Leluh, major coral reefs, etc. in agreement
4.4.1. Submission to UNESCO re World Heritage Site applications by 2008
4.4.2. A national Site of Special Interest register established by 2008 by type (eg cultural, marine, historic etc)
4.4.3. By 2010 official "SSI" signage in place at all designated
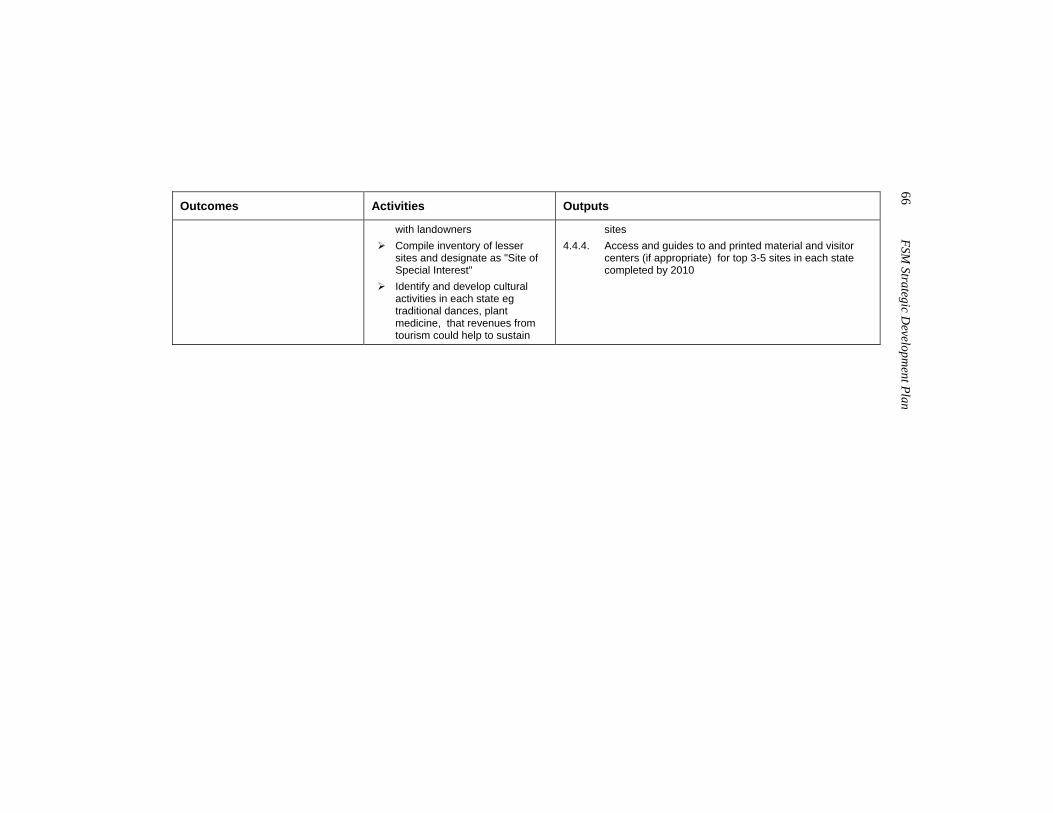
66 FSM
Strategic Developm
ent Plan
Outcomes Activities Outputs
with landowners Compile inventory of lesser
sites and designate as "Site of Special Interest"
Identify and develop cultural activities in each state eg traditional dances, plant medicine, that revenues from tourism could help to sustain
sites 4.4.4. Access and guides to and printed material and visitor
centers (if appropriate) for top 3-5 sites in each state completed by 2010
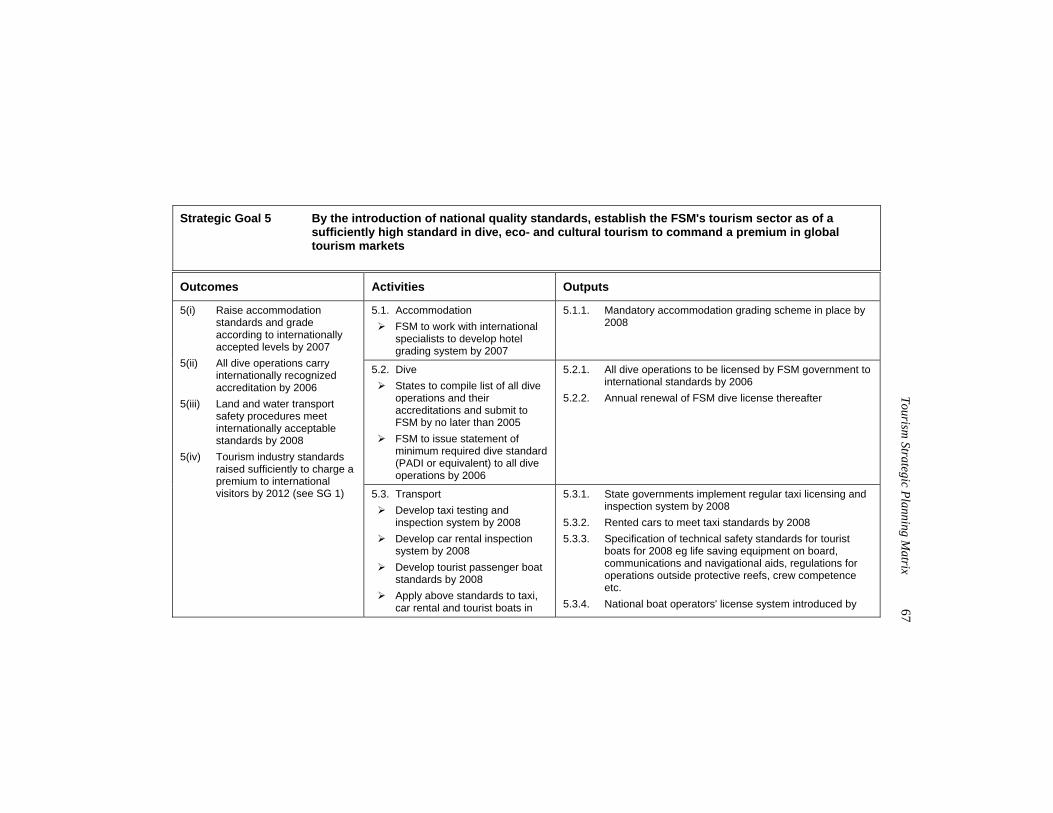
Tourism
Strategic Planning Matrix
67
Strategic Goal 5 By the introduction of national quality standards, establish the FSM's tourism sector as of a
sufficiently high standard in dive, eco- and cultural tourism to command a premium in global tourism markets
Outcomes Activities Outputs
5.1. Accommodation FSM to work with international
specialists to develop hotel grading system by 2007
5.1.1. Mandatory accommodation grading scheme in place by 2008
5.2. Dive States to compile list of all dive
operations and their accreditations and submit to FSM by no later than 2005
FSM to issue statement of minimum required dive standard (PADI or equivalent) to all dive operations by 2006
5.2.1. All dive operations to be licensed by FSM government to international standards by 2006
5.2.2. Annual renewal of FSM dive license thereafter
5(i) Raise accommodation standards and grade according to internationally accepted levels by 2007
5(ii) All dive operations carry internationally recognized accreditation by 2006
5(iii) Land and water transport safety procedures meet internationally acceptable standards by 2008
5(iv) Tourism industry standards raised sufficiently to charge a premium to international visitors by 2012 (see SG 1)
5.3. Transport
Develop taxi testing and inspection system by 2008
Develop car rental inspection system by 2008
Develop tourist passenger boat standards by 2008
Apply above standards to taxi, car rental and tourist boats in
5.3.1. State governments implement regular taxi licensing and inspection system by 2008
5.3.2. Rented cars to meet taxi standards by 2008 5.3.3. Specification of technical safety standards for tourist
boats for 2008 eg life saving equipment on board, communications and navigational aids, regulations for operations outside protective reefs, crew competence etc.
5.3.4. National boat operators' license system introduced by
68 FSM
Strategic Developm
ent Plan
Outcomes Activities Outputs
2008 2008
5.4. General FSM with national and state
governments establishes tourism industry inspectorate by 2008 to cover:
accommodation transport tourism service industry eg retail, restaurants, handicrafts etc.
FSM introduces national tourism industry accreditation and licensing system in 2010
Introduce a requirement that only businesses accredited by the FSM can be included in national/state level promotion and marketing
In 2011 FSM initiates debate with public and private stakeholders in all states on how to drive tourism consistently upmarket
5.4.1. Tourism Service Industry Quality Accreditation from 2010
5.4.2. Tourist Boat, Car Rental and Taxi Operators accreditation from 2010
5.4.3. Proposals prepared for presentation to Congress in 2012 for planning controls, capacity limits, minimum daily charges and other internationally acceptable means of positioning the FSM as a premium international visitor destination
5.4.4. Tour guide certification standards and procedure established by 2006
Tourism
Strategic Planning Matrix
69
Strategic Goal 6 Promote inter-sectoral linkages and maximize use of local produce and services Outcomes Activities Outputs
6.1. Each State's agricultural and fishing authorities to identify reliable local sources and suppliers of fish, meat, vegetables, and fruit in 2006.
6.1.1. Demand assessment prepared by State VBs for consumption of local produce by tourism sector (accommodation, restaurants etc.) by 2007
6.2. Tourism industry, state VBs and state governments to prepare tourist industry supply proposals and implement at producer level where necessary commencing 2007
6.2.1. Tourism industry purchasing consortia and/or co-operatives created where necessary to "regularize" demand by 2007
6.3. Develop a plan in each state for use of local construction techniques and materials in hotels, other tourism infrastructure and in cultural and other tourism related events by 2007
6.3.1. An inventory of local building materials and construction skills to provide an information base for new local style tourism infrastructure, fixtures and fittings available by 2008
6.4. Develop and diversify range of local handicrafts and other products available for purchase by visitors
6.4.1. Plans in place at key cultural attractions and within cultural groups for use of local raw materials etc. by 2008
6.4.2. A range of sustainable handicrafts and products available for sale to visitors in each state certified to FSM standards (SG 5) by 2010
6(i) By 2010 hotels in FSM will buy 100% of their fish, 50% of fruit, 50% of vegetables, and 10% of meat from within the FSM
6(ii) Ensure that every foreign visitor to the FSM spends at least $50 on locally produced artefacts, souvenirs, handicrafts etc. on each visit
6(iii) National craft advisor for artisans in place and operative by 2010
6(iv) National award scheme to tourism industry suppliers established by 2008
6.5. Provide design and 6.5.1. Where appropriate, State VBs to operate their own
70 FSM
Strategic Developm
ent Plan
Outcomes Activities Outputs
craft/production support services to local artisans and encourage the survival of traditional skills by teaching programs and presentations in schools
shop(s) and/or buy/sell co-operatives for local artisans by 2010
6.6. Introduce new activities to craft industry eg candle making?, screen-printed Tee shirts?, basket ware?; Select annually individual local suppliers to the tourism industry worthy of receiving special recognition
6.6.1. Diversified and improved product range available to visitors
Tourism
Strategic Planning Matrix
71
Strategic Goal 7 Involve FSM residents in tourism sector development Outcomes Activities Outputs
7.1. FSM in coordination with all relevant agencies (and with assistance from international bodies, eg PATA) to develop tourism public awareness programs to inform FSM citizens of tourism's benefits, opportunities and impact
7.1.1. Program developed for ongoing public awareness with supporting materials (information sheets, posters, media announcements/press releases, etc.) for adults by end 2006
7.1.2. Annual public awareness campaigns by means of seminars, public meetings, radio, press ad, etc., on all four main islands to commence 2007.
7.1.3. National tourism awareness program and supporting material for use in secondary schools designed by end-2007
7.1.4. Tourism awareness curriculum in all secondary schools introduced by 2008 so that at least one tourism awareness session per year is held in each school
7.2. Tourism industry stakeholders, FSM and state governments (with assistance from international bodies) to develop programs to educate citizens on tourists' requirements
7.2.1. Educational material and programs designed by end-2006 to inform citizens outside the tourism sector of tourists' interests, concerns, requirements and expectations
7.2.2. Information programs delivered to adults in principal settlements on all main islands, commencing in 2007, by means of public meetings, radio and press ads etc.
7.2.3. Program of annual updates and refresher campaigns introduced in all states thereafter
7(i) Nationwide awareness of tourism's importance to the FSM's development by completing initial public awareness campaigns in all four principal islands by 2008
7(ii) Raise ability of residents to respond to the needs of tourists
7(iii) Gain the acceptance of citizens to tourism development plans
7.3. FSM, national and state governments to develop public
7.3.1. All states to have presented tourism development plans and strategies to traditional, religious and other leaders
72 FSM
Strategic Developm
ent Plan
Outcomes Activities Outputs
consultation mechanisms with traditional leaders, the church and other relevant representatives on tourism development strategies
and gained broad approval as part of the formulation of state and national tourism development plans (SG 1) by 2007
7.3.2. An annual consultation meeting with traditional leaders etc held in each state on progress to date, amendments, specific project proposals etc. from 2008
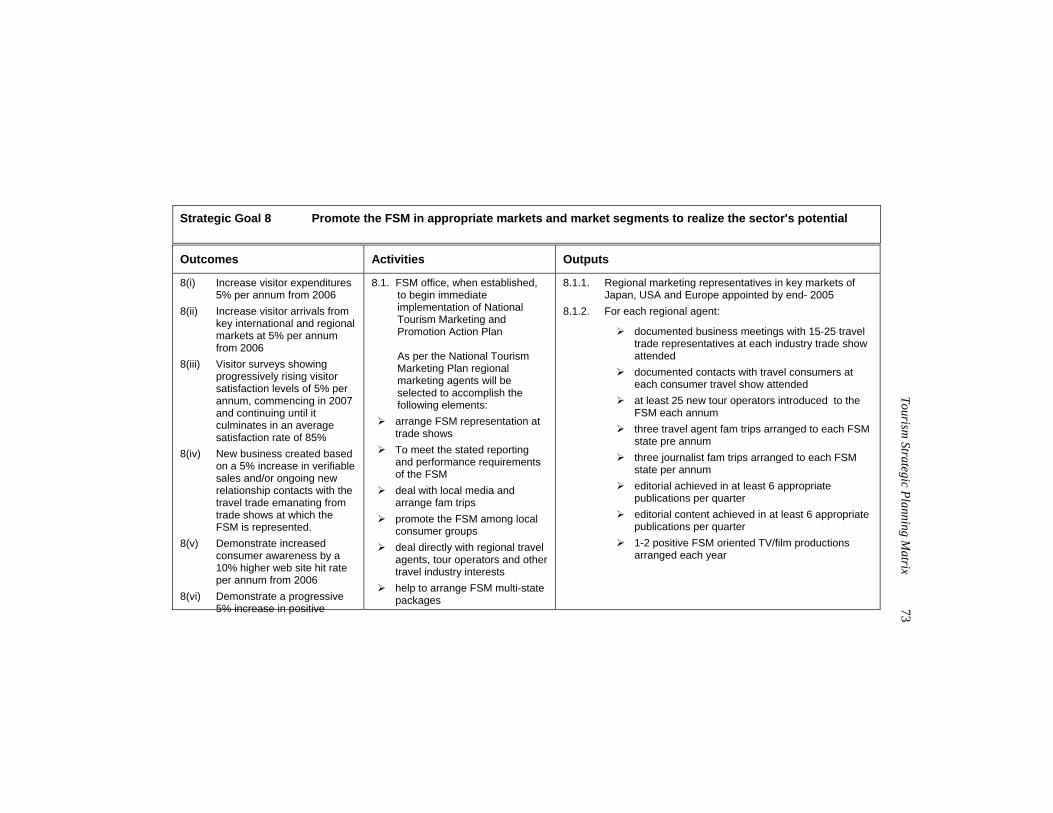
Tourism
Strategic Planning Matrix
73
Strategic Goal 8 Promote the FSM in appropriate markets and market segments to realize the sector's potential Outcomes Activities Outputs
8(i) Increase visitor expenditures 5% per annum from 2006
8(ii) Increase visitor arrivals from key international and regional markets at 5% per annum from 2006
8(iii) Visitor surveys showing progressively rising visitor satisfaction levels of 5% per annum, commencing in 2007 and continuing until it culminates in an average satisfaction rate of 85%
8(iv) New business created based on a 5% increase in verifiable sales and/or ongoing new relationship contacts with the travel trade emanating from trade shows at which the FSM is represented.
8(v) Demonstrate increased consumer awareness by a 10% higher web site hit rate per annum from 2006
8(vi) Demonstrate a progressive 5% increase in positive
8.1. FSM office, when established, to begin immediate implementation of National Tourism Marketing and Promotion Action Plan As per the National Tourism Marketing Plan regional marketing agents will be selected to accomplish the following elements:
arrange FSM representation at trade shows
To meet the stated reporting and performance requirements of the FSM
deal with local media and arrange fam trips
promote the FSM among local consumer groups
deal directly with regional travel agents, tour operators and other travel industry interests
help to arrange FSM multi-state packages
8.1.1. Regional marketing representatives in key markets of Japan, USA and Europe appointed by end- 2005
8.1.2. For each regional agent:
documented business meetings with 15-25 travel trade representatives at each industry trade show attended
documented contacts with travel consumers at each consumer travel show attended
at least 25 new tour operators introduced to the FSM each annum
three travel agent fam trips arranged to each FSM state pre annum
three journalist fam trips arranged to each FSM state per annum
editorial achieved in at least 6 appropriate publications per quarter
editorial content achieved in at least 6 appropriate publications per quarter
1-2 positive FSM oriented TV/film productions arranged each year
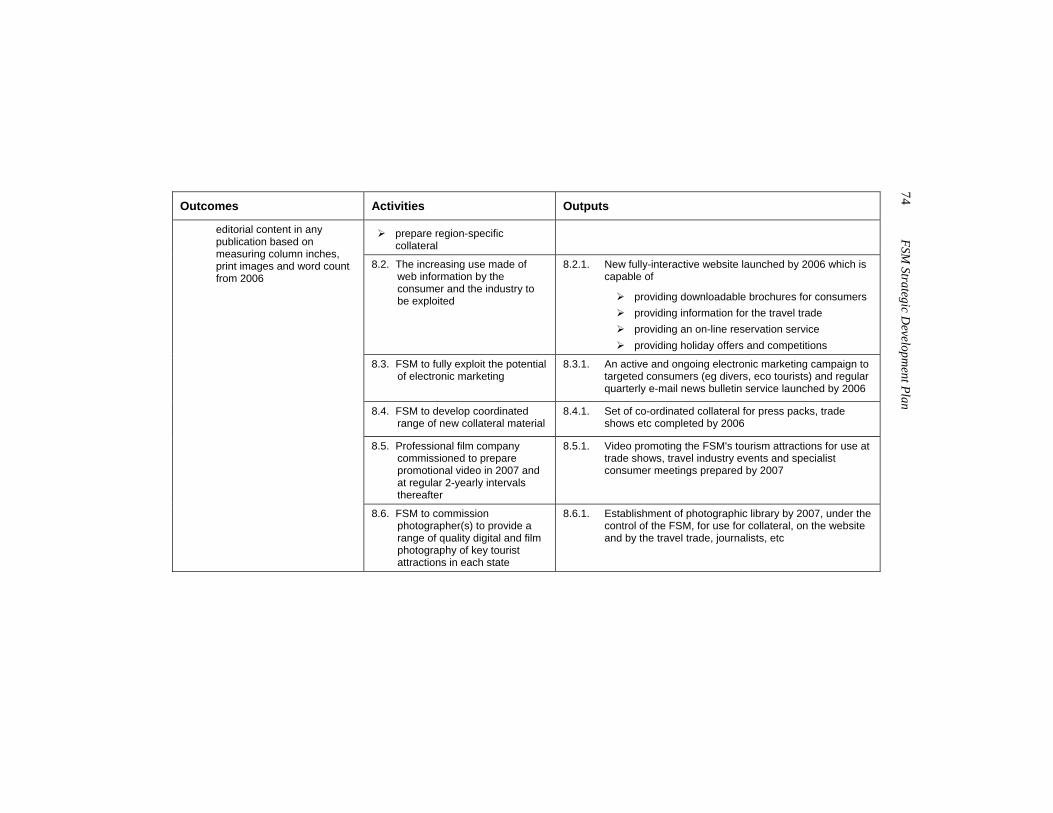
74 FSM
Strategic Developm
ent Plan
Outcomes Activities Outputs
prepare region-specific collateral
8.2. The increasing use made of web information by the consumer and the industry to be exploited
8.2.1. New fully-interactive website launched by 2006 which is capable of
providing downloadable brochures for consumers providing information for the travel trade providing an on-line reservation service providing holiday offers and competitions
8.3. FSM to fully exploit the potential of electronic marketing
8.3.1. An active and ongoing electronic marketing campaign to targeted consumers (eg divers, eco tourists) and regular quarterly e-mail news bulletin service launched by 2006
8.4. FSM to develop coordinated range of new collateral material
8.4.1. Set of co-ordinated collateral for press packs, trade shows etc completed by 2006
8.5. Professional film company commissioned to prepare promotional video in 2007 and at regular 2-yearly intervals thereafter
8.5.1. Video promoting the FSM's tourism attractions for use at trade shows, travel industry events and specialist consumer meetings prepared by 2007
editorial content in any publication based on measuring column inches, print images and word count from 2006
8.6. FSM to commission photographer(s) to provide a range of quality digital and film photography of key tourist attractions in each state
8.6.1. Establishment of photographic library by 2007, under the control of the FSM, for use for collateral, on the website and by the travel trade, journalists, etc
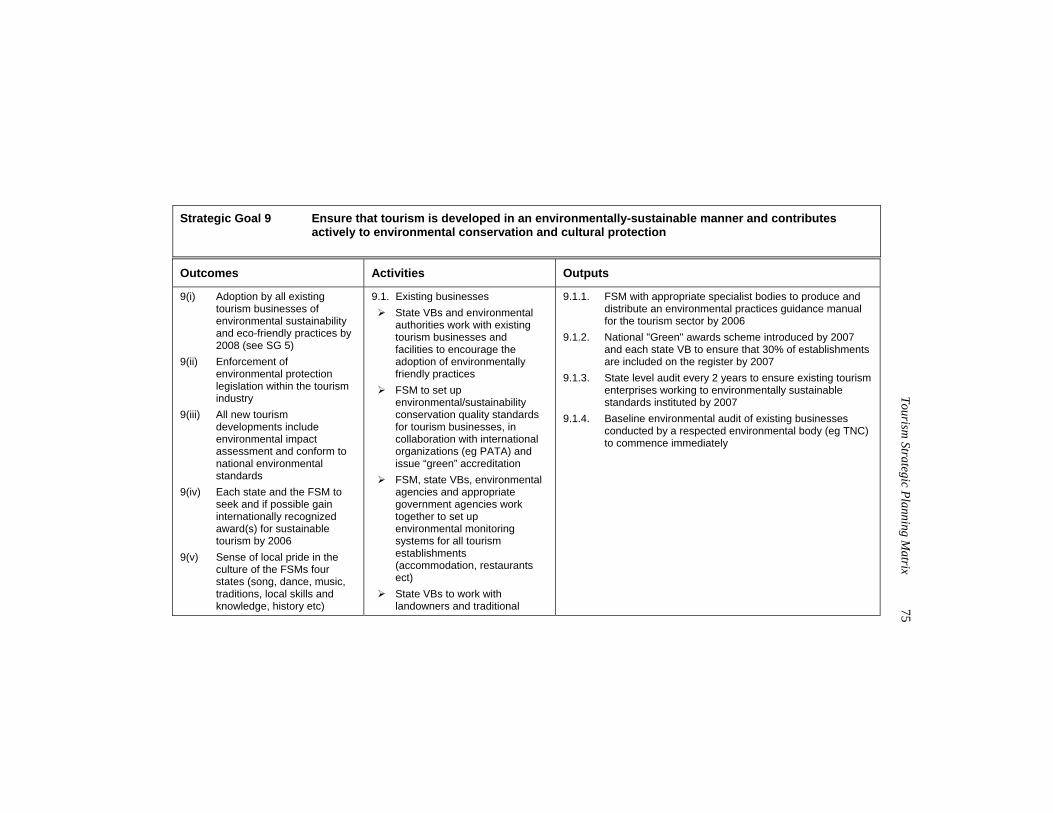
Tourism
Strategic Planning Matrix
75
Strategic Goal 9 Ensure that tourism is developed in an environmentally-sustainable manner and contributes
actively to environmental conservation and cultural protection Outcomes Activities Outputs
9(i) Adoption by all existing tourism businesses of environmental sustainability and eco-friendly practices by 2008 (see SG 5)
9(ii) Enforcement of environmental protection legislation within the tourism industry
9(iii) All new tourism developments include environmental impact assessment and conform to national environmental standards
9(iv) Each state and the FSM to seek and if possible gain internationally recognized award(s) for sustainable tourism by 2006
9(v) Sense of local pride in the culture of the FSMs four states (song, dance, music, traditions, local skills and knowledge, history etc)
9.1. Existing businesses State VBs and environmental
authorities work with existing tourism businesses and facilities to encourage the adoption of environmentally friendly practices
FSM to set up environmental/sustainability conservation quality standards for tourism businesses, in collaboration with international organizations (eg PATA) and issue “green” accreditation
FSM, state VBs, environmental agencies and appropriate government agencies work together to set up environmental monitoring systems for all tourism establishments (accommodation, restaurants ect)
State VBs to work with landowners and traditional
9.1.1. FSM with appropriate specialist bodies to produce and distribute an environmental practices guidance manual for the tourism sector by 2006
9.1.2. National "Green" awards scheme introduced by 2007 and each state VB to ensure that 30% of establishments are included on the register by 2007
9.1.3. State level audit every 2 years to ensure existing tourism enterprises working to environmentally sustainable standards instituted by 2007
9.1.4. Baseline environmental audit of existing businesses conducted by a respected environmental body (eg TNC) to commence immediately
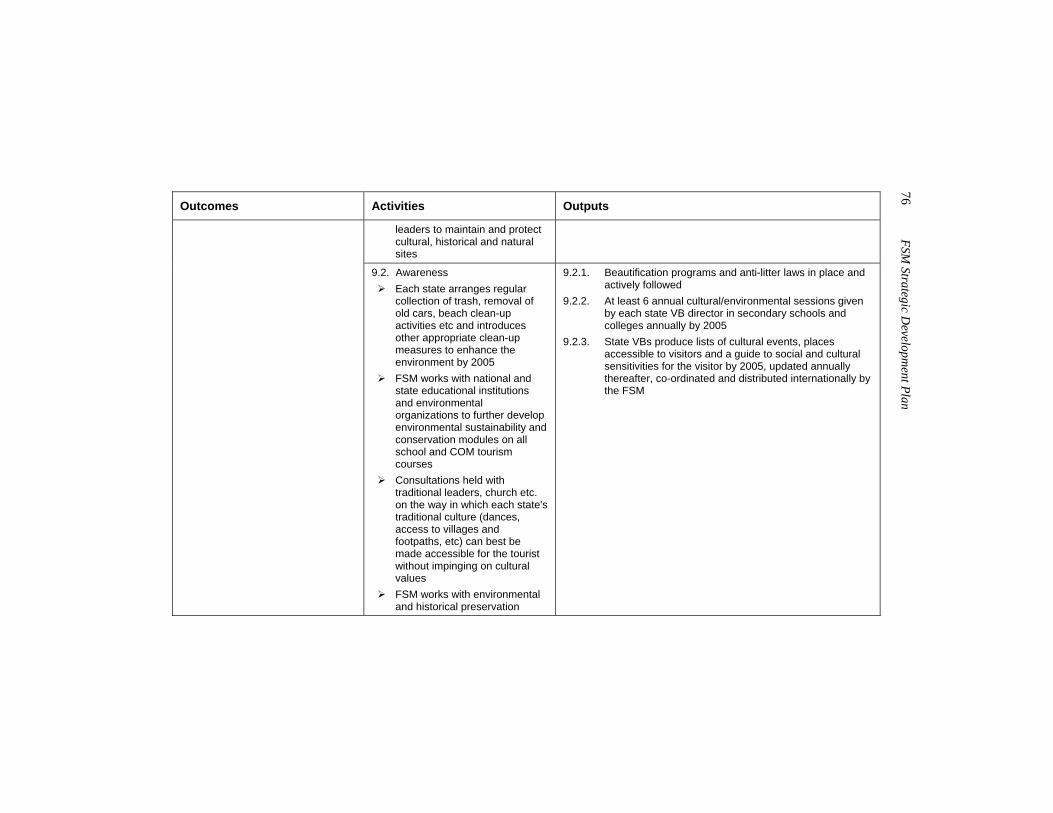
76 FSM
Strategic Developm
ent Plan
Outcomes Activities Outputs
leaders to maintain and protect cultural, historical and natural sites
9.2. Awareness Each state arranges regular
collection of trash, removal of old cars, beach clean-up activities etc and introduces other appropriate clean-up measures to enhance the environment by 2005
FSM works with national and state educational institutions and environmental organizations to further develop environmental sustainability and conservation modules on all school and COM tourism courses
Consultations held with traditional leaders, church etc. on the way in which each state's traditional culture (dances, access to villages and footpaths, etc) can best be made accessible for the tourist without impinging on cultural values
FSM works with environmental and historical preservation
9.2.1. Beautification programs and anti-litter laws in place and actively followed
9.2.2. At least 6 annual cultural/environmental sessions given by each state VB director in secondary schools and colleges annually by 2005
9.2.3. State VBs produce lists of cultural events, places accessible to visitors and a guide to social and cultural sensitivities for the visitor by 2005, updated annually thereafter, co-ordinated and distributed internationally by the FSM
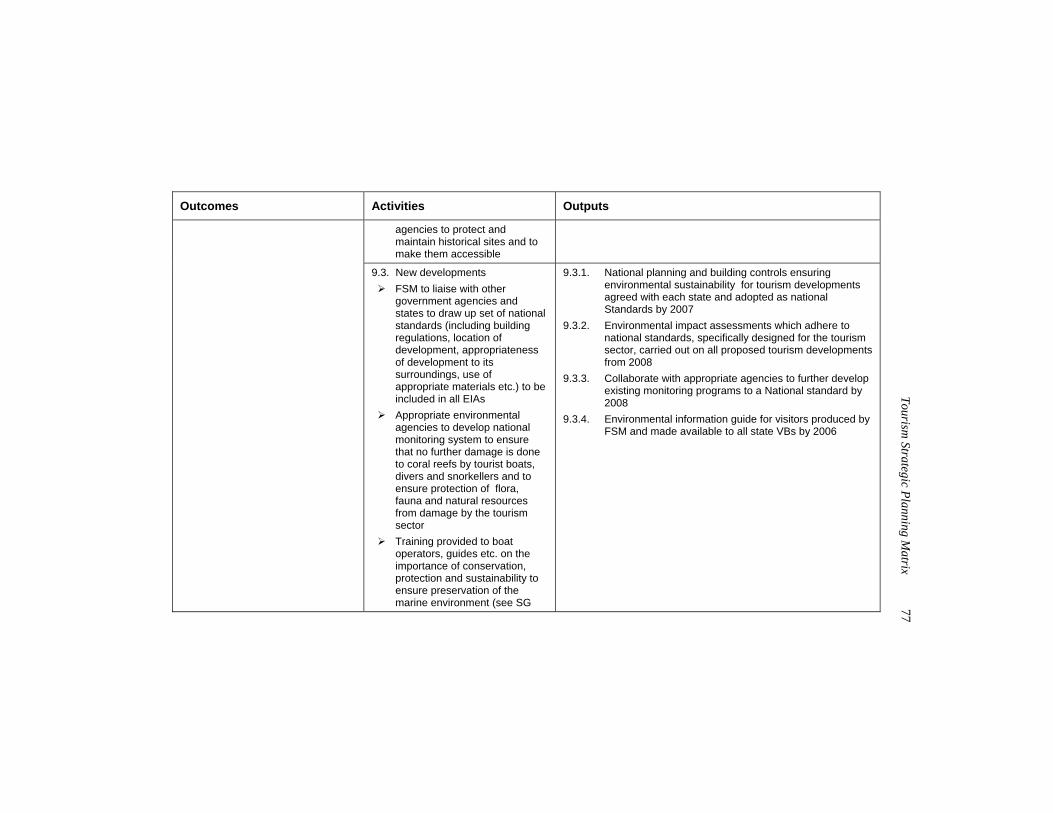
Tourism
Strategic Planning Matrix
77
Outcomes Activities Outputs
agencies to protect and maintain historical sites and to make them accessible
9.3. New developments FSM to liaise with other
government agencies and states to draw up set of national standards (including building regulations, location of development, appropriateness of development to its surroundings, use of appropriate materials etc.) to be included in all EIAs
Appropriate environmental agencies to develop national monitoring system to ensure that no further damage is done to coral reefs by tourist boats, divers and snorkellers and to ensure protection of flora, fauna and natural resources from damage by the tourism sector
Training provided to boat operators, guides etc. on the importance of conservation, protection and sustainability to ensure preservation of the marine environment (see SG
9.3.1. National planning and building controls ensuring environmental sustainability for tourism developments agreed with each state and adopted as national Standards by 2007
9.3.2. Environmental impact assessments which adhere to national standards, specifically designed for the tourism sector, carried out on all proposed tourism developments from 2008
9.3.3. Collaborate with appropriate agencies to further develop existing monitoring programs to a National standard by 2008
9.3.4. Environmental information guide for visitors produced by FSM and made available to all state VBs by 2006
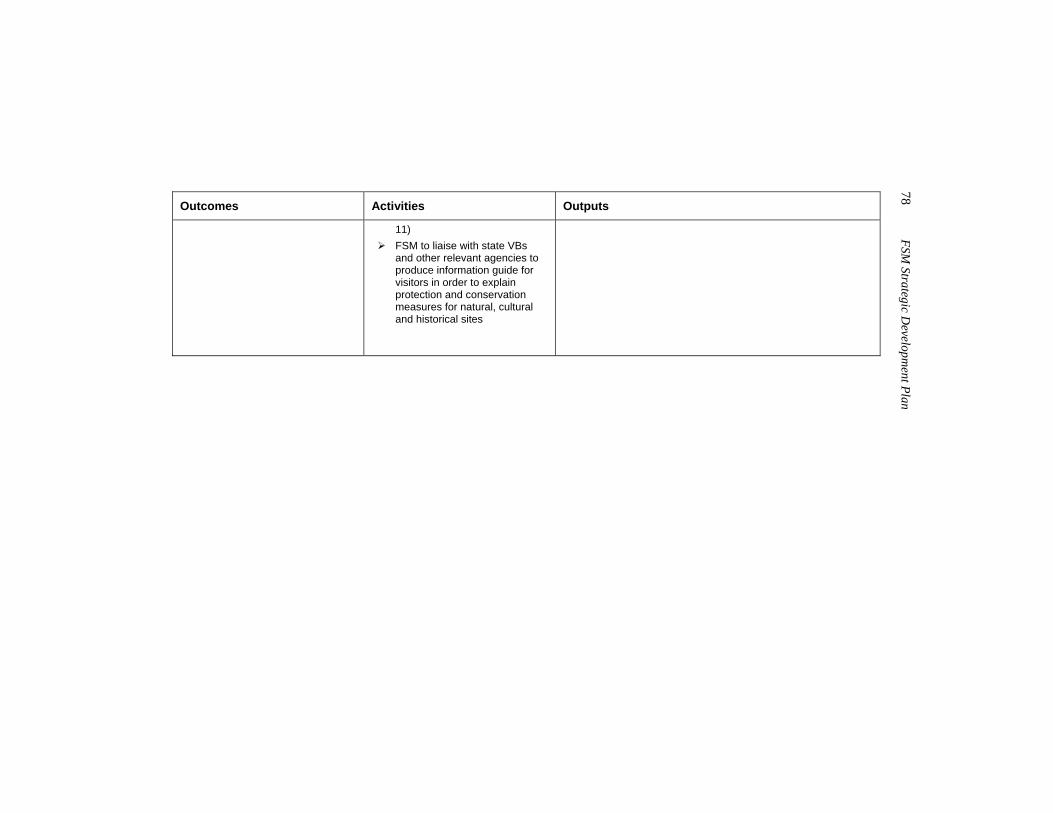
78 FSM
Strategic Developm
ent Plan
Outcomes Activities Outputs
11) FSM to liaise with state VBs
and other relevant agencies to produce information guide for visitors in order to explain protection and conservation measures for natural, cultural and historical sites
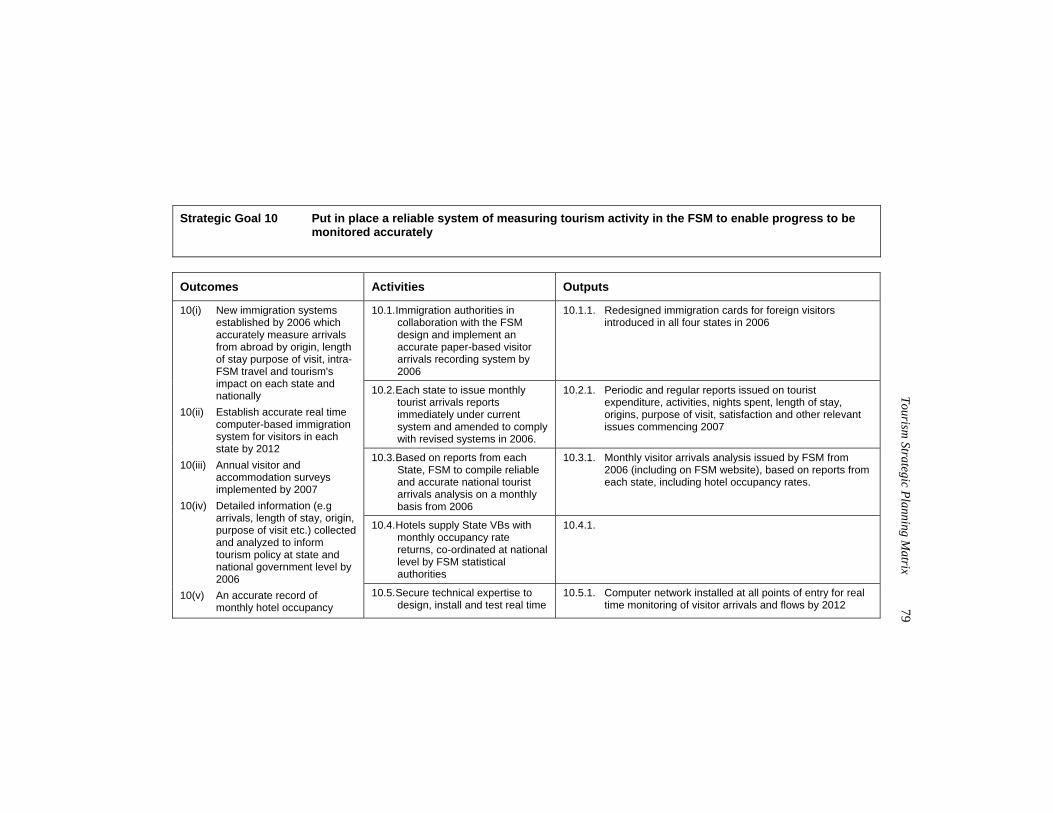
Tourism
Strategic Planning Matrix
79
Strategic Goal 10 Put in place a reliable system of measuring tourism activity in the FSM to enable progress to be
monitored accurately
Outcomes Activities Outputs
10.1. Immigration authorities in collaboration with the FSM design and implement an accurate paper-based visitor arrivals recording system by 2006
10.1.1. Redesigned immigration cards for foreign visitors introduced in all four states in 2006
10.2. Each state to issue monthly tourist arrivals reports immediately under current system and amended to comply with revised systems in 2006.
10.2.1. Periodic and regular reports issued on tourist expenditure, activities, nights spent, length of stay, origins, purpose of visit, satisfaction and other relevant issues commencing 2007
10.3. Based on reports from each State, FSM to compile reliable and accurate national tourist arrivals analysis on a monthly basis from 2006
10.3.1. Monthly visitor arrivals analysis issued by FSM from 2006 (including on FSM website), based on reports from each state, including hotel occupancy rates.
10.4. Hotels supply State VBs with monthly occupancy rate returns, co-ordinated at national level by FSM statistical authorities
10.4.1.
10(i) New immigration systems established by 2006 which accurately measure arrivals from abroad by origin, length of stay purpose of visit, intra-FSM travel and tourism's impact on each state and nationally
10(ii) Establish accurate real time computer-based immigration system for visitors in each state by 2012
10(iii) Annual visitor and accommodation surveys implemented by 2007
10(iv) Detailed information (e.g arrivals, length of stay, origin, purpose of visit etc.) collected and analyzed to inform tourism policy at state and national government level by 2006
10(v) An accurate record of monthly hotel occupancy
10.5. Secure technical expertise to design, install and test real time
10.5.1. Computer network installed at all points of entry for real time monitoring of visitor arrivals and flows by 2012
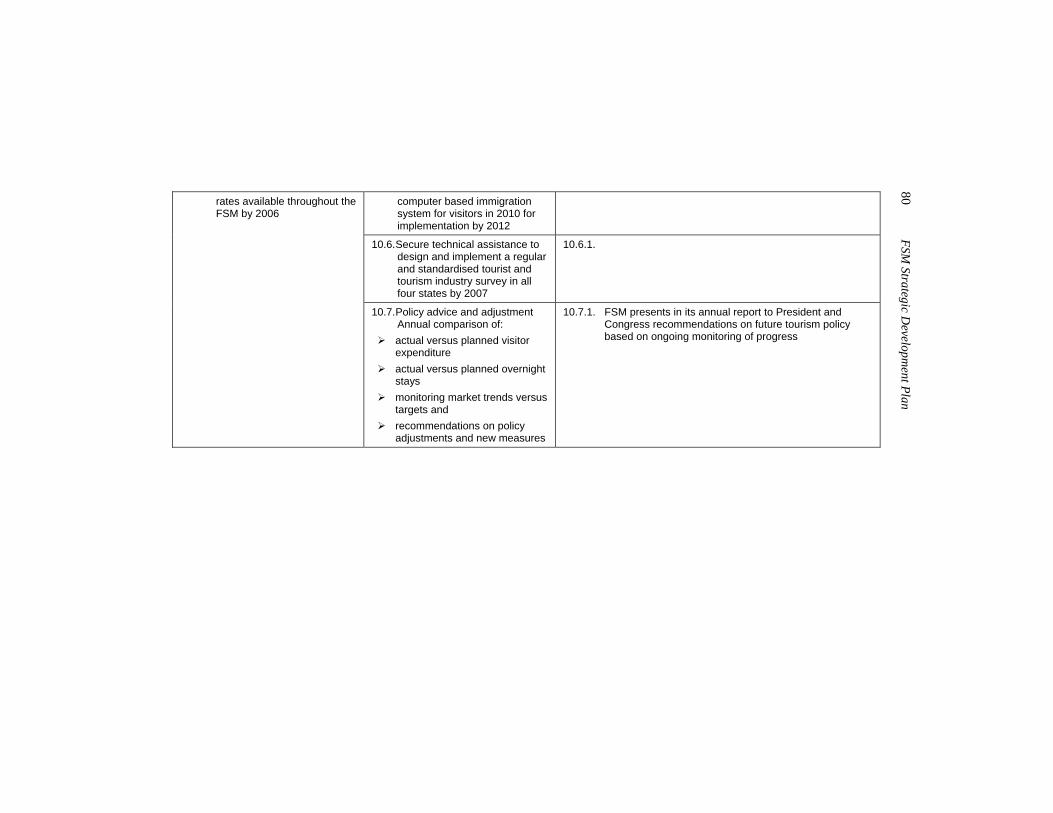
80 FSM
Strategic Developm
ent Plan
computer based immigration system for visitors in 2010 for implementation by 2012
10.6. Secure technical assistance to design and implement a regular and standardised tourist and tourism industry survey in all four states by 2007
10.6.1.
rates available throughout the FSM by 2006
10.7. Policy advice and adjustment Annual comparison of:
actual versus planned visitor expenditure
actual versus planned overnight stays
monitoring market trends versus targets and
recommendations on policy adjustments and new measures
10.7.1. FSM presents in its annual report to President and Congress recommendations on future tourism policy based on ongoing monitoring of progress
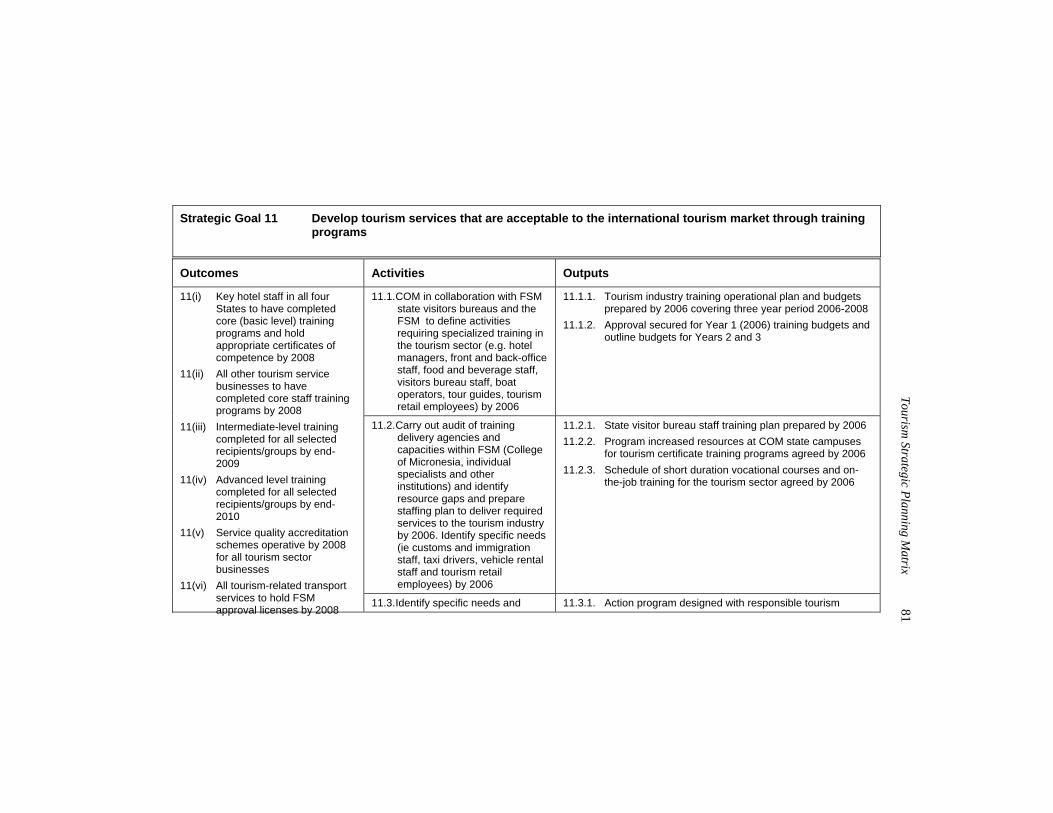
Tourism
Strategic Planning Matrix
81
Strategic Goal 11 Develop tourism services that are acceptable to the international tourism market through training
programs Outcomes Activities Outputs
11.1. COM in collaboration with FSM state visitors bureaus and the FSM to define activities requiring specialized training in the tourism sector (e.g. hotel managers, front and back-office staff, food and beverage staff, visitors bureau staff, boat operators, tour guides, tourism retail employees) by 2006
11.1.1. Tourism industry training operational plan and budgets prepared by 2006 covering three year period 2006-2008
11.1.2. Approval secured for Year 1 (2006) training budgets and outline budgets for Years 2 and 3
11.2. Carry out audit of training delivery agencies and capacities within FSM (College of Micronesia, individual specialists and other institutions) and identify resource gaps and prepare staffing plan to deliver required services to the tourism industry by 2006. Identify specific needs (ie customs and immigration staff, taxi drivers, vehicle rental staff and tourism retail employees) by 2006
11.2.1. State visitor bureau staff training plan prepared by 2006 11.2.2. Program increased resources at COM state campuses
for tourism certificate training programs agreed by 2006 11.2.3. Schedule of short duration vocational courses and on-
the-job training for the tourism sector agreed by 2006
11(i) Key hotel staff in all four States to have completed core (basic level) training programs and hold appropriate certificates of competence by 2008
11(ii) All other tourism service businesses to have completed core staff training programs by 2008
11(iii) Intermediate-level training completed for all selected recipients/groups by end-2009
11(iv) Advanced level training completed for all selected recipients/groups by end-2010
11(v) Service quality accreditation schemes operative by 2008 for all tourism sector businesses
11(vi) All tourism-related transport services to hold FSM approval licenses by 2008
11.3. Identify specific needs and 11.3.1. Action program designed with responsible tourism
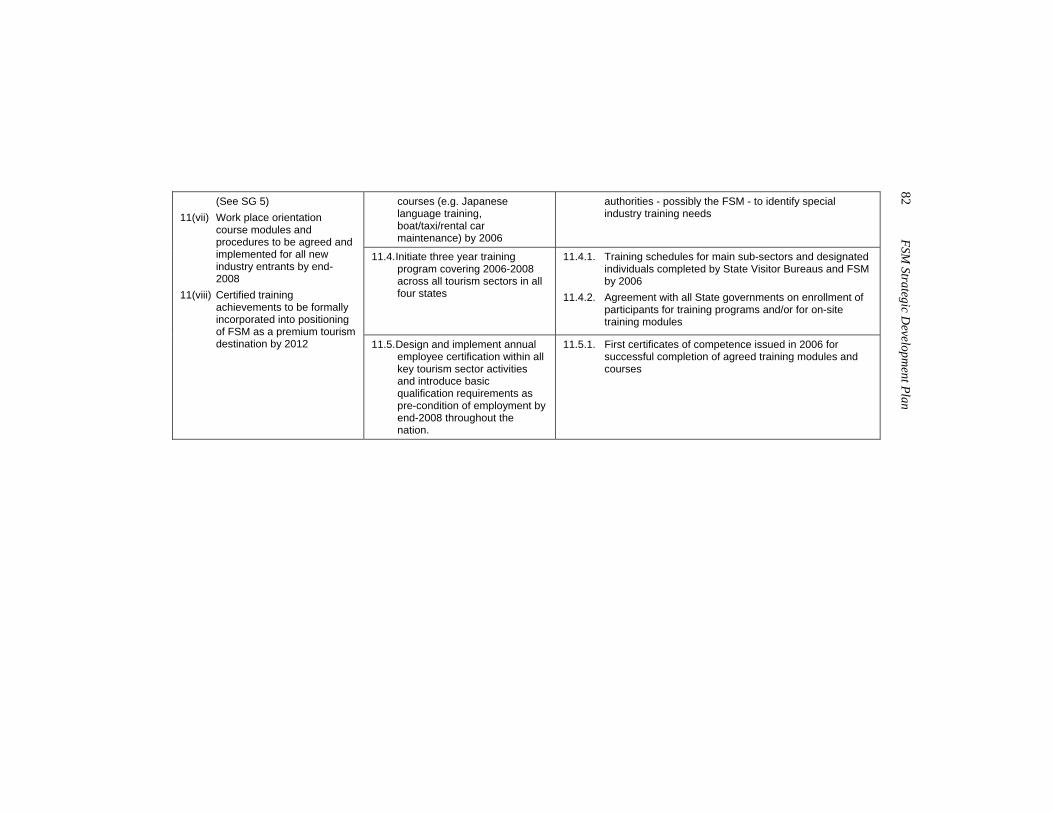
82 FSM
Strategic Developm
ent Plan
courses (e.g. Japanese language training, boat/taxi/rental car maintenance) by 2006
authorities - possibly the FSM - to identify special industry training needs
11.4. Initiate three year training program covering 2006-2008 across all tourism sectors in all four states
11.4.1. Training schedules for main sub-sectors and designated individuals completed by State Visitor Bureaus and FSM by 2006
11.4.2. Agreement with all State governments on enrollment of participants for training programs and/or for on-site training modules
(See SG 5) 11(vii) Work place orientation
course modules and procedures to be agreed and implemented for all new industry entrants by end-2008
11(viii) Certified training achievements to be formally incorporated into positioning of FSM as a premium tourism destination by 2012 11.5. Design and implement annual
employee certification within all key tourism sector activities and introduce basic qualification requirements as pre-condition of employment by end-2008 throughout the nation.
11.5.1. First certificates of competence issued in 2006 for successful completion of agreed training modules and courses
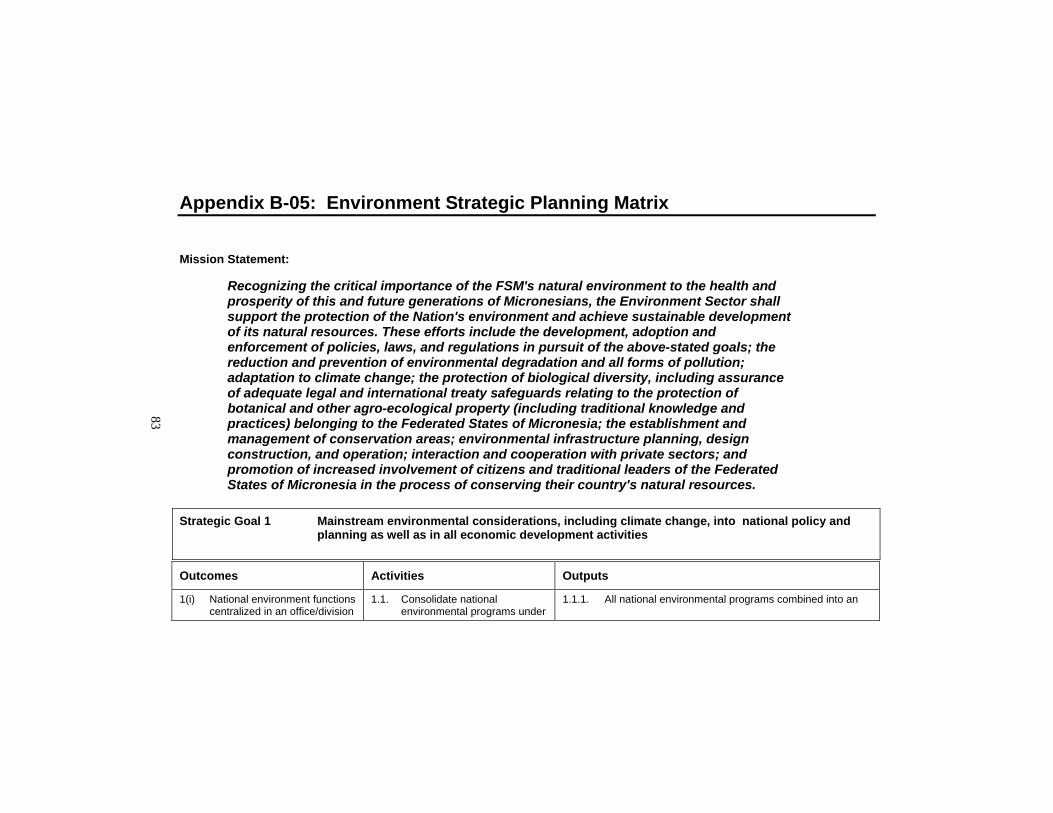
83
Appendix B-05: Environment Strategic Planning Matrix
Mission Statement:
Recognizing the critical importance of the FSM's natural environment to the health and prosperity of this and future generations of Micronesians, the Environment Sector shall support the protection of the Nation's environment and achieve sustainable development of its natural resources. These efforts include the development, adoption and enforcement of policies, laws, and regulations in pursuit of the above-stated goals; the reduction and prevention of environmental degradation and all forms of pollution; adaptation to climate change; the protection of biological diversity, including assurance of adequate legal and international treaty safeguards relating to the protection of botanical and other agro-ecological property (including traditional knowledge and practices) belonging to the Federated States of Micronesia; the establishment and management of conservation areas; environmental infrastructure planning, design construction, and operation; interaction and cooperation with private sectors; and promotion of increased involvement of citizens and traditional leaders of the Federated States of Micronesia in the process of conserving their country's natural resources.
Strategic Goal 1 Mainstream environmental considerations, including climate change, into national policy and planning as well as in all economic development activities
Outcomes Activities Outputs
1(i) National environment functions centralized in an office/division
1.1. Consolidate national environmental programs under
1.1.1. All national environmental programs combined into an
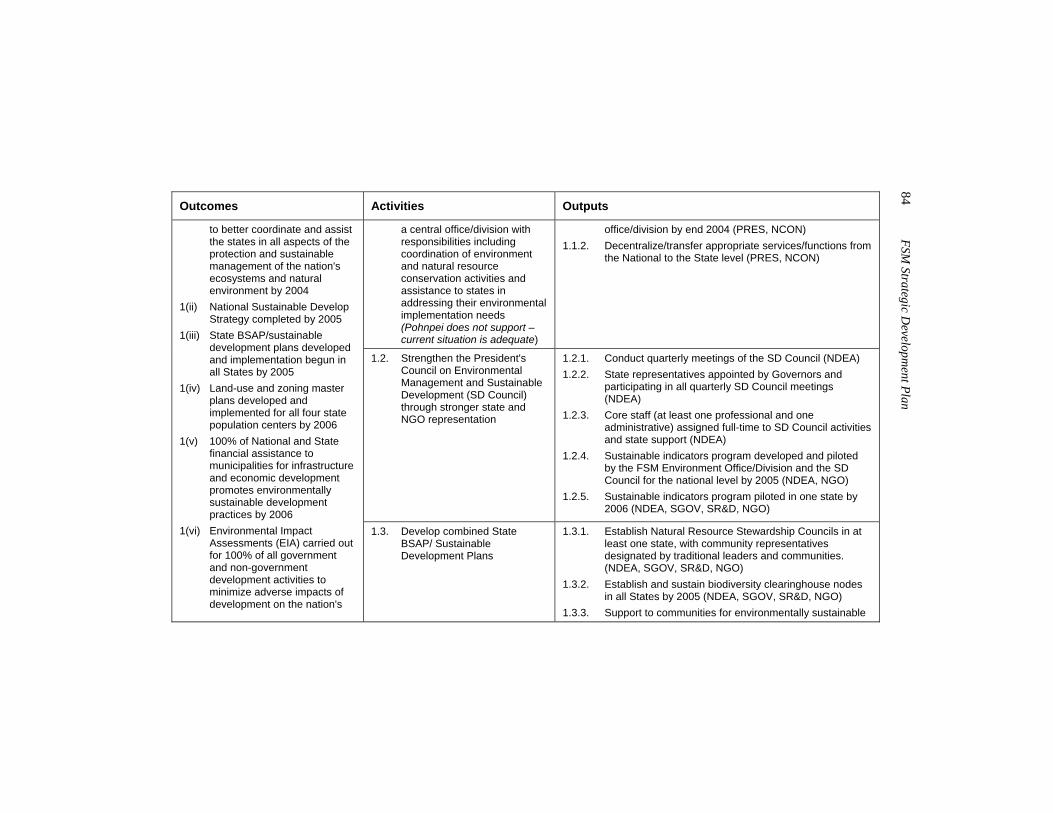
84 FSM
Strategic Developm
ent Plan
Outcomes Activities Outputs
a central office/division with responsibilities including coordination of environment and natural resource conservation activities and assistance to states in addressing their environmental implementation needs (Pohnpei does not support – current situation is adequate)
office/division by end 2004 (PRES, NCON) 1.1.2. Decentralize/transfer appropriate services/functions from
the National to the State level (PRES, NCON)
1.2. Strengthen the President's Council on Environmental Management and Sustainable Development (SD Council) through stronger state and NGO representation
1.2.1. Conduct quarterly meetings of the SD Council (NDEA) 1.2.2. State representatives appointed by Governors and
participating in all quarterly SD Council meetings (NDEA)
1.2.3. Core staff (at least one professional and one administrative) assigned full-time to SD Council activities and state support (NDEA)
1.2.4. Sustainable indicators program developed and piloted by the FSM Environment Office/Division and the SD Council for the national level by 2005 (NDEA, NGO)
1.2.5. Sustainable indicators program piloted in one state by 2006 (NDEA, SGOV, SR&D, NGO)
to better coordinate and assist the states in all aspects of the protection and sustainable management of the nation's ecosystems and natural environment by 2004
1(ii) National Sustainable Develop Strategy completed by 2005
1(iii) State BSAP/sustainable development plans developed and implementation begun in all States by 2005
1(iv) Land-use and zoning master plans developed and implemented for all four state population centers by 2006
1(v) 100% of National and State financial assistance to municipalities for infrastructure and economic development promotes environmentally sustainable development practices by 2006
1(vi) Environmental Impact Assessments (EIA) carried out for 100% of all government and non-government development activities to minimize adverse impacts of development on the nation's
1.3. Develop combined State BSAP/ Sustainable Development Plans
1.3.1. Establish Natural Resource Stewardship Councils in at least one state, with community representatives designated by traditional leaders and communities. (NDEA, SGOV, SR&D, NGO)
1.3.2. Establish and sustain biodiversity clearinghouse nodes in all States by 2005 (NDEA, SGOV, SR&D, NGO)
1.3.3. Support to communities for environmentally sustainable
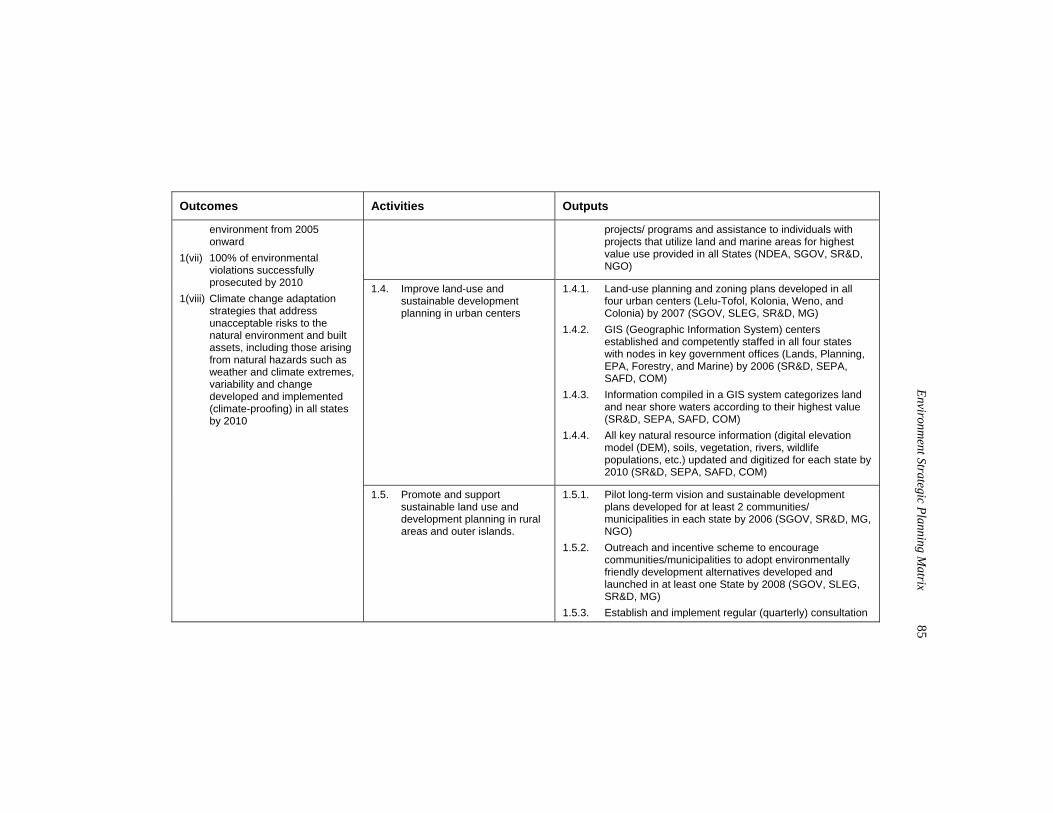
Environm
ent Strategic Planning Matrix
85
Outcomes Activities Outputs
projects/ programs and assistance to individuals with projects that utilize land and marine areas for highest value use provided in all States (NDEA, SGOV, SR&D, NGO)
1.4. Improve land-use and sustainable development planning in urban centers
1.4.1. Land-use planning and zoning plans developed in all four urban centers (Lelu-Tofol, Kolonia, Weno, and Colonia) by 2007 (SGOV, SLEG, SR&D, MG)
1.4.2. GIS (Geographic Information System) centers established and competently staffed in all four states with nodes in key government offices (Lands, Planning, EPA, Forestry, and Marine) by 2006 (SR&D, SEPA, SAFD, COM)
1.4.3. Information compiled in a GIS system categorizes land and near shore waters according to their highest value (SR&D, SEPA, SAFD, COM)
1.4.4. All key natural resource information (digital elevation model (DEM), soils, vegetation, rivers, wildlife populations, etc.) updated and digitized for each state by 2010 (SR&D, SEPA, SAFD, COM)
environment from 2005 onward
1(vii) 100% of environmental violations successfully prosecuted by 2010
1(viii) Climate change adaptation strategies that address unacceptable risks to the natural environment and built assets, including those arising from natural hazards such as weather and climate extremes, variability and change developed and implemented (climate-proofing) in all states by 2010
1.5. Promote and support sustainable land use and development planning in rural areas and outer islands.
1.5.1. Pilot long-term vision and sustainable development plans developed for at least 2 communities/ municipalities in each state by 2006 (SGOV, SR&D, MG, NGO)
1.5.2. Outreach and incentive scheme to encourage communities/municipalities to adopt environmentally friendly development alternatives developed and launched in at least one State by 2008 (SGOV, SLEG, SR&D, MG)
1.5.3. Establish and implement regular (quarterly) consultation
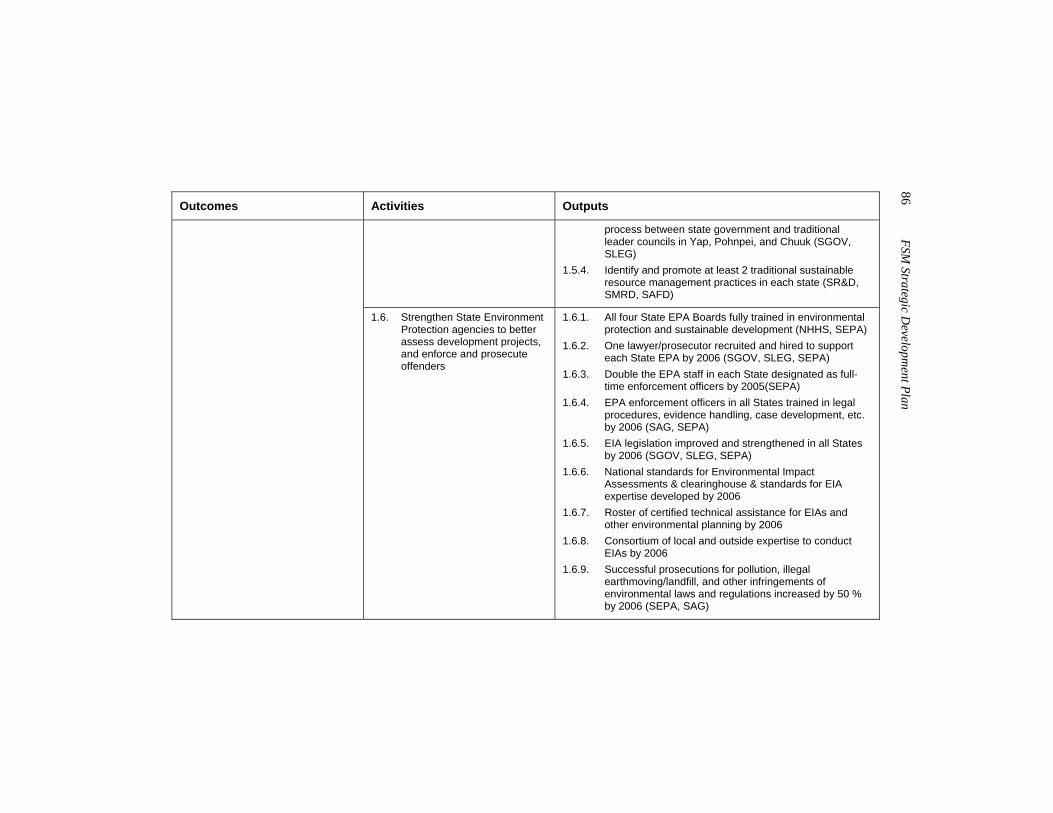
86 FSM
Strategic Developm
ent Plan
Outcomes Activities Outputs
process between state government and traditional leader councils in Yap, Pohnpei, and Chuuk (SGOV, SLEG)
1.5.4. Identify and promote at least 2 traditional sustainable resource management practices in each state (SR&D, SMRD, SAFD)
1.6. Strengthen State Environment Protection agencies to better assess development projects, and enforce and prosecute offenders
1.6.1. All four State EPA Boards fully trained in environmental protection and sustainable development (NHHS, SEPA)
1.6.2. One lawyer/prosecutor recruited and hired to support each State EPA by 2006 (SGOV, SLEG, SEPA)
1.6.3. Double the EPA staff in each State designated as full-time enforcement officers by 2005(SEPA)
1.6.4. EPA enforcement officers in all States trained in legal procedures, evidence handling, case development, etc. by 2006 (SAG, SEPA)
1.6.5. EIA legislation improved and strengthened in all States by 2006 (SGOV, SLEG, SEPA)
1.6.6. National standards for Environmental Impact Assessments & clearinghouse & standards for EIA expertise developed by 2006
1.6.7. Roster of certified technical assistance for EIAs and other environmental planning by 2006
1.6.8. Consortium of local and outside expertise to conduct EIAs by 2006
1.6.9. Successful prosecutions for pollution, illegal earthmoving/landfill, and other infringements of environmental laws and regulations increased by 50 % by 2006 (SEPA, SAG)
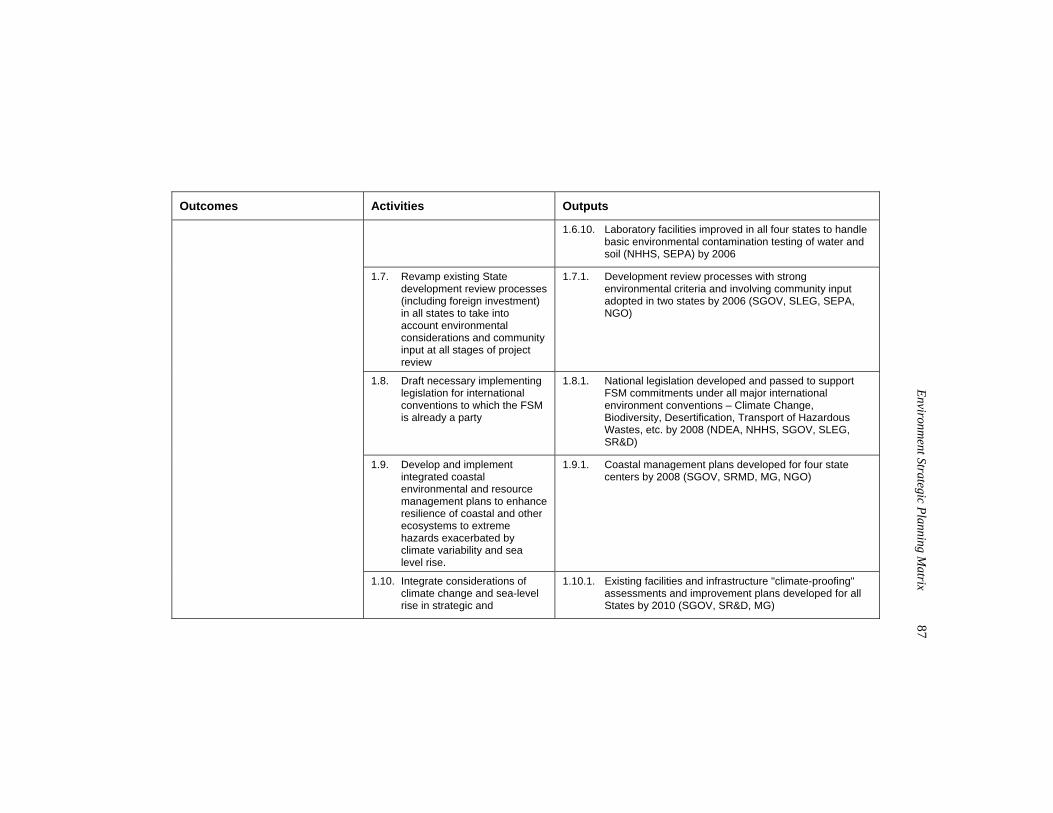
Environm
ent Strategic Planning Matrix
87
Outcomes Activities Outputs
1.6.10. Laboratory facilities improved in all four states to handle basic environmental contamination testing of water and soil (NHHS, SEPA) by 2006
1.7. Revamp existing State development review processes (including foreign investment) in all states to take into account environmental considerations and community input at all stages of project review
1.7.1. Development review processes with strong environmental criteria and involving community input adopted in two states by 2006 (SGOV, SLEG, SEPA, NGO)
1.8. Draft necessary implementing legislation for international conventions to which the FSM is already a party
1.8.1. National legislation developed and passed to support FSM commitments under all major international environment conventions – Climate Change, Biodiversity, Desertification, Transport of Hazardous Wastes, etc. by 2008 (NDEA, NHHS, SGOV, SLEG, SR&D)
1.9. Develop and implement integrated coastal environmental and resource management plans to enhance resilience of coastal and other ecosystems to extreme hazards exacerbated by climate variability and sea level rise.
1.9.1. Coastal management plans developed for four state centers by 2008 (SGOV, SRMD, MG, NGO)
1.10. Integrate considerations of climate change and sea-level rise in strategic and
1.10.1. Existing facilities and infrastructure "climate-proofing" assessments and improvement plans developed for all States by 2010 (SGOV, SR&D, MG)
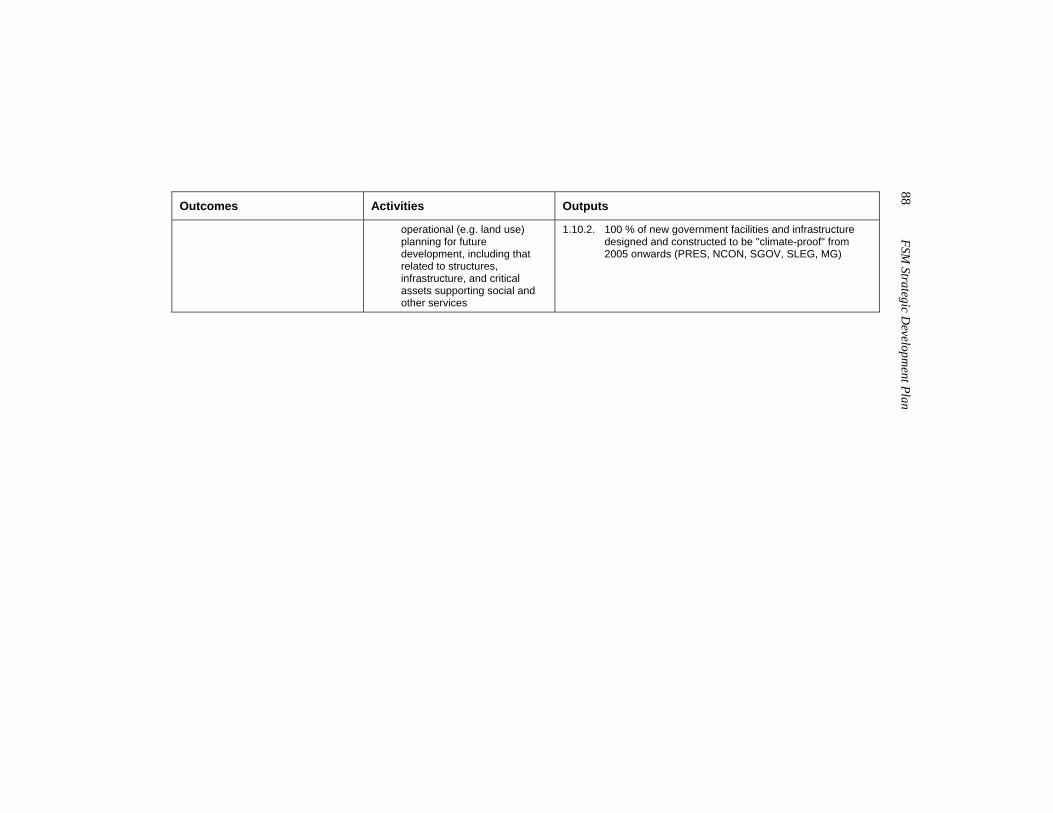
88 FSM
Strategic Developm
ent Plan
Outcomes Activities Outputs
operational (e.g. land use) planning for future development, including that related to structures, infrastructure, and critical assets supporting social and other services
1.10.2. 100 % of new government facilities and infrastructure designed and constructed to be "climate-proof" from 2005 onwards (PRES, NCON, SGOV, SLEG, MG)
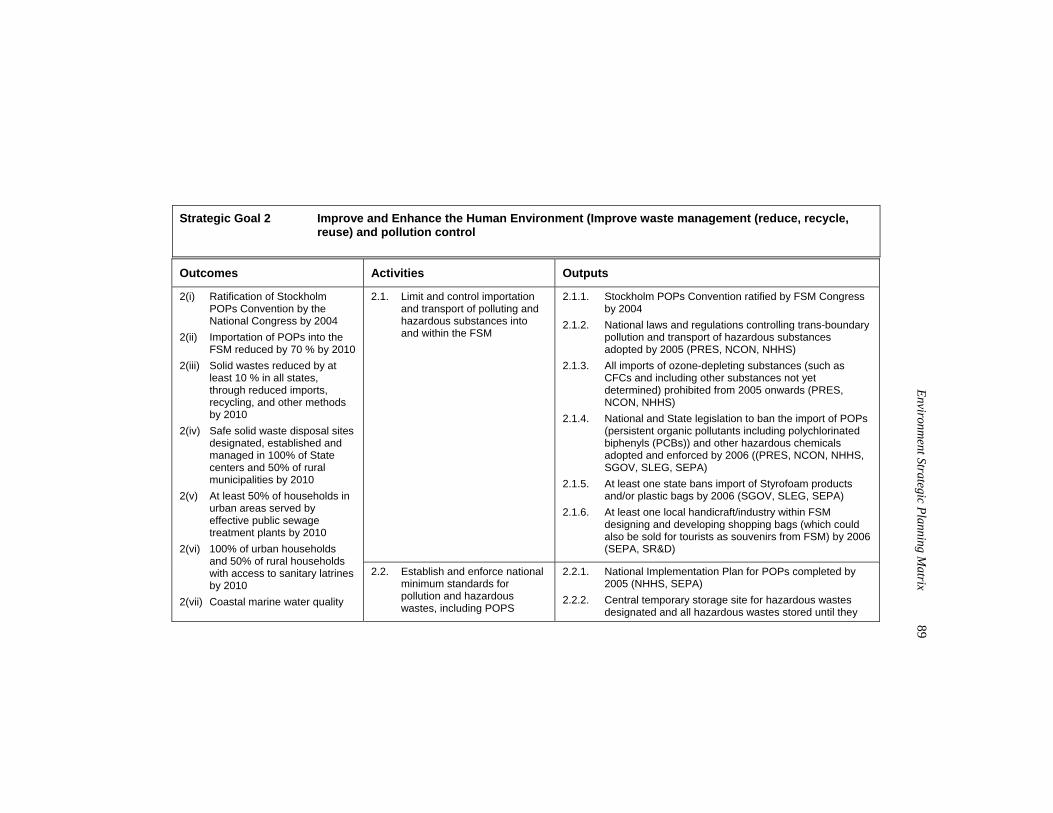
Environm
ent Strategic Planning Matrix
89
Strategic Goal 2 Improve and Enhance the Human Environment (Improve waste management (reduce, recycle,
reuse) and pollution control Outcomes Activities Outputs
2.1. Limit and control importation and transport of polluting and hazardous substances into and within the FSM
2.1.1. Stockholm POPs Convention ratified by FSM Congress by 2004
2.1.2. National laws and regulations controlling trans-boundary pollution and transport of hazardous substances adopted by 2005 (PRES, NCON, NHHS)
2.1.3. All imports of ozone-depleting substances (such as CFCs and including other substances not yet determined) prohibited from 2005 onwards (PRES, NCON, NHHS)
2.1.4. National and State legislation to ban the import of POPs (persistent organic pollutants including polychlorinated biphenyls (PCBs)) and other hazardous chemicals adopted and enforced by 2006 ((PRES, NCON, NHHS, SGOV, SLEG, SEPA)
2.1.5. At least one state bans import of Styrofoam products and/or plastic bags by 2006 (SGOV, SLEG, SEPA)
2.1.6. At least one local handicraft/industry within FSM designing and developing shopping bags (which could also be sold for tourists as souvenirs from FSM) by 2006 (SEPA, SR&D)
2(i) Ratification of Stockholm POPs Convention by the National Congress by 2004
2(ii) Importation of POPs into the FSM reduced by 70 % by 2010
2(iii) Solid wastes reduced by at least 10 % in all states, through reduced imports, recycling, and other methods by 2010
2(iv) Safe solid waste disposal sites designated, established and managed in 100% of State centers and 50% of rural municipalities by 2010
2(v) At least 50% of households in urban areas served by effective public sewage treatment plants by 2010
2(vi) 100% of urban households and 50% of rural households with access to sanitary latrines by 2010
2(vii) Coastal marine water quality
2.2. Establish and enforce national minimum standards for pollution and hazardous wastes, including POPS
2.2.1. National Implementation Plan for POPs completed by 2005 (NHHS, SEPA)
2.2.2. Central temporary storage site for hazardous wastes designated and all hazardous wastes stored until they
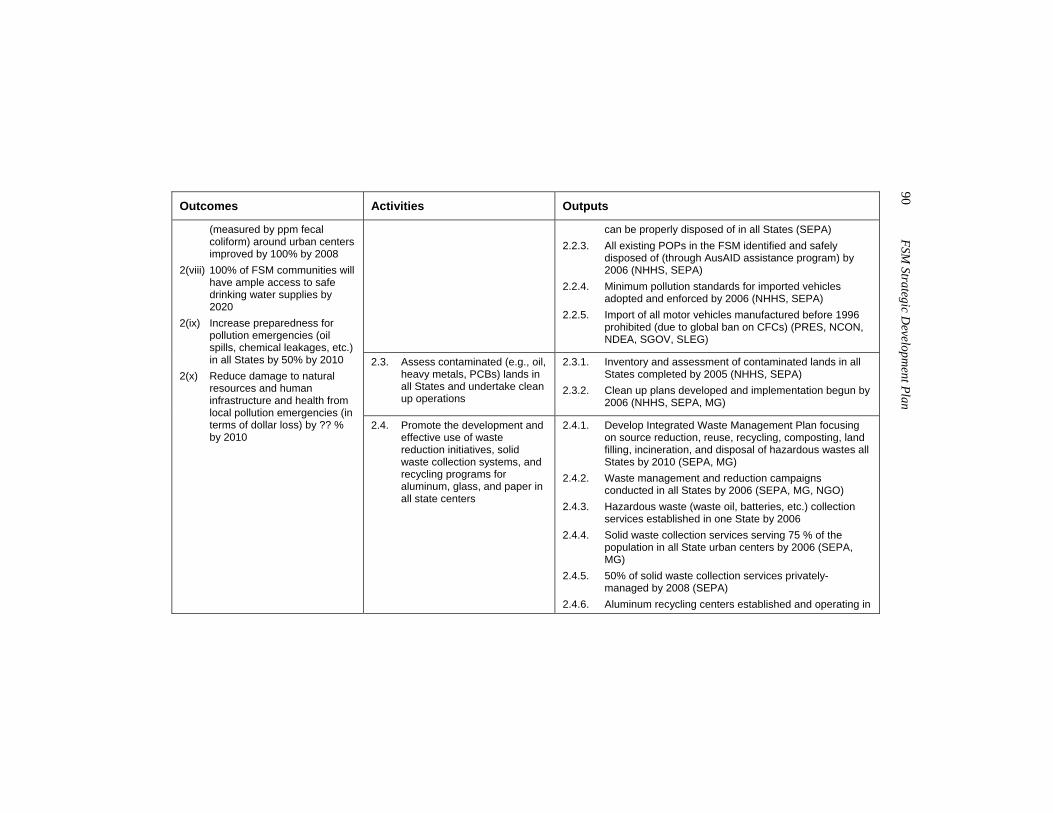
90 FSM
Strategic Developm
ent Plan
Outcomes Activities Outputs
can be properly disposed of in all States (SEPA) 2.2.3. All existing POPs in the FSM identified and safely
disposed of (through AusAID assistance program) by 2006 (NHHS, SEPA)
2.2.4. Minimum pollution standards for imported vehicles adopted and enforced by 2006 (NHHS, SEPA)
2.2.5. Import of all motor vehicles manufactured before 1996 prohibited (due to global ban on CFCs) (PRES, NCON, NDEA, SGOV, SLEG)
2.3. Assess contaminated (e.g., oil, heavy metals, PCBs) lands in all States and undertake clean up operations
2.3.1. Inventory and assessment of contaminated lands in all States completed by 2005 (NHHS, SEPA)
2.3.2. Clean up plans developed and implementation begun by 2006 (NHHS, SEPA, MG)
(measured by ppm fecal coliform) around urban centers improved by 100% by 2008
2(viii) 100% of FSM communities will have ample access to safe drinking water supplies by 2020
2(ix) Increase preparedness for pollution emergencies (oil spills, chemical leakages, etc.) in all States by 50% by 2010
2(x) Reduce damage to natural resources and human infrastructure and health from local pollution emergencies (in terms of dollar loss) by ?? % by 2010
2.4. Promote the development and effective use of waste reduction initiatives, solid waste collection systems, and recycling programs for aluminum, glass, and paper in all state centers
2.4.1. Develop Integrated Waste Management Plan focusing on source reduction, reuse, recycling, composting, land filling, incineration, and disposal of hazardous wastes all States by 2010 (SEPA, MG)
2.4.2. Waste management and reduction campaigns conducted in all States by 2006 (SEPA, MG, NGO)
2.4.3. Hazardous waste (waste oil, batteries, etc.) collection services established in one State by 2006
2.4.4. Solid waste collection services serving 75 % of the population in all State urban centers by 2006 (SEPA, MG)
2.4.5. 50% of solid waste collection services privately-managed by 2008 (SEPA)
2.4.6. Aluminum recycling centers established and operating in
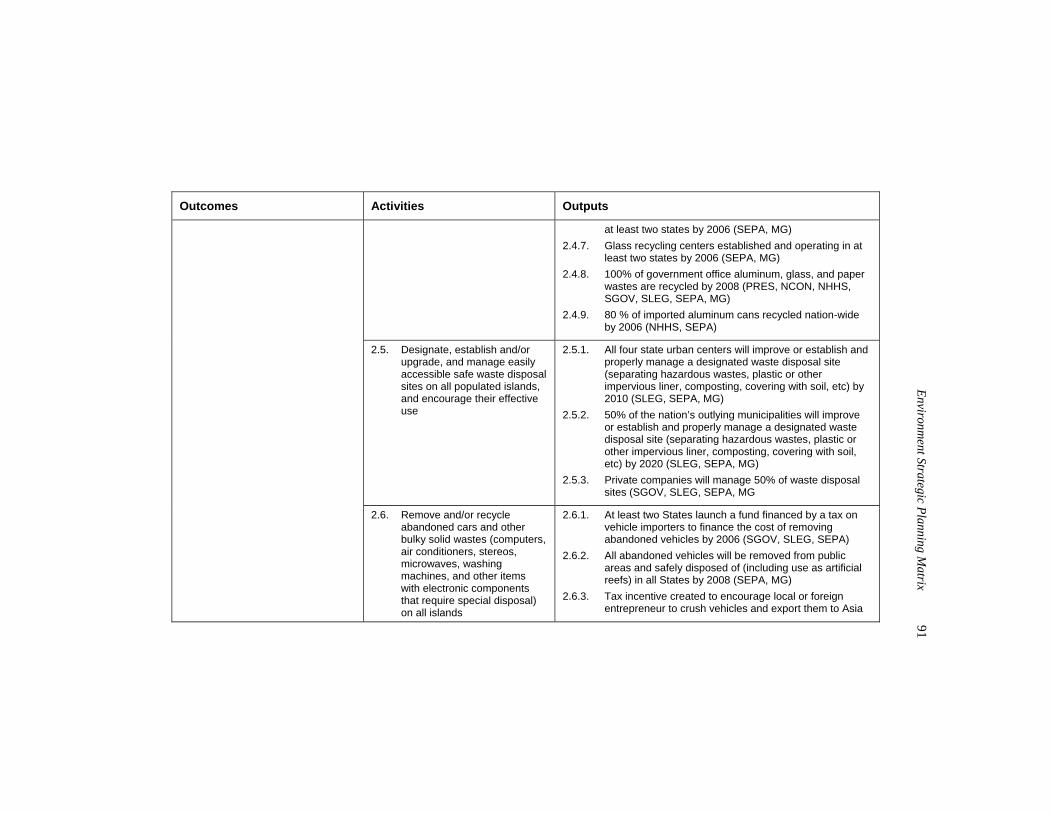
Environm
ent Strategic Planning Matrix
91
Outcomes Activities Outputs
at least two states by 2006 (SEPA, MG) 2.4.7. Glass recycling centers established and operating in at
least two states by 2006 (SEPA, MG) 2.4.8. 100% of government office aluminum, glass, and paper
wastes are recycled by 2008 (PRES, NCON, NHHS, SGOV, SLEG, SEPA, MG)
2.4.9. 80 % of imported aluminum cans recycled nation-wide by 2006 (NHHS, SEPA)
2.5. Designate, establish and/or upgrade, and manage easily accessible safe waste disposal sites on all populated islands, and encourage their effective use
2.5.1. All four state urban centers will improve or establish and properly manage a designated waste disposal site (separating hazardous wastes, plastic or other impervious liner, composting, covering with soil, etc) by 2010 (SLEG, SEPA, MG)
2.5.2. 50% of the nation’s outlying municipalities will improve or establish and properly manage a designated waste disposal site (separating hazardous wastes, plastic or other impervious liner, composting, covering with soil, etc) by 2020 (SLEG, SEPA, MG)
2.5.3. Private companies will manage 50% of waste disposal sites (SGOV, SLEG, SEPA, MG
2.6. Remove and/or recycle abandoned cars and other bulky solid wastes (computers, air conditioners, stereos, microwaves, washing machines, and other items with electronic components that require special disposal) on all islands
2.6.1. At least two States launch a fund financed by a tax on vehicle importers to finance the cost of removing abandoned vehicles by 2006 (SGOV, SLEG, SEPA)
2.6.2. All abandoned vehicles will be removed from public areas and safely disposed of (including use as artificial reefs) in all States by 2008 (SEPA, MG)
2.6.3. Tax incentive created to encourage local or foreign entrepreneur to crush vehicles and export them to Asia
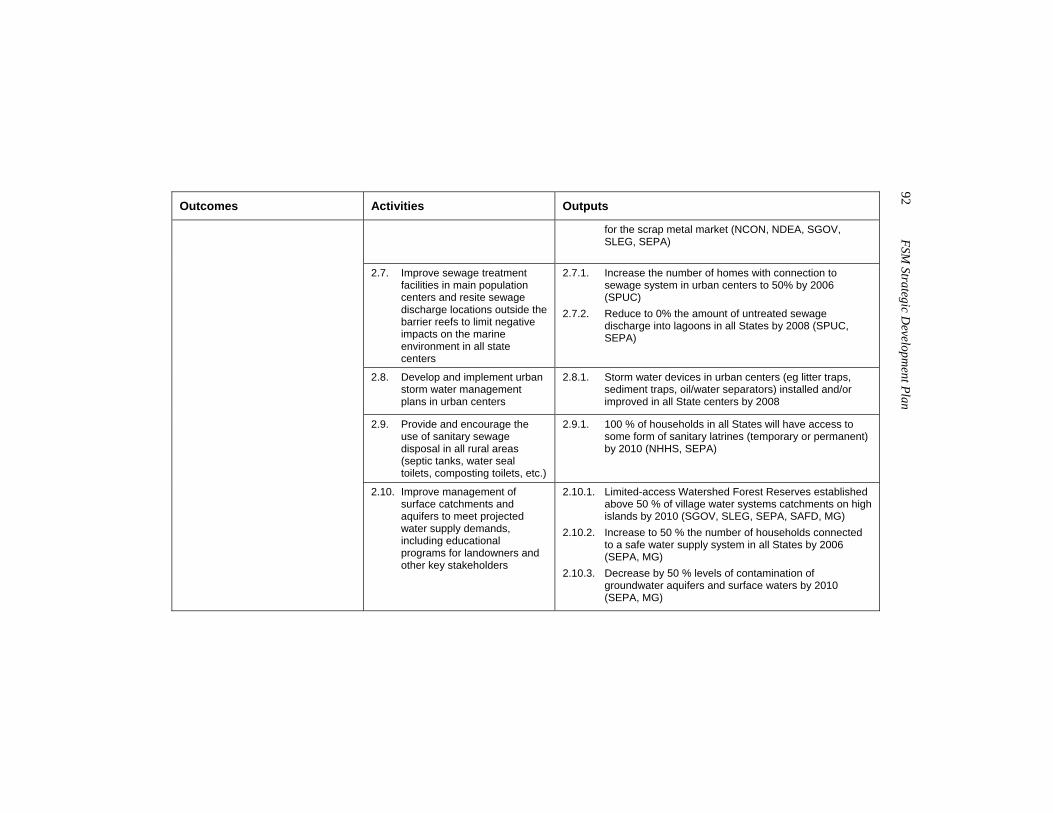
92 FSM
Strategic Developm
ent Plan
Outcomes Activities Outputs
for the scrap metal market (NCON, NDEA, SGOV, SLEG, SEPA)
2.7. Improve sewage treatment facilities in main population centers and resite sewage discharge locations outside the barrier reefs to limit negative impacts on the marine environment in all state centers
2.7.1. Increase the number of homes with connection to sewage system in urban centers to 50% by 2006 (SPUC)
2.7.2. Reduce to 0% the amount of untreated sewage discharge into lagoons in all States by 2008 (SPUC, SEPA)
2.8. Develop and implement urban storm water management plans in urban centers
2.8.1. Storm water devices in urban centers (eg litter traps, sediment traps, oil/water separators) installed and/or improved in all State centers by 2008
2.9. Provide and encourage the use of sanitary sewage disposal in all rural areas (septic tanks, water seal toilets, composting toilets, etc.)
2.9.1. 100 % of households in all States will have access to some form of sanitary latrines (temporary or permanent) by 2010 (NHHS, SEPA)
2.10. Improve management of surface catchments and aquifers to meet projected water supply demands, including educational programs for landowners and other key stakeholders
2.10.1. Limited-access Watershed Forest Reserves established above 50 % of village water systems catchments on high islands by 2010 (SGOV, SLEG, SEPA, SAFD, MG)
2.10.2. Increase to 50 % the number of households connected to a safe water supply system in all States by 2006 (SEPA, MG)
2.10.3. Decrease by 50 % levels of contamination of groundwater aquifers and surface waters by 2010 (SEPA, MG)
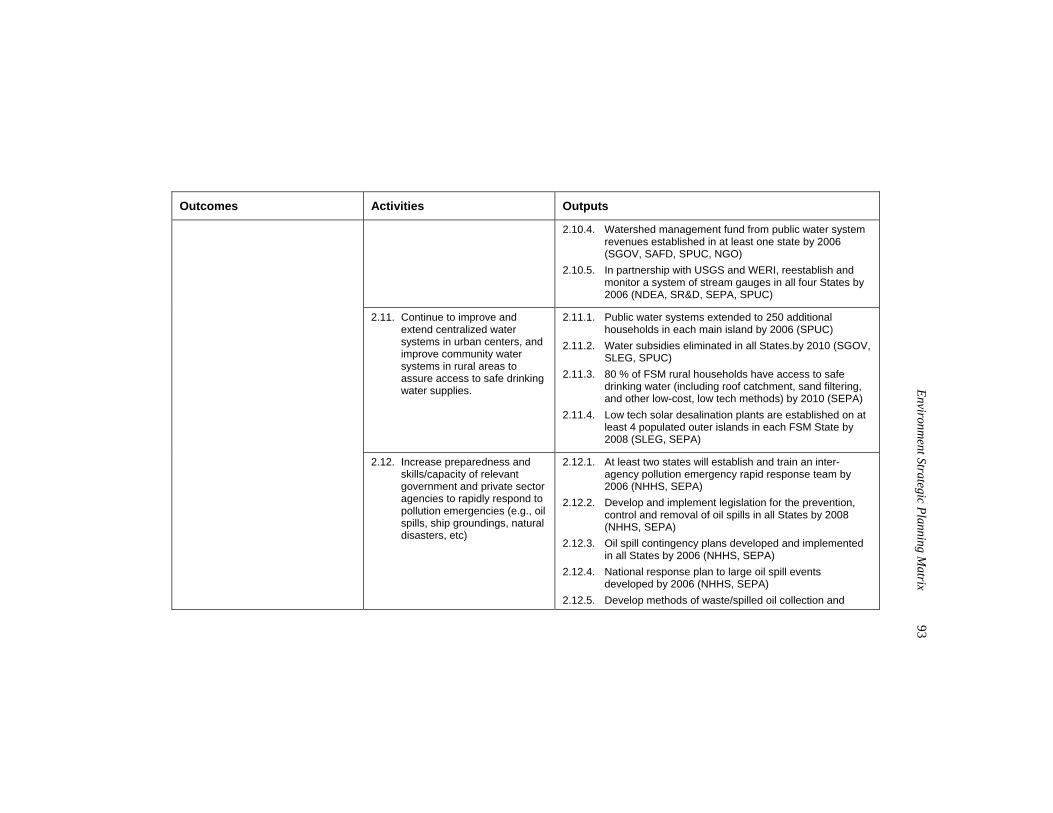
Environm
ent Strategic Planning Matrix
93
Outcomes Activities Outputs
2.10.4. Watershed management fund from public water system revenues established in at least one state by 2006 (SGOV, SAFD, SPUC, NGO)
2.10.5. In partnership with USGS and WERI, reestablish and monitor a system of stream gauges in all four States by 2006 (NDEA, SR&D, SEPA, SPUC)
2.11. Continue to improve and extend centralized water systems in urban centers, and improve community water systems in rural areas to assure access to safe drinking water supplies.
2.11.1. Public water systems extended to 250 additional households in each main island by 2006 (SPUC)
2.11.2. Water subsidies eliminated in all States.by 2010 (SGOV, SLEG, SPUC)
2.11.3. 80 % of FSM rural households have access to safe drinking water (including roof catchment, sand filtering, and other low-cost, low tech methods) by 2010 (SEPA)
2.11.4. Low tech solar desalination plants are established on at least 4 populated outer islands in each FSM State by 2008 (SLEG, SEPA)
2.12. Increase preparedness and skills/capacity of relevant government and private sector agencies to rapidly respond to pollution emergencies (e.g., oil spills, ship groundings, natural disasters, etc)
2.12.1. At least two states will establish and train an inter-agency pollution emergency rapid response team by 2006 (NHHS, SEPA)
2.12.2. Develop and implement legislation for the prevention, control and removal of oil spills in all States by 2008 (NHHS, SEPA)
2.12.3. Oil spill contingency plans developed and implemented in all States by 2006 (NHHS, SEPA)
2.12.4. National response plan to large oil spill events developed by 2006 (NHHS, SEPA)
2.12.5. Develop methods of waste/spilled oil collection and
94 FSM
Strategic Developm
ent Plan
Outcomes Activities Outputs
disposal in all States by 2008 (NHHS, SEPA)
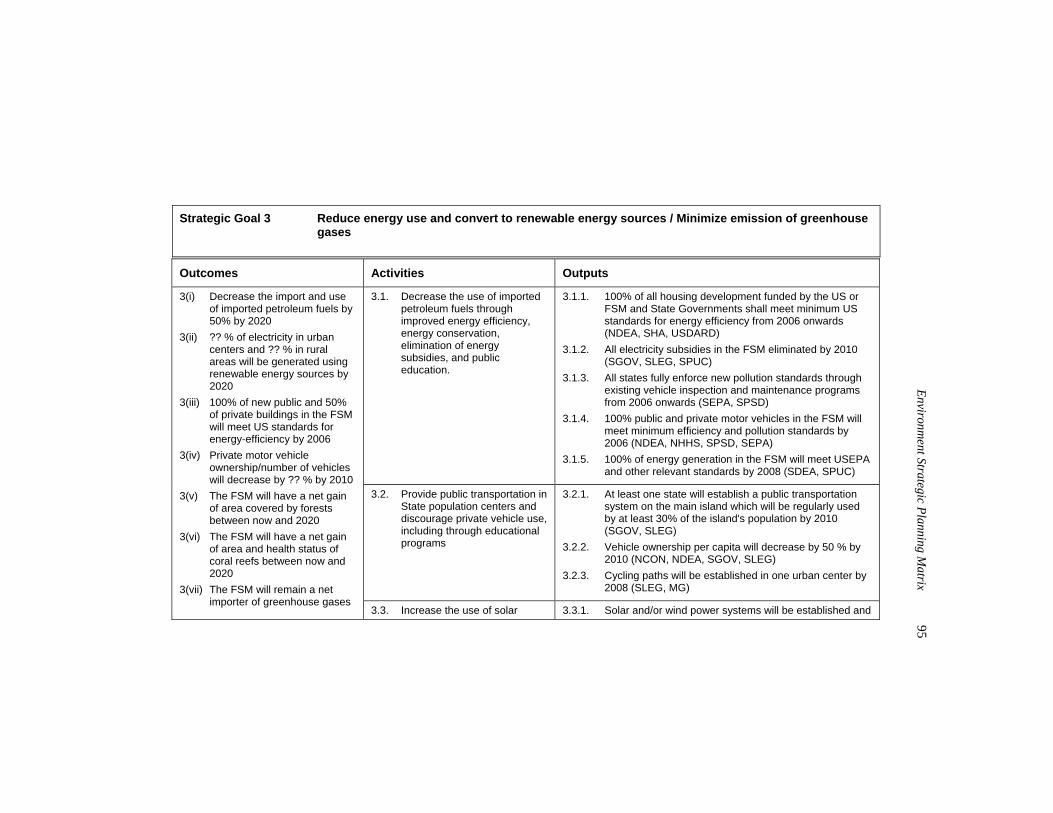
Environm
ent Strategic Planning Matrix
95
Strategic Goal 3 Reduce energy use and convert to renewable energy sources / Minimize emission of greenhouse
gases Outcomes Activities Outputs
3.1. Decrease the use of imported petroleum fuels through improved energy efficiency, energy conservation, elimination of energy subsidies, and public education.
3.1.1. 100% of all housing development funded by the US or FSM and State Governments shall meet minimum US standards for energy efficiency from 2006 onwards (NDEA, SHA, USDARD)
3.1.2. All electricity subsidies in the FSM eliminated by 2010 (SGOV, SLEG, SPUC)
3.1.3. All states fully enforce new pollution standards through existing vehicle inspection and maintenance programs from 2006 onwards (SEPA, SPSD)
3.1.4. 100% public and private motor vehicles in the FSM will meet minimum efficiency and pollution standards by 2006 (NDEA, NHHS, SPSD, SEPA)
3.1.5. 100% of energy generation in the FSM will meet USEPA and other relevant standards by 2008 (SDEA, SPUC)
3.2. Provide public transportation in State population centers and discourage private vehicle use, including through educational programs
3.2.1. At least one state will establish a public transportation system on the main island which will be regularly used by at least 30% of the island's population by 2010 (SGOV, SLEG)
3.2.2. Vehicle ownership per capita will decrease by 50 % by 2010 (NCON, NDEA, SGOV, SLEG)
3.2.3. Cycling paths will be established in one urban center by 2008 (SLEG, MG)
3(i) Decrease the import and use of imported petroleum fuels by 50% by 2020
3(ii) ?? % of electricity in urban centers and ?? % in rural areas will be generated using renewable energy sources by 2020
3(iii) 100% of new public and 50% of private buildings in the FSM will meet US standards for energy-efficiency by 2006
3(iv) Private motor vehicle ownership/number of vehicles will decrease by ?? % by 2010
3(v) The FSM will have a net gain of area covered by forests between now and 2020
3(vi) The FSM will have a net gain of area and health status of coral reefs between now and 2020
3(vii) The FSM will remain a net importer of greenhouse gases
3.3. Increase the use of solar 3.3.1. Solar and/or wind power systems will be established and
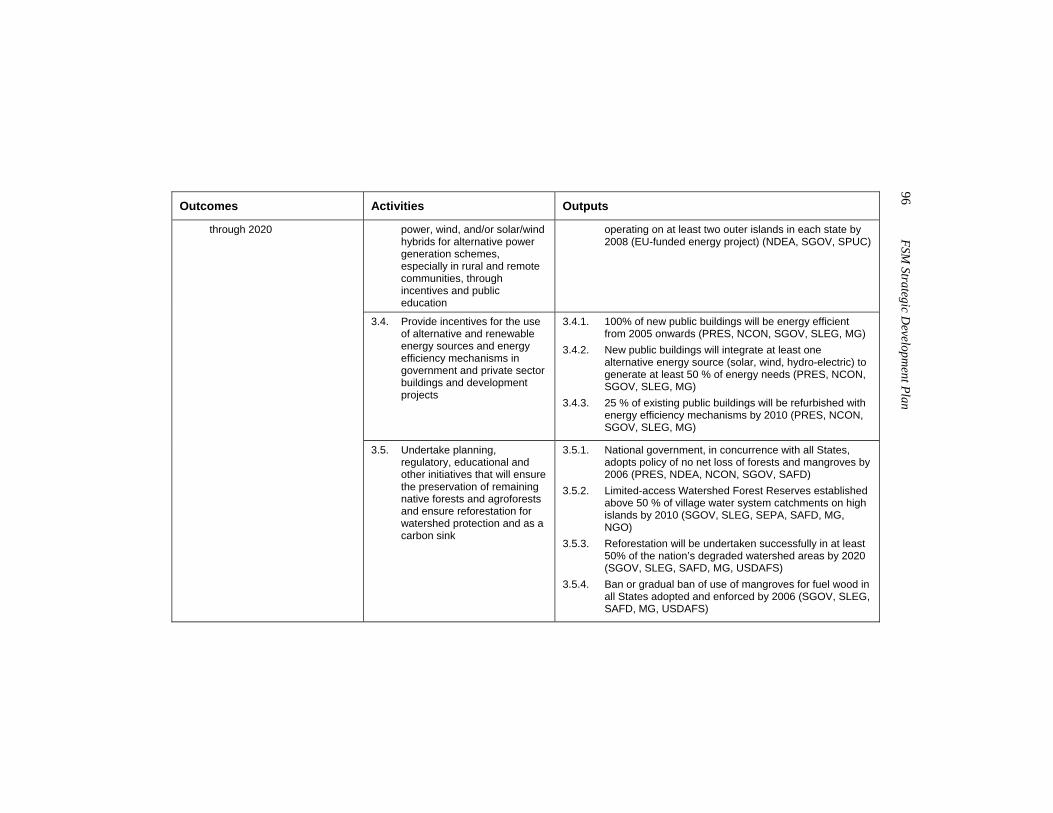
96 FSM
Strategic Developm
ent Plan
Outcomes Activities Outputs
power, wind, and/or solar/wind hybrids for alternative power generation schemes, especially in rural and remote communities, through incentives and public education
operating on at least two outer islands in each state by 2008 (EU-funded energy project) (NDEA, SGOV, SPUC)
3.4. Provide incentives for the use of alternative and renewable energy sources and energy efficiency mechanisms in government and private sector buildings and development projects
3.4.1. 100% of new public buildings will be energy efficient from 2005 onwards (PRES, NCON, SGOV, SLEG, MG)
3.4.2. New public buildings will integrate at least one alternative energy source (solar, wind, hydro-electric) to generate at least 50 % of energy needs (PRES, NCON, SGOV, SLEG, MG)
3.4.3. 25 % of existing public buildings will be refurbished with energy efficiency mechanisms by 2010 (PRES, NCON, SGOV, SLEG, MG)
through 2020
3.5. Undertake planning, regulatory, educational and other initiatives that will ensure the preservation of remaining native forests and agroforests and ensure reforestation for watershed protection and as a carbon sink
3.5.1. National government, in concurrence with all States, adopts policy of no net loss of forests and mangroves by 2006 (PRES, NDEA, NCON, SGOV, SAFD)
3.5.2. Limited-access Watershed Forest Reserves established above 50 % of village water system catchments on high islands by 2010 (SGOV, SLEG, SEPA, SAFD, MG, NGO)
3.5.3. Reforestation will be undertaken successfully in at least 50% of the nation’s degraded watershed areas by 2020 (SGOV, SLEG, SAFD, MG, USDAFS)
3.5.4. Ban or gradual ban of use of mangroves for fuel wood in all States adopted and enforced by 2006 (SGOV, SLEG, SAFD, MG, USDAFS)
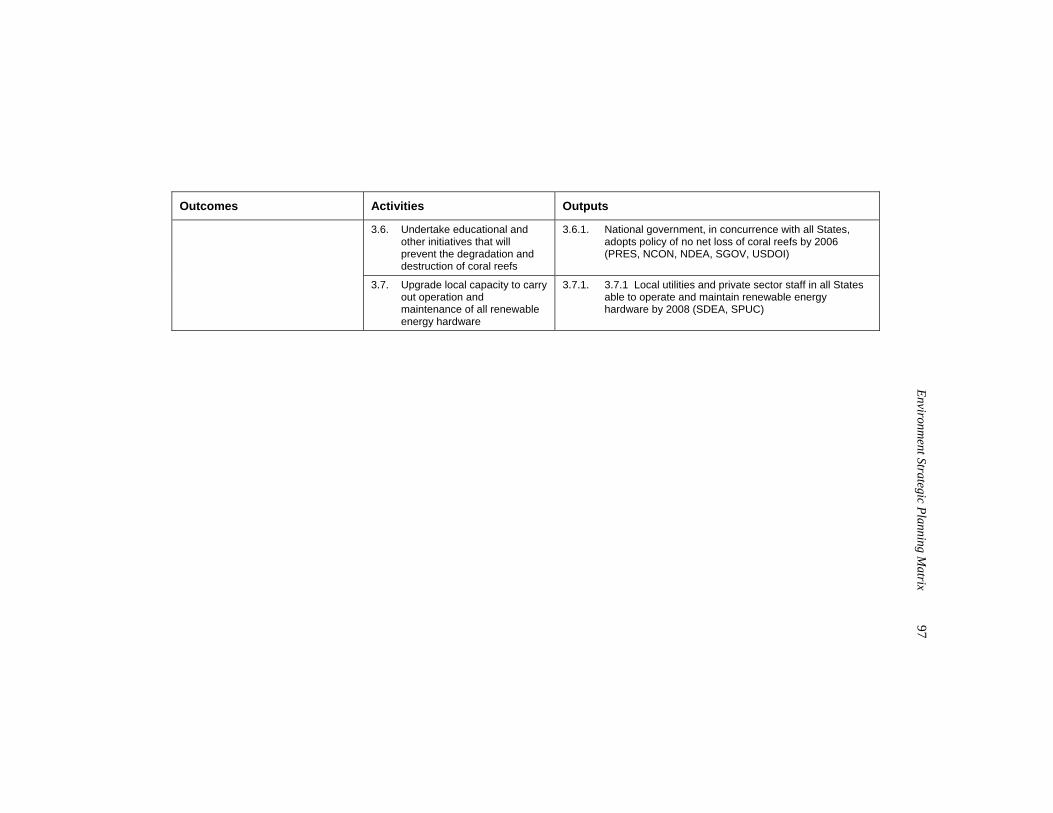
Environm
ent Strategic Planning Matrix
97
Outcomes Activities Outputs
3.6. Undertake educational and other initiatives that will prevent the degradation and destruction of coral reefs
3.6.1. National government, in concurrence with all States, adopts policy of no net loss of coral reefs by 2006 (PRES, NCON, NDEA, SGOV, USDOI)
3.7. Upgrade local capacity to carry out operation and maintenance of all renewable energy hardware
3.7.1. 3.7.1 Local utilities and private sector staff in all States able to operate and maintain renewable energy hardware by 2008 (SDEA, SPUC)
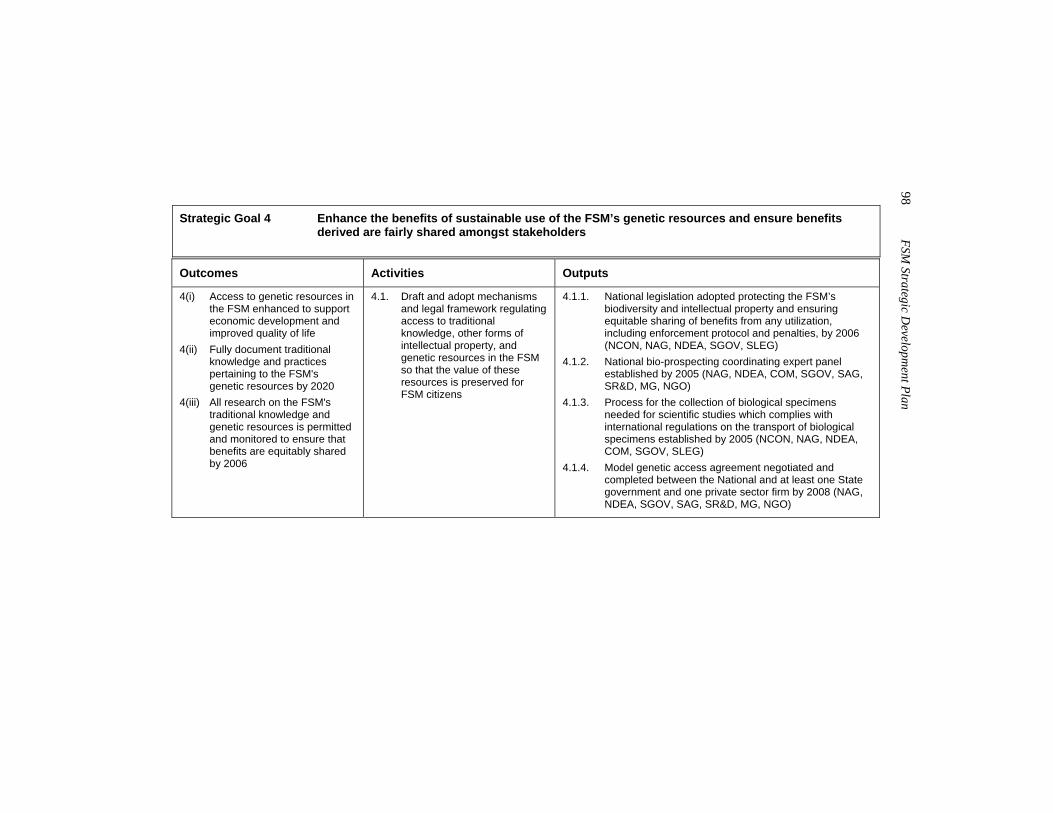
98 FSM
Strategic Developm
ent Plan
Strategic Goal 4 Enhance the benefits of sustainable use of the FSM’s genetic resources and ensure benefits
derived are fairly shared amongst stakeholders Outcomes Activities Outputs
4(i) Access to genetic resources in the FSM enhanced to support economic development and improved quality of life
4(ii) Fully document traditional knowledge and practices pertaining to the FSM's genetic resources by 2020
4(iii) All research on the FSM's traditional knowledge and genetic resources is permitted and monitored to ensure that benefits are equitably shared by 2006
4.1. Draft and adopt mechanisms and legal framework regulating access to traditional knowledge, other forms of intellectual property, and genetic resources in the FSM so that the value of these resources is preserved for FSM citizens
4.1.1. National legislation adopted protecting the FSM’s biodiversity and intellectual property and ensuring equitable sharing of benefits from any utilization, including enforcement protocol and penalties, by 2006 (NCON, NAG, NDEA, SGOV, SLEG)
4.1.2. National bio-prospecting coordinating expert panel established by 2005 (NAG, NDEA, COM, SGOV, SAG, SR&D, MG, NGO)
4.1.3. Process for the collection of biological specimens needed for scientific studies which complies with international regulations on the transport of biological specimens established by 2005 (NCON, NAG, NDEA, COM, SGOV, SLEG)
4.1.4. Model genetic access agreement negotiated and completed between the National and at least one State government and one private sector firm by 2008 (NAG, NDEA, SGOV, SAG, SR&D, MG, NGO)
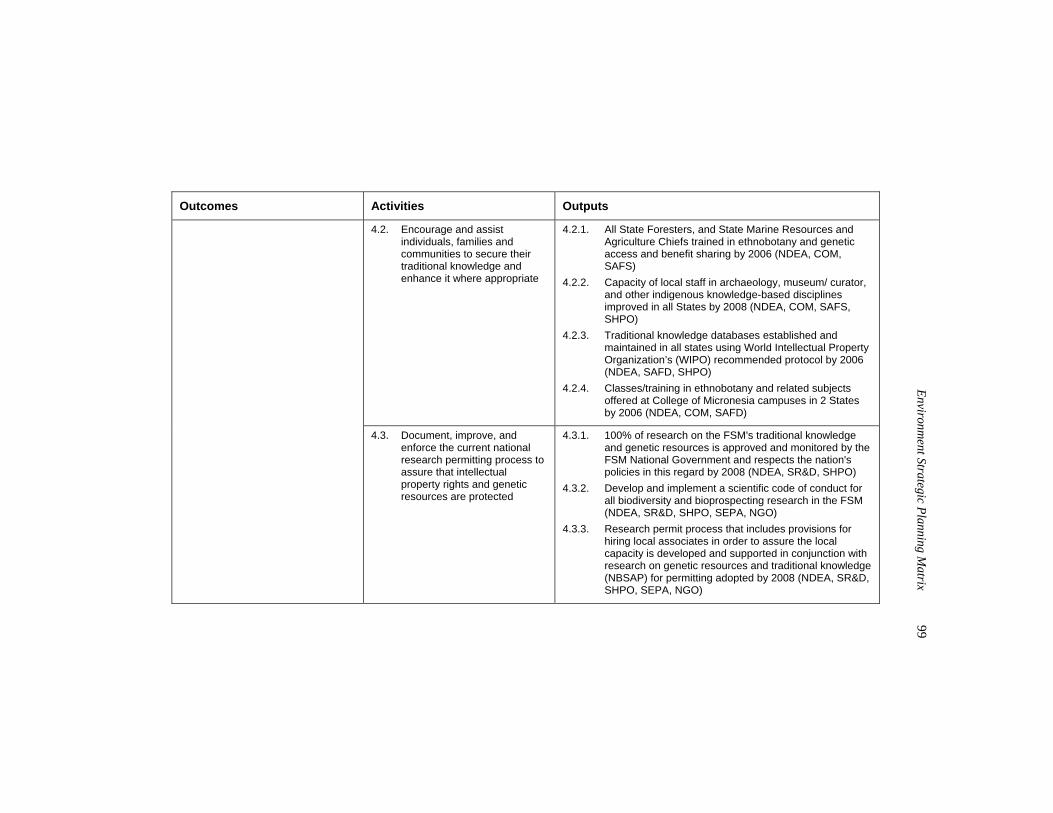
Environm
ent Strategic Planning Matrix
99
Outcomes Activities Outputs
4.2. Encourage and assist individuals, families and communities to secure their traditional knowledge and enhance it where appropriate
4.2.1. All State Foresters, and State Marine Resources and Agriculture Chiefs trained in ethnobotany and genetic access and benefit sharing by 2006 (NDEA, COM, SAFS)
4.2.2. Capacity of local staff in archaeology, museum/ curator, and other indigenous knowledge-based disciplines improved in all States by 2008 (NDEA, COM, SAFS, SHPO)
4.2.3. Traditional knowledge databases established and maintained in all states using World Intellectual Property Organization’s (WIPO) recommended protocol by 2006 (NDEA, SAFD, SHPO)
4.2.4. Classes/training in ethnobotany and related subjects offered at College of Micronesia campuses in 2 States by 2006 (NDEA, COM, SAFD)
4.3. Document, improve, and enforce the current national research permitting process to assure that intellectual property rights and genetic resources are protected
4.3.1. 100% of research on the FSM's traditional knowledge and genetic resources is approved and monitored by the FSM National Government and respects the nation's policies in this regard by 2008 (NDEA, SR&D, SHPO)
4.3.2. Develop and implement a scientific code of conduct for all biodiversity and bioprospecting research in the FSM (NDEA, SR&D, SHPO, SEPA, NGO)
4.3.3. Research permit process that includes provisions for hiring local associates in order to assure the local capacity is developed and supported in conjunction with research on genetic resources and traditional knowledge (NBSAP) for permitting adopted by 2008 (NDEA, SR&D, SHPO, SEPA, NGO)
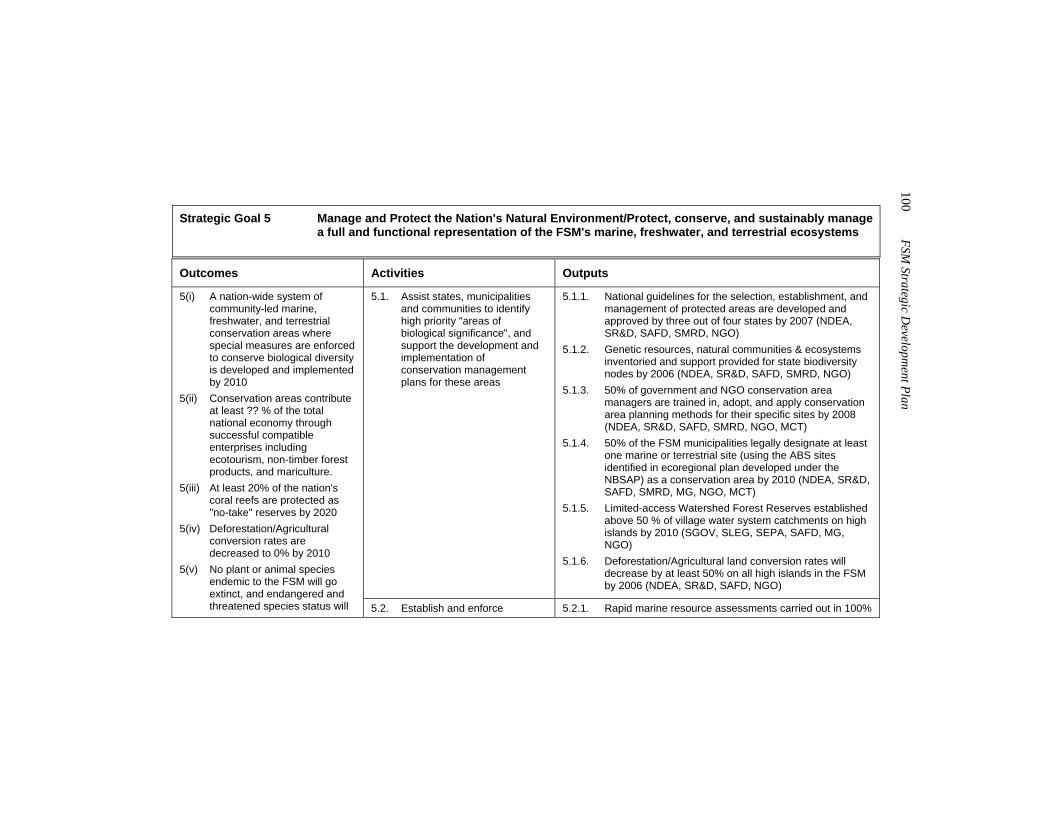
100 FSM
Strategic Developm
ent Plan
Strategic Goal 5 Manage and Protect the Nation's Natural Environment/Protect, conserve, and sustainably manage
a full and functional representation of the FSM's marine, freshwater, and terrestrial ecosystems Outcomes Activities Outputs
5.1. Assist states, municipalities and communities to identify high priority "areas of biological significance", and support the development and implementation of conservation management plans for these areas
5.1.1. National guidelines for the selection, establishment, and management of protected areas are developed and approved by three out of four states by 2007 (NDEA, SR&D, SAFD, SMRD, NGO)
5.1.2. Genetic resources, natural communities & ecosystems inventoried and support provided for state biodiversity nodes by 2006 (NDEA, SR&D, SAFD, SMRD, NGO)
5.1.3. 50% of government and NGO conservation area managers are trained in, adopt, and apply conservation area planning methods for their specific sites by 2008 (NDEA, SR&D, SAFD, SMRD, NGO, MCT)
5.1.4. 50% of the FSM municipalities legally designate at least one marine or terrestrial site (using the ABS sites identified in ecoregional plan developed under the NBSAP) as a conservation area by 2010 (NDEA, SR&D, SAFD, SMRD, MG, NGO, MCT)
5.1.5. Limited-access Watershed Forest Reserves established above 50 % of village water system catchments on high islands by 2010 (SGOV, SLEG, SEPA, SAFD, MG, NGO)
5.1.6. Deforestation/Agricultural land conversion rates will decrease by at least 50% on all high islands in the FSM by 2006 (NDEA, SR&D, SAFD, NGO)
5(i) A nation-wide system of community-led marine, freshwater, and terrestrial conservation areas where special measures are enforced to conserve biological diversity is developed and implemented by 2010
5(ii) Conservation areas contribute at least ?? % of the total national economy through successful compatible enterprises including ecotourism, non-timber forest products, and mariculture.
5(iii) At least 20% of the nation's coral reefs are protected as "no-take" reserves by 2020
5(iv) Deforestation/Agricultural conversion rates are decreased to 0% by 2010
5(v) No plant or animal species endemic to the FSM will go extinct, and endangered and threatened species status will 5.2. Establish and enforce 5.2.1. Rapid marine resource assessments carried out in 100%
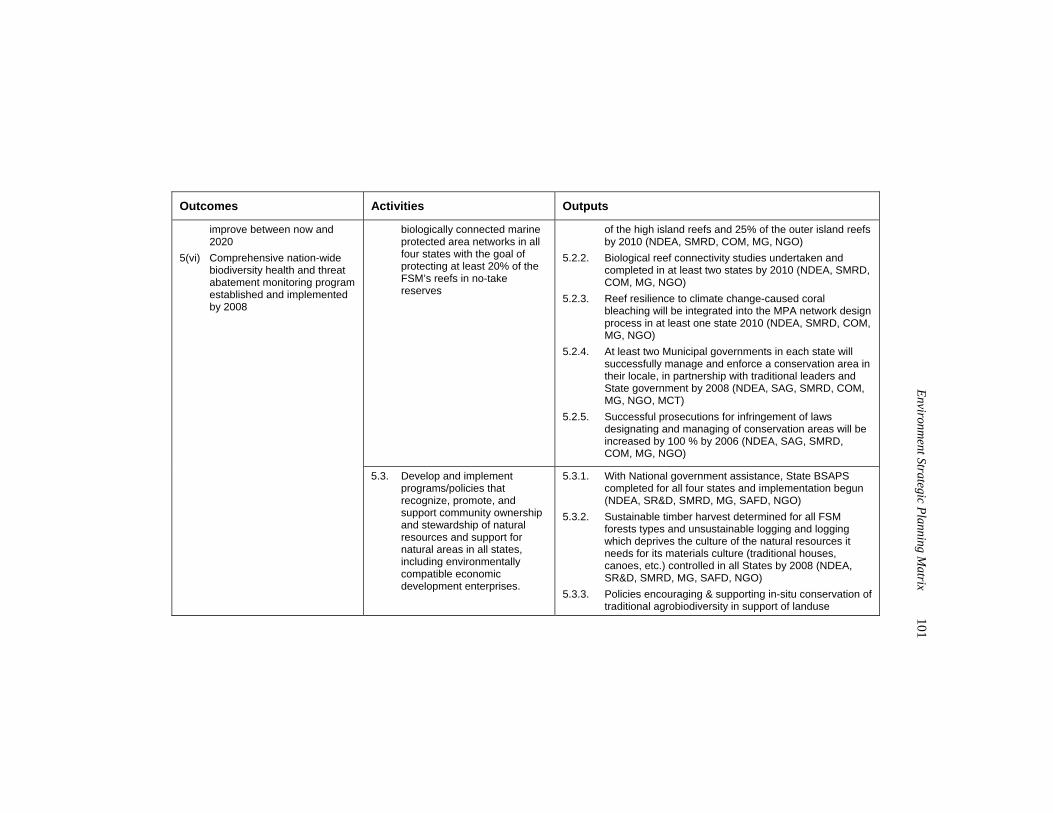
Environm
ent Strategic Planning Matrix
101
Outcomes Activities Outputs
biologically connected marine protected area networks in all four states with the goal of protecting at least 20% of the FSM’s reefs in no-take reserves
of the high island reefs and 25% of the outer island reefs by 2010 (NDEA, SMRD, COM, MG, NGO)
5.2.2. Biological reef connectivity studies undertaken and completed in at least two states by 2010 (NDEA, SMRD, COM, MG, NGO)
5.2.3. Reef resilience to climate change-caused coral bleaching will be integrated into the MPA network design process in at least one state 2010 (NDEA, SMRD, COM, MG, NGO)
5.2.4. At least two Municipal governments in each state will successfully manage and enforce a conservation area in their locale, in partnership with traditional leaders and State government by 2008 (NDEA, SAG, SMRD, COM, MG, NGO, MCT)
5.2.5. Successful prosecutions for infringement of laws designating and managing of conservation areas will be increased by 100 % by 2006 (NDEA, SAG, SMRD, COM, MG, NGO)
improve between now and 2020
5(vi) Comprehensive nation-wide biodiversity health and threat abatement monitoring program established and implemented by 2008
5.3. Develop and implement programs/policies that recognize, promote, and support community ownership and stewardship of natural resources and support for natural areas in all states, including environmentally compatible economic development enterprises.
5.3.1. With National government assistance, State BSAPS completed for all four states and implementation begun (NDEA, SR&D, SMRD, MG, SAFD, NGO)
5.3.2. Sustainable timber harvest determined for all FSM forests types and unsustainable logging and logging which deprives the culture of the natural resources it needs for its materials culture (traditional houses, canoes, etc.) controlled in all States by 2008 (NDEA, SR&D, SMRD, MG, SAFD, NGO)
5.3.3. Policies encouraging & supporting in-situ conservation of traditional agrobiodiversity in support of landuse
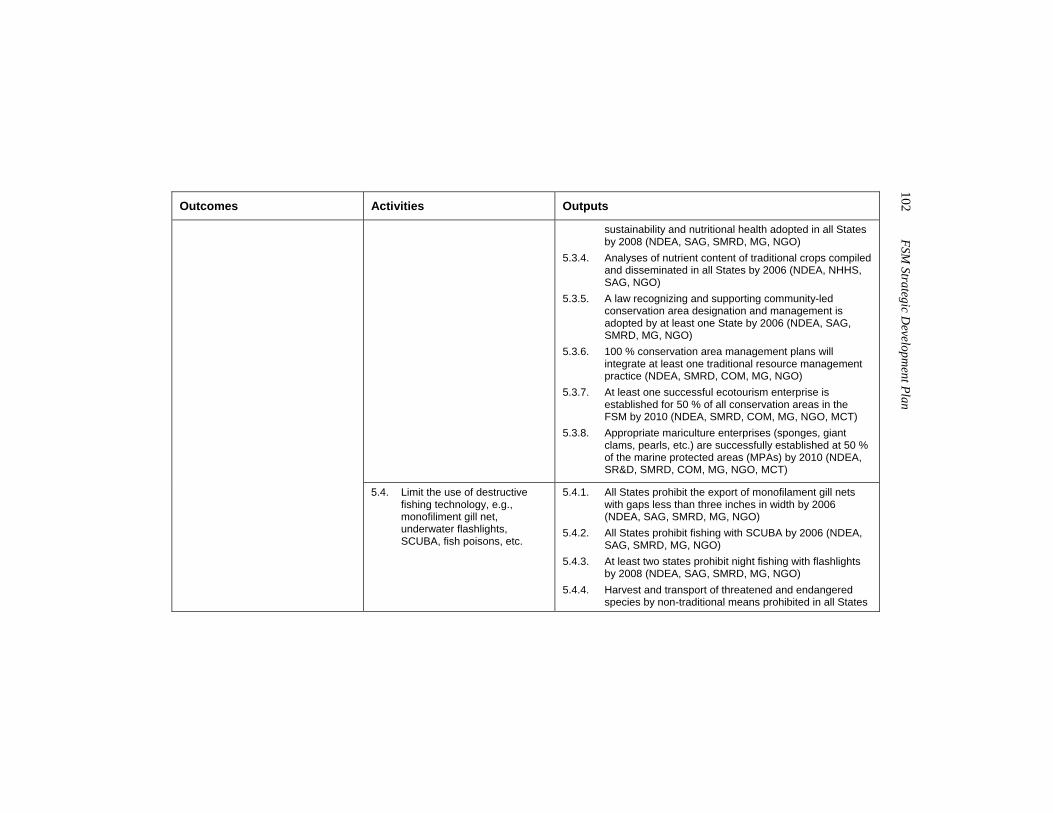
102 FSM
Strategic Developm
ent Plan
Outcomes Activities Outputs
sustainability and nutritional health adopted in all States by 2008 (NDEA, SAG, SMRD, MG, NGO)
5.3.4. Analyses of nutrient content of traditional crops compiled and disseminated in all States by 2006 (NDEA, NHHS, SAG, NGO)
5.3.5. A law recognizing and supporting community-led conservation area designation and management is adopted by at least one State by 2006 (NDEA, SAG, SMRD, MG, NGO)
5.3.6. 100 % conservation area management plans will integrate at least one traditional resource management practice (NDEA, SMRD, COM, MG, NGO)
5.3.7. At least one successful ecotourism enterprise is established for 50 % of all conservation areas in the FSM by 2010 (NDEA, SMRD, COM, MG, NGO, MCT)
5.3.8. Appropriate mariculture enterprises (sponges, giant clams, pearls, etc.) are successfully established at 50 % of the marine protected areas (MPAs) by 2010 (NDEA, SR&D, SMRD, COM, MG, NGO, MCT)
5.4. Limit the use of destructive fishing technology, e.g., monofiliment gill net, underwater flashlights, SCUBA, fish poisons, etc.
5.4.1. All States prohibit the export of monofilament gill nets with gaps less than three inches in width by 2006 (NDEA, SAG, SMRD, MG, NGO)
5.4.2. All States prohibit fishing with SCUBA by 2006 (NDEA, SAG, SMRD, MG, NGO)
5.4.3. At least two states prohibit night fishing with flashlights by 2008 (NDEA, SAG, SMRD, MG, NGO)
5.4.4. Harvest and transport of threatened and endangered species by non-traditional means prohibited in all States
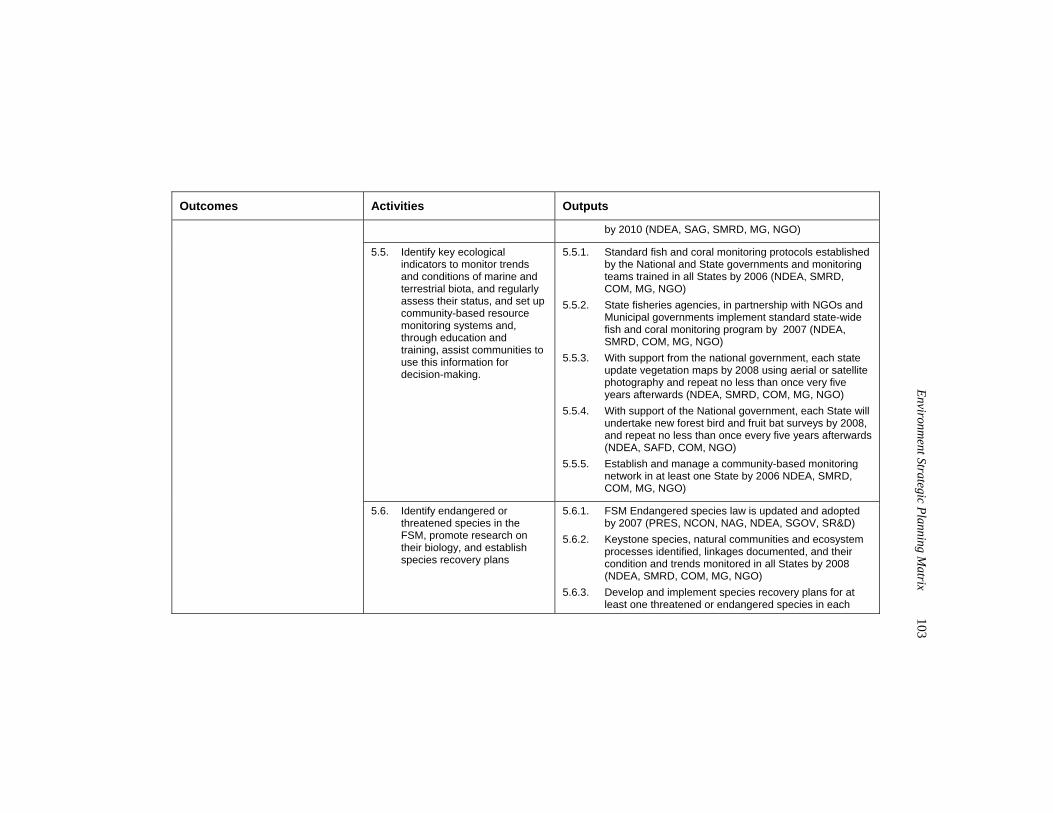
Environm
ent Strategic Planning Matrix
103
Outcomes Activities Outputs
by 2010 (NDEA, SAG, SMRD, MG, NGO)
5.5. Identify key ecological indicators to monitor trends and conditions of marine and terrestrial biota, and regularly assess their status, and set up community-based resource monitoring systems and, through education and training, assist communities to use this information for decision-making.
5.5.1. Standard fish and coral monitoring protocols established by the National and State governments and monitoring teams trained in all States by 2006 (NDEA, SMRD, COM, MG, NGO)
5.5.2. State fisheries agencies, in partnership with NGOs and Municipal governments implement standard state-wide fish and coral monitoring program by 2007 (NDEA, SMRD, COM, MG, NGO)
5.5.3. With support from the national government, each state update vegetation maps by 2008 using aerial or satellite photography and repeat no less than once very five years afterwards (NDEA, SMRD, COM, MG, NGO)
5.5.4. With support of the National government, each State will undertake new forest bird and fruit bat surveys by 2008, and repeat no less than once every five years afterwards (NDEA, SAFD, COM, NGO)
5.5.5. Establish and manage a community-based monitoring network in at least one State by 2006 NDEA, SMRD, COM, MG, NGO)
5.6. Identify endangered or threatened species in the FSM, promote research on their biology, and establish species recovery plans
5.6.1. FSM Endangered species law is updated and adopted by 2007 (PRES, NCON, NAG, NDEA, SGOV, SR&D)
5.6.2. Keystone species, natural communities and ecosystem processes identified, linkages documented, and their condition and trends monitored in all States by 2008 (NDEA, SMRD, COM, MG, NGO)
5.6.3. Develop and implement species recovery plans for at least one threatened or endangered species in each
104 FSM
Strategic Developm
ent Plan
Outcomes Activities Outputs
state by 2006 (in partnership with US Fish and Wildlife Service) (NDEA, SR&D, SMRD, SAFD, NGO, MCT)
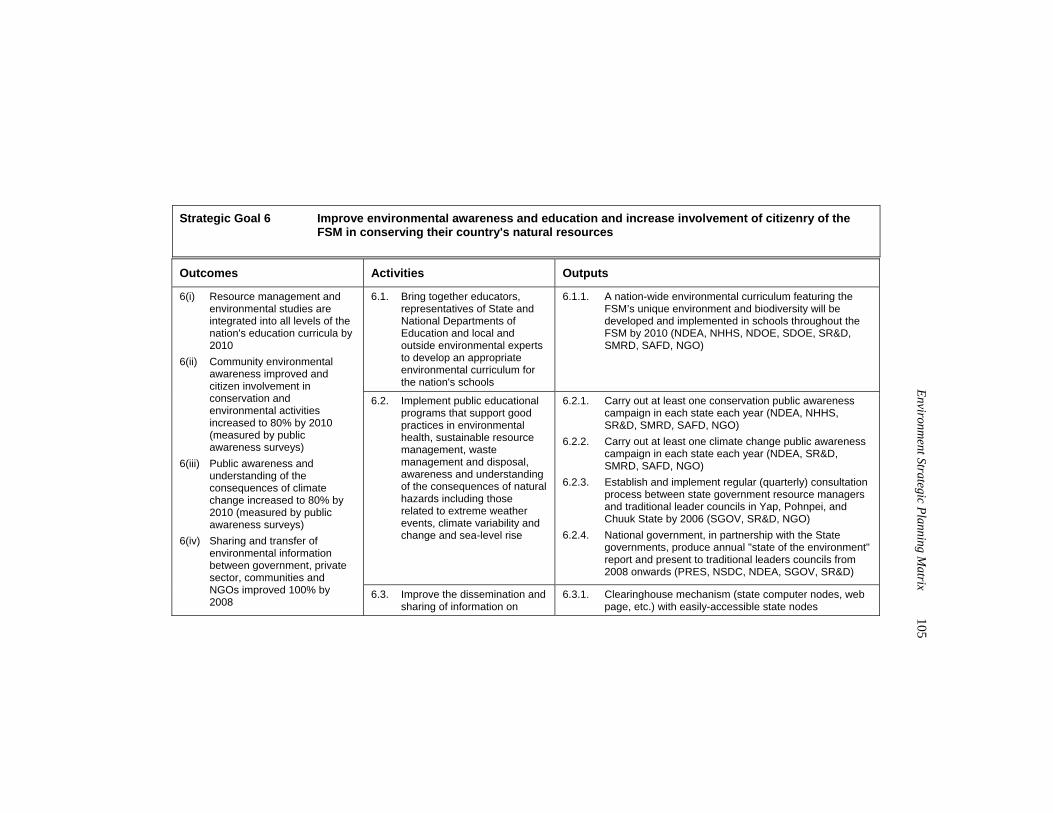
Environm
ent Strategic Planning Matrix
105
Strategic Goal 6 Improve environmental awareness and education and increase involvement of citizenry of the
FSM in conserving their country's natural resources Outcomes Activities Outputs
6.1. Bring together educators, representatives of State and National Departments of Education and local and outside environmental experts to develop an appropriate environmental curriculum for the nation's schools
6.1.1. A nation-wide environmental curriculum featuring the FSM’s unique environment and biodiversity will be developed and implemented in schools throughout the FSM by 2010 (NDEA, NHHS, NDOE, SDOE, SR&D, SMRD, SAFD, NGO)
6.2. Implement public educational programs that support good practices in environmental health, sustainable resource management, waste management and disposal, awareness and understanding of the consequences of natural hazards including those related to extreme weather events, climate variability and change and sea-level rise
6.2.1. Carry out at least one conservation public awareness campaign in each state each year (NDEA, NHHS, SR&D, SMRD, SAFD, NGO)
6.2.2. Carry out at least one climate change public awareness campaign in each state each year (NDEA, SR&D, SMRD, SAFD, NGO)
6.2.3. Establish and implement regular (quarterly) consultation process between state government resource managers and traditional leader councils in Yap, Pohnpei, and Chuuk State by 2006 (SGOV, SR&D, NGO)
6.2.4. National government, in partnership with the State governments, produce annual "state of the environment" report and present to traditional leaders councils from 2008 onwards (PRES, NSDC, NDEA, SGOV, SR&D)
6(i) Resource management and environmental studies are integrated into all levels of the nation's education curricula by 2010
6(ii) Community environmental awareness improved and citizen involvement in conservation and environmental activities increased to 80% by 2010 (measured by public awareness surveys)
6(iii) Public awareness and understanding of the consequences of climate change increased to 80% by 2010 (measured by public awareness surveys)
6(iv) Sharing and transfer of environmental information between government, private sector, communities and NGOs improved 100% by 2008
6.3. Improve the dissemination and sharing of information on
6.3.1. Clearinghouse mechanism (state computer nodes, web page, etc.) with easily-accessible state nodes
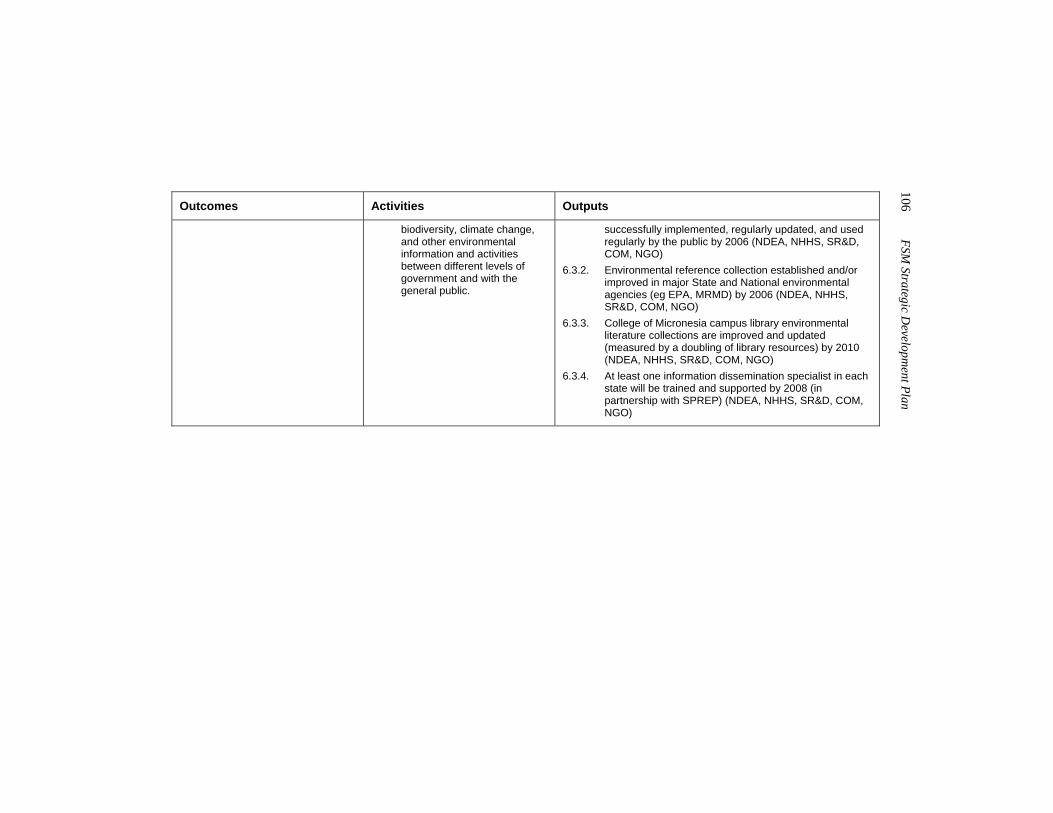
106 FSM
Strategic Developm
ent Plan
Outcomes Activities Outputs
biodiversity, climate change, and other environmental information and activities between different levels of government and with the general public.
successfully implemented, regularly updated, and used regularly by the public by 2006 (NDEA, NHHS, SR&D, COM, NGO)
6.3.2. Environmental reference collection established and/or improved in major State and National environmental agencies (eg EPA, MRMD) by 2006 (NDEA, NHHS, SR&D, COM, NGO)
6.3.3. College of Micronesia campus library environmental literature collections are improved and updated (measured by a doubling of library resources) by 2010 (NDEA, NHHS, SR&D, COM, NGO)
6.3.4. At least one information dissemination specialist in each state will be trained and supported by 2008 (in partnership with SPREP) (NDEA, NHHS, SR&D, COM, NGO)
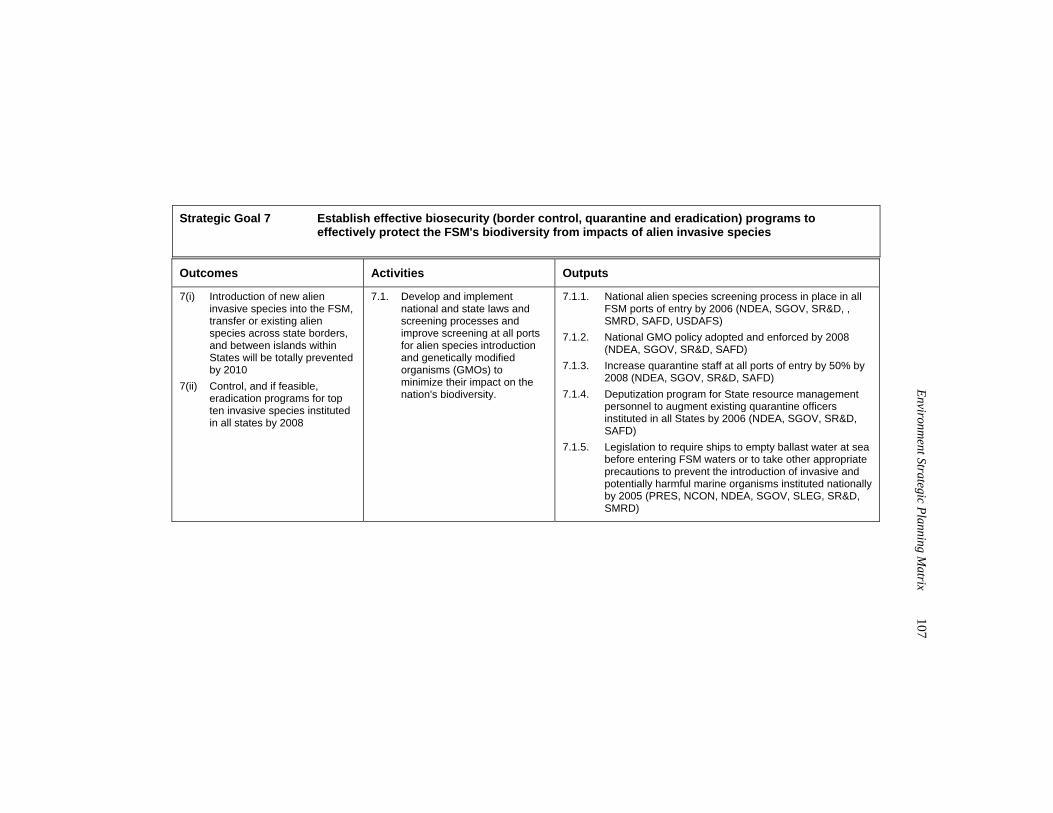
Environm
ent Strategic Planning Matrix
107
Strategic Goal 7 Establish effective biosecurity (border control, quarantine and eradication) programs to
effectively protect the FSM's biodiversity from impacts of alien invasive species Outcomes Activities Outputs
7(i) Introduction of new alien invasive species into the FSM, transfer or existing alien species across state borders, and between islands within States will be totally prevented by 2010
7(ii) Control, and if feasible, eradication programs for top ten invasive species instituted in all states by 2008
7.1. Develop and implement national and state laws and screening processes and improve screening at all ports for alien species introduction and genetically modified organisms (GMOs) to minimize their impact on the nation's biodiversity.
7.1.1. National alien species screening process in place in all FSM ports of entry by 2006 (NDEA, SGOV, SR&D, , SMRD, SAFD, USDAFS)
7.1.2. National GMO policy adopted and enforced by 2008 (NDEA, SGOV, SR&D, SAFD)
7.1.3. Increase quarantine staff at all ports of entry by 50% by 2008 (NDEA, SGOV, SR&D, SAFD)
7.1.4. Deputization program for State resource management personnel to augment existing quarantine officers instituted in all States by 2006 (NDEA, SGOV, SR&D, SAFD)
7.1.5. Legislation to require ships to empty ballast water at sea before entering FSM waters or to take other appropriate precautions to prevent the introduction of invasive and potentially harmful marine organisms instituted nationally by 2005 (PRES, NCON, NDEA, SGOV, SLEG, SR&D, SMRD)
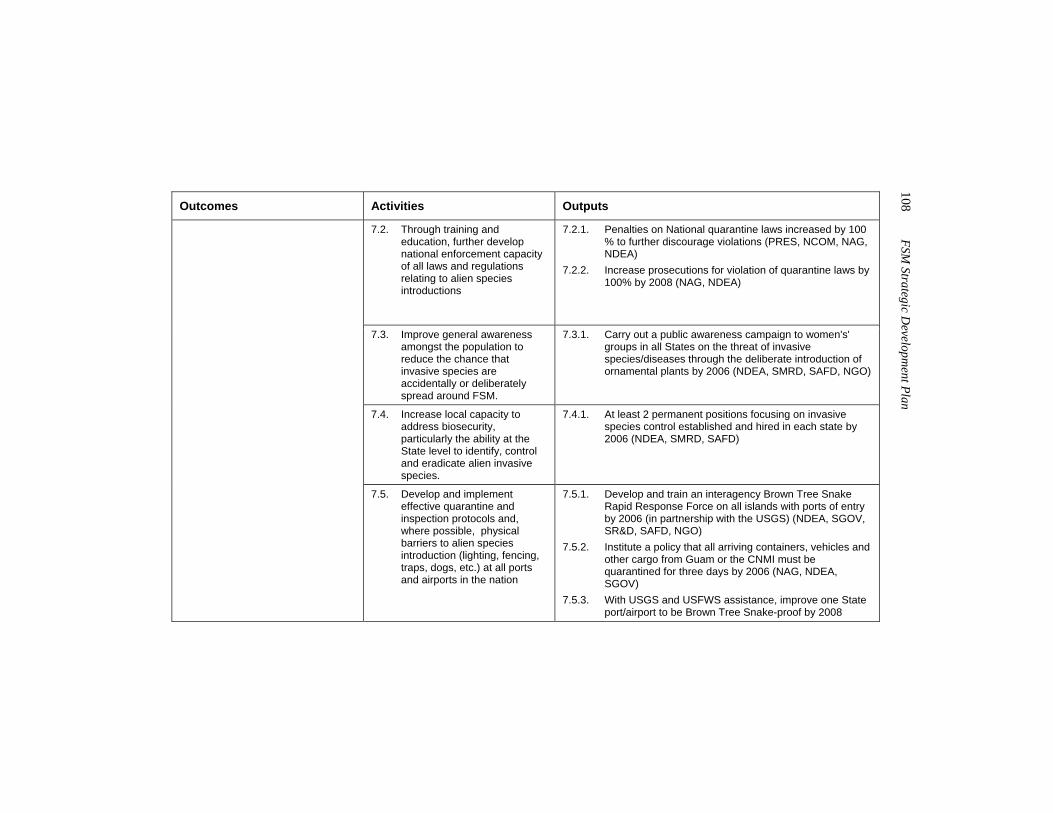
108 FSM
Strategic Developm
ent Plan
Outcomes Activities Outputs
7.2. Through training and education, further develop national enforcement capacity of all laws and regulations relating to alien species introductions
7.2.1. Penalties on National quarantine laws increased by 100 % to further discourage violations (PRES, NCOM, NAG, NDEA)
7.2.2. Increase prosecutions for violation of quarantine laws by 100% by 2008 (NAG, NDEA)
7.3. Improve general awareness amongst the population to reduce the chance that invasive species are accidentally or deliberately spread around FSM.
7.3.1. Carry out a public awareness campaign to women's' groups in all States on the threat of invasive species/diseases through the deliberate introduction of ornamental plants by 2006 (NDEA, SMRD, SAFD, NGO)
7.4. Increase local capacity to address biosecurity, particularly the ability at the State level to identify, control and eradicate alien invasive species.
7.4.1. At least 2 permanent positions focusing on invasive species control established and hired in each state by 2006 (NDEA, SMRD, SAFD)
7.5. Develop and implement effective quarantine and inspection protocols and, where possible, physical barriers to alien species introduction (lighting, fencing, traps, dogs, etc.) at all ports and airports in the nation
7.5.1. Develop and train an interagency Brown Tree Snake Rapid Response Force on all islands with ports of entry by 2006 (in partnership with the USGS) (NDEA, SGOV, SR&D, SAFD, NGO)
7.5.2. Institute a policy that all arriving containers, vehicles and other cargo from Guam or the CNMI must be quarantined for three days by 2006 (NAG, NDEA, SGOV)
7.5.3. With USGS and USFWS assistance, improve one State port/airport to be Brown Tree Snake-proof by 2008
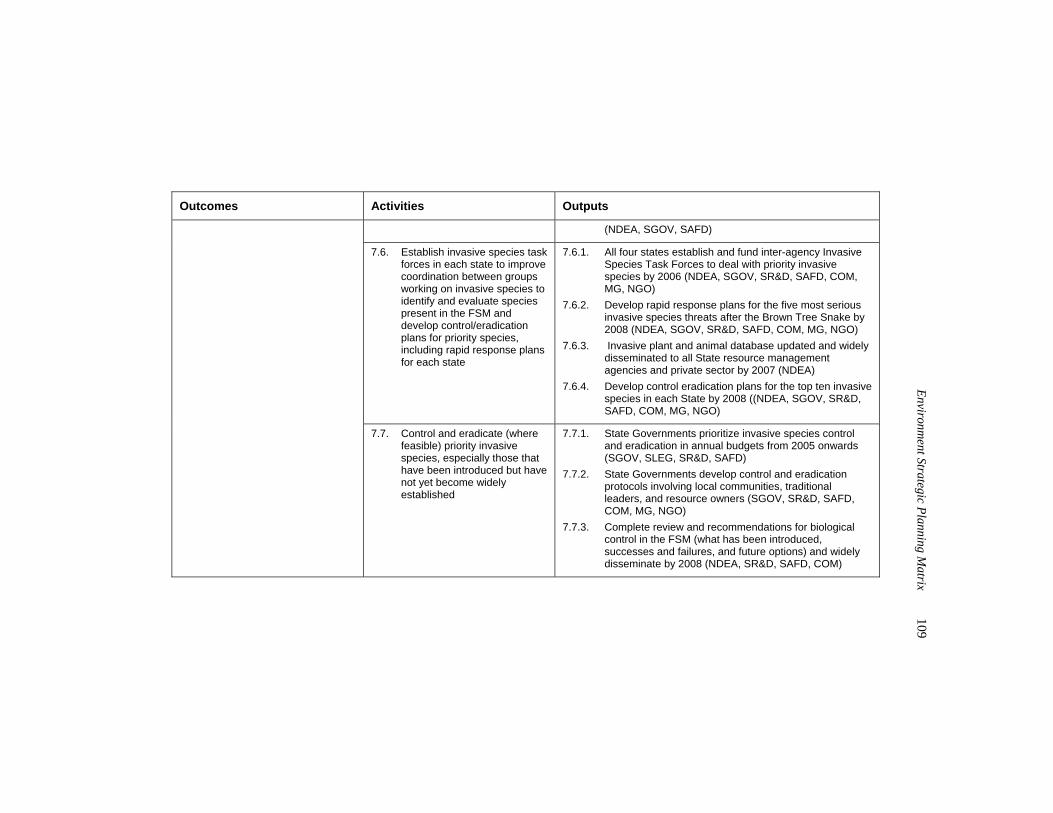
Environm
ent Strategic Planning Matrix
109
Outcomes Activities Outputs
(NDEA, SGOV, SAFD)
7.6. Establish invasive species task forces in each state to improve coordination between groups working on invasive species to identify and evaluate species present in the FSM and develop control/eradication plans for priority species, including rapid response plans for each state
7.6.1. All four states establish and fund inter-agency Invasive Species Task Forces to deal with priority invasive species by 2006 (NDEA, SGOV, SR&D, SAFD, COM, MG, NGO)
7.6.2. Develop rapid response plans for the five most serious invasive species threats after the Brown Tree Snake by 2008 (NDEA, SGOV, SR&D, SAFD, COM, MG, NGO)
7.6.3. Invasive plant and animal database updated and widely disseminated to all State resource management agencies and private sector by 2007 (NDEA)
7.6.4. Develop control eradication plans for the top ten invasive species in each State by 2008 ((NDEA, SGOV, SR&D, SAFD, COM, MG, NGO)
7.7. Control and eradicate (where feasible) priority invasive species, especially those that have been introduced but have not yet become widely established
7.7.1. State Governments prioritize invasive species control and eradication in annual budgets from 2005 onwards (SGOV, SLEG, SR&D, SAFD)
7.7.2. State Governments develop control and eradication protocols involving local communities, traditional leaders, and resource owners (SGOV, SR&D, SAFD, COM, MG, NGO)
7.7.3. Complete review and recommendations for biological control in the FSM (what has been introduced, successes and failures, and future options) and widely disseminate by 2008 (NDEA, SR&D, SAFD, COM)
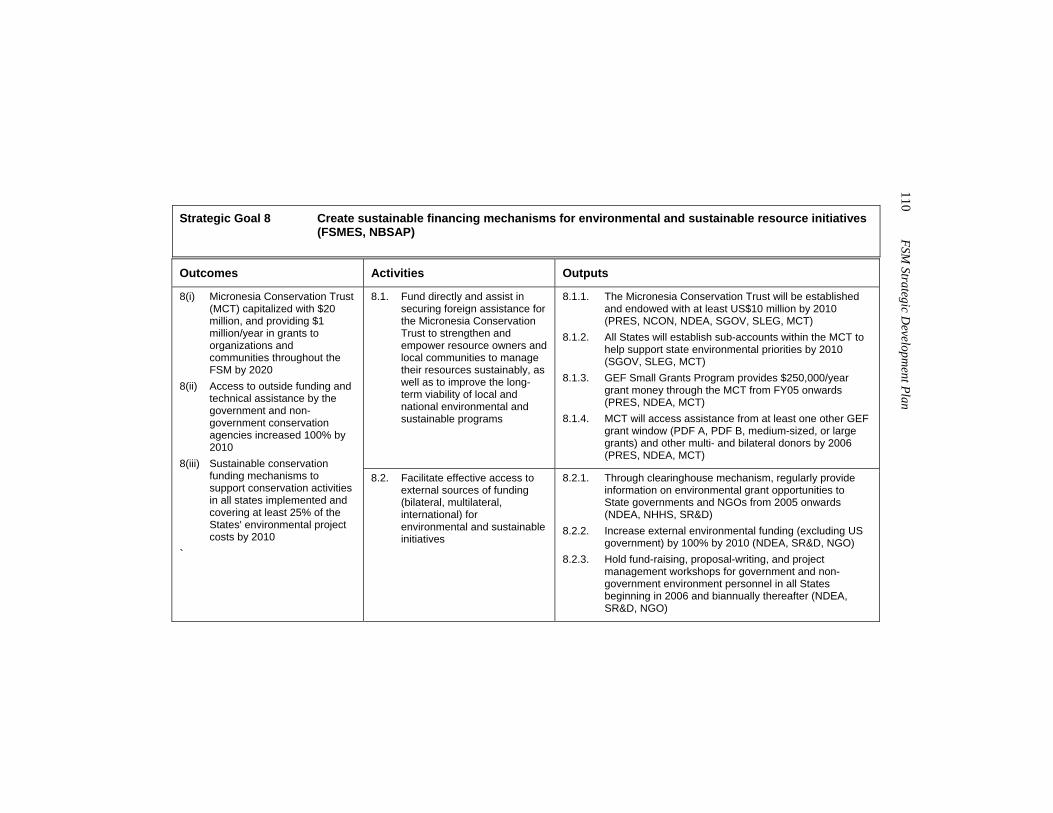
110 FSM
Strategic Developm
ent Plan
Strategic Goal 8 Create sustainable financing mechanisms for environmental and sustainable resource initiatives
(FSMES, NBSAP) Outcomes Activities Outputs
8.1. Fund directly and assist in securing foreign assistance for the Micronesia Conservation Trust to strengthen and empower resource owners and local communities to manage their resources sustainably, as well as to improve the long-term viability of local and national environmental and sustainable programs
8.1.1. The Micronesia Conservation Trust will be established and endowed with at least US$10 million by 2010 (PRES, NCON, NDEA, SGOV, SLEG, MCT)
8.1.2. All States will establish sub-accounts within the MCT to help support state environmental priorities by 2010 (SGOV, SLEG, MCT)
8.1.3. GEF Small Grants Program provides $250,000/year grant money through the MCT from FY05 onwards (PRES, NDEA, MCT)
8.1.4. MCT will access assistance from at least one other GEF grant window (PDF A, PDF B, medium-sized, or large grants) and other multi- and bilateral donors by 2006 (PRES, NDEA, MCT)
8(i) Micronesia Conservation Trust (MCT) capitalized with $20 million, and providing $1 million/year in grants to organizations and communities throughout the FSM by 2020
8(ii) Access to outside funding and technical assistance by the government and non-government conservation agencies increased 100% by 2010
8(iii) Sustainable conservation funding mechanisms to support conservation activities in all states implemented and covering at least 25% of the States' environmental project costs by 2010
`
8.2. Facilitate effective access to external sources of funding (bilateral, multilateral, international) for environmental and sustainable initiatives
8.2.1. Through clearinghouse mechanism, regularly provide information on environmental grant opportunities to State governments and NGOs from 2005 onwards (NDEA, NHHS, SR&D)
8.2.2. Increase external environmental funding (excluding US government) by 100% by 2010 (NDEA, SR&D, NGO)
8.2.3. Hold fund-raising, proposal-writing, and project management workshops for government and non-government environment personnel in all States beginning in 2006 and biannually thereafter (NDEA, SR&D, NGO)
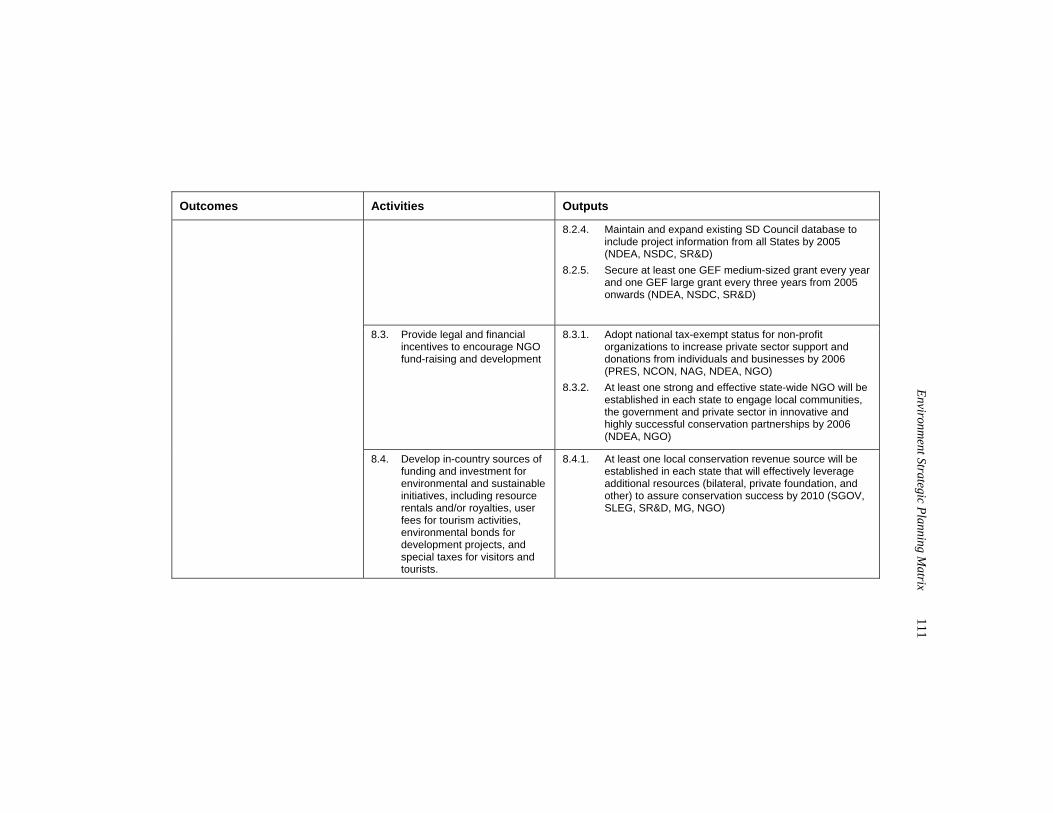
Environm
ent Strategic Planning Matrix
111
Outcomes Activities Outputs
8.2.4. Maintain and expand existing SD Council database to include project information from all States by 2005 (NDEA, NSDC, SR&D)
8.2.5. Secure at least one GEF medium-sized grant every year and one GEF large grant every three years from 2005 onwards (NDEA, NSDC, SR&D)
8.3. Provide legal and financial incentives to encourage NGO fund-raising and development
8.3.1. Adopt national tax-exempt status for non-profit organizations to increase private sector support and donations from individuals and businesses by 2006 (PRES, NCON, NAG, NDEA, NGO)
8.3.2. At least one strong and effective state-wide NGO will be established in each state to engage local communities, the government and private sector in innovative and highly successful conservation partnerships by 2006 (NDEA, NGO)
8.4. Develop in-country sources of funding and investment for environmental and sustainable initiatives, including resource rentals and/or royalties, user fees for tourism activities, environmental bonds for development projects, and special taxes for visitors and tourists.
8.4.1. At least one local conservation revenue source will be established in each state that will effectively leverage additional resources (bilateral, private foundation, and other) to assure conservation success by 2010 (SGOV, SLEG, SR&D, MG, NGO)
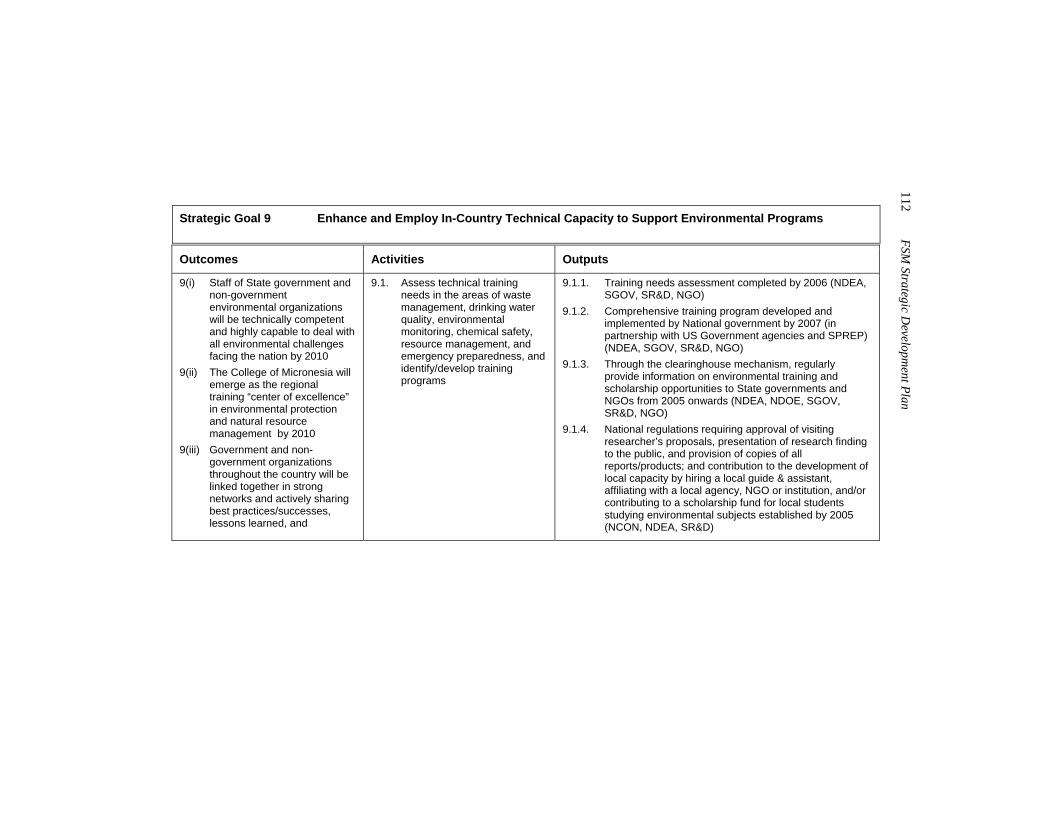
112 FSM
Strategic Developm
ent Plan
Strategic Goal 9 Enhance and Employ In-Country Technical Capacity to Support Environmental Programs Outcomes Activities Outputs
9(i) Staff of State government and non-government environmental organizations will be technically competent and highly capable to deal with all environmental challenges facing the nation by 2010
9(ii) The College of Micronesia will emerge as the regional training “center of excellence” in environmental protection and natural resource management by 2010
9(iii) Government and non-government organizations throughout the country will be linked together in strong networks and actively sharing best practices/successes, lessons learned, and
9.1. Assess technical training needs in the areas of waste management, drinking water quality, environmental monitoring, chemical safety, resource management, and emergency preparedness, and identify/develop training programs
9.1.1. Training needs assessment completed by 2006 (NDEA, SGOV, SR&D, NGO)
9.1.2. Comprehensive training program developed and implemented by National government by 2007 (in partnership with US Government agencies and SPREP) (NDEA, SGOV, SR&D, NGO)
9.1.3. Through the clearinghouse mechanism, regularly provide information on environmental training and scholarship opportunities to State governments and NGOs from 2005 onwards (NDEA, NDOE, SGOV, SR&D, NGO)
9.1.4. National regulations requiring approval of visiting researcher’s proposals, presentation of research finding to the public, and provision of copies of all reports/products; and contribution to the development of local capacity by hiring a local guide & assistant, affiliating with a local agency, NGO or institution, and/or contributing to a scholarship fund for local students studying environmental subjects established by 2005 (NCON, NDEA, SR&D)
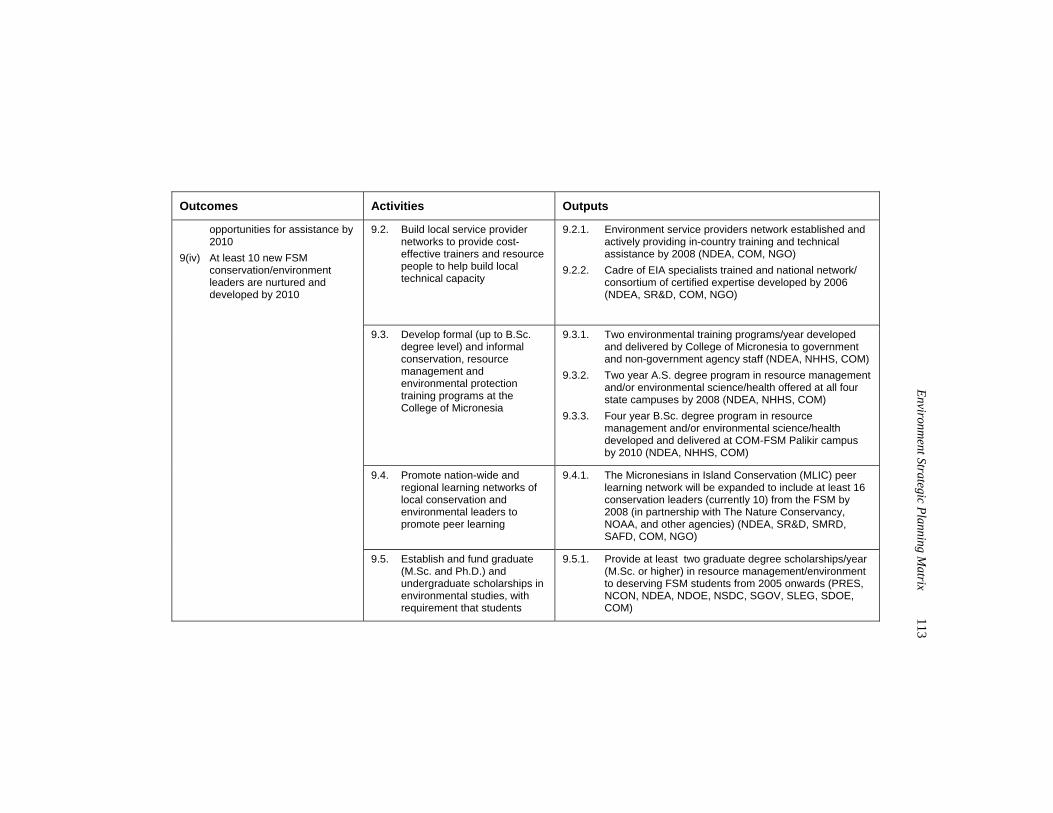
Environm
ent Strategic Planning Matrix
113
Outcomes Activities Outputs
9.2. Build local service provider networks to provide cost-effective trainers and resource people to help build local technical capacity
9.2.1. Environment service providers network established and actively providing in-country training and technical assistance by 2008 (NDEA, COM, NGO)
9.2.2. Cadre of EIA specialists trained and national network/ consortium of certified expertise developed by 2006 (NDEA, SR&D, COM, NGO)
9.3. Develop formal (up to B.Sc. degree level) and informal conservation, resource management and environmental protection training programs at the College of Micronesia
9.3.1. Two environmental training programs/year developed and delivered by College of Micronesia to government and non-government agency staff (NDEA, NHHS, COM)
9.3.2. Two year A.S. degree program in resource management and/or environmental science/health offered at all four state campuses by 2008 (NDEA, NHHS, COM)
9.3.3. Four year B.Sc. degree program in resource management and/or environmental science/health developed and delivered at COM-FSM Palikir campus by 2010 (NDEA, NHHS, COM)
9.4. Promote nation-wide and regional learning networks of local conservation and environmental leaders to promote peer learning
9.4.1. The Micronesians in Island Conservation (MLIC) peer learning network will be expanded to include at least 16 conservation leaders (currently 10) from the FSM by 2008 (in partnership with The Nature Conservancy, NOAA, and other agencies) (NDEA, SR&D, SMRD, SAFD, COM, NGO)
opportunities for assistance by 2010
9(iv) At least 10 new FSM conservation/environment leaders are nurtured and developed by 2010
9.5. Establish and fund graduate (M.Sc. and Ph.D.) and undergraduate scholarships in environmental studies, with requirement that students
9.5.1. Provide at least two graduate degree scholarships/year (M.Sc. or higher) in resource management/environment to deserving FSM students from 2005 onwards (PRES, NCON, NDEA, NDOE, NSDC, SGOV, SLEG, SDOE, COM)
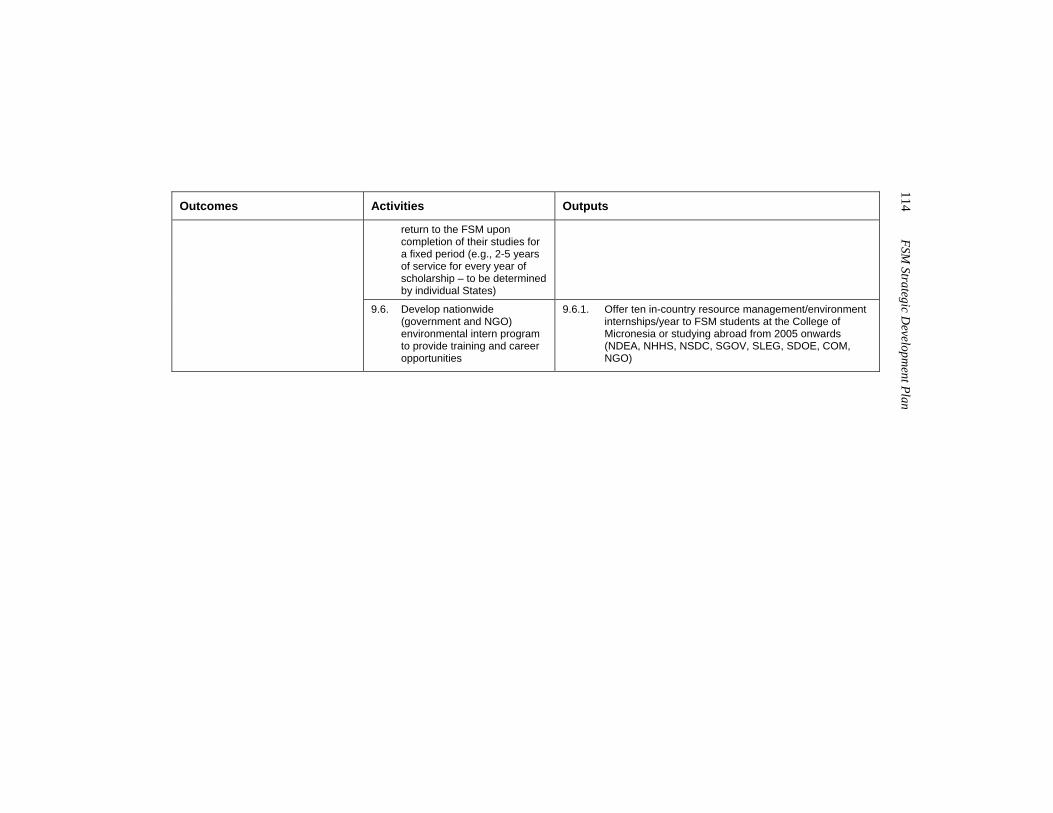
114 FSM
Strategic Developm
ent Plan
Outcomes Activities Outputs
return to the FSM upon completion of their studies for a fixed period (e.g., 2-5 years of service for every year of scholarship – to be determined by individual States)
9.6. Develop nationwide (government and NGO) environmental intern program to provide training and career opportunities
9.6.1. Offer ten in-country resource management/environment internships/year to FSM students at the College of Micronesia or studying abroad from 2005 onwards (NDEA, NHHS, NSDC, SGOV, SLEG, SDOE, COM, NGO)
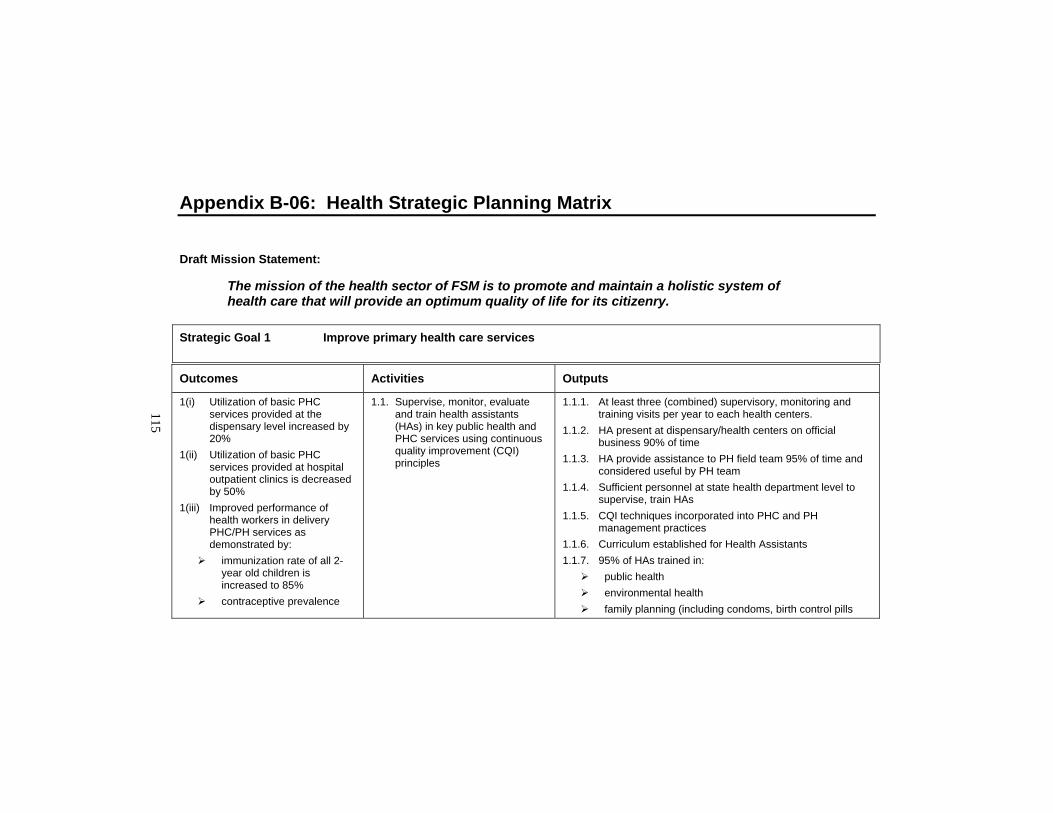
115
Appendix B-06: Health Strategic Planning Matrix
Draft Mission Statement:
The mission of the health sector of FSM is to promote and maintain a holistic system of health care that will provide an optimum quality of life for its citizenry.
Strategic Goal 1 Improve primary health care services Outcomes Activities Outputs
1(i) Utilization of basic PHC services provided at the dispensary level increased by 20%
1(ii) Utilization of basic PHC services provided at hospital outpatient clinics is decreased by 50%
1(iii) Improved performance of health workers in delivery PHC/PH services as demonstrated by:
immunization rate of all 2-year old children is increased to 85%
contraceptive prevalence
1.1. Supervise, monitor, evaluate and train health assistants (HAs) in key public health and PHC services using continuous quality improvement (CQI) principles
1.1.1. At least three (combined) supervisory, monitoring and training visits per year to each health centers.
1.1.2. HA present at dispensary/health centers on official business 90% of time
1.1.3. HA provide assistance to PH field team 95% of time and considered useful by PH team
1.1.4. Sufficient personnel at state health department level to supervise, train HAs
1.1.5. CQI techniques incorporated into PHC and PH management practices
1.1.6. Curriculum established for Health Assistants 1.1.7. 95% of HAs trained in:
public health environmental health family planning (including condoms, birth control pills
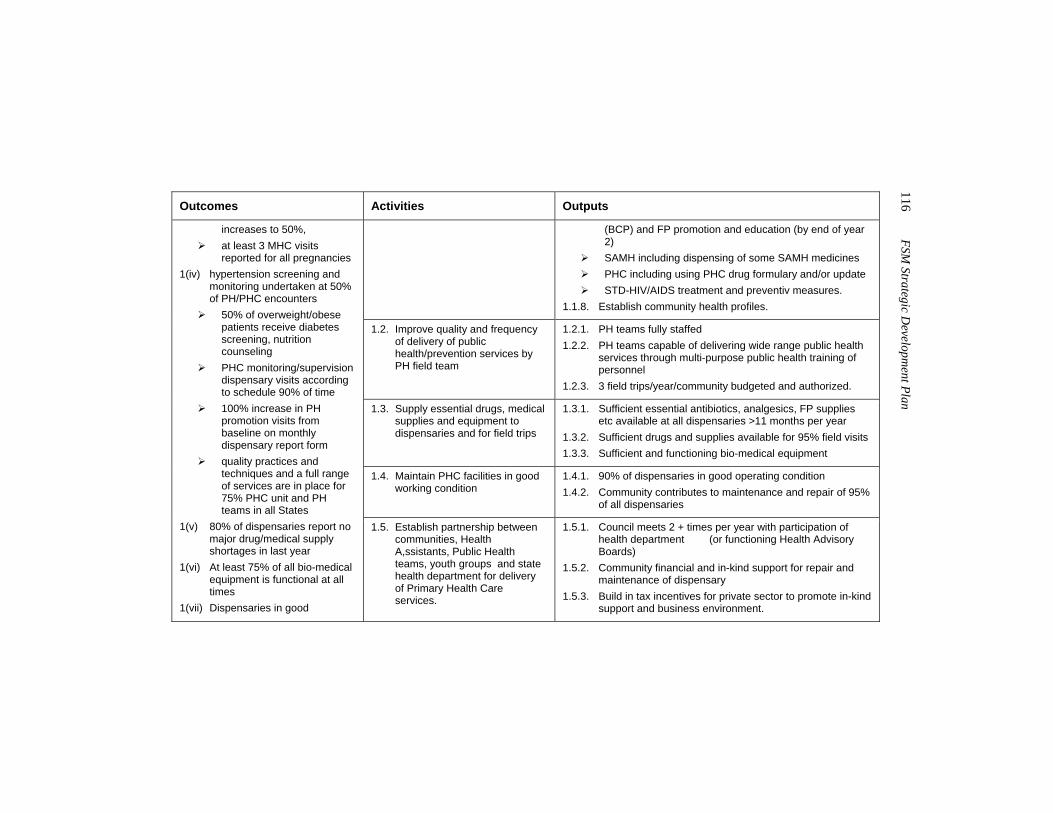
116 FSM
Strategic Developm
ent Plan
Outcomes Activities Outputs
(BCP) and FP promotion and education (by end of year 2)
SAMH including dispensing of some SAMH medicines PHC including using PHC drug formulary and/or update STD-HIV/AIDS treatment and preventiv measures.
1.1.8. Establish community health profiles.
1.2. Improve quality and frequency of delivery of public health/prevention services by PH field team
1.2.1. PH teams fully staffed 1.2.2. PH teams capable of delivering wide range public health
services through multi-purpose public health training of personnel
1.2.3. 3 field trips/year/community budgeted and authorized.
1.3. Supply essential drugs, medical supplies and equipment to dispensaries and for field trips
1.3.1. Sufficient essential antibiotics, analgesics, FP supplies etc available at all dispensaries >11 months per year
1.3.2. Sufficient drugs and supplies available for 95% field visits 1.3.3. Sufficient and functioning bio-medical equipment
1.4. Maintain PHC facilities in good working condition
1.4.1. 90% of dispensaries in good operating condition 1.4.2. Community contributes to maintenance and repair of 95%
of all dispensaries
increases to 50%, at least 3 MHC visits
reported for all pregnancies 1(iv) hypertension screening and
monitoring undertaken at 50% of PH/PHC encounters
50% of overweight/obese patients receive diabetes screening, nutrition counseling
PHC monitoring/supervision dispensary visits according to schedule 90% of time
100% increase in PH promotion visits from baseline on monthly dispensary report form
quality practices and techniques and a full range of services are in place for 75% PHC unit and PH teams in all States
1(v) 80% of dispensaries report no major drug/medical supply shortages in last year
1(vi) At least 75% of all bio-medical equipment is functional at all times
1(vii) Dispensaries in good
1.5. Establish partnership between communities, Health A,ssistants, Public Health teams, youth groups and state health department for delivery of Primary Health Care services.
1.5.1. Council meets 2 + times per year with participation of health department (or functioning Health Advisory Boards)
1.5.2. Community financial and in-kind support for repair and maintenance of dispensary
1.5.3. Build in tax incentives for private sector to promote in-kind support and business environment.
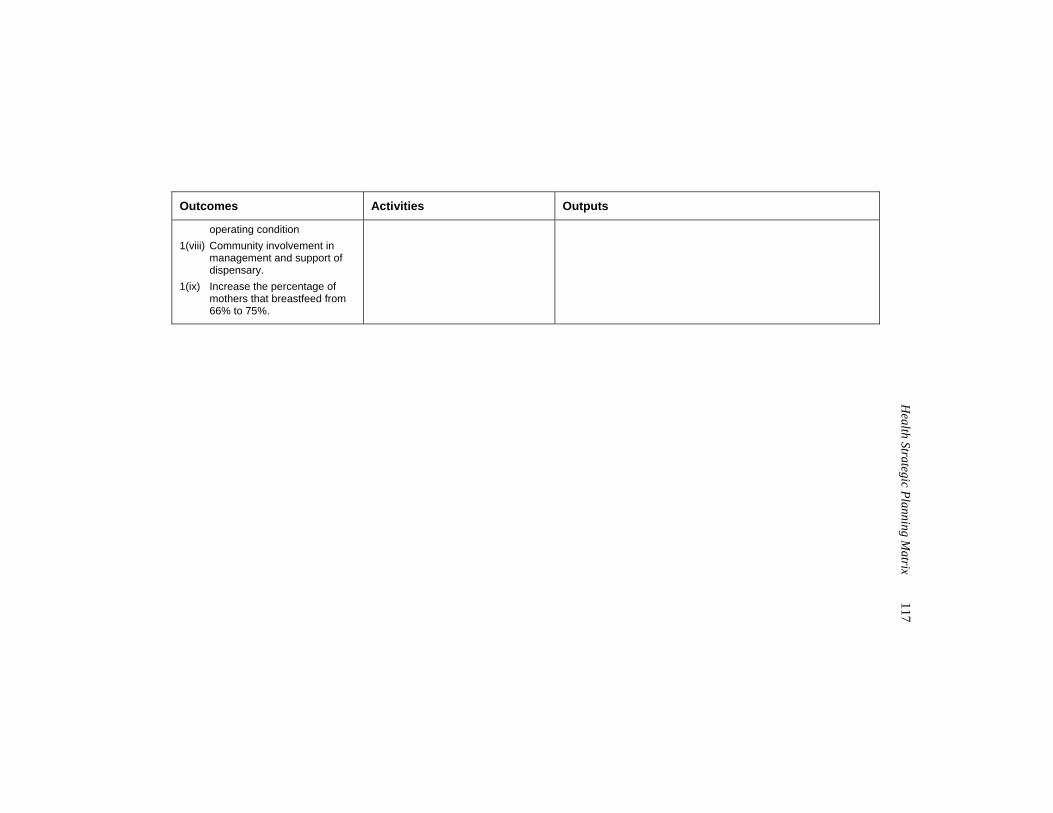
H
ealth Strategic Planning Matrix
117
Outcomes Activities Outputs
operating condition 1(viii) Community involvement in
management and support of dispensary.
1(ix) Increase the percentage of mothers that breastfeed from 66% to 75%.
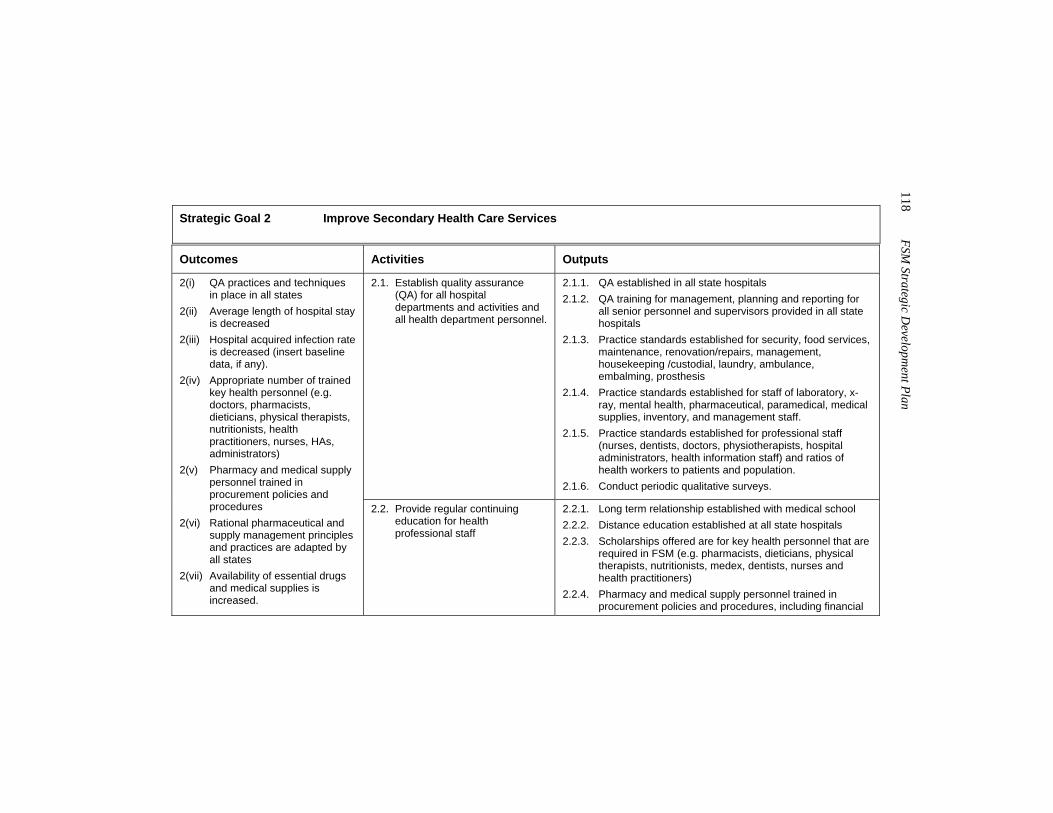
118 FSM
Strategic Developm
ent Plan
Strategic Goal 2 Improve Secondary Health Care Services Outcomes Activities Outputs
2.1. Establish quality assurance (QA) for all hospital departments and activities and all health department personnel.
2.1.1. QA established in all state hospitals 2.1.2. QA training for management, planning and reporting for
all senior personnel and supervisors provided in all state hospitals
2.1.3. Practice standards established for security, food services, maintenance, renovation/repairs, management, housekeeping /custodial, laundry, ambulance, embalming, prosthesis
2.1.4. Practice standards established for staff of laboratory, x-ray, mental health, pharmaceutical, paramedical, medical supplies, inventory, and management staff.
2.1.5. Practice standards established for professional staff (nurses, dentists, doctors, physiotherapists, hospital administrators, health information staff) and ratios of health workers to patients and population.
2.1.6. Conduct periodic qualitative surveys.
2(i) QA practices and techniques in place in all states
2(ii) Average length of hospital stay is decreased
2(iii) Hospital acquired infection rate is decreased (insert baseline data, if any).
2(iv) Appropriate number of trained key health personnel (e.g. doctors, pharmacists, dieticians, physical therapists, nutritionists, health practitioners, nurses, HAs, administrators)
2(v) Pharmacy and medical supply personnel trained in procurement policies and procedures
2(vi) Rational pharmaceutical and supply management principles and practices are adapted by all states
2(vii) Availability of essential drugs and medical supplies is increased.
2.2. Provide regular continuing education for health professional staff
2.2.1. Long term relationship established with medical school 2.2.2. Distance education established at all state hospitals 2.2.3. Scholarships offered are for key health personnel that are
required in FSM (e.g. pharmacists, dieticians, physical therapists, nutritionists, medex, dentists, nurses and health practitioners)
2.2.4. Pharmacy and medical supply personnel trained in procurement policies and procedures, including financial
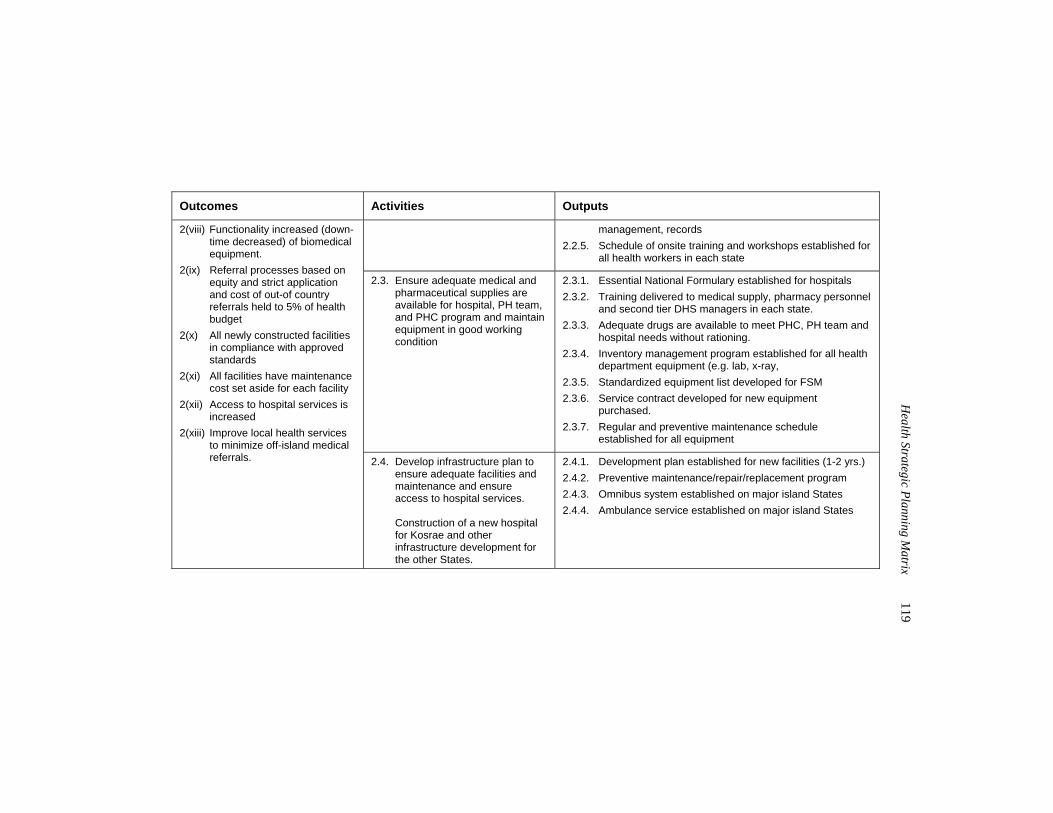
H
ealth Strategic Planning Matrix
119
Outcomes Activities Outputs
management, records 2.2.5. Schedule of onsite training and workshops established for
all health workers in each state
2.3. Ensure adequate medical and pharmaceutical supplies are available for hospital, PH team, and PHC program and maintain equipment in good working condition
2.3.1. Essential National Formulary established for hospitals 2.3.2. Training delivered to medical supply, pharmacy personnel
and second tier DHS managers in each state. 2.3.3. Adequate drugs are available to meet PHC, PH team and
hospital needs without rationing. 2.3.4. Inventory management program established for all health
department equipment (e.g. lab, x-ray, 2.3.5. Standardized equipment list developed for FSM 2.3.6. Service contract developed for new equipment
purchased. 2.3.7. Regular and preventive maintenance schedule
established for all equipment
2(viii) Functionality increased (down-time decreased) of biomedical equipment.
2(ix) Referral processes based on equity and strict application and cost of out-of country referrals held to 5% of health budget
2(x) All newly constructed facilities in compliance with approved standards
2(xi) All facilities have maintenance cost set aside for each facility
2(xii) Access to hospital services is increased
2(xiii) Improve local health services to minimize off-island medical referrals. 2.4. Develop infrastructure plan to
ensure adequate facilities and maintenance and ensure access to hospital services. Construction of a new hospital for Kosrae and other infrastructure development for the other States.
2.4.1. Development plan established for new facilities (1-2 yrs.) 2.4.2. Preventive maintenance/repair/replacement program 2.4.3. Omnibus system established on major island States 2.4.4. Ambulance service established on major island States
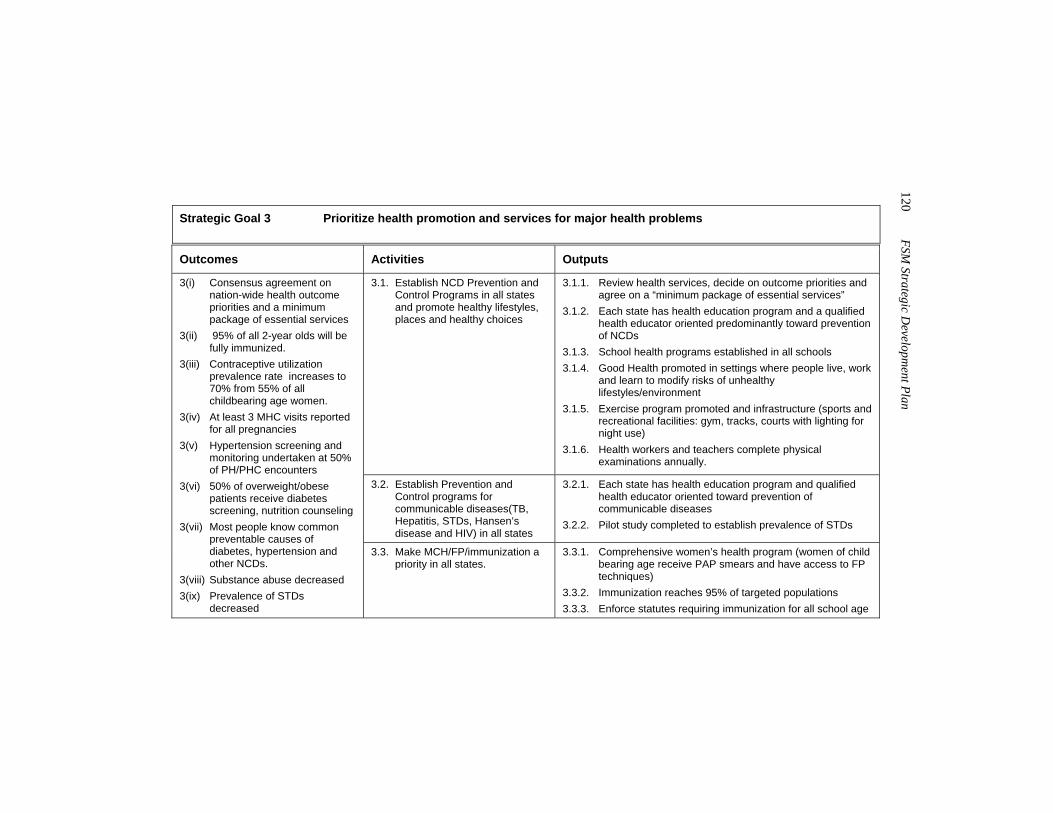
120 FSM
Strategic Developm
ent Plan
Strategic Goal 3 Prioritize health promotion and services for major health problems Outcomes Activities Outputs
3.1. Establish NCD Prevention and Control Programs in all states and promote healthy lifestyles, places and healthy choices
3.1.1. Review health services, decide on outcome priorities and agree on a “minimum package of essential services”
3.1.2. Each state has health education program and a qualified health educator oriented predominantly toward prevention of NCDs
3.1.3. School health programs established in all schools 3.1.4. Good Health promoted in settings where people live, work
and learn to modify risks of unhealthy lifestyles/environment
3.1.5. Exercise program promoted and infrastructure (sports and recreational facilities: gym, tracks, courts with lighting for night use)
3.1.6. Health workers and teachers complete physical examinations annually.
3.2. Establish Prevention and Control programs for communicable diseases(TB, Hepatitis, STDs, Hansen’s disease and HIV) in all states
3.2.1. Each state has health education program and qualified health educator oriented toward prevention of communicable diseases
3.2.2. Pilot study completed to establish prevalence of STDs
3(i) Consensus agreement on nation-wide health outcome priorities and a minimum package of essential services
3(ii) 95% of all 2-year olds will be fully immunized.
3(iii) Contraceptive utilization prevalence rate increases to 70% from 55% of all childbearing age women.
3(iv) At least 3 MHC visits reported for all pregnancies
3(v) Hypertension screening and monitoring undertaken at 50% of PH/PHC encounters
3(vi) 50% of overweight/obese patients receive diabetes screening, nutrition counseling
3(vii) Most people know common preventable causes of diabetes, hypertension and other NCDs.
3(viii) Substance abuse decreased 3(ix) Prevalence of STDs
decreased
3.3. Make MCH/FP/immunization a priority in all states.
3.3.1. Comprehensive women’s health program (women of child bearing age receive PAP smears and have access to FP techniques)
3.3.2. Immunization reaches 95% of targeted populations 3.3.3. Enforce statutes requiring immunization for all school age
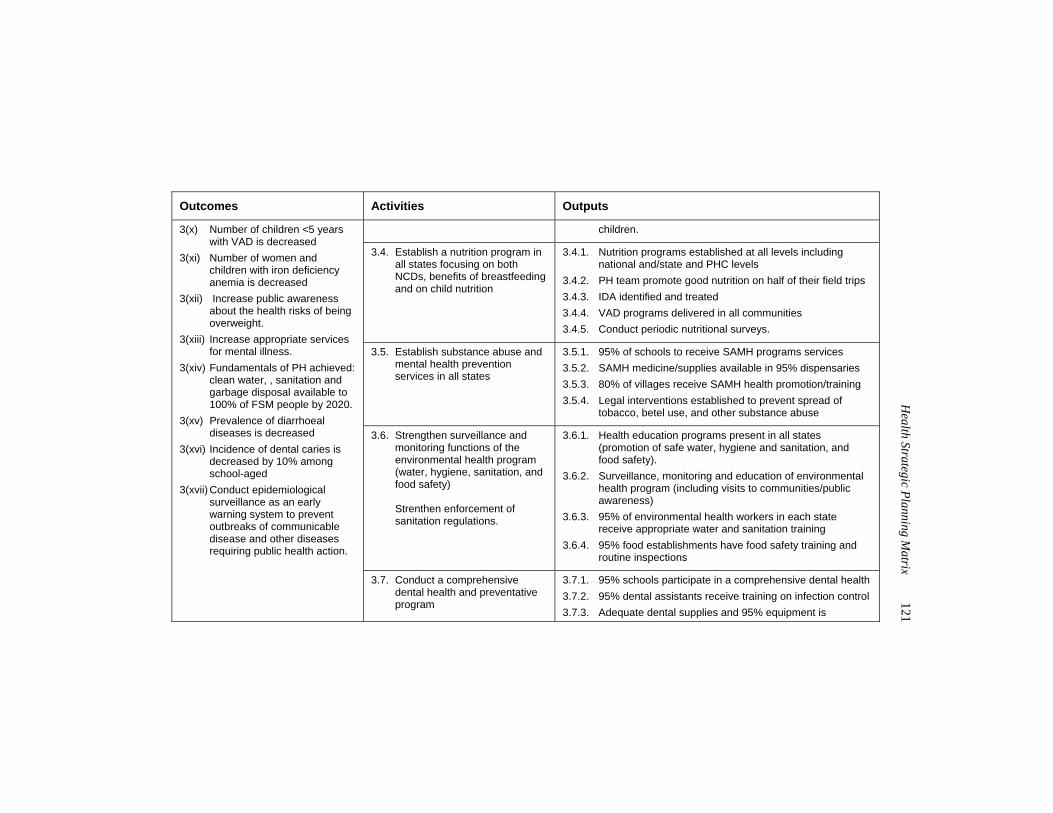
H
ealth Strategic Planning Matrix
121
Outcomes Activities Outputs
children.
3.4. Establish a nutrition program in all states focusing on both NCDs, benefits of breastfeeding and on child nutrition
3.4.1. Nutrition programs established at all levels including national and/state and PHC levels
3.4.2. PH team promote good nutrition on half of their field trips 3.4.3. IDA identified and treated 3.4.4. VAD programs delivered in all communities 3.4.5. Conduct periodic nutritional surveys.
3.5. Establish substance abuse and mental health prevention services in all states
3.5.1. 95% of schools to receive SAMH programs services 3.5.2. SAMH medicine/supplies available in 95% dispensaries 3.5.3. 80% of villages receive SAMH health promotion/training 3.5.4. Legal interventions established to prevent spread of
tobacco, betel use, and other substance abuse
3.6. Strengthen surveillance and monitoring functions of the environmental health program (water, hygiene, sanitation, and food safety) Strenthen enforcement of sanitation regulations.
3.6.1. Health education programs present in all states (promotion of safe water, hygiene and sanitation, and food safety).
3.6.2. Surveillance, monitoring and education of environmental health program (including visits to communities/public awareness)
3.6.3. 95% of environmental health workers in each state receive appropriate water and sanitation training
3.6.4. 95% food establishments have food safety training and routine inspections
3(x) Number of children <5 years with VAD is decreased
3(xi) Number of women and children with iron deficiency anemia is decreased
3(xii) Increase public awareness about the health risks of being overweight.
3(xiii) Increase appropriate services for mental illness.
3(xiv) Fundamentals of PH achieved: clean water, , sanitation and garbage disposal available to 100% of FSM people by 2020.
3(xv) Prevalence of diarrhoeal diseases is decreased
3(xvi) Incidence of dental caries is decreased by 10% among school-aged
3(xvii) Conduct epidemiological surveillance as an early warning system to prevent outbreaks of communicable disease and other diseases requiring public health action.
3.7. Conduct a comprehensive dental health and preventative program
3.7.1. 95% schools participate in a comprehensive dental health 3.7.2. 95% dental assistants receive training on infection control 3.7.3. Adequate dental supplies and 95% equipment is
122 FSM
Strategic Developm
ent Plan
Outcomes Activities Outputs
functional
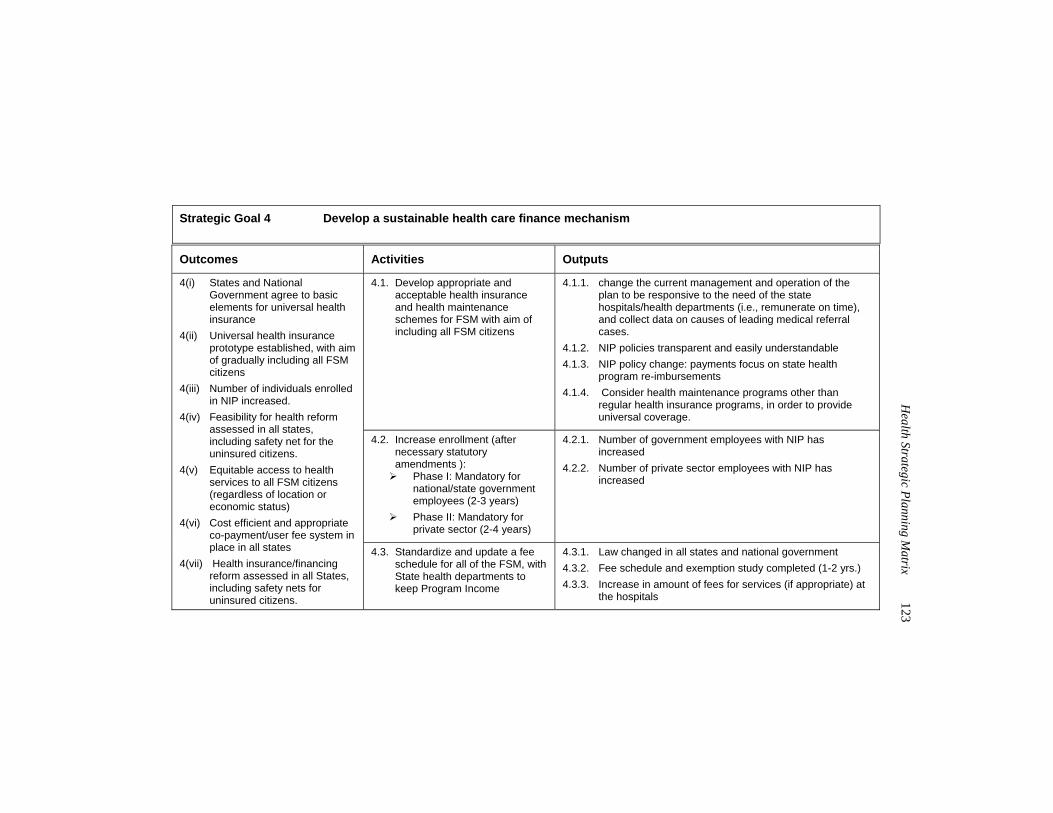
H
ealth Strategic Planning Matrix
123
Strategic Goal 4 Develop a sustainable health care finance mechanism Outcomes Activities Outputs
4.1. Develop appropriate and acceptable health insurance and health maintenance schemes for FSM with aim of including all FSM citizens
4.1.1. change the current management and operation of the plan to be responsive to the need of the state hospitals/health departments (i.e., remunerate on time), and collect data on causes of leading medical referral cases.
4.1.2. NIP policies transparent and easily understandable 4.1.3. NIP policy change: payments focus on state health
program re-imbursements 4.1.4. Consider health maintenance programs other than
regular health insurance programs, in order to provide universal coverage.
4.2. Increase enrollment (after necessary statutory amendments ): Phase I: Mandatory for
national/state government employees (2-3 years)
Phase II: Mandatory for private sector (2-4 years)
4.2.1. Number of government employees with NIP has increased
4.2.2. Number of private sector employees with NIP has increased
4(i) States and National Government agree to basic elements for universal health insurance
4(ii) Universal health insurance prototype established, with aim of gradually including all FSM citizens
4(iii) Number of individuals enrolled in NIP increased.
4(iv) Feasibility for health reform assessed in all states, including safety net for the uninsured citizens.
4(v) Equitable access to health services to all FSM citizens (regardless of location or economic status)
4(vi) Cost efficient and appropriate co-payment/user fee system in place in all states
4(vii) Health insurance/financing reform assessed in all States, including safety nets for uninsured citizens.
4.3. Standardize and update a fee schedule for all of the FSM, with State health departments to keep Program Income
4.3.1. Law changed in all states and national government 4.3.2. Fee schedule and exemption study completed (1-2 yrs.) 4.3.3. Increase in amount of fees for services (if appropriate) at
the hospitals
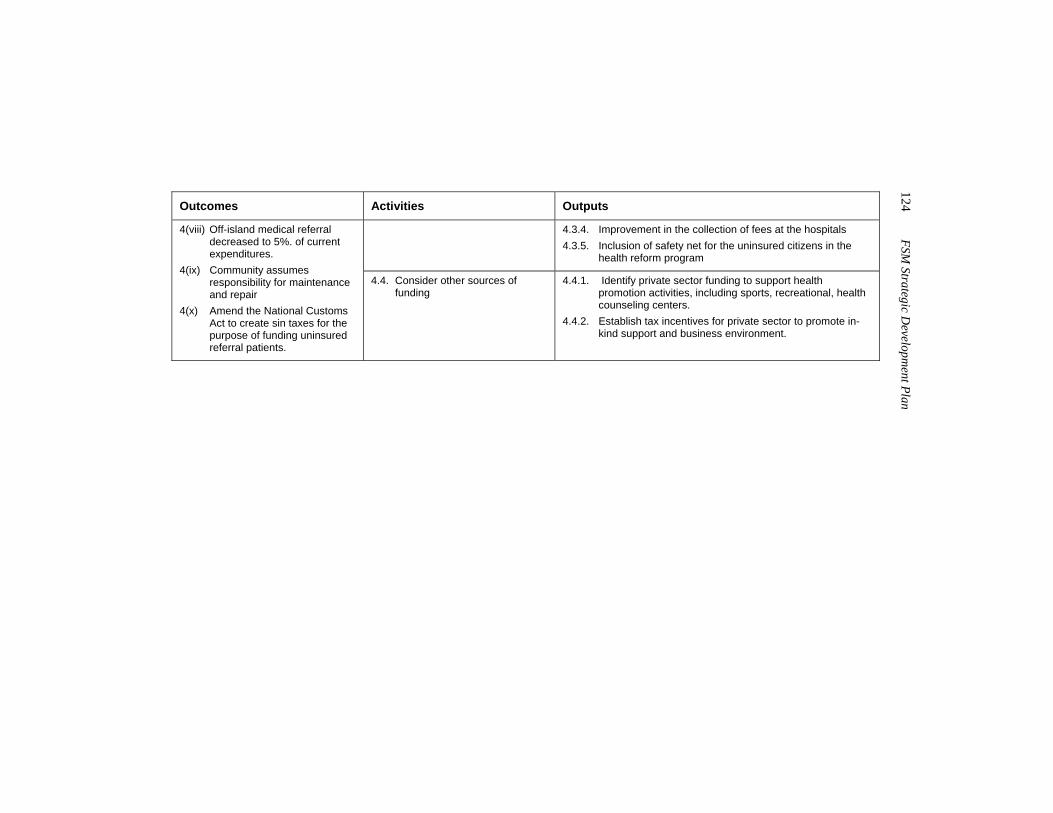
124 FSM
Strategic Developm
ent Plan
Outcomes Activities Outputs
4.3.4. Improvement in the collection of fees at the hospitals 4.3.5. Inclusion of safety net for the uninsured citizens in the
health reform program
4(viii) Off-island medical referral decreased to 5%. of current expenditures.
4(ix) Community assumes responsibility for maintenance and repair
4(x) Amend the National Customs Act to create sin taxes for the purpose of funding uninsured referral patients.
4.4. Consider other sources of funding
4.4.1. Identify private sector funding to support health promotion activities, including sports, recreational, health counseling centers.
4.4.2. Establish tax incentives for private sector to promote in-kind support and business environment.
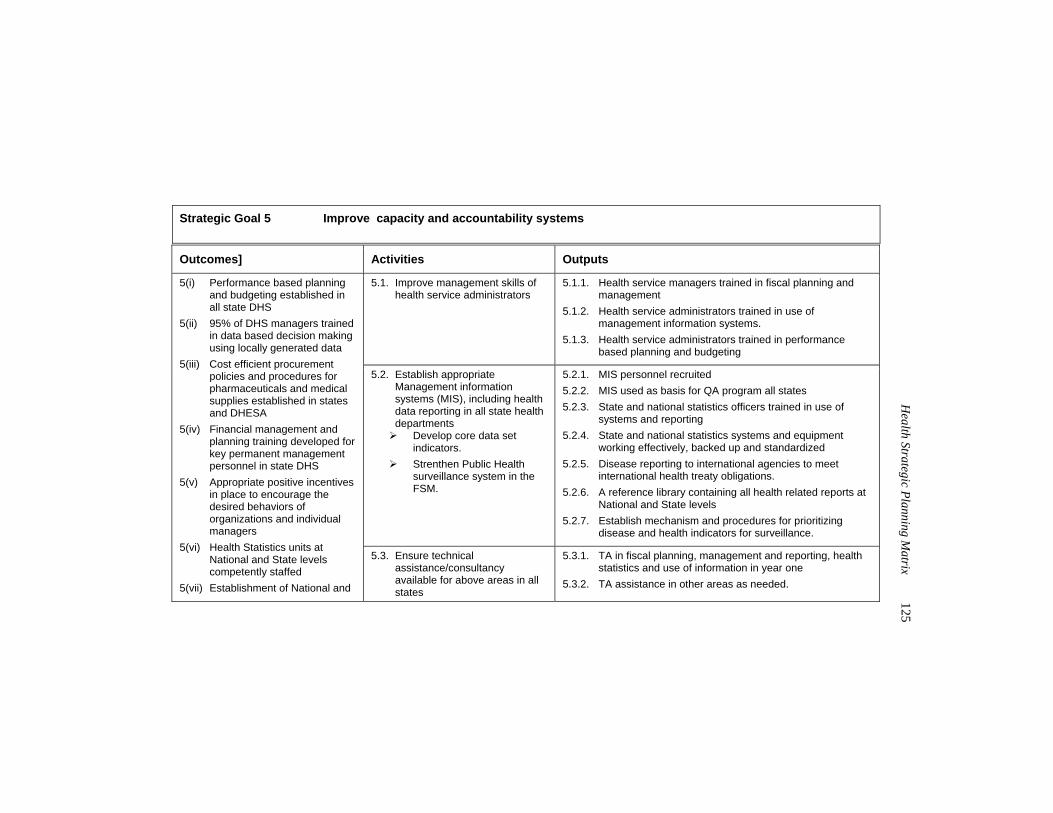
H
ealth Strategic Planning Matrix
125
Strategic Goal 5 Improve capacity and accountability systems Outcomes] Activities Outputs
5.1. Improve management skills of health service administrators
5.1.1. Health service managers trained in fiscal planning and management
5.1.2. Health service administrators trained in use of management information systems.
5.1.3. Health service administrators trained in performance based planning and budgeting
5.2. Establish appropriate Management information systems (MIS), including health data reporting in all state health departments Develop core data set
indicators. Strenthen Public Health
surveillance system in the FSM.
5.2.1. MIS personnel recruited 5.2.2. MIS used as basis for QA program all states 5.2.3. State and national statistics officers trained in use of
systems and reporting 5.2.4. State and national statistics systems and equipment
working effectively, backed up and standardized 5.2.5. Disease reporting to international agencies to meet
international health treaty obligations. 5.2.6. A reference library containing all health related reports at
National and State levels 5.2.7. Establish mechanism and procedures for prioritizing
disease and health indicators for surveillance.
5(i) Performance based planning and budgeting established in all state DHS
5(ii) 95% of DHS managers trained in data based decision making using locally generated data
5(iii) Cost efficient procurement policies and procedures for pharmaceuticals and medical supplies established in states and DHESA
5(iv) Financial management and planning training developed for key permanent management personnel in state DHS
5(v) Appropriate positive incentives in place to encourage the desired behaviors of organizations and individual managers
5(vi) Health Statistics units at National and State levels competently staffed
5(vii) Establishment of National and
5.3. Ensure technical assistance/consultancy available for above areas in all states
5.3.1. TA in fiscal planning, management and reporting, health statistics and use of information in year one
5.3.2. TA assistance in other areas as needed.
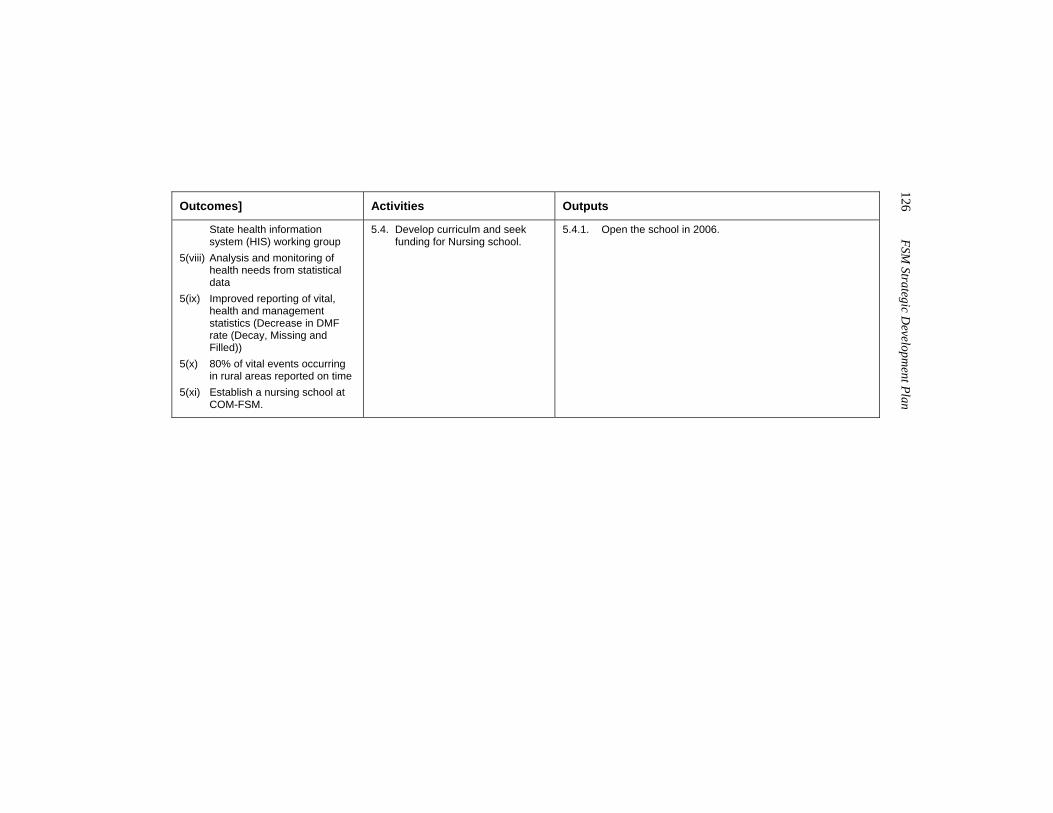
126 FSM
Strategic Developm
ent Plan
Outcomes] Activities Outputs
State health information system (HIS) working group
5(viii) Analysis and monitoring of health needs from statistical data
5(ix) Improved reporting of vital, health and management statistics (Decrease in DMF rate (Decay, Missing and Filled))
5(x) 80% of vital events occurring in rural areas reported on time
5(xi) Establish a nursing school at COM-FSM.
5.4. Develop curriculm and seek funding for Nursing school.
5.4.1. Open the school in 2006.
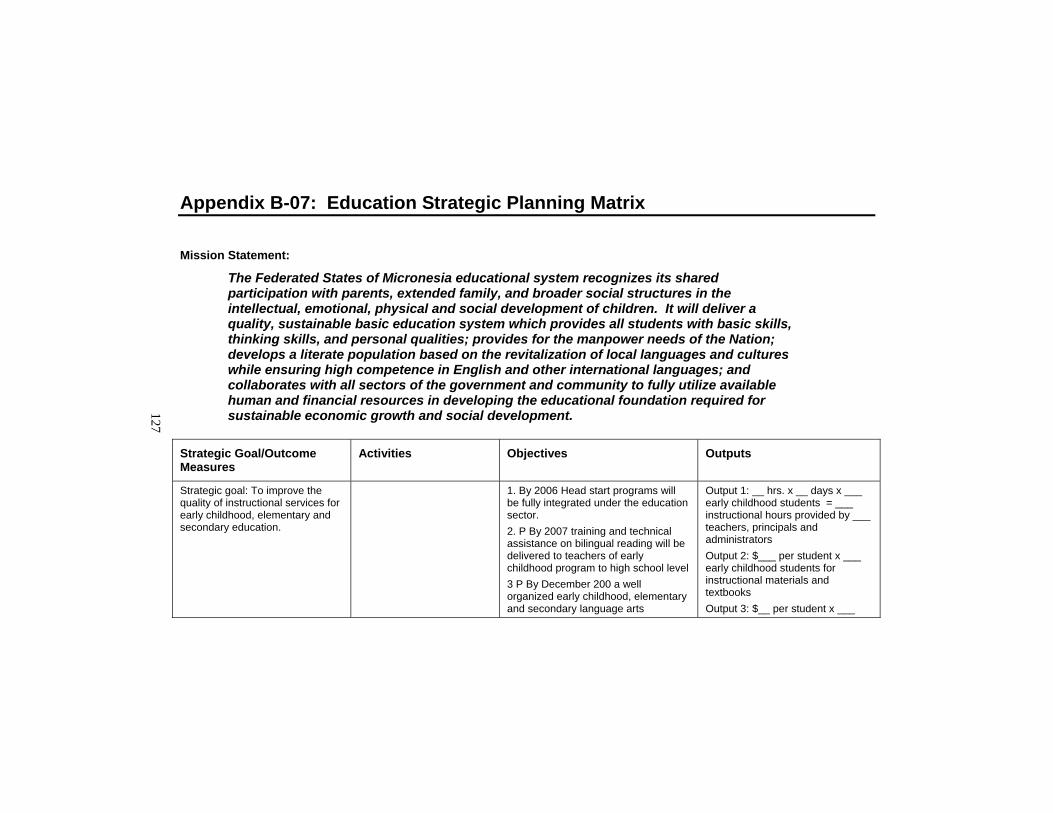
127
Appendix B-07: Education Strategic Planning Matrix
Mission Statement:
The Federated States of Micronesia educational system recognizes its shared participation with parents, extended family, and broader social structures in the intellectual, emotional, physical and social development of children. It will deliver a quality, sustainable basic education system which provides all students with basic skills, thinking skills, and personal qualities; provides for the manpower needs of the Nation; develops a literate population based on the revitalization of local languages and cultures while ensuring high competence in English and other international languages; and collaborates with all sectors of the government and community to fully utilize available human and financial resources in developing the educational foundation required for sustainable economic growth and social development.
Strategic Goal/Outcome Measures
Activities Objectives Outputs
Strategic goal: To improve the quality of instructional services for early childhood, elementary and secondary education.
1. By 2006 Head start programs will be fully integrated under the education sector. 2. P By 2007 training and technical assistance on bilingual reading will be delivered to teachers of early childhood program to high school level 3 P By December 200 a well organized early childhood, elementary and secondary language arts
Output 1: __ hrs. x __ days x ___ early childhood students = ___ instructional hours provided by ___ teachers, principals and administrators Output 2: $___ per student x ___ early childhood students for instructional materials and textbooks Output 3: $__ per student x ___
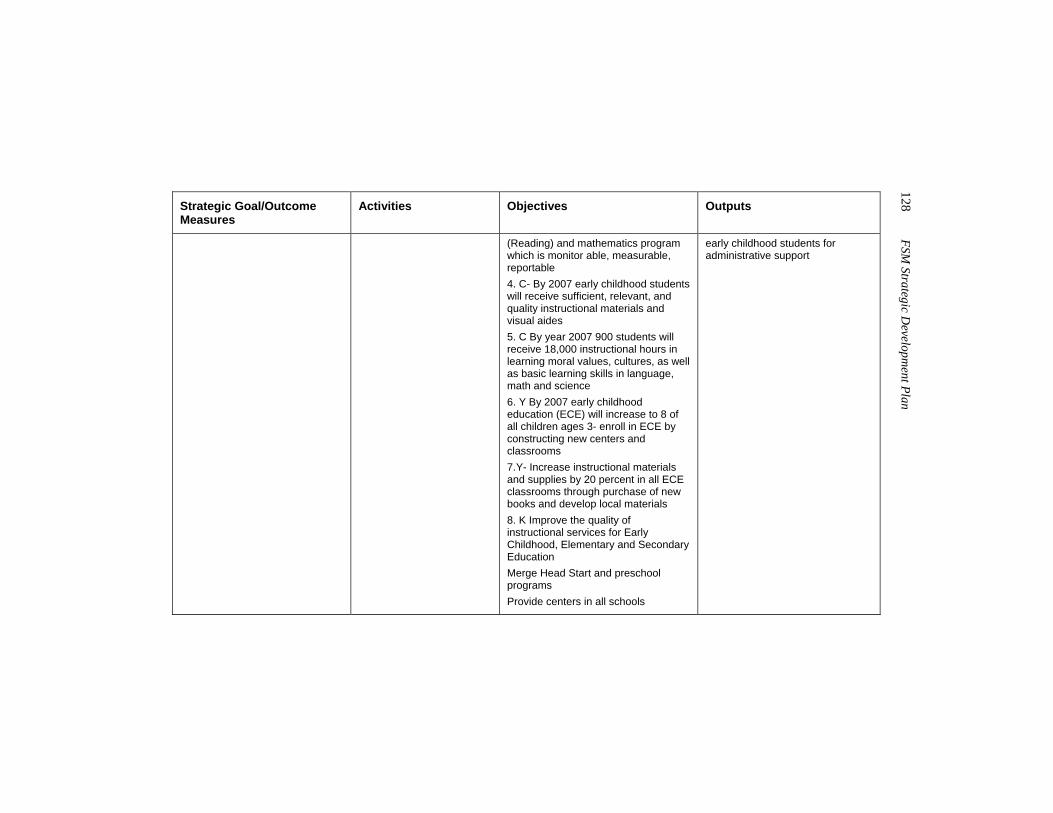
128 FSM
Strategic Developm
ent Plan
Strategic Goal/Outcome Measures
Activities Objectives Outputs
(Reading) and mathematics program which is monitor able, measurable, reportable 4. C- By 2007 early childhood students will receive sufficient, relevant, and quality instructional materials and visual aides 5. C By year 2007 900 students will receive 18,000 instructional hours in learning moral values, cultures, as well as basic learning skills in language, math and science 6. Y By 2007 early childhood education (ECE) will increase to 8 of all children ages 3- enroll in ECE by constructing new centers and classrooms 7.Y- Increase instructional materials and supplies by 20 percent in all ECE classrooms through purchase of new books and develop local materials 8. K Improve the quality of instructional services for Early Childhood, Elementary and Secondary Education Merge Head Start and preschool programs Provide centers in all schools
early childhood students for administrative support
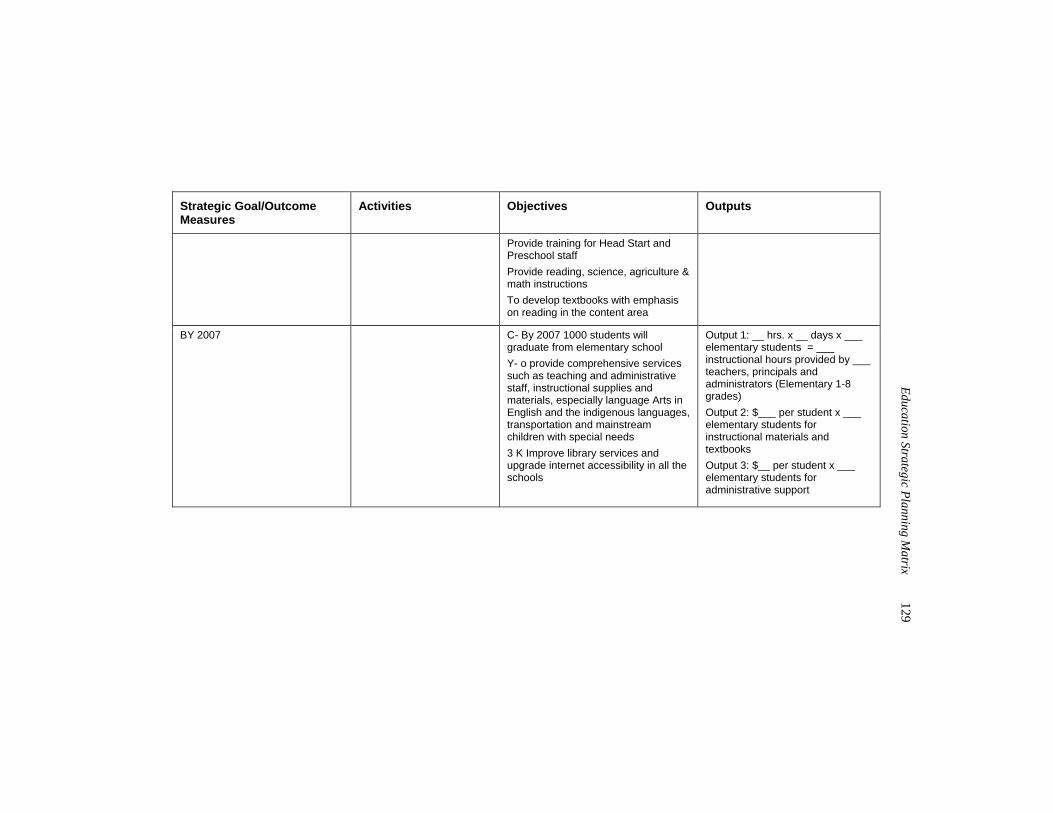
Education Strategic Planning M
atrix 129
Strategic Goal/Outcome Measures
Activities Objectives Outputs
Provide training for Head Start and Preschool staff Provide reading, science, agriculture & math instructions To develop textbooks with emphasis on reading in the content area
BY 2007
C- By 2007 1000 students will graduate from elementary school Y- o provide comprehensive services such as teaching and administrative staff, instructional supplies and materials, especially language Arts in English and the indigenous languages, transportation and mainstream children with special needs 3 K Improve library services and upgrade internet accessibility in all the schools
Output 1: __ hrs. x __ days x ___ elementary students = ___ instructional hours provided by ___ teachers, principals and administrators (Elementary 1-8 grades) Output 2: $___ per student x ___ elementary students for instructional materials and textbooks Output 3: $__ per student x ___ elementary students for administrative support
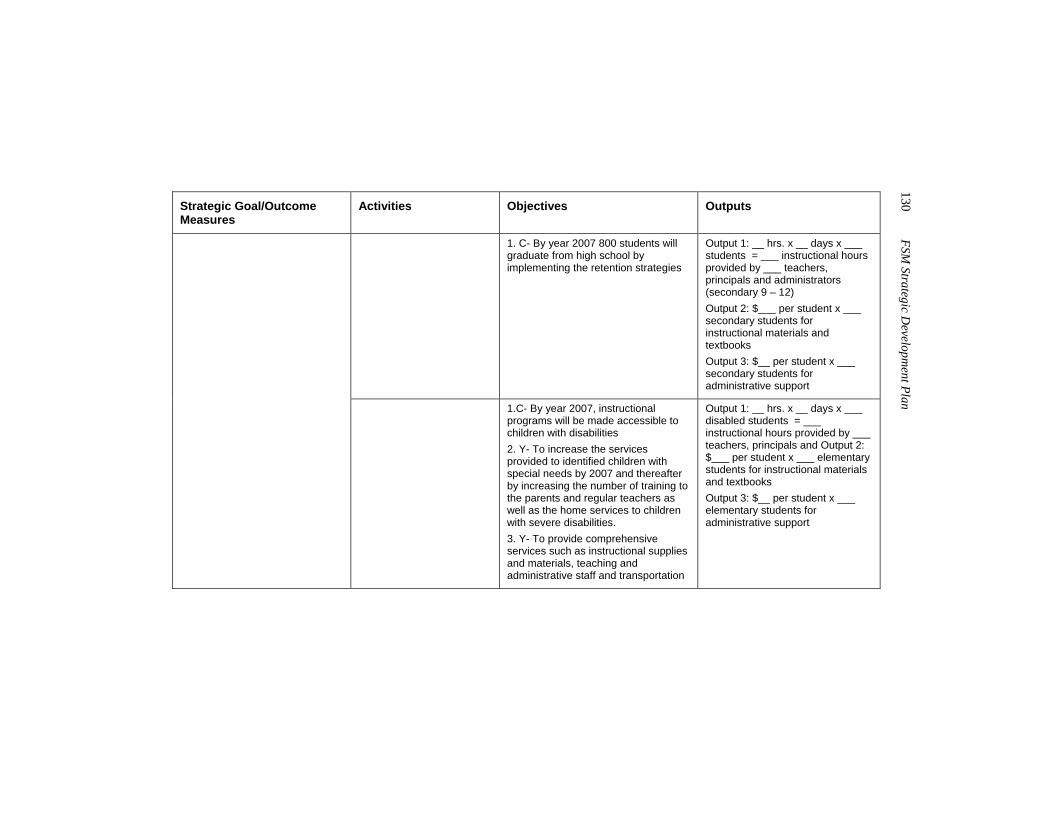
130 FSM
Strategic Developm
ent Plan
Strategic Goal/Outcome Measures
Activities Objectives Outputs
1. C- By year 2007 800 students will graduate from high school by implementing the retention strategies
Output 1: __ hrs. x __ days x ___ students = ___ instructional hours provided by ___ teachers, principals and administrators (secondary 9 – 12) Output 2: $___ per student x ___ secondary students for instructional materials and textbooks Output 3: $__ per student x ___ secondary students for administrative support
1.C- By year 2007, instructional programs will be made accessible to children with disabilities 2. Y- To increase the services provided to identified children with special needs by 2007 and thereafter by increasing the number of training to the parents and regular teachers as well as the home services to children with severe disabilities. 3. Y- To provide comprehensive services such as instructional supplies and materials, teaching and administrative staff and transportation
Output 1: __ hrs. x __ days x ___ disabled students = ___ instructional hours provided by ___ teachers, principals and Output 2: $___ per student x ___ elementary students for instructional materials and textbooks Output 3: $__ per student x ___ elementary students for administrative support
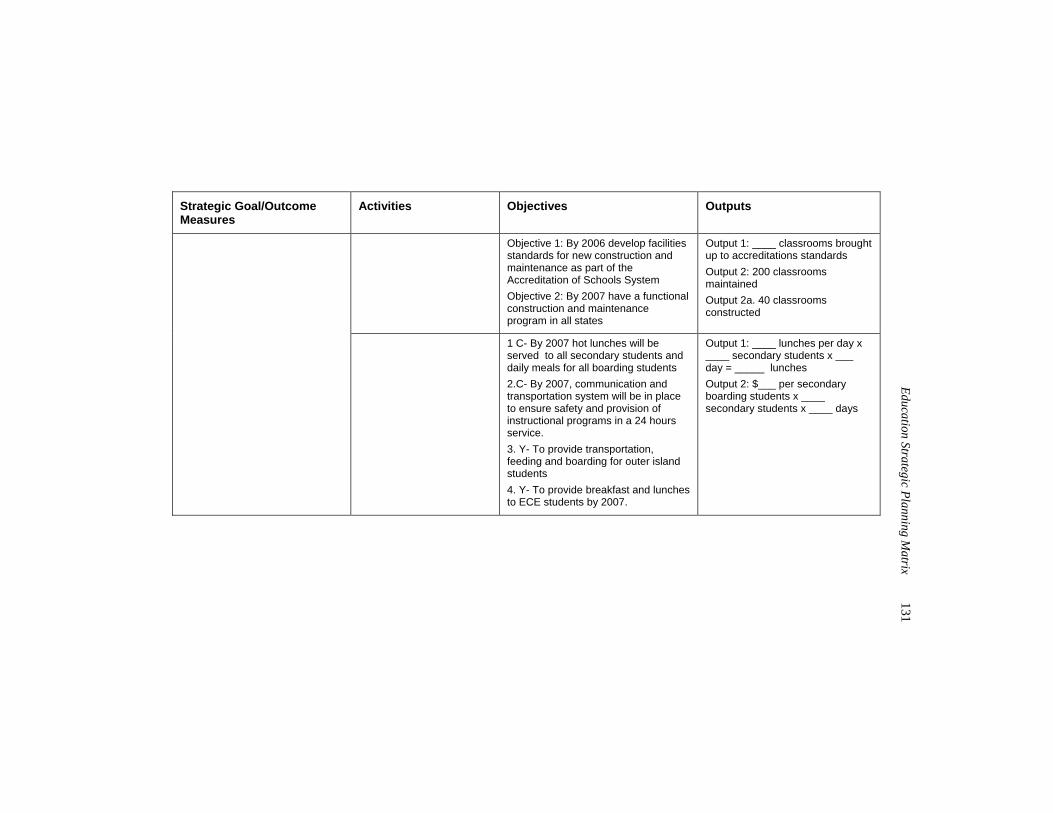
Education Strategic Planning M
atrix 131
Strategic Goal/Outcome Measures
Activities Objectives Outputs
Objective 1: By 2006 develop facilities standards for new construction and maintenance as part of the Accreditation of Schools System Objective 2: By 2007 have a functional construction and maintenance program in all states
Output 1: ____ classrooms brought up to accreditations standards Output 2: 200 classrooms maintained Output 2a. 40 classrooms constructed
1 C- By 2007 hot lunches will be served to all secondary students and daily meals for all boarding students 2.C- By 2007, communication and transportation system will be in place to ensure safety and provision of instructional programs in a 24 hours service. 3. Y- To provide transportation, feeding and boarding for outer island students 4. Y- To provide breakfast and lunches to ECE students by 2007.
Output 1: ____ lunches per day x ____ secondary students x ___ day = _____ lunches Output 2: $___ per secondary boarding students x ____ secondary students x ____ days
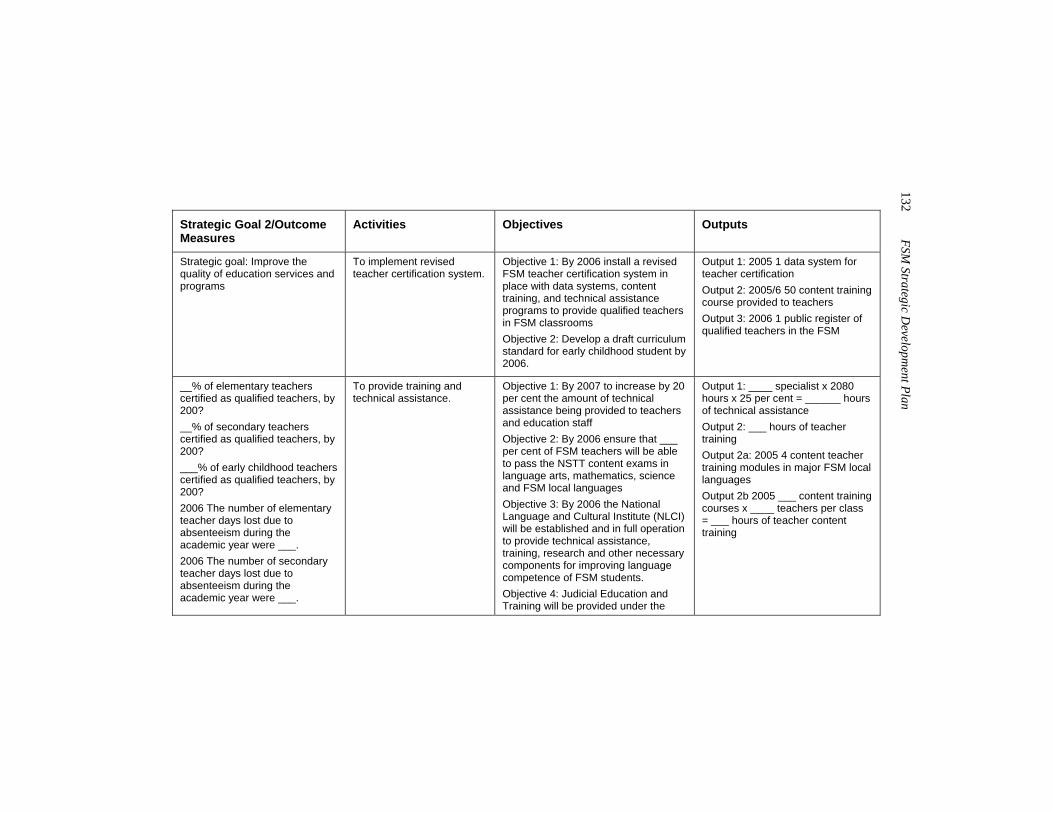
132 FSM
Strategic Developm
ent Plan
Strategic Goal 2/Outcome Measures
Activities Objectives Outputs
Strategic goal: Improve the quality of education services and programs
To implement revised teacher certification system.
Objective 1: By 2006 install a revised FSM teacher certification system in place with data systems, content training, and technical assistance programs to provide qualified teachers in FSM classrooms Objective 2: Develop a draft curriculum standard for early childhood student by 2006.
Output 1: 2005 1 data system for teacher certification Output 2: 2005/6 50 content training course provided to teachers Output 3: 2006 1 public register of qualified teachers in the FSM
__% of elementary teachers certified as qualified teachers, by 200? __% of secondary teachers certified as qualified teachers, by 200? ___% of early childhood teachers certified as qualified teachers, by 200? 2006 The number of elementary teacher days lost due to absenteeism during the academic year were ___. 2006 The number of secondary teacher days lost due to absenteeism during the academic year were ___.
To provide training and technical assistance.
Objective 1: By 2007 to increase by 20 per cent the amount of technical assistance being provided to teachers and education staff Objective 2: By 2006 ensure that ___ per cent of FSM teachers will be able to pass the NSTT content exams in language arts, mathematics, science and FSM local languages Objective 3: By 2006 the National Language and Cultural Institute (NLCI) will be established and in full operation to provide technical assistance, training, research and other necessary components for improving language competence of FSM students. Objective 4: Judicial Education and Training will be provided under the
Output 1: ____ specialist x 2080 hours x 25 per cent = ______ hours of technical assistance Output 2: ___ hours of teacher training Output 2a: 2005 4 content teacher training modules in major FSM local languages Output 2b 2005 ___ content training courses x ____ teachers per class = ___ hours of teacher content training
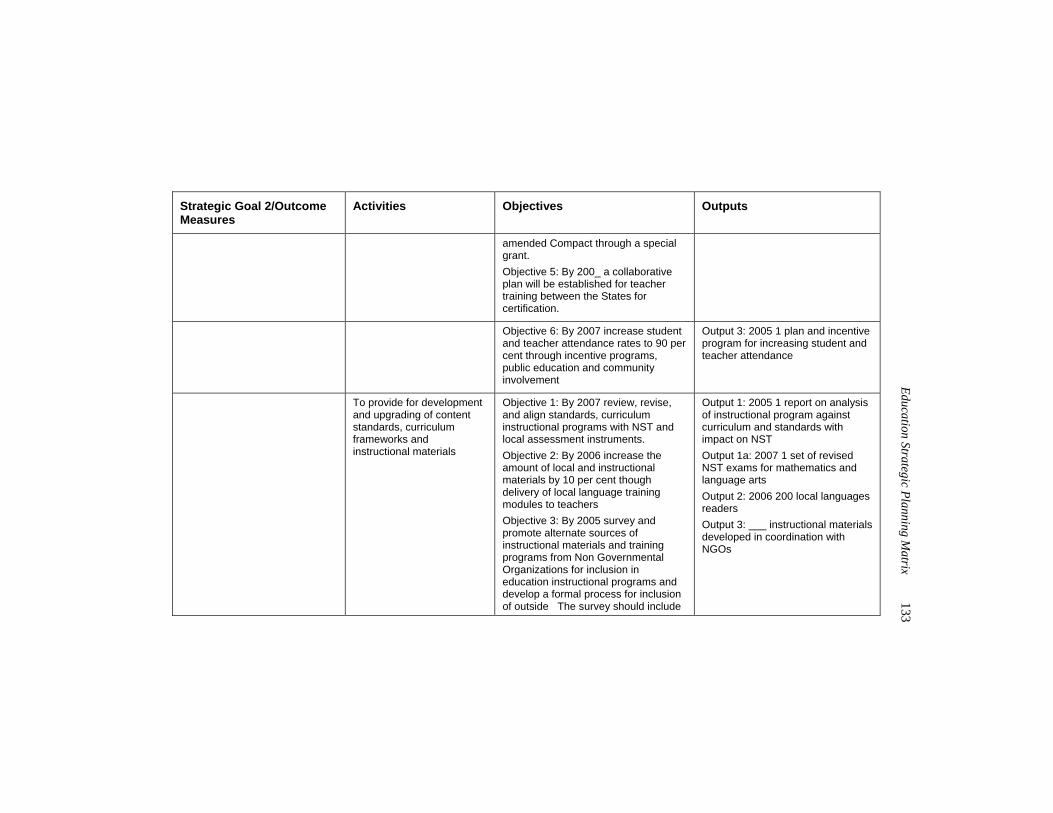
Education Strategic Planning M
atrix 133
Strategic Goal 2/Outcome Measures
Activities Objectives Outputs
amended Compact through a special grant. Objective 5: By 200_ a collaborative plan will be established for teacher training between the States for certification.
Objective 6: By 2007 increase student and teacher attendance rates to 90 per cent through incentive programs, public education and community involvement
Output 3: 2005 1 plan and incentive program for increasing student and teacher attendance
To provide for development and upgrading of content standards, curriculum frameworks and instructional materials
Objective 1: By 2007 review, revise, and align standards, curriculum instructional programs with NST and local assessment instruments. Objective 2: By 2006 increase the amount of local and instructional materials by 10 per cent though delivery of local language training modules to teachers Objective 3: By 2005 survey and promote alternate sources of instructional materials and training programs from Non Governmental Organizations for inclusion in education instructional programs and develop a formal process for inclusion of outside The survey should include
Output 1: 2005 1 report on analysis of instructional program against curriculum and standards with impact on NST Output 1a: 2007 1 set of revised NST exams for mathematics and language arts Output 2: 2006 200 local languages readers Output 3: ___ instructional materials developed in coordination with NGOs
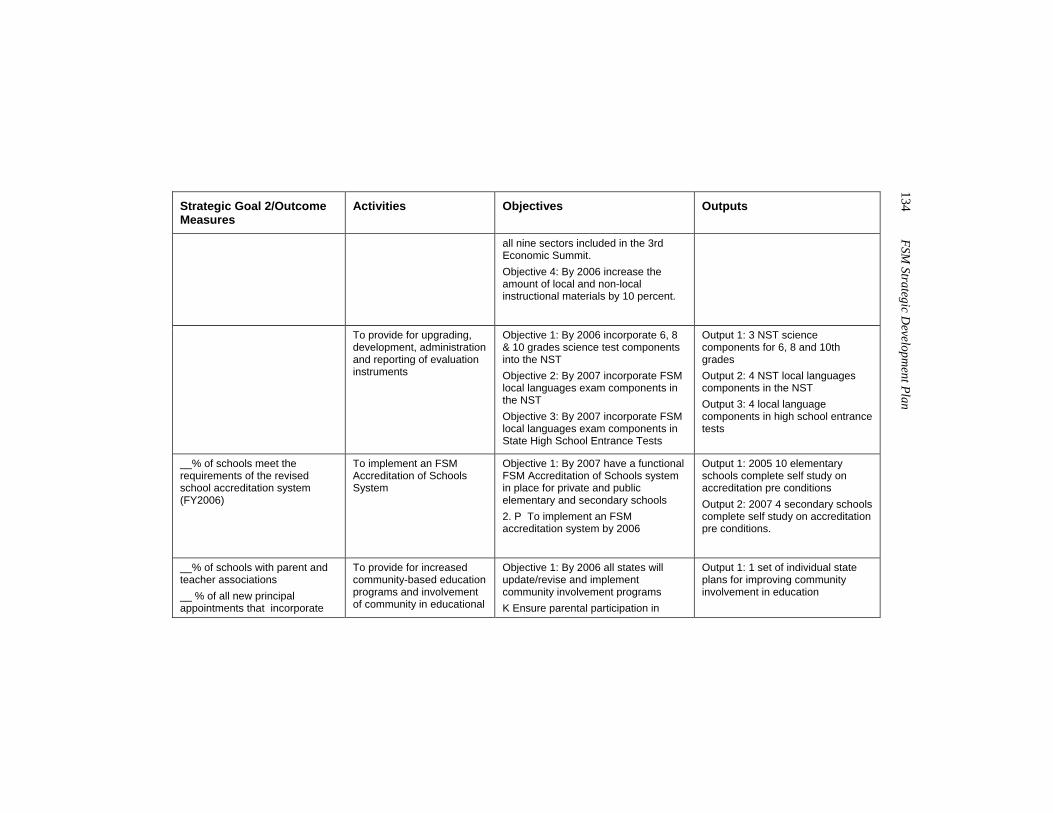
134 FSM
Strategic Developm
ent Plan
Strategic Goal 2/Outcome Measures
Activities Objectives Outputs
all nine sectors included in the 3rd Economic Summit. Objective 4: By 2006 increase the amount of local and non-local instructional materials by 10 percent.
To provide for upgrading, development, administration and reporting of evaluation instruments
Objective 1: By 2006 incorporate 6, 8 & 10 grades science test components into the NST Objective 2: By 2007 incorporate FSM local languages exam components in the NST Objective 3: By 2007 incorporate FSM local languages exam components in State High School Entrance Tests
Output 1: 3 NST science components for 6, 8 and 10th grades Output 2: 4 NST local languages components in the NST Output 3: 4 local language components in high school entrance tests
__% of schools meet the requirements of the revised school accreditation system (FY2006)
To implement an FSM Accreditation of Schools System
Objective 1: By 2007 have a functional FSM Accreditation of Schools system in place for private and public elementary and secondary schools 2. P To implement an FSM accreditation system by 2006
Output 1: 2005 10 elementary schools complete self study on accreditation pre conditions Output 2: 2007 4 secondary schools complete self study on accreditation pre conditions.
__% of schools with parent and teacher associations __ % of all new principal appointments that incorporate
To provide for increased community-based education programs and involvement of community in educational
Objective 1: By 2006 all states will update/revise and implement community involvement programs K Ensure parental participation in
Output 1: 1 set of individual state plans for improving community involvement in education
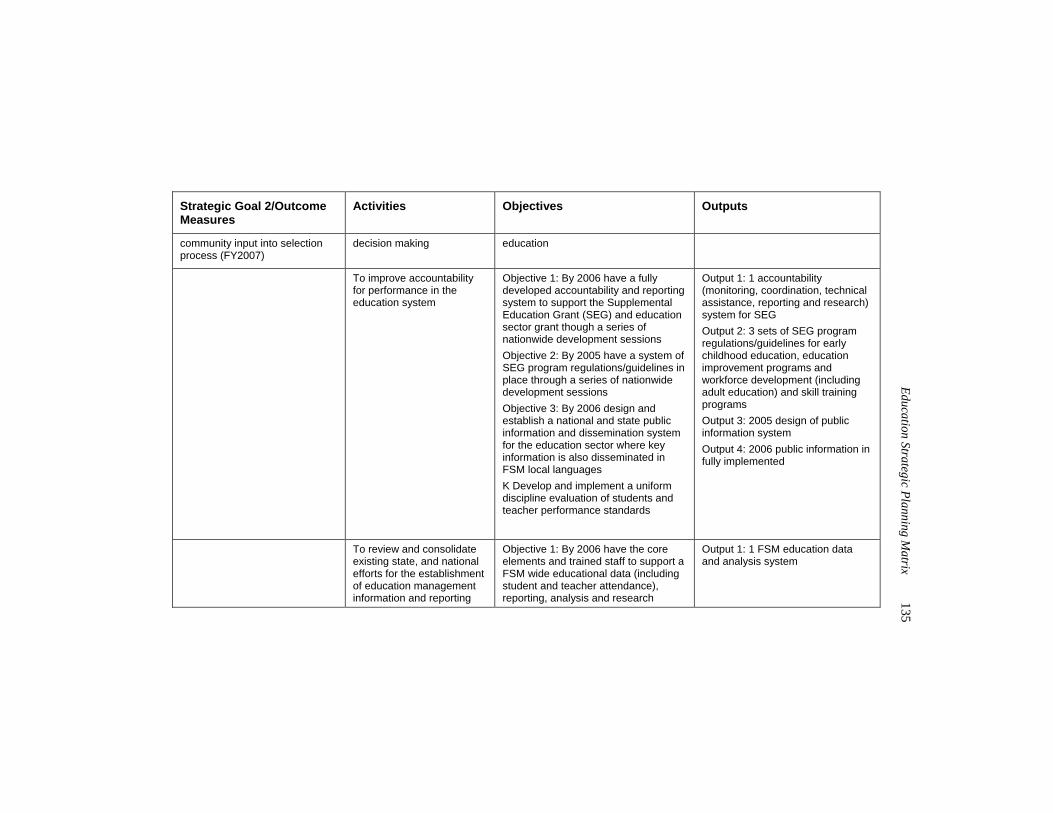
Education Strategic Planning M
atrix 135
Strategic Goal 2/Outcome Measures
Activities Objectives Outputs
community input into selection process (FY2007)
decision making education
To improve accountability for performance in the education system
Objective 1: By 2006 have a fully developed accountability and reporting system to support the Supplemental Education Grant (SEG) and education sector grant though a series of nationwide development sessions Objective 2: By 2005 have a system of SEG program regulations/guidelines in place through a series of nationwide development sessions Objective 3: By 2006 design and establish a national and state public information and dissemination system for the education sector where key information is also disseminated in FSM local languages K Develop and implement a uniform discipline evaluation of students and teacher performance standards
Output 1: 1 accountability (monitoring, coordination, technical assistance, reporting and research) system for SEG Output 2: 3 sets of SEG program regulations/guidelines for early childhood education, education improvement programs and workforce development (including adult education) and skill training programs Output 3: 2005 design of public information system Output 4: 2006 public information in fully implemented
To review and consolidate existing state, and national efforts for the establishment of education management information and reporting
Objective 1: By 2006 have the core elements and trained staff to support a FSM wide educational data (including student and teacher attendance), reporting, analysis and research
Output 1: 1 FSM education data and analysis system
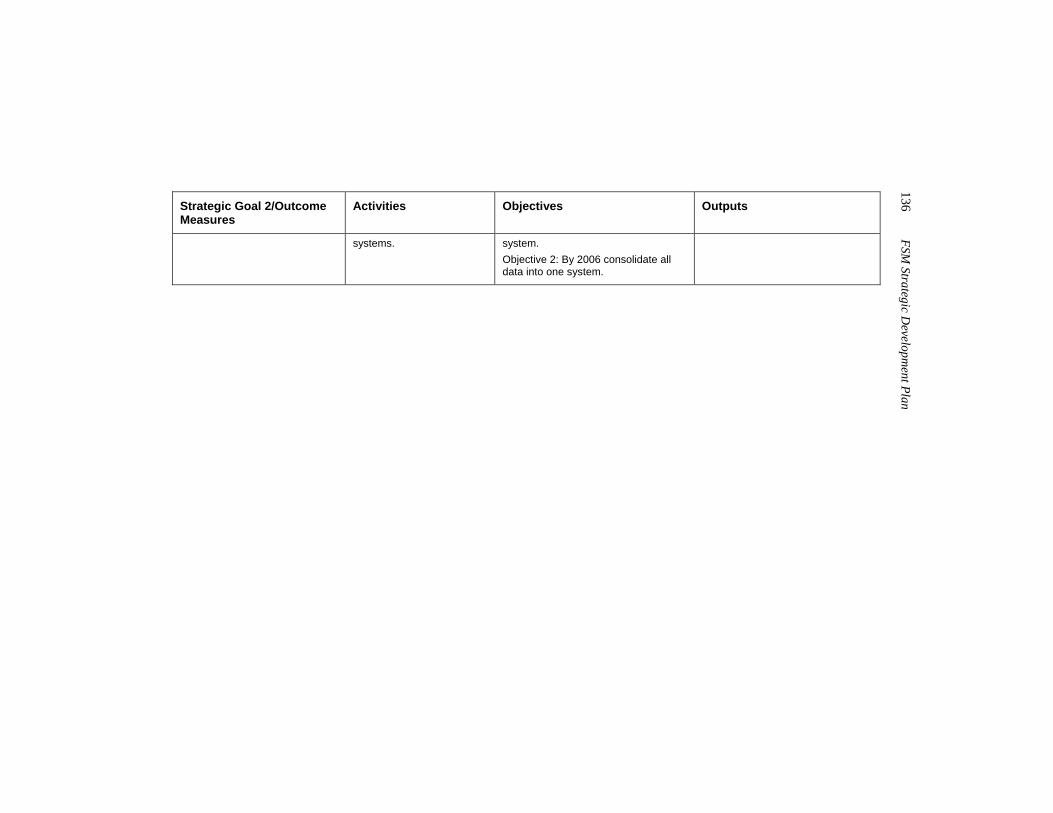
136 FSM
Strategic Developm
ent Plan
Strategic Goal 2/Outcome Measures
Activities Objectives Outputs
systems. system. Objective 2: By 2006 consolidate all data into one system.
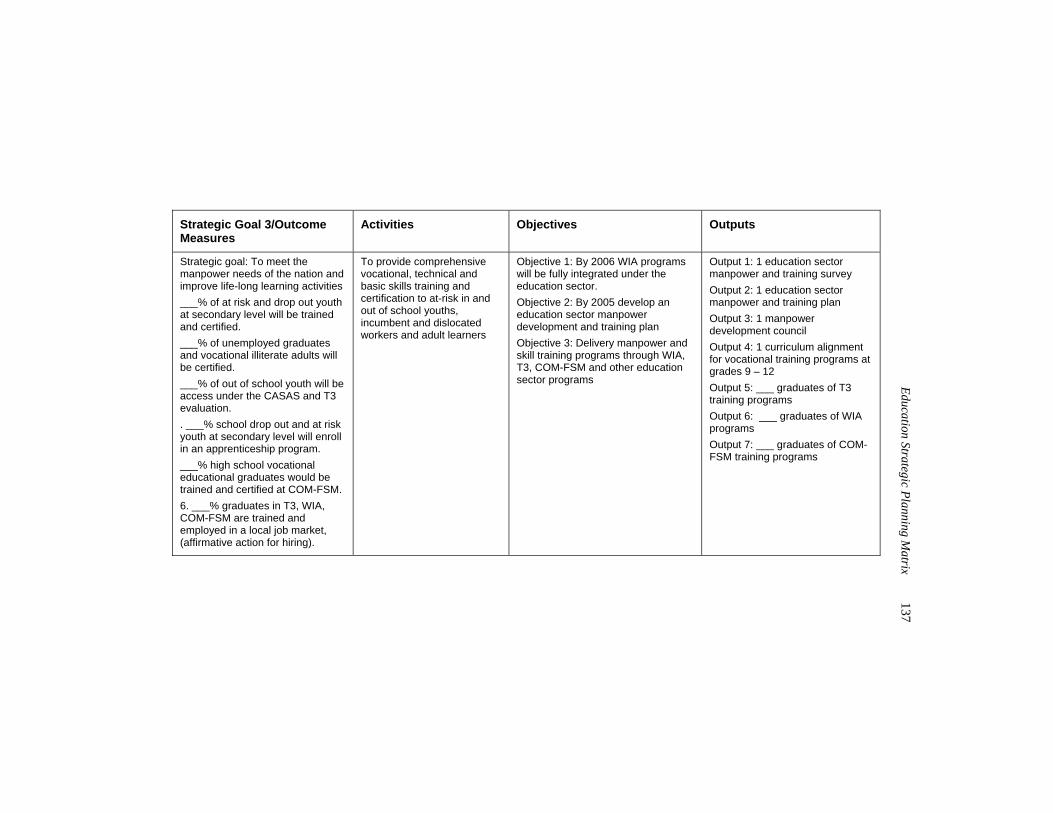
Education Strategic Planning M
atrix 137
Strategic Goal 3/Outcome Measures
Activities Objectives Outputs
Strategic goal: To meet the manpower needs of the nation and improve life-long learning activities ___% of at risk and drop out youth at secondary level will be trained and certified. ___% of unemployed graduates and vocational illiterate adults will be certified. ___% of out of school youth will be access under the CASAS and T3 evaluation. . ___% school drop out and at risk youth at secondary level will enroll in an apprenticeship program. ___% high school vocational educational graduates would be trained and certified at COM-FSM. 6. ___% graduates in T3, WIA, COM-FSM are trained and employed in a local job market, (affirmative action for hiring).
To provide comprehensive vocational, technical and basic skills training and certification to at-risk in and out of school youths, incumbent and dislocated workers and adult learners
Objective 1: By 2006 WIA programs will be fully integrated under the education sector. Objective 2: By 2005 develop an education sector manpower development and training plan Objective 3: Delivery manpower and skill training programs through WIA, T3, COM-FSM and other education sector programs
Output 1: 1 education sector manpower and training survey Output 2: 1 education sector manpower and training plan Output 3: 1 manpower development council Output 4: 1 curriculum alignment for vocational training programs at grades 9 – 12 Output 5: ___ graduates of T3 training programs Output 6: ___ graduates of WIA programs Output 7: ___ graduates of COM-FSM training programs
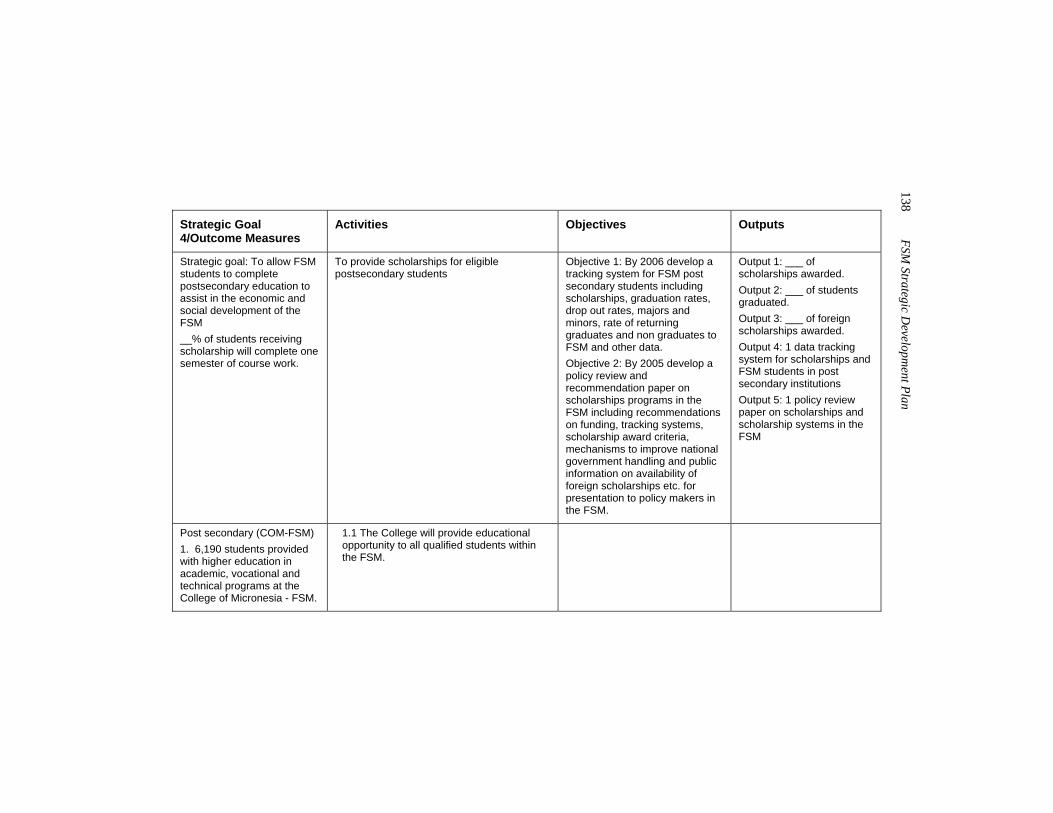
138 FSM
Strategic Developm
ent Plan
Strategic Goal 4/Outcome Measures
Activities Objectives Outputs
Strategic goal: To allow FSM students to complete postsecondary education to assist in the economic and social development of the FSM __% of students receiving scholarship will complete one semester of course work.
To provide scholarships for eligible postsecondary students
Objective 1: By 2006 develop a tracking system for FSM post secondary students including scholarships, graduation rates, drop out rates, majors and minors, rate of returning graduates and non graduates to FSM and other data. Objective 2: By 2005 develop a policy review and recommendation paper on scholarships programs in the FSM including recommendations on funding, tracking systems, scholarship award criteria, mechanisms to improve national government handling and public information on availability of foreign scholarships etc. for presentation to policy makers in the FSM.
Output 1: ___ of scholarships awarded. Output 2: ___ of students graduated. Output 3: ___ of foreign scholarships awarded. Output 4: 1 data tracking system for scholarships and FSM students in post secondary institutions Output 5: 1 policy review paper on scholarships and scholarship systems in the FSM
Post secondary (COM-FSM) 1. 6,190 students provided with higher education in academic, vocational and technical programs at the College of Micronesia - FSM.
1.1 The College will provide educational opportunity to all qualified students within the FSM.
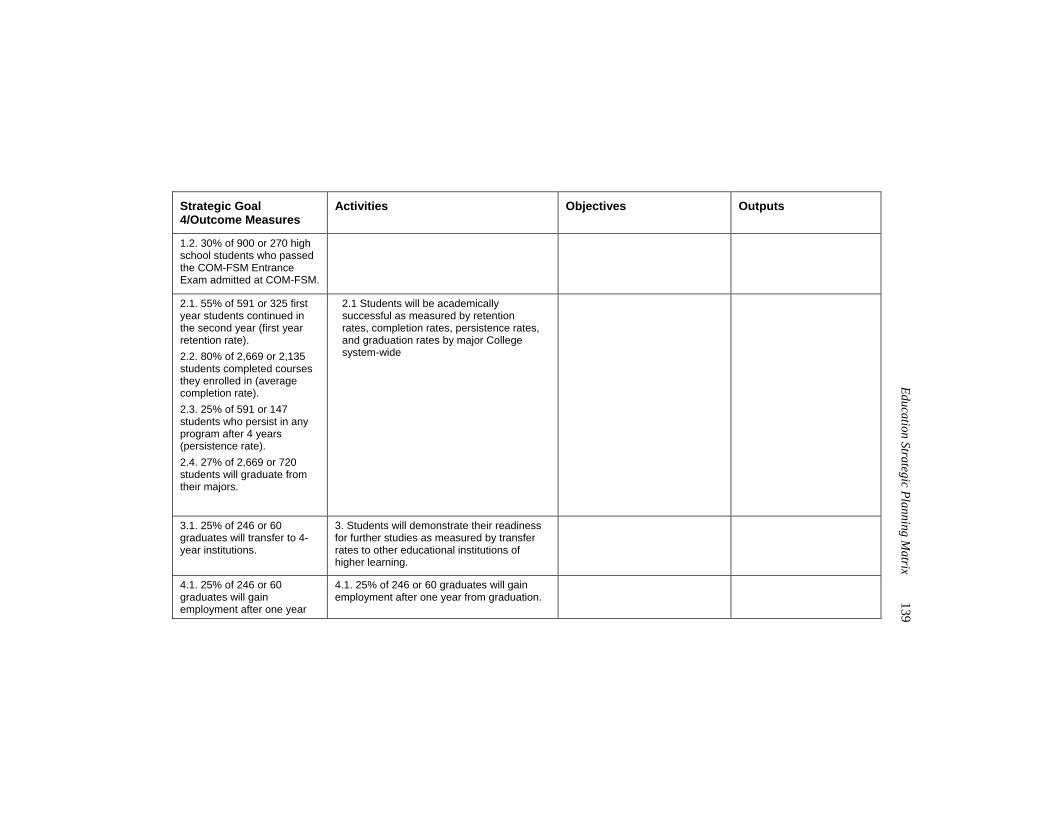
Education Strategic Planning M
atrix 139
Strategic Goal 4/Outcome Measures
Activities Objectives Outputs
1.2. 30% of 900 or 270 high school students who passed the COM-FSM Entrance Exam admitted at COM-FSM.
2.1. 55% of 591 or 325 first year students continued in the second year (first year retention rate). 2.2. 80% of 2,669 or 2,135 students completed courses they enrolled in (average completion rate). 2.3. 25% of 591 or 147 students who persist in any program after 4 years (persistence rate). 2.4. 27% of 2,669 or 720 students will graduate from their majors.
2.1 Students will be academically successful as measured by retention rates, completion rates, persistence rates, and graduation rates by major College system-wide
3.1. 25% of 246 or 60 graduates will transfer to 4-year institutions.
3. Students will demonstrate their readiness for further studies as measured by transfer rates to other educational institutions of higher learning.
4.1. 25% of 246 or 60 graduates will gain employment after one year
4.1. 25% of 246 or 60 graduates will gain employment after one year from graduation.
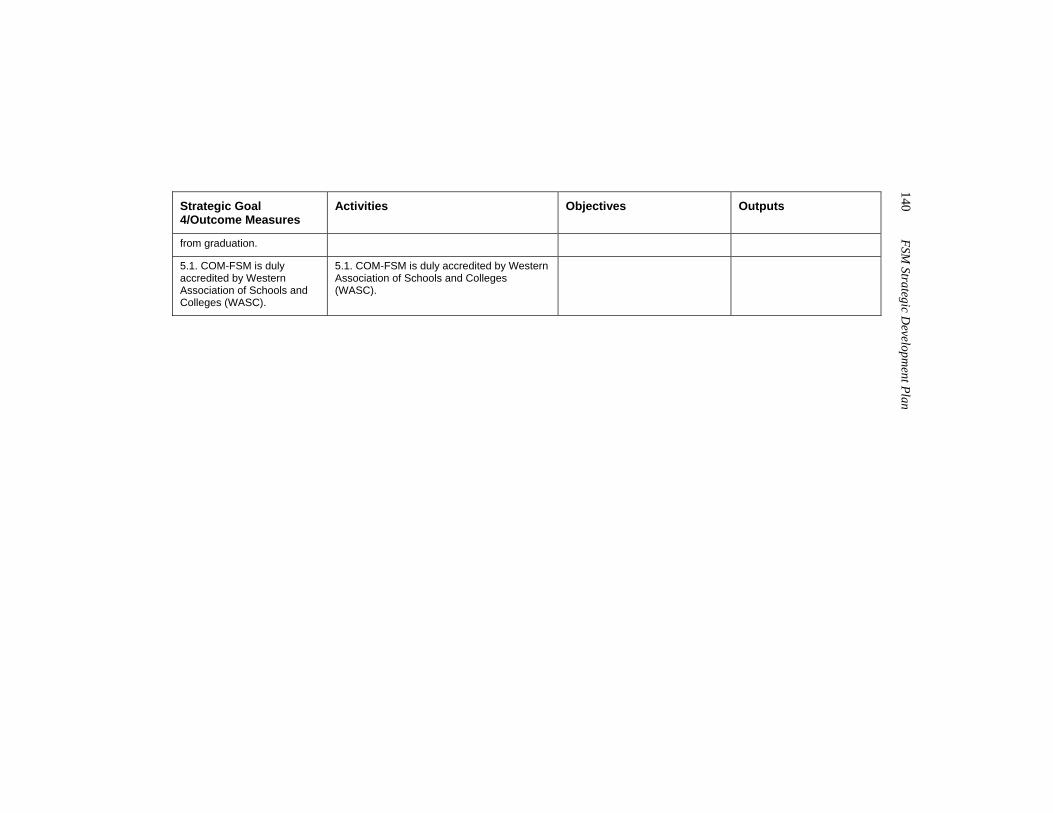
140 FSM
Strategic Developm
ent Plan
Strategic Goal 4/Outcome Measures
Activities Objectives Outputs
from graduation.
5.1. COM-FSM is duly accredited by Western Association of Schools and Colleges (WASC).
5.1. COM-FSM is duly accredited by Western Association of Schools and Colleges (WASC).
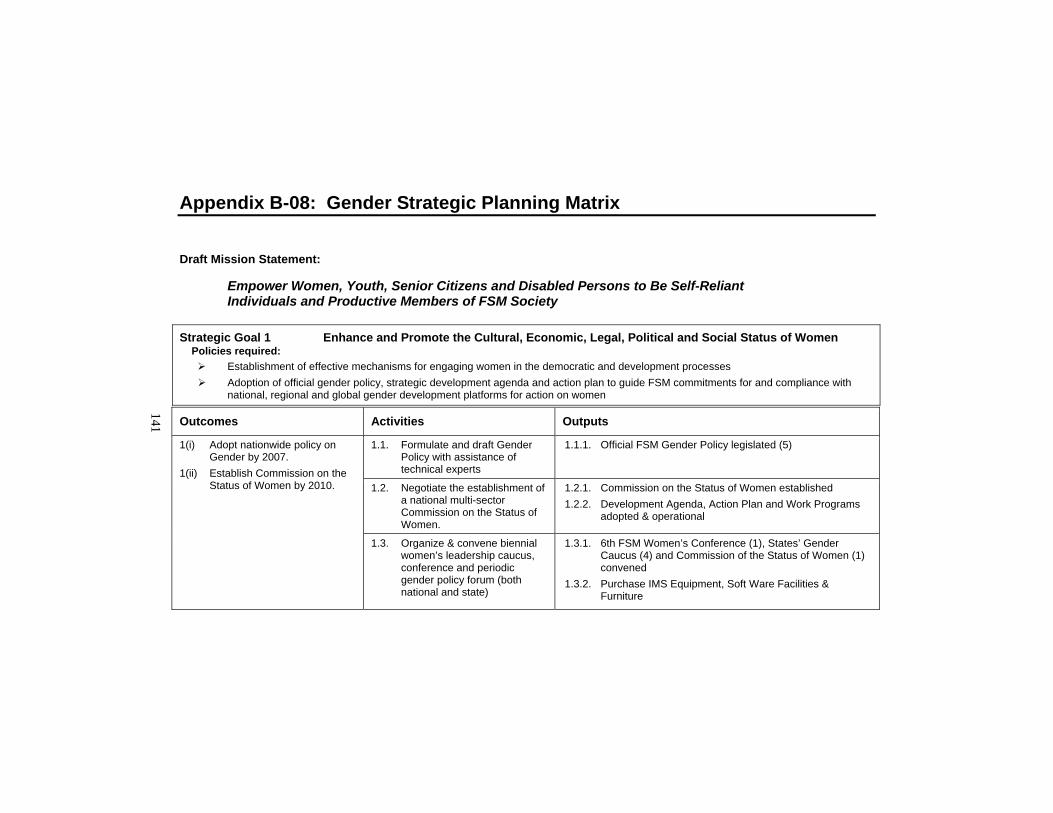
141
Appendix B-08: Gender Strategic Planning Matrix
Draft Mission Statement:
Empower Women, Youth, Senior Citizens and Disabled Persons to Be Self-Reliant Individuals and Productive Members of FSM Society
Strategic Goal 1 Enhance and Promote the Cultural, Economic, Legal, Political and Social Status of Women Policies required:
Establishment of effective mechanisms for engaging women in the democratic and development processes Adoption of official gender policy, strategic development agenda and action plan to guide FSM commitments for and compliance with
national, regional and global gender development platforms for action on women Outcomes Activities Outputs
1.1. Formulate and draft Gender Policy with assistance of technical experts
1.1.1. Official FSM Gender Policy legislated (5)
1.2. Negotiate the establishment of a national multi-sector Commission on the Status of Women.
1.2.1. Commission on the Status of Women established 1.2.2. Development Agenda, Action Plan and Work Programs
adopted & operational
1(i) Adopt nationwide policy on Gender by 2007.
1(ii) Establish Commission on the Status of Women by 2010.
1.3. Organize & convene biennial women’s leadership caucus, conference and periodic gender policy forum (both national and state)
1.3.1. 6th FSM Women’s Conference (1), States’ Gender Caucus (4) and Commission of the Status of Women (1) convened
1.3.2. Purchase IMS Equipment, Soft Ware Facilities & Furniture
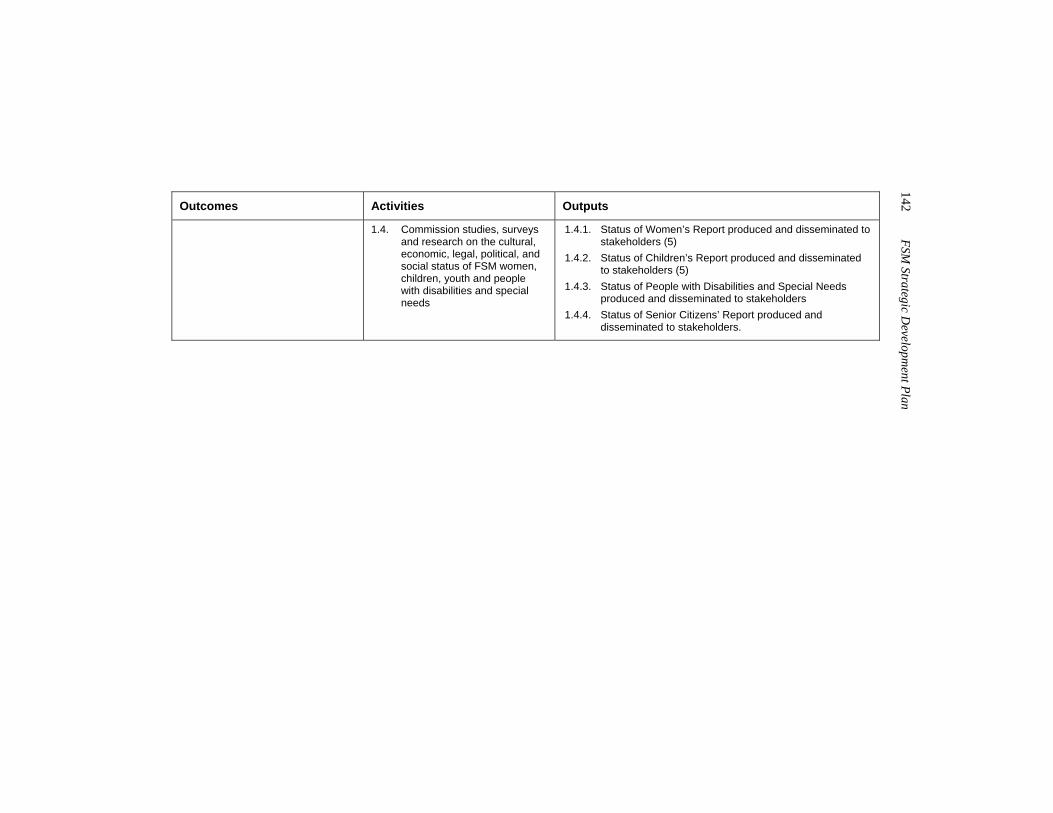
142 FSM
Strategic Developm
ent Plan
Outcomes Activities Outputs
1.4. Commission studies, surveys and research on the cultural, economic, legal, political, and social status of FSM women, children, youth and people with disabilities and special needs
1.4.1. Status of Women’s Report produced and disseminated to stakeholders (5)
1.4.2. Status of Children’s Report produced and disseminated to stakeholders (5)
1.4.3. Status of People with Disabilities and Special Needs produced and disseminated to stakeholders
1.4.4. Status of Senior Citizens’ Report produced and disseminated to stakeholders.
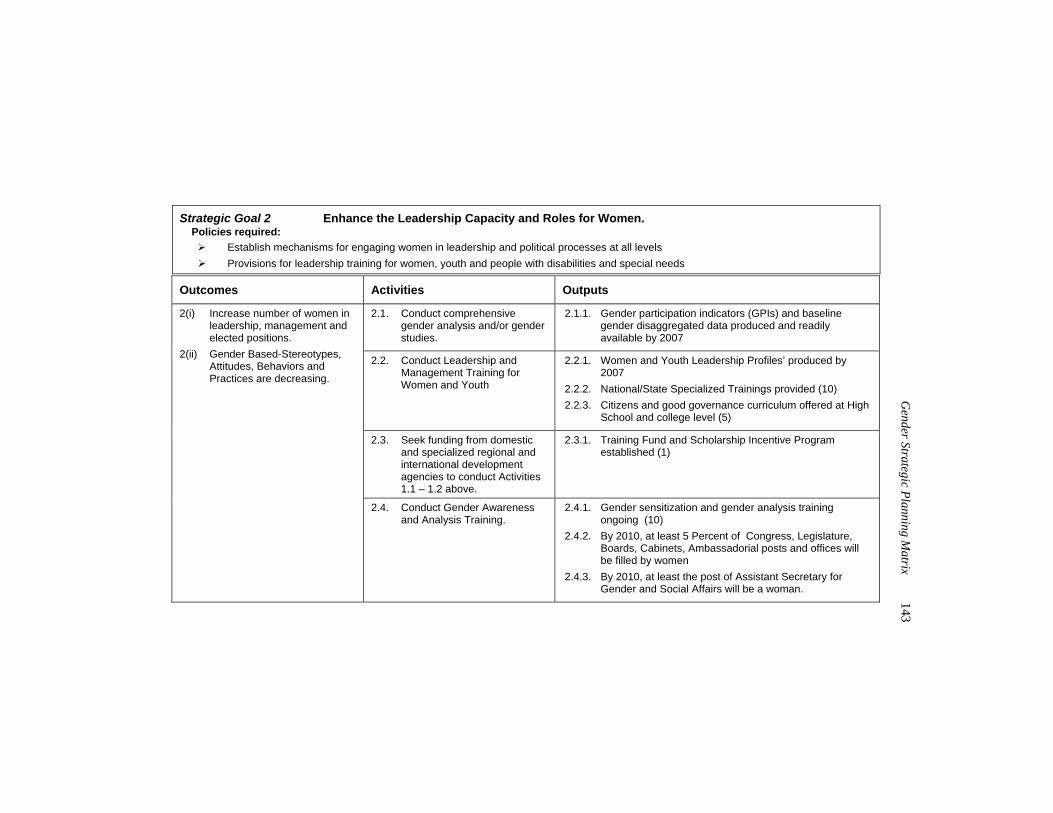
G
ender Strategic Planning Matrix
143
Strategic Goal 2 Enhance the Leadership Capacity and Roles for Women.
Policies required: Establish mechanisms for engaging women in leadership and political processes at all levels Provisions for leadership training for women, youth and people with disabilities and special needs
Outcomes Activities Outputs
2.1. Conduct comprehensive gender analysis and/or gender studies.
2.1.1. Gender participation indicators (GPIs) and baseline gender disaggregated data produced and readily available by 2007
2.2. Conduct Leadership and Management Training for Women and Youth
2.2.1. Women and Youth Leadership Profiles’ produced by 2007
2.2.2. National/State Specialized Trainings provided (10) 2.2.3. Citizens and good governance curriculum offered at High
School and college level (5)
2.3. Seek funding from domestic and specialized regional and international development agencies to conduct Activities 1.1 – 1.2 above.
2.3.1. Training Fund and Scholarship Incentive Program established (1)
2(i) Increase number of women in leadership, management and elected positions.
2(ii) Gender Based-Stereotypes, Attitudes, Behaviors and Practices are decreasing.
2.4. Conduct Gender Awareness and Analysis Training.
2.4.1. Gender sensitization and gender analysis training ongoing (10)
2.4.2. By 2010, at least 5 Percent of Congress, Legislature, Boards, Cabinets, Ambassadorial posts and offices will be filled by women
2.4.3. By 2010, at least the post of Assistant Secretary for Gender and Social Affairs will be a woman.
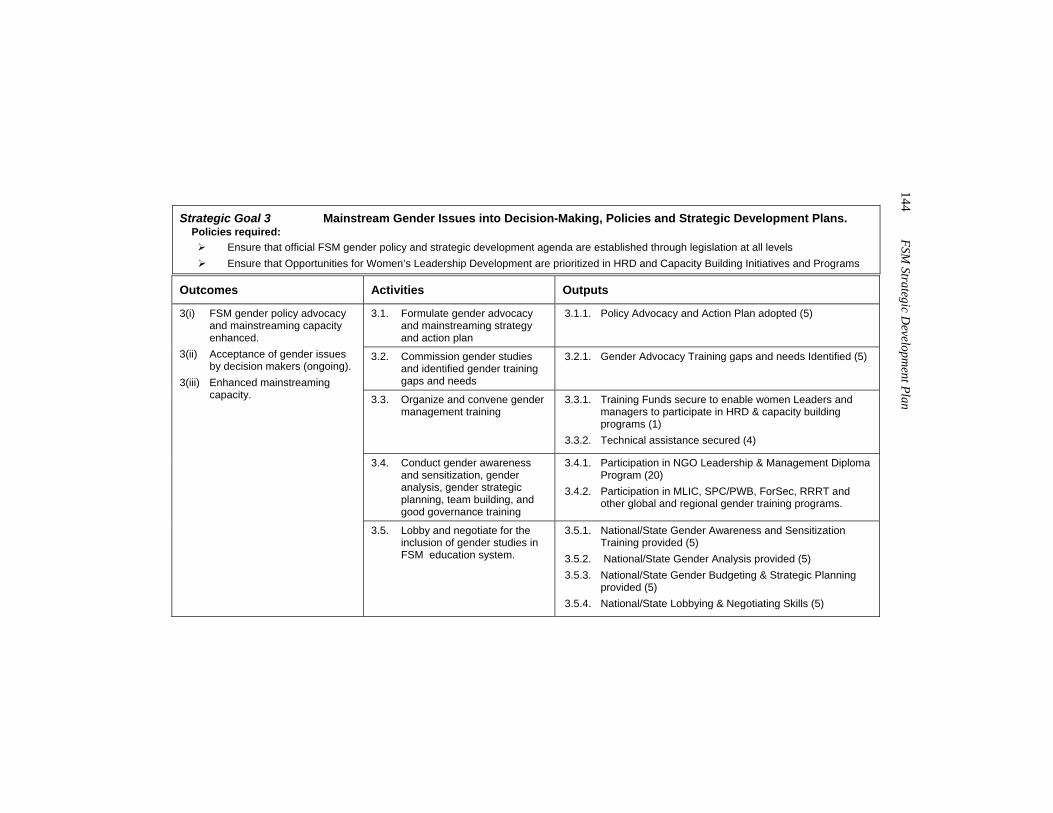
144 FSM
Strategic Developm
ent Plan
Strategic Goal 3 Mainstream Gender Issues into Decision-Making, Policies and Strategic Development Plans.
Policies required: Ensure that official FSM gender policy and strategic development agenda are established through legislation at all levels Ensure that Opportunities for Women’s Leadership Development are prioritized in HRD and Capacity Building Initiatives and Programs
Outcomes Activities Outputs
3.1. Formulate gender advocacy and mainstreaming strategy and action plan
3.1.1. Policy Advocacy and Action Plan adopted (5)
3.2. Commission gender studies and identified gender training gaps and needs
3.2.1. Gender Advocacy Training gaps and needs Identified (5)
3.3. Organize and convene gender management training
3.3.1. Training Funds secure to enable women Leaders and managers to participate in HRD & capacity building programs (1)
3.3.2. Technical assistance secured (4)
3.4. Conduct gender awareness and sensitization, gender analysis, gender strategic planning, team building, and good governance training
3.4.1. Participation in NGO Leadership & Management Diploma Program (20)
3.4.2. Participation in MLIC, SPC/PWB, ForSec, RRRT and other global and regional gender training programs.
3(i) FSM gender policy advocacy and mainstreaming capacity enhanced.
3(ii) Acceptance of gender issues by decision makers (ongoing).
3(iii) Enhanced mainstreaming capacity.
3.5. Lobby and negotiate for the inclusion of gender studies in FSM education system.
3.5.1. National/State Gender Awareness and Sensitization Training provided (5)
3.5.2. National/State Gender Analysis provided (5) 3.5.3. National/State Gender Budgeting & Strategic Planning
provided (5) 3.5.4. National/State Lobbying & Negotiating Skills (5)
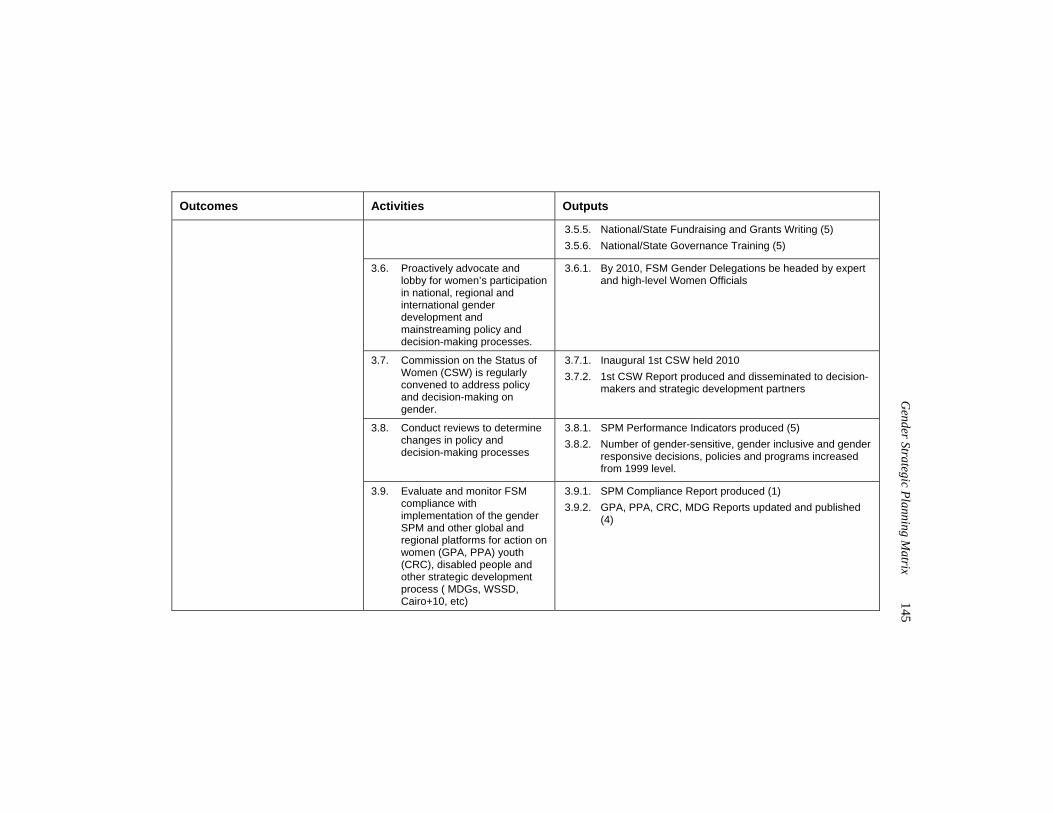
G
ender Strategic Planning Matrix
145
Outcomes Activities Outputs
3.5.5. National/State Fundraising and Grants Writing (5) 3.5.6. National/State Governance Training (5)
3.6. Proactively advocate and lobby for women’s participation in national, regional and international gender development and mainstreaming policy and decision-making processes.
3.6.1. By 2010, FSM Gender Delegations be headed by expert and high-level Women Officials
3.7. Commission on the Status of Women (CSW) is regularly convened to address policy and decision-making on gender.
3.7.1. Inaugural 1st CSW held 2010 3.7.2. 1st CSW Report produced and disseminated to decision-
makers and strategic development partners
3.8. Conduct reviews to determine changes in policy and decision-making processes
3.8.1. SPM Performance Indicators produced (5) 3.8.2. Number of gender-sensitive, gender inclusive and gender
responsive decisions, policies and programs increased from 1999 level.
3.9. Evaluate and monitor FSM compliance with implementation of the gender SPM and other global and regional platforms for action on women (GPA, PPA) youth (CRC), disabled people and other strategic development process ( MDGs, WSSD, Cairo+10, etc)
3.9.1. SPM Compliance Report produced (1) 3.9.2. GPA, PPA, CRC, MDG Reports updated and published
(4)
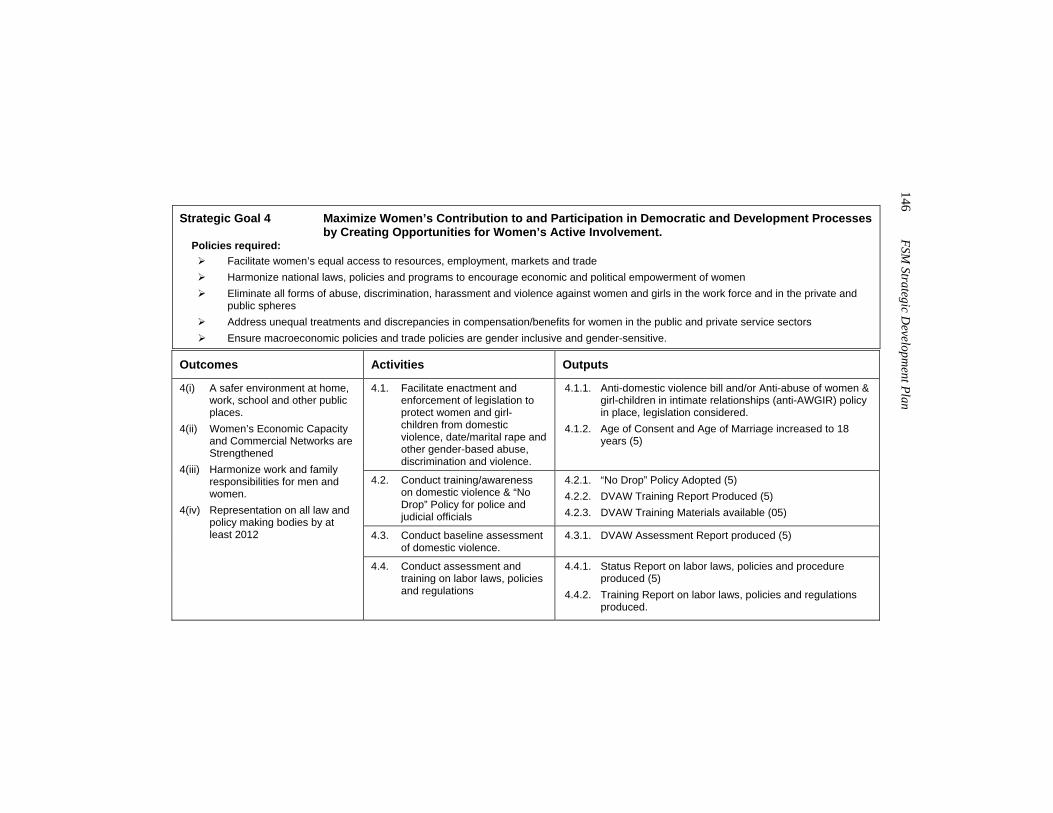
146 FSM
Strategic Developm
ent Plan
Strategic Goal 4 Maximize Women’s Contribution to and Participation in Democratic and Development Processes
by Creating Opportunities for Women’s Active Involvement. Policies required:
Facilitate women’s equal access to resources, employment, markets and trade Harmonize national laws, policies and programs to encourage economic and political empowerment of women Eliminate all forms of abuse, discrimination, harassment and violence against women and girls in the work force and in the private and
public spheres Address unequal treatments and discrepancies in compensation/benefits for women in the public and private service sectors Ensure macroeconomic policies and trade policies are gender inclusive and gender-sensitive.
Outcomes Activities Outputs
4.1. Facilitate enactment and enforcement of legislation to protect women and girl-children from domestic violence, date/marital rape and other gender-based abuse, discrimination and violence.
4.1.1. Anti-domestic violence bill and/or Anti-abuse of women & girl-children in intimate relationships (anti-AWGIR) policy in place, legislation considered.
4.1.2. Age of Consent and Age of Marriage increased to 18 years (5)
4.2. Conduct training/awareness on domestic violence & “No Drop” Policy for police and judicial officials
4.2.1. “No Drop” Policy Adopted (5) 4.2.2. DVAW Training Report Produced (5) 4.2.3. DVAW Training Materials available (05)
4.3. Conduct baseline assessment of domestic violence.
4.3.1. DVAW Assessment Report produced (5)
4(i) A safer environment at home, work, school and other public places.
4(ii) Women’s Economic Capacity and Commercial Networks are Strengthened
4(iii) Harmonize work and family responsibilities for men and women.
4(iv) Representation on all law and policy making bodies by at least 2012
4.4. Conduct assessment and training on labor laws, policies and regulations
4.4.1. Status Report on labor laws, policies and procedure produced (5)
4.4.2. Training Report on labor laws, policies and regulations produced.
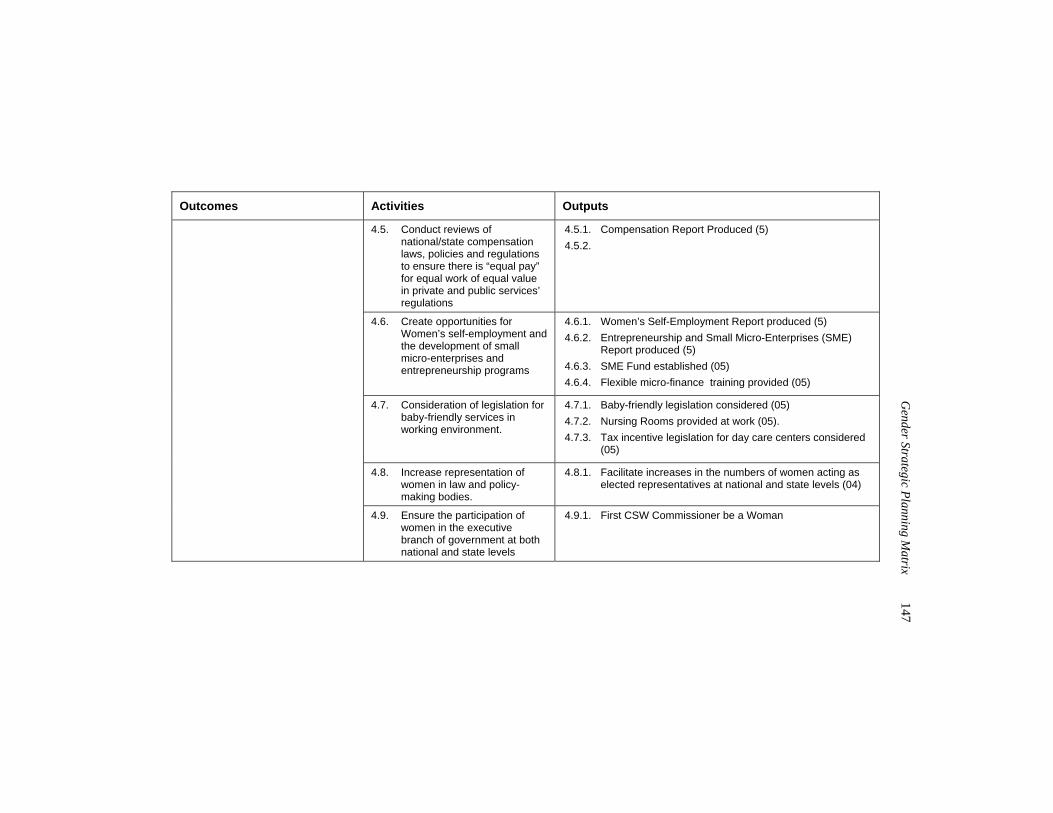
G
ender Strategic Planning Matrix
147
Outcomes Activities Outputs
4.5. Conduct reviews of national/state compensation laws, policies and regulations to ensure there is “equal pay” for equal work of equal value in private and public services’ regulations
4.5.1. Compensation Report Produced (5) 4.5.2.
4.6. Create opportunities for Women’s self-employment and the development of small micro-enterprises and entrepreneurship programs
4.6.1. Women’s Self-Employment Report produced (5) 4.6.2. Entrepreneurship and Small Micro-Enterprises (SME)
Report produced (5) 4.6.3. SME Fund established (05) 4.6.4. Flexible micro-finance training provided (05)
4.7. Consideration of legislation for baby-friendly services in working environment.
4.7.1. Baby-friendly legislation considered (05) 4.7.2. Nursing Rooms provided at work (05). 4.7.3. Tax incentive legislation for day care centers considered
(05)
4.8. Increase representation of women in law and policy-making bodies.
4.8.1. Facilitate increases in the numbers of women acting as elected representatives at national and state levels (04)
4.9. Ensure the participation of women in the executive branch of government at both national and state levels
4.9.1. First CSW Commissioner be a Woman
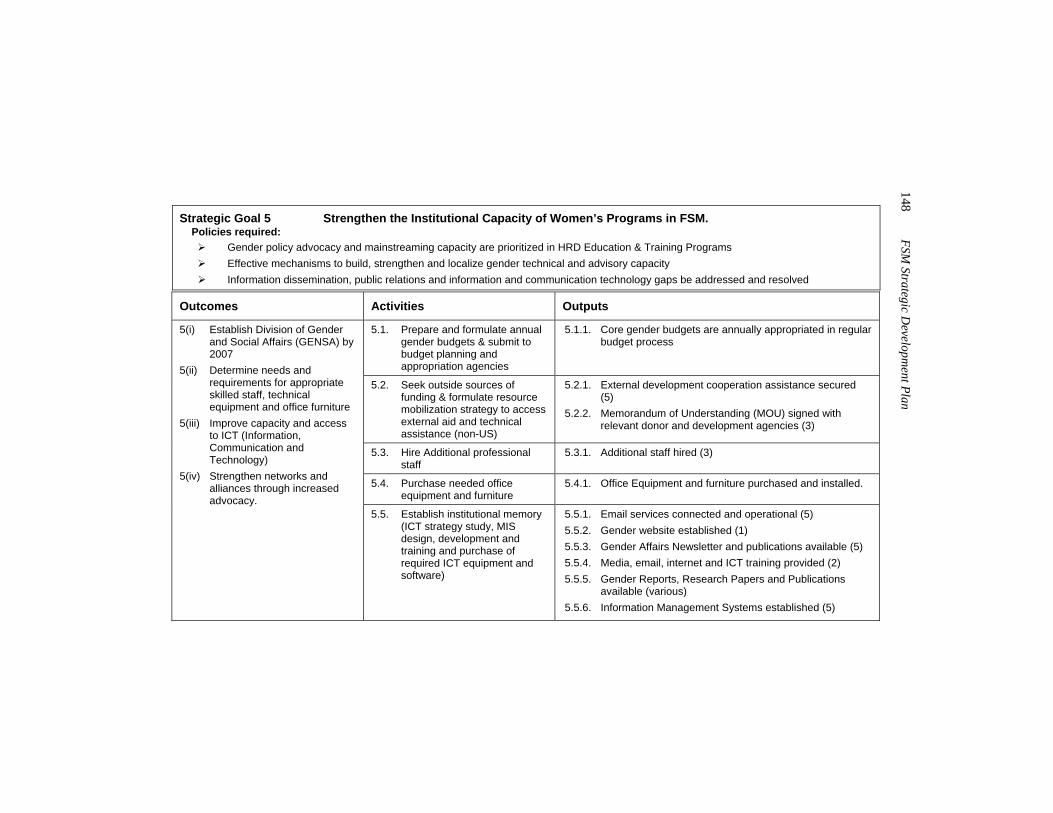
148 FSM
Strategic Developm
ent Plan
Strategic Goal 5 Strengthen the Institutional Capacity of Women’s Programs in FSM.
Policies required: Gender policy advocacy and mainstreaming capacity are prioritized in HRD Education & Training Programs Effective mechanisms to build, strengthen and localize gender technical and advisory capacity Information dissemination, public relations and information and communication technology gaps be addressed and resolved
Outcomes Activities Outputs
5.1. Prepare and formulate annual gender budgets & submit to budget planning and appropriation agencies
5.1.1. Core gender budgets are annually appropriated in regular budget process
5.2. Seek outside sources of funding & formulate resource mobilization strategy to access external aid and technical assistance (non-US)
5.2.1. External development cooperation assistance secured (5)
5.2.2. Memorandum of Understanding (MOU) signed with relevant donor and development agencies (3)
5.3. Hire Additional professional staff
5.3.1. Additional staff hired (3)
5.4. Purchase needed office equipment and furniture
5.4.1. Office Equipment and furniture purchased and installed.
5(i) Establish Division of Gender and Social Affairs (GENSA) by 2007
5(ii) Determine needs and requirements for appropriate skilled staff, technical equipment and office furniture
5(iii) Improve capacity and access to ICT (Information, Communication and Technology)
5(iv) Strengthen networks and alliances through increased advocacy.
5.5. Establish institutional memory (ICT strategy study, MIS design, development and training and purchase of required ICT equipment and software)
5.5.1. Email services connected and operational (5) 5.5.2. Gender website established (1) 5.5.3. Gender Affairs Newsletter and publications available (5) 5.5.4. Media, email, internet and ICT training provided (2) 5.5.5. Gender Reports, Research Papers and Publications
available (various) 5.5.6. Information Management Systems established (5)
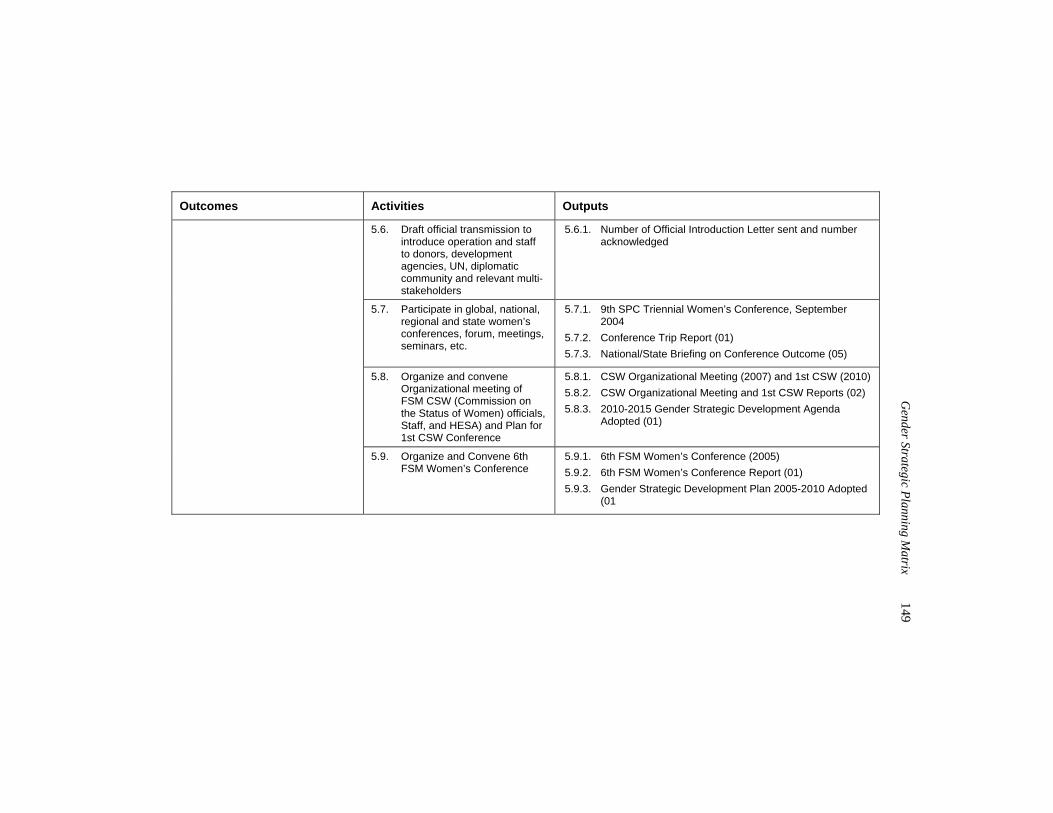
G
ender Strategic Planning Matrix
149
Outcomes Activities Outputs
5.6. Draft official transmission to introduce operation and staff to donors, development agencies, UN, diplomatic community and relevant multi-stakeholders
5.6.1. Number of Official Introduction Letter sent and number acknowledged
5.7. Participate in global, national, regional and state women’s conferences, forum, meetings, seminars, etc.
5.7.1. 9th SPC Triennial Women’s Conference, September 2004
5.7.2. Conference Trip Report (01) 5.7.3. National/State Briefing on Conference Outcome (05)
5.8. Organize and convene Organizational meeting of FSM CSW (Commission on the Status of Women) officials, Staff, and HESA) and Plan for 1st CSW Conference
5.8.1. CSW Organizational Meeting (2007) and 1st CSW (2010) 5.8.2. CSW Organizational Meeting and 1st CSW Reports (02) 5.8.3. 2010-2015 Gender Strategic Development Agenda
Adopted (01)
5.9. Organize and Convene 6th FSM Women’s Conference
5.9.1. 6th FSM Women’s Conference (2005) 5.9.2. 6th FSM Women’s Conference Report (01) 5.9.3. Gender Strategic Development Plan 2005-2010 Adopted
(01
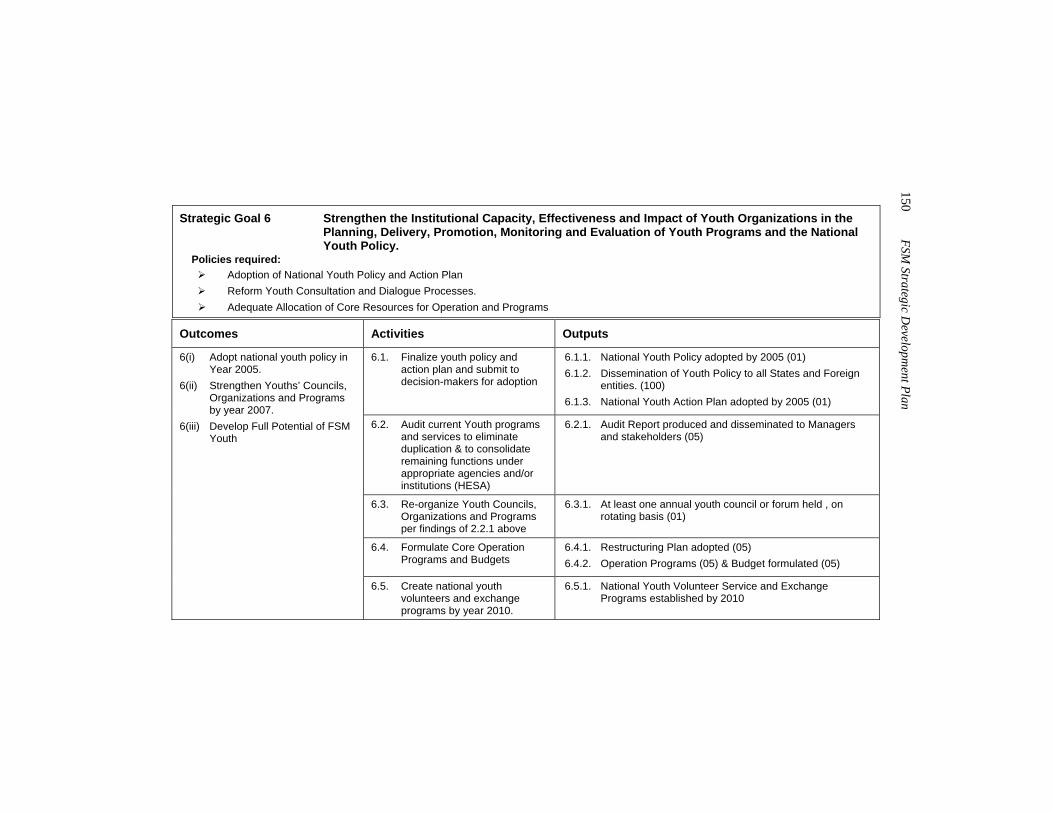
150 FSM
Strategic Developm
ent Plan
Strategic Goal 6 Strengthen the Institutional Capacity, Effectiveness and Impact of Youth Organizations in the
Planning, Delivery, Promotion, Monitoring and Evaluation of Youth Programs and the National Youth Policy.
Policies required: Adoption of National Youth Policy and Action Plan Reform Youth Consultation and Dialogue Processes. Adequate Allocation of Core Resources for Operation and Programs
Outcomes Activities Outputs
6.1. Finalize youth policy and action plan and submit to decision-makers for adoption
6.1.1. National Youth Policy adopted by 2005 (01) 6.1.2. Dissemination of Youth Policy to all States and Foreign
entities. (100) 6.1.3. National Youth Action Plan adopted by 2005 (01)
6.2. Audit current Youth programs and services to eliminate duplication & to consolidate remaining functions under appropriate agencies and/or institutions (HESA)
6.2.1. Audit Report produced and disseminated to Managers and stakeholders (05)
6.3. Re-organize Youth Councils, Organizations and Programs per findings of 2.2.1 above
6.3.1. At least one annual youth council or forum held , on rotating basis (01)
6.4. Formulate Core Operation Programs and Budgets
6.4.1. Restructuring Plan adopted (05) 6.4.2. Operation Programs (05) & Budget formulated (05)
6(i) Adopt national youth policy in Year 2005.
6(ii) Strengthen Youths’ Councils, Organizations and Programs by year 2007.
6(iii) Develop Full Potential of FSM Youth
6.5. Create national youth volunteers and exchange programs by year 2010.
6.5.1. National Youth Volunteer Service and Exchange Programs established by 2010
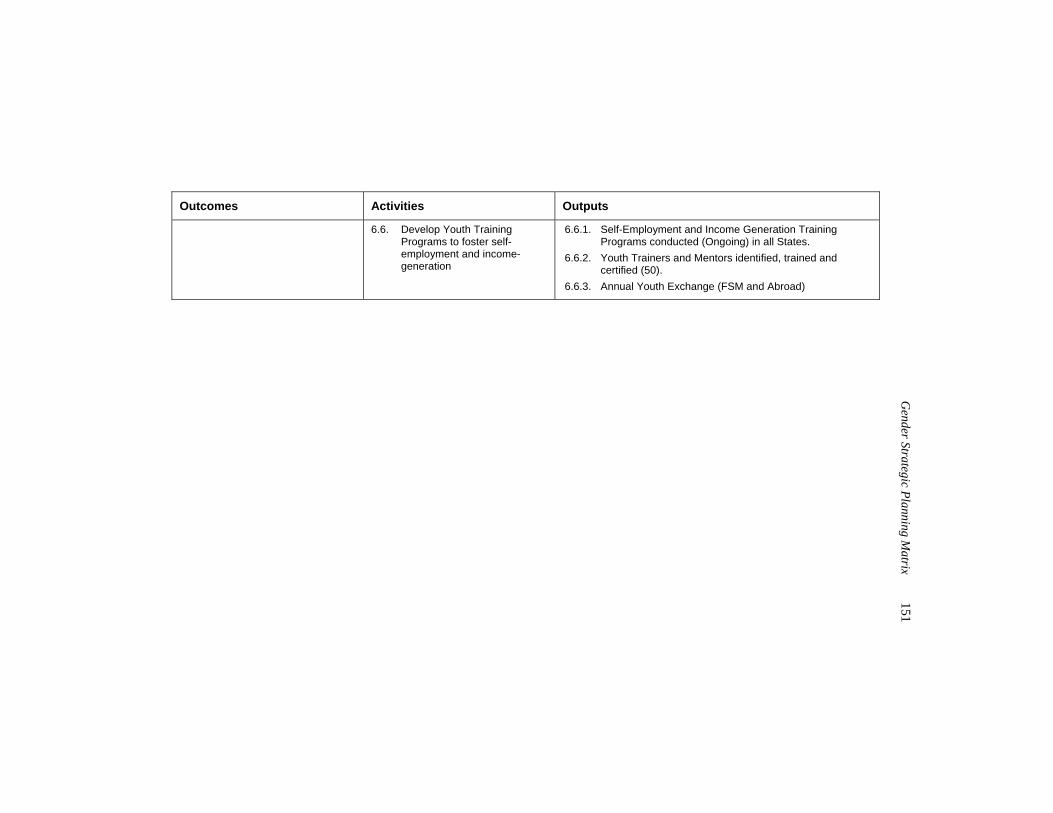
G
ender Strategic Planning Matrix
151
Outcomes Activities Outputs
6.6. Develop Youth Training Programs to foster self-employment and income-generation
6.6.1. Self-Employment and Income Generation Training Programs conducted (Ongoing) in all States.
6.6.2. Youth Trainers and Mentors identified, trained and certified (50).
6.6.3. Annual Youth Exchange (FSM and Abroad)
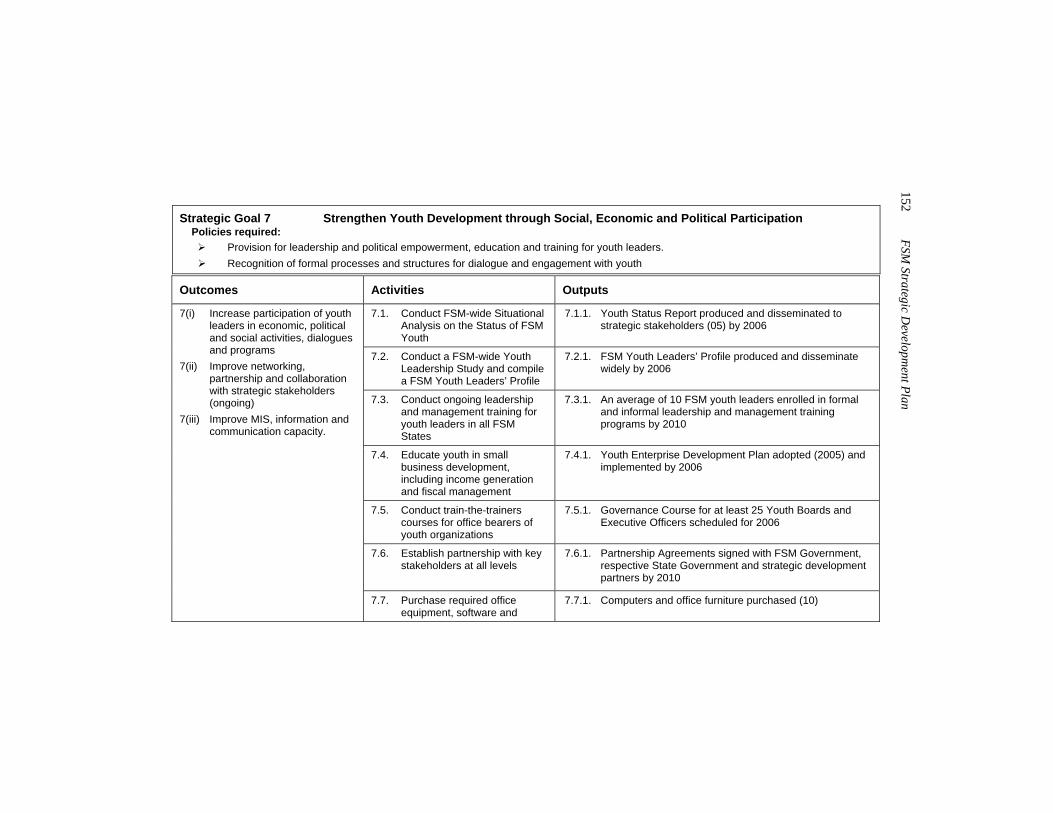
152 FSM
Strategic Developm
ent Plan
Strategic Goal 7 Strengthen Youth Development through Social, Economic and Political Participation
Policies required: Provision for leadership and political empowerment, education and training for youth leaders. Recognition of formal processes and structures for dialogue and engagement with youth
Outcomes Activities Outputs
7.1. Conduct FSM-wide Situational Analysis on the Status of FSM Youth
7.1.1. Youth Status Report produced and disseminated to strategic stakeholders (05) by 2006
7.2. Conduct a FSM-wide Youth Leadership Study and compile a FSM Youth Leaders’ Profile
7.2.1. FSM Youth Leaders’ Profile produced and disseminate widely by 2006
7.3. Conduct ongoing leadership and management training for youth leaders in all FSM States
7.3.1. An average of 10 FSM youth leaders enrolled in formal and informal leadership and management training programs by 2010
7.4. Educate youth in small business development, including income generation and fiscal management
7.4.1. Youth Enterprise Development Plan adopted (2005) and implemented by 2006
7.5. Conduct train-the-trainers courses for office bearers of youth organizations
7.5.1. Governance Course for at least 25 Youth Boards and Executive Officers scheduled for 2006
7.6. Establish partnership with key stakeholders at all levels
7.6.1. Partnership Agreements signed with FSM Government, respective State Government and strategic development partners by 2010
7(i) Increase participation of youth leaders in economic, political and social activities, dialogues and programs
7(ii) Improve networking, partnership and collaboration with strategic stakeholders (ongoing)
7(iii) Improve MIS, information and communication capacity.
7.7. Purchase required office equipment, software and
7.7.1. Computers and office furniture purchased (10)
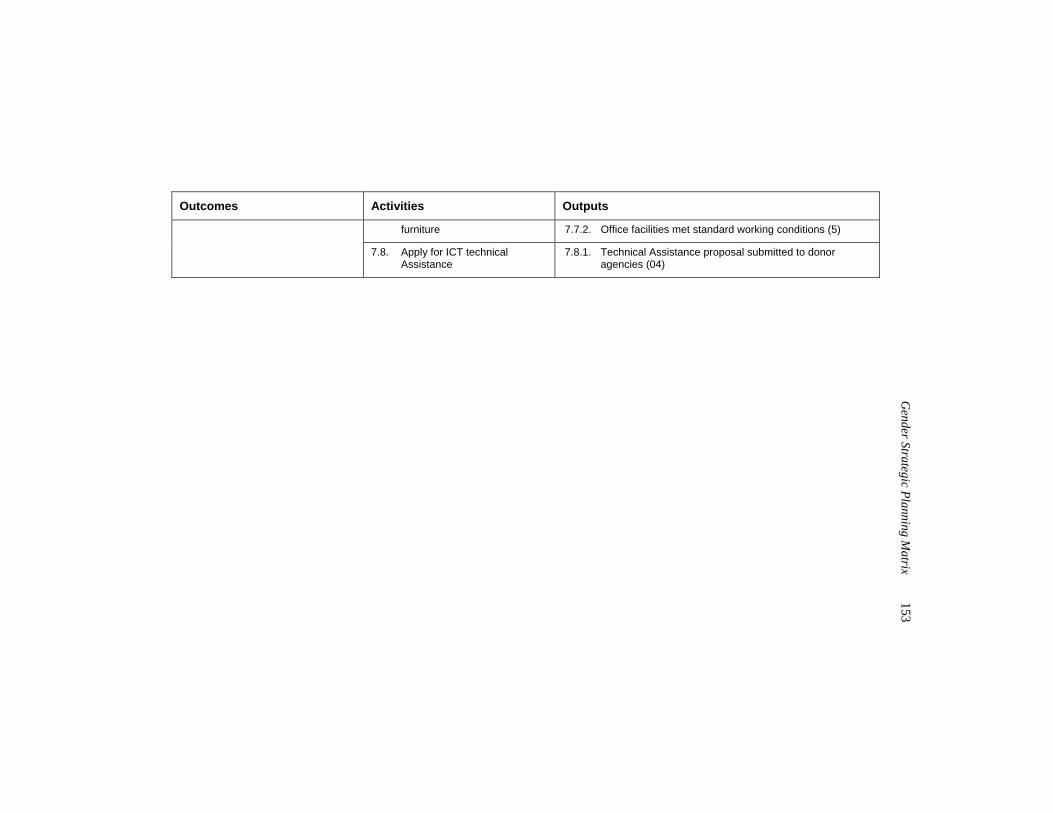
G
ender Strategic Planning Matrix
153
Outcomes Activities Outputs
furniture 7.7.2. Office facilities met standard working conditions (5)
7.8. Apply for ICT technical Assistance
7.8.1. Technical Assistance proposal submitted to donor agencies (04)
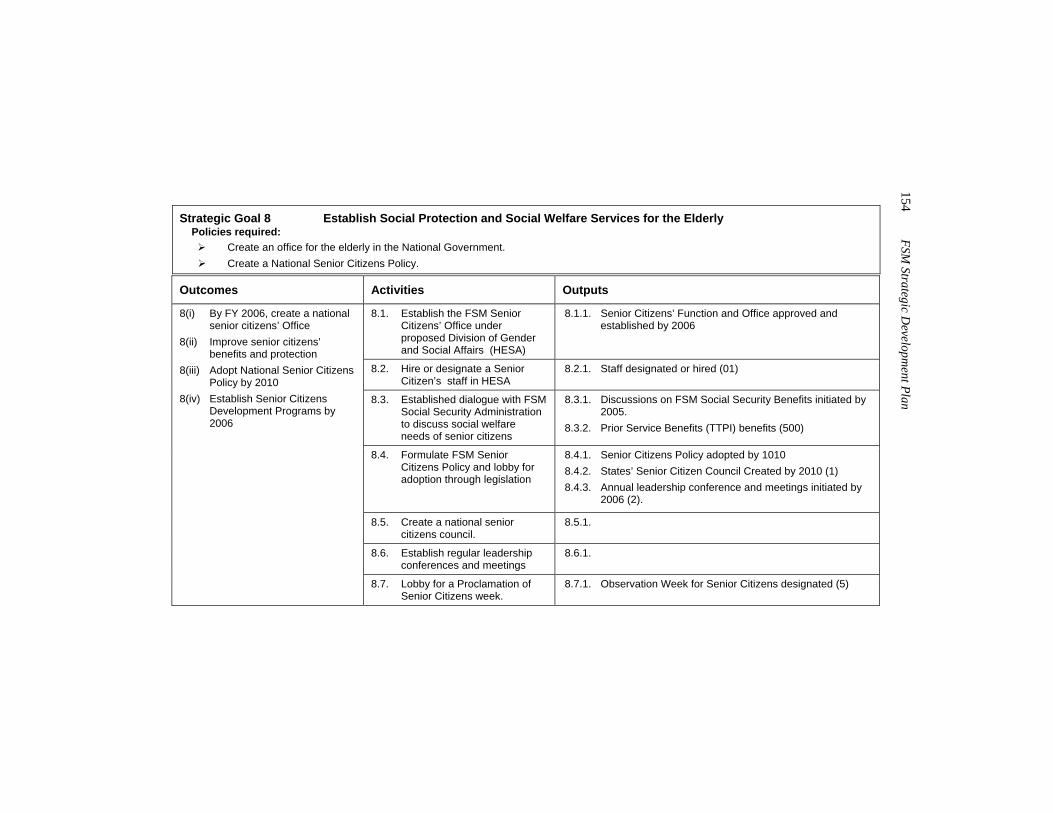
154 FSM
Strategic Developm
ent Plan
Strategic Goal 8 Establish Social Protection and Social Welfare Services for the Elderly
Policies required: Create an office for the elderly in the National Government. Create a National Senior Citizens Policy.
Outcomes Activities Outputs
8.1. Establish the FSM Senior Citizens’ Office under proposed Division of Gender and Social Affairs (HESA)
8.1.1. Senior Citizens’ Function and Office approved and established by 2006
8.2. Hire or designate a Senior Citizen’s staff in HESA
8.2.1. Staff designated or hired (01)
8.3. Established dialogue with FSM Social Security Administration to discuss social welfare needs of senior citizens
8.3.1. Discussions on FSM Social Security Benefits initiated by 2005.
8.3.2. Prior Service Benefits (TTPI) benefits (500)
8.4. Formulate FSM Senior Citizens Policy and lobby for adoption through legislation
8.4.1. Senior Citizens Policy adopted by 1010 8.4.2. States’ Senior Citizen Council Created by 2010 (1) 8.4.3. Annual leadership conference and meetings initiated by
2006 (2).
8.5. Create a national senior citizens council.
8.5.1.
8.6. Establish regular leadership conferences and meetings
8.6.1.
8(i) By FY 2006, create a national senior citizens’ Office
8(ii) Improve senior citizens’ benefits and protection
8(iii) Adopt National Senior Citizens Policy by 2010
8(iv) Establish Senior Citizens Development Programs by 2006
8.7. Lobby for a Proclamation of Senior Citizens week.
8.7.1. Observation Week for Senior Citizens designated (5)
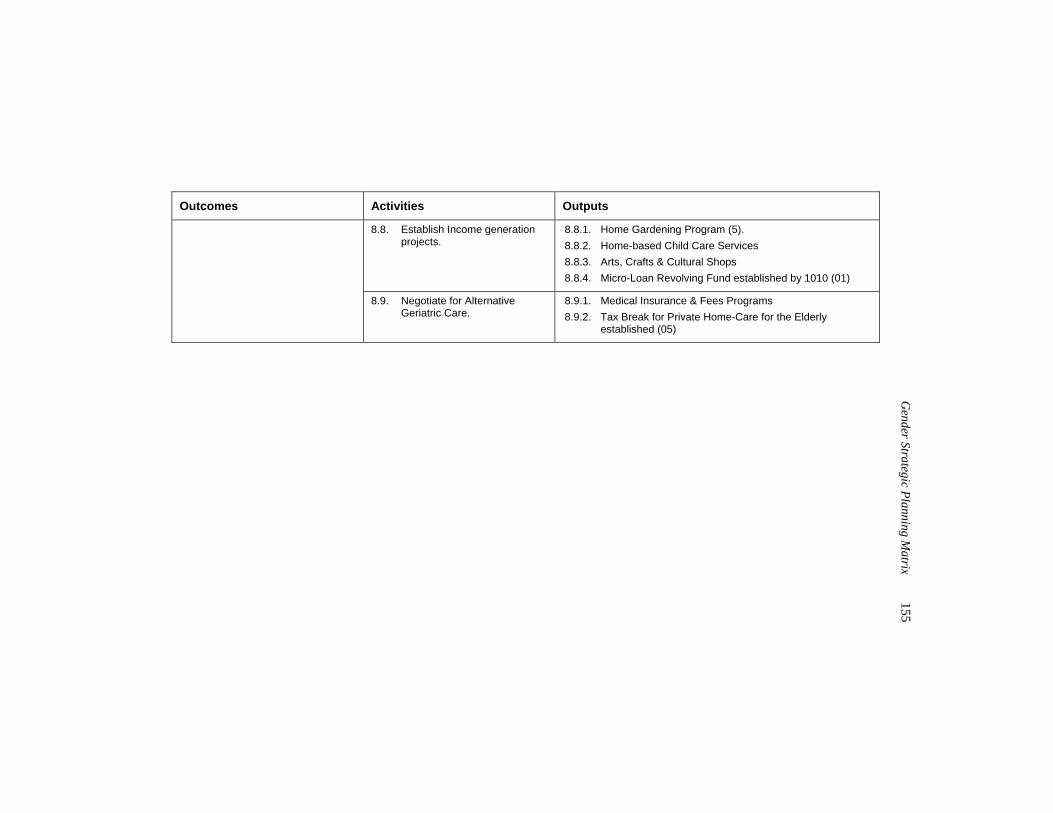
G
ender Strategic Planning Matrix
155
Outcomes Activities Outputs
8.8. Establish Income generation projects.
8.8.1. Home Gardening Program (5). 8.8.2. Home-based Child Care Services 8.8.3. Arts, Crafts & Cultural Shops 8.8.4. Micro-Loan Revolving Fund established by 1010 (01)
8.9. Negotiate for Alternative Geriatric Care.
8.9.1. Medical Insurance & Fees Programs 8.9.2. Tax Break for Private Home-Care for the Elderly
established (05)
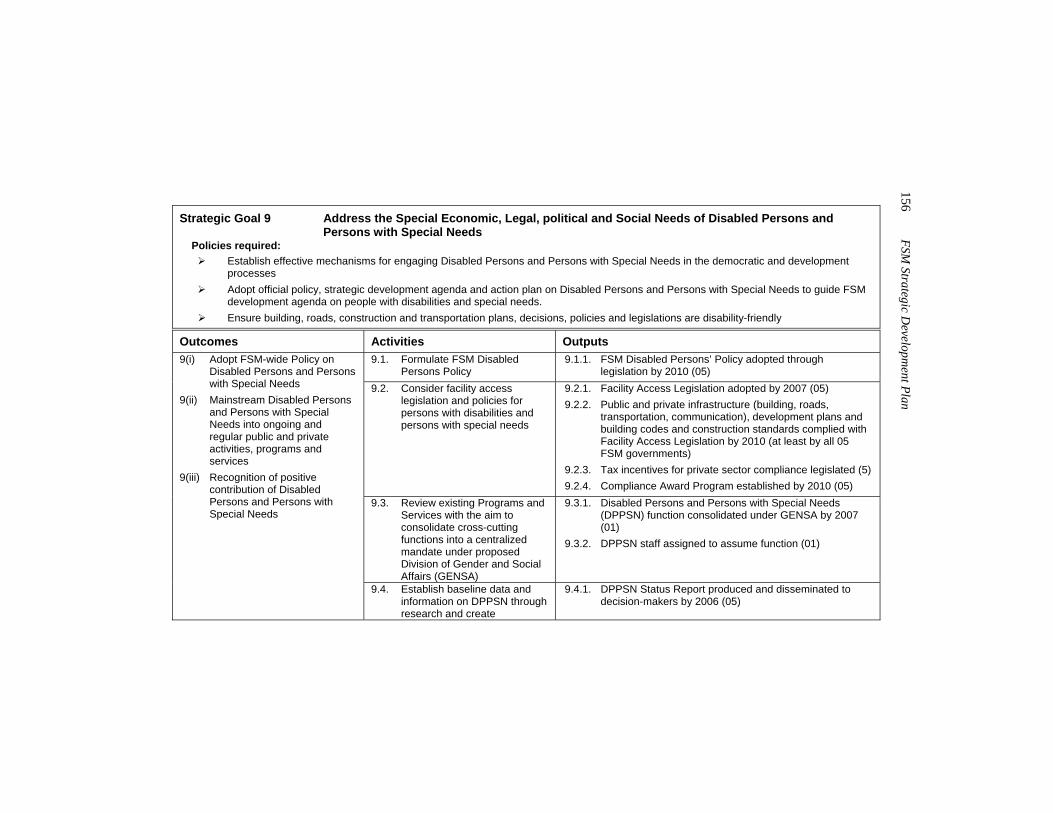
156 FSM
Strategic Developm
ent Plan
Strategic Goal 9 Address the Special Economic, Legal, political and Social Needs of Disabled Persons and
Persons with Special Needs Policies required:
Establish effective mechanisms for engaging Disabled Persons and Persons with Special Needs in the democratic and development processes
Adopt official policy, strategic development agenda and action plan on Disabled Persons and Persons with Special Needs to guide FSM development agenda on people with disabilities and special needs.
Ensure building, roads, construction and transportation plans, decisions, policies and legislations are disability-friendly Outcomes Activities Outputs
9.1. Formulate FSM Disabled Persons Policy
9.1.1. FSM Disabled Persons’ Policy adopted through legislation by 2010 (05)
9.2. Consider facility access legislation and policies for persons with disabilities and persons with special needs
9.2.1. Facility Access Legislation adopted by 2007 (05) 9.2.2. Public and private infrastructure (building, roads,
transportation, communication), development plans and building codes and construction standards complied with Facility Access Legislation by 2010 (at least by all 05 FSM governments)
9.2.3. Tax incentives for private sector compliance legislated (5) 9.2.4. Compliance Award Program established by 2010 (05)
9.3. Review existing Programs and Services with the aim to consolidate cross-cutting functions into a centralized mandate under proposed Division of Gender and Social Affairs (GENSA)
9.3.1. Disabled Persons and Persons with Special Needs (DPPSN) function consolidated under GENSA by 2007 (01)
9.3.2. DPPSN staff assigned to assume function (01)
9(i) Adopt FSM-wide Policy on Disabled Persons and Persons with Special Needs
9(ii) Mainstream Disabled Persons and Persons with Special Needs into ongoing and regular public and private activities, programs and services
9(iii) Recognition of positive contribution of Disabled Persons and Persons with Special Needs
9.4. Establish baseline data and information on DPPSN through research and create
9.4.1. DPPSN Status Report produced and disseminated to decision-makers by 2006 (05)
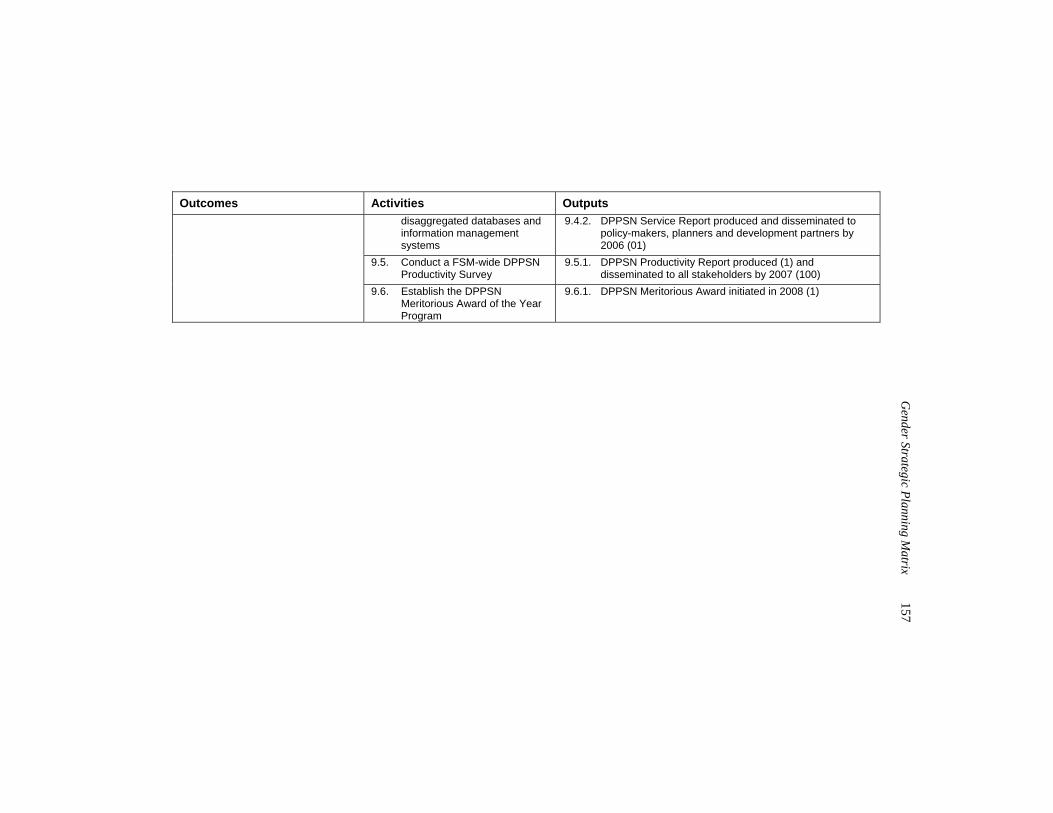
G
ender Strategic Planning Matrix
157
Outcomes Activities Outputs disaggregated databases and information management systems
9.4.2. DPPSN Service Report produced and disseminated to policy-makers, planners and development partners by 2006 (01)
9.5. Conduct a FSM-wide DPPSN Productivity Survey
9.5.1. DPPSN Productivity Report produced (1) and disseminated to all stakeholders by 2007 (100)
9.6. Establish the DPPSN Meritorious Award of the Year Program
9.6.1. DPPSN Meritorious Award initiated in 2008 (1)
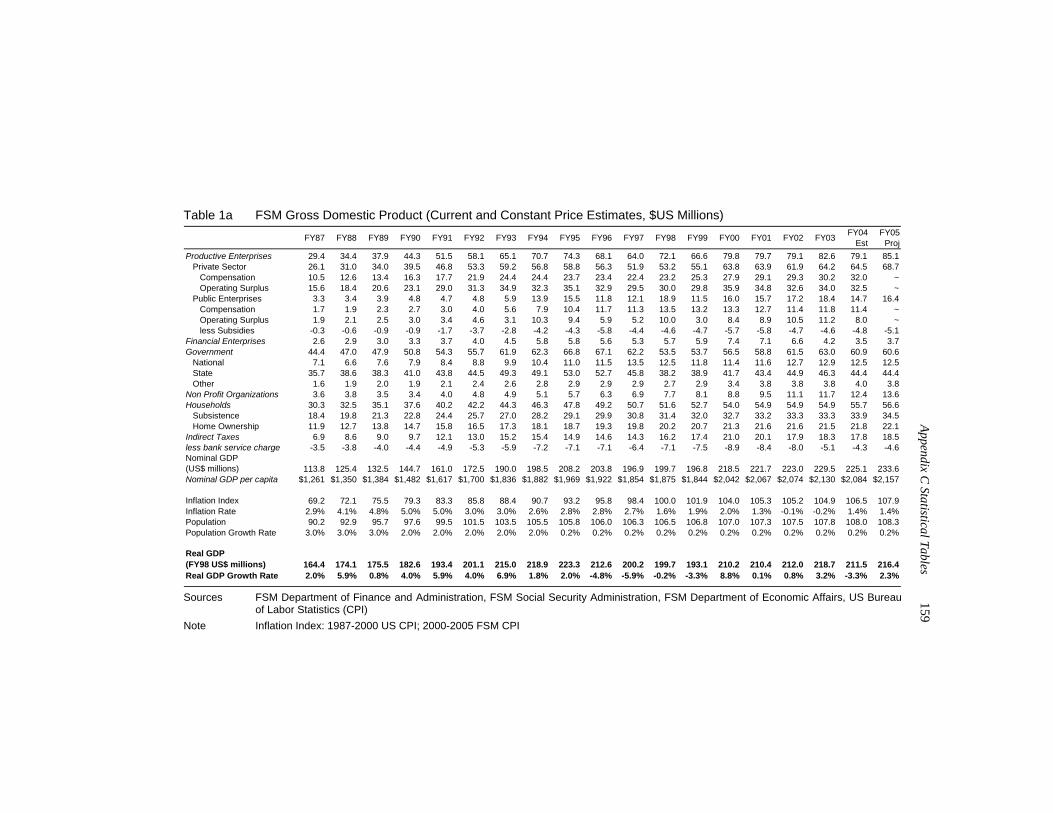
Appendix C
Statistical Tables 159
Table 1a FSM Gross Domestic Product (Current and Constant Price Estimates, $US Millions)
FY87 FY88 FY89 FY90 FY91 FY92 FY93 FY94 FY95 FY96 FY97 FY98 FY99 FY00 FY01 FY02 FY03 FY04 Est
FY05 Proj
Productive Enterprises 29.4 34.4 37.9 44.3 51.5 58.1 65.1 70.7 74.3 68.1 64.0 72.1 66.6 79.8 79.7 79.1 82.6 79.1 85.1Private Sector 26.1 31.0 34.0 39.5 46.8 53.3 59.2 56.8 58.8 56.3 51.9 53.2 55.1 63.8 63.9 61.9 64.2 64.5 68.7
Compensation 10.5 12.6 13.4 16.3 17.7 21.9 24.4 24.4 23.7 23.4 22.4 23.2 25.3 27.9 29.1 29.3 30.2 32.0 ~Operating Surplus 15.6 18.4 20.6 23.1 29.0 31.3 34.9 32.3 35.1 32.9 29.5 30.0 29.8 35.9 34.8 32.6 34.0 32.5 ~
Public Enterprises 3.3 3.4 3.9 4.8 4.7 4.8 5.9 13.9 15.5 11.8 12.1 18.9 11.5 16.0 15.7 17.2 18.4 14.7 16.4Compensation 1.7 1.9 2.3 2.7 3.0 4.0 5.6 7.9 10.4 11.7 11.3 13.5 13.2 13.3 12.7 11.4 11.8 11.4 ~Operating Surplus 1.9 2.1 2.5 3.0 3.4 4.6 3.1 10.3 9.4 5.9 5.2 10.0 3.0 8.4 8.9 10.5 11.2 8.0 ~less Subsidies -0.3 -0.6 -0.9 -0.9 -1.7 -3.7 -2.8 -4.2 -4.3 -5.8 -4.4 -4.6 -4.7 -5.7 -5.8 -4.7 -4.6 -4.8 -5.1
Financial Enterprises 2.6 2.9 3.0 3.3 3.7 4.0 4.5 5.8 5.8 5.6 5.3 5.7 5.9 7.4 7.1 6.6 4.2 3.5 3.7Government 44.4 47.0 47.9 50.8 54.3 55.7 61.9 62.3 66.8 67.1 62.2 53.5 53.7 56.5 58.8 61.5 63.0 60.9 60.6
National 7.1 6.6 7.6 7.9 8.4 8.8 9.9 10.4 11.0 11.5 13.5 12.5 11.8 11.4 11.6 12.7 12.9 12.5 12.5State 35.7 38.6 38.3 41.0 43.8 44.5 49.3 49.1 53.0 52.7 45.8 38.2 38.9 41.7 43.4 44.9 46.3 44.4 44.4Other 1.6 1.9 2.0 1.9 2.1 2.4 2.6 2.8 2.9 2.9 2.9 2.7 2.9 3.4 3.8 3.8 3.8 4.0 3.8
Non Profit Organizations 3.6 3.8 3.5 3.4 4.0 4.8 4.9 5.1 5.7 6.3 6.9 7.7 8.1 8.8 9.5 11.1 11.7 12.4 13.6Households 30.3 32.5 35.1 37.6 40.2 42.2 44.3 46.3 47.8 49.2 50.7 51.6 52.7 54.0 54.9 54.9 54.9 55.7 56.6
Subsistence 18.4 19.8 21.3 22.8 24.4 25.7 27.0 28.2 29.1 29.9 30.8 31.4 32.0 32.7 33.2 33.3 33.3 33.9 34.5Home Ownership 11.9 12.7 13.8 14.7 15.8 16.5 17.3 18.1 18.7 19.3 19.8 20.2 20.7 21.3 21.6 21.6 21.5 21.8 22.1
Indirect Taxes 6.9 8.6 9.0 9.7 12.1 13.0 15.2 15.4 14.9 14.6 14.3 16.2 17.4 21.0 20.1 17.9 18.3 17.8 18.5less bank service charge -3.5 -3.8 -4.0 -4.4 -4.9 -5.3 -5.9 -7.2 -7.1 -7.1 -6.4 -7.1 -7.5 -8.9 -8.4 -8.0 -5.1 -4.3 -4.6Nominal GDP(US$ millions) 113.8 125.4 132.5 144.7 161.0 172.5 190.0 198.5 208.2 203.8 196.9 199.7 196.8 218.5 221.7 223.0 229.5 225.1 233.6Nominal GDP per capita $1,261 $1,350 $1,384 $1,482 $1,617 $1,700 $1,836 $1,882 $1,969 $1,922 $1,854 $1,875 $1,844 $2,042 $2,067 $2,074 $2,130 $2,084 $2,157
Inflation Index 69.2 72.1 75.5 79.3 83.3 85.8 88.4 90.7 93.2 95.8 98.4 100.0 101.9 104.0 105.3 105.2 104.9 106.5 107.9Inflation Rate 2.9% 4.1% 4.8% 5.0% 5.0% 3.0% 3.0% 2.6% 2.8% 2.8% 2.7% 1.6% 1.9% 2.0% 1.3% -0.1% -0.2% 1.4% 1.4%Population 90.2 92.9 95.7 97.6 99.5 101.5 103.5 105.5 105.8 106.0 106.3 106.5 106.8 107.0 107.3 107.5 107.8 108.0 108.3Population Growth Rate 3.0% 3.0% 3.0% 2.0% 2.0% 2.0% 2.0% 2.0% 0.2% 0.2% 0.2% 0.2% 0.2% 0.2% 0.2% 0.2% 0.2% 0.2% 0.2%
Real GDP(FY98 US$ millions) 164.4 174.1 175.5 182.6 193.4 201.1 215.0 218.9 223.3 212.6 200.2 199.7 193.1 210.2 210.4 212.0 218.7 211.5 216.4Real GDP Growth Rate 2.0% 5.9% 0.8% 4.0% 5.9% 4.0% 6.9% 1.8% 2.0% -4.8% -5.9% -0.2% -3.3% 8.8% 0.1% 0.8% 3.2% -3.3% 2.3%
Sources FSM Department of Finance and Administration, FSM Social Security Administration, FSM Department of Economic Affairs, US Bureau of Labor Statistics (CPI)
Note Inflation Index: 1987-2000 US CPI; 2000-2005 FSM CPI
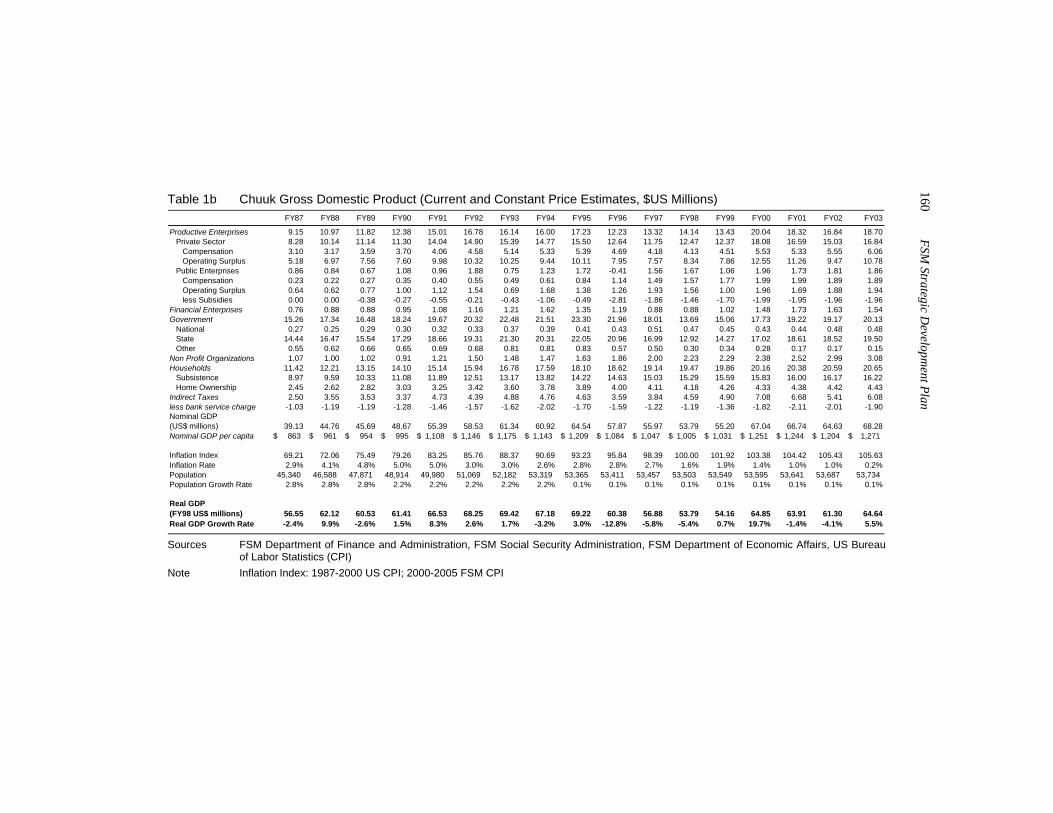
160 FSM
Strategic Developm
ent Plan
Table 1b Chuuk Gross Domestic Product (Current and Constant Price Estimates, $US Millions) FY87 FY88 FY89 FY90 FY91 FY92 FY93 FY94 FY95 FY96 FY97 FY98 FY99 FY00 FY01 FY02 FY03
Productive Enterprises 9.15 10.97 11.82 12.38 15.01 16.78 16.14 16.00 17.23 12.23 13.32 14.14 13.43 20.04 18.32 16.84 18.70Private Sector 8.28 10.14 11.14 11.30 14.04 14.90 15.39 14.77 15.50 12.64 11.75 12.47 12.37 18.08 16.59 15.03 16.84
Compensation 3.10 3.17 3.59 3.70 4.06 4.58 5.14 5.33 5.39 4.69 4.18 4.13 4.51 5.53 5.33 5.55 6.06Operating Surplus 5.18 6.97 7.56 7.60 9.98 10.32 10.25 9.44 10.11 7.95 7.57 8.34 7.86 12.55 11.26 9.47 10.78
Public Enterprises 0.86 0.84 0.67 1.08 0.96 1.88 0.75 1.23 1.72 -0.41 1.56 1.67 1.06 1.96 1.73 1.81 1.86Compensation 0.23 0.22 0.27 0.35 0.40 0.55 0.49 0.61 0.84 1.14 1.49 1.57 1.77 1.99 1.99 1.89 1.89Operating Surplus 0.64 0.62 0.77 1.00 1.12 1.54 0.69 1.68 1.38 1.26 1.93 1.56 1.00 1.96 1.69 1.88 1.94less Subsidies 0.00 0.00 -0.38 -0.27 -0.55 -0.21 -0.43 -1.06 -0.49 -2.81 -1.86 -1.46 -1.70 -1.99 -1.95 -1.96 -1.96
Financial Enterprises 0.76 0.88 0.88 0.95 1.08 1.16 1.21 1.62 1.35 1.19 0.88 0.88 1.02 1.48 1.73 1.63 1.54Government 15.26 17.34 16.48 18.24 19.67 20.32 22.48 21.51 23.30 21.96 18.01 13.69 15.06 17.73 19.22 19.17 20.13
National 0.27 0.25 0.29 0.30 0.32 0.33 0.37 0.39 0.41 0.43 0.51 0.47 0.45 0.43 0.44 0.48 0.48State 14.44 16.47 15.54 17.29 18.66 19.31 21.30 20.31 22.05 20.96 16.99 12.92 14.27 17.02 18.61 18.52 19.50Other 0.55 0.62 0.66 0.65 0.69 0.68 0.81 0.81 0.83 0.57 0.50 0.30 0.34 0.28 0.17 0.17 0.15
Non Profit Organizations 1.07 1.00 1.02 0.91 1.21 1.50 1.48 1.47 1.63 1.86 2.00 2.23 2.29 2.38 2.52 2.99 3.08Households 11.42 12.21 13.15 14.10 15.14 15.94 16.78 17.59 18.10 18.62 19.14 19.47 19.86 20.16 20.38 20.59 20.65
Subsistence 8.97 9.59 10.33 11.08 11.89 12.51 13.17 13.82 14.22 14.63 15.03 15.29 15.59 15.83 16.00 16.17 16.22Home Ownership 2.45 2.62 2.82 3.03 3.25 3.42 3.60 3.78 3.89 4.00 4.11 4.18 4.26 4.33 4.38 4.42 4.43
Indirect Taxes 2.50 3.55 3.53 3.37 4.73 4.39 4.88 4.76 4.63 3.59 3.84 4.59 4.90 7.08 6.68 5.41 6.08less bank service charge -1.03 -1.19 -1.19 -1.28 -1.46 -1.57 -1.62 -2.02 -1.70 -1.59 -1.22 -1.19 -1.36 -1.82 -2.11 -2.01 -1.90Nominal GDP(US$ millions) 39.13 44.76 45.69 48.67 55.39 58.53 61.34 60.92 64.54 57.87 55.97 53.79 55.20 67.04 66.74 64.63 68.28Nominal GDP per capita 863$ 961$ 954$ 995$ 1,108$ 1,146$ 1,175$ 1,143$ 1,209$ 1,084$ 1,047$ 1,005$ 1,031$ 1,251$ 1,244$ 1,204$ 1,271$
Inflation Index 69.21 72.06 75.49 79.26 83.25 85.76 88.37 90.69 93.23 95.84 98.39 100.00 101.92 103.38 104.42 105.43 105.63Inflation Rate 2.9% 4.1% 4.8% 5.0% 5.0% 3.0% 3.0% 2.6% 2.8% 2.8% 2.7% 1.6% 1.9% 1.4% 1.0% 1.0% 0.2%Population 45,340 46,588 47,871 48,914 49,980 51,069 52,182 53,319 53,365 53,411 53,457 53,503 53,549 53,595 53,641 53,687 53,734 Population Growth Rate 2.8% 2.8% 2.8% 2.2% 2.2% 2.2% 2.2% 2.2% 0.1% 0.1% 0.1% 0.1% 0.1% 0.1% 0.1% 0.1% 0.1%
Real GDP(FY98 US$ millions) 56.55 62.12 60.53 61.41 66.53 68.25 69.42 67.18 69.22 60.38 56.88 53.79 54.16 64.85 63.91 61.30 64.64Real GDP Growth Rate -2.4% 9.9% -2.6% 1.5% 8.3% 2.6% 1.7% -3.2% 3.0% -12.8% -5.8% -5.4% 0.7% 19.7% -1.4% -4.1% 5.5%
Sources FSM Department of Finance and Administration, FSM Social Security Administration, FSM Department of Economic Affairs, US Bureau of Labor Statistics (CPI)
Note Inflation Index: 1987-2000 US CPI; 2000-2005 FSM CPI
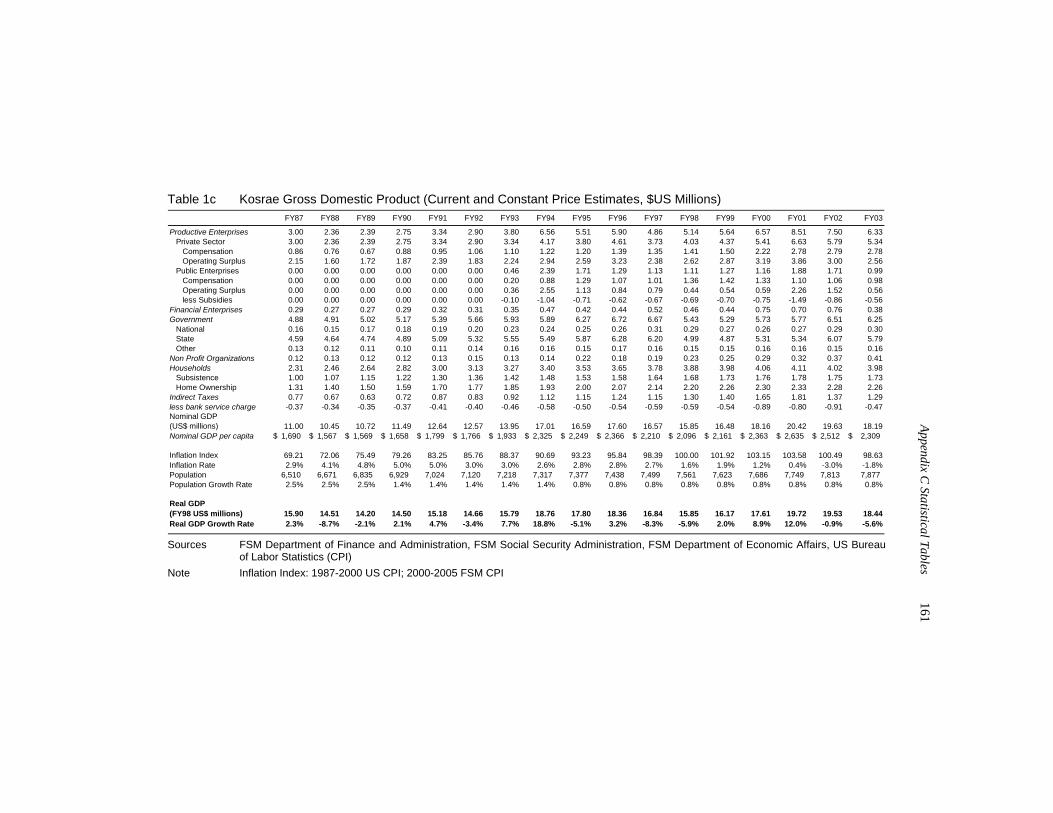
Appendix C
Statistical Tables 161
Table 1c Kosrae Gross Domestic Product (Current and Constant Price Estimates, $US Millions) FY87 FY88 FY89 FY90 FY91 FY92 FY93 FY94 FY95 FY96 FY97 FY98 FY99 FY00 FY01 FY02 FY03
Productive Enterprises 3.00 2.36 2.39 2.75 3.34 2.90 3.80 6.56 5.51 5.90 4.86 5.14 5.64 6.57 8.51 7.50 6.33Private Sector 3.00 2.36 2.39 2.75 3.34 2.90 3.34 4.17 3.80 4.61 3.73 4.03 4.37 5.41 6.63 5.79 5.34
Compensation 0.86 0.76 0.67 0.88 0.95 1.06 1.10 1.22 1.20 1.39 1.35 1.41 1.50 2.22 2.78 2.79 2.78Operating Surplus 2.15 1.60 1.72 1.87 2.39 1.83 2.24 2.94 2.59 3.23 2.38 2.62 2.87 3.19 3.86 3.00 2.56
Public Enterprises 0.00 0.00 0.00 0.00 0.00 0.00 0.46 2.39 1.71 1.29 1.13 1.11 1.27 1.16 1.88 1.71 0.99Compensation 0.00 0.00 0.00 0.00 0.00 0.00 0.20 0.88 1.29 1.07 1.01 1.36 1.42 1.33 1.10 1.06 0.98Operating Surplus 0.00 0.00 0.00 0.00 0.00 0.00 0.36 2.55 1.13 0.84 0.79 0.44 0.54 0.59 2.26 1.52 0.56less Subsidies 0.00 0.00 0.00 0.00 0.00 0.00 -0.10 -1.04 -0.71 -0.62 -0.67 -0.69 -0.70 -0.75 -1.49 -0.86 -0.56
Financial Enterprises 0.29 0.27 0.27 0.29 0.32 0.31 0.35 0.47 0.42 0.44 0.52 0.46 0.44 0.75 0.70 0.76 0.38Government 4.88 4.91 5.02 5.17 5.39 5.66 5.93 5.89 6.27 6.72 6.67 5.43 5.29 5.73 5.77 6.51 6.25
National 0.16 0.15 0.17 0.18 0.19 0.20 0.23 0.24 0.25 0.26 0.31 0.29 0.27 0.26 0.27 0.29 0.30State 4.59 4.64 4.74 4.89 5.09 5.32 5.55 5.49 5.87 6.28 6.20 4.99 4.87 5.31 5.34 6.07 5.79Other 0.13 0.12 0.11 0.10 0.11 0.14 0.16 0.16 0.15 0.17 0.16 0.15 0.15 0.16 0.16 0.15 0.16
Non Profit Organizations 0.12 0.13 0.12 0.12 0.13 0.15 0.13 0.14 0.22 0.18 0.19 0.23 0.25 0.29 0.32 0.37 0.41Households 2.31 2.46 2.64 2.82 3.00 3.13 3.27 3.40 3.53 3.65 3.78 3.88 3.98 4.06 4.11 4.02 3.98
Subsistence 1.00 1.07 1.15 1.22 1.30 1.36 1.42 1.48 1.53 1.58 1.64 1.68 1.73 1.76 1.78 1.75 1.73Home Ownership 1.31 1.40 1.50 1.59 1.70 1.77 1.85 1.93 2.00 2.07 2.14 2.20 2.26 2.30 2.33 2.28 2.26
Indirect Taxes 0.77 0.67 0.63 0.72 0.87 0.83 0.92 1.12 1.15 1.24 1.15 1.30 1.40 1.65 1.81 1.37 1.29less bank service charge -0.37 -0.34 -0.35 -0.37 -0.41 -0.40 -0.46 -0.58 -0.50 -0.54 -0.59 -0.59 -0.54 -0.89 -0.80 -0.91 -0.47Nominal GDP(US$ millions) 11.00 10.45 10.72 11.49 12.64 12.57 13.95 17.01 16.59 17.60 16.57 15.85 16.48 18.16 20.42 19.63 18.19Nominal GDP per capita 1,690$ 1,567$ 1,569$ 1,658$ 1,799$ 1,766$ 1,933$ 2,325$ 2,249$ 2,366$ 2,210$ 2,096$ 2,161$ 2,363$ 2,635$ 2,512$ 2,309$
Inflation Index 69.21 72.06 75.49 79.26 83.25 85.76 88.37 90.69 93.23 95.84 98.39 100.00 101.92 103.15 103.58 100.49 98.63Inflation Rate 2.9% 4.1% 4.8% 5.0% 5.0% 3.0% 3.0% 2.6% 2.8% 2.8% 2.7% 1.6% 1.9% 1.2% 0.4% -3.0% -1.8%Population 6,510 6,671 6,835 6,929 7,024 7,120 7,218 7,317 7,377 7,438 7,499 7,561 7,623 7,686 7,749 7,813 7,877 Population Growth Rate 2.5% 2.5% 2.5% 1.4% 1.4% 1.4% 1.4% 1.4% 0.8% 0.8% 0.8% 0.8% 0.8% 0.8% 0.8% 0.8% 0.8%
Real GDP(FY98 US$ millions) 15.90 14.51 14.20 14.50 15.18 14.66 15.79 18.76 17.80 18.36 16.84 15.85 16.17 17.61 19.72 19.53 18.44Real GDP Growth Rate 2.3% -8.7% -2.1% 2.1% 4.7% -3.4% 7.7% 18.8% -5.1% 3.2% -8.3% -5.9% 2.0% 8.9% 12.0% -0.9% -5.6%
Sources FSM Department of Finance and Administration, FSM Social Security Administration, FSM Department of Economic Affairs, US Bureau of Labor Statistics (CPI)
Note Inflation Index: 1987-2000 US CPI; 2000-2005 FSM CPI
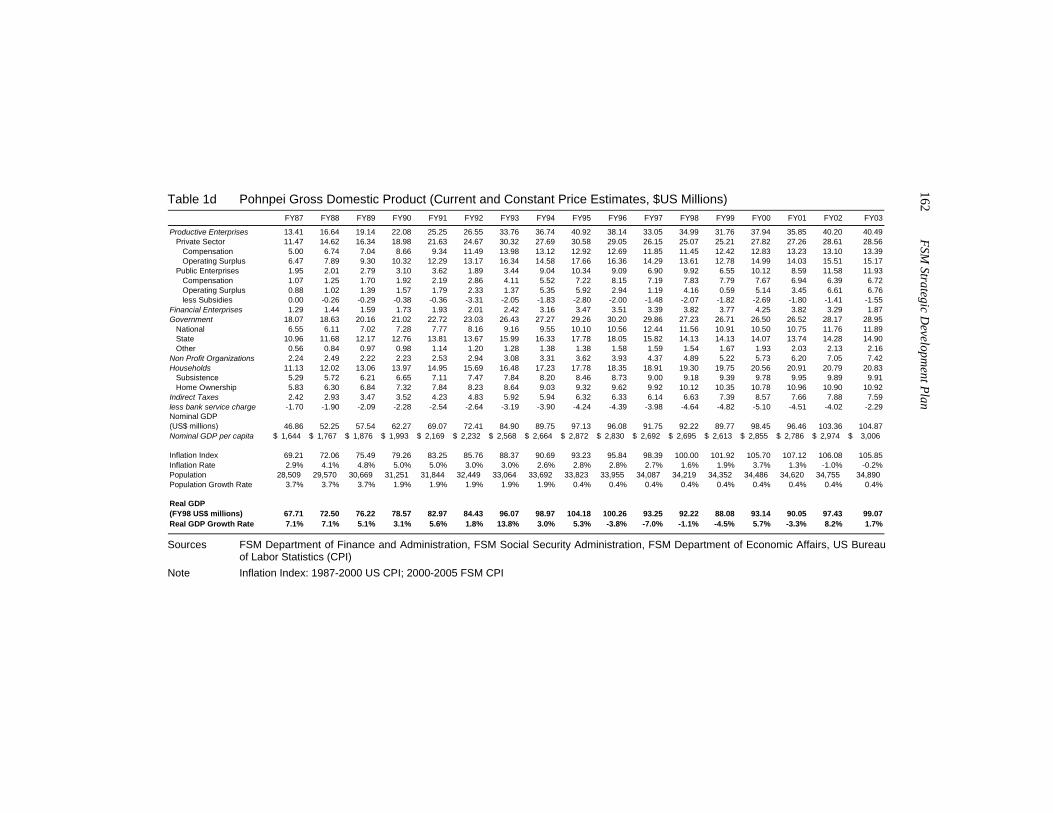
162 FSM
Strategic Developm
ent Plan
Table 1d Pohnpei Gross Domestic Product (Current and Constant Price Estimates, $US Millions) FY87 FY88 FY89 FY90 FY91 FY92 FY93 FY94 FY95 FY96 FY97 FY98 FY99 FY00 FY01 FY02 FY03
Productive Enterprises 13.41 16.64 19.14 22.08 25.25 26.55 33.76 36.74 40.92 38.14 33.05 34.99 31.76 37.94 35.85 40.20 40.49Private Sector 11.47 14.62 16.34 18.98 21.63 24.67 30.32 27.69 30.58 29.05 26.15 25.07 25.21 27.82 27.26 28.61 28.56
Compensation 5.00 6.74 7.04 8.66 9.34 11.49 13.98 13.12 12.92 12.69 11.85 11.45 12.42 12.83 13.23 13.10 13.39Operating Surplus 6.47 7.89 9.30 10.32 12.29 13.17 16.34 14.58 17.66 16.36 14.29 13.61 12.78 14.99 14.03 15.51 15.17
Public Enterprises 1.95 2.01 2.79 3.10 3.62 1.89 3.44 9.04 10.34 9.09 6.90 9.92 6.55 10.12 8.59 11.58 11.93Compensation 1.07 1.25 1.70 1.92 2.19 2.86 4.11 5.52 7.22 8.15 7.19 7.83 7.79 7.67 6.94 6.39 6.72Operating Surplus 0.88 1.02 1.39 1.57 1.79 2.33 1.37 5.35 5.92 2.94 1.19 4.16 0.59 5.14 3.45 6.61 6.76less Subsidies 0.00 -0.26 -0.29 -0.38 -0.36 -3.31 -2.05 -1.83 -2.80 -2.00 -1.48 -2.07 -1.82 -2.69 -1.80 -1.41 -1.55
Financial Enterprises 1.29 1.44 1.59 1.73 1.93 2.01 2.42 3.16 3.47 3.51 3.39 3.82 3.77 4.25 3.82 3.29 1.87Government 18.07 18.63 20.16 21.02 22.72 23.03 26.43 27.27 29.26 30.20 29.86 27.23 26.71 26.50 26.52 28.17 28.95
National 6.55 6.11 7.02 7.28 7.77 8.16 9.16 9.55 10.10 10.56 12.44 11.56 10.91 10.50 10.75 11.76 11.89State 10.96 11.68 12.17 12.76 13.81 13.67 15.99 16.33 17.78 18.05 15.82 14.13 14.13 14.07 13.74 14.28 14.90Other 0.56 0.84 0.97 0.98 1.14 1.20 1.28 1.38 1.38 1.58 1.59 1.54 1.67 1.93 2.03 2.13 2.16
Non Profit Organizations 2.24 2.49 2.22 2.23 2.53 2.94 3.08 3.31 3.62 3.93 4.37 4.89 5.22 5.73 6.20 7.05 7.42Households 11.13 12.02 13.06 13.97 14.95 15.69 16.48 17.23 17.78 18.35 18.91 19.30 19.75 20.56 20.91 20.79 20.83
Subsistence 5.29 5.72 6.21 6.65 7.11 7.47 7.84 8.20 8.46 8.73 9.00 9.18 9.39 9.78 9.95 9.89 9.91Home Ownership 5.83 6.30 6.84 7.32 7.84 8.23 8.64 9.03 9.32 9.62 9.92 10.12 10.35 10.78 10.96 10.90 10.92
Indirect Taxes 2.42 2.93 3.47 3.52 4.23 4.83 5.92 5.94 6.32 6.33 6.14 6.63 7.39 8.57 7.66 7.88 7.59less bank service charge -1.70 -1.90 -2.09 -2.28 -2.54 -2.64 -3.19 -3.90 -4.24 -4.39 -3.98 -4.64 -4.82 -5.10 -4.51 -4.02 -2.29Nominal GDP(US$ millions) 46.86 52.25 57.54 62.27 69.07 72.41 84.90 89.75 97.13 96.08 91.75 92.22 89.77 98.45 96.46 103.36 104.87Nominal GDP per capita 1,644$ 1,767$ 1,876$ 1,993$ 2,169$ 2,232$ 2,568$ 2,664$ 2,872$ 2,830$ 2,692$ 2,695$ 2,613$ 2,855$ 2,786$ 2,974$ 3,006$
Inflation Index 69.21 72.06 75.49 79.26 83.25 85.76 88.37 90.69 93.23 95.84 98.39 100.00 101.92 105.70 107.12 106.08 105.85Inflation Rate 2.9% 4.1% 4.8% 5.0% 5.0% 3.0% 3.0% 2.6% 2.8% 2.8% 2.7% 1.6% 1.9% 3.7% 1.3% -1.0% -0.2%Population 28,509 29,570 30,669 31,251 31,844 32,449 33,064 33,692 33,823 33,955 34,087 34,219 34,352 34,486 34,620 34,755 34,890 Population Growth Rate 3.7% 3.7% 3.7% 1.9% 1.9% 1.9% 1.9% 1.9% 0.4% 0.4% 0.4% 0.4% 0.4% 0.4% 0.4% 0.4% 0.4%
Real GDP(FY98 US$ millions) 67.71 72.50 76.22 78.57 82.97 84.43 96.07 98.97 104.18 100.26 93.25 92.22 88.08 93.14 90.05 97.43 99.07Real GDP Growth Rate 7.1% 7.1% 5.1% 3.1% 5.6% 1.8% 13.8% 3.0% 5.3% -3.8% -7.0% -1.1% -4.5% 5.7% -3.3% 8.2% 1.7%
Sources FSM Department of Finance and Administration, FSM Social Security Administration, FSM Department of Economic Affairs, US Bureau of Labor Statistics (CPI)
Note Inflation Index: 1987-2000 US CPI; 2000-2005 FSM CPI
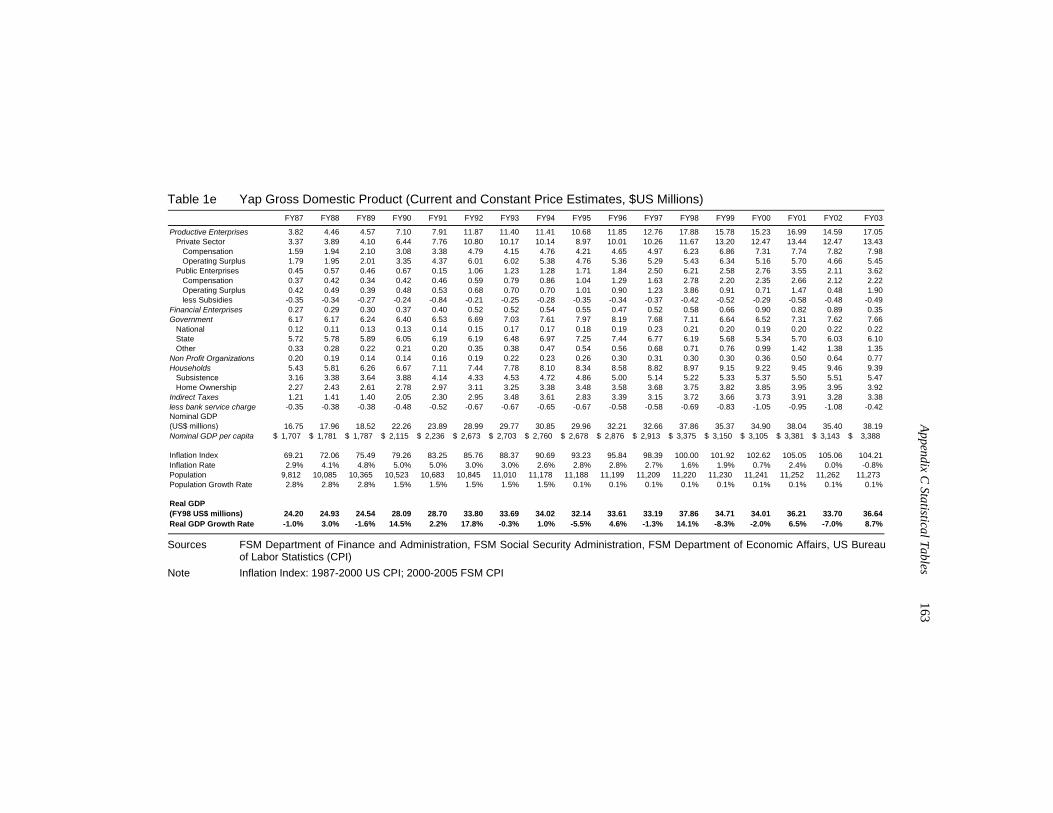
Appendix C
Statistical Tables 163
Table 1e Yap Gross Domestic Product (Current and Constant Price Estimates, $US Millions) FY87 FY88 FY89 FY90 FY91 FY92 FY93 FY94 FY95 FY96 FY97 FY98 FY99 FY00 FY01 FY02 FY03
Productive Enterprises 3.82 4.46 4.57 7.10 7.91 11.87 11.40 11.41 10.68 11.85 12.76 17.88 15.78 15.23 16.99 14.59 17.05Private Sector 3.37 3.89 4.10 6.44 7.76 10.80 10.17 10.14 8.97 10.01 10.26 11.67 13.20 12.47 13.44 12.47 13.43
Compensation 1.59 1.94 2.10 3.08 3.38 4.79 4.15 4.76 4.21 4.65 4.97 6.23 6.86 7.31 7.74 7.82 7.98Operating Surplus 1.79 1.95 2.01 3.35 4.37 6.01 6.02 5.38 4.76 5.36 5.29 5.43 6.34 5.16 5.70 4.66 5.45
Public Enterprises 0.45 0.57 0.46 0.67 0.15 1.06 1.23 1.28 1.71 1.84 2.50 6.21 2.58 2.76 3.55 2.11 3.62Compensation 0.37 0.42 0.34 0.42 0.46 0.59 0.79 0.86 1.04 1.29 1.63 2.78 2.20 2.35 2.66 2.12 2.22Operating Surplus 0.42 0.49 0.39 0.48 0.53 0.68 0.70 0.70 1.01 0.90 1.23 3.86 0.91 0.71 1.47 0.48 1.90less Subsidies -0.35 -0.34 -0.27 -0.24 -0.84 -0.21 -0.25 -0.28 -0.35 -0.34 -0.37 -0.42 -0.52 -0.29 -0.58 -0.48 -0.49
Financial Enterprises 0.27 0.29 0.30 0.37 0.40 0.52 0.52 0.54 0.55 0.47 0.52 0.58 0.66 0.90 0.82 0.89 0.35Government 6.17 6.17 6.24 6.40 6.53 6.69 7.03 7.61 7.97 8.19 7.68 7.11 6.64 6.52 7.31 7.62 7.66
National 0.12 0.11 0.13 0.13 0.14 0.15 0.17 0.17 0.18 0.19 0.23 0.21 0.20 0.19 0.20 0.22 0.22State 5.72 5.78 5.89 6.05 6.19 6.19 6.48 6.97 7.25 7.44 6.77 6.19 5.68 5.34 5.70 6.03 6.10Other 0.33 0.28 0.22 0.21 0.20 0.35 0.38 0.47 0.54 0.56 0.68 0.71 0.76 0.99 1.42 1.38 1.35
Non Profit Organizations 0.20 0.19 0.14 0.14 0.16 0.19 0.22 0.23 0.26 0.30 0.31 0.30 0.30 0.36 0.50 0.64 0.77Households 5.43 5.81 6.26 6.67 7.11 7.44 7.78 8.10 8.34 8.58 8.82 8.97 9.15 9.22 9.45 9.46 9.39
Subsistence 3.16 3.38 3.64 3.88 4.14 4.33 4.53 4.72 4.86 5.00 5.14 5.22 5.33 5.37 5.50 5.51 5.47Home Ownership 2.27 2.43 2.61 2.78 2.97 3.11 3.25 3.38 3.48 3.58 3.68 3.75 3.82 3.85 3.95 3.95 3.92
Indirect Taxes 1.21 1.41 1.40 2.05 2.30 2.95 3.48 3.61 2.83 3.39 3.15 3.72 3.66 3.73 3.91 3.28 3.38less bank service charge -0.35 -0.38 -0.38 -0.48 -0.52 -0.67 -0.67 -0.65 -0.67 -0.58 -0.58 -0.69 -0.83 -1.05 -0.95 -1.08 -0.42Nominal GDP(US$ millions) 16.75 17.96 18.52 22.26 23.89 28.99 29.77 30.85 29.96 32.21 32.66 37.86 35.37 34.90 38.04 35.40 38.19Nominal GDP per capita 1,707$ 1,781$ 1,787$ 2,115$ 2,236$ 2,673$ 2,703$ 2,760$ 2,678$ 2,876$ 2,913$ 3,375$ 3,150$ 3,105$ 3,381$ 3,143$ 3,388$
Inflation Index 69.21 72.06 75.49 79.26 83.25 85.76 88.37 90.69 93.23 95.84 98.39 100.00 101.92 102.62 105.05 105.06 104.21Inflation Rate 2.9% 4.1% 4.8% 5.0% 5.0% 3.0% 3.0% 2.6% 2.8% 2.8% 2.7% 1.6% 1.9% 0.7% 2.4% 0.0% -0.8%Population 9,812 10,085 10,365 10,523 10,683 10,845 11,010 11,178 11,188 11,199 11,209 11,220 11,230 11,241 11,252 11,262 11,273 Population Growth Rate 2.8% 2.8% 2.8% 1.5% 1.5% 1.5% 1.5% 1.5% 0.1% 0.1% 0.1% 0.1% 0.1% 0.1% 0.1% 0.1% 0.1%
Real GDP(FY98 US$ millions) 24.20 24.93 24.54 28.09 28.70 33.80 33.69 34.02 32.14 33.61 33.19 37.86 34.71 34.01 36.21 33.70 36.64Real GDP Growth Rate -1.0% 3.0% -1.6% 14.5% 2.2% 17.8% -0.3% 1.0% -5.5% 4.6% -1.3% 14.1% -8.3% -2.0% 6.5% -7.0% 8.7%
Sources FSM Department of Finance and Administration, FSM Social Security Administration, FSM Department of Economic Affairs, US Bureau of Labor Statistics (CPI)
Note Inflation Index: 1987-2000 US CPI; 2000-2005 FSM CPI
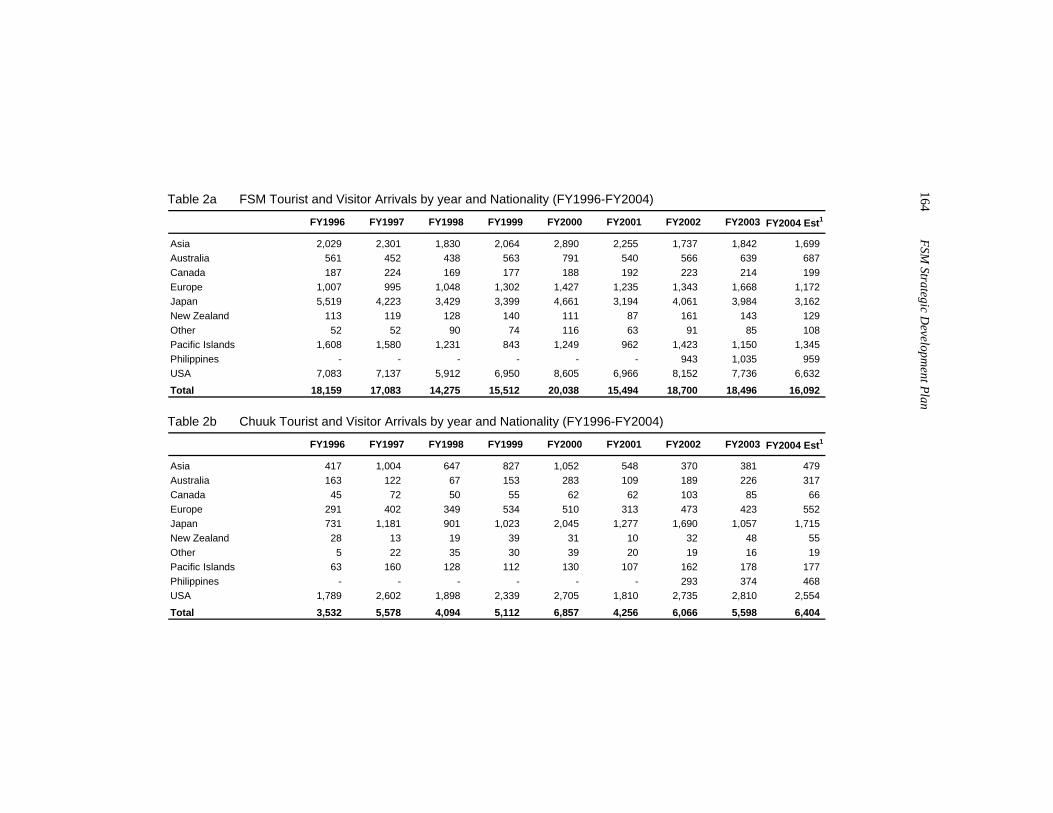
164 FSM
Strategic Developm
ent Plan
Table 2a FSM Tourist and Visitor Arrivals by year and Nationality (FY1996-FY2004)
FY1996 FY1997 FY1998 FY1999 FY2000 FY2001 FY2002 FY2003 FY2004 Est1
Asia 2,029 2,301 1,830 2,064 2,890 2,255 1,737 1,842 1,699 Australia 561 452 438 563 791 540 566 639 687 Canada 187 224 169 177 188 192 223 214 199 Europe 1,007 995 1,048 1,302 1,427 1,235 1,343 1,668 1,172 Japan 5,519 4,223 3,429 3,399 4,661 3,194 4,061 3,984 3,162 New Zealand 113 119 128 140 111 87 161 143 129 Other 52 52 90 74 116 63 91 85 108 Pacific Islands 1,608 1,580 1,231 843 1,249 962 1,423 1,150 1,345 Philippines - - - - - - 943 1,035 959 USA 7,083 7,137 5,912 6,950 8,605 6,966 8,152 7,736 6,632
Total 18,159 17,083 14,275 15,512 20,038 15,494 18,700 18,496 16,092
Table 2b Chuuk Tourist and Visitor Arrivals by year and Nationality (FY1996-FY2004)
FY1996 FY1997 FY1998 FY1999 FY2000 FY2001 FY2002 FY2003 FY2004 Est1
Asia 417 1,004 647 827 1,052 548 370 381 479 Australia 163 122 67 153 283 109 189 226 317 Canada 45 72 50 55 62 62 103 85 66 Europe 291 402 349 534 510 313 473 423 552 Japan 731 1,181 901 1,023 2,045 1,277 1,690 1,057 1,715 New Zealand 28 13 19 39 31 10 32 48 55 Other 5 22 35 30 39 20 19 16 19 Pacific Islands 63 160 128 112 130 107 162 178 177 Philippines - - - - - - 293 374 468 USA 1,789 2,602 1,898 2,339 2,705 1,810 2,735 2,810 2,554
Total 3,532 5,578 4,094 5,112 6,857 4,256 6,066 5,598 6,404
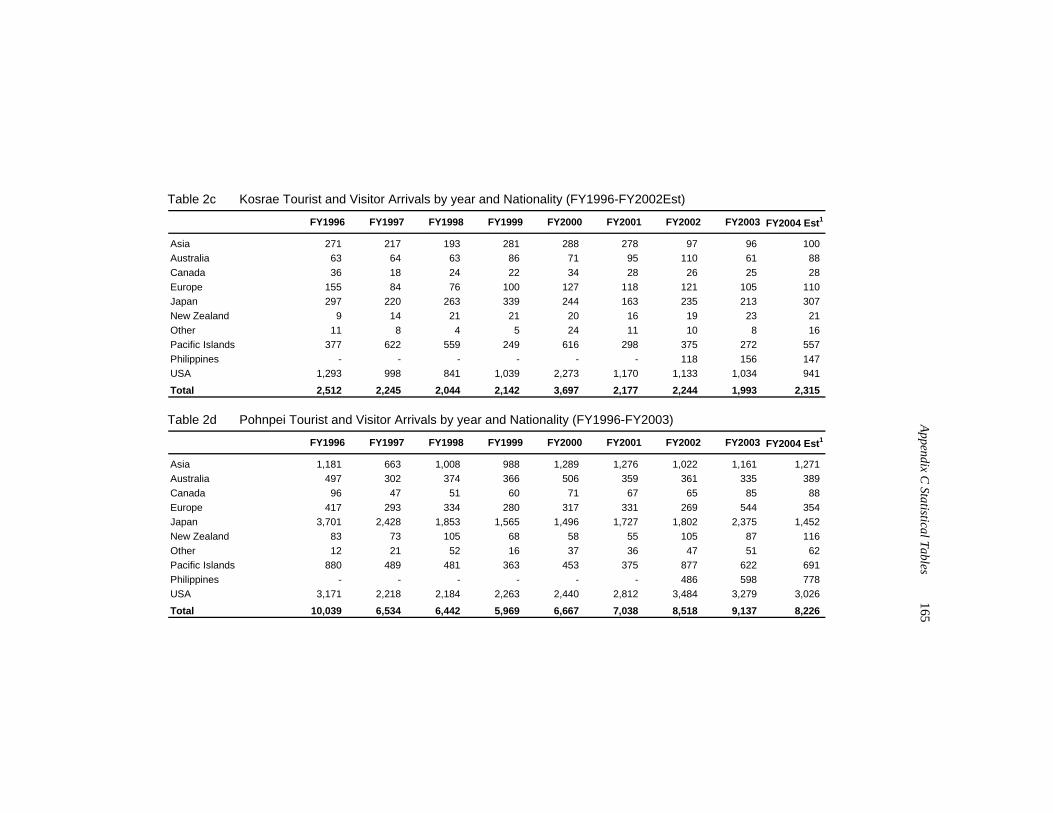
Appendix C
Statistical Tables 165
Table 2c Kosrae Tourist and Visitor Arrivals by year and Nationality (FY1996-FY2002Est)
FY1996 FY1997 FY1998 FY1999 FY2000 FY2001 FY2002 FY2003 FY2004 Est1
Asia 271 217 193 281 288 278 97 96 100 Australia 63 64 63 86 71 95 110 61 88 Canada 36 18 24 22 34 28 26 25 28 Europe 155 84 76 100 127 118 121 105 110 Japan 297 220 263 339 244 163 235 213 307 New Zealand 9 14 21 21 20 16 19 23 21 Other 11 8 4 5 24 11 10 8 16 Pacific Islands 377 622 559 249 616 298 375 272 557 Philippines - - - - - - 118 156 147 USA 1,293 998 841 1,039 2,273 1,170 1,133 1,034 941
Total 2,512 2,245 2,044 2,142 3,697 2,177 2,244 1,993 2,315 Table 2d Pohnpei Tourist and Visitor Arrivals by year and Nationality (FY1996-FY2003)
FY1996 FY1997 FY1998 FY1999 FY2000 FY2001 FY2002 FY2003 FY2004 Est1
Asia 1,181 663 1,008 988 1,289 1,276 1,022 1,161 1,271 Australia 497 302 374 366 506 359 361 335 389 Canada 96 47 51 60 71 67 65 85 88 Europe 417 293 334 280 317 331 269 544 354 Japan 3,701 2,428 1,853 1,565 1,496 1,727 1,802 2,375 1,452 New Zealand 83 73 105 68 58 55 105 87 116 Other 12 21 52 16 37 36 47 51 62 Pacific Islands 880 489 481 363 453 375 877 622 691 Philippines - - - - - - 486 598 778 USA 3,171 2,218 2,184 2,263 2,440 2,812 3,484 3,279 3,026
Total 10,039 6,534 6,442 5,969 6,667 7,038 8,518 9,137 8,226
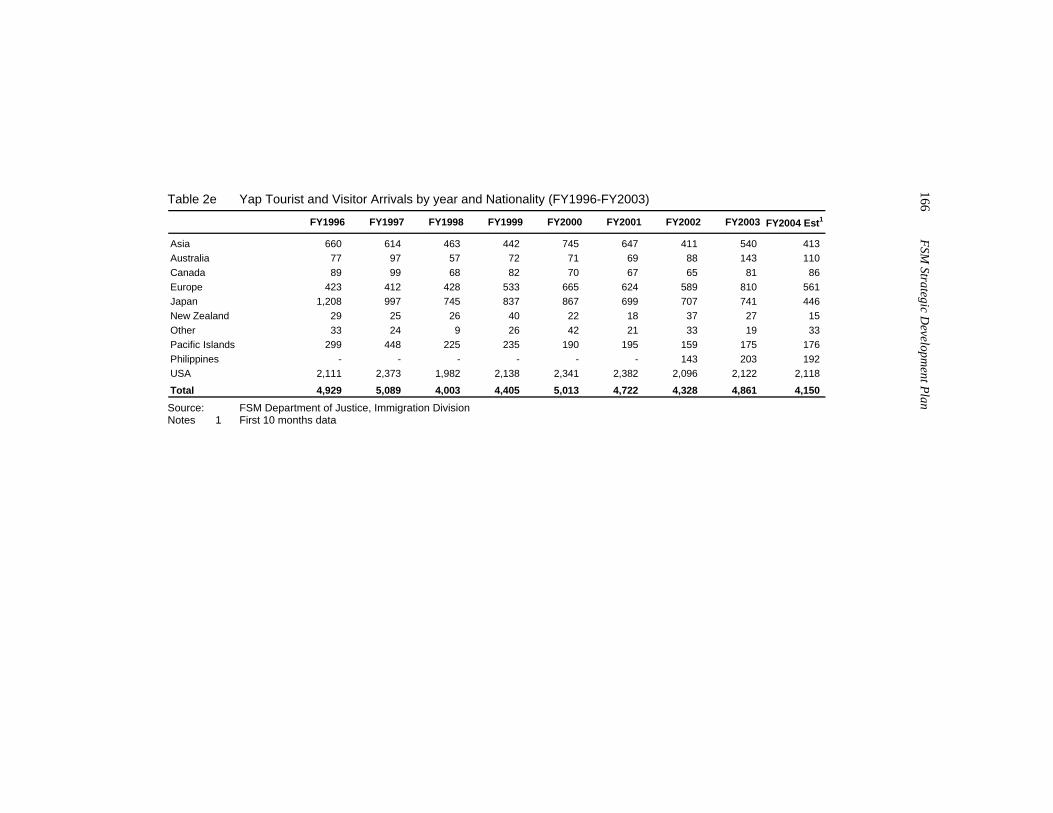
166 FSM
Strategic Developm
ent Plan
Table 2e Yap Tourist and Visitor Arrivals by year and Nationality (FY1996-FY2003)
FY1996 FY1997 FY1998 FY1999 FY2000 FY2001 FY2002 FY2003 FY2004 Est1
Asia 660 614 463 442 745 647 411 540 413 Australia 77 97 57 72 71 69 88 143 110 Canada 89 99 68 82 70 67 65 81 86 Europe 423 412 428 533 665 624 589 810 561 Japan 1,208 997 745 837 867 699 707 741 446 New Zealand 29 25 26 40 22 18 37 27 15 Other 33 24 9 26 42 21 33 19 33 Pacific Islands 299 448 225 235 190 195 159 175 176 Philippines - - - - - - 143 203 192 USA 2,111 2,373 1,982 2,138 2,341 2,382 2,096 2,122 2,118
Total 4,929 5,089 4,003 4,405 5,013 4,722 4,328 4,861 4,150
Source: FSM Department of Justice, Immigration Division Notes 1 First 10 months data
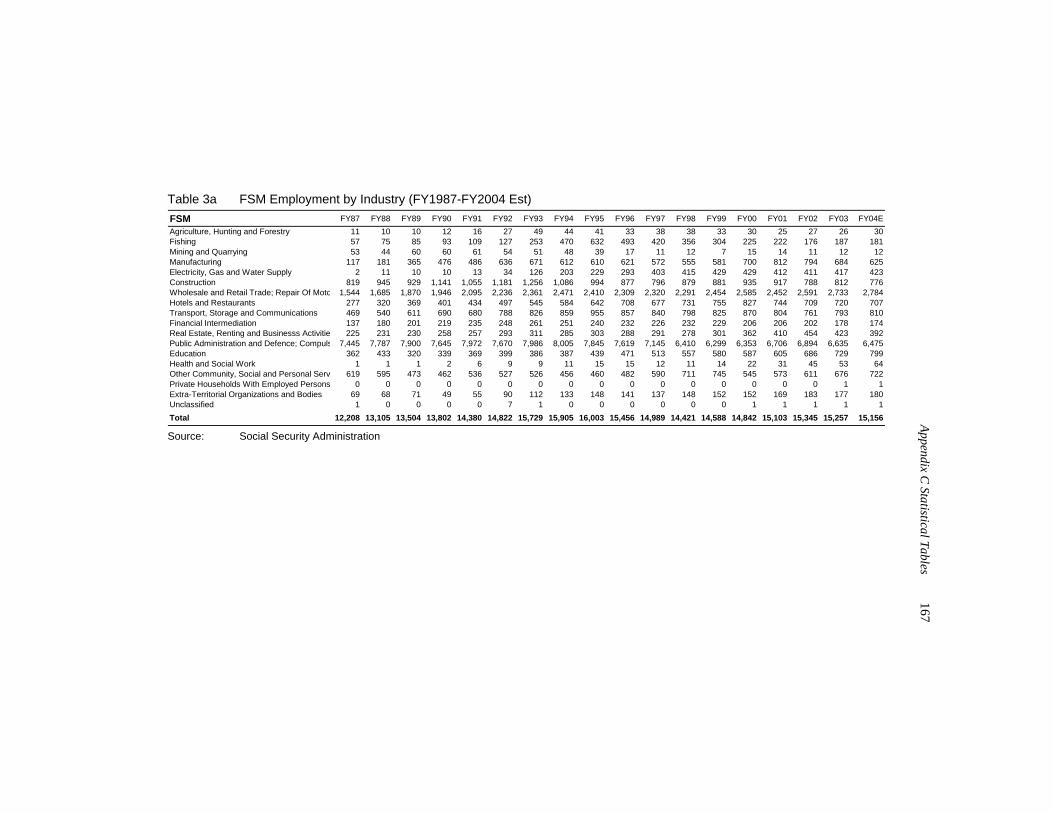
Appendix C
Statistical Tables 167
Table 3a FSM Employment by Industry (FY1987-FY2004 Est) FSM FY87 FY88 FY89 FY90 FY91 FY92 FY93 FY94 FY95 FY96 FY97 FY98 FY99 FY00 FY01 FY02 FY03 FY04EAgriculture, Hunting and Forestry 11 10 10 12 16 27 49 44 41 33 38 38 33 30 25 27 26 30Fishing 57 75 85 93 109 127 253 470 632 493 420 356 304 225 222 176 187 181Mining and Quarrying 53 44 60 60 61 54 51 48 39 17 11 12 7 15 14 11 12 12Manufacturing 117 181 365 476 486 636 671 612 610 621 572 555 581 700 812 794 684 625Electricity, Gas and Water Supply 2 11 10 10 13 34 126 203 229 293 403 415 429 429 412 411 417 423Construction 819 945 929 1,141 1,055 1,181 1,256 1,086 994 877 796 879 881 935 917 788 812 776Wholesale and Retail Trade; Repair Of Moto 1,544 1,685 1,870 1,946 2,095 2,236 2,361 2,471 2,410 2,309 2,320 2,291 2,454 2,585 2,452 2,591 2,733 2,784Hotels and Restaurants 277 320 369 401 434 497 545 584 642 708 677 731 755 827 744 709 720 707Transport, Storage and Communications 469 540 611 690 680 788 826 859 955 857 840 798 825 870 804 761 793 810Financial Intermediation 137 180 201 219 235 248 261 251 240 232 226 232 229 206 206 202 178 174Real Estate, Renting and Businesss Activitie 225 231 230 258 257 293 311 285 303 288 291 278 301 362 410 454 423 392Public Administration and Defence; Compuls 7,445 7,787 7,900 7,645 7,972 7,670 7,986 8,005 7,845 7,619 7,145 6,410 6,299 6,353 6,706 6,894 6,635 6,475Education 362 433 320 339 369 399 386 387 439 471 513 557 580 587 605 686 729 799Health and Social Work 1 1 1 2 6 9 9 11 15 15 12 11 14 22 31 45 53 64Other Community, Social and Personal Serv 619 595 473 462 536 527 526 456 460 482 590 711 745 545 573 611 676 722Private Households With Employed Persons 0 0 0 0 0 0 0 0 0 0 0 0 0 0 0 0 1 1Extra-Territorial Organizations and Bodies 69 68 71 49 55 90 112 133 148 141 137 148 152 152 169 183 177 180Unclassified 1 0 0 0 0 7 1 0 0 0 0 0 0 1 1 1 1 1Total 12,208 13,105 13,504 13,802 14,380 14,822 15,729 15,905 16,003 15,456 14,989 14,421 14,588 14,842 15,103 15,345 15,257 15,156
Source: Social Security Administration
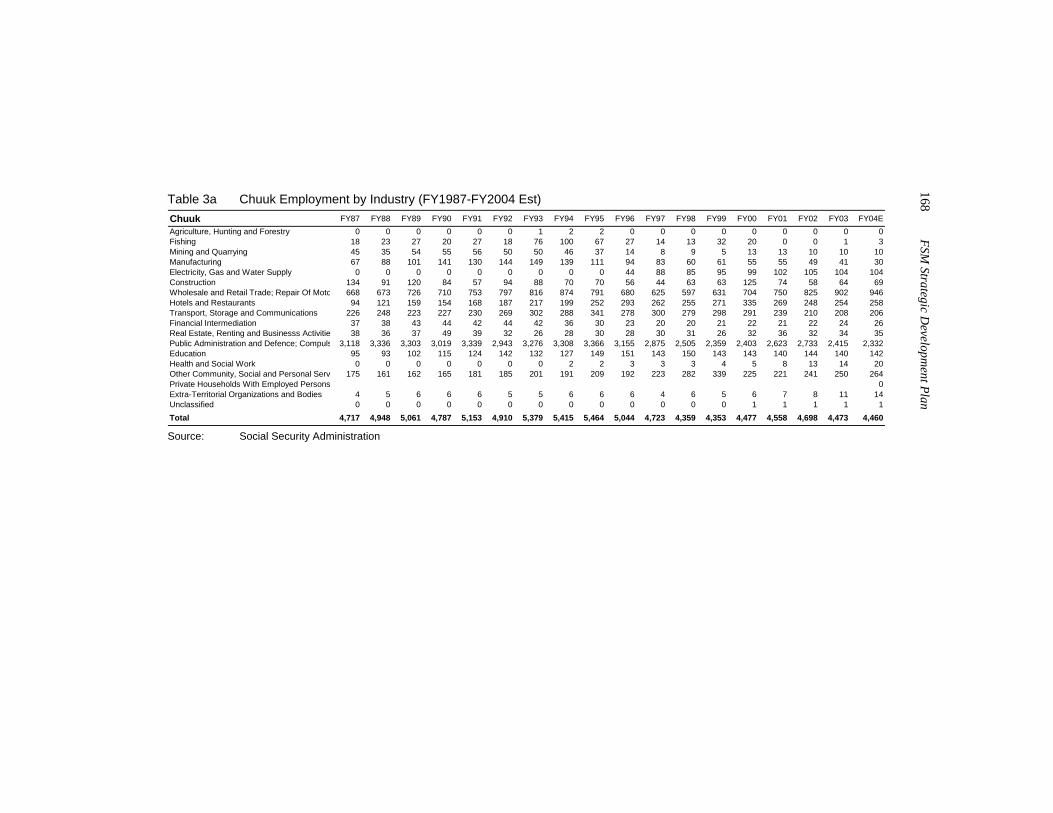
168 FSM
Strategic Developm
ent Plan
Table 3a Chuuk Employment by Industry (FY1987-FY2004 Est) Chuuk FY87 FY88 FY89 FY90 FY91 FY92 FY93 FY94 FY95 FY96 FY97 FY98 FY99 FY00 FY01 FY02 FY03 FY04EAgriculture, Hunting and Forestry 0 0 0 0 0 0 1 2 2 0 0 0 0 0 0 0 0 0Fishing 18 23 27 20 27 18 76 100 67 27 14 13 32 20 0 0 1 3Mining and Quarrying 45 35 54 55 56 50 50 46 37 14 8 9 5 13 13 10 10 10Manufacturing 67 88 101 141 130 144 149 139 111 94 83 60 61 55 55 49 41 30Electricity, Gas and Water Supply 0 0 0 0 0 0 0 0 0 44 88 85 95 99 102 105 104 104Construction 134 91 120 84 57 94 88 70 70 56 44 63 63 125 74 58 64 69Wholesale and Retail Trade; Repair Of Moto 668 673 726 710 753 797 816 874 791 680 625 597 631 704 750 825 902 946Hotels and Restaurants 94 121 159 154 168 187 217 199 252 293 262 255 271 335 269 248 254 258Transport, Storage and Communications 226 248 223 227 230 269 302 288 341 278 300 279 298 291 239 210 208 206Financial Intermediation 37 38 43 44 42 44 42 36 30 23 20 20 21 22 21 22 24 26Real Estate, Renting and Businesss Activitie 38 36 37 49 39 32 26 28 30 28 30 31 26 32 36 32 34 35Public Administration and Defence; Compuls 3,118 3,336 3,303 3,019 3,339 2,943 3,276 3,308 3,366 3,155 2,875 2,505 2,359 2,403 2,623 2,733 2,415 2,332Education 95 93 102 115 124 142 132 127 149 151 143 150 143 143 140 144 140 142Health and Social Work 0 0 0 0 0 0 0 2 2 3 3 3 4 5 8 13 14 20Other Community, Social and Personal Serv 175 161 162 165 181 185 201 191 209 192 223 282 339 225 221 241 250 264Private Households With Employed Persons 0Extra-Territorial Organizations and Bodies 4 5 6 6 6 5 5 6 6 6 4 6 5 6 7 8 11 14Unclassified 0 0 0 0 0 0 0 0 0 0 0 0 0 1 1 1 1 1Total 4,717 4,948 5,061 4,787 5,153 4,910 5,379 5,415 5,464 5,044 4,723 4,359 4,353 4,477 4,558 4,698 4,473 4,460
Source: Social Security Administration
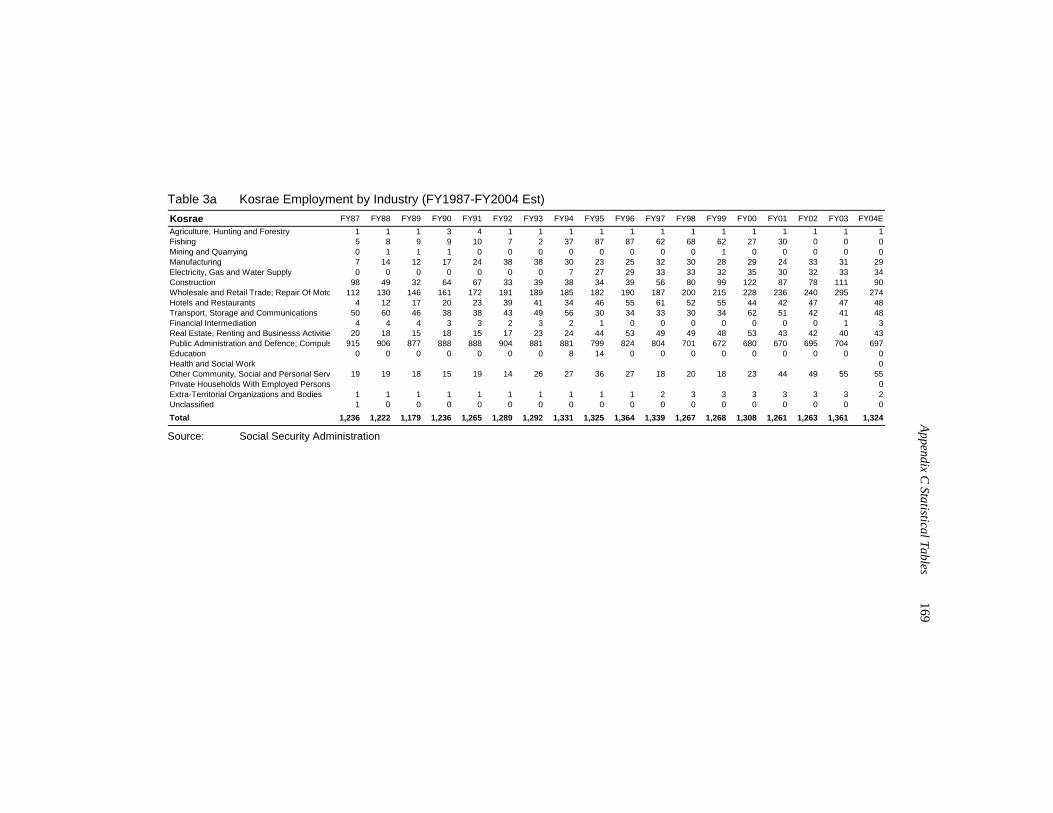
Appendix C
Statistical Tables 169
Table 3a Kosrae Employment by Industry (FY1987-FY2004 Est) Kosrae FY87 FY88 FY89 FY90 FY91 FY92 FY93 FY94 FY95 FY96 FY97 FY98 FY99 FY00 FY01 FY02 FY03 FY04EAgriculture, Hunting and Forestry 1 1 1 3 4 1 1 1 1 1 1 1 1 1 1 1 1 1Fishing 5 8 9 9 10 7 2 37 87 87 62 68 62 27 30 0 0 0Mining and Quarrying 0 1 1 1 0 0 0 0 0 0 0 0 1 0 0 0 0 0Manufacturing 7 14 12 17 24 38 38 30 23 25 32 30 28 29 24 33 31 29Electricity, Gas and Water Supply 0 0 0 0 0 0 0 7 27 29 33 33 32 35 30 32 33 34Construction 98 49 32 64 67 33 39 38 34 39 56 80 99 122 87 78 111 90Wholesale and Retail Trade; Repair Of Moto 112 130 146 161 172 191 189 185 182 190 187 200 215 228 236 240 295 274Hotels and Restaurants 4 12 17 20 23 39 41 34 46 55 61 52 55 44 42 47 47 48Transport, Storage and Communications 50 60 46 38 38 43 49 56 30 34 33 30 34 62 51 42 41 48Financial Intermediation 4 4 4 3 3 2 3 2 1 0 0 0 0 0 0 0 1 3Real Estate, Renting and Businesss Activitie 20 18 15 18 15 17 23 24 44 53 49 49 48 53 43 42 40 43Public Administration and Defence; Compuls 915 906 877 888 888 904 881 881 799 824 804 701 672 680 670 695 704 697Education 0 0 0 0 0 0 0 8 14 0 0 0 0 0 0 0 0 0Health and Social Work 0Other Community, Social and Personal Serv 19 19 18 15 19 14 26 27 36 27 18 20 18 23 44 49 55 55Private Households With Employed Persons 0Extra-Territorial Organizations and Bodies 1 1 1 1 1 1 1 1 1 1 2 3 3 3 3 3 3 2Unclassified 1 0 0 0 0 0 0 0 0 0 0 0 0 0 0 0 0 0Total 1,236 1,222 1,179 1,236 1,265 1,289 1,292 1,331 1,325 1,364 1,339 1,267 1,268 1,308 1,261 1,263 1,361 1,324
Source: Social Security Administration

170 FSM
Strategic Developm
ent Plan
Table 3a Pohnpei Employment by Industry (FY1987-FY2004 Est) Pohnpei FY87 FY88 FY89 FY90 FY91 FY92 FY93 FY94 FY95 FY96 FY97 FY98 FY99 FY00 FY01 FY02 FY03 FY04EAgriculture, Hunting and Forestry 10 9 9 9 11 25 39 32 28 25 30 30 26 25 20 21 21 26Fishing 0 0 3 4 7 18 60 175 328 257 223 212 174 124 140 140 145 139Mining and Quarrying 7 8 5 4 4 4 2 2 2 3 3 3 2 1 1 1 2 2Manufacturing 38 66 54 60 63 77 76 76 77 78 71 63 52 51 44 64 45 39Electricity, Gas and Water Supply 2 9 8 8 11 32 124 194 200 199 199 207 205 194 186 180 181 183Construction 430 618 602 684 622 704 868 799 713 559 488 494 524 488 555 422 366 381Wholesale and Retail Trade; Repair Of Moto 549 644 755 840 901 964 1,053 1,061 1,075 1,066 1,066 1,069 1,134 1,173 1,068 1,137 1,152 1,178Hotels and Restaurants 137 144 147 175 199 216 224 237 228 230 218 233 206 203 221 227 230 215Transport, Storage and Communications 166 198 318 401 390 455 450 480 549 513 472 455 461 475 465 467 495 501Financial Intermediation 83 126 141 161 177 188 203 200 198 197 195 200 196 181 185 180 153 145Real Estate, Renting and Businesss Activitie 150 158 157 162 173 206 217 194 193 171 173 154 143 160 193 238 226 228Public Administration and Defence; Compuls 2,369 2,452 2,637 2,659 2,693 2,751 2,656 2,562 2,545 2,515 2,430 2,226 2,372 2,363 2,433 2,486 2,508 2,445Education 267 337 213 216 238 245 241 236 262 306 356 401 435 442 463 539 586 654Health and Social Work 1 1 1 2 6 9 9 10 13 12 9 8 10 15 20 30 37 42Other Community, Social and Personal Serv 390 379 254 252 304 297 261 200 160 193 242 292 272 209 209 234 238 255Private Households With Employed Persons 0Extra-Territorial Organizations and Bodies 63 59 63 40 47 82 106 126 141 134 131 139 143 142 160 172 164 164Unclassified 0 0 0 0 0 7 0 0 0 0 0 0 0 0 0 0 0 0Total 4,662 5,208 5,366 5,675 5,847 6,279 6,589 6,583 6,713 6,459 6,304 6,187 6,355 6,248 6,362 6,540 6,548 6,597
Source: Social Security Administration
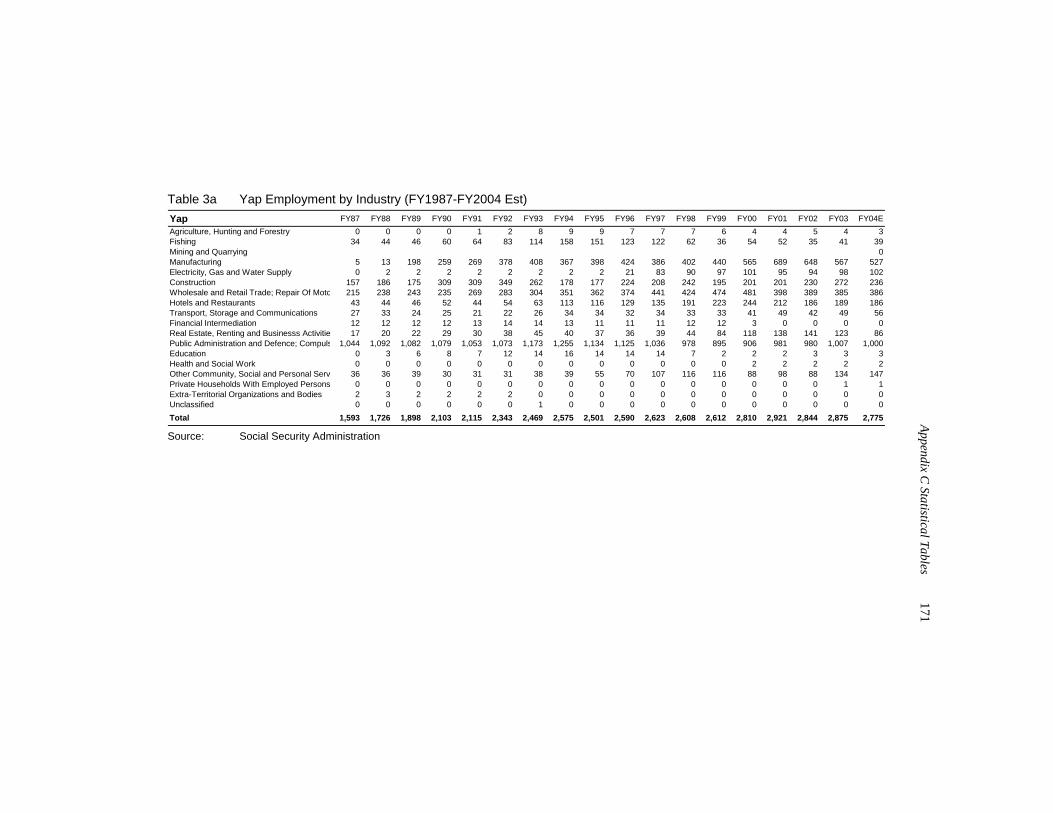
Appendix C
Statistical Tables 171
Table 3a Yap Employment by Industry (FY1987-FY2004 Est) Yap FY87 FY88 FY89 FY90 FY91 FY92 FY93 FY94 FY95 FY96 FY97 FY98 FY99 FY00 FY01 FY02 FY03 FY04EAgriculture, Hunting and Forestry 0 0 0 0 1 2 8 9 9 7 7 7 6 4 4 5 4 3Fishing 34 44 46 60 64 83 114 158 151 123 122 62 36 54 52 35 41 39Mining and Quarrying 0Manufacturing 5 13 198 259 269 378 408 367 398 424 386 402 440 565 689 648 567 527Electricity, Gas and Water Supply 0 2 2 2 2 2 2 2 2 21 83 90 97 101 95 94 98 102Construction 157 186 175 309 309 349 262 178 177 224 208 242 195 201 201 230 272 236Wholesale and Retail Trade; Repair Of Moto 215 238 243 235 269 283 304 351 362 374 441 424 474 481 398 389 385 386Hotels and Restaurants 43 44 46 52 44 54 63 113 116 129 135 191 223 244 212 186 189 186Transport, Storage and Communications 27 33 24 25 21 22 26 34 34 32 34 33 33 41 49 42 49 56Financial Intermediation 12 12 12 12 13 14 14 13 11 11 11 12 12 3 0 0 0 0Real Estate, Renting and Businesss Activitie 17 20 22 29 30 38 45 40 37 36 39 44 84 118 138 141 123 86Public Administration and Defence; Compuls 1,044 1,092 1,082 1,079 1,053 1,073 1,173 1,255 1,134 1,125 1,036 978 895 906 981 980 1,007 1,000Education 0 3 6 8 7 12 14 16 14 14 14 7 2 2 2 3 3 3Health and Social Work 0 0 0 0 0 0 0 0 0 0 0 0 0 2 2 2 2 2Other Community, Social and Personal Serv 36 36 39 30 31 31 38 39 55 70 107 116 116 88 98 88 134 147Private Households With Employed Persons 0 0 0 0 0 0 0 0 0 0 0 0 0 0 0 0 1 1Extra-Territorial Organizations and Bodies 2 3 2 2 2 2 0 0 0 0 0 0 0 0 0 0 0 0Unclassified 0 0 0 0 0 0 1 0 0 0 0 0 0 0 0 0 0 0Total 1,593 1,726 1,898 2,103 2,115 2,343 2,469 2,575 2,501 2,590 2,623 2,608 2,612 2,810 2,921 2,844 2,875 2,775
Source: Social Security Administration
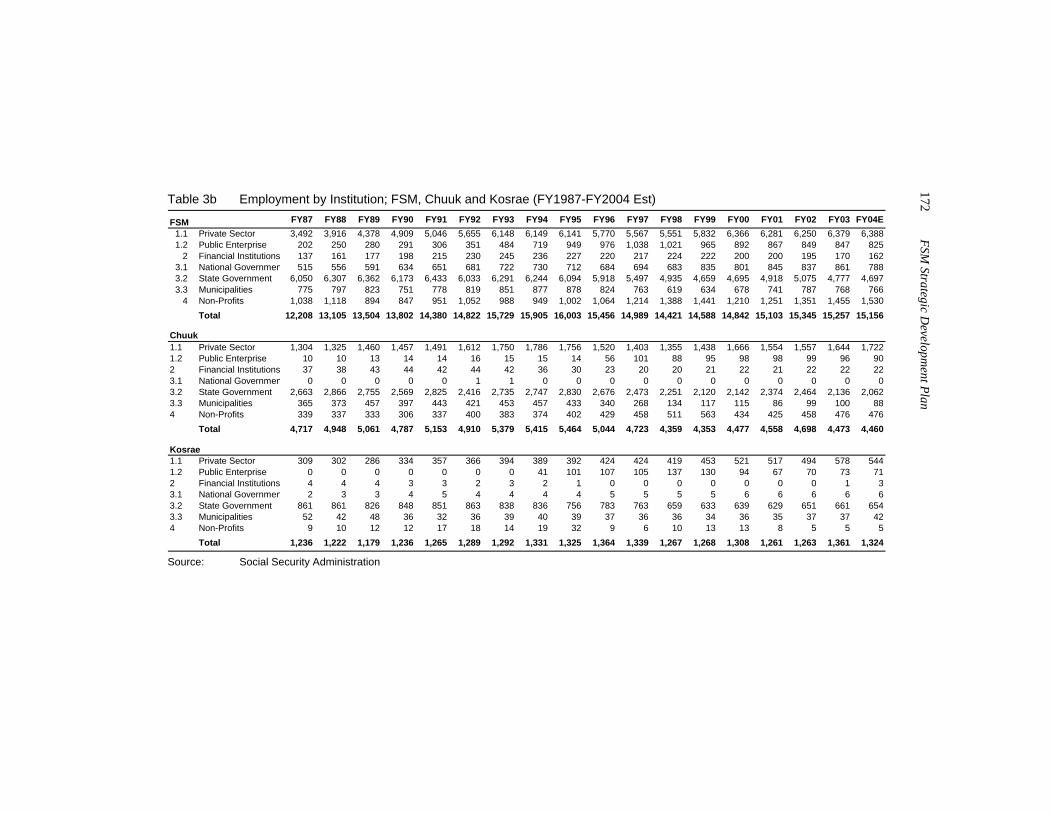
172 FSM
Strategic Developm
ent Plan
Table 3b Employment by Institution; FSM, Chuuk and Kosrae (FY1987-FY2004 Est)
FSM FY87 FY88 FY89 FY90 FY91 FY92 FY93 FY94 FY95 FY96 FY97 FY98 FY99 FY00 FY01 FY02 FY03 FY04E1.1 Private Sector 3,492 3,916 4,378 4,909 5,046 5,655 6,148 6,149 6,141 5,770 5,567 5,551 5,832 6,366 6,281 6,250 6,379 6,3881.2 Public Enterprise 202 250 280 291 306 351 484 719 949 976 1,038 1,021 965 892 867 849 847 825
2 Financial Institutions 137 161 177 198 215 230 245 236 227 220 217 224 222 200 200 195 170 1623.1 National Governmen 515 556 591 634 651 681 722 730 712 684 694 683 835 801 845 837 861 7883.2 State Government 6,050 6,307 6,362 6,173 6,433 6,033 6,291 6,244 6,094 5,918 5,497 4,935 4,659 4,695 4,918 5,075 4,777 4,6973.3 Municipalities 775 797 823 751 778 819 851 877 878 824 763 619 634 678 741 787 768 766
4 Non-Profits 1,038 1,118 894 847 951 1,052 988 949 1,002 1,064 1,214 1,388 1,441 1,210 1,251 1,351 1,455 1,530Total 12,208 13,105 13,504 13,802 14,380 14,822 15,729 15,905 16,003 15,456 14,989 14,421 14,588 14,842 15,103 15,345 15,257 15,156
Chuuk1.1 Private Sector 1,304 1,325 1,460 1,457 1,491 1,612 1,750 1,786 1,756 1,520 1,403 1,355 1,438 1,666 1,554 1,557 1,644 1,7221.2 Public Enterprise 10 10 13 14 14 16 15 15 14 56 101 88 95 98 98 99 96 902 Financial Institutions 37 38 43 44 42 44 42 36 30 23 20 20 21 22 21 22 22 223.1 National Governmen 0 0 0 0 0 1 1 0 0 0 0 0 0 0 0 0 0 03.2 State Government 2,663 2,866 2,755 2,569 2,825 2,416 2,735 2,747 2,830 2,676 2,473 2,251 2,120 2,142 2,374 2,464 2,136 2,0623.3 Municipalities 365 373 457 397 443 421 453 457 433 340 268 134 117 115 86 99 100 884 Non-Profits 339 337 333 306 337 400 383 374 402 429 458 511 563 434 425 458 476 476
Total 4,717 4,948 5,061 4,787 5,153 4,910 5,379 5,415 5,464 5,044 4,723 4,359 4,353 4,477 4,558 4,698 4,473 4,460
Kosrae1.1 Private Sector 309 302 286 334 357 366 394 389 392 424 424 419 453 521 517 494 578 5441.2 Public Enterprise 0 0 0 0 0 0 0 41 101 107 105 137 130 94 67 70 73 712 Financial Institutions 4 4 4 3 3 2 3 2 1 0 0 0 0 0 0 0 1 33.1 National Governmen 2 3 3 4 5 4 4 4 4 5 5 5 5 6 6 6 6 63.2 State Government 861 861 826 848 851 863 838 836 756 783 763 659 633 639 629 651 661 6543.3 Municipalities 52 42 48 36 32 36 39 40 39 37 36 36 34 36 35 37 37 424 Non-Profits 9 10 12 12 17 18 14 19 32 9 6 10 13 13 8 5 5 5
Total 1,236 1,222 1,179 1,236 1,265 1,289 1,292 1,331 1,325 1,364 1,339 1,267 1,268 1,308 1,261 1,263 1,361 1,324
Source: Social Security Administration
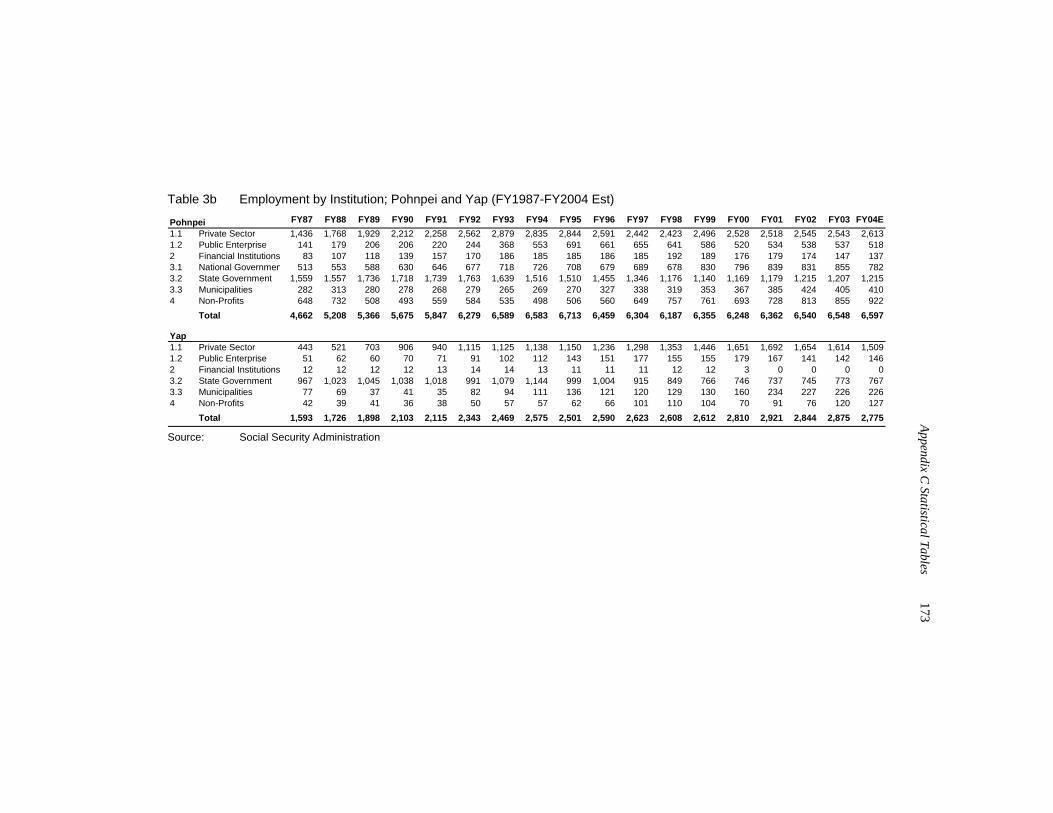
Appendix C
Statistical Tables 173
Table 3b Employment by Institution; Pohnpei and Yap (FY1987-FY2004 Est)
Pohnpei FY87 FY88 FY89 FY90 FY91 FY92 FY93 FY94 FY95 FY96 FY97 FY98 FY99 FY00 FY01 FY02 FY03 FY04E1.1 Private Sector 1,436 1,768 1,929 2,212 2,258 2,562 2,879 2,835 2,844 2,591 2,442 2,423 2,496 2,528 2,518 2,545 2,543 2,6131.2 Public Enterprise 141 179 206 206 220 244 368 553 691 661 655 641 586 520 534 538 537 5182 Financial Institutions 83 107 118 139 157 170 186 185 185 186 185 192 189 176 179 174 147 1373.1 National Governmen 513 553 588 630 646 677 718 726 708 679 689 678 830 796 839 831 855 7823.2 State Government 1,559 1,557 1,736 1,718 1,739 1,763 1,639 1,516 1,510 1,455 1,346 1,176 1,140 1,169 1,179 1,215 1,207 1,2153.3 Municipalities 282 313 280 278 268 279 265 269 270 327 338 319 353 367 385 424 405 4104 Non-Profits 648 732 508 493 559 584 535 498 506 560 649 757 761 693 728 813 855 922
Total 4,662 5,208 5,366 5,675 5,847 6,279 6,589 6,583 6,713 6,459 6,304 6,187 6,355 6,248 6,362 6,540 6,548 6,597
Yap1.1 Private Sector 443 521 703 906 940 1,115 1,125 1,138 1,150 1,236 1,298 1,353 1,446 1,651 1,692 1,654 1,614 1,5091.2 Public Enterprise 51 62 60 70 71 91 102 112 143 151 177 155 155 179 167 141 142 1462 Financial Institutions 12 12 12 12 13 14 14 13 11 11 11 12 12 3 0 0 0 03.2 State Government 967 1,023 1,045 1,038 1,018 991 1,079 1,144 999 1,004 915 849 766 746 737 745 773 7673.3 Municipalities 77 69 37 41 35 82 94 111 136 121 120 129 130 160 234 227 226 2264 Non-Profits 42 39 41 36 38 50 57 57 62 66 101 110 104 70 91 76 120 127
Total 1,593 1,726 1,898 2,103 2,115 2,343 2,469 2,575 2,501 2,590 2,623 2,608 2,612 2,810 2,921 2,844 2,875 2,775
Source: Social Security Administration
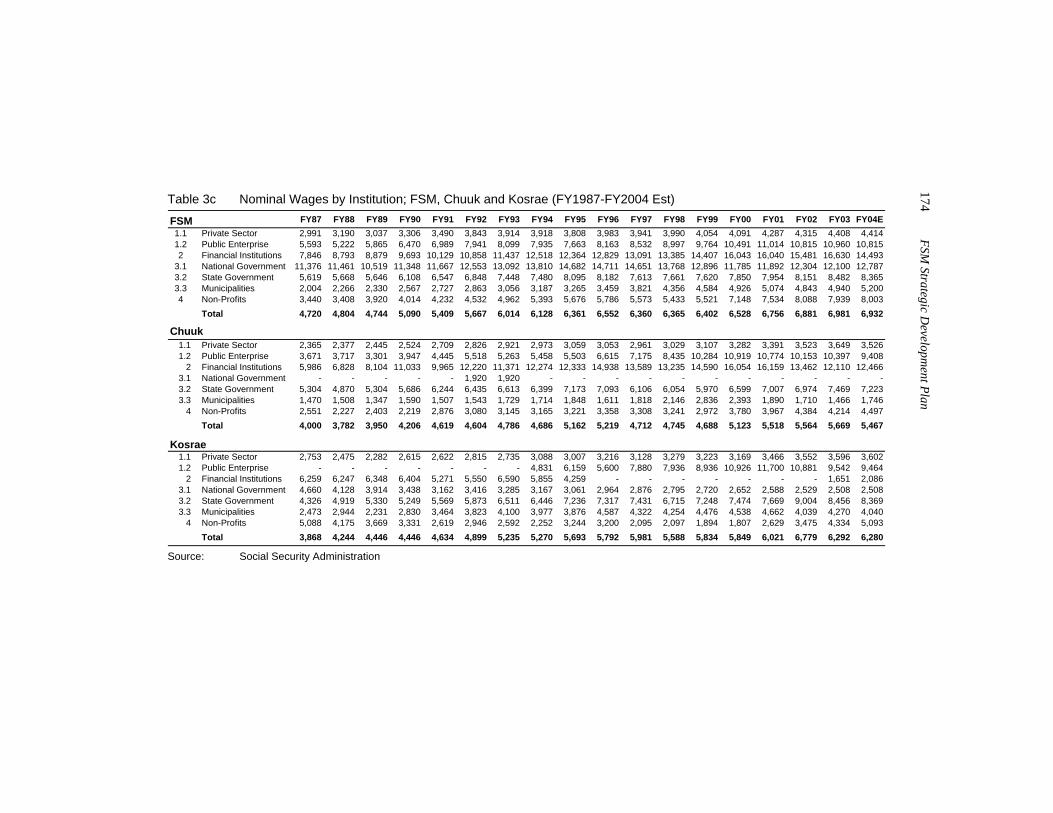
174 FSM
Strategic Developm
ent Plan
Table 3c Nominal Wages by Institution; FSM, Chuuk and Kosrae (FY1987-FY2004 Est)
FSM FY87 FY88 FY89 FY90 FY91 FY92 FY93 FY94 FY95 FY96 FY97 FY98 FY99 FY00 FY01 FY02 FY03 FY04E1.1 Private Sector 2,991 3,190 3,037 3,306 3,490 3,843 3,914 3,918 3,808 3,983 3,941 3,990 4,054 4,091 4,287 4,315 4,408 4,4141.2 Public Enterprise 5,593 5,222 5,865 6,470 6,989 7,941 8,099 7,935 7,663 8,163 8,532 8,997 9,764 10,491 11,014 10,815 10,960 10,8152 Financial Institutions 7,846 8,793 8,879 9,693 10,129 10,858 11,437 12,518 12,364 12,829 13,091 13,385 14,407 16,043 16,040 15,481 16,630 14,493
3.1 National Government 11,376 11,461 10,519 11,348 11,667 12,553 13,092 13,810 14,682 14,711 14,651 13,768 12,896 11,785 11,892 12,304 12,100 12,7873.2 State Government 5,619 5,668 5,646 6,108 6,547 6,848 7,448 7,480 8,095 8,182 7,613 7,661 7,620 7,850 7,954 8,151 8,482 8,3653.3 Municipalities 2,004 2,266 2,330 2,567 2,727 2,863 3,056 3,187 3,265 3,459 3,821 4,356 4,584 4,926 5,074 4,843 4,940 5,2004 Non-Profits 3,440 3,408 3,920 4,014 4,232 4,532 4,962 5,393 5,676 5,786 5,573 5,433 5,521 7,148 7,534 8,088 7,939 8,003
Total 4,720 4,804 4,744 5,090 5,409 5,667 6,014 6,128 6,361 6,552 6,360 6,365 6,402 6,528 6,756 6,881 6,981 6,932
Chuuk1.1 Private Sector 2,365 2,377 2,445 2,524 2,709 2,826 2,921 2,973 3,059 3,053 2,961 3,029 3,107 3,282 3,391 3,523 3,649 3,5261.2 Public Enterprise 3,671 3,717 3,301 3,947 4,445 5,518 5,263 5,458 5,503 6,615 7,175 8,435 10,284 10,919 10,774 10,153 10,397 9,408
2 Financial Institutions 5,986 6,828 8,104 11,033 9,965 12,220 11,371 12,274 12,333 14,938 13,589 13,235 14,590 16,054 16,159 13,462 12,110 12,4663.1 National Government - - - - - 1,920 1,920 - - - - - - - - - - -3.2 State Government 5,304 4,870 5,304 5,686 6,244 6,435 6,613 6,399 7,173 7,093 6,106 6,054 5,970 6,599 7,007 6,974 7,469 7,2233.3 Municipalities 1,470 1,508 1,347 1,590 1,507 1,543 1,729 1,714 1,848 1,611 1,818 2,146 2,836 2,393 1,890 1,710 1,466 1,746
4 Non-Profits 2,551 2,227 2,403 2,219 2,876 3,080 3,145 3,165 3,221 3,358 3,308 3,241 2,972 3,780 3,967 4,384 4,214 4,497Total 4,000 3,782 3,950 4,206 4,619 4,604 4,786 4,686 5,162 5,219 4,712 4,745 4,688 5,123 5,518 5,564 5,669 5,467
Kosrae1.1 Private Sector 2,753 2,475 2,282 2,615 2,622 2,815 2,735 3,088 3,007 3,216 3,128 3,279 3,223 3,169 3,466 3,552 3,596 3,6021.2 Public Enterprise - - - - - - - 4,831 6,159 5,600 7,880 7,936 8,936 10,926 11,700 10,881 9,542 9,464
2 Financial Institutions 6,259 6,247 6,348 6,404 5,271 5,550 6,590 5,855 4,259 - - - - - - - 1,651 2,0863.1 National Government 4,660 4,128 3,914 3,438 3,162 3,416 3,285 3,167 3,061 2,964 2,876 2,795 2,720 2,652 2,588 2,529 2,508 2,5083.2 State Government 4,326 4,919 5,330 5,249 5,569 5,873 6,511 6,446 7,236 7,317 7,431 6,715 7,248 7,474 7,669 9,004 8,456 8,3693.3 Municipalities 2,473 2,944 2,231 2,830 3,464 3,823 4,100 3,977 3,876 4,587 4,322 4,254 4,476 4,538 4,662 4,039 4,270 4,040
4 Non-Profits 5,088 4,175 3,669 3,331 2,619 2,946 2,592 2,252 3,244 3,200 2,095 2,097 1,894 1,807 2,629 3,475 4,334 5,093Total 3,868 4,244 4,446 4,446 4,634 4,899 5,235 5,270 5,693 5,792 5,981 5,588 5,834 5,849 6,021 6,779 6,292 6,280
Source: Social Security Administration
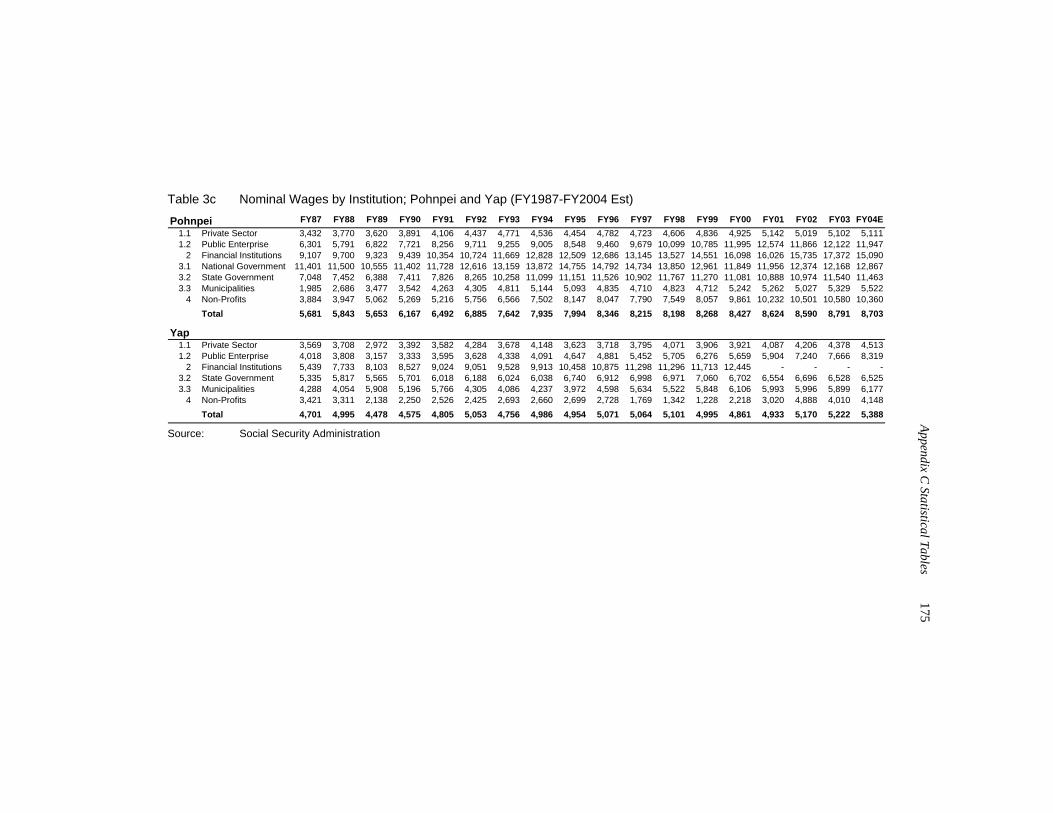
Appendix C
Statistical Tables 175
Table 3c Nominal Wages by Institution; Pohnpei and Yap (FY1987-FY2004 Est)
Pohnpei FY87 FY88 FY89 FY90 FY91 FY92 FY93 FY94 FY95 FY96 FY97 FY98 FY99 FY00 FY01 FY02 FY03 FY04E1.1 Private Sector 3,432 3,770 3,620 3,891 4,106 4,437 4,771 4,536 4,454 4,782 4,723 4,606 4,836 4,925 5,142 5,019 5,102 5,1111.2 Public Enterprise 6,301 5,791 6,822 7,721 8,256 9,711 9,255 9,005 8,548 9,460 9,679 10,099 10,785 11,995 12,574 11,866 12,122 11,947
2 Financial Institutions 9,107 9,700 9,323 9,439 10,354 10,724 11,669 12,828 12,509 12,686 13,145 13,527 14,551 16,098 16,026 15,735 17,372 15,0903.1 National Government 11,401 11,500 10,555 11,402 11,728 12,616 13,159 13,872 14,755 14,792 14,734 13,850 12,961 11,849 11,956 12,374 12,168 12,8673.2 State Government 7,048 7,452 6,388 7,411 7,826 8,265 10,258 11,099 11,151 11,526 10,902 11,767 11,270 11,081 10,888 10,974 11,540 11,4633.3 Municipalities 1,985 2,686 3,477 3,542 4,263 4,305 4,811 5,144 5,093 4,835 4,710 4,823 4,712 5,242 5,262 5,027 5,329 5,522
4 Non-Profits 3,884 3,947 5,062 5,269 5,216 5,756 6,566 7,502 8,147 8,047 7,790 7,549 8,057 9,861 10,232 10,501 10,580 10,360Total 5,681 5,843 5,653 6,167 6,492 6,885 7,642 7,935 7,994 8,346 8,215 8,198 8,268 8,427 8,624 8,590 8,791 8,703
Yap1.1 Private Sector 3,569 3,708 2,972 3,392 3,582 4,284 3,678 4,148 3,623 3,718 3,795 4,071 3,906 3,921 4,087 4,206 4,378 4,5131.2 Public Enterprise 4,018 3,808 3,157 3,333 3,595 3,628 4,338 4,091 4,647 4,881 5,452 5,705 6,276 5,659 5,904 7,240 7,666 8,319
2 Financial Institutions 5,439 7,733 8,103 8,527 9,024 9,051 9,528 9,913 10,458 10,875 11,298 11,296 11,713 12,445 - - - -3.2 State Government 5,335 5,817 5,565 5,701 6,018 6,188 6,024 6,038 6,740 6,912 6,998 6,971 7,060 6,702 6,554 6,696 6,528 6,5253.3 Municipalities 4,288 4,054 5,908 5,196 5,766 4,305 4,086 4,237 3,972 4,598 5,634 5,522 5,848 6,106 5,993 5,996 5,899 6,177
4 Non-Profits 3,421 3,311 2,138 2,250 2,526 2,425 2,693 2,660 2,699 2,728 1,769 1,342 1,228 2,218 3,020 4,888 4,010 4,148Total 4,701 4,995 4,478 4,575 4,805 5,053 4,756 4,986 4,954 5,071 5,064 5,101 4,995 4,861 4,933 5,170 5,222 5,388
Source: Social Security Administration
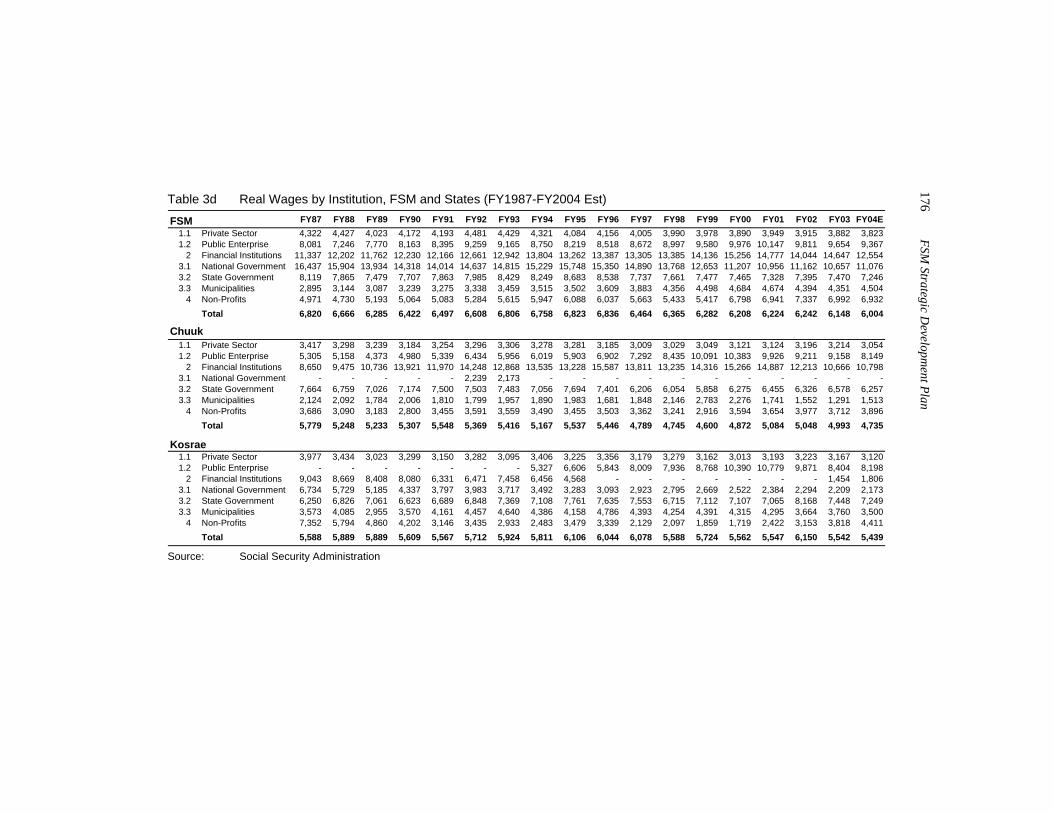
176 FSM
Strategic Developm
ent Plan
Table 3d Real Wages by Institution, FSM and States (FY1987-FY2004 Est)
FSM FY87 FY88 FY89 FY90 FY91 FY92 FY93 FY94 FY95 FY96 FY97 FY98 FY99 FY00 FY01 FY02 FY03 FY04E1.1 Private Sector 4,322 4,427 4,023 4,172 4,193 4,481 4,429 4,321 4,084 4,156 4,005 3,990 3,978 3,890 3,949 3,915 3,882 3,8231.2 Public Enterprise 8,081 7,246 7,770 8,163 8,395 9,259 9,165 8,750 8,219 8,518 8,672 8,997 9,580 9,976 10,147 9,811 9,654 9,367
2 Financial Institutions 11,337 12,202 11,762 12,230 12,166 12,661 12,942 13,804 13,262 13,387 13,305 13,385 14,136 15,256 14,777 14,044 14,647 12,5543.1 National Government 16,437 15,904 13,934 14,318 14,014 14,637 14,815 15,229 15,748 15,350 14,890 13,768 12,653 11,207 10,956 11,162 10,657 11,0763.2 State Government 8,119 7,865 7,479 7,707 7,863 7,985 8,429 8,249 8,683 8,538 7,737 7,661 7,477 7,465 7,328 7,395 7,470 7,2463.3 Municipalities 2,895 3,144 3,087 3,239 3,275 3,338 3,459 3,515 3,502 3,609 3,883 4,356 4,498 4,684 4,674 4,394 4,351 4,504
4 Non-Profits 4,971 4,730 5,193 5,064 5,083 5,284 5,615 5,947 6,088 6,037 5,663 5,433 5,417 6,798 6,941 7,337 6,992 6,932Total 6,820 6,666 6,285 6,422 6,497 6,608 6,806 6,758 6,823 6,836 6,464 6,365 6,282 6,208 6,224 6,242 6,148 6,004
Chuuk1.1 Private Sector 3,417 3,298 3,239 3,184 3,254 3,296 3,306 3,278 3,281 3,185 3,009 3,029 3,049 3,121 3,124 3,196 3,214 3,0541.2 Public Enterprise 5,305 5,158 4,373 4,980 5,339 6,434 5,956 6,019 5,903 6,902 7,292 8,435 10,091 10,383 9,926 9,211 9,158 8,149
2 Financial Institutions 8,650 9,475 10,736 13,921 11,970 14,248 12,868 13,535 13,228 15,587 13,811 13,235 14,316 15,266 14,887 12,213 10,666 10,7983.1 National Government - - - - - 2,239 2,173 - - - - - - - - - - -3.2 State Government 7,664 6,759 7,026 7,174 7,500 7,503 7,483 7,056 7,694 7,401 6,206 6,054 5,858 6,275 6,455 6,326 6,578 6,2573.3 Municipalities 2,124 2,092 1,784 2,006 1,810 1,799 1,957 1,890 1,983 1,681 1,848 2,146 2,783 2,276 1,741 1,552 1,291 1,513
4 Non-Profits 3,686 3,090 3,183 2,800 3,455 3,591 3,559 3,490 3,455 3,503 3,362 3,241 2,916 3,594 3,654 3,977 3,712 3,896Total 5,779 5,248 5,233 5,307 5,548 5,369 5,416 5,167 5,537 5,446 4,789 4,745 4,600 4,872 5,084 5,048 4,993 4,735
Kosrae1.1 Private Sector 3,977 3,434 3,023 3,299 3,150 3,282 3,095 3,406 3,225 3,356 3,179 3,279 3,162 3,013 3,193 3,223 3,167 3,1201.2 Public Enterprise - - - - - - - 5,327 6,606 5,843 8,009 7,936 8,768 10,390 10,779 9,871 8,404 8,198
2 Financial Institutions 9,043 8,669 8,408 8,080 6,331 6,471 7,458 6,456 4,568 - - - - - - - 1,454 1,8063.1 National Government 6,734 5,729 5,185 4,337 3,797 3,983 3,717 3,492 3,283 3,093 2,923 2,795 2,669 2,522 2,384 2,294 2,209 2,1733.2 State Government 6,250 6,826 7,061 6,623 6,689 6,848 7,369 7,108 7,761 7,635 7,553 6,715 7,112 7,107 7,065 8,168 7,448 7,2493.3 Municipalities 3,573 4,085 2,955 3,570 4,161 4,457 4,640 4,386 4,158 4,786 4,393 4,254 4,391 4,315 4,295 3,664 3,760 3,500
4 Non-Profits 7,352 5,794 4,860 4,202 3,146 3,435 2,933 2,483 3,479 3,339 2,129 2,097 1,859 1,719 2,422 3,153 3,818 4,411Total 5,588 5,889 5,889 5,609 5,567 5,712 5,924 5,811 6,106 6,044 6,078 5,588 5,724 5,562 5,547 6,150 5,542 5,439
Source: Social Security Administration
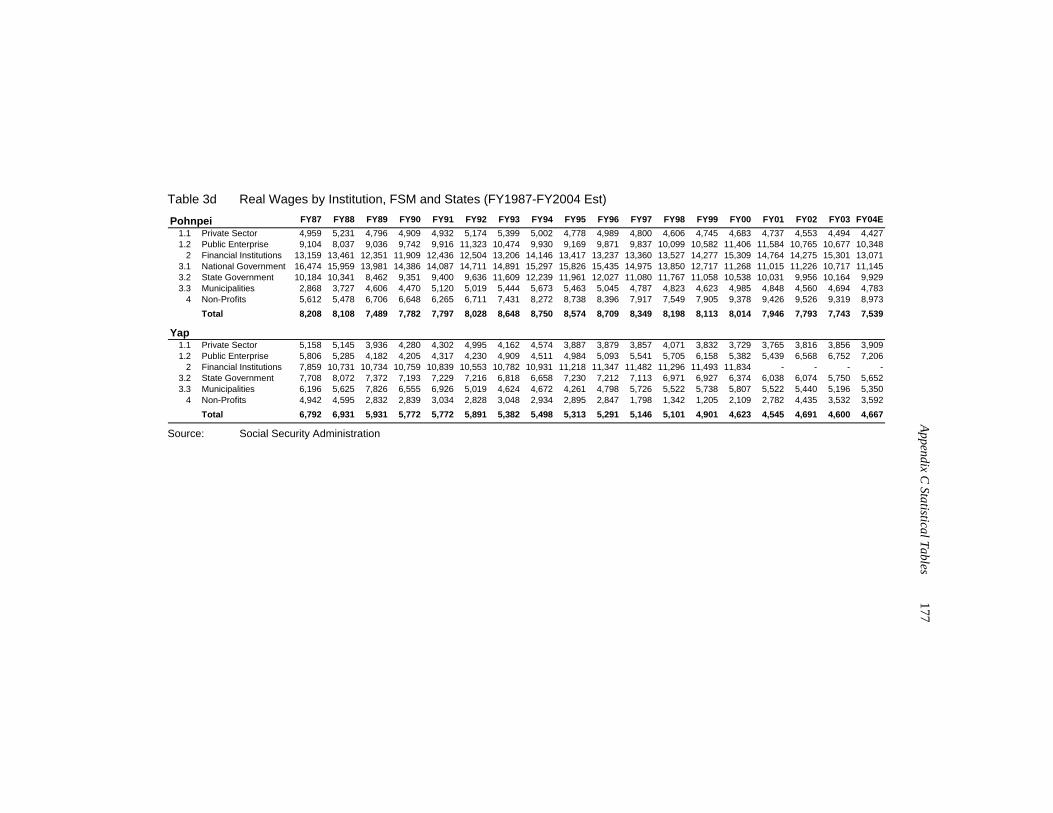
Appendix C
Statistical Tables 177
Table 3d Real Wages by Institution, FSM and States (FY1987-FY2004 Est)
Pohnpei FY87 FY88 FY89 FY90 FY91 FY92 FY93 FY94 FY95 FY96 FY97 FY98 FY99 FY00 FY01 FY02 FY03 FY04E1.1 Private Sector 4,959 5,231 4,796 4,909 4,932 5,174 5,399 5,002 4,778 4,989 4,800 4,606 4,745 4,683 4,737 4,553 4,494 4,4271.2 Public Enterprise 9,104 8,037 9,036 9,742 9,916 11,323 10,474 9,930 9,169 9,871 9,837 10,099 10,582 11,406 11,584 10,765 10,677 10,348
2 Financial Institutions 13,159 13,461 12,351 11,909 12,436 12,504 13,206 14,146 13,417 13,237 13,360 13,527 14,277 15,309 14,764 14,275 15,301 13,0713.1 National Government 16,474 15,959 13,981 14,386 14,087 14,711 14,891 15,297 15,826 15,435 14,975 13,850 12,717 11,268 11,015 11,226 10,717 11,1453.2 State Government 10,184 10,341 8,462 9,351 9,400 9,636 11,609 12,239 11,961 12,027 11,080 11,767 11,058 10,538 10,031 9,956 10,164 9,9293.3 Municipalities 2,868 3,727 4,606 4,470 5,120 5,019 5,444 5,673 5,463 5,045 4,787 4,823 4,623 4,985 4,848 4,560 4,694 4,783
4 Non-Profits 5,612 5,478 6,706 6,648 6,265 6,711 7,431 8,272 8,738 8,396 7,917 7,549 7,905 9,378 9,426 9,526 9,319 8,973Total 8,208 8,108 7,489 7,782 7,797 8,028 8,648 8,750 8,574 8,709 8,349 8,198 8,113 8,014 7,946 7,793 7,743 7,539
Yap1.1 Private Sector 5,158 5,145 3,936 4,280 4,302 4,995 4,162 4,574 3,887 3,879 3,857 4,071 3,832 3,729 3,765 3,816 3,856 3,9091.2 Public Enterprise 5,806 5,285 4,182 4,205 4,317 4,230 4,909 4,511 4,984 5,093 5,541 5,705 6,158 5,382 5,439 6,568 6,752 7,206
2 Financial Institutions 7,859 10,731 10,734 10,759 10,839 10,553 10,782 10,931 11,218 11,347 11,482 11,296 11,493 11,834 - - - -3.2 State Government 7,708 8,072 7,372 7,193 7,229 7,216 6,818 6,658 7,230 7,212 7,113 6,971 6,927 6,374 6,038 6,074 5,750 5,6523.3 Municipalities 6,196 5,625 7,826 6,555 6,926 5,019 4,624 4,672 4,261 4,798 5,726 5,522 5,738 5,807 5,522 5,440 5,196 5,350
4 Non-Profits 4,942 4,595 2,832 2,839 3,034 2,828 3,048 2,934 2,895 2,847 1,798 1,342 1,205 2,109 2,782 4,435 3,532 3,592Total 6,792 6,931 5,931 5,772 5,772 5,891 5,382 5,498 5,313 5,291 5,146 5,101 4,901 4,623 4,545 4,691 4,600 4,667
Source: Social Security Administration
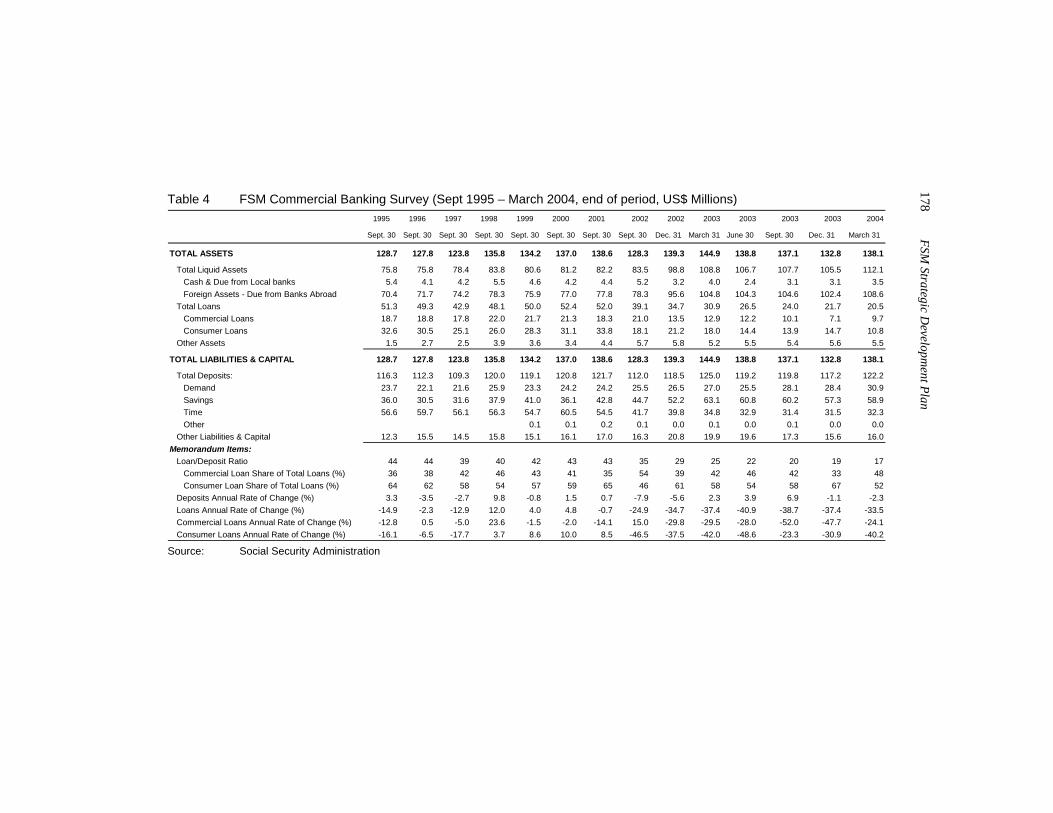
178 FSM
Strategic Developm
ent Plan
Table 4 FSM Commercial Banking Survey (Sept 1995 – March 2004, end of period, US$ Millions) 1995 1996 1997 1998 1999 2000 2001 2002 2002 2003 2003 2003 2003 2004
Sept. 30 Sept. 30 Sept. 30 Sept. 30 Sept. 30 Sept. 30 Sept. 30 Sept. 30 Dec. 31 March 31 June 30 Sept. 30 Dec. 31 March 31
TOTAL ASSETS 128.7 127.8 123.8 135.8 134.2 137.0 138.6 128.3 139.3 144.9 138.8 137.1 132.8 138.1
Total Liquid Assets 75.8 75.8 78.4 83.8 80.6 81.2 82.2 83.5 98.8 108.8 106.7 107.7 105.5 112.1Cash & Due from Local banks 5.4 4.1 4.2 5.5 4.6 4.2 4.4 5.2 3.2 4.0 2.4 3.1 3.1 3.5Foreign Assets - Due from Banks Abroad 70.4 71.7 74.2 78.3 75.9 77.0 77.8 78.3 95.6 104.8 104.3 104.6 102.4 108.6
Total Loans 51.3 49.3 42.9 48.1 50.0 52.4 52.0 39.1 34.7 30.9 26.5 24.0 21.7 20.5Commercial Loans 18.7 18.8 17.8 22.0 21.7 21.3 18.3 21.0 13.5 12.9 12.2 10.1 7.1 9.7Consumer Loans 32.6 30.5 25.1 26.0 28.3 31.1 33.8 18.1 21.2 18.0 14.4 13.9 14.7 10.8
Other Assets 1.5 2.7 2.5 3.9 3.6 3.4 4.4 5.7 5.8 5.2 5.5 5.4 5.6 5.5
TOTAL LIABILITIES & CAPITAL 128.7 127.8 123.8 135.8 134.2 137.0 138.6 128.3 139.3 144.9 138.8 137.1 132.8 138.1
Total Deposits: 116.3 112.3 109.3 120.0 119.1 120.8 121.7 112.0 118.5 125.0 119.2 119.8 117.2 122.2Demand 23.7 22.1 21.6 25.9 23.3 24.2 24.2 25.5 26.5 27.0 25.5 28.1 28.4 30.9Savings 36.0 30.5 31.6 37.9 41.0 36.1 42.8 44.7 52.2 63.1 60.8 60.2 57.3 58.9Time 56.6 59.7 56.1 56.3 54.7 60.5 54.5 41.7 39.8 34.8 32.9 31.4 31.5 32.3Other 0.1 0.1 0.2 0.1 0.0 0.1 0.0 0.1 0.0 0.0
Other Liabilities & Capital 12.3 15.5 14.5 15.8 15.1 16.1 17.0 16.3 20.8 19.9 19.6 17.3 15.6 16.0Memorandum Items:
Loan/Deposit Ratio 44 44 39 40 42 43 43 35 29 25 22 20 19 17Commercial Loan Share of Total Loans (%) 36 38 42 46 43 41 35 54 39 42 46 42 33 48Consumer Loan Share of Total Loans (%) 64 62 58 54 57 59 65 46 61 58 54 58 67 52
Deposits Annual Rate of Change (%) 3.3 -3.5 -2.7 9.8 -0.8 1.5 0.7 -7.9 -5.6 2.3 3.9 6.9 -1.1 -2.3Loans Annual Rate of Change (%) -14.9 -2.3 -12.9 12.0 4.0 4.8 -0.7 -24.9 -34.7 -37.4 -40.9 -38.7 -37.4 -33.5Commercial Loans Annual Rate of Change (%) -12.8 0.5 -5.0 23.6 -1.5 -2.0 -14.1 15.0 -29.8 -29.5 -28.0 -52.0 -47.7 -24.1Consumer Loans Annual Rate of Change (%) -16.1 -6.5 -17.7 3.7 8.6 10.0 8.5 -46.5 -37.5 -42.0 -48.6 -23.3 -30.9 -40.2
Source: Social Security Administration
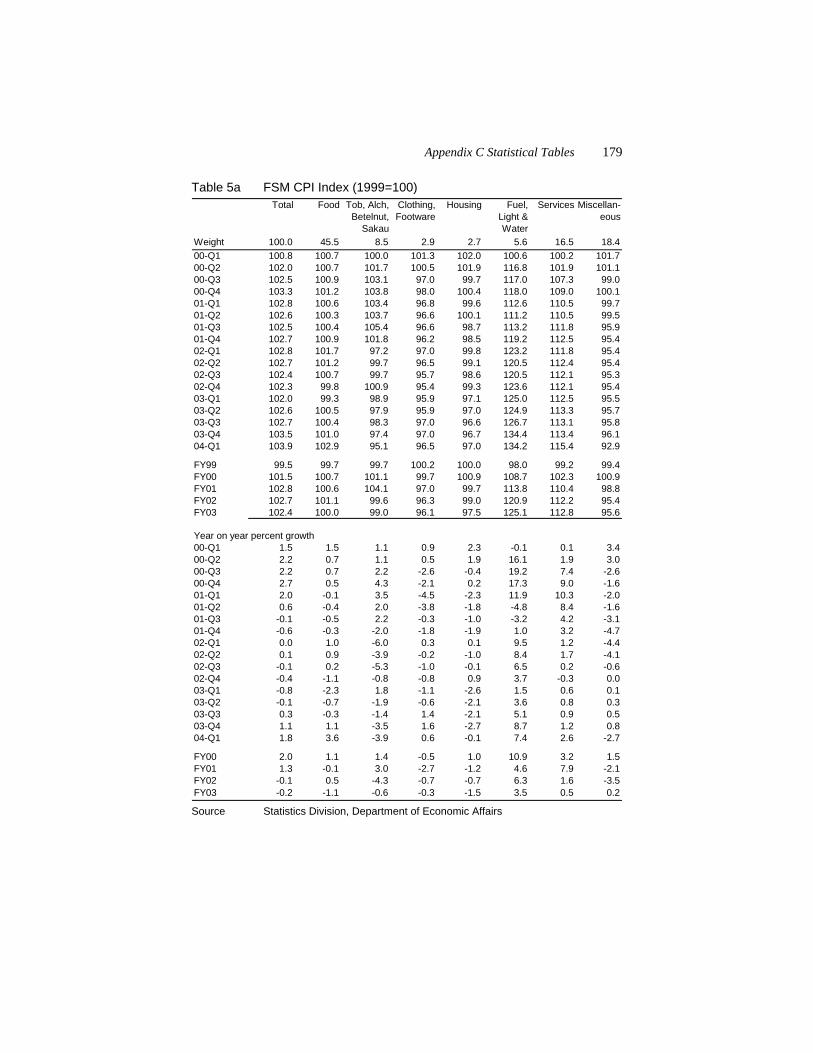
Appendix C Statistical Tables 179
Table 5a FSM CPI Index (1999=100) Total Food Tob, Alch,
Betelnut, Sakau
Clothing, Footware
Housing Fuel, Light & Water
Services Miscellan-eous
Weight 100.0 45.5 8.5 2.9 2.7 5.6 16.5 18.400-Q1 100.8 100.7 100.0 101.3 102.0 100.6 100.2 101.700-Q2 102.0 100.7 101.7 100.5 101.9 116.8 101.9 101.100-Q3 102.5 100.9 103.1 97.0 99.7 117.0 107.3 99.000-Q4 103.3 101.2 103.8 98.0 100.4 118.0 109.0 100.101-Q1 102.8 100.6 103.4 96.8 99.6 112.6 110.5 99.701-Q2 102.6 100.3 103.7 96.6 100.1 111.2 110.5 99.501-Q3 102.5 100.4 105.4 96.6 98.7 113.2 111.8 95.901-Q4 102.7 100.9 101.8 96.2 98.5 119.2 112.5 95.402-Q1 102.8 101.7 97.2 97.0 99.8 123.2 111.8 95.402-Q2 102.7 101.2 99.7 96.5 99.1 120.5 112.4 95.402-Q3 102.4 100.7 99.7 95.7 98.6 120.5 112.1 95.302-Q4 102.3 99.8 100.9 95.4 99.3 123.6 112.1 95.403-Q1 102.0 99.3 98.9 95.9 97.1 125.0 112.5 95.503-Q2 102.6 100.5 97.9 95.9 97.0 124.9 113.3 95.703-Q3 102.7 100.4 98.3 97.0 96.6 126.7 113.1 95.803-Q4 103.5 101.0 97.4 97.0 96.7 134.4 113.4 96.104-Q1 103.9 102.9 95.1 96.5 97.0 134.2 115.4 92.9
FY99 99.5 99.7 99.7 100.2 100.0 98.0 99.2 99.4FY00 101.5 100.7 101.1 99.7 100.9 108.7 102.3 100.9FY01 102.8 100.6 104.1 97.0 99.7 113.8 110.4 98.8FY02 102.7 101.1 99.6 96.3 99.0 120.9 112.2 95.4FY03 102.4 100.0 99.0 96.1 97.5 125.1 112.8 95.6
Year on year percent growth00-Q1 1.5 1.5 1.1 0.9 2.3 -0.1 0.1 3.400-Q2 2.2 0.7 1.1 0.5 1.9 16.1 1.9 3.000-Q3 2.2 0.7 2.2 -2.6 -0.4 19.2 7.4 -2.600-Q4 2.7 0.5 4.3 -2.1 0.2 17.3 9.0 -1.601-Q1 2.0 -0.1 3.5 -4.5 -2.3 11.9 10.3 -2.001-Q2 0.6 -0.4 2.0 -3.8 -1.8 -4.8 8.4 -1.601-Q3 -0.1 -0.5 2.2 -0.3 -1.0 -3.2 4.2 -3.101-Q4 -0.6 -0.3 -2.0 -1.8 -1.9 1.0 3.2 -4.702-Q1 0.0 1.0 -6.0 0.3 0.1 9.5 1.2 -4.402-Q2 0.1 0.9 -3.9 -0.2 -1.0 8.4 1.7 -4.102-Q3 -0.1 0.2 -5.3 -1.0 -0.1 6.5 0.2 -0.602-Q4 -0.4 -1.1 -0.8 -0.8 0.9 3.7 -0.3 0.003-Q1 -0.8 -2.3 1.8 -1.1 -2.6 1.5 0.6 0.103-Q2 -0.1 -0.7 -1.9 -0.6 -2.1 3.6 0.8 0.303-Q3 0.3 -0.3 -1.4 1.4 -2.1 5.1 0.9 0.503-Q4 1.1 1.1 -3.5 1.6 -2.7 8.7 1.2 0.804-Q1 1.8 3.6 -3.9 0.6 -0.1 7.4 2.6 -2.7
FY00 2.0 1.1 1.4 -0.5 1.0 10.9 3.2 1.5FY01 1.3 -0.1 3.0 -2.7 -1.2 4.6 7.9 -2.1FY02 -0.1 0.5 -4.3 -0.7 -0.7 6.3 1.6 -3.5FY03 -0.2 -1.1 -0.6 -0.3 -1.5 3.5 0.5 0.2 Source Statistics Division, Department of Economic Affairs
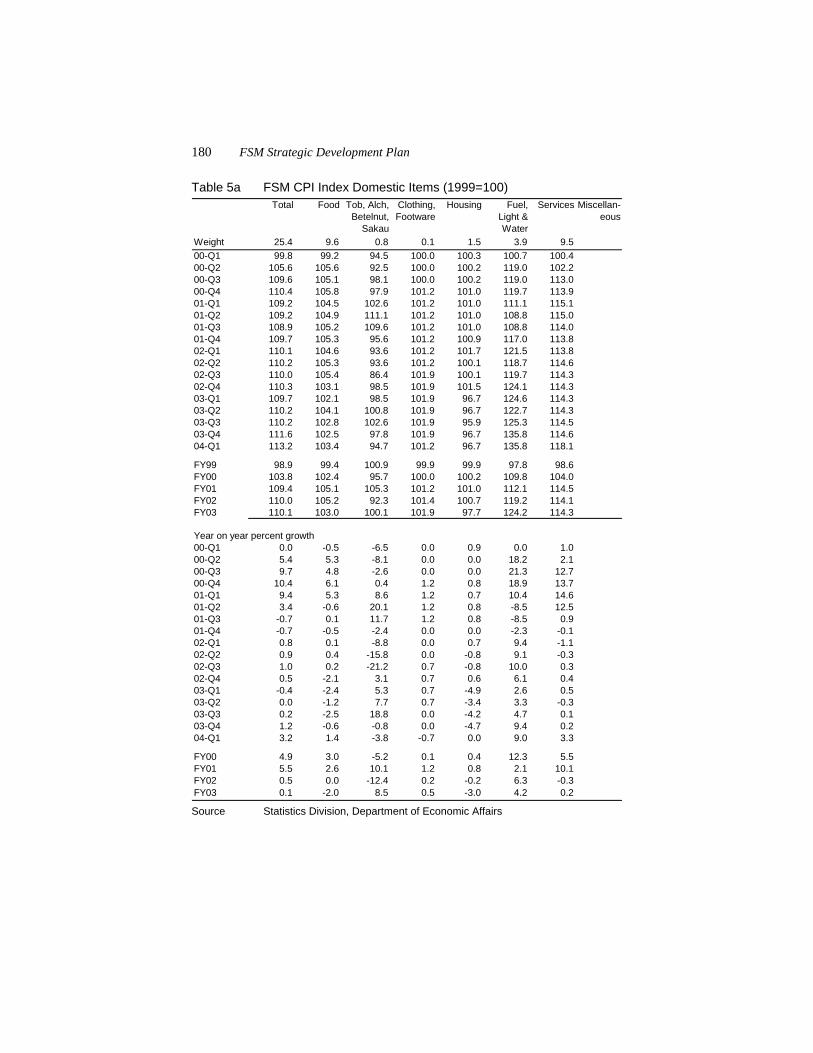
180 FSM Strategic Development Plan
Table 5a FSM CPI Index Domestic Items (1999=100) Total Food Tob, Alch,
Betelnut, Sakau
Clothing, Footware
Housing Fuel, Light & Water
Services Miscellan-eous
Weight 25.4 9.6 0.8 0.1 1.5 3.9 9.500-Q1 99.8 99.2 94.5 100.0 100.3 100.7 100.400-Q2 105.6 105.6 92.5 100.0 100.2 119.0 102.200-Q3 109.6 105.1 98.1 100.0 100.2 119.0 113.000-Q4 110.4 105.8 97.9 101.2 101.0 119.7 113.901-Q1 109.2 104.5 102.6 101.2 101.0 111.1 115.101-Q2 109.2 104.9 111.1 101.2 101.0 108.8 115.001-Q3 108.9 105.2 109.6 101.2 101.0 108.8 114.001-Q4 109.7 105.3 95.6 101.2 100.9 117.0 113.802-Q1 110.1 104.6 93.6 101.2 101.7 121.5 113.802-Q2 110.2 105.3 93.6 101.2 100.1 118.7 114.602-Q3 110.0 105.4 86.4 101.9 100.1 119.7 114.302-Q4 110.3 103.1 98.5 101.9 101.5 124.1 114.303-Q1 109.7 102.1 98.5 101.9 96.7 124.6 114.303-Q2 110.2 104.1 100.8 101.9 96.7 122.7 114.303-Q3 110.2 102.8 102.6 101.9 95.9 125.3 114.503-Q4 111.6 102.5 97.8 101.9 96.7 135.8 114.604-Q1 113.2 103.4 94.7 101.2 96.7 135.8 118.1
FY99 98.9 99.4 100.9 99.9 99.9 97.8 98.6FY00 103.8 102.4 95.7 100.0 100.2 109.8 104.0FY01 109.4 105.1 105.3 101.2 101.0 112.1 114.5FY02 110.0 105.2 92.3 101.4 100.7 119.2 114.1FY03 110.1 103.0 100.1 101.9 97.7 124.2 114.3
Year on year percent growth00-Q1 0.0 -0.5 -6.5 0.0 0.9 0.0 1.000-Q2 5.4 5.3 -8.1 0.0 0.0 18.2 2.100-Q3 9.7 4.8 -2.6 0.0 0.0 21.3 12.700-Q4 10.4 6.1 0.4 1.2 0.8 18.9 13.701-Q1 9.4 5.3 8.6 1.2 0.7 10.4 14.601-Q2 3.4 -0.6 20.1 1.2 0.8 -8.5 12.501-Q3 -0.7 0.1 11.7 1.2 0.8 -8.5 0.901-Q4 -0.7 -0.5 -2.4 0.0 0.0 -2.3 -0.102-Q1 0.8 0.1 -8.8 0.0 0.7 9.4 -1.102-Q2 0.9 0.4 -15.8 0.0 -0.8 9.1 -0.302-Q3 1.0 0.2 -21.2 0.7 -0.8 10.0 0.302-Q4 0.5 -2.1 3.1 0.7 0.6 6.1 0.403-Q1 -0.4 -2.4 5.3 0.7 -4.9 2.6 0.503-Q2 0.0 -1.2 7.7 0.7 -3.4 3.3 -0.303-Q3 0.2 -2.5 18.8 0.0 -4.2 4.7 0.103-Q4 1.2 -0.6 -0.8 0.0 -4.7 9.4 0.204-Q1 3.2 1.4 -3.8 -0.7 0.0 9.0 3.3
FY00 4.9 3.0 -5.2 0.1 0.4 12.3 5.5FY01 5.5 2.6 10.1 1.2 0.8 2.1 10.1FY02 0.5 0.0 -12.4 0.2 -0.2 6.3 -0.3FY03 0.1 -2.0 8.5 0.5 -3.0 4.2 0.2 Source Statistics Division, Department of Economic Affairs
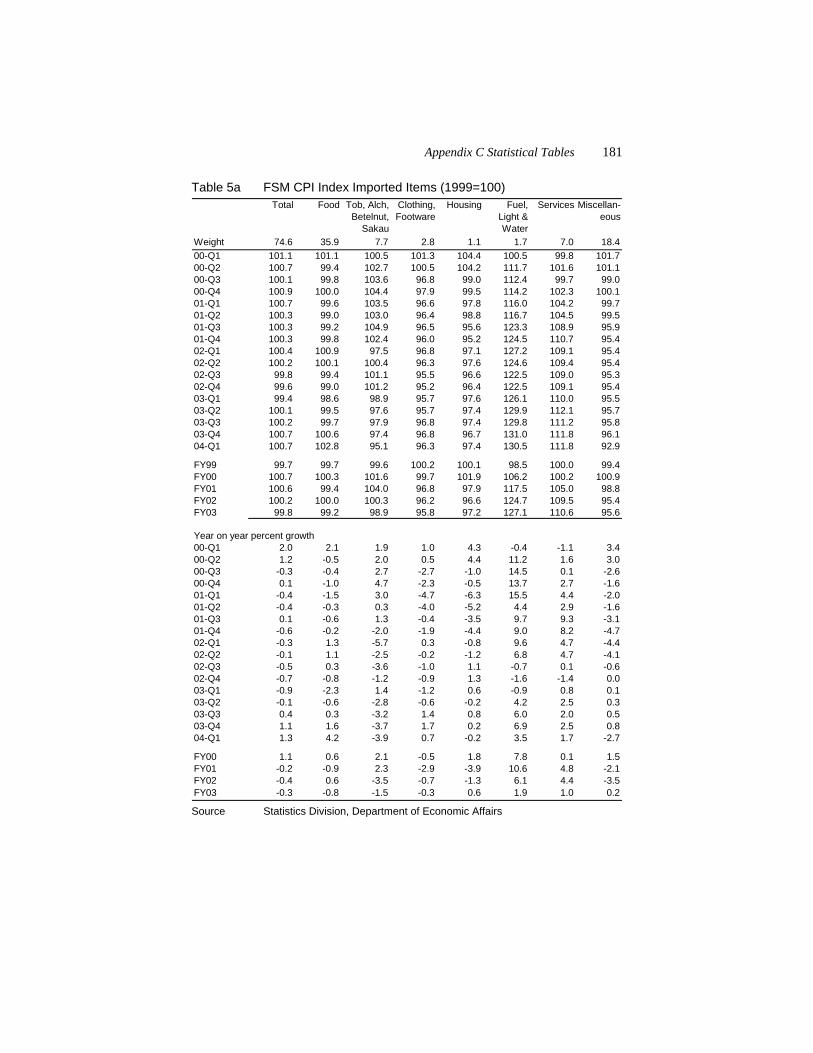
Appendix C Statistical Tables 181
Table 5a FSM CPI Index Imported Items (1999=100) Total Food Tob, Alch,
Betelnut, Sakau
Clothing, Footware
Housing Fuel, Light & Water
Services Miscellan-eous
Weight 74.6 35.9 7.7 2.8 1.1 1.7 7.0 18.400-Q1 101.1 101.1 100.5 101.3 104.4 100.5 99.8 101.700-Q2 100.7 99.4 102.7 100.5 104.2 111.7 101.6 101.100-Q3 100.1 99.8 103.6 96.8 99.0 112.4 99.7 99.000-Q4 100.9 100.0 104.4 97.9 99.5 114.2 102.3 100.101-Q1 100.7 99.6 103.5 96.6 97.8 116.0 104.2 99.701-Q2 100.3 99.0 103.0 96.4 98.8 116.7 104.5 99.501-Q3 100.3 99.2 104.9 96.5 95.6 123.3 108.9 95.901-Q4 100.3 99.8 102.4 96.0 95.2 124.5 110.7 95.402-Q1 100.4 100.9 97.5 96.8 97.1 127.2 109.1 95.402-Q2 100.2 100.1 100.4 96.3 97.6 124.6 109.4 95.402-Q3 99.8 99.4 101.1 95.5 96.6 122.5 109.0 95.302-Q4 99.6 99.0 101.2 95.2 96.4 122.5 109.1 95.403-Q1 99.4 98.6 98.9 95.7 97.6 126.1 110.0 95.503-Q2 100.1 99.5 97.6 95.7 97.4 129.9 112.1 95.703-Q3 100.2 99.7 97.9 96.8 97.4 129.8 111.2 95.803-Q4 100.7 100.6 97.4 96.8 96.7 131.0 111.8 96.104-Q1 100.7 102.8 95.1 96.3 97.4 130.5 111.8 92.9
FY99 99.7 99.7 99.6 100.2 100.1 98.5 100.0 99.4FY00 100.7 100.3 101.6 99.7 101.9 106.2 100.2 100.9FY01 100.6 99.4 104.0 96.8 97.9 117.5 105.0 98.8FY02 100.2 100.0 100.3 96.2 96.6 124.7 109.5 95.4FY03 99.8 99.2 98.9 95.8 97.2 127.1 110.6 95.6
Year on year percent growth00-Q1 2.0 2.1 1.9 1.0 4.3 -0.4 -1.1 3.400-Q2 1.2 -0.5 2.0 0.5 4.4 11.2 1.6 3.000-Q3 -0.3 -0.4 2.7 -2.7 -1.0 14.5 0.1 -2.600-Q4 0.1 -1.0 4.7 -2.3 -0.5 13.7 2.7 -1.601-Q1 -0.4 -1.5 3.0 -4.7 -6.3 15.5 4.4 -2.001-Q2 -0.4 -0.3 0.3 -4.0 -5.2 4.4 2.9 -1.601-Q3 0.1 -0.6 1.3 -0.4 -3.5 9.7 9.3 -3.101-Q4 -0.6 -0.2 -2.0 -1.9 -4.4 9.0 8.2 -4.702-Q1 -0.3 1.3 -5.7 0.3 -0.8 9.6 4.7 -4.402-Q2 -0.1 1.1 -2.5 -0.2 -1.2 6.8 4.7 -4.102-Q3 -0.5 0.3 -3.6 -1.0 1.1 -0.7 0.1 -0.602-Q4 -0.7 -0.8 -1.2 -0.9 1.3 -1.6 -1.4 0.003-Q1 -0.9 -2.3 1.4 -1.2 0.6 -0.9 0.8 0.103-Q2 -0.1 -0.6 -2.8 -0.6 -0.2 4.2 2.5 0.303-Q3 0.4 0.3 -3.2 1.4 0.8 6.0 2.0 0.503-Q4 1.1 1.6 -3.7 1.7 0.2 6.9 2.5 0.804-Q1 1.3 4.2 -3.9 0.7 -0.2 3.5 1.7 -2.7
FY00 1.1 0.6 2.1 -0.5 1.8 7.8 0.1 1.5FY01 -0.2 -0.9 2.3 -2.9 -3.9 10.6 4.8 -2.1FY02 -0.4 0.6 -3.5 -0.7 -1.3 6.1 4.4 -3.5FY03 -0.3 -0.8 -1.5 -0.3 0.6 1.9 1.0 0.2 Source Statistics Division, Department of Economic Affairs
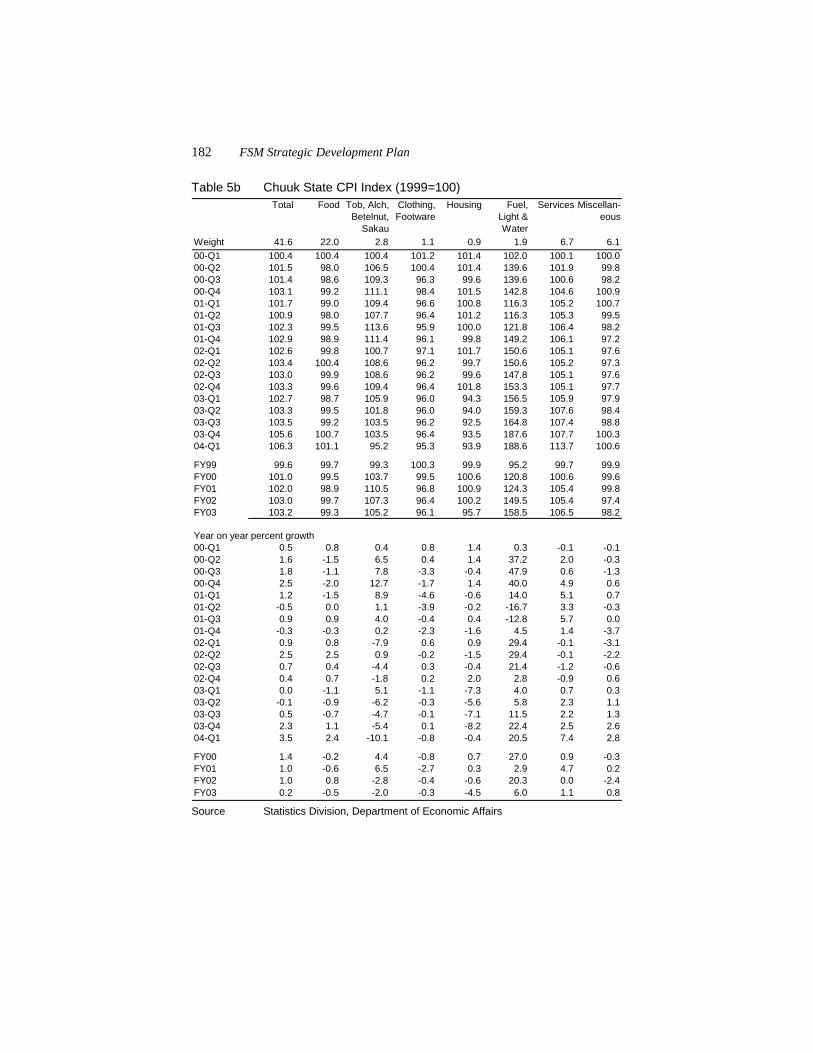
182 FSM Strategic Development Plan
Table 5b Chuuk State CPI Index (1999=100) Total Food Tob, Alch,
Betelnut, Sakau
Clothing, Footware
Housing Fuel, Light & Water
Services Miscellan-eous
Weight 41.6 22.0 2.8 1.1 0.9 1.9 6.7 6.100-Q1 100.4 100.4 100.4 101.2 101.4 102.0 100.1 100.000-Q2 101.5 98.0 106.5 100.4 101.4 139.6 101.9 99.800-Q3 101.4 98.6 109.3 96.3 99.6 139.6 100.6 98.200-Q4 103.1 99.2 111.1 98.4 101.5 142.8 104.6 100.901-Q1 101.7 99.0 109.4 96.6 100.8 116.3 105.2 100.701-Q2 100.9 98.0 107.7 96.4 101.2 116.3 105.3 99.501-Q3 102.3 99.5 113.6 95.9 100.0 121.8 106.4 98.201-Q4 102.9 98.9 111.4 96.1 99.8 149.2 106.1 97.202-Q1 102.6 99.8 100.7 97.1 101.7 150.6 105.1 97.602-Q2 103.4 100.4 108.6 96.2 99.7 150.6 105.2 97.302-Q3 103.0 99.9 108.6 96.2 99.6 147.8 105.1 97.602-Q4 103.3 99.6 109.4 96.4 101.8 153.3 105.1 97.703-Q1 102.7 98.7 105.9 96.0 94.3 156.5 105.9 97.903-Q2 103.3 99.5 101.8 96.0 94.0 159.3 107.6 98.403-Q3 103.5 99.2 103.5 96.2 92.5 164.8 107.4 98.803-Q4 105.6 100.7 103.5 96.4 93.5 187.6 107.7 100.304-Q1 106.3 101.1 95.2 95.3 93.9 188.6 113.7 100.6
FY99 99.6 99.7 99.3 100.3 99.9 95.2 99.7 99.9FY00 101.0 99.5 103.7 99.5 100.6 120.8 100.6 99.6FY01 102.0 98.9 110.5 96.8 100.9 124.3 105.4 99.8FY02 103.0 99.7 107.3 96.4 100.2 149.5 105.4 97.4FY03 103.2 99.3 105.2 96.1 95.7 158.5 106.5 98.2
Year on year percent growth00-Q1 0.5 0.8 0.4 0.8 1.4 0.3 -0.1 -0.100-Q2 1.6 -1.5 6.5 0.4 1.4 37.2 2.0 -0.300-Q3 1.8 -1.1 7.8 -3.3 -0.4 47.9 0.6 -1.300-Q4 2.5 -2.0 12.7 -1.7 1.4 40.0 4.9 0.601-Q1 1.2 -1.5 8.9 -4.6 -0.6 14.0 5.1 0.701-Q2 -0.5 0.0 1.1 -3.9 -0.2 -16.7 3.3 -0.301-Q3 0.9 0.9 4.0 -0.4 0.4 -12.8 5.7 0.001-Q4 -0.3 -0.3 0.2 -2.3 -1.6 4.5 1.4 -3.702-Q1 0.9 0.8 -7.9 0.6 0.9 29.4 -0.1 -3.102-Q2 2.5 2.5 0.9 -0.2 -1.5 29.4 -0.1 -2.202-Q3 0.7 0.4 -4.4 0.3 -0.4 21.4 -1.2 -0.602-Q4 0.4 0.7 -1.8 0.2 2.0 2.8 -0.9 0.603-Q1 0.0 -1.1 5.1 -1.1 -7.3 4.0 0.7 0.303-Q2 -0.1 -0.9 -6.2 -0.3 -5.6 5.8 2.3 1.103-Q3 0.5 -0.7 -4.7 -0.1 -7.1 11.5 2.2 1.303-Q4 2.3 1.1 -5.4 0.1 -8.2 22.4 2.5 2.604-Q1 3.5 2.4 -10.1 -0.8 -0.4 20.5 7.4 2.8
FY00 1.4 -0.2 4.4 -0.8 0.7 27.0 0.9 -0.3FY01 1.0 -0.6 6.5 -2.7 0.3 2.9 4.7 0.2FY02 1.0 0.8 -2.8 -0.4 -0.6 20.3 0.0 -2.4FY03 0.2 -0.5 -2.0 -0.3 -4.5 6.0 1.1 0.8 Source Statistics Division, Department of Economic Affairs
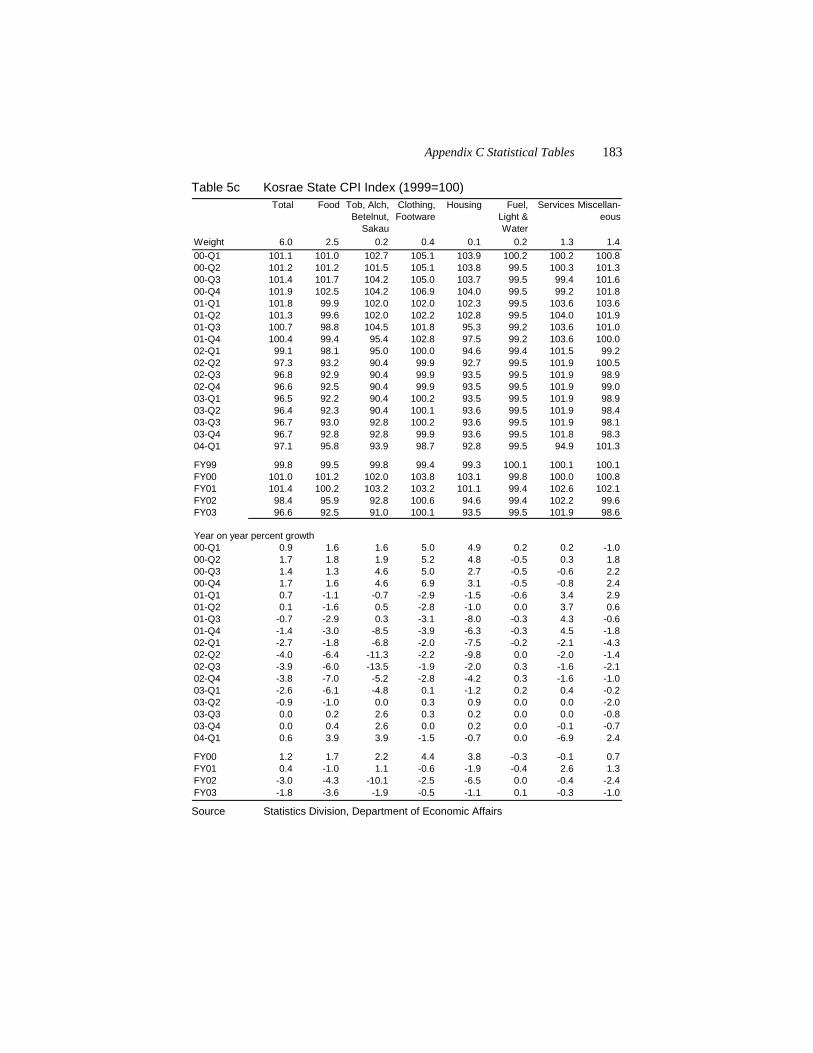
Appendix C Statistical Tables 183
Table 5c Kosrae State CPI Index (1999=100) Total Food Tob, Alch,
Betelnut, Sakau
Clothing, Footware
Housing Fuel, Light & Water
Services Miscellan-eous
Weight 6.0 2.5 0.2 0.4 0.1 0.2 1.3 1.400-Q1 101.1 101.0 102.7 105.1 103.9 100.2 100.2 100.800-Q2 101.2 101.2 101.5 105.1 103.8 99.5 100.3 101.300-Q3 101.4 101.7 104.2 105.0 103.7 99.5 99.4 101.600-Q4 101.9 102.5 104.2 106.9 104.0 99.5 99.2 101.801-Q1 101.8 99.9 102.0 102.0 102.3 99.5 103.6 103.601-Q2 101.3 99.6 102.0 102.2 102.8 99.5 104.0 101.901-Q3 100.7 98.8 104.5 101.8 95.3 99.2 103.6 101.001-Q4 100.4 99.4 95.4 102.8 97.5 99.2 103.6 100.002-Q1 99.1 98.1 95.0 100.0 94.6 99.4 101.5 99.202-Q2 97.3 93.2 90.4 99.9 92.7 99.5 101.9 100.502-Q3 96.8 92.9 90.4 99.9 93.5 99.5 101.9 98.902-Q4 96.6 92.5 90.4 99.9 93.5 99.5 101.9 99.003-Q1 96.5 92.2 90.4 100.2 93.5 99.5 101.9 98.903-Q2 96.4 92.3 90.4 100.1 93.6 99.5 101.9 98.403-Q3 96.7 93.0 92.8 100.2 93.6 99.5 101.9 98.103-Q4 96.7 92.8 92.8 99.9 93.6 99.5 101.8 98.304-Q1 97.1 95.8 93.9 98.7 92.8 99.5 94.9 101.3
FY99 99.8 99.5 99.8 99.4 99.3 100.1 100.1 100.1FY00 101.0 101.2 102.0 103.8 103.1 99.8 100.0 100.8FY01 101.4 100.2 103.2 103.2 101.1 99.4 102.6 102.1FY02 98.4 95.9 92.8 100.6 94.6 99.4 102.2 99.6FY03 96.6 92.5 91.0 100.1 93.5 99.5 101.9 98.6
Year on year percent growth00-Q1 0.9 1.6 1.6 5.0 4.9 0.2 0.2 -1.000-Q2 1.7 1.8 1.9 5.2 4.8 -0.5 0.3 1.800-Q3 1.4 1.3 4.6 5.0 2.7 -0.5 -0.6 2.200-Q4 1.7 1.6 4.6 6.9 3.1 -0.5 -0.8 2.401-Q1 0.7 -1.1 -0.7 -2.9 -1.5 -0.6 3.4 2.901-Q2 0.1 -1.6 0.5 -2.8 -1.0 0.0 3.7 0.601-Q3 -0.7 -2.9 0.3 -3.1 -8.0 -0.3 4.3 -0.601-Q4 -1.4 -3.0 -8.5 -3.9 -6.3 -0.3 4.5 -1.802-Q1 -2.7 -1.8 -6.8 -2.0 -7.5 -0.2 -2.1 -4.302-Q2 -4.0 -6.4 -11.3 -2.2 -9.8 0.0 -2.0 -1.402-Q3 -3.9 -6.0 -13.5 -1.9 -2.0 0.3 -1.6 -2.102-Q4 -3.8 -7.0 -5.2 -2.8 -4.2 0.3 -1.6 -1.003-Q1 -2.6 -6.1 -4.8 0.1 -1.2 0.2 0.4 -0.203-Q2 -0.9 -1.0 0.0 0.3 0.9 0.0 0.0 -2.003-Q3 0.0 0.2 2.6 0.3 0.2 0.0 0.0 -0.803-Q4 0.0 0.4 2.6 0.0 0.2 0.0 -0.1 -0.704-Q1 0.6 3.9 3.9 -1.5 -0.7 0.0 -6.9 2.4
FY00 1.2 1.7 2.2 4.4 3.8 -0.3 -0.1 0.7FY01 0.4 -1.0 1.1 -0.6 -1.9 -0.4 2.6 1.3FY02 -3.0 -4.3 -10.1 -2.5 -6.5 0.0 -0.4 -2.4FY03 -1.8 -3.6 -1.9 -0.5 -1.1 0.1 -0.3 -1.0 Source Statistics Division, Department of Economic Affairs
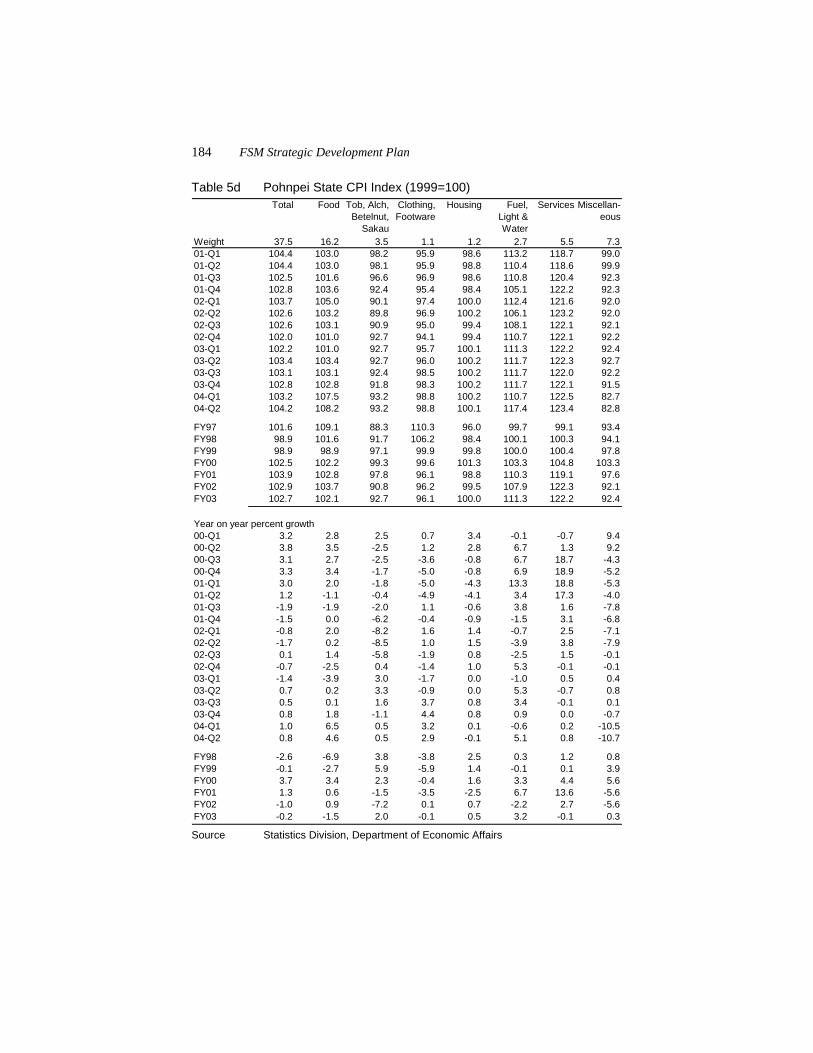
184 FSM Strategic Development Plan
Table 5d Pohnpei State CPI Index (1999=100) Total Food Tob, Alch,
Betelnut, Sakau
Clothing, Footware
Housing Fuel, Light & Water
Services Miscellan-eous
Weight 37.5 16.2 3.5 1.1 1.2 2.7 5.5 7.301-Q1 104.4 103.0 98.2 95.9 98.6 113.2 118.7 99.001-Q2 104.4 103.0 98.1 95.9 98.8 110.4 118.6 99.901-Q3 102.5 101.6 96.6 96.9 98.6 110.8 120.4 92.301-Q4 102.8 103.6 92.4 95.4 98.4 105.1 122.2 92.302-Q1 103.7 105.0 90.1 97.4 100.0 112.4 121.6 92.002-Q2 102.6 103.2 89.8 96.9 100.2 106.1 123.2 92.002-Q3 102.6 103.1 90.9 95.0 99.4 108.1 122.1 92.102-Q4 102.0 101.0 92.7 94.1 99.4 110.7 122.1 92.203-Q1 102.2 101.0 92.7 95.7 100.1 111.3 122.2 92.403-Q2 103.4 103.4 92.7 96.0 100.2 111.7 122.3 92.703-Q3 103.1 103.1 92.4 98.5 100.2 111.7 122.0 92.203-Q4 102.8 102.8 91.8 98.3 100.2 111.7 122.1 91.504-Q1 103.2 107.5 93.2 98.8 100.2 110.7 122.5 82.704-Q2 104.2 108.2 93.2 98.8 100.1 117.4 123.4 82.8
FY97 101.6 109.1 88.3 110.3 96.0 99.7 99.1 93.4FY98 98.9 101.6 91.7 106.2 98.4 100.1 100.3 94.1FY99 98.9 98.9 97.1 99.9 99.8 100.0 100.4 97.8FY00 102.5 102.2 99.3 99.6 101.3 103.3 104.8 103.3FY01 103.9 102.8 97.8 96.1 98.8 110.3 119.1 97.6FY02 102.9 103.7 90.8 96.2 99.5 107.9 122.3 92.1FY03 102.7 102.1 92.7 96.1 100.0 111.3 122.2 92.4
Year on year percent growth00-Q1 3.2 2.8 2.5 0.7 3.4 -0.1 -0.7 9.400-Q2 3.8 3.5 -2.5 1.2 2.8 6.7 1.3 9.200-Q3 3.1 2.7 -2.5 -3.6 -0.8 6.7 18.7 -4.300-Q4 3.3 3.4 -1.7 -5.0 -0.8 6.9 18.9 -5.201-Q1 3.0 2.0 -1.8 -5.0 -4.3 13.3 18.8 -5.301-Q2 1.2 -1.1 -0.4 -4.9 -4.1 3.4 17.3 -4.001-Q3 -1.9 -1.9 -2.0 1.1 -0.6 3.8 1.6 -7.801-Q4 -1.5 0.0 -6.2 -0.4 -0.9 -1.5 3.1 -6.802-Q1 -0.8 2.0 -8.2 1.6 1.4 -0.7 2.5 -7.102-Q2 -1.7 0.2 -8.5 1.0 1.5 -3.9 3.8 -7.902-Q3 0.1 1.4 -5.8 -1.9 0.8 -2.5 1.5 -0.102-Q4 -0.7 -2.5 0.4 -1.4 1.0 5.3 -0.1 -0.103-Q1 -1.4 -3.9 3.0 -1.7 0.0 -1.0 0.5 0.403-Q2 0.7 0.2 3.3 -0.9 0.0 5.3 -0.7 0.803-Q3 0.5 0.1 1.6 3.7 0.8 3.4 -0.1 0.103-Q4 0.8 1.8 -1.1 4.4 0.8 0.9 0.0 -0.704-Q1 1.0 6.5 0.5 3.2 0.1 -0.6 0.2 -10.504-Q2 0.8 4.6 0.5 2.9 -0.1 5.1 0.8 -10.7
FY98 -2.6 -6.9 3.8 -3.8 2.5 0.3 1.2 0.8FY99 -0.1 -2.7 5.9 -5.9 1.4 -0.1 0.1 3.9FY00 3.7 3.4 2.3 -0.4 1.6 3.3 4.4 5.6FY01 1.3 0.6 -1.5 -3.5 -2.5 6.7 13.6 -5.6FY02 -1.0 0.9 -7.2 0.1 0.7 -2.2 2.7 -5.6FY03 -0.2 -1.5 2.0 -0.1 0.5 3.2 -0.1 0.3 Source Statistics Division, Department of Economic Affairs
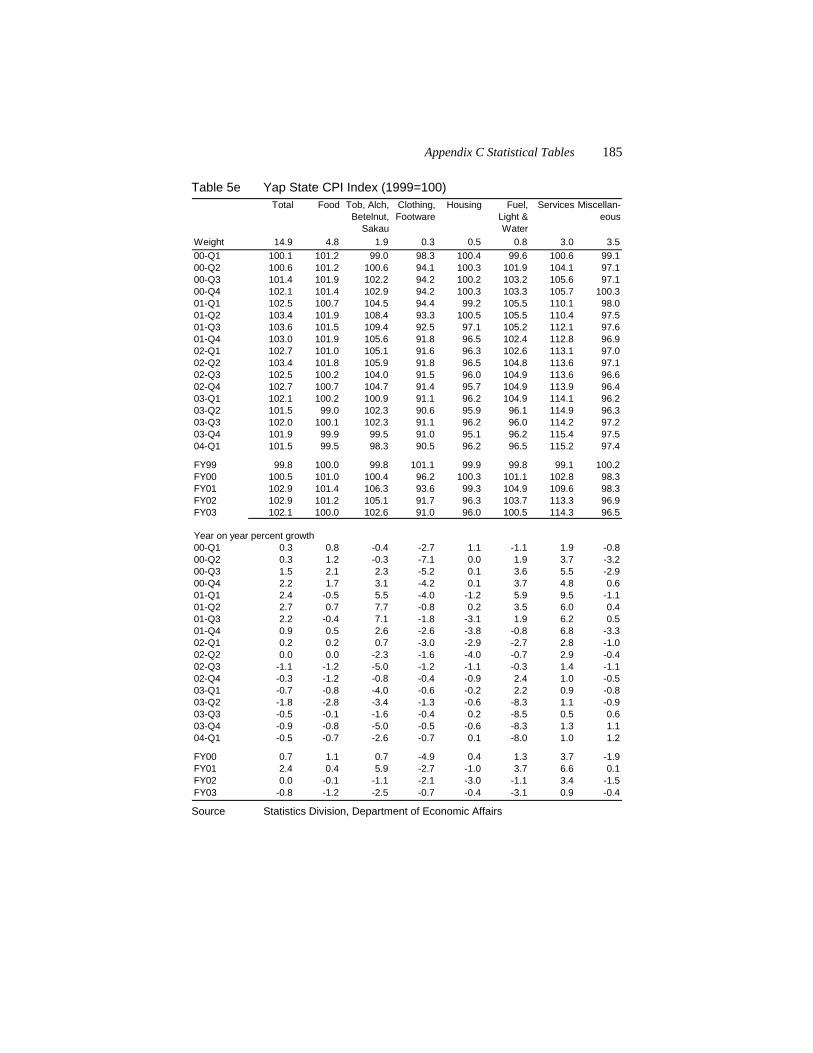
Appendix C Statistical Tables 185
Table 5e Yap State CPI Index (1999=100) Total Food Tob, Alch,
Betelnut, Sakau
Clothing, Footware
Housing Fuel, Light & Water
Services Miscellan-eous
Weight 14.9 4.8 1.9 0.3 0.5 0.8 3.0 3.500-Q1 100.1 101.2 99.0 98.3 100.4 99.6 100.6 99.100-Q2 100.6 101.2 100.6 94.1 100.3 101.9 104.1 97.100-Q3 101.4 101.9 102.2 94.2 100.2 103.2 105.6 97.100-Q4 102.1 101.4 102.9 94.2 100.3 103.3 105.7 100.301-Q1 102.5 100.7 104.5 94.4 99.2 105.5 110.1 98.001-Q2 103.4 101.9 108.4 93.3 100.5 105.5 110.4 97.501-Q3 103.6 101.5 109.4 92.5 97.1 105.2 112.1 97.601-Q4 103.0 101.9 105.6 91.8 96.5 102.4 112.8 96.902-Q1 102.7 101.0 105.1 91.6 96.3 102.6 113.1 97.002-Q2 103.4 101.8 105.9 91.8 96.5 104.8 113.6 97.102-Q3 102.5 100.2 104.0 91.5 96.0 104.9 113.6 96.602-Q4 102.7 100.7 104.7 91.4 95.7 104.9 113.9 96.403-Q1 102.1 100.2 100.9 91.1 96.2 104.9 114.1 96.203-Q2 101.5 99.0 102.3 90.6 95.9 96.1 114.9 96.303-Q3 102.0 100.1 102.3 91.1 96.2 96.0 114.2 97.203-Q4 101.9 99.9 99.5 91.0 95.1 96.2 115.4 97.504-Q1 101.5 99.5 98.3 90.5 96.2 96.5 115.2 97.4
FY99 99.8 100.0 99.8 101.1 99.9 99.8 99.1 100.2FY00 100.5 101.0 100.4 96.2 100.3 101.1 102.8 98.3FY01 102.9 101.4 106.3 93.6 99.3 104.9 109.6 98.3FY02 102.9 101.2 105.1 91.7 96.3 103.7 113.3 96.9FY03 102.1 100.0 102.6 91.0 96.0 100.5 114.3 96.5
Year on year percent growth00-Q1 0.3 0.8 -0.4 -2.7 1.1 -1.1 1.9 -0.800-Q2 0.3 1.2 -0.3 -7.1 0.0 1.9 3.7 -3.200-Q3 1.5 2.1 2.3 -5.2 0.1 3.6 5.5 -2.900-Q4 2.2 1.7 3.1 -4.2 0.1 3.7 4.8 0.601-Q1 2.4 -0.5 5.5 -4.0 -1.2 5.9 9.5 -1.101-Q2 2.7 0.7 7.7 -0.8 0.2 3.5 6.0 0.401-Q3 2.2 -0.4 7.1 -1.8 -3.1 1.9 6.2 0.501-Q4 0.9 0.5 2.6 -2.6 -3.8 -0.8 6.8 -3.302-Q1 0.2 0.2 0.7 -3.0 -2.9 -2.7 2.8 -1.002-Q2 0.0 0.0 -2.3 -1.6 -4.0 -0.7 2.9 -0.402-Q3 -1.1 -1.2 -5.0 -1.2 -1.1 -0.3 1.4 -1.102-Q4 -0.3 -1.2 -0.8 -0.4 -0.9 2.4 1.0 -0.503-Q1 -0.7 -0.8 -4.0 -0.6 -0.2 2.2 0.9 -0.803-Q2 -1.8 -2.8 -3.4 -1.3 -0.6 -8.3 1.1 -0.903-Q3 -0.5 -0.1 -1.6 -0.4 0.2 -8.5 0.5 0.603-Q4 -0.9 -0.8 -5.0 -0.5 -0.6 -8.3 1.3 1.104-Q1 -0.5 -0.7 -2.6 -0.7 0.1 -8.0 1.0 1.2
FY00 0.7 1.1 0.7 -4.9 0.4 1.3 3.7 -1.9FY01 2.4 0.4 5.9 -2.7 -1.0 3.7 6.6 0.1FY02 0.0 -0.1 -1.1 -2.1 -3.0 -1.1 3.4 -1.5FY03 -0.8 -1.2 -2.5 -0.7 -0.4 -3.1 0.9 -0.4 Source Statistics Division, Department of Economic Affairs
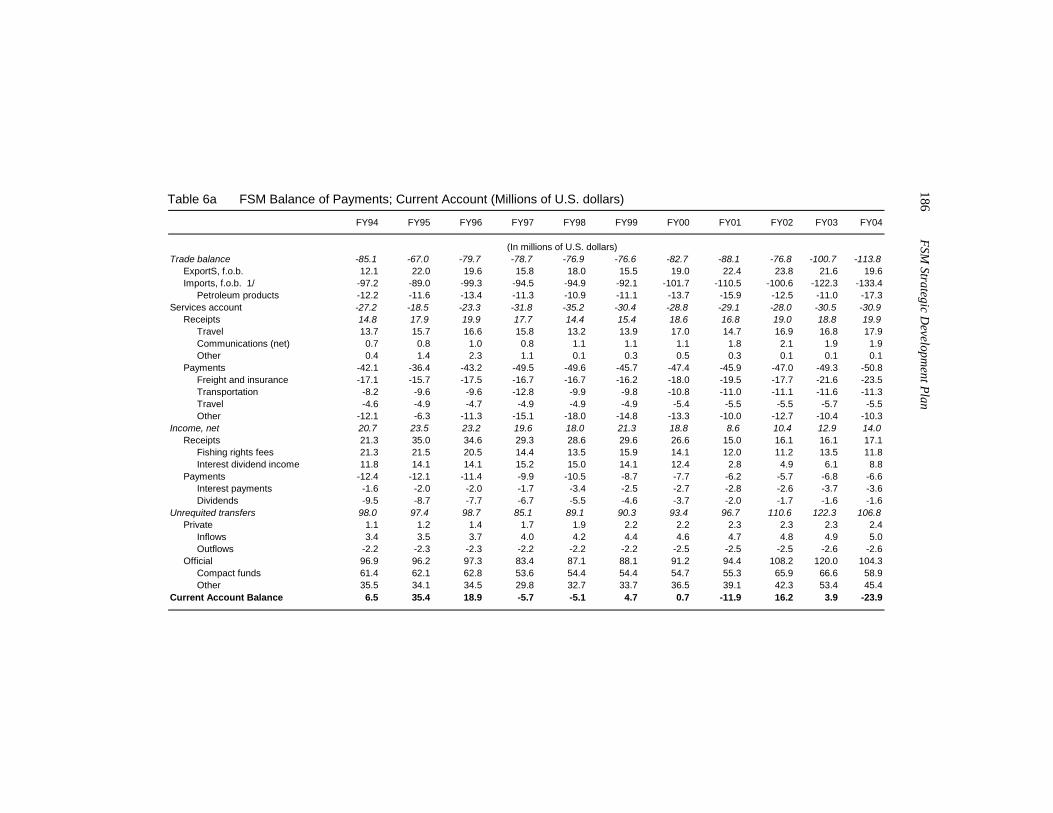
186 FSM
Strategic Developm
ent Plan
Table 6a FSM Balance of Payments; Current Account (Millions of U.S. dollars)
FY94 FY95 FY96 FY97 FY98 FY99 FY00 FY01 FY02 FY03 FY04
(In millions of U.S. dollars)Trade balance -85.1 -67.0 -79.7 -78.7 -76.9 -76.6 -82.7 -88.1 -76.8 -100.7 -113.8
ExportS, f.o.b. 12.1 22.0 19.6 15.8 18.0 15.5 19.0 22.4 23.8 21.6 19.6Imports, f.o.b. 1/ -97.2 -89.0 -99.3 -94.5 -94.9 -92.1 -101.7 -110.5 -100.6 -122.3 -133.4
Petroleum products -12.2 -11.6 -13.4 -11.3 -10.9 -11.1 -13.7 -15.9 -12.5 -11.0 -17.3Services account -27.2 -18.5 -23.3 -31.8 -35.2 -30.4 -28.8 -29.1 -28.0 -30.5 -30.9
Receipts 14.8 17.9 19.9 17.7 14.4 15.4 18.6 16.8 19.0 18.8 19.9Travel 13.7 15.7 16.6 15.8 13.2 13.9 17.0 14.7 16.9 16.8 17.9Communications (net) 0.7 0.8 1.0 0.8 1.1 1.1 1.1 1.8 2.1 1.9 1.9Other 0.4 1.4 2.3 1.1 0.1 0.3 0.5 0.3 0.1 0.1 0.1
Payments -42.1 -36.4 -43.2 -49.5 -49.6 -45.7 -47.4 -45.9 -47.0 -49.3 -50.8Freight and insurance -17.1 -15.7 -17.5 -16.7 -16.7 -16.2 -18.0 -19.5 -17.7 -21.6 -23.5Transportation -8.2 -9.6 -9.6 -12.8 -9.9 -9.8 -10.8 -11.0 -11.1 -11.6 -11.3Travel -4.6 -4.9 -4.7 -4.9 -4.9 -4.9 -5.4 -5.5 -5.5 -5.7 -5.5Other -12.1 -6.3 -11.3 -15.1 -18.0 -14.8 -13.3 -10.0 -12.7 -10.4 -10.3
Income, net 20.7 23.5 23.2 19.6 18.0 21.3 18.8 8.6 10.4 12.9 14.0Receipts 21.3 35.0 34.6 29.3 28.6 29.6 26.6 15.0 16.1 16.1 17.1
Fishing rights fees 21.3 21.5 20.5 14.4 13.5 15.9 14.1 12.0 11.2 13.5 11.8Interest dividend income 11.8 14.1 14.1 15.2 15.0 14.1 12.4 2.8 4.9 6.1 8.8
Payments -12.4 -12.1 -11.4 -9.9 -10.5 -8.7 -7.7 -6.2 -5.7 -6.8 -6.6Interest payments -1.6 -2.0 -2.0 -1.7 -3.4 -2.5 -2.7 -2.8 -2.6 -3.7 -3.6Dividends -9.5 -8.7 -7.7 -6.7 -5.5 -4.6 -3.7 -2.0 -1.7 -1.6 -1.6
Unrequited transfers 98.0 97.4 98.7 85.1 89.1 90.3 93.4 96.7 110.6 122.3 106.8Private 1.1 1.2 1.4 1.7 1.9 2.2 2.2 2.3 2.3 2.3 2.4
Inflows 3.4 3.5 3.7 4.0 4.2 4.4 4.6 4.7 4.8 4.9 5.0Outflows -2.2 -2.3 -2.3 -2.2 -2.2 -2.2 -2.5 -2.5 -2.5 -2.6 -2.6
Official 96.9 96.2 97.3 83.4 87.1 88.1 91.2 94.4 108.2 120.0 104.3Compact funds 61.4 62.1 62.8 53.6 54.4 54.4 54.7 55.3 65.9 66.6 58.9Other 35.5 34.1 34.5 29.8 32.7 33.7 36.5 39.1 42.3 53.4 45.4
Current Account Balance 6.5 35.4 18.9 -5.7 -5.1 4.7 0.7 -11.9 16.2 3.9 -23.9
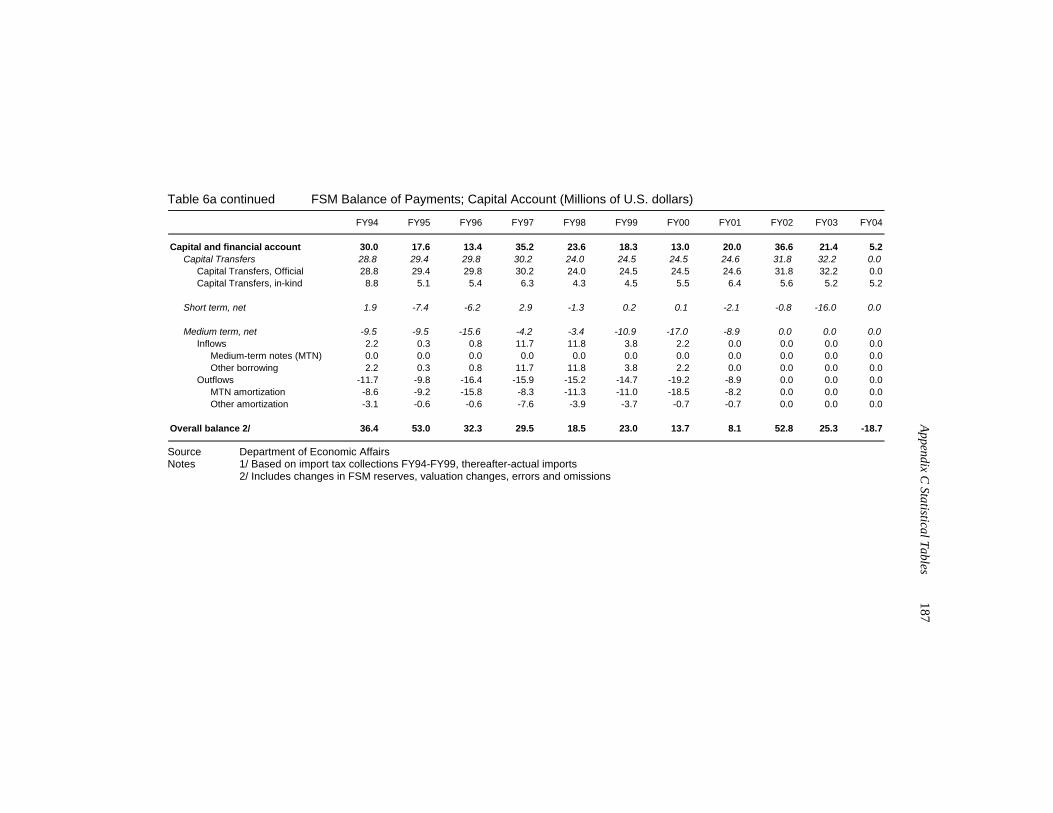
Appendix C
Statistical Tables 187
Table 6a continued FSM Balance of Payments; Capital Account (Millions of U.S. dollars)
FY94 FY95 FY96 FY97 FY98 FY99 FY00 FY01 FY02 FY03 FY04
Capital and financial account 30.0 17.6 13.4 35.2 23.6 18.3 13.0 20.0 36.6 21.4 5.2Capital Transfers 28.8 29.4 29.8 30.2 24.0 24.5 24.5 24.6 31.8 32.2 0.0
Capital Transfers, Official 28.8 29.4 29.8 30.2 24.0 24.5 24.5 24.6 31.8 32.2 0.0Capital Transfers, in-kind 8.8 5.1 5.4 6.3 4.3 4.5 5.5 6.4 5.6 5.2 5.2
Short term, net 1.9 -7.4 -6.2 2.9 -1.3 0.2 0.1 -2.1 -0.8 -16.0 0.0
Medium term, net -9.5 -9.5 -15.6 -4.2 -3.4 -10.9 -17.0 -8.9 0.0 0.0 0.0Inflows 2.2 0.3 0.8 11.7 11.8 3.8 2.2 0.0 0.0 0.0 0.0
Medium-term notes (MTN) 0.0 0.0 0.0 0.0 0.0 0.0 0.0 0.0 0.0 0.0 0.0Other borrowing 2.2 0.3 0.8 11.7 11.8 3.8 2.2 0.0 0.0 0.0 0.0
Outflows -11.7 -9.8 -16.4 -15.9 -15.2 -14.7 -19.2 -8.9 0.0 0.0 0.0MTN amortization -8.6 -9.2 -15.8 -8.3 -11.3 -11.0 -18.5 -8.2 0.0 0.0 0.0Other amortization -3.1 -0.6 -0.6 -7.6 -3.9 -3.7 -0.7 -0.7 0.0 0.0 0.0
Overall balance 2/ 36.4 53.0 32.3 29.5 18.5 23.0 13.7 8.1 52.8 25.3 -18.7
Source Department of Economic Affairs Notes 1/ Based on import tax collections FY94-FY99, thereafter-actual imports 2/ Includes changes in FSM reserves, valuation changes, errors and omissions
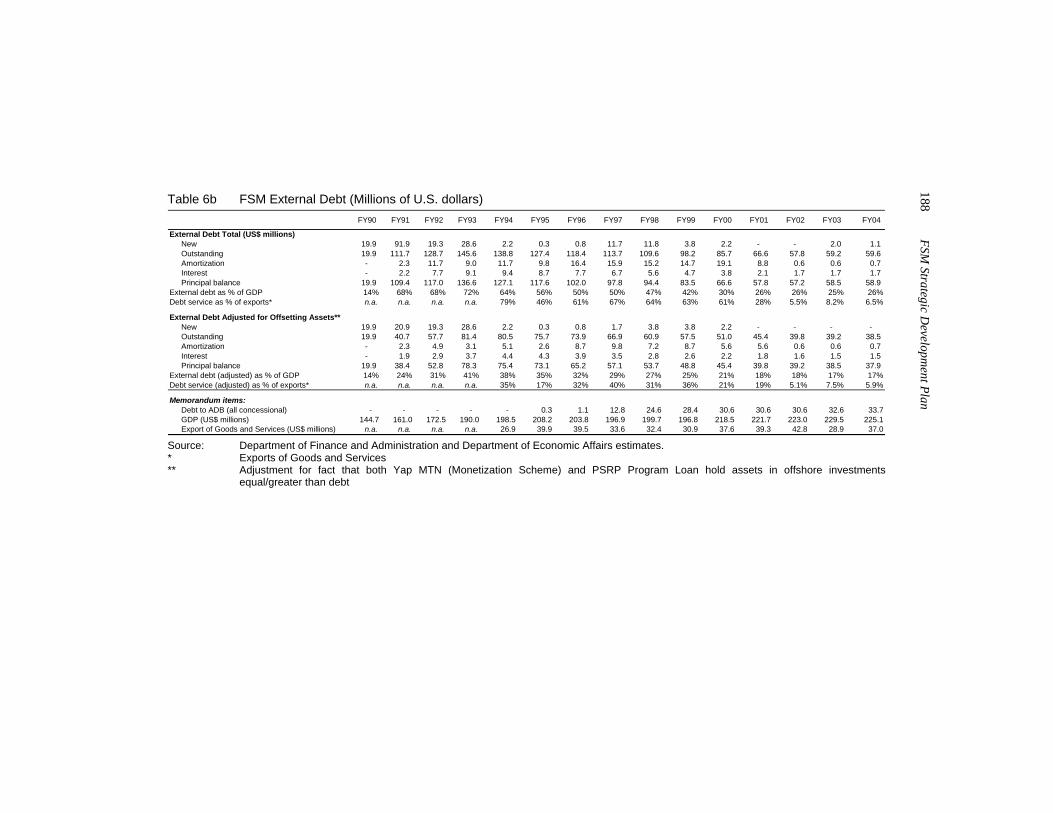
188 FSM
Strategic Developm
ent Plan
Table 6b FSM External Debt (Millions of U.S. dollars) FY90 FY91 FY92 FY93 FY94 FY95 FY96 FY97 FY98 FY99 FY00 FY01 FY02 FY03 FY04
External Debt Total (US$ millions)New 19.9 91.9 19.3 28.6 2.2 0.3 0.8 11.7 11.8 3.8 2.2 - - 2.0 1.1 Outstanding 19.9 111.7 128.7 145.6 138.8 127.4 118.4 113.7 109.6 98.2 85.7 66.6 57.8 59.2 59.6 Amortization - 2.3 11.7 9.0 11.7 9.8 16.4 15.9 15.2 14.7 19.1 8.8 0.6 0.6 0.7 Interest - 2.2 7.7 9.1 9.4 8.7 7.7 6.7 5.6 4.7 3.8 2.1 1.7 1.7 1.7 Principal balance 19.9 109.4 117.0 136.6 127.1 117.6 102.0 97.8 94.4 83.5 66.6 57.8 57.2 58.5 58.9
External debt as % of GDP 14% 68% 68% 72% 64% 56% 50% 50% 47% 42% 30% 26% 26% 25% 26%Debt service as % of exports* n.a. n.a. n.a. n.a. 79% 46% 61% 67% 64% 63% 61% 28% 5.5% 8.2% 6.5%
External Debt Adjusted for Offsetting Assets**New 19.9 20.9 19.3 28.6 2.2 0.3 0.8 1.7 3.8 3.8 2.2 - - - - Outstanding 19.9 40.7 57.7 81.4 80.5 75.7 73.9 66.9 60.9 57.5 51.0 45.4 39.8 39.2 38.5 Amortization - 2.3 4.9 3.1 5.1 2.6 8.7 9.8 7.2 8.7 5.6 5.6 0.6 0.6 0.7 Interest - 1.9 2.9 3.7 4.4 4.3 3.9 3.5 2.8 2.6 2.2 1.8 1.6 1.5 1.5 Principal balance 19.9 38.4 52.8 78.3 75.4 73.1 65.2 57.1 53.7 48.8 45.4 39.8 39.2 38.5 37.9
External debt (adjusted) as % of GDP 14% 24% 31% 41% 38% 35% 32% 29% 27% 25% 21% 18% 18% 17% 17%Debt service (adjusted) as % of exports* n.a. n.a. n.a. n.a. 35% 17% 32% 40% 31% 36% 21% 19% 5.1% 7.5% 5.9%
Memorandum items:Debt to ADB (all concessional) - - - - - 0.3 1.1 12.8 24.6 28.4 30.6 30.6 30.6 32.6 33.7GDP (US$ millions) 144.7 161.0 172.5 190.0 198.5 208.2 203.8 196.9 199.7 196.8 218.5 221.7 223.0 229.5 225.1Export of Goods and Services (US$ millions) n.a. n.a. n.a. n.a. 26.9 39.9 39.5 33.6 32.4 30.9 37.6 39.3 42.8 28.9 37.0
Source: Department of Finance and Administration and Department of Economic Affairs estimates. * Exports of Goods and Services ** Adjustment for fact that both Yap MTN (Monetization Scheme) and PSRP Program Loan hold assets in offshore investments
equal/greater than debt
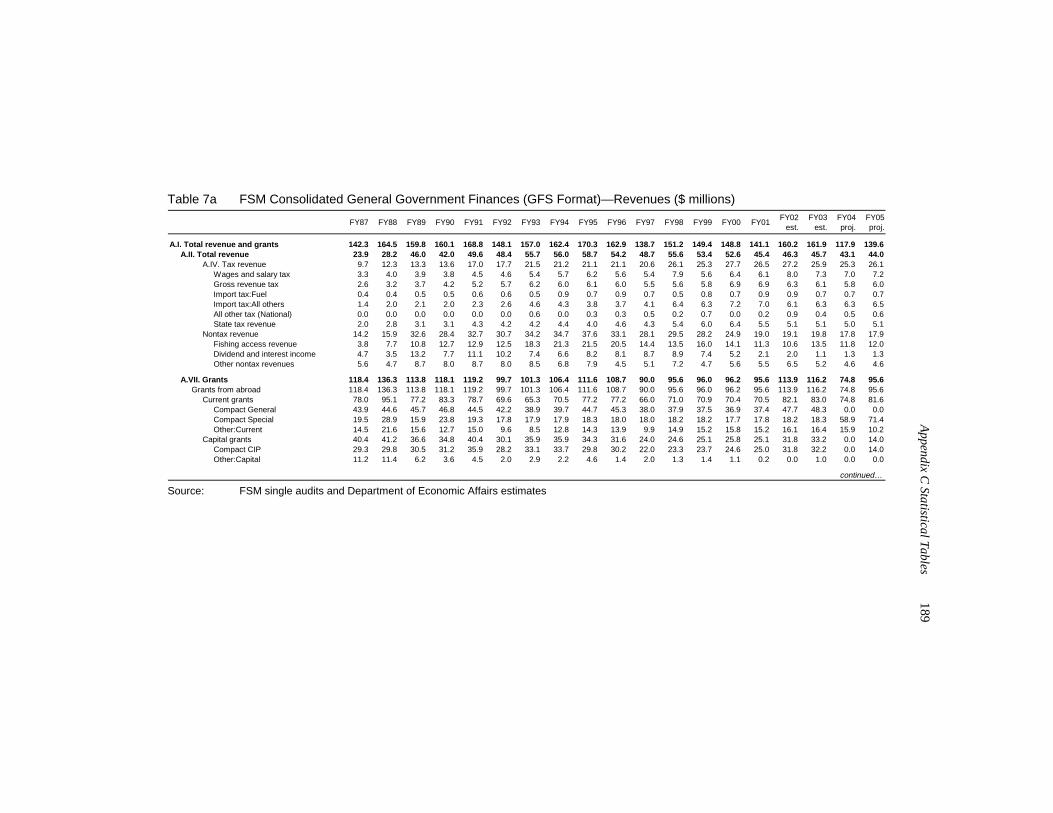
Appendix C
Statistical Tables 189
Table 7a FSM Consolidated General Government Finances (GFS Format)—Revenues ($ millions)
FY87 FY88 FY89 FY90 FY91 FY92 FY93 FY94 FY95 FY96 FY97 FY98 FY99 FY00 FY01 FY02est.
FY03est.
FY04proj.
FY05proj.
A.I. Total revenue and grants 142.3 164.5 159.8 160.1 168.8 148.1 157.0 162.4 170.3 162.9 138.7 151.2 149.4 148.8 141.1 160.2 161.9 117.9 139.6 A.II. Total revenue 23.9 28.2 46.0 42.0 49.6 48.4 55.7 56.0 58.7 54.2 48.7 55.6 53.4 52.6 45.4 46.3 45.7 43.1 44.0 A.IV. Tax revenue 9.7 12.3 13.3 13.6 17.0 17.7 21.5 21.2 21.1 21.1 20.6 26.1 25.3 27.7 26.5 27.2 25.9 25.3 26.1 Wages and salary tax 3.3 4.0 3.9 3.8 4.5 4.6 5.4 5.7 6.2 5.6 5.4 7.9 5.6 6.4 6.1 8.0 7.3 7.0 7.2 Gross revenue tax 2.6 3.2 3.7 4.2 5.2 5.7 6.2 6.0 6.1 6.0 5.5 5.6 5.8 6.9 6.9 6.3 6.1 5.8 6.0 Import tax:Fuel 0.4 0.4 0.5 0.5 0.6 0.6 0.5 0.9 0.7 0.9 0.7 0.5 0.8 0.7 0.9 0.9 0.7 0.7 0.7 Import tax:All others 1.4 2.0 2.1 2.0 2.3 2.6 4.6 4.3 3.8 3.7 4.1 6.4 6.3 7.2 7.0 6.1 6.3 6.3 6.5 All other tax (National) 0.0 0.0 0.0 0.0 0.0 0.0 0.6 0.0 0.3 0.3 0.5 0.2 0.7 0.0 0.2 0.9 0.4 0.5 0.6 State tax revenue 2.0 2.8 3.1 3.1 4.3 4.2 4.2 4.4 4.0 4.6 4.3 5.4 6.0 6.4 5.5 5.1 5.1 5.0 5.1 Nontax revenue 14.2 15.9 32.6 28.4 32.7 30.7 34.2 34.7 37.6 33.1 28.1 29.5 28.2 24.9 19.0 19.1 19.8 17.8 17.9 Fishing access revenue 3.8 7.7 10.8 12.7 12.9 12.5 18.3 21.3 21.5 20.5 14.4 13.5 16.0 14.1 11.3 10.6 13.5 11.8 12.0 Dividend and interest income 4.7 3.5 13.2 7.7 11.1 10.2 7.4 6.6 8.2 8.1 8.7 8.9 7.4 5.2 2.1 2.0 1.1 1.3 1.3 Other nontax revenues 5.6 4.7 8.7 8.0 8.7 8.0 8.5 6.8 7.9 4.5 5.1 7.2 4.7 5.6 5.5 6.5 5.2 4.6 4.6
A.VII. Grants 118.4 136.3 113.8 118.1 119.2 99.7 101.3 106.4 111.6 108.7 90.0 95.6 96.0 96.2 95.6 113.9 116.2 74.8 95.6 Grants from abroad 118.4 136.3 113.8 118.1 119.2 99.7 101.3 106.4 111.6 108.7 90.0 95.6 96.0 96.2 95.6 113.9 116.2 74.8 95.6 Current grants 78.0 95.1 77.2 83.3 78.7 69.6 65.3 70.5 77.2 77.2 66.0 71.0 70.9 70.4 70.5 82.1 83.0 74.8 81.6 Compact General 43.9 44.6 45.7 46.8 44.5 42.2 38.9 39.7 44.7 45.3 38.0 37.9 37.5 36.9 37.4 47.7 48.3 0.0 0.0 Compact Special 19.5 28.9 15.9 23.8 19.3 17.8 17.9 17.9 18.3 18.0 18.0 18.2 18.2 17.7 17.8 18.2 18.3 58.9 71.4 Other:Current 14.5 21.6 15.6 12.7 15.0 9.6 8.5 12.8 14.3 13.9 9.9 14.9 15.2 15.8 15.2 16.1 16.4 15.9 10.2 Capital grants 40.4 41.2 36.6 34.8 40.4 30.1 35.9 35.9 34.3 31.6 24.0 24.6 25.1 25.8 25.1 31.8 33.2 0.0 14.0 Compact CIP 29.3 29.8 30.5 31.2 35.9 28.2 33.1 33.7 29.8 30.2 22.0 23.3 23.7 24.6 25.0 31.8 32.2 0.0 14.0 Other:Capital 11.2 11.4 6.2 3.6 4.5 2.0 2.9 2.2 4.6 1.4 2.0 1.3 1.4 1.1 0.2 0.0 1.0 0.0 0.0
continued…
Source: FSM single audits and Department of Economic Affairs estimates
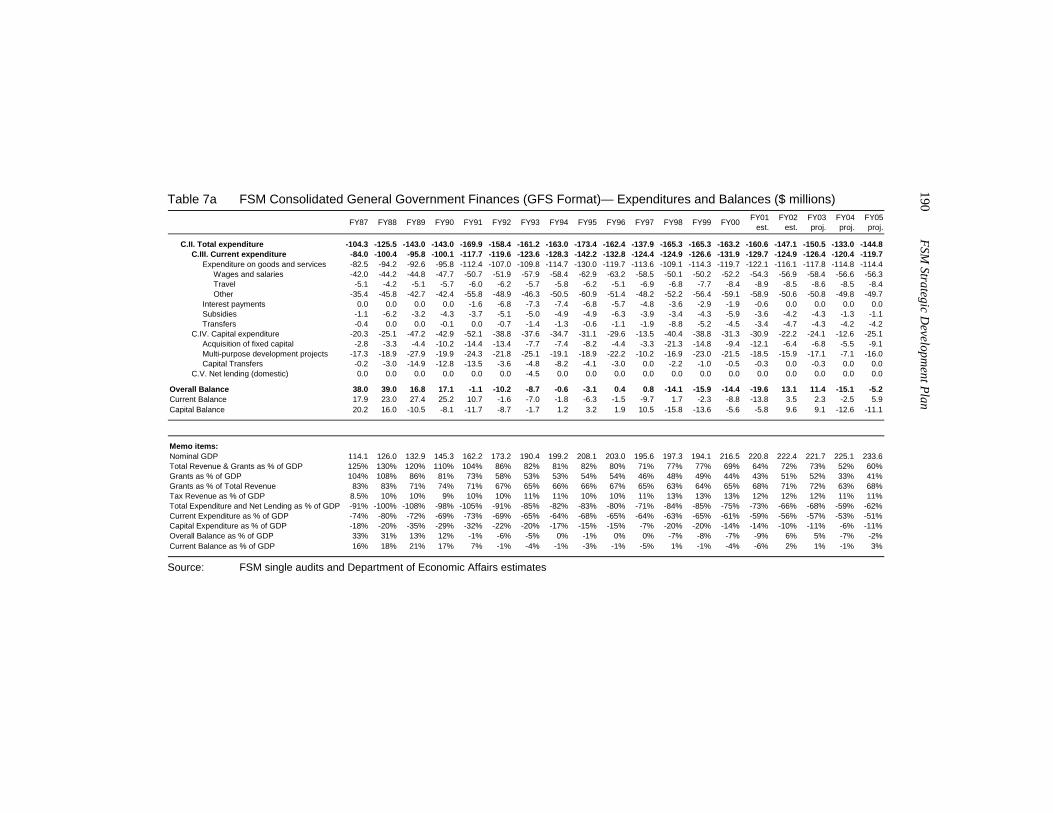
190 FSM
Strategic Developm
ent Plan
Table 7a FSM Consolidated General Government Finances (GFS Format)— Expenditures and Balances ($ millions)
FY87 FY88 FY89 FY90 FY91 FY92 FY93 FY94 FY95 FY96 FY97 FY98 FY99 FY00 FY01est.
FY02est.
FY03proj.
FY04proj.
FY05proj.
C.II. Total expenditure -104.3 -125.5 -143.0 -143.0 -169.9 -158.4 -161.2 -163.0 -173.4 -162.4 -137.9 -165.3 -165.3 -163.2 -160.6 -147.1 -150.5 -133.0 -144.8 C.III. Current expenditure -84.0 -100.4 -95.8 -100.1 -117.7 -119.6 -123.6 -128.3 -142.2 -132.8 -124.4 -124.9 -126.6 -131.9 -129.7 -124.9 -126.4 -120.4 -119.7 Expenditure on goods and services -82.5 -94.2 -92.6 -95.8 -112.4 -107.0 -109.8 -114.7 -130.0 -119.7 -113.6 -109.1 -114.3 -119.7 -122.1 -116.1 -117.8 -114.8 -114.4 Wages and salaries -42.0 -44.2 -44.8 -47.7 -50.7 -51.9 -57.9 -58.4 -62.9 -63.2 -58.5 -50.1 -50.2 -52.2 -54.3 -56.9 -58.4 -56.6 -56.3 Travel -5.1 -4.2 -5.1 -5.7 -6.0 -6.2 -5.7 -5.8 -6.2 -5.1 -6.9 -6.8 -7.7 -8.4 -8.9 -8.5 -8.6 -8.5 -8.4 Other -35.4 -45.8 -42.7 -42.4 -55.8 -48.9 -46.3 -50.5 -60.9 -51.4 -48.2 -52.2 -56.4 -59.1 -58.9 -50.6 -50.8 -49.8 -49.7 Interest payments 0.0 0.0 0.0 0.0 -1.6 -6.8 -7.3 -7.4 -6.8 -5.7 -4.8 -3.6 -2.9 -1.9 -0.6 0.0 0.0 0.0 0.0 Subsidies -1.1 -6.2 -3.2 -4.3 -3.7 -5.1 -5.0 -4.9 -4.9 -6.3 -3.9 -3.4 -4.3 -5.9 -3.6 -4.2 -4.3 -1.3 -1.1 Transfers -0.4 0.0 0.0 -0.1 0.0 -0.7 -1.4 -1.3 -0.6 -1.1 -1.9 -8.8 -5.2 -4.5 -3.4 -4.7 -4.3 -4.2 -4.2 C.IV. Capital expenditure -20.3 -25.1 -47.2 -42.9 -52.1 -38.8 -37.6 -34.7 -31.1 -29.6 -13.5 -40.4 -38.8 -31.3 -30.9 -22.2 -24.1 -12.6 -25.1 Acquisition of fixed capital -2.8 -3.3 -4.4 -10.2 -14.4 -13.4 -7.7 -7.4 -8.2 -4.4 -3.3 -21.3 -14.8 -9.4 -12.1 -6.4 -6.8 -5.5 -9.1 Multi-purpose development projects -17.3 -18.9 -27.9 -19.9 -24.3 -21.8 -25.1 -19.1 -18.9 -22.2 -10.2 -16.9 -23.0 -21.5 -18.5 -15.9 -17.1 -7.1 -16.0 Capital Transfers -0.2 -3.0 -14.9 -12.8 -13.5 -3.6 -4.8 -8.2 -4.1 -3.0 0.0 -2.2 -1.0 -0.5 -0.3 0.0 -0.3 0.0 0.0 C.V. Net lending (domestic) 0.0 0.0 0.0 0.0 0.0 0.0 -4.5 0.0 0.0 0.0 0.0 0.0 0.0 0.0 0.0 0.0 0.0 0.0 0.0
Overall Balance 38.0 39.0 16.8 17.1 -1.1 -10.2 -8.7 -0.6 -3.1 0.4 0.8 -14.1 -15.9 -14.4 -19.6 13.1 11.4 -15.1 -5.2Current Balance 17.9 23.0 27.4 25.2 10.7 -1.6 -7.0 -1.8 -6.3 -1.5 -9.7 1.7 -2.3 -8.8 -13.8 3.5 2.3 -2.5 5.9Capital Balance 20.2 16.0 -10.5 -8.1 -11.7 -8.7 -1.7 1.2 3.2 1.9 10.5 -15.8 -13.6 -5.6 -5.8 9.6 9.1 -12.6 -11.1
Memo items:Nominal GDP 114.1 126.0 132.9 145.3 162.2 173.2 190.4 199.2 208.1 203.0 195.6 197.3 194.1 216.5 220.8 222.4 221.7 225.1 233.6Total Revenue & Grants as % of GDP 125% 130% 120% 110% 104% 86% 82% 81% 82% 80% 71% 77% 77% 69% 64% 72% 73% 52% 60%Grants as % of GDP 104% 108% 86% 81% 73% 58% 53% 53% 54% 54% 46% 48% 49% 44% 43% 51% 52% 33% 41%Grants as % of Total Revenue 83% 83% 71% 74% 71% 67% 65% 66% 66% 67% 65% 63% 64% 65% 68% 71% 72% 63% 68%Tax Revenue as % of GDP 8.5% 10% 10% 9% 10% 10% 11% 11% 10% 10% 11% 13% 13% 13% 12% 12% 12% 11% 11%Total Expenditure and Net Lending as % of GDP -91% -100% -108% -98% -105% -91% -85% -82% -83% -80% -71% -84% -85% -75% -73% -66% -68% -59% -62%Current Expenditure as % of GDP -74% -80% -72% -69% -73% -69% -65% -64% -68% -65% -64% -63% -65% -61% -59% -56% -57% -53% -51%Capital Expenditure as % of GDP -18% -20% -35% -29% -32% -22% -20% -17% -15% -15% -7% -20% -20% -14% -14% -10% -11% -6% -11%Overall Balance as % of GDP 33% 31% 13% 12% -1% -6% -5% 0% -1% 0% 0% -7% -8% -7% -9% 6% 5% -7% -2%Current Balance as % of GDP 16% 18% 21% 17% 7% -1% -4% -1% -3% -1% -5% 1% -1% -4% -6% 2% 1% -1% 3%
Source: FSM single audits and Department of Economic Affairs estimates
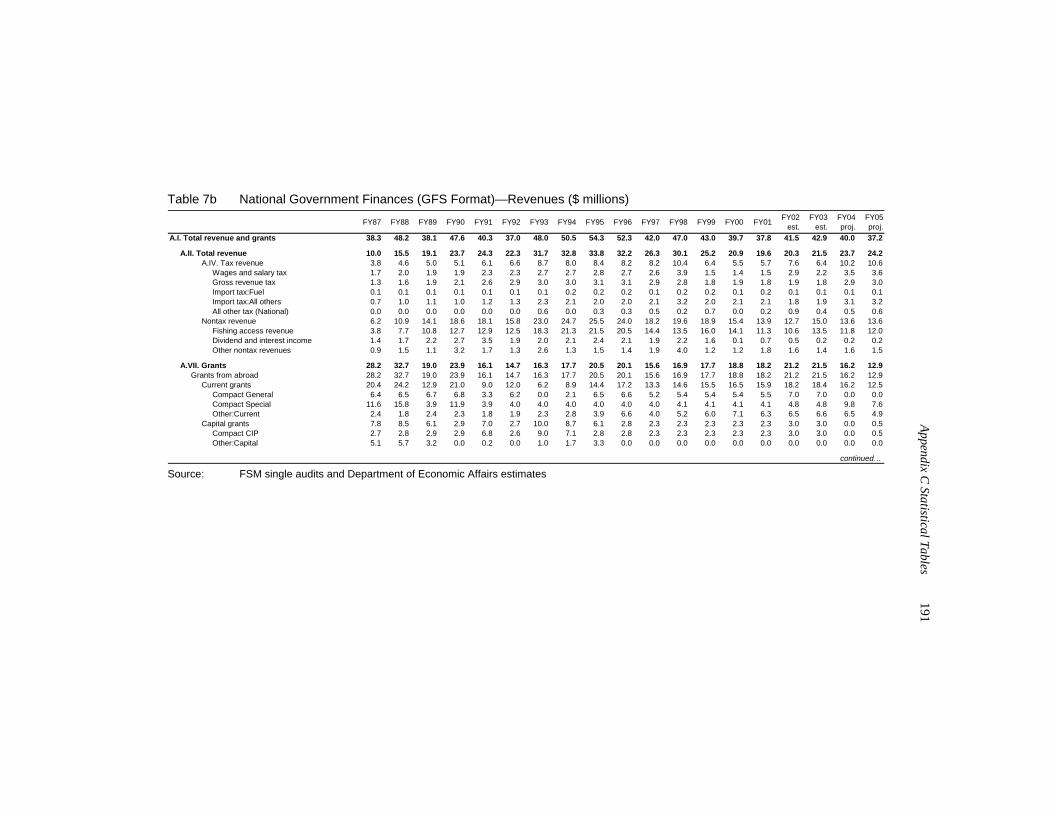
Appendix C
Statistical Tables 191
Table 7b National Government Finances (GFS Format)—Revenues ($ millions)
FY87 FY88 FY89 FY90 FY91 FY92 FY93 FY94 FY95 FY96 FY97 FY98 FY99 FY00 FY01 FY02est.
FY03est.
FY04proj.
FY05proj.
A.I. Total revenue and grants 38.3 48.2 38.1 47.6 40.3 37.0 48.0 50.5 54.3 52.3 42.0 47.0 43.0 39.7 37.8 41.5 42.9 40.0 37.2
A.II. Total revenue 10.0 15.5 19.1 23.7 24.3 22.3 31.7 32.8 33.8 32.2 26.3 30.1 25.2 20.9 19.6 20.3 21.5 23.7 24.2 A.IV. Tax revenue 3.8 4.6 5.0 5.1 6.1 6.6 8.7 8.0 8.4 8.2 8.2 10.4 6.4 5.5 5.7 7.6 6.4 10.2 10.6 Wages and salary tax 1.7 2.0 1.9 1.9 2.3 2.3 2.7 2.7 2.8 2.7 2.6 3.9 1.5 1.4 1.5 2.9 2.2 3.5 3.6 Gross revenue tax 1.3 1.6 1.9 2.1 2.6 2.9 3.0 3.0 3.1 3.1 2.9 2.8 1.8 1.9 1.8 1.9 1.8 2.9 3.0 Import tax:Fuel 0.1 0.1 0.1 0.1 0.1 0.1 0.1 0.2 0.2 0.2 0.1 0.2 0.2 0.1 0.2 0.1 0.1 0.1 0.1 Import tax:All others 0.7 1.0 1.1 1.0 1.2 1.3 2.3 2.1 2.0 2.0 2.1 3.2 2.0 2.1 2.1 1.8 1.9 3.1 3.2 All other tax (National) 0.0 0.0 0.0 0.0 0.0 0.0 0.6 0.0 0.3 0.3 0.5 0.2 0.7 0.0 0.2 0.9 0.4 0.5 0.6 Nontax revenue 6.2 10.9 14.1 18.6 18.1 15.8 23.0 24.7 25.5 24.0 18.2 19.6 18.9 15.4 13.9 12.7 15.0 13.6 13.6 Fishing access revenue 3.8 7.7 10.8 12.7 12.9 12.5 18.3 21.3 21.5 20.5 14.4 13.5 16.0 14.1 11.3 10.6 13.5 11.8 12.0 Dividend and interest income 1.4 1.7 2.2 2.7 3.5 1.9 2.0 2.1 2.4 2.1 1.9 2.2 1.6 0.1 0.7 0.5 0.2 0.2 0.2 Other nontax revenues 0.9 1.5 1.1 3.2 1.7 1.3 2.6 1.3 1.5 1.4 1.9 4.0 1.2 1.2 1.8 1.6 1.4 1.6 1.5
A.VII. Grants 28.2 32.7 19.0 23.9 16.1 14.7 16.3 17.7 20.5 20.1 15.6 16.9 17.7 18.8 18.2 21.2 21.5 16.2 12.9 Grants from abroad 28.2 32.7 19.0 23.9 16.1 14.7 16.3 17.7 20.5 20.1 15.6 16.9 17.7 18.8 18.2 21.2 21.5 16.2 12.9 Current grants 20.4 24.2 12.9 21.0 9.0 12.0 6.2 8.9 14.4 17.2 13.3 14.6 15.5 16.5 15.9 18.2 18.4 16.2 12.5 Compact General 6.4 6.5 6.7 6.8 3.3 6.2 0.0 2.1 6.5 6.6 5.2 5.4 5.4 5.4 5.5 7.0 7.0 0.0 0.0 Compact Special 11.6 15.8 3.9 11.9 3.9 4.0 4.0 4.0 4.0 4.0 4.0 4.1 4.1 4.1 4.1 4.8 4.8 9.8 7.6 Other:Current 2.4 1.8 2.4 2.3 1.8 1.9 2.3 2.8 3.9 6.6 4.0 5.2 6.0 7.1 6.3 6.5 6.6 6.5 4.9 Capital grants 7.8 8.5 6.1 2.9 7.0 2.7 10.0 8.7 6.1 2.8 2.3 2.3 2.3 2.3 2.3 3.0 3.0 0.0 0.5 Compact CIP 2.7 2.8 2.9 2.9 6.8 2.6 9.0 7.1 2.8 2.8 2.3 2.3 2.3 2.3 2.3 3.0 3.0 0.0 0.5 Other:Capital 5.1 5.7 3.2 0.0 0.2 0.0 1.0 1.7 3.3 0.0 0.0 0.0 0.0 0.0 0.0 0.0 0.0 0.0 0.0
continued…
Source: FSM single audits and Department of Economic Affairs estimates

192 FSM
Strategic Developm
ent Plan
Table 7b National Government Finances (GFS Format)— Expenditures and Balances ($ millions)
FY87 FY88 FY89 FY90 FY91 FY92 FY93 FY94 FY95 FY96 FY97 FY98 FY99 FY00 FY01est.
FY02est.
FY03proj.
FY04proj.
FY05proj.
C.I. Total expenditure and net lending 25.1 34.7 44.0 32.3 42.0 35.7 40.1 45.4 52.0 51.0 51.3 55.8 52.5 51.3 50.3 43.3 43.4 41.7 41.7 C.II. Total expenditure 25.1 34.7 44.0 32.3 42.0 35.7 40.1 45.4 52.0 51.0 51.3 55.8 52.5 51.3 50.3 43.3 43.4 41.7 41.7 C.III. Current expenditure 19.7 25.5 25.1 26.7 29.7 32.4 34.9 38.0 43.4 43.7 50.4 48.1 47.0 47.9 47.0 40.6 40.7 39.2 39.0 Expenditure on goods and services 18.6 20.0 22.8 23.3 27.7 30.8 30.1 34.7 41.2 41.4 47.9 44.9 42.4 41.8 42.0 35.2 35.6 34.7 34.7 Wages and salaries 7.1 6.5 7.5 7.7 8.3 8.7 9.9 10.3 10.9 11.4 13.5 12.5 11.8 11.4 11.6 12.7 12.9 12.5 12.5 Travel 2.0 1.6 2.1 1.9 2.1 2.4 2.6 2.5 2.9 2.6 4.3 4.2 4.7 4.9 5.2 4.4 4.5 4.4 4.4 Other 9.5 11.8 13.2 13.7 17.2 19.6 17.7 22.0 27.5 27.3 30.2 28.2 26.0 25.6 25.2 18.0 18.2 17.8 17.8 Interest payments 0.0 0.0 0.0 0.0 0.0 0.2 0.0 0.0 0.0 0.0 0.0 0.0 0.0 0.0 0.0 0.0 0.0 0.0 0.0 Subsidies 0.8 5.6 2.3 3.4 2.0 1.4 3.7 2.1 1.7 1.5 1.0 1.3 1.5 2.2 1.6 1.9 1.6 1.0 0.8 Transfers 0.4 0.0 0.0 0.0 0.0 0.0 1.1 1.2 0.5 0.8 1.4 1.8 3.0 3.8 3.4 3.6 3.6 3.6 3.6 [Memo: incl. transfers to state governments] 1.7 0.7 0.7 1.7 0.9 2.6 2.2 1.9 2.1 4.7 4.7 6.5 4.5 6.2 6.4 3.0 2.6 0.0 0.0 C.IV. Capital expenditure 5.4 9.1 19.0 5.5 12.3 3.4 5.2 7.4 8.6 7.3 0.9 7.7 5.5 3.5 3.3 2.7 2.7 2.5 2.7 Acquisition of fixed capital 0.0 0.0 0.0 0.0 0.0 0.0 0.0 0.0 0.5 0.0 0.0 3.3 3.7 2.7 1.6 1.4 1.4 1.3 1.3 Multi-purpose development projects 5.2 6.1 5.5 2.0 1.2 0.9 3.2 2.7 4.7 4.3 0.9 2.9 0.8 0.7 1.7 1.3 1.3 1.1 1.3 Capital Transfers 0.2 3.0 13.5 3.5 11.0 2.5 2.0 4.7 3.4 3.0 0.0 1.5 1.0 0.0 0.0 0.0 0.0 0.0 0.0
Overall Balance 13.1 13.6 -5.9 15.3 -1.7 1.3 7.8 5.0 2.3 1.3 -9.3 -8.8 -9.5 -11.7 -12.6 -1.8 -0.5 -1.7 -4.5Current Balance 10.7 14.2 6.9 17.9 3.6 2.0 3.0 3.7 4.8 5.8 -10.7 -3.4 -6.3 -10.5 -11.6 -2.1 -0.8 0.7 -2.3Capital Balance 2.4 -0.6 -12.9 -2.6 -5.3 -0.7 4.8 1.3 -2.5 -4.5 1.4 -5.4 -3.2 -1.2 -1.0 0.3 0.3 -2.5 -2.2
Memo items:Nominal GDP 114.1 126.0 132.9 145.3 162.2 173.2 190.4 199.2 208.1 203.0 195.6 197.3 194.1 216.5 220.8 222.4 221.7 225.1 233.6Total Revenue & Grants as % of GDP 34% 38% 29% 33% 25% 21% 25% 25% 26% 26% 21% 24% 22% 18% 17% 19% 19% 18% 16%Grants as % of GDP 25% 26% 14% 16% 10% 8% 9% 9% 10% 10% 8% 9% 9% 9% 8% 10% 10% 7% 6%Grants as % of Total Revenue 74% 68% 50% 50% 40% 40% 34% 35% 38% 38% 37% 36% 41% 47% 48% 51% 50% 41% 35%Tax Revenue as % of GDP 7% 8% 8% 7% 8% 8% 9% 8% 8% 8% 8% 11% 10% 9% 9% 11% 9% 15% 15%Total Expenditure and Net Lending as % of GDP 22% 28% 33% 22% 26% 21% 21% 23% 25% 25% 26% 28% 27% 24% 23% 19% 20% 19% 18%Current Expenditure as % of GDP 17% 20% 19% 18% 18% 19% 18% 19% 21% 22% 26% 24% 24% 22% 21% 18% 18% 17% 17%Capital Expenditure as % of GDP 5% 7% 14% 4% 8% 2% 3% 4% 4% 4% 0% 4% 3% 2% 2% 1% 1% 1% 1%Overall Balance as % of GDP 11% 11% -4% 11% -1% 1% 4% 3% 1% 1% -5% -4% -5% -5% -6% -1% 0% -1% -2%Current Balance as % of GDP 9% 11% 5% 12% 2% 1% 2% 2% 2% 3% -5% -2% -3% -5% -5% -1% 0% 0% -1%
Source: FSM single audits and Department of Economic Affairs estimates
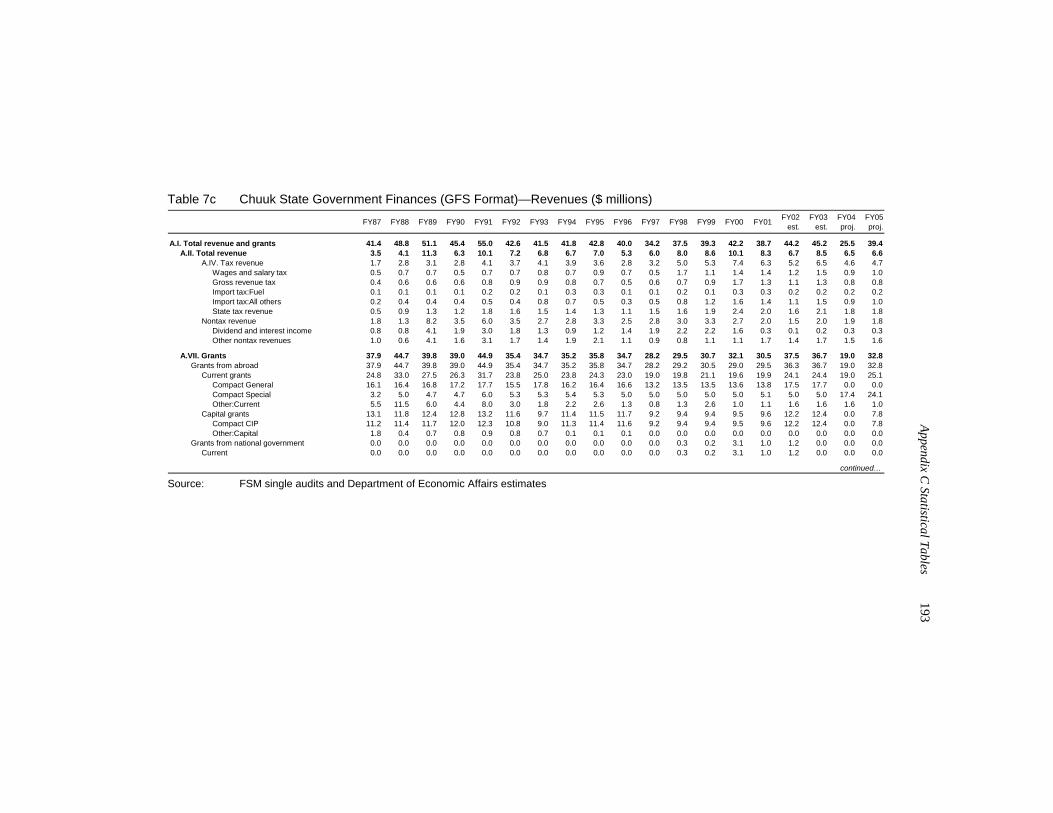
Appendix C
Statistical Tables 193
Table 7c Chuuk State Government Finances (GFS Format)—Revenues ($ millions)
FY87 FY88 FY89 FY90 FY91 FY92 FY93 FY94 FY95 FY96 FY97 FY98 FY99 FY00 FY01 FY02est.
FY03est.
FY04proj.
FY05proj.
A.I. Total revenue and grants 41.4 48.8 51.1 45.4 55.0 42.6 41.5 41.8 42.8 40.0 34.2 37.5 39.3 42.2 38.7 44.2 45.2 25.5 39.4 A.II. Total revenue 3.5 4.1 11.3 6.3 10.1 7.2 6.8 6.7 7.0 5.3 6.0 8.0 8.6 10.1 8.3 6.7 8.5 6.5 6.6 A.IV. Tax revenue 1.7 2.8 3.1 2.8 4.1 3.7 4.1 3.9 3.6 2.8 3.2 5.0 5.3 7.4 6.3 5.2 6.5 4.6 4.7 Wages and salary tax 0.5 0.7 0.7 0.5 0.7 0.7 0.8 0.7 0.9 0.7 0.5 1.7 1.1 1.4 1.4 1.2 1.5 0.9 1.0 Gross revenue tax 0.4 0.6 0.6 0.6 0.8 0.9 0.9 0.8 0.7 0.5 0.6 0.7 0.9 1.7 1.3 1.1 1.3 0.8 0.8 Import tax:Fuel 0.1 0.1 0.1 0.1 0.2 0.2 0.1 0.3 0.3 0.1 0.1 0.2 0.1 0.3 0.3 0.2 0.2 0.2 0.2 Import tax:All others 0.2 0.4 0.4 0.4 0.5 0.4 0.8 0.7 0.5 0.3 0.5 0.8 1.2 1.6 1.4 1.1 1.5 0.9 1.0 State tax revenue 0.5 0.9 1.3 1.2 1.8 1.6 1.5 1.4 1.3 1.1 1.5 1.6 1.9 2.4 2.0 1.6 2.1 1.8 1.8 Nontax revenue 1.8 1.3 8.2 3.5 6.0 3.5 2.7 2.8 3.3 2.5 2.8 3.0 3.3 2.7 2.0 1.5 2.0 1.9 1.8 Dividend and interest income 0.8 0.8 4.1 1.9 3.0 1.8 1.3 0.9 1.2 1.4 1.9 2.2 2.2 1.6 0.3 0.1 0.2 0.3 0.3 Other nontax revenues 1.0 0.6 4.1 1.6 3.1 1.7 1.4 1.9 2.1 1.1 0.9 0.8 1.1 1.1 1.7 1.4 1.7 1.5 1.6
A.VII. Grants 37.9 44.7 39.8 39.0 44.9 35.4 34.7 35.2 35.8 34.7 28.2 29.5 30.7 32.1 30.5 37.5 36.7 19.0 32.8 Grants from abroad 37.9 44.7 39.8 39.0 44.9 35.4 34.7 35.2 35.8 34.7 28.2 29.2 30.5 29.0 29.5 36.3 36.7 19.0 32.8 Current grants 24.8 33.0 27.5 26.3 31.7 23.8 25.0 23.8 24.3 23.0 19.0 19.8 21.1 19.6 19.9 24.1 24.4 19.0 25.1 Compact General 16.1 16.4 16.8 17.2 17.7 15.5 17.8 16.2 16.4 16.6 13.2 13.5 13.5 13.6 13.8 17.5 17.7 0.0 0.0 Compact Special 3.2 5.0 4.7 4.7 6.0 5.3 5.3 5.4 5.3 5.0 5.0 5.0 5.0 5.0 5.1 5.0 5.0 17.4 24.1 Other:Current 5.5 11.5 6.0 4.4 8.0 3.0 1.8 2.2 2.6 1.3 0.8 1.3 2.6 1.0 1.1 1.6 1.6 1.6 1.0 Capital grants 13.1 11.8 12.4 12.8 13.2 11.6 9.7 11.4 11.5 11.7 9.2 9.4 9.4 9.5 9.6 12.2 12.4 0.0 7.8 Compact CIP 11.2 11.4 11.7 12.0 12.3 10.8 9.0 11.3 11.4 11.6 9.2 9.4 9.4 9.5 9.6 12.2 12.4 0.0 7.8 Other:Capital 1.8 0.4 0.7 0.8 0.9 0.8 0.7 0.1 0.1 0.1 0.0 0.0 0.0 0.0 0.0 0.0 0.0 0.0 0.0 Grants from national government 0.0 0.0 0.0 0.0 0.0 0.0 0.0 0.0 0.0 0.0 0.0 0.3 0.2 3.1 1.0 1.2 0.0 0.0 0.0 Current 0.0 0.0 0.0 0.0 0.0 0.0 0.0 0.0 0.0 0.0 0.0 0.3 0.2 3.1 1.0 1.2 0.0 0.0 0.0
continued…
Source: FSM single audits and Department of Economic Affairs estimates
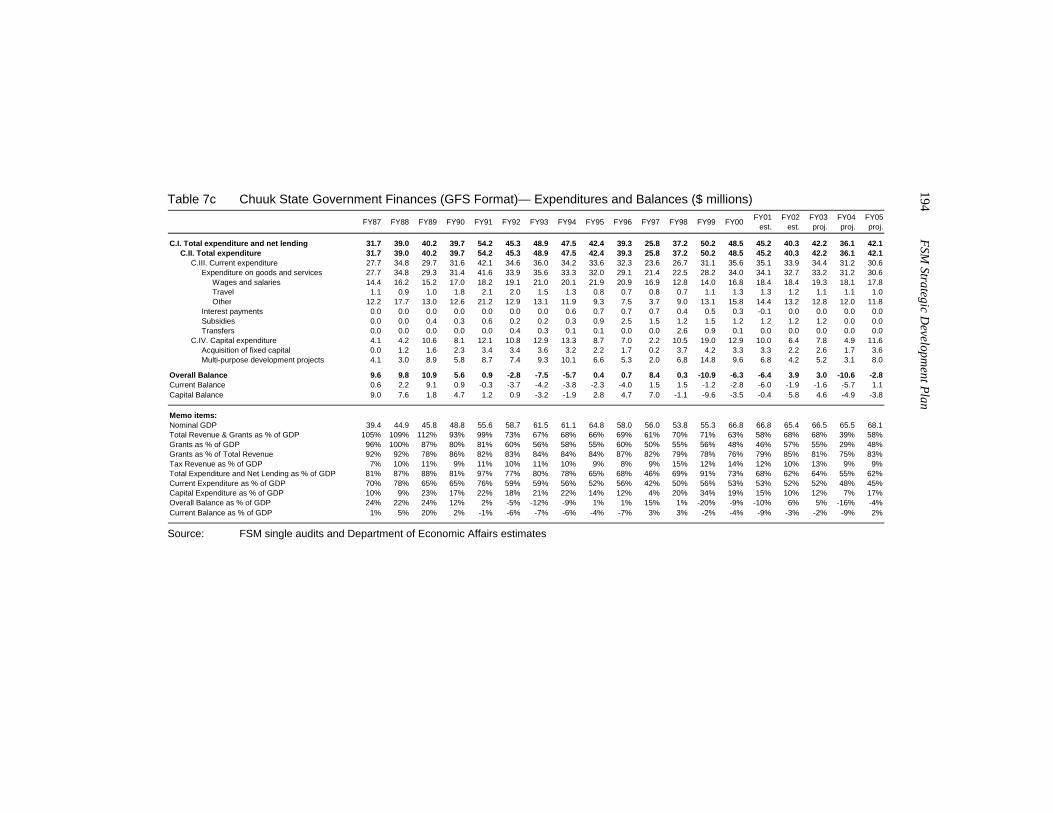
194 FSM
Strategic Developm
ent Plan
Table 7c Chuuk State Government Finances (GFS Format)— Expenditures and Balances ($ millions)
FY87 FY88 FY89 FY90 FY91 FY92 FY93 FY94 FY95 FY96 FY97 FY98 FY99 FY00 FY01est.
FY02est.
FY03proj.
FY04proj.
FY05proj.
C.I. Total expenditure and net lending 31.7 39.0 40.2 39.7 54.2 45.3 48.9 47.5 42.4 39.3 25.8 37.2 50.2 48.5 45.2 40.3 42.2 36.1 42.1 C.II. Total expenditure 31.7 39.0 40.2 39.7 54.2 45.3 48.9 47.5 42.4 39.3 25.8 37.2 50.2 48.5 45.2 40.3 42.2 36.1 42.1 C.III. Current expenditure 27.7 34.8 29.7 31.6 42.1 34.6 36.0 34.2 33.6 32.3 23.6 26.7 31.1 35.6 35.1 33.9 34.4 31.2 30.6 Expenditure on goods and services 27.7 34.8 29.3 31.4 41.6 33.9 35.6 33.3 32.0 29.1 21.4 22.5 28.2 34.0 34.1 32.7 33.2 31.2 30.6 Wages and salaries 14.4 16.2 15.2 17.0 18.2 19.1 21.0 20.1 21.9 20.9 16.9 12.8 14.0 16.8 18.4 18.4 19.3 18.1 17.8 Travel 1.1 0.9 1.0 1.8 2.1 2.0 1.5 1.3 0.8 0.7 0.8 0.7 1.1 1.3 1.3 1.2 1.1 1.1 1.0 Other 12.2 17.7 13.0 12.6 21.2 12.9 13.1 11.9 9.3 7.5 3.7 9.0 13.1 15.8 14.4 13.2 12.8 12.0 11.8 Interest payments 0.0 0.0 0.0 0.0 0.0 0.0 0.0 0.6 0.7 0.7 0.7 0.4 0.5 0.3 -0.1 0.0 0.0 0.0 0.0 Subsidies 0.0 0.0 0.4 0.3 0.6 0.2 0.2 0.3 0.9 2.5 1.5 1.2 1.5 1.2 1.2 1.2 1.2 0.0 0.0 Transfers 0.0 0.0 0.0 0.0 0.0 0.4 0.3 0.1 0.1 0.0 0.0 2.6 0.9 0.1 0.0 0.0 0.0 0.0 0.0 C.IV. Capital expenditure 4.1 4.2 10.6 8.1 12.1 10.8 12.9 13.3 8.7 7.0 2.2 10.5 19.0 12.9 10.0 6.4 7.8 4.9 11.6 Acquisition of fixed capital 0.0 1.2 1.6 2.3 3.4 3.4 3.6 3.2 2.2 1.7 0.2 3.7 4.2 3.3 3.3 2.2 2.6 1.7 3.6 Multi-purpose development projects 4.1 3.0 8.9 5.8 8.7 7.4 9.3 10.1 6.6 5.3 2.0 6.8 14.8 9.6 6.8 4.2 5.2 3.1 8.0
Overall Balance 9.6 9.8 10.9 5.6 0.9 -2.8 -7.5 -5.7 0.4 0.7 8.4 0.3 -10.9 -6.3 -6.4 3.9 3.0 -10.6 -2.8Current Balance 0.6 2.2 9.1 0.9 -0.3 -3.7 -4.2 -3.8 -2.3 -4.0 1.5 1.5 -1.2 -2.8 -6.0 -1.9 -1.6 -5.7 1.1Capital Balance 9.0 7.6 1.8 4.7 1.2 0.9 -3.2 -1.9 2.8 4.7 7.0 -1.1 -9.6 -3.5 -0.4 5.8 4.6 -4.9 -3.8
Memo items:Nominal GDP 39.4 44.9 45.8 48.8 55.6 58.7 61.5 61.1 64.8 58.0 56.0 53.8 55.3 66.8 66.8 65.4 66.5 65.5 68.1Total Revenue & Grants as % of GDP 105% 109% 112% 93% 99% 73% 67% 68% 66% 69% 61% 70% 71% 63% 58% 68% 68% 39% 58%Grants as % of GDP 96% 100% 87% 80% 81% 60% 56% 58% 55% 60% 50% 55% 56% 48% 46% 57% 55% 29% 48%Grants as % of Total Revenue 92% 92% 78% 86% 82% 83% 84% 84% 84% 87% 82% 79% 78% 76% 79% 85% 81% 75% 83%Tax Revenue as % of GDP 7% 10% 11% 9% 11% 10% 11% 10% 9% 8% 9% 15% 12% 14% 12% 10% 13% 9% 9%Total Expenditure and Net Lending as % of GDP 81% 87% 88% 81% 97% 77% 80% 78% 65% 68% 46% 69% 91% 73% 68% 62% 64% 55% 62%Current Expenditure as % of GDP 70% 78% 65% 65% 76% 59% 59% 56% 52% 56% 42% 50% 56% 53% 53% 52% 52% 48% 45%Capital Expenditure as % of GDP 10% 9% 23% 17% 22% 18% 21% 22% 14% 12% 4% 20% 34% 19% 15% 10% 12% 7% 17%Overall Balance as % of GDP 24% 22% 24% 12% 2% -5% -12% -9% 1% 1% 15% 1% -20% -9% -10% 6% 5% -16% -4%Current Balance as % of GDP 1% 5% 20% 2% -1% -6% -7% -6% -4% -7% 3% 3% -2% -4% -9% -3% -2% -9% 2%
Source: FSM single audits and Department of Economic Affairs estimates
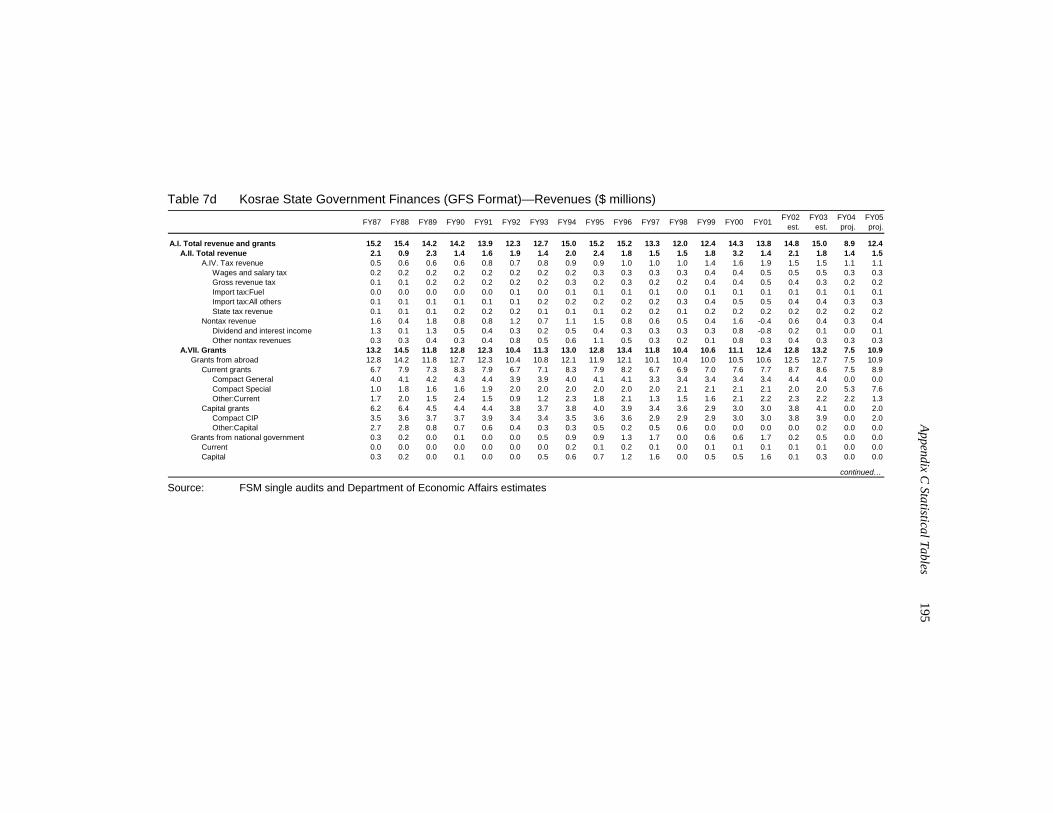
Appendix C
Statistical Tables 195
Table 7d Kosrae State Government Finances (GFS Format)—Revenues ($ millions)
FY87 FY88 FY89 FY90 FY91 FY92 FY93 FY94 FY95 FY96 FY97 FY98 FY99 FY00 FY01 FY02est.
FY03est.
FY04proj.
FY05proj.
A.I. Total revenue and grants 15.2 15.4 14.2 14.2 13.9 12.3 12.7 15.0 15.2 15.2 13.3 12.0 12.4 14.3 13.8 14.8 15.0 8.9 12.4 A.II. Total revenue 2.1 0.9 2.3 1.4 1.6 1.9 1.4 2.0 2.4 1.8 1.5 1.5 1.8 3.2 1.4 2.1 1.8 1.4 1.5 A.IV. Tax revenue 0.5 0.6 0.6 0.6 0.8 0.7 0.8 0.9 0.9 1.0 1.0 1.0 1.4 1.6 1.9 1.5 1.5 1.1 1.1 Wages and salary tax 0.2 0.2 0.2 0.2 0.2 0.2 0.2 0.2 0.3 0.3 0.3 0.3 0.4 0.4 0.5 0.5 0.5 0.3 0.3 Gross revenue tax 0.1 0.1 0.2 0.2 0.2 0.2 0.2 0.3 0.2 0.3 0.2 0.2 0.4 0.4 0.5 0.4 0.3 0.2 0.2 Import tax:Fuel 0.0 0.0 0.0 0.0 0.0 0.1 0.0 0.1 0.1 0.1 0.1 0.0 0.1 0.1 0.1 0.1 0.1 0.1 0.1 Import tax:All others 0.1 0.1 0.1 0.1 0.1 0.1 0.2 0.2 0.2 0.2 0.2 0.3 0.4 0.5 0.5 0.4 0.4 0.3 0.3 State tax revenue 0.1 0.1 0.1 0.2 0.2 0.2 0.1 0.1 0.1 0.2 0.2 0.1 0.2 0.2 0.2 0.2 0.2 0.2 0.2 Nontax revenue 1.6 0.4 1.8 0.8 0.8 1.2 0.7 1.1 1.5 0.8 0.6 0.5 0.4 1.6 -0.4 0.6 0.4 0.3 0.4 Dividend and interest income 1.3 0.1 1.3 0.5 0.4 0.3 0.2 0.5 0.4 0.3 0.3 0.3 0.3 0.8 -0.8 0.2 0.1 0.0 0.1 Other nontax revenues 0.3 0.3 0.4 0.3 0.4 0.8 0.5 0.6 1.1 0.5 0.3 0.2 0.1 0.8 0.3 0.4 0.3 0.3 0.3 A.VII. Grants 13.2 14.5 11.8 12.8 12.3 10.4 11.3 13.0 12.8 13.4 11.8 10.4 10.6 11.1 12.4 12.8 13.2 7.5 10.9 Grants from abroad 12.8 14.2 11.8 12.7 12.3 10.4 10.8 12.1 11.9 12.1 10.1 10.4 10.0 10.5 10.6 12.5 12.7 7.5 10.9 Current grants 6.7 7.9 7.3 8.3 7.9 6.7 7.1 8.3 7.9 8.2 6.7 6.9 7.0 7.6 7.7 8.7 8.6 7.5 8.9 Compact General 4.0 4.1 4.2 4.3 4.4 3.9 3.9 4.0 4.1 4.1 3.3 3.4 3.4 3.4 3.4 4.4 4.4 0.0 0.0 Compact Special 1.0 1.8 1.6 1.6 1.9 2.0 2.0 2.0 2.0 2.0 2.0 2.1 2.1 2.1 2.1 2.0 2.0 5.3 7.6 Other:Current 1.7 2.0 1.5 2.4 1.5 0.9 1.2 2.3 1.8 2.1 1.3 1.5 1.6 2.1 2.2 2.3 2.2 2.2 1.3 Capital grants 6.2 6.4 4.5 4.4 4.4 3.8 3.7 3.8 4.0 3.9 3.4 3.6 2.9 3.0 3.0 3.8 4.1 0.0 2.0 Compact CIP 3.5 3.6 3.7 3.7 3.9 3.4 3.4 3.5 3.6 3.6 2.9 2.9 2.9 3.0 3.0 3.8 3.9 0.0 2.0 Other:Capital 2.7 2.8 0.8 0.7 0.6 0.4 0.3 0.3 0.5 0.2 0.5 0.6 0.0 0.0 0.0 0.0 0.2 0.0 0.0 Grants from national government 0.3 0.2 0.0 0.1 0.0 0.0 0.5 0.9 0.9 1.3 1.7 0.0 0.6 0.6 1.7 0.2 0.5 0.0 0.0 Current 0.0 0.0 0.0 0.0 0.0 0.0 0.0 0.2 0.1 0.2 0.1 0.0 0.1 0.1 0.1 0.1 0.1 0.0 0.0 Capital 0.3 0.2 0.0 0.1 0.0 0.0 0.5 0.6 0.7 1.2 1.6 0.0 0.5 0.5 1.6 0.1 0.3 0.0 0.0
continued…
Source: FSM single audits and Department of Economic Affairs estimates

196 FSM
Strategic Developm
ent Plan
Table 7d Kosrae State Government Finances (GFS Format)— Expenditures and Balances ($ millions)
FY87 FY88 FY89 FY90 FY91 FY92 FY93 FY94 FY95 FY96 FY97 FY98 FY99 FY00 FY01est.
FY02est.
FY03proj.
FY04proj.
FY05proj.
C.I. Total expenditure and net lending 12.7 12.5 11.7 13.8 14.8 15.2 13.6 13.4 13.6 15.3 13.3 11.3 11.8 13.4 14.6 14.5 14.0 10.5 11.7 C.II. Total expenditure 12.7 12.5 11.7 13.8 14.8 15.2 13.6 13.4 13.6 15.3 13.3 11.3 11.8 13.4 14.6 14.5 14.0 10.5 11.7 C.III. Current expenditure 7.6 7.8 8.0 8.2 8.1 7.9 9.1 9.6 10.5 10.0 9.4 8.4 8.1 8.4 9.5 10.9 10.2 9.7 9.5 Expenditure on goods and services 7.6 7.8 8.0 8.2 8.1 7.6 8.8 8.7 9.9 9.5 8.4 7.0 7.5 8.4 9.0 10.1 9.9 9.7 9.5 Wages and salaries 4.2 4.3 4.4 4.5 4.6 4.9 5.1 5.1 5.5 5.8 5.7 4.6 4.6 4.9 5.0 5.7 5.5 5.4 5.2 Travel 0.8 0.4 0.5 0.6 0.4 0.3 0.3 0.5 0.6 0.4 0.4 0.5 0.4 0.7 0.7 0.8 0.8 0.8 0.7 Other 2.5 3.1 3.2 3.1 3.1 2.4 3.4 3.1 3.8 3.3 2.3 1.9 2.4 2.8 3.3 3.6 3.6 3.5 3.5 Interest payments 0.0 0.0 0.0 0.0 0.0 0.2 0.3 0.2 0.1 0.0 0.0 0.0 0.0 0.0 0.0 0.0 0.0 0.0 0.0 Subsidies 0.0 0.0 0.0 0.0 0.0 0.0 0.0 0.7 0.4 0.5 1.1 0.5 0.5 0.0 0.5 0.5 0.3 0.0 0.0 Transfers 0.0 0.0 0.0 0.0 0.0 0.0 0.0 0.0 0.0 0.0 0.0 0.9 0.1 0.0 0.0 0.4 0.0 0.0 0.0 C.IV. Capital expenditure 5.1 4.7 3.7 5.6 6.6 7.3 4.5 3.8 3.1 5.3 3.8 2.8 3.6 5.0 5.1 3.5 3.8 0.8 2.2 Acquisition of fixed capital 0.4 0.3 0.5 1.8 3.8 5.4 0.5 0.5 0.4 0.3 0.3 0.5 0.4 0.5 0.3 0.3 0.3 0.2 0.3 Multi-purpose development projects -4.7 -4.5 -3.1 -3.8 -2.8 -1.8 -4.0 -3.1 -2.7 -4.9 -3.6 -2.4 -3.2 -3.9 -4.6 -3.2 -3.2 -0.6 -2.0 Capital Transfers 0.0 0.0 0.0 0.0 0.0 0.0 0.0 -0.3 0.0 0.0 0.0 0.0 0.0 -0.5 -0.3 0.0 -0.3 0.0 0.0 C.V. Net lending (domestic) 0.0 0.0 0.0 0.0 0.0 0.0 0.0 0.0 0.0 0.0 0.0 0.0 0.0 0.0 0.0 0.0 0.0 0.0 0.0
Overall Balance 2.6 2.9 2.5 0.4 -0.8 -2.9 -0.9 1.6 1.5 -0.1 0.0 0.7 0.7 1.0 -0.8 0.3 1.0 -1.6 0.7Current Balance 1.1 1.0 1.7 1.5 1.3 0.7 -0.6 0.9 -0.1 0.1 -1.1 0.0 0.8 2.5 -0.3 0.0 0.4 -0.7 1.0Capital Balance 1.4 1.9 0.8 -1.1 -2.2 -3.5 -0.4 0.7 1.6 -0.2 1.2 0.7 -0.2 -1.5 -0.6 0.4 0.6 -0.8 -0.2
Memo items:Nominal GDP 11.5 11.1 11.3 12.2 13.4 13.4 14.8 18.2 17.5 18.4 17.0 16.4 17.1 18.5 20.7 20.0 19.0 17.8 18.5Total Revenue & Grants as % of GDP 132% 139% 125% 117% 104% 92% 86% 82% 86% 83% 79% 73% 73% 78% 67% 74% 79% 50% 67%Grants as % of GDP 115% 131% 104% 105% 92% 78% 76% 71% 73% 73% 70% 64% 62% 60% 60% 64% 69% 42% 59%Grants as % of Total Revenue 87% 94% 83% 90% 88% 85% 89% 87% 84% 88% 89% 87% 85% 78% 90% 86% 88% 84% 88%Tax Revenue as % of GDP 8% 9% 9% 9% 10% 9% 9% 9% 9% 10% 10% 11% 11% 12% 12% 10% 11% 8% 8%Total Expenditure and Net Lending as % of GDP 110% 113% 103% 113% 110% 113% 92% 74% 78% 83% 78% 69% 69% 72% 71% 72% 74% 59% 63%Current Expenditure as % of GDP 66% 70% 71% 67% 60% 59% 62% 53% 60% 55% 56% 51% 48% 45% 46% 55% 54% 54% 51%Capital Expenditure as % of GDP 44% 43% 32% 46% 49% 54% 31% 21% 18% 29% 23% 17% 21% 27% 25% 18% 20% 5% 12%Overall Balance as % of GDP 22% 26% 22% 4% -6% -21% -6% 9% 9% -1% 0% 4% 4% 5% -4% 2% 5% -9% 4%Current Balance as % of GDP 10% 9% 15% 13% 10% 5% -4% 5% 0% 1% -7% 0% 5% 14% -1% 0% 2% -4% 5%
Source: FSM single audits and Department of Economic Affairs estimates
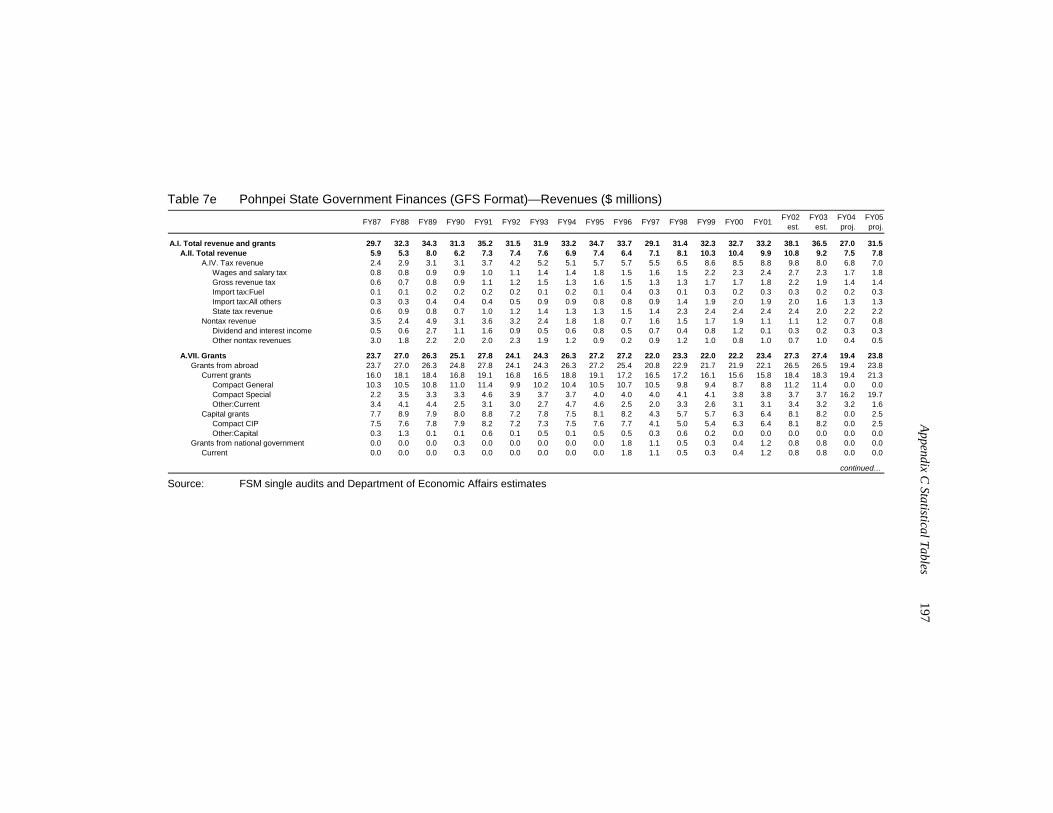
Appendix C
Statistical Tables 197
Table 7e Pohnpei State Government Finances (GFS Format)—Revenues ($ millions)
FY87 FY88 FY89 FY90 FY91 FY92 FY93 FY94 FY95 FY96 FY97 FY98 FY99 FY00 FY01 FY02est.
FY03est.
FY04proj.
FY05proj.
A.I. Total revenue and grants 29.7 32.3 34.3 31.3 35.2 31.5 31.9 33.2 34.7 33.7 29.1 31.4 32.3 32.7 33.2 38.1 36.5 27.0 31.5 A.II. Total revenue 5.9 5.3 8.0 6.2 7.3 7.4 7.6 6.9 7.4 6.4 7.1 8.1 10.3 10.4 9.9 10.8 9.2 7.5 7.8 A.IV. Tax revenue 2.4 2.9 3.1 3.1 3.7 4.2 5.2 5.1 5.7 5.7 5.5 6.5 8.6 8.5 8.8 9.8 8.0 6.8 7.0 Wages and salary tax 0.8 0.8 0.9 0.9 1.0 1.1 1.4 1.4 1.8 1.5 1.6 1.5 2.2 2.3 2.4 2.7 2.3 1.7 1.8 Gross revenue tax 0.6 0.7 0.8 0.9 1.1 1.2 1.5 1.3 1.6 1.5 1.3 1.3 1.7 1.7 1.8 2.2 1.9 1.4 1.4 Import tax:Fuel 0.1 0.1 0.2 0.2 0.2 0.2 0.1 0.2 0.1 0.4 0.3 0.1 0.3 0.2 0.3 0.3 0.2 0.2 0.3 Import tax:All others 0.3 0.3 0.4 0.4 0.4 0.5 0.9 0.9 0.8 0.8 0.9 1.4 1.9 2.0 1.9 2.0 1.6 1.3 1.3 State tax revenue 0.6 0.9 0.8 0.7 1.0 1.2 1.4 1.3 1.3 1.5 1.4 2.3 2.4 2.4 2.4 2.4 2.0 2.2 2.2 Nontax revenue 3.5 2.4 4.9 3.1 3.6 3.2 2.4 1.8 1.8 0.7 1.6 1.5 1.7 1.9 1.1 1.1 1.2 0.7 0.8 Dividend and interest income 0.5 0.6 2.7 1.1 1.6 0.9 0.5 0.6 0.8 0.5 0.7 0.4 0.8 1.2 0.1 0.3 0.2 0.3 0.3 Other nontax revenues 3.0 1.8 2.2 2.0 2.0 2.3 1.9 1.2 0.9 0.2 0.9 1.2 1.0 0.8 1.0 0.7 1.0 0.4 0.5
A.VII. Grants 23.7 27.0 26.3 25.1 27.8 24.1 24.3 26.3 27.2 27.2 22.0 23.3 22.0 22.2 23.4 27.3 27.4 19.4 23.8 Grants from abroad 23.7 27.0 26.3 24.8 27.8 24.1 24.3 26.3 27.2 25.4 20.8 22.9 21.7 21.9 22.1 26.5 26.5 19.4 23.8 Current grants 16.0 18.1 18.4 16.8 19.1 16.8 16.5 18.8 19.1 17.2 16.5 17.2 16.1 15.6 15.8 18.4 18.3 19.4 21.3 Compact General 10.3 10.5 10.8 11.0 11.4 9.9 10.2 10.4 10.5 10.7 10.5 9.8 9.4 8.7 8.8 11.2 11.4 0.0 0.0 Compact Special 2.2 3.5 3.3 3.3 4.6 3.9 3.7 3.7 4.0 4.0 4.0 4.1 4.1 3.8 3.8 3.7 3.7 16.2 19.7 Other:Current 3.4 4.1 4.4 2.5 3.1 3.0 2.7 4.7 4.6 2.5 2.0 3.3 2.6 3.1 3.1 3.4 3.2 3.2 1.6 Capital grants 7.7 8.9 7.9 8.0 8.8 7.2 7.8 7.5 8.1 8.2 4.3 5.7 5.7 6.3 6.4 8.1 8.2 0.0 2.5 Compact CIP 7.5 7.6 7.8 7.9 8.2 7.2 7.3 7.5 7.6 7.7 4.1 5.0 5.4 6.3 6.4 8.1 8.2 0.0 2.5 Other:Capital 0.3 1.3 0.1 0.1 0.6 0.1 0.5 0.1 0.5 0.5 0.3 0.6 0.2 0.0 0.0 0.0 0.0 0.0 0.0 Grants from national government 0.0 0.0 0.0 0.3 0.0 0.0 0.0 0.0 0.0 1.8 1.1 0.5 0.3 0.4 1.2 0.8 0.8 0.0 0.0 Current 0.0 0.0 0.0 0.3 0.0 0.0 0.0 0.0 0.0 1.8 1.1 0.5 0.3 0.4 1.2 0.8 0.8 0.0 0.0
continued…
Source: FSM single audits and Department of Economic Affairs estimates
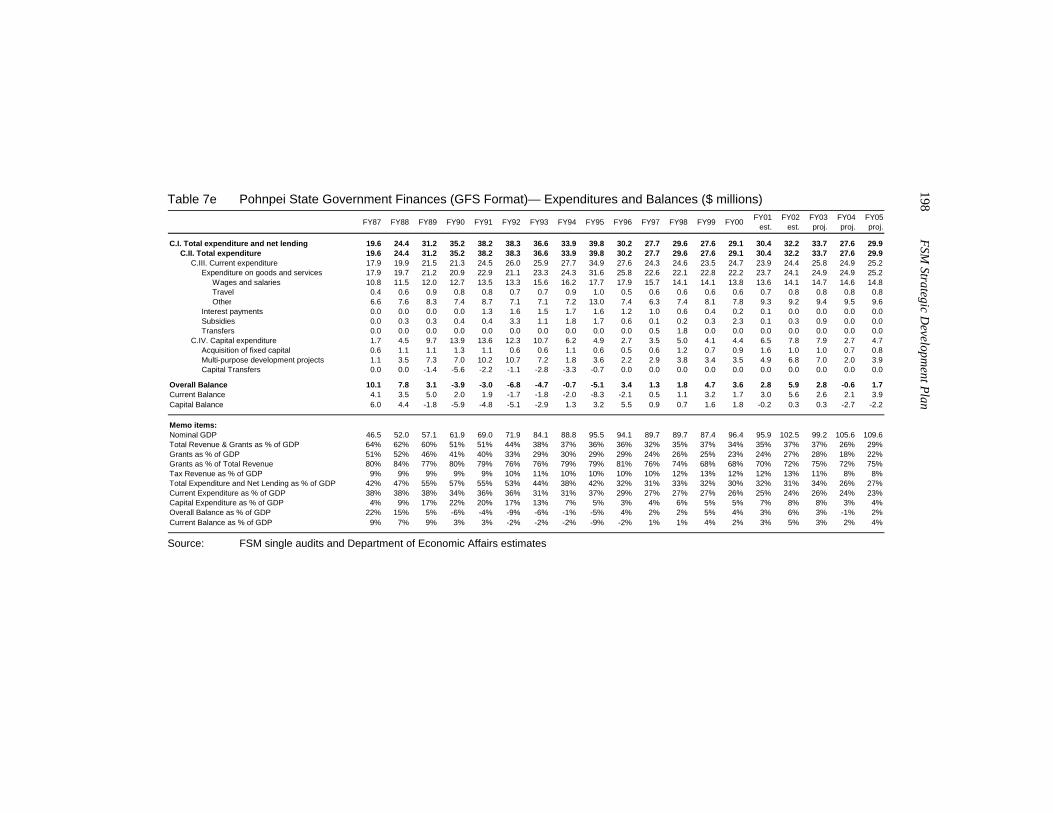
198 FSM
Strategic Developm
ent Plan
Table 7e Pohnpei State Government Finances (GFS Format)— Expenditures and Balances ($ millions)
FY87 FY88 FY89 FY90 FY91 FY92 FY93 FY94 FY95 FY96 FY97 FY98 FY99 FY00 FY01est.
FY02est.
FY03proj.
FY04proj.
FY05proj.
C.I. Total expenditure and net lending 19.6 24.4 31.2 35.2 38.2 38.3 36.6 33.9 39.8 30.2 27.7 29.6 27.6 29.1 30.4 32.2 33.7 27.6 29.9 C.II. Total expenditure 19.6 24.4 31.2 35.2 38.2 38.3 36.6 33.9 39.8 30.2 27.7 29.6 27.6 29.1 30.4 32.2 33.7 27.6 29.9 C.III. Current expenditure 17.9 19.9 21.5 21.3 24.5 26.0 25.9 27.7 34.9 27.6 24.3 24.6 23.5 24.7 23.9 24.4 25.8 24.9 25.2 Expenditure on goods and services 17.9 19.7 21.2 20.9 22.9 21.1 23.3 24.3 31.6 25.8 22.6 22.1 22.8 22.2 23.7 24.1 24.9 24.9 25.2 Wages and salaries 10.8 11.5 12.0 12.7 13.5 13.3 15.6 16.2 17.7 17.9 15.7 14.1 14.1 13.8 13.6 14.1 14.7 14.6 14.8 Travel 0.4 0.6 0.9 0.8 0.8 0.7 0.7 0.9 1.0 0.5 0.6 0.6 0.6 0.6 0.7 0.8 0.8 0.8 0.8 Other 6.6 7.6 8.3 7.4 8.7 7.1 7.1 7.2 13.0 7.4 6.3 7.4 8.1 7.8 9.3 9.2 9.4 9.5 9.6 Interest payments 0.0 0.0 0.0 0.0 1.3 1.6 1.5 1.7 1.6 1.2 1.0 0.6 0.4 0.2 0.1 0.0 0.0 0.0 0.0 Subsidies 0.0 0.3 0.3 0.4 0.4 3.3 1.1 1.8 1.7 0.6 0.1 0.2 0.3 2.3 0.1 0.3 0.9 0.0 0.0 Transfers 0.0 0.0 0.0 0.0 0.0 0.0 0.0 0.0 0.0 0.0 0.5 1.8 0.0 0.0 0.0 0.0 0.0 0.0 0.0 C.IV. Capital expenditure 1.7 4.5 9.7 13.9 13.6 12.3 10.7 6.2 4.9 2.7 3.5 5.0 4.1 4.4 6.5 7.8 7.9 2.7 4.7 Acquisition of fixed capital 0.6 1.1 1.1 1.3 1.1 0.6 0.6 1.1 0.6 0.5 0.6 1.2 0.7 0.9 1.6 1.0 1.0 0.7 0.8 Multi-purpose development projects 1.1 3.5 7.3 7.0 10.2 10.7 7.2 1.8 3.6 2.2 2.9 3.8 3.4 3.5 4.9 6.8 7.0 2.0 3.9 Capital Transfers 0.0 0.0 -1.4 -5.6 -2.2 -1.1 -2.8 -3.3 -0.7 0.0 0.0 0.0 0.0 0.0 0.0 0.0 0.0 0.0 0.0
Overall Balance 10.1 7.8 3.1 -3.9 -3.0 -6.8 -4.7 -0.7 -5.1 3.4 1.3 1.8 4.7 3.6 2.8 5.9 2.8 -0.6 1.7Current Balance 4.1 3.5 5.0 2.0 1.9 -1.7 -1.8 -2.0 -8.3 -2.1 0.5 1.1 3.2 1.7 3.0 5.6 2.6 2.1 3.9Capital Balance 6.0 4.4 -1.8 -5.9 -4.8 -5.1 -2.9 1.3 3.2 5.5 0.9 0.7 1.6 1.8 -0.2 0.3 0.3 -2.7 -2.2
Memo items:Nominal GDP 46.5 52.0 57.1 61.9 69.0 71.9 84.1 88.8 95.5 94.1 89.7 89.7 87.4 96.4 95.9 102.5 99.2 105.6 109.6Total Revenue & Grants as % of GDP 64% 62% 60% 51% 51% 44% 38% 37% 36% 36% 32% 35% 37% 34% 35% 37% 37% 26% 29%Grants as % of GDP 51% 52% 46% 41% 40% 33% 29% 30% 29% 29% 24% 26% 25% 23% 24% 27% 28% 18% 22%Grants as % of Total Revenue 80% 84% 77% 80% 79% 76% 76% 79% 79% 81% 76% 74% 68% 68% 70% 72% 75% 72% 75%Tax Revenue as % of GDP 9% 9% 9% 9% 9% 10% 11% 10% 10% 10% 10% 12% 13% 12% 12% 13% 11% 8% 8%Total Expenditure and Net Lending as % of GDP 42% 47% 55% 57% 55% 53% 44% 38% 42% 32% 31% 33% 32% 30% 32% 31% 34% 26% 27%Current Expenditure as % of GDP 38% 38% 38% 34% 36% 36% 31% 31% 37% 29% 27% 27% 27% 26% 25% 24% 26% 24% 23%Capital Expenditure as % of GDP 4% 9% 17% 22% 20% 17% 13% 7% 5% 3% 4% 6% 5% 5% 7% 8% 8% 3% 4%Overall Balance as % of GDP 22% 15% 5% -6% -4% -9% -6% -1% -5% 4% 2% 2% 5% 4% 3% 6% 3% -1% 2%Current Balance as % of GDP 9% 7% 9% 3% 3% -2% -2% -2% -9% -2% 1% 1% 4% 2% 3% 5% 3% 2% 4%
Source: FSM single audits and Department of Economic Affairs estimates
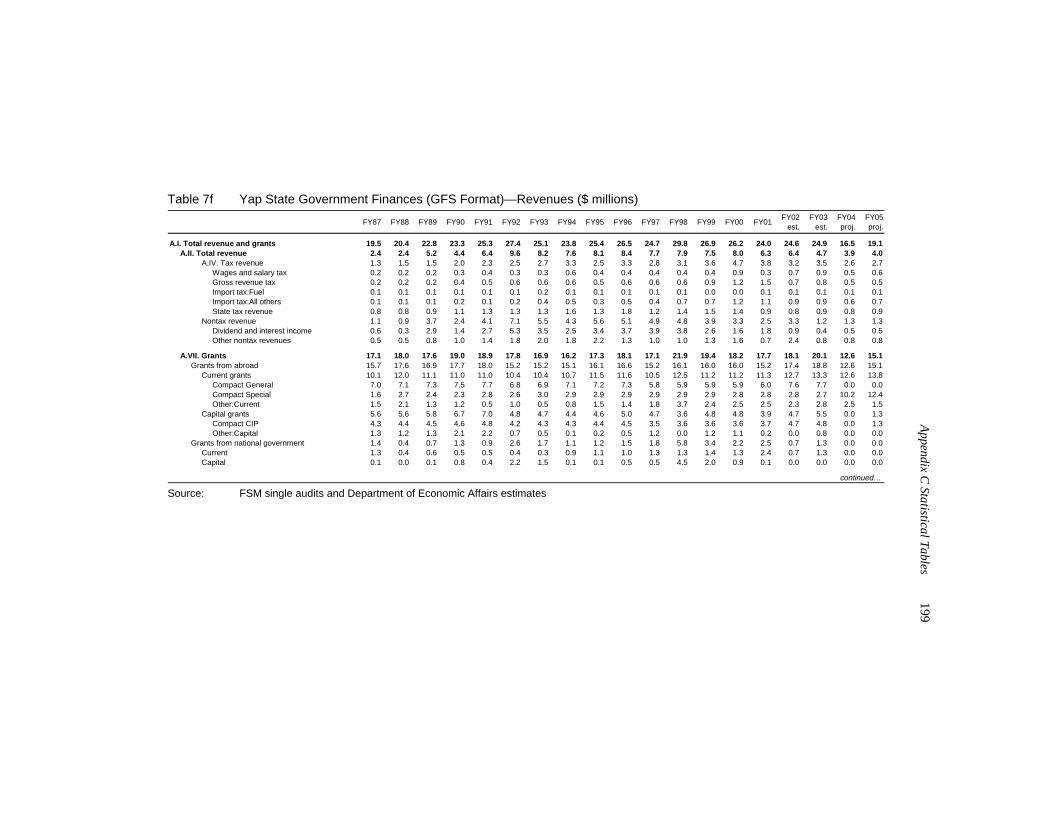
Appendix C
Statistical Tables 199
Table 7f Yap State Government Finances (GFS Format)—Revenues ($ millions)
FY87 FY88 FY89 FY90 FY91 FY92 FY93 FY94 FY95 FY96 FY97 FY98 FY99 FY00 FY01 FY02est.
FY03est.
FY04proj.
FY05proj.
A.I. Total revenue and grants 19.5 20.4 22.8 23.3 25.3 27.4 25.1 23.8 25.4 26.5 24.7 29.8 26.9 26.2 24.0 24.6 24.9 16.5 19.1 A.II. Total revenue 2.4 2.4 5.2 4.4 6.4 9.6 8.2 7.6 8.1 8.4 7.7 7.9 7.5 8.0 6.3 6.4 4.7 3.9 4.0 A.IV. Tax revenue 1.3 1.5 1.5 2.0 2.3 2.5 2.7 3.3 2.5 3.3 2.8 3.1 3.6 4.7 3.8 3.2 3.5 2.6 2.7 Wages and salary tax 0.2 0.2 0.2 0.3 0.4 0.3 0.3 0.6 0.4 0.4 0.4 0.4 0.4 0.9 0.3 0.7 0.9 0.5 0.6 Gross revenue tax 0.2 0.2 0.2 0.4 0.5 0.6 0.6 0.6 0.5 0.6 0.6 0.6 0.9 1.2 1.5 0.7 0.8 0.5 0.5 Import tax:Fuel 0.1 0.1 0.1 0.1 0.1 0.1 0.2 0.1 0.1 0.1 0.1 0.1 0.0 0.0 0.1 0.1 0.1 0.1 0.1 Import tax:All others 0.1 0.1 0.1 0.2 0.1 0.2 0.4 0.5 0.3 0.5 0.4 0.7 0.7 1.2 1.1 0.9 0.9 0.6 0.7 State tax revenue 0.8 0.8 0.9 1.1 1.3 1.3 1.3 1.6 1.3 1.8 1.2 1.4 1.5 1.4 0.9 0.8 0.9 0.8 0.9 Nontax revenue 1.1 0.9 3.7 2.4 4.1 7.1 5.5 4.3 5.6 5.1 4.9 4.8 3.9 3.3 2.5 3.3 1.2 1.3 1.3 Dividend and interest income 0.6 0.3 2.9 1.4 2.7 5.3 3.5 2.5 3.4 3.7 3.9 3.8 2.6 1.6 1.8 0.9 0.4 0.5 0.5 Other nontax revenues 0.5 0.5 0.8 1.0 1.4 1.8 2.0 1.8 2.2 1.3 1.0 1.0 1.3 1.6 0.7 2.4 0.8 0.8 0.8
A.VII. Grants 17.1 18.0 17.6 19.0 18.9 17.8 16.9 16.2 17.3 18.1 17.1 21.9 19.4 18.2 17.7 18.1 20.1 12.6 15.1 Grants from abroad 15.7 17.6 16.9 17.7 18.0 15.2 15.2 15.1 16.1 16.6 15.2 16.1 16.0 16.0 15.2 17.4 18.8 12.6 15.1 Current grants 10.1 12.0 11.1 11.0 11.0 10.4 10.4 10.7 11.5 11.6 10.5 12.5 11.2 11.2 11.3 12.7 13.3 12.6 13.8 Compact General 7.0 7.1 7.3 7.5 7.7 6.8 6.9 7.1 7.2 7.3 5.8 5.9 5.9 5.9 6.0 7.6 7.7 0.0 0.0 Compact Special 1.6 2.7 2.4 2.3 2.8 2.6 3.0 2.9 2.9 2.9 2.9 2.9 2.9 2.8 2.8 2.8 2.7 10.2 12.4 Other:Current 1.5 2.1 1.3 1.2 0.5 1.0 0.5 0.8 1.5 1.4 1.8 3.7 2.4 2.5 2.5 2.3 2.8 2.5 1.5 Capital grants 5.6 5.6 5.8 6.7 7.0 4.8 4.7 4.4 4.6 5.0 4.7 3.6 4.8 4.8 3.9 4.7 5.5 0.0 1.3 Compact CIP 4.3 4.4 4.5 4.6 4.8 4.2 4.3 4.3 4.4 4.5 3.5 3.6 3.6 3.6 3.7 4.7 4.8 0.0 1.3 Other:Capital 1.3 1.2 1.3 2.1 2.2 0.7 0.5 0.1 0.2 0.5 1.2 0.0 1.2 1.1 0.2 0.0 0.8 0.0 0.0 Grants from national government 1.4 0.4 0.7 1.3 0.9 2.6 1.7 1.1 1.2 1.5 1.8 5.8 3.4 2.2 2.5 0.7 1.3 0.0 0.0 Current 1.3 0.4 0.6 0.5 0.5 0.4 0.3 0.9 1.1 1.0 1.3 1.3 1.4 1.3 2.4 0.7 1.3 0.0 0.0 Capital 0.1 0.0 0.1 0.8 0.4 2.2 1.5 0.1 0.1 0.5 0.5 4.5 2.0 0.9 0.1 0.0 0.0 0.0 0.0
continued…
Source: FSM single audits and Department of Economic Affairs estimates
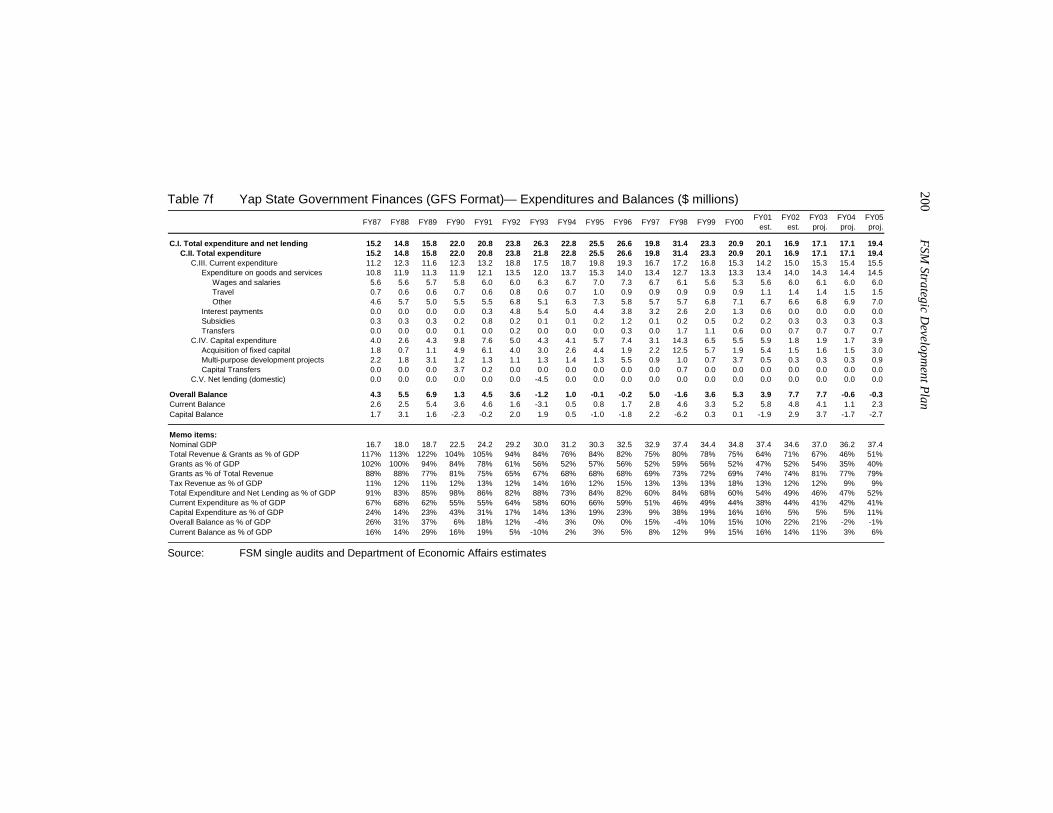
200 FSM
Strategic Developm
ent Plan
Table 7f Yap State Government Finances (GFS Format)— Expenditures and Balances ($ millions)
FY87 FY88 FY89 FY90 FY91 FY92 FY93 FY94 FY95 FY96 FY97 FY98 FY99 FY00 FY01est.
FY02est.
FY03proj.
FY04proj.
FY05proj.
C.I. Total expenditure and net lending 15.2 14.8 15.8 22.0 20.8 23.8 26.3 22.8 25.5 26.6 19.8 31.4 23.3 20.9 20.1 16.9 17.1 17.1 19.4 C.II. Total expenditure 15.2 14.8 15.8 22.0 20.8 23.8 21.8 22.8 25.5 26.6 19.8 31.4 23.3 20.9 20.1 16.9 17.1 17.1 19.4 C.III. Current expenditure 11.2 12.3 11.6 12.3 13.2 18.8 17.5 18.7 19.8 19.3 16.7 17.2 16.8 15.3 14.2 15.0 15.3 15.4 15.5 Expenditure on goods and services 10.8 11.9 11.3 11.9 12.1 13.5 12.0 13.7 15.3 14.0 13.4 12.7 13.3 13.3 13.4 14.0 14.3 14.4 14.5 Wages and salaries 5.6 5.6 5.7 5.8 6.0 6.0 6.3 6.7 7.0 7.3 6.7 6.1 5.6 5.3 5.6 6.0 6.1 6.0 6.0 Travel 0.7 0.6 0.6 0.7 0.6 0.8 0.6 0.7 1.0 0.9 0.9 0.9 0.9 0.9 1.1 1.4 1.4 1.5 1.5 Other 4.6 5.7 5.0 5.5 5.5 6.8 5.1 6.3 7.3 5.8 5.7 5.7 6.8 7.1 6.7 6.6 6.8 6.9 7.0 Interest payments 0.0 0.0 0.0 0.0 0.3 4.8 5.4 5.0 4.4 3.8 3.2 2.6 2.0 1.3 0.6 0.0 0.0 0.0 0.0 Subsidies 0.3 0.3 0.3 0.2 0.8 0.2 0.1 0.1 0.2 1.2 0.1 0.2 0.5 0.2 0.2 0.3 0.3 0.3 0.3 Transfers 0.0 0.0 0.0 0.1 0.0 0.2 0.0 0.0 0.0 0.3 0.0 1.7 1.1 0.6 0.0 0.7 0.7 0.7 0.7 C.IV. Capital expenditure 4.0 2.6 4.3 9.8 7.6 5.0 4.3 4.1 5.7 7.4 3.1 14.3 6.5 5.5 5.9 1.8 1.9 1.7 3.9 Acquisition of fixed capital 1.8 0.7 1.1 4.9 6.1 4.0 3.0 2.6 4.4 1.9 2.2 12.5 5.7 1.9 5.4 1.5 1.6 1.5 3.0 Multi-purpose development projects 2.2 1.8 3.1 1.2 1.3 1.1 1.3 1.4 1.3 5.5 0.9 1.0 0.7 3.7 0.5 0.3 0.3 0.3 0.9 Capital Transfers 0.0 0.0 0.0 3.7 0.2 0.0 0.0 0.0 0.0 0.0 0.0 0.7 0.0 0.0 0.0 0.0 0.0 0.0 0.0 C.V. Net lending (domestic) 0.0 0.0 0.0 0.0 0.0 0.0 -4.5 0.0 0.0 0.0 0.0 0.0 0.0 0.0 0.0 0.0 0.0 0.0 0.0
Overall Balance 4.3 5.5 6.9 1.3 4.5 3.6 -1.2 1.0 -0.1 -0.2 5.0 -1.6 3.6 5.3 3.9 7.7 7.7 -0.6 -0.3Current Balance 2.6 2.5 5.4 3.6 4.6 1.6 -3.1 0.5 0.8 1.7 2.8 4.6 3.3 5.2 5.8 4.8 4.1 1.1 2.3Capital Balance 1.7 3.1 1.6 -2.3 -0.2 2.0 1.9 0.5 -1.0 -1.8 2.2 -6.2 0.3 0.1 -1.9 2.9 3.7 -1.7 -2.7
Memo items:Nominal GDP 16.7 18.0 18.7 22.5 24.2 29.2 30.0 31.2 30.3 32.5 32.9 37.4 34.4 34.8 37.4 34.6 37.0 36.2 37.4Total Revenue & Grants as % of GDP 117% 113% 122% 104% 105% 94% 84% 76% 84% 82% 75% 80% 78% 75% 64% 71% 67% 46% 51%Grants as % of GDP 102% 100% 94% 84% 78% 61% 56% 52% 57% 56% 52% 59% 56% 52% 47% 52% 54% 35% 40%Grants as % of Total Revenue 88% 88% 77% 81% 75% 65% 67% 68% 68% 68% 69% 73% 72% 69% 74% 74% 81% 77% 79%Tax Revenue as % of GDP 11% 12% 11% 12% 13% 12% 14% 16% 12% 15% 13% 13% 13% 18% 13% 12% 12% 9% 9%Total Expenditure and Net Lending as % of GDP 91% 83% 85% 98% 86% 82% 88% 73% 84% 82% 60% 84% 68% 60% 54% 49% 46% 47% 52%Current Expenditure as % of GDP 67% 68% 62% 55% 55% 64% 58% 60% 66% 59% 51% 46% 49% 44% 38% 44% 41% 42% 41%Capital Expenditure as % of GDP 24% 14% 23% 43% 31% 17% 14% 13% 19% 23% 9% 38% 19% 16% 16% 5% 5% 5% 11%Overall Balance as % of GDP 26% 31% 37% 6% 18% 12% -4% 3% 0% 0% 15% -4% 10% 15% 10% 22% 21% -2% -1%Current Balance as % of GDP 16% 14% 29% 16% 19% 5% -10% 2% 3% 5% 8% 12% 9% 15% 16% 14% 11% 3% 6%
Source: FSM single audits and Department of Economic Affairs estimates
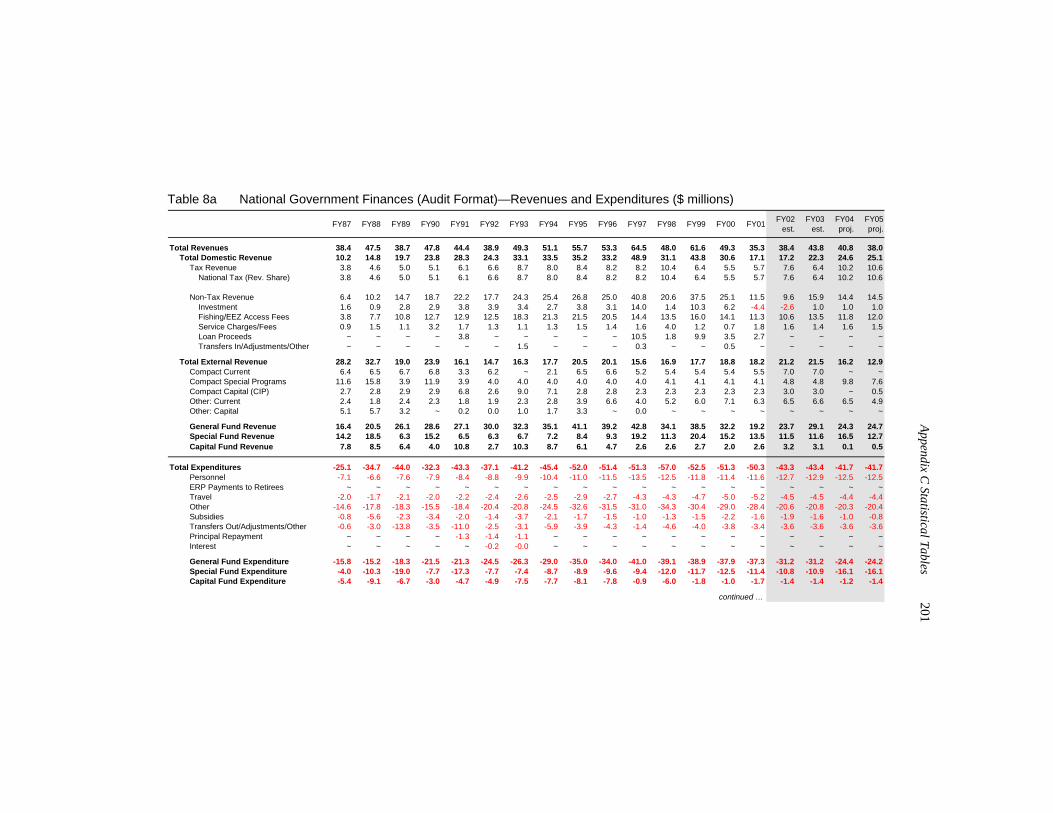
Appendix C
Statistical Tables 201
Table 8a National Government Finances (Audit Format)—Revenues and Expenditures ($ millions)
FY87 FY88 FY89 FY90 FY91 FY92 FY93 FY94 FY95 FY96 FY97 FY98 FY99 FY00 FY01 FY02est.
FY03est.
FY04proj.
FY05proj.
Total Revenues 38.4 47.5 38.7 47.8 44.4 38.9 49.3 51.1 55.7 53.3 64.5 48.0 61.6 49.3 35.3 38.4 43.8 40.8 38.0Total Domestic Revenue 10.2 14.8 19.7 23.8 28.3 24.3 33.1 33.5 35.2 33.2 48.9 31.1 43.8 30.6 17.1 17.2 22.3 24.6 25.1
Tax Revenue 3.8 4.6 5.0 5.1 6.1 6.6 8.7 8.0 8.4 8.2 8.2 10.4 6.4 5.5 5.7 7.6 6.4 10.2 10.6 National Tax (Rev. Share) 3.8 4.6 5.0 5.1 6.1 6.6 8.7 8.0 8.4 8.2 8.2 10.4 6.4 5.5 5.7 7.6 6.4 10.2 10.6
Non-Tax Revenue 6.4 10.2 14.7 18.7 22.2 17.7 24.3 25.4 26.8 25.0 40.8 20.6 37.5 25.1 11.5 9.6 15.9 14.4 14.5 Investment 1.6 0.9 2.8 2.9 3.8 3.9 3.4 2.7 3.8 3.1 14.0 1.4 10.3 6.2 -4.4 -2.6 1.0 1.0 1.0 Fishing/EEZ Access Fees 3.8 7.7 10.8 12.7 12.9 12.5 18.3 21.3 21.5 20.5 14.4 13.5 16.0 14.1 11.3 10.6 13.5 11.8 12.0 Service Charges/Fees 0.9 1.5 1.1 3.2 1.7 1.3 1.1 1.3 1.5 1.4 1.6 4.0 1.2 0.7 1.8 1.6 1.4 1.6 1.5 Loan Proceeds ~ ~ ~ ~ 3.8 ~ ~ ~ ~ ~ 10.5 1.8 9.9 3.5 2.7 ~ ~ ~ ~ Transfers In/Adjustments/Other ~ ~ ~ ~ ~ ~ 1.5 ~ ~ ~ 0.3 ~ ~ 0.5 ~ ~ ~ ~ ~
Total External Revenue 28.2 32.7 19.0 23.9 16.1 14.7 16.3 17.7 20.5 20.1 15.6 16.9 17.7 18.8 18.2 21.2 21.5 16.2 12.9Compact Current 6.4 6.5 6.7 6.8 3.3 6.2 ~ 2.1 6.5 6.6 5.2 5.4 5.4 5.4 5.5 7.0 7.0 ~ ~Compact Special Programs 11.6 15.8 3.9 11.9 3.9 4.0 4.0 4.0 4.0 4.0 4.0 4.1 4.1 4.1 4.1 4.8 4.8 9.8 7.6Compact Capital (CIP) 2.7 2.8 2.9 2.9 6.8 2.6 9.0 7.1 2.8 2.8 2.3 2.3 2.3 2.3 2.3 3.0 3.0 ~ 0.5Other: Current 2.4 1.8 2.4 2.3 1.8 1.9 2.3 2.8 3.9 6.6 4.0 5.2 6.0 7.1 6.3 6.5 6.6 6.5 4.9Other: Capital 5.1 5.7 3.2 ~ 0.2 0.0 1.0 1.7 3.3 ~ 0.0 ~ ~ ~ ~ ~ ~ ~ ~
General Fund Revenue 16.4 20.5 26.1 28.6 27.1 30.0 32.3 35.1 41.1 39.2 42.8 34.1 38.5 32.2 19.2 23.7 29.1 24.3 24.7Special Fund Revenue 14.2 18.5 6.3 15.2 6.5 6.3 6.7 7.2 8.4 9.3 19.2 11.3 20.4 15.2 13.5 11.5 11.6 16.5 12.7Capital Fund Revenue 7.8 8.5 6.4 4.0 10.8 2.7 10.3 8.7 6.1 4.7 2.6 2.6 2.7 2.0 2.6 3.2 3.1 0.1 0.5
Total Expenditures -25.1 -34.7 -44.0 -32.3 -43.3 -37.1 -41.2 -45.4 -52.0 -51.4 -51.3 -57.0 -52.5 -51.3 -50.3 -43.3 -43.4 -41.7 -41.7Personnel -7.1 -6.6 -7.6 -7.9 -8.4 -8.8 -9.9 -10.4 -11.0 -11.5 -13.5 -12.5 -11.8 -11.4 -11.6 -12.7 -12.9 -12.5 -12.5ERP Payments to Retirees ~ ~ ~ ~ ~ ~ ~ ~ ~ ~ ~ ~ ~ ~ ~ ~ ~ ~ ~Travel -2.0 -1.7 -2.1 -2.0 -2.2 -2.4 -2.6 -2.5 -2.9 -2.7 -4.3 -4.3 -4.7 -5.0 -5.2 -4.5 -4.5 -4.4 -4.4
Other -14.6 -17.8 -18.3 -15.5 -18.4 -20.4 -20.8 -24.5 -32.6 -31.5 -31.0 -34.3 -30.4 -29.0 -28.4 -20.6 -20.8 -20.3 -20.4Subsidies -0.8 -5.6 -2.3 -3.4 -2.0 -1.4 -3.7 -2.1 -1.7 -1.5 -1.0 -1.3 -1.5 -2.2 -1.6 -1.9 -1.6 -1.0 -0.8Transfers Out/Adjustments/Other -0.6 -3.0 -13.8 -3.5 -11.0 -2.5 -3.1 -5.9 -3.9 -4.3 -1.4 -4.6 -4.0 -3.8 -3.4 -3.6 -3.6 -3.6 -3.6Principal Repayment ~ ~ ~ ~ -1.3 -1.4 -1.1 ~ ~ ~ ~ ~ ~ ~ ~ ~ ~ ~ ~Interest ~ ~ ~ ~ ~ -0.2 -0.0 ~ ~ ~ ~ ~ ~ ~ ~ ~ ~ ~ ~
General Fund Expenditure -15.8 -15.2 -18.3 -21.5 -21.3 -24.5 -26.3 -29.0 -35.0 -34.0 -41.0 -39.1 -38.9 -37.9 -37.3 -31.2 -31.2 -24.4 -24.2Special Fund Expenditure -4.0 -10.3 -19.0 -7.7 -17.3 -7.7 -7.4 -8.7 -8.9 -9.6 -9.4 -12.0 -11.7 -12.5 -11.4 -10.8 -10.9 -16.1 -16.1Capital Fund Expenditure -5.4 -9.1 -6.7 -3.0 -4.7 -4.9 -7.5 -7.7 -8.1 -7.8 -0.9 -6.0 -1.8 -1.0 -1.7 -1.4 -1.4 -1.2 -1.4
continued …
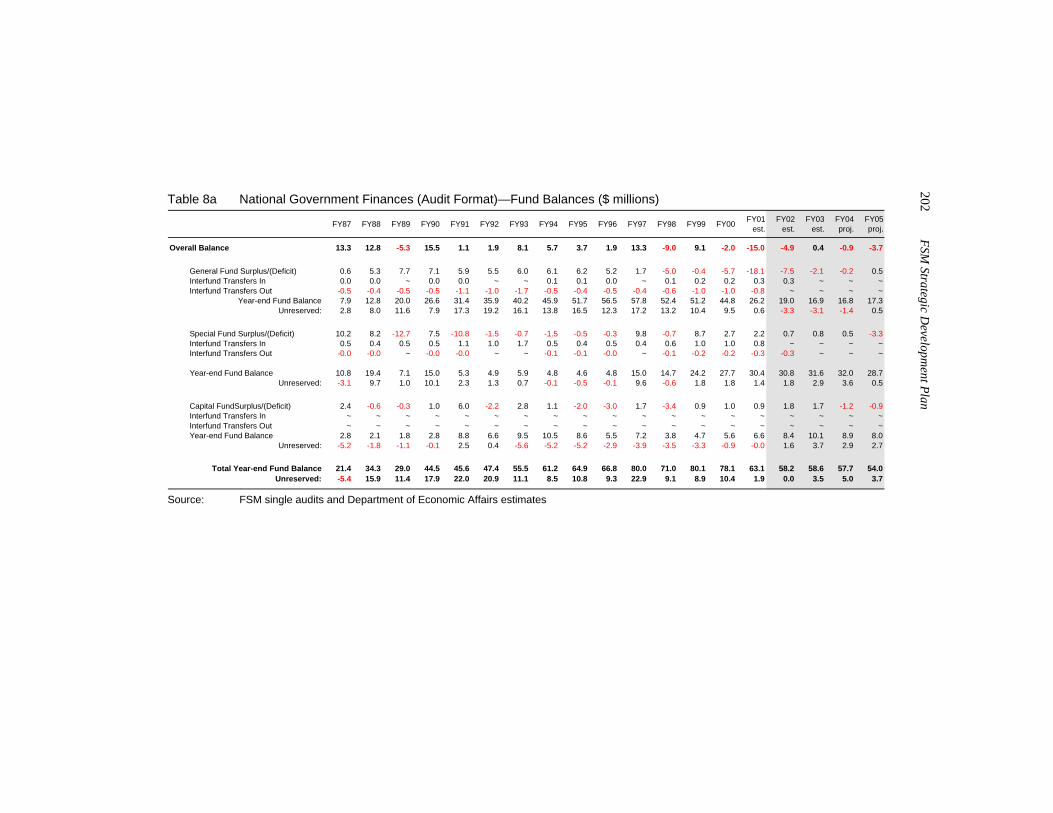
202 FSM
Strategic Developm
ent Plan
Table 8a National Government Finances (Audit Format)—Fund Balances ($ millions)
FY87 FY88 FY89 FY90 FY91 FY92 FY93 FY94 FY95 FY96 FY97 FY98 FY99 FY00 FY01est.
FY02est.
FY03est.
FY04proj.
FY05proj.
Overall Balance 13.3 12.8 -5.3 15.5 1.1 1.9 8.1 5.7 3.7 1.9 13.3 -9.0 9.1 -2.0 -15.0 -4.9 0.4 -0.9 -3.7
General Fund Surplus/(Deficit) 0.6 5.3 7.7 7.1 5.9 5.5 6.0 6.1 6.2 5.2 1.7 -5.0 -0.4 -5.7 -18.1 -7.5 -2.1 -0.2 0.5Interfund Transfers In 0.0 0.0 ~ 0.0 0.0 ~ ~ 0.1 0.1 0.0 ~ 0.1 0.2 0.2 0.3 0.3 ~ ~ ~Interfund Transfers Out -0.5 -0.4 -0.5 -0.5 -1.1 -1.0 -1.7 -0.5 -0.4 -0.5 -0.4 -0.6 -1.0 -1.0 -0.8 ~ ~ ~ ~
Year-end Fund Balance 7.9 12.8 20.0 26.6 31.4 35.9 40.2 45.9 51.7 56.5 57.8 52.4 51.2 44.8 26.2 19.0 16.9 16.8 17.3Unreserved: 2.8 8.0 11.6 7.9 17.3 19.2 16.1 13.8 16.5 12.3 17.2 13.2 10.4 9.5 0.6 -3.3 -3.1 -1.4 0.5
Special Fund Surplus/(Deficit) 10.2 8.2 -12.7 7.5 -10.8 -1.5 -0.7 -1.5 -0.5 -0.3 9.8 -0.7 8.7 2.7 2.2 0.7 0.8 0.5 -3.3Interfund Transfers In 0.5 0.4 0.5 0.5 1.1 1.0 1.7 0.5 0.4 0.5 0.4 0.6 1.0 1.0 0.8 ~ ~ ~ ~Interfund Transfers Out -0.0 -0.0 ~ -0.0 -0.0 ~ ~ -0.1 -0.1 -0.0 ~ -0.1 -0.2 -0.2 -0.3 -0.3 ~ ~ ~
Year-end Fund Balance 10.8 19.4 7.1 15.0 5.3 4.9 5.9 4.8 4.6 4.8 15.0 14.7 24.2 27.7 30.4 30.8 31.6 32.0 28.7Unreserved: -3.1 9.7 1.0 10.1 2.3 1.3 0.7 -0.1 -0.5 -0.1 9.6 -0.6 1.8 1.8 1.4 1.8 2.9 3.6 0.5
Capital FundSurplus/(Deficit) 2.4 -0.6 -0.3 1.0 6.0 -2.2 2.8 1.1 -2.0 -3.0 1.7 -3.4 0.9 1.0 0.9 1.8 1.7 -1.2 -0.9Interfund Transfers In ~ ~ ~ ~ ~ ~ ~ ~ ~ ~ ~ ~ ~ ~ ~ ~ ~ ~ ~Interfund Transfers Out ~ ~ ~ ~ ~ ~ ~ ~ ~ ~ ~ ~ ~ ~ ~ ~ ~ ~ ~Year-end Fund Balance 2.8 2.1 1.8 2.8 8.8 6.6 9.5 10.5 8.6 5.5 7.2 3.8 4.7 5.6 6.6 8.4 10.1 8.9 8.0
Unreserved: -5.2 -1.8 -1.1 -0.1 2.5 0.4 -5.6 -5.2 -5.2 -2.9 -3.9 -3.5 -3.3 -0.9 -0.0 1.6 3.7 2.9 2.7
Total Year-end Fund Balance 21.4 34.3 29.0 44.5 45.6 47.4 55.5 61.2 64.9 66.8 80.0 71.0 80.1 78.1 63.1 58.2 58.6 57.7 54.0Unreserved: -5.4 15.9 11.4 17.9 22.0 20.9 11.1 8.5 10.8 9.3 22.9 9.1 8.9 10.4 1.9 0.0 3.5 5.0 3.7
Source: FSM single audits and Department of Economic Affairs estimates
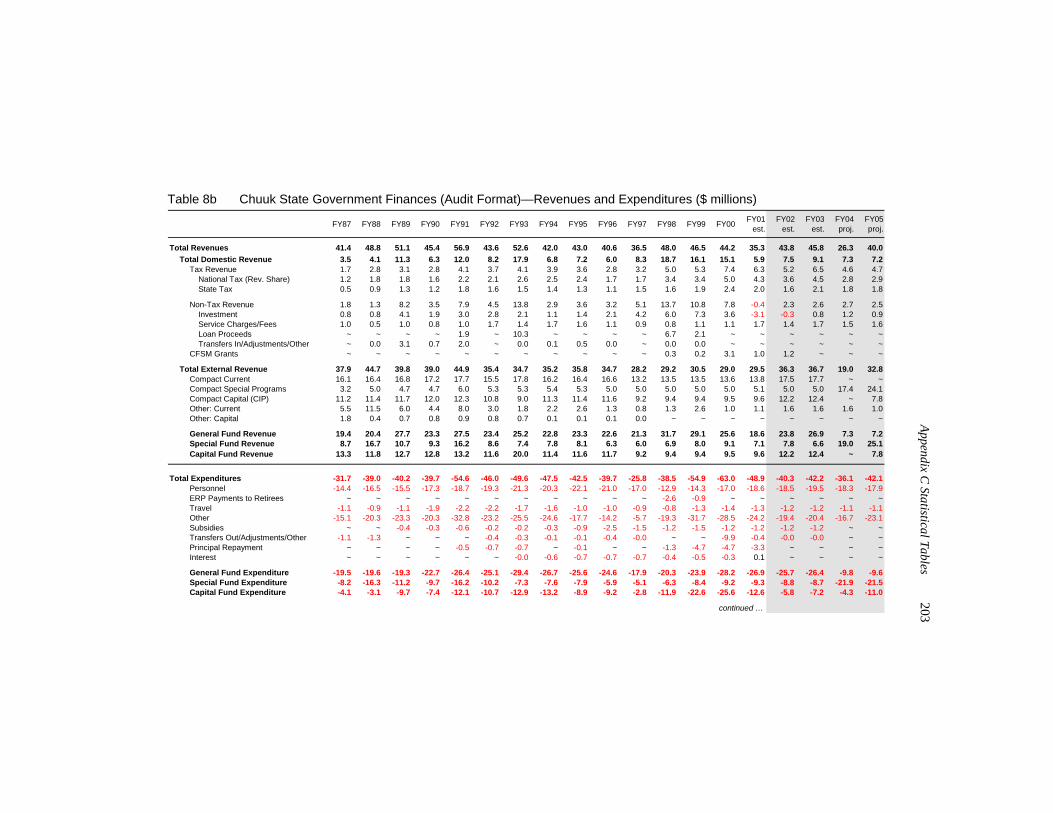
Appendix C
Statistical Tables 203
Table 8b Chuuk State Government Finances (Audit Format)—Revenues and Expenditures ($ millions)
FY87 FY88 FY89 FY90 FY91 FY92 FY93 FY94 FY95 FY96 FY97 FY98 FY99 FY00 FY01est.
FY02est.
FY03est.
FY04proj.
FY05proj.
Total Revenues 41.4 48.8 51.1 45.4 56.9 43.6 52.6 42.0 43.0 40.6 36.5 48.0 46.5 44.2 35.3 43.8 45.8 26.3 40.0Total Domestic Revenue 3.5 4.1 11.3 6.3 12.0 8.2 17.9 6.8 7.2 6.0 8.3 18.7 16.1 15.1 5.9 7.5 9.1 7.3 7.2
Tax Revenue 1.7 2.8 3.1 2.8 4.1 3.7 4.1 3.9 3.6 2.8 3.2 5.0 5.3 7.4 6.3 5.2 6.5 4.6 4.7 National Tax (Rev. Share) 1.2 1.8 1.8 1.6 2.2 2.1 2.6 2.5 2.4 1.7 1.7 3.4 3.4 5.0 4.3 3.6 4.5 2.8 2.9 State Tax 0.5 0.9 1.3 1.2 1.8 1.6 1.5 1.4 1.3 1.1 1.5 1.6 1.9 2.4 2.0 1.6 2.1 1.8 1.8
Non-Tax Revenue 1.8 1.3 8.2 3.5 7.9 4.5 13.8 2.9 3.6 3.2 5.1 13.7 10.8 7.8 -0.4 2.3 2.6 2.7 2.5 Investment 0.8 0.8 4.1 1.9 3.0 2.8 2.1 1.1 1.4 2.1 4.2 6.0 7.3 3.6 -3.1 -0.3 0.8 1.2 0.9 Service Charges/Fees 1.0 0.5 1.0 0.8 1.0 1.7 1.4 1.7 1.6 1.1 0.9 0.8 1.1 1.1 1.7 1.4 1.7 1.5 1.6 Loan Proceeds ~ ~ ~ ~ 1.9 ~ 10.3 ~ ~ ~ ~ 6.7 2.1 ~ ~ ~ ~ ~ ~ Transfers In/Adjustments/Other ~ 0.0 3.1 0.7 2.0 ~ 0.0 0.1 0.5 0.0 ~ 0.0 0.0 ~ ~ ~ ~ ~ ~CFSM Grants ~ ~ ~ ~ ~ ~ ~ ~ ~ ~ ~ 0.3 0.2 3.1 1.0 1.2 ~ ~ ~
Total External Revenue 37.9 44.7 39.8 39.0 44.9 35.4 34.7 35.2 35.8 34.7 28.2 29.2 30.5 29.0 29.5 36.3 36.7 19.0 32.8Compact Current 16.1 16.4 16.8 17.2 17.7 15.5 17.8 16.2 16.4 16.6 13.2 13.5 13.5 13.6 13.8 17.5 17.7 ~ ~Compact Special Programs 3.2 5.0 4.7 4.7 6.0 5.3 5.3 5.4 5.3 5.0 5.0 5.0 5.0 5.0 5.1 5.0 5.0 17.4 24.1Compact Capital (CIP) 11.2 11.4 11.7 12.0 12.3 10.8 9.0 11.3 11.4 11.6 9.2 9.4 9.4 9.5 9.6 12.2 12.4 ~ 7.8Other: Current 5.5 11.5 6.0 4.4 8.0 3.0 1.8 2.2 2.6 1.3 0.8 1.3 2.6 1.0 1.1 1.6 1.6 1.6 1.0Other: Capital 1.8 0.4 0.7 0.8 0.9 0.8 0.7 0.1 0.1 0.1 0.0 ~ ~ ~ ~ ~ ~ ~ ~
General Fund Revenue 19.4 20.4 27.7 23.3 27.5 23.4 25.2 22.8 23.3 22.6 21.3 31.7 29.1 25.6 18.6 23.8 26.9 7.3 7.2Special Fund Revenue 8.7 16.7 10.7 9.3 16.2 8.6 7.4 7.8 8.1 6.3 6.0 6.9 8.0 9.1 7.1 7.8 6.6 19.0 25.1Capital Fund Revenue 13.3 11.8 12.7 12.8 13.2 11.6 20.0 11.4 11.6 11.7 9.2 9.4 9.4 9.5 9.6 12.2 12.4 ~ 7.8
Total Expenditures -31.7 -39.0 -40.2 -39.7 -54.6 -46.0 -49.6 -47.5 -42.5 -39.7 -25.8 -38.5 -54.9 -63.0 -48.9 -40.3 -42.2 -36.1 -42.1Personnel -14.4 -16.5 -15.5 -17.3 -18.7 -19.3 -21.3 -20.3 -22.1 -21.0 -17.0 -12.9 -14.3 -17.0 -18.6 -18.5 -19.5 -18.3 -17.9ERP Payments to Retirees ~ ~ ~ ~ ~ ~ ~ ~ ~ ~ ~ -2.6 -0.9 ~ ~ ~ ~ ~ ~Travel -1.1 -0.9 -1.1 -1.9 -2.2 -2.2 -1.7 -1.6 -1.0 -1.0 -0.9 -0.8 -1.3 -1.4 -1.3 -1.2 -1.2 -1.1 -1.1
Other -15.1 -20.3 -23.3 -20.3 -32.8 -23.2 -25.5 -24.6 -17.7 -14.2 -5.7 -19.3 -31.7 -28.5 -24.2 -19.4 -20.4 -16.7 -23.1Subsidies ~ ~ -0.4 -0.3 -0.6 -0.2 -0.2 -0.3 -0.9 -2.5 -1.5 -1.2 -1.5 -1.2 -1.2 -1.2 -1.2 ~ ~Transfers Out/Adjustments/Other -1.1 -1.3 ~ ~ ~ -0.4 -0.3 -0.1 -0.1 -0.4 -0.0 ~ ~ -9.9 -0.4 -0.0 -0.0 ~ ~Principal Repayment ~ ~ ~ ~ -0.5 -0.7 -0.7 ~ -0.1 ~ ~ -1.3 -4.7 -4.7 -3.3 ~ ~ ~ ~Interest ~ ~ ~ ~ ~ ~ -0.0 -0.6 -0.7 -0.7 -0.7 -0.4 -0.5 -0.3 0.1 ~ ~ ~ ~
General Fund Expenditure -19.5 -19.6 -19.3 -22.7 -26.4 -25.1 -29.4 -26.7 -25.6 -24.6 -17.9 -20.3 -23.9 -28.2 -26.9 -25.7 -26.4 -9.8 -9.6Special Fund Expenditure -8.2 -16.3 -11.2 -9.7 -16.2 -10.2 -7.3 -7.6 -7.9 -5.9 -5.1 -6.3 -8.4 -9.2 -9.3 -8.8 -8.7 -21.9 -21.5Capital Fund Expenditure -4.1 -3.1 -9.7 -7.4 -12.1 -10.7 -12.9 -13.2 -8.9 -9.2 -2.8 -11.9 -22.6 -25.6 -12.6 -5.8 -7.2 -4.3 -11.0
continued …
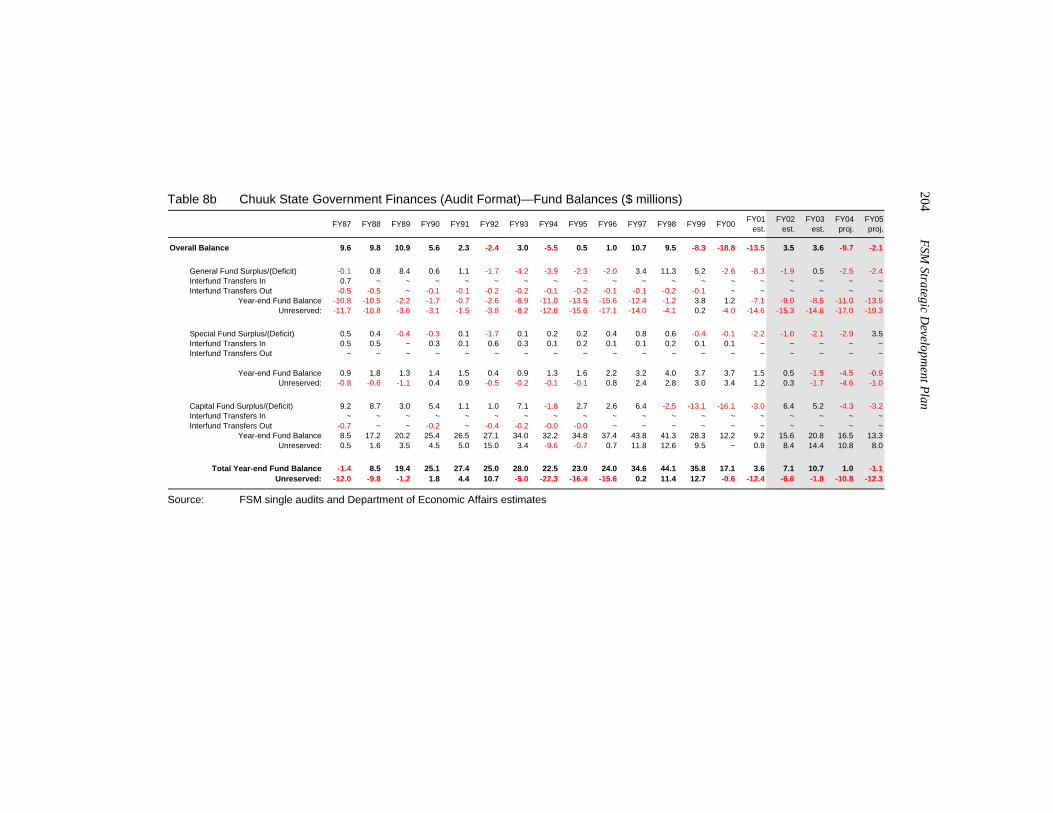
204 FSM
Strategic Developm
ent Plan
Table 8b Chuuk State Government Finances (Audit Format)—Fund Balances ($ millions)
FY87 FY88 FY89 FY90 FY91 FY92 FY93 FY94 FY95 FY96 FY97 FY98 FY99 FY00 FY01est.
FY02est.
FY03est.
FY04proj.
FY05proj.
Overall Balance 9.6 9.8 10.9 5.6 2.3 -2.4 3.0 -5.5 0.5 1.0 10.7 9.5 -8.3 -18.8 -13.5 3.5 3.6 -9.7 -2.1
General Fund Surplus/(Deficit) -0.1 0.8 8.4 0.6 1.1 -1.7 -4.2 -3.9 -2.3 -2.0 3.4 11.3 5.2 -2.6 -8.3 -1.9 0.5 -2.5 -2.4Interfund Transfers In 0.7 ~ ~ ~ ~ ~ ~ ~ ~ ~ ~ ~ ~ ~ ~ ~ ~ ~ ~Interfund Transfers Out -0.5 -0.5 ~ -0.1 -0.1 -0.2 -0.2 -0.1 -0.2 -0.1 -0.1 -0.2 -0.1 ~ ~ ~ ~ ~ ~
Year-end Fund Balance -10.8 -10.5 -2.2 -1.7 -0.7 -2.6 -6.9 -11.0 -13.5 -15.6 -12.4 -1.2 3.8 1.2 -7.1 -9.0 -8.5 -11.0 -13.5Unreserved: -11.7 -10.8 -3.6 -3.1 -1.5 -3.8 -8.2 -12.6 -15.6 -17.1 -14.0 -4.1 0.2 -4.0 -14.6 -15.3 -14.6 -17.0 -19.3
Special Fund Surplus/(Deficit) 0.5 0.4 -0.4 -0.3 0.1 -1.7 0.1 0.2 0.2 0.4 0.8 0.6 -0.4 -0.1 -2.2 -1.0 -2.1 -2.9 3.5Interfund Transfers In 0.5 0.5 ~ 0.3 0.1 0.6 0.3 0.1 0.2 0.1 0.1 0.2 0.1 0.1 ~ ~ ~ ~ ~Interfund Transfers Out ~ ~ ~ ~ ~ ~ ~ ~ ~ ~ ~ ~ ~ ~ ~ ~ ~ ~ ~
Year-end Fund Balance 0.9 1.8 1.3 1.4 1.5 0.4 0.9 1.3 1.6 2.2 3.2 4.0 3.7 3.7 1.5 0.5 -1.5 -4.5 -0.9Unreserved: -0.8 -0.6 -1.1 0.4 0.9 -0.5 -0.2 -0.1 -0.1 0.8 2.4 2.8 3.0 3.4 1.2 0.3 -1.7 -4.6 -1.0
Capital Fund Surplus/(Deficit) 9.2 8.7 3.0 5.4 1.1 1.0 7.1 -1.8 2.7 2.6 6.4 -2.5 -13.1 -16.1 -3.0 6.4 5.2 -4.3 -3.2Interfund Transfers In ~ ~ ~ ~ ~ ~ ~ ~ ~ ~ ~ ~ ~ ~ ~ ~ ~ ~ ~Interfund Transfers Out -0.7 ~ ~ -0.2 ~ -0.4 -0.2 -0.0 -0.0 ~ ~ ~ ~ ~ ~ ~ ~ ~ ~
Year-end Fund Balance 8.5 17.2 20.2 25.4 26.5 27.1 34.0 32.2 34.8 37.4 43.8 41.3 28.3 12.2 9.2 15.6 20.8 16.5 13.3Unreserved: 0.5 1.6 3.5 4.5 5.0 15.0 3.4 -9.6 -0.7 0.7 11.8 12.6 9.5 ~ 0.9 8.4 14.4 10.8 8.0
Total Year-end Fund Balance -1.4 8.5 19.4 25.1 27.4 25.0 28.0 22.5 23.0 24.0 34.6 44.1 35.8 17.1 3.6 7.1 10.7 1.0 -1.1Unreserved: -12.0 -9.8 -1.2 1.8 4.4 10.7 -5.0 -22.3 -16.4 -15.6 0.2 11.4 12.7 -0.6 -12.4 -6.6 -1.9 -10.8 -12.3
Source: FSM single audits and Department of Economic Affairs estimates
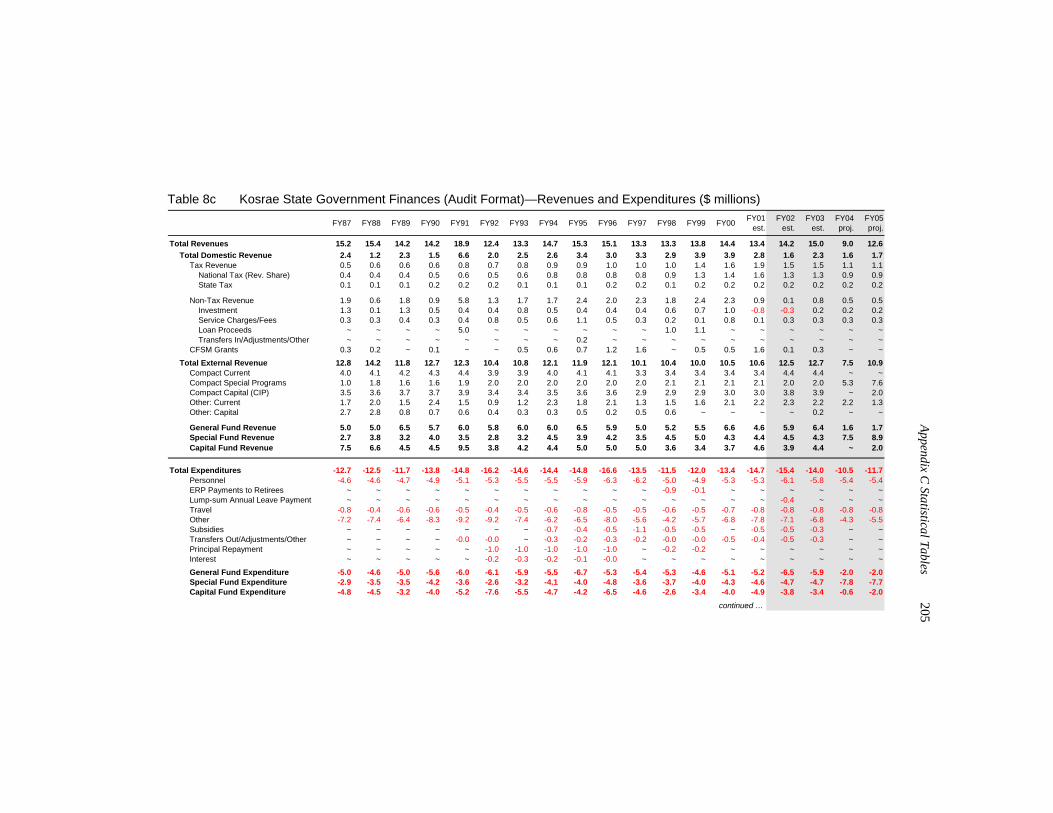
Appendix C
Statistical Tables 205
Table 8c Kosrae State Government Finances (Audit Format)—Revenues and Expenditures ($ millions)
FY87 FY88 FY89 FY90 FY91 FY92 FY93 FY94 FY95 FY96 FY97 FY98 FY99 FY00 FY01est.
FY02est.
FY03est.
FY04proj.
FY05proj.
Total Revenues 15.2 15.4 14.2 14.2 18.9 12.4 13.3 14.7 15.3 15.1 13.3 13.3 13.8 14.4 13.4 14.2 15.0 9.0 12.6Total Domestic Revenue 2.4 1.2 2.3 1.5 6.6 2.0 2.5 2.6 3.4 3.0 3.3 2.9 3.9 3.9 2.8 1.6 2.3 1.6 1.7
Tax Revenue 0.5 0.6 0.6 0.6 0.8 0.7 0.8 0.9 0.9 1.0 1.0 1.0 1.4 1.6 1.9 1.5 1.5 1.1 1.1 National Tax (Rev. Share) 0.4 0.4 0.4 0.5 0.6 0.5 0.6 0.8 0.8 0.8 0.8 0.9 1.3 1.4 1.6 1.3 1.3 0.9 0.9 State Tax 0.1 0.1 0.1 0.2 0.2 0.2 0.1 0.1 0.1 0.2 0.2 0.1 0.2 0.2 0.2 0.2 0.2 0.2 0.2
Non-Tax Revenue 1.9 0.6 1.8 0.9 5.8 1.3 1.7 1.7 2.4 2.0 2.3 1.8 2.4 2.3 0.9 0.1 0.8 0.5 0.5 Investment 1.3 0.1 1.3 0.5 0.4 0.4 0.8 0.5 0.4 0.4 0.4 0.6 0.7 1.0 -0.8 -0.3 0.2 0.2 0.2 Service Charges/Fees 0.3 0.3 0.4 0.3 0.4 0.8 0.5 0.6 1.1 0.5 0.3 0.2 0.1 0.8 0.1 0.3 0.3 0.3 0.3 Loan Proceeds ~ ~ ~ ~ 5.0 ~ ~ ~ ~ ~ ~ 1.0 1.1 ~ ~ ~ ~ ~ ~ Transfers In/Adjustments/Other ~ ~ ~ ~ ~ ~ ~ ~ 0.2 ~ ~ ~ ~ ~ ~ ~ ~ ~ ~CFSM Grants 0.3 0.2 ~ 0.1 ~ ~ 0.5 0.6 0.7 1.2 1.6 ~ 0.5 0.5 1.6 0.1 0.3 ~ ~
Total External Revenue 12.8 14.2 11.8 12.7 12.3 10.4 10.8 12.1 11.9 12.1 10.1 10.4 10.0 10.5 10.6 12.5 12.7 7.5 10.9Compact Current 4.0 4.1 4.2 4.3 4.4 3.9 3.9 4.0 4.1 4.1 3.3 3.4 3.4 3.4 3.4 4.4 4.4 ~ ~Compact Special Programs 1.0 1.8 1.6 1.6 1.9 2.0 2.0 2.0 2.0 2.0 2.0 2.1 2.1 2.1 2.1 2.0 2.0 5.3 7.6Compact Capital (CIP) 3.5 3.6 3.7 3.7 3.9 3.4 3.4 3.5 3.6 3.6 2.9 2.9 2.9 3.0 3.0 3.8 3.9 ~ 2.0Other: Current 1.7 2.0 1.5 2.4 1.5 0.9 1.2 2.3 1.8 2.1 1.3 1.5 1.6 2.1 2.2 2.3 2.2 2.2 1.3Other: Capital 2.7 2.8 0.8 0.7 0.6 0.4 0.3 0.3 0.5 0.2 0.5 0.6 ~ ~ ~ ~ 0.2 ~ ~
General Fund Revenue 5.0 5.0 6.5 5.7 6.0 5.8 6.0 6.0 6.5 5.9 5.0 5.2 5.5 6.6 4.6 5.9 6.4 1.6 1.7Special Fund Revenue 2.7 3.8 3.2 4.0 3.5 2.8 3.2 4.5 3.9 4.2 3.5 4.5 5.0 4.3 4.4 4.5 4.3 7.5 8.9Capital Fund Revenue 7.5 6.6 4.5 4.5 9.5 3.8 4.2 4.4 5.0 5.0 5.0 3.6 3.4 3.7 4.6 3.9 4.4 ~ 2.0
Total Expenditures -12.7 -12.5 -11.7 -13.8 -14.8 -16.2 -14.6 -14.4 -14.8 -16.6 -13.5 -11.5 -12.0 -13.4 -14.7 -15.4 -14.0 -10.5 -11.7Personnel -4.6 -4.6 -4.7 -4.9 -5.1 -5.3 -5.5 -5.5 -5.9 -6.3 -6.2 -5.0 -4.9 -5.3 -5.3 -6.1 -5.8 -5.4 -5.4ERP Payments to Retirees ~ ~ ~ ~ ~ ~ ~ ~ ~ ~ ~ -0.9 -0.1 ~ ~ ~ ~ ~ ~Lump-sum Annual Leave Payment ~ ~ ~ ~ ~ ~ ~ ~ ~ ~ ~ ~ ~ ~ ~ -0.4 ~ ~ ~Travel -0.8 -0.4 -0.6 -0.6 -0.5 -0.4 -0.5 -0.6 -0.8 -0.5 -0.5 -0.6 -0.5 -0.7 -0.8 -0.8 -0.8 -0.8 -0.8
Other -7.2 -7.4 -6.4 -8.3 -9.2 -9.2 -7.4 -6.2 -6.5 -8.0 -5.6 -4.2 -5.7 -6.8 -7.8 -7.1 -6.8 -4.3 -5.5Subsidies ~ ~ ~ ~ ~ ~ ~ -0.7 -0.4 -0.5 -1.1 -0.5 -0.5 ~ -0.5 -0.5 -0.3 ~ ~Transfers Out/Adjustments/Other ~ ~ ~ ~ -0.0 -0.0 ~ -0.3 -0.2 -0.3 -0.2 -0.0 -0.0 -0.5 -0.4 -0.5 -0.3 ~ ~Principal Repayment ~ ~ ~ ~ ~ -1.0 -1.0 -1.0 -1.0 -1.0 ~ -0.2 -0.2 ~ ~ ~ ~ ~ ~Interest ~ ~ ~ ~ ~ -0.2 -0.3 -0.2 -0.1 -0.0 ~ ~ ~ ~ ~ ~ ~ ~ ~
General Fund Expenditure -5.0 -4.6 -5.0 -5.6 -6.0 -6.1 -5.9 -5.5 -6.7 -5.3 -5.4 -5.3 -4.6 -5.1 -5.2 -6.5 -5.9 -2.0 -2.0Special Fund Expenditure -2.9 -3.5 -3.5 -4.2 -3.6 -2.6 -3.2 -4.1 -4.0 -4.8 -3.6 -3.7 -4.0 -4.3 -4.6 -4.7 -4.7 -7.8 -7.7Capital Fund Expenditure -4.8 -4.5 -3.2 -4.0 -5.2 -7.6 -5.5 -4.7 -4.2 -6.5 -4.6 -2.6 -3.4 -4.0 -4.9 -3.8 -3.4 -0.6 -2.0
continued …
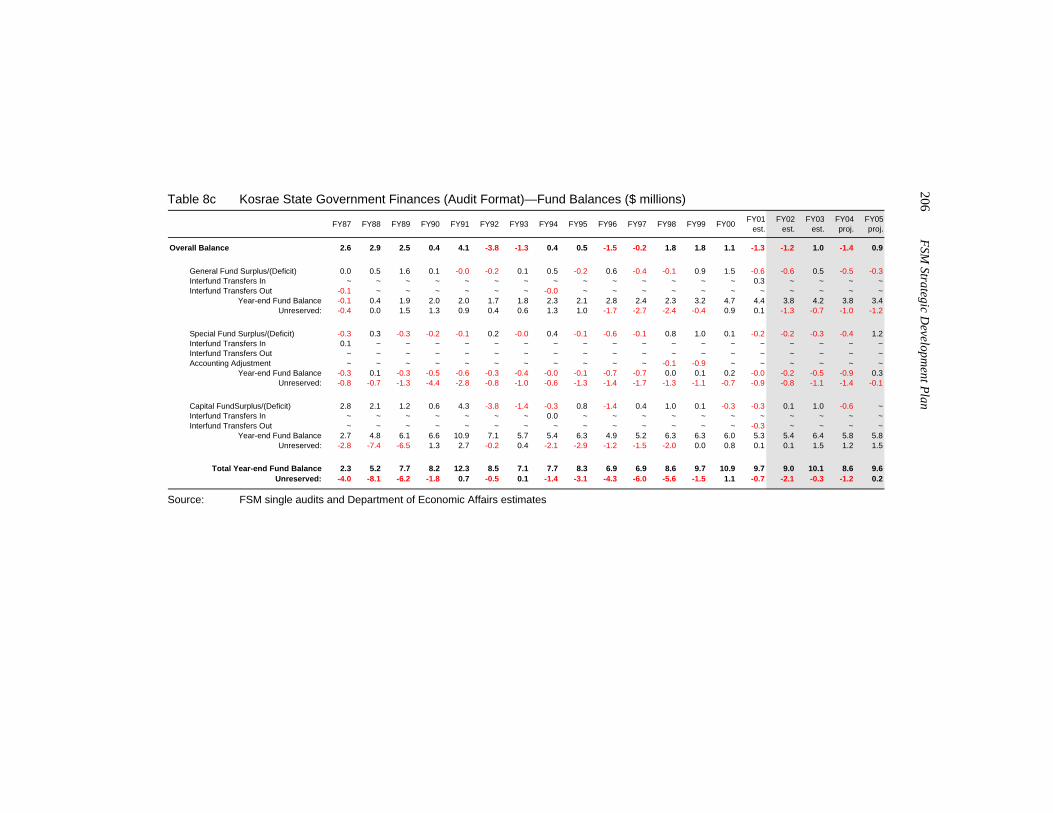
206 FSM
Strategic Developm
ent Plan
Table 8c Kosrae State Government Finances (Audit Format)—Fund Balances ($ millions)
FY87 FY88 FY89 FY90 FY91 FY92 FY93 FY94 FY95 FY96 FY97 FY98 FY99 FY00 FY01est.
FY02est.
FY03est.
FY04proj.
FY05proj.
Overall Balance 2.6 2.9 2.5 0.4 4.1 -3.8 -1.3 0.4 0.5 -1.5 -0.2 1.8 1.8 1.1 -1.3 -1.2 1.0 -1.4 0.9
General Fund Surplus/(Deficit) 0.0 0.5 1.6 0.1 -0.0 -0.2 0.1 0.5 -0.2 0.6 -0.4 -0.1 0.9 1.5 -0.6 -0.6 0.5 -0.5 -0.3Interfund Transfers In ~ ~ ~ ~ ~ ~ ~ ~ ~ ~ ~ ~ ~ ~ 0.3 ~ ~ ~ ~Interfund Transfers Out -0.1 ~ ~ ~ ~ ~ ~ -0.0 ~ ~ ~ ~ ~ ~ ~ ~ ~ ~ ~
Year-end Fund Balance -0.1 0.4 1.9 2.0 2.0 1.7 1.8 2.3 2.1 2.8 2.4 2.3 3.2 4.7 4.4 3.8 4.2 3.8 3.4Unreserved: -0.4 0.0 1.5 1.3 0.9 0.4 0.6 1.3 1.0 -1.7 -2.7 -2.4 -0.4 0.9 0.1 -1.3 -0.7 -1.0 -1.2
Special Fund Surplus/(Deficit) -0.3 0.3 -0.3 -0.2 -0.1 0.2 -0.0 0.4 -0.1 -0.6 -0.1 0.8 1.0 0.1 -0.2 -0.2 -0.3 -0.4 1.2Interfund Transfers In 0.1 ~ ~ ~ ~ ~ ~ ~ ~ ~ ~ ~ ~ ~ ~ ~ ~ ~ ~Interfund Transfers Out ~ ~ ~ ~ ~ ~ ~ ~ ~ ~ ~ ~ ~ ~ ~ ~ ~ ~ ~Accounting Adjustment ~ ~ ~ ~ ~ ~ ~ ~ ~ ~ ~ -0.1 -0.9 ~ ~ ~ ~ ~ ~
Year-end Fund Balance -0.3 0.1 -0.3 -0.5 -0.6 -0.3 -0.4 -0.0 -0.1 -0.7 -0.7 0.0 0.1 0.2 -0.0 -0.2 -0.5 -0.9 0.3Unreserved: -0.8 -0.7 -1.3 -4.4 -2.8 -0.8 -1.0 -0.6 -1.3 -1.4 -1.7 -1.3 -1.1 -0.7 -0.9 -0.8 -1.1 -1.4 -0.1
Capital FundSurplus/(Deficit) 2.8 2.1 1.2 0.6 4.3 -3.8 -1.4 -0.3 0.8 -1.4 0.4 1.0 0.1 -0.3 -0.3 0.1 1.0 -0.6 ~Interfund Transfers In ~ ~ ~ ~ ~ ~ ~ 0.0 ~ ~ ~ ~ ~ ~ ~ ~ ~ ~ ~Interfund Transfers Out ~ ~ ~ ~ ~ ~ ~ ~ ~ ~ ~ ~ ~ ~ -0.3 ~ ~ ~ ~
Year-end Fund Balance 2.7 4.8 6.1 6.6 10.9 7.1 5.7 5.4 6.3 4.9 5.2 6.3 6.3 6.0 5.3 5.4 6.4 5.8 5.8Unreserved: -2.8 -7.4 -6.5 1.3 2.7 -0.2 0.4 -2.1 -2.9 -1.2 -1.5 -2.0 0.0 0.8 0.1 0.1 1.5 1.2 1.5
Total Year-end Fund Balance 2.3 5.2 7.7 8.2 12.3 8.5 7.1 7.7 8.3 6.9 6.9 8.6 9.7 10.9 9.7 9.0 10.1 8.6 9.6Unreserved: -4.0 -8.1 -6.2 -1.8 0.7 -0.5 0.1 -1.4 -3.1 -4.3 -6.0 -5.6 -1.5 1.1 -0.7 -2.1 -0.3 -1.2 0.2
Source: FSM single audits and Department of Economic Affairs estimates
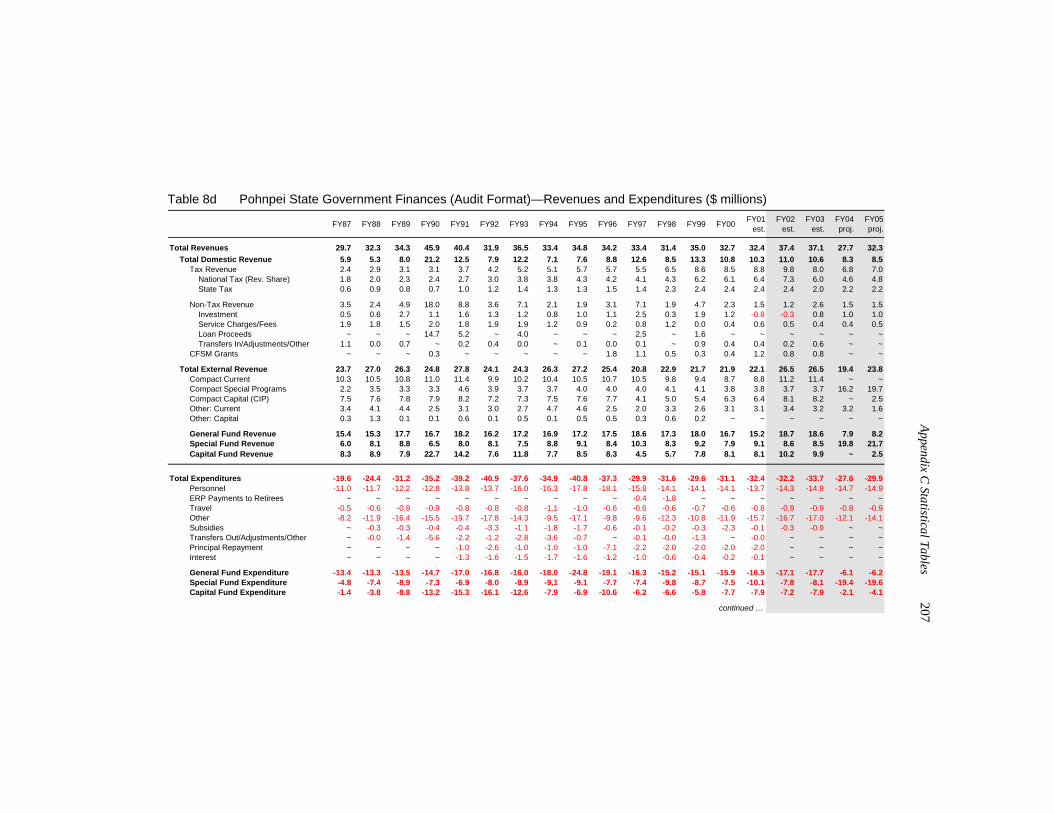
Appendix C
Statistical Tables 207
Table 8d Pohnpei State Government Finances (Audit Format)—Revenues and Expenditures ($ millions)
FY87 FY88 FY89 FY90 FY91 FY92 FY93 FY94 FY95 FY96 FY97 FY98 FY99 FY00 FY01est.
FY02est.
FY03est.
FY04proj.
FY05proj.
Total Revenues 29.7 32.3 34.3 45.9 40.4 31.9 36.5 33.4 34.8 34.2 33.4 31.4 35.0 32.7 32.4 37.4 37.1 27.7 32.3Total Domestic Revenue 5.9 5.3 8.0 21.2 12.5 7.9 12.2 7.1 7.6 8.8 12.6 8.5 13.3 10.8 10.3 11.0 10.6 8.3 8.5
Tax Revenue 2.4 2.9 3.1 3.1 3.7 4.2 5.2 5.1 5.7 5.7 5.5 6.5 8.6 8.5 8.8 9.8 8.0 6.8 7.0 National Tax (Rev. Share) 1.8 2.0 2.3 2.4 2.7 3.0 3.8 3.8 4.3 4.2 4.1 4.3 6.2 6.1 6.4 7.3 6.0 4.6 4.8 State Tax 0.6 0.9 0.8 0.7 1.0 1.2 1.4 1.3 1.3 1.5 1.4 2.3 2.4 2.4 2.4 2.4 2.0 2.2 2.2
Non-Tax Revenue 3.5 2.4 4.9 18.0 8.8 3.6 7.1 2.1 1.9 3.1 7.1 1.9 4.7 2.3 1.5 1.2 2.6 1.5 1.5 Investment 0.5 0.6 2.7 1.1 1.6 1.3 1.2 0.8 1.0 1.1 2.5 0.3 1.9 1.2 -0.8 -0.3 0.8 1.0 1.0 Service Charges/Fees 1.9 1.8 1.5 2.0 1.8 1.9 1.9 1.2 0.9 0.2 0.8 1.2 0.0 0.4 0.6 0.5 0.4 0.4 0.5 Loan Proceeds ~ ~ ~ 14.7 5.2 ~ 4.0 ~ ~ ~ 2.5 ~ 1.6 ~ ~ ~ ~ ~ ~ Transfers In/Adjustments/Other 1.1 0.0 0.7 ~ 0.2 0.4 0.0 ~ 0.1 0.0 0.1 ~ 0.9 0.4 0.4 0.2 0.6 ~ ~CFSM Grants ~ ~ ~ 0.3 ~ ~ ~ ~ ~ 1.8 1.1 0.5 0.3 0.4 1.2 0.8 0.8 ~ ~
Total External Revenue 23.7 27.0 26.3 24.8 27.8 24.1 24.3 26.3 27.2 25.4 20.8 22.9 21.7 21.9 22.1 26.5 26.5 19.4 23.8Compact Current 10.3 10.5 10.8 11.0 11.4 9.9 10.2 10.4 10.5 10.7 10.5 9.8 9.4 8.7 8.8 11.2 11.4 ~ ~Compact Special Programs 2.2 3.5 3.3 3.3 4.6 3.9 3.7 3.7 4.0 4.0 4.0 4.1 4.1 3.8 3.8 3.7 3.7 16.2 19.7Compact Capital (CIP) 7.5 7.6 7.8 7.9 8.2 7.2 7.3 7.5 7.6 7.7 4.1 5.0 5.4 6.3 6.4 8.1 8.2 ~ 2.5Other: Current 3.4 4.1 4.4 2.5 3.1 3.0 2.7 4.7 4.6 2.5 2.0 3.3 2.6 3.1 3.1 3.4 3.2 3.2 1.6Other: Capital 0.3 1.3 0.1 0.1 0.6 0.1 0.5 0.1 0.5 0.5 0.3 0.6 0.2 ~ ~ ~ ~ ~ ~
General Fund Revenue 15.4 15.3 17.7 16.7 18.2 16.2 17.2 16.9 17.2 17.5 18.6 17.3 18.0 16.7 15.2 18.7 18.6 7.9 8.2Special Fund Revenue 6.0 8.1 8.8 6.5 8.0 8.1 7.5 8.8 9.1 8.4 10.3 8.3 9.2 7.9 9.1 8.6 8.5 19.8 21.7Capital Fund Revenue 8.3 8.9 7.9 22.7 14.2 7.6 11.8 7.7 8.5 8.3 4.5 5.7 7.8 8.1 8.1 10.2 9.9 ~ 2.5
Total Expenditures -19.6 -24.4 -31.2 -35.2 -39.2 -40.9 -37.6 -34.9 -40.8 -37.3 -29.9 -31.6 -29.6 -31.1 -32.4 -32.2 -33.7 -27.6 -29.9Personnel -11.0 -11.7 -12.2 -12.8 -13.8 -13.7 -16.0 -16.3 -17.8 -18.1 -15.8 -14.1 -14.1 -14.1 -13.7 -14.3 -14.9 -14.7 -14.9ERP Payments to Retirees ~ ~ ~ ~ ~ ~ ~ ~ ~ ~ -0.4 -1.8 ~ ~ ~ ~ ~ ~ ~Travel -0.5 -0.6 -0.9 -0.9 -0.8 -0.8 -0.8 -1.1 -1.0 -0.6 -0.6 -0.6 -0.7 -0.6 -0.8 -0.9 -0.9 -0.8 -0.9
Other -8.2 -11.9 -16.4 -15.5 -19.7 -17.8 -14.3 -9.5 -17.1 -9.8 -9.6 -12.3 -10.8 -11.9 -15.7 -16.7 -17.0 -12.1 -14.1Subsidies ~ -0.3 -0.3 -0.4 -0.4 -3.3 -1.1 -1.8 -1.7 -0.6 -0.1 -0.2 -0.3 -2.3 -0.1 -0.3 -0.9 ~ ~Transfers Out/Adjustments/Other ~ -0.0 -1.4 -5.6 -2.2 -1.2 -2.8 -3.6 -0.7 ~ -0.1 -0.0 -1.3 ~ -0.0 ~ ~ ~ ~Principal Repayment ~ ~ ~ ~ -1.0 -2.6 -1.0 -1.0 -1.0 -7.1 -2.2 -2.0 -2.0 -2.0 -2.0 ~ ~ ~ ~Interest ~ ~ ~ ~ -1.3 -1.6 -1.5 -1.7 -1.6 -1.2 -1.0 -0.6 -0.4 -0.2 -0.1 ~ ~ ~ ~
General Fund Expenditure -13.4 -13.3 -13.5 -14.7 -17.0 -16.8 -16.0 -18.0 -24.8 -19.1 -16.3 -15.2 -15.1 -15.9 -16.5 -17.1 -17.7 -6.1 -6.2Special Fund Expenditure -4.8 -7.4 -8.9 -7.3 -6.9 -8.0 -8.9 -9.1 -9.1 -7.7 -7.4 -9.8 -8.7 -7.5 -10.1 -7.8 -8.1 -19.4 -19.6Capital Fund Expenditure -1.4 -3.8 -8.8 -13.2 -15.3 -16.1 -12.6 -7.9 -6.9 -10.6 -6.2 -6.6 -5.8 -7.7 -7.9 -7.2 -7.9 -2.1 -4.1
continued …
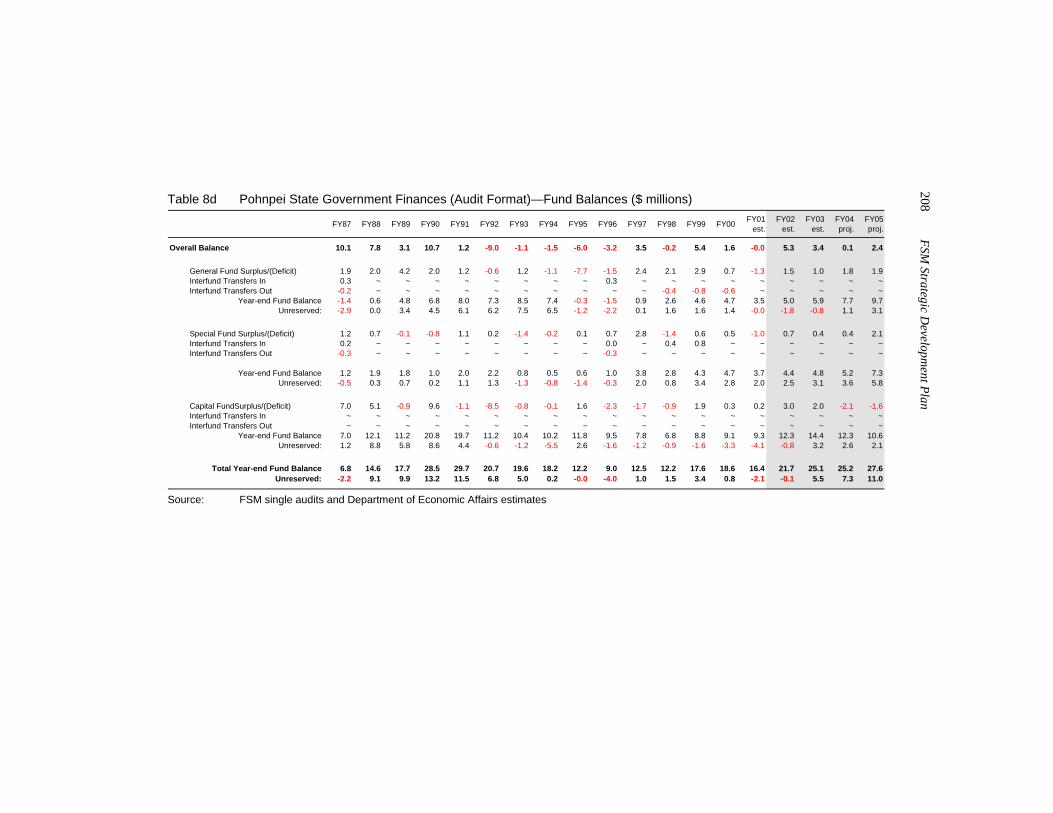
208 FSM
Strategic Developm
ent Plan
Table 8d Pohnpei State Government Finances (Audit Format)—Fund Balances ($ millions)
FY87 FY88 FY89 FY90 FY91 FY92 FY93 FY94 FY95 FY96 FY97 FY98 FY99 FY00 FY01est.
FY02est.
FY03est.
FY04proj.
FY05proj.
Overall Balance 10.1 7.8 3.1 10.7 1.2 -9.0 -1.1 -1.5 -6.0 -3.2 3.5 -0.2 5.4 1.6 -0.0 5.3 3.4 0.1 2.4
General Fund Surplus/(Deficit) 1.9 2.0 4.2 2.0 1.2 -0.6 1.2 -1.1 -7.7 -1.5 2.4 2.1 2.9 0.7 -1.3 1.5 1.0 1.8 1.9Interfund Transfers In 0.3 ~ ~ ~ ~ ~ ~ ~ ~ 0.3 ~ ~ ~ ~ ~ ~ ~ ~ ~Interfund Transfers Out -0.2 ~ ~ ~ ~ ~ ~ ~ ~ ~ ~ -0.4 -0.8 -0.6 ~ ~ ~ ~ ~
Year-end Fund Balance -1.4 0.6 4.8 6.8 8.0 7.3 8.5 7.4 -0.3 -1.5 0.9 2.6 4.6 4.7 3.5 5.0 5.9 7.7 9.7Unreserved: -2.9 0.0 3.4 4.5 6.1 6.2 7.5 6.5 -1.2 -2.2 0.1 1.6 1.6 1.4 -0.0 -1.8 -0.8 1.1 3.1
Special Fund Surplus/(Deficit) 1.2 0.7 -0.1 -0.8 1.1 0.2 -1.4 -0.2 0.1 0.7 2.8 -1.4 0.6 0.5 -1.0 0.7 0.4 0.4 2.1Interfund Transfers In 0.2 ~ ~ ~ ~ ~ ~ ~ ~ 0.0 ~ 0.4 0.8 ~ ~ ~ ~ ~ ~Interfund Transfers Out -0.3 ~ ~ ~ ~ ~ ~ ~ ~ -0.3 ~ ~ ~ ~ ~ ~ ~ ~ ~
Year-end Fund Balance 1.2 1.9 1.8 1.0 2.0 2.2 0.8 0.5 0.6 1.0 3.8 2.8 4.3 4.7 3.7 4.4 4.8 5.2 7.3Unreserved: -0.5 0.3 0.7 0.2 1.1 1.3 -1.3 -0.8 -1.4 -0.3 2.0 0.8 3.4 2.8 2.0 2.5 3.1 3.6 5.8
Capital FundSurplus/(Deficit) 7.0 5.1 -0.9 9.6 -1.1 -8.5 -0.8 -0.1 1.6 -2.3 -1.7 -0.9 1.9 0.3 0.2 3.0 2.0 -2.1 -1.6Interfund Transfers In ~ ~ ~ ~ ~ ~ ~ ~ ~ ~ ~ ~ ~ ~ ~ ~ ~ ~ ~Interfund Transfers Out ~ ~ ~ ~ ~ ~ ~ ~ ~ ~ ~ ~ ~ ~ ~ ~ ~ ~ ~
Year-end Fund Balance 7.0 12.1 11.2 20.8 19.7 11.2 10.4 10.2 11.8 9.5 7.8 6.8 8.8 9.1 9.3 12.3 14.4 12.3 10.6Unreserved: 1.2 8.8 5.8 8.6 4.4 -0.6 -1.2 -5.5 2.6 -1.6 -1.2 -0.9 -1.6 -3.3 -4.1 -0.8 3.2 2.6 2.1
Total Year-end Fund Balance 6.8 14.6 17.7 28.5 29.7 20.7 19.6 18.2 12.2 9.0 12.5 12.2 17.6 18.6 16.4 21.7 25.1 25.2 27.6Unreserved: -2.2 9.1 9.9 13.2 11.5 6.8 5.0 0.2 -0.0 -4.0 1.0 1.5 3.4 0.8 -2.1 -0.1 5.5 7.3 11.0
Source: FSM single audits and Department of Economic Affairs estimates
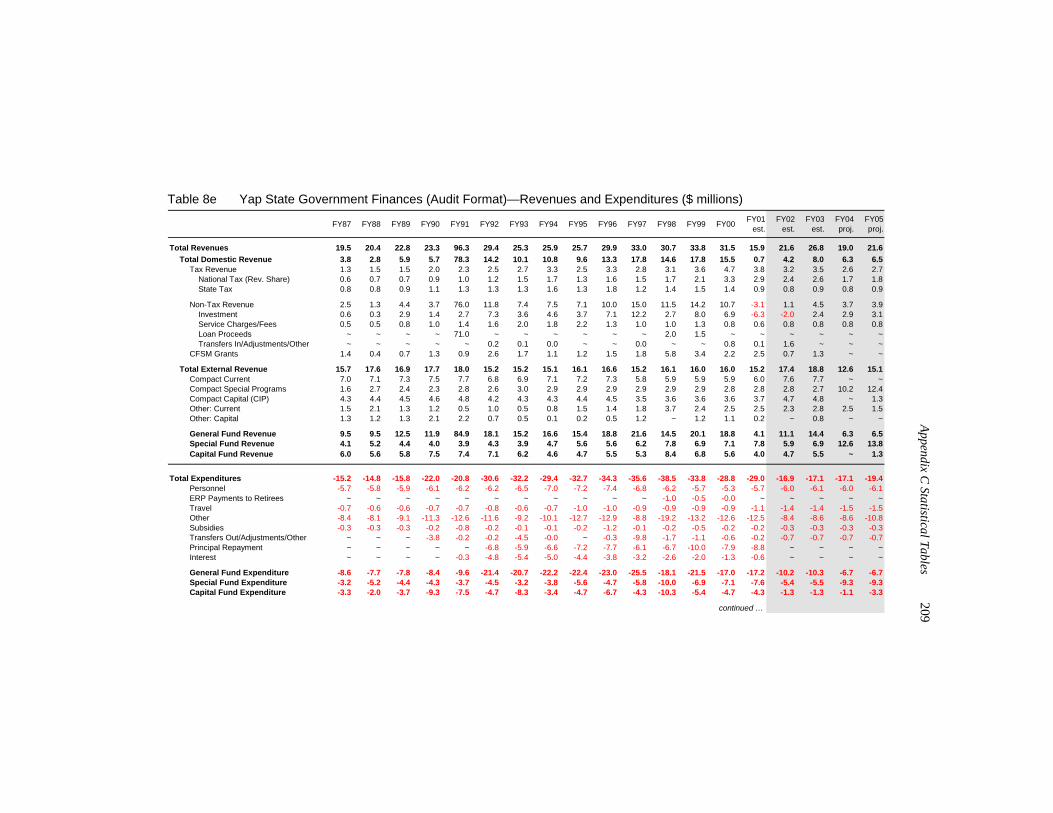
Appendix C
Statistical Tables 209
Table 8e Yap State Government Finances (Audit Format)—Revenues and Expenditures ($ millions)
FY87 FY88 FY89 FY90 FY91 FY92 FY93 FY94 FY95 FY96 FY97 FY98 FY99 FY00 FY01est.
FY02est.
FY03est.
FY04proj.
FY05proj.
Total Revenues 19.5 20.4 22.8 23.3 96.3 29.4 25.3 25.9 25.7 29.9 33.0 30.7 33.8 31.5 15.9 21.6 26.8 19.0 21.6Total Domestic Revenue 3.8 2.8 5.9 5.7 78.3 14.2 10.1 10.8 9.6 13.3 17.8 14.6 17.8 15.5 0.7 4.2 8.0 6.3 6.5
Tax Revenue 1.3 1.5 1.5 2.0 2.3 2.5 2.7 3.3 2.5 3.3 2.8 3.1 3.6 4.7 3.8 3.2 3.5 2.6 2.7 National Tax (Rev. Share) 0.6 0.7 0.7 0.9 1.0 1.2 1.5 1.7 1.3 1.6 1.5 1.7 2.1 3.3 2.9 2.4 2.6 1.7 1.8 State Tax 0.8 0.8 0.9 1.1 1.3 1.3 1.3 1.6 1.3 1.8 1.2 1.4 1.5 1.4 0.9 0.8 0.9 0.8 0.9
Non-Tax Revenue 2.5 1.3 4.4 3.7 76.0 11.8 7.4 7.5 7.1 10.0 15.0 11.5 14.2 10.7 -3.1 1.1 4.5 3.7 3.9 Investment 0.6 0.3 2.9 1.4 2.7 7.3 3.6 4.6 3.7 7.1 12.2 2.7 8.0 6.9 -6.3 -2.0 2.4 2.9 3.1 Service Charges/Fees 0.5 0.5 0.8 1.0 1.4 1.6 2.0 1.8 2.2 1.3 1.0 1.0 1.3 0.8 0.6 0.8 0.8 0.8 0.8 Loan Proceeds ~ ~ ~ ~ 71.0 ~ ~ ~ ~ ~ ~ 2.0 1.5 ~ ~ ~ ~ ~ ~ Transfers In/Adjustments/Other ~ ~ ~ ~ ~ 0.2 0.1 0.0 ~ ~ 0.0 ~ ~ 0.8 0.1 1.6 ~ ~ ~CFSM Grants 1.4 0.4 0.7 1.3 0.9 2.6 1.7 1.1 1.2 1.5 1.8 5.8 3.4 2.2 2.5 0.7 1.3 ~ ~
Total External Revenue 15.7 17.6 16.9 17.7 18.0 15.2 15.2 15.1 16.1 16.6 15.2 16.1 16.0 16.0 15.2 17.4 18.8 12.6 15.1Compact Current 7.0 7.1 7.3 7.5 7.7 6.8 6.9 7.1 7.2 7.3 5.8 5.9 5.9 5.9 6.0 7.6 7.7 ~ ~Compact Special Programs 1.6 2.7 2.4 2.3 2.8 2.6 3.0 2.9 2.9 2.9 2.9 2.9 2.9 2.8 2.8 2.8 2.7 10.2 12.4Compact Capital (CIP) 4.3 4.4 4.5 4.6 4.8 4.2 4.3 4.3 4.4 4.5 3.5 3.6 3.6 3.6 3.7 4.7 4.8 ~ 1.3Other: Current 1.5 2.1 1.3 1.2 0.5 1.0 0.5 0.8 1.5 1.4 1.8 3.7 2.4 2.5 2.5 2.3 2.8 2.5 1.5Other: Capital 1.3 1.2 1.3 2.1 2.2 0.7 0.5 0.1 0.2 0.5 1.2 ~ 1.2 1.1 0.2 ~ 0.8 ~ ~
General Fund Revenue 9.5 9.5 12.5 11.9 84.9 18.1 15.2 16.6 15.4 18.8 21.6 14.5 20.1 18.8 4.1 11.1 14.4 6.3 6.5Special Fund Revenue 4.1 5.2 4.4 4.0 3.9 4.3 3.9 4.7 5.6 5.6 6.2 7.8 6.9 7.1 7.8 5.9 6.9 12.6 13.8Capital Fund Revenue 6.0 5.6 5.8 7.5 7.4 7.1 6.2 4.6 4.7 5.5 5.3 8.4 6.8 5.6 4.0 4.7 5.5 ~ 1.3
Total Expenditures -15.2 -14.8 -15.8 -22.0 -20.8 -30.6 -32.2 -29.4 -32.7 -34.3 -35.6 -38.5 -33.8 -28.8 -29.0 -16.9 -17.1 -17.1 -19.4Personnel -5.7 -5.8 -5.9 -6.1 -6.2 -6.2 -6.5 -7.0 -7.2 -7.4 -6.8 -6.2 -5.7 -5.3 -5.7 -6.0 -6.1 -6.0 -6.1ERP Payments to Retirees ~ ~ ~ ~ ~ ~ ~ ~ ~ ~ ~ -1.0 -0.5 -0.0 ~ ~ ~ ~ ~Travel -0.7 -0.6 -0.6 -0.7 -0.7 -0.8 -0.6 -0.7 -1.0 -1.0 -0.9 -0.9 -0.9 -0.9 -1.1 -1.4 -1.4 -1.5 -1.5
Other -8.4 -8.1 -9.1 -11.3 -12.6 -11.6 -9.2 -10.1 -12.7 -12.9 -8.8 -19.2 -13.2 -12.6 -12.5 -8.4 -8.6 -8.6 -10.8Subsidies -0.3 -0.3 -0.3 -0.2 -0.8 -0.2 -0.1 -0.1 -0.2 -1.2 -0.1 -0.2 -0.5 -0.2 -0.2 -0.3 -0.3 -0.3 -0.3Transfers Out/Adjustments/Other ~ ~ ~ -3.8 -0.2 -0.2 -4.5 -0.0 ~ -0.3 -9.8 -1.7 -1.1 -0.6 -0.2 -0.7 -0.7 -0.7 -0.7Principal Repayment ~ ~ ~ ~ ~ -6.8 -5.9 -6.6 -7.2 -7.7 -6.1 -6.7 -10.0 -7.9 -8.8 ~ ~ ~ ~Interest ~ ~ ~ ~ -0.3 -4.8 -5.4 -5.0 -4.4 -3.8 -3.2 -2.6 -2.0 -1.3 -0.6 ~ ~ ~ ~
General Fund Expenditure -8.6 -7.7 -7.8 -8.4 -9.6 -21.4 -20.7 -22.2 -22.4 -23.0 -25.5 -18.1 -21.5 -17.0 -17.2 -10.2 -10.3 -6.7 -6.7Special Fund Expenditure -3.2 -5.2 -4.4 -4.3 -3.7 -4.5 -3.2 -3.8 -5.6 -4.7 -5.8 -10.0 -6.9 -7.1 -7.6 -5.4 -5.5 -9.3 -9.3Capital Fund Expenditure -3.3 -2.0 -3.7 -9.3 -7.5 -4.7 -8.3 -3.4 -4.7 -6.7 -4.3 -10.3 -5.4 -4.7 -4.3 -1.3 -1.3 -1.1 -3.3
continued …
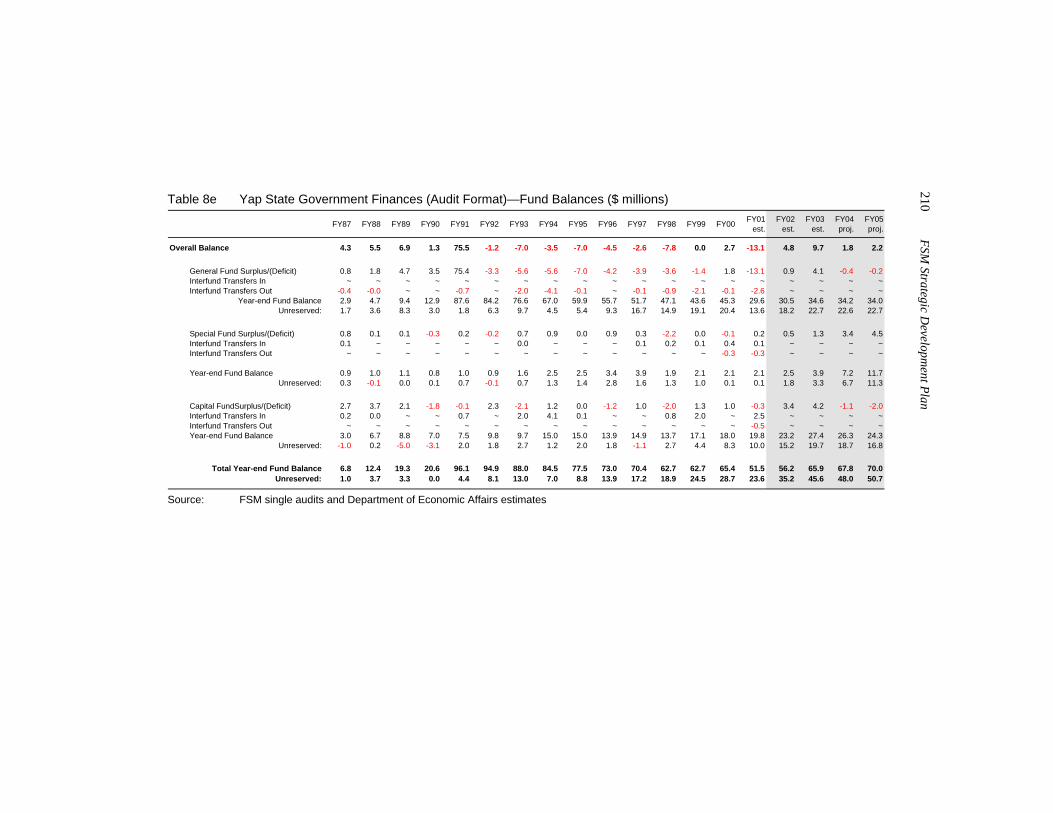
210 FSM
Strategic Developm
ent Plan
Table 8e Yap State Government Finances (Audit Format)—Fund Balances ($ millions)
FY87 FY88 FY89 FY90 FY91 FY92 FY93 FY94 FY95 FY96 FY97 FY98 FY99 FY00 FY01est.
FY02est.
FY03est.
FY04proj.
FY05proj.
Overall Balance 4.3 5.5 6.9 1.3 75.5 -1.2 -7.0 -3.5 -7.0 -4.5 -2.6 -7.8 0.0 2.7 -13.1 4.8 9.7 1.8 2.2
General Fund Surplus/(Deficit) 0.8 1.8 4.7 3.5 75.4 -3.3 -5.6 -5.6 -7.0 -4.2 -3.9 -3.6 -1.4 1.8 -13.1 0.9 4.1 -0.4 -0.2Interfund Transfers In ~ ~ ~ ~ ~ ~ ~ ~ ~ ~ ~ ~ ~ ~ ~ ~ ~ ~ ~Interfund Transfers Out -0.4 -0.0 ~ ~ -0.7 ~ -2.0 -4.1 -0.1 ~ -0.1 -0.9 -2.1 -0.1 -2.6 ~ ~ ~ ~
Year-end Fund Balance 2.9 4.7 9.4 12.9 87.6 84.2 76.6 67.0 59.9 55.7 51.7 47.1 43.6 45.3 29.6 30.5 34.6 34.2 34.0Unreserved: 1.7 3.6 8.3 3.0 1.8 6.3 9.7 4.5 5.4 9.3 16.7 14.9 19.1 20.4 13.6 18.2 22.7 22.6 22.7
Special Fund Surplus/(Deficit) 0.8 0.1 0.1 -0.3 0.2 -0.2 0.7 0.9 0.0 0.9 0.3 -2.2 0.0 -0.1 0.2 0.5 1.3 3.4 4.5Interfund Transfers In 0.1 ~ ~ ~ ~ ~ 0.0 ~ ~ ~ 0.1 0.2 0.1 0.4 0.1 ~ ~ ~ ~Interfund Transfers Out ~ ~ ~ ~ ~ ~ ~ ~ ~ ~ ~ ~ ~ -0.3 -0.3 ~ ~ ~ ~
Year-end Fund Balance 0.9 1.0 1.1 0.8 1.0 0.9 1.6 2.5 2.5 3.4 3.9 1.9 2.1 2.1 2.1 2.5 3.9 7.2 11.7Unreserved: 0.3 -0.1 0.0 0.1 0.7 -0.1 0.7 1.3 1.4 2.8 1.6 1.3 1.0 0.1 0.1 1.8 3.3 6.7 11.3
Capital FundSurplus/(Deficit) 2.7 3.7 2.1 -1.8 -0.1 2.3 -2.1 1.2 0.0 -1.2 1.0 -2.0 1.3 1.0 -0.3 3.4 4.2 -1.1 -2.0Interfund Transfers In 0.2 0.0 ~ ~ 0.7 ~ 2.0 4.1 0.1 ~ ~ 0.8 2.0 ~ 2.5 ~ ~ ~ ~Interfund Transfers Out ~ ~ ~ ~ ~ ~ ~ ~ ~ ~ ~ ~ ~ ~ -0.5 ~ ~ ~ ~Year-end Fund Balance 3.0 6.7 8.8 7.0 7.5 9.8 9.7 15.0 15.0 13.9 14.9 13.7 17.1 18.0 19.8 23.2 27.4 26.3 24.3
Unreserved: -1.0 0.2 -5.0 -3.1 2.0 1.8 2.7 1.2 2.0 1.8 -1.1 2.7 4.4 8.3 10.0 15.2 19.7 18.7 16.8
Total Year-end Fund Balance 6.8 12.4 19.3 20.6 96.1 94.9 88.0 84.5 77.5 73.0 70.4 62.7 62.7 65.4 51.5 56.2 65.9 67.8 70.0Unreserved: 1.0 3.7 3.3 0.0 4.4 8.1 13.0 7.0 8.8 13.9 17.2 18.9 24.5 28.7 23.6 35.2 45.6 48.0 50.7
Source: FSM single audits and Department of Economic Affairs estimates
Related Documents