ACETONE AND METHYL ETHYL KETONE IN URINE NMAM 8319, ISSUE 1 BACK-UP DATA REPORT COREY C. DOWNS JAMES B. PERKINS DRAFT JULY 8,2002 EDITED VERSION FINALIZED MARCH 7, 2014 CONTRACTS CDC-200-95-2955 CDC-200-2001-08000 Submitted To: National Institute for Occupational Safety and Health Robert A. Taft Laboratories 4676 Columbia Parkway Cincinnati, Ohio 45226 Submitted By: DataChem Laboratories, Inc. 960 West LeVoy Drive Salt Lake City, Utah 84123-2547

Welcome message from author
This document is posted to help you gain knowledge. Please leave a comment to let me know what you think about it! Share it to your friends and learn new things together.
Transcript
ACETONE AND METHYL ETHYL KETONE IN URINE NMAM 8319, ISSUE 1 BACK-UP DATA REPORT COREY C. DOWNS JAMES B. PERKINS DRAFT JULY 8,2002 EDITED VERSION FINALIZED MARCH 7, 2014 CONTRACTS CDC-200-95-2955 CDC-200-2001-08000
Submitted To: National Institute for Occupational Safety and Health Robert A. Taft Laboratories 4676 Columbia Parkway Cincinnati, Ohio 45226 Submitted By: DataChem Laboratories, Inc. 960 West LeVoy Drive Salt Lake City, Utah 84123-2547

TABLE OF CONTENTS
ACETONE AND METHYL ETHYL KETONE IN URINE BACKUP DATA REPORT
INTRODUCTION AND BACKGROUND ............................................................................................1
REAGENTS AND MATERIALS .......................................................................................................2
Preparation of Primary Stock and Internal Standard Solutions .....................................3
SAMPLE PREPARATION AND INSTRUMENT CONDITIONS ..............................................................3
Sample Preparation ........................................................................................................3
Instrument Conditions ....................................................................................................4
Calibration......................................................................................................................5
Chromatogram Analysis ................................................................................................5
LIMIT OF DETECTION AND QUANTITATION STUDY .....................................................................7
LONG-TERM STABILITY STUDY ..................................................................................................8
PRECISION, ACCURACY, AND BIAS STUDY ................................................................................10
SUMMARY .................................................................................................................................12
REFERENCES .............................................................................................................................12
APPENDIX .................................................................................................................................14
User Check Conditions ...................................................................................................14
User Check Results .........................................................................................................15

ACETONE and METHYL ETHYL KETONE in urine:
Back-up Data Report
INTRODUCTION AND BACKGROUND
Both acetone and methyl ethyl ketone (MEK) are utilized in a wide variety of industrial
processes. They are present as solvents in many commercial products such as paints, inks,
adhesives, thinners, and resins. The ubiquitous use of these chemicals in industry generates a
large potential for excessive occupational exposure.
Symptoms of acetone and MEK exposure are similar. Lower concentrations primarily
cause irritation of mucous membranes. Higher levels non-specifically depress the central nervous
system and are associated with headaches, drowsiness, dizziness, confusion, and even
unconsciousness. The onset of the effects varies broadly from person to person and seems to be
influenced by prior exposure.
Individuals exposed to acetone or MEK will excrete a portion of the chemical in their
urine. Several studies indicated a significant correlation between environmental exposure and
urinary excretion levels for both acetone and MEK; therefore, monitoring occupational exposure
to these solvents can be achieved through urinalysis [1-4]. Acetone and MEK pass into the urine
via simple renal diffusion; their urinary concentrations should not be corrected using creatinine
or specific gravity measurements and will be unaffected by renal disease. The US Environmental
Protection Agency has published toxicological reviews of both compounds [5, 6].
This report evaluates a method for simultaneously quantifying acetone and MEK
concentrations in urine samples utilizing a gas chromatograph equipped with a flame ionization
detector (FID). This method employs a headspace technique in which the air above a sample is
injected into the system, rather than injecting the actual sample or an extract of the sample. A
method based on a headspace technique seems ideal in this situation because the volatile nature
of the analytes allows them to easily enter the headspace upon heating of the sample. It also
eliminates the need for extra sample extraction steps and prevents injecting relatively dirty
biological matrices into the instrument, where contamination and wear may occur.
Caution must be used in the interpretation of results from this analysis, as other urinary
sources are documented for each analyte, which could lead to an overestimation of the exposure
Page 2 of 19
levels. All humans endogenously produce acetone as a natural part of daily metabolism. This
method is sensitive enough to detect endogenous concentrations of acetone. Diabetics will have
significantly higher concentrations of acetone in their urine. Fasting may also elevate acetone
urinary concentrations [7]. Acetone is a metabolite of 2-propanol, consequently 2-propanol
exposure can lead to increased acetone concentrations in urine [8]. MEK is not usually
endogenously produced by humans and is normally only found in persons occupationally
exposed to the solvent. However, 2-butanol is metabolized to MEK and may interfere with
monitoring MEK exposure [9]. Simultaneous exposure to ethanol was shown to reduce MEK
metabolism and thus increase the MEK concentration in urine; consumption of alcoholic
beverages may cause an increase in MEK urinary concentrations [10].
The Biological Exposure Indices (BEI) Committee recommends a BEI in urine of 2
mg/mL for MEK and 50 mg/mL for acetone [11].
NOTE: Proper safety precautions should always be taken when dealing with any
chemical but especially when working with biological fluids such as urine. Manipulating
biological samples poses a serious health risk because of the potential transmittance of infectious
diseases including hepatitis and HIV. Lab coats, goggles, and gloves must be worn at all times
and standard precautions should be followed [12]. Work should be performed in an isolated hood
where possible. All waste is required by law to be disposed of in a properly labeled, autoclavable
container.
REAGENTS AND MATERIALS
Presented in Table 1 is the list of reagents and solvents used for this method and its
evaluation. 2-Pentanone was selected for use as an internal standard to normalize the values of
acetone and MEK determined in the urine samples.
TABLE 1. LIST OF CHEMICALS
Chemical Vendor CAS # Purity Lot # Acetone Aldrich 67-64-1 99% DO 033337 DO Methyl Ethyl Ketone Aldrich 78-93-3 99.5% LI 03563 KI 2-Pentanone Aldrich 107-87-9 97% 02009HT Water 7732-18-5 ASTM Type II --

Page 3 of 19
Water was used as the solvent while preparing the primary stock and internal standard solutions.
Urine used in the study for standards and test samples was collected from volunteer employees at
DataChem Laboratories in Salt Lake City. The urine was collected and pooled as needed. Once
pooled, it was stored at 4 °C in 1-L polyethylene screw-top bottles.
Preparation of Primary Stock and Internal Standard Solutions
To make the primary stock solution, a 10-mL volumetric flask was filled partially with
water. With a microliter syringe, a specific, measured volume of each analyte was added to the
flask. The 10-mL volumetric flask was brought to volume with water, mixed, and the solution
was transferred to a 13 X 100 mm glass culture tube with a Teflon-lined cap. The solution was
stored at 4 °C in the dark until needed. The concentration of each analyte in the stock solution
was calculated using the volume of analyte added, its density, its purity factor, and the total
dilution volume. Using acetone as an example:
( ) 6.6010
1999.0788.0770 =
⋅××
⋅×
mLLmgL
mm mg/mL.
The internal standard solution was prepared in a similar manner by adding 2-pentanone to
enough water to fill a 1-L volumetric flask. The target concentration was approximately 80 mg of
2-pentanone/mL of water. For the experiments in this evaluation, the actual internal standard
concentration was 78.5 mg/mL calculated as follows:
( ) 5.781
197.08095.0100 =
⋅
××
⋅×
LLmgL
mm mg/L = 78.5 mg/mL.
This concentration of internal standard was employed because it provided good peak shape, peak
area, and reproducibility for the internal standard.
SAMPLE PREPARATION AND INSTRUMENT CONDITIONS
Sample Preparation
For each study, the samples and standards were always prepared in the same manner.
Exactly 10.0 mL of urine was transferred into a 20-mL Perkin Elmer HS-40 headspace vial. Half
a milliliter of the internal standard solution was added to the vial before sealing the vial with an
aluminum crimp-cap and PTFE/Butyl septum. Each vial was then lightly mixed and analyzed. If
spiked urine and samples were not going to be transferred to headspace vials and analyzed
immediately, they should be stored at 4 °C in tightly-sealed vials with minimal headspace.

Page 4 of 19
Samples shipped from the field should also be sent refrigerated in containers having as little
headspace as possible.
Instrument Conditions
All of the samples and standards were run on the same system with the same set of
conditions. The system consisted of a Perkin Elmer Autosystem gas chromatograph equipped
with an FID and a Perkin Elmer HS-40 headspace autosampler. The column was a fused silica
capillary column (DB-624, 75 m X 0.53 mm I.D., 3.0 mm film). Figure 1 shows the temperature
program that was utilized. The head pressure was maintained at 15 psi.
FIGURE 1. TEMPERATURE PROGRAM
The carrier gas consisted of pre-purified helium and the FID was supplied with pre-purified
hydrogen and filtered air. The injector and detector temperatures were 180 °C and 250 °C
respectively. The injection conditions were splitless. The headspace autosampler was set to the
following conditions:
Transfer Temp: 129 °C Withdrawal: 0.2 min Thermostat Time: 30 min Needle: 120 °C GC Cycle Time: 28 min Sample: 80 °C Pressurize: 1.0 min Inject: 0.08 min Table 2 shows the typical retention times of the analytes given these conditions.
TABLE 2. ANALYTE RETENTION TIMES
3°/min
40 °C 4 min
220°C 2 min
60°C
20°/ min
Analyte Retention Time (min) Acetone 5.46
MEK 9.43 2-Pentanone 13.20

Page 5 of 19
The final temperature (220 °C) was maintained until the column appeared to be clean in order to
prevent any carryover into the next sample injection. Conditions used for a syringe-injection type
of headspace system can be found in the Appendix.
Calibration
To quantify the amount of acetone and MEK present in samples, a calibration curve was
constructed daily with at least six working standards covering the anticipated concentration range
of the samples. The working standards were prepared by diluting known amounts of the
acetone/MEK stock solution into enough pooled urine to make a total of 10.0 mL for each
standard. Along with the working standards, at least one pooled urine blank was prepared by
transferring 10.0 mL of pooled urine (the same pooled urine used for creating the working
standards) into a headspace vial. The 10 mL of each working standard and pooled urine blank
were then processed using the same procedure as listed previously.
After analyzing the samples, a calibration graph was generated for each analyte by
plotting, for each working standard, the normalized analyte response (peak area of analyte
divided by the peak area of the internal standard on the same chromatogram) on the y-axis vs.
concentration of analyte on the x-axis. A linear or quadratic model was utilized in processing the
working standard data, depending on which model provided a better fit to the data. Because
humans endogenously produce acetone, detectable amounts of acetone were often found in the
pooled urine blanks. Before plotting the calibration graph, it was often necessary to subtract the
normalized analyte response of the pooled urine blank from the normalized analyte response of
each working standard. The normalized analyte response was then calculated for each sample
and the corresponding acetone and MEK concentrations were read from the x-axis of the
calibration curves.
Chromatogram Analysis
Representative overlaid chromatograms of a high and low urine standard and of blank
urine with and without internal standard when the previously described conditions are employed
are shown in both full- and reduced-scales in Figure 2. 2-Pentanone was chosen as the internal
standard because of its availability and because its retention time positioned it in a relatively
interference-free portion of the chromatogram of the urine sample.
Page 6 of 19
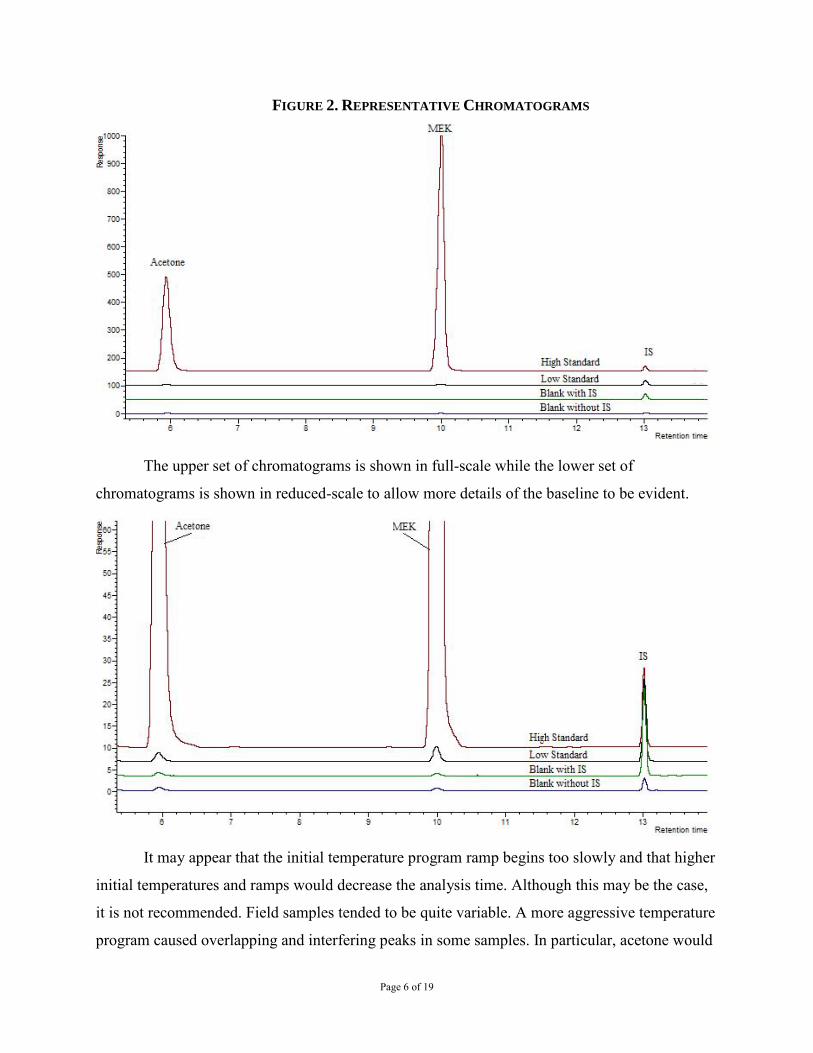
FIGURE 2. REPRESENTATIVE CHROMATOGRAMS
The upper set of chromatograms is shown in full-scale while the lower set of
chromatograms is shown in reduced-scale to allow more details of the baseline to be evident.
It may appear that the initial temperature program ramp begins too slowly and that higher
initial temperatures and ramps would decrease the analysis time. Although this may be the case,
it is not recommended. Field samples tended to be quite variable. A more aggressive temperature
program caused overlapping and interfering peaks in some samples. In particular, acetone would
Page 7 of 19
often co-elute with other compounds when higher initial temperatures were employed. These
chromatograms were acquired during the User Check experiments and thus show slightly
different retention times than those shown in Table 2.
LIMIT OF DETECTION AND QUANTITATION STUDY
This study was to determine the limit of detection (LOD) of the method based upon
pooled control urine spiked with acetone and MEK. The limit of quantitation (LOQ) for both
analytes was then calculated as 10/3 times the LOD. The resulting LOQ was then used to
determine the target concentrations for all subsequent steps in the method evaluation.
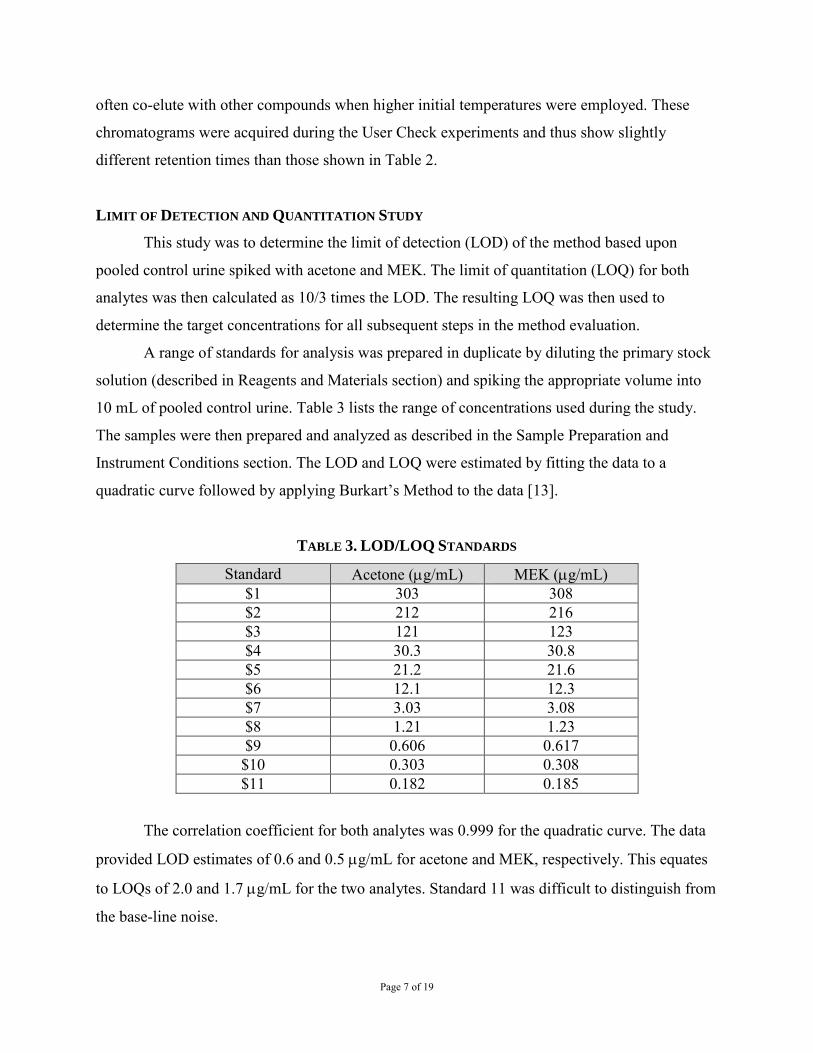
A range of standards for analysis was prepared in duplicate by diluting the primary stock
solution (described in Reagents and Materials section) and spiking the appropriate volume into
10 mL of pooled control urine. Table 3 lists the range of concentrations used during the study.
The samples were then prepared and analyzed as described in the Sample Preparation and
Instrument Conditions section. The LOD and LOQ were estimated by fitting the data to a
quadratic curve followed by applying Burkart’s Method to the data [13].
TABLE 3. LOD/LOQ STANDARDS
Standard Acetone (mg/mL) MEK (mg/mL) $1 303 308 $2 212 216 $3 121 123 $4 30.3 30.8 $5 21.2 21.6 $6 12.1 12.3 $7 3.03 3.08 $8 1.21 1.23 $9 0.606 0.617 $10 0.303 0.308 $11 0.182 0.185
The correlation coefficient for both analytes was 0.999 for the quadratic curve. The data
provided LOD estimates of 0.6 and 0.5 mg/mL for acetone and MEK, respectively. This equates
to LOQs of 2.0 and 1.7 mg/mL for the two analytes. Standard 11 was difficult to distinguish from
the base-line noise.

Page 8 of 19
This experiment was repeated three different times on three different days using slightly
different concentrations of standards to determine if the LOD was consistently achievable. The
LODs ranged from 0.3 to 0.8 mg/mL for acetone and 0.1 to 0.7 mg/mL for MEK. Although lower
LODs were occasionally obtained, 0.6 mg/mL was chosen for each analyte as the method’s LOD
because it was consistently obtainable.
LONG-TERM STABILITY STUDY
This experiment was designed to assess the stability of acetone and MEK in urine under
various conditions of storage. The study covered a period of 30 days with samples stored both at
room temperature (24 °C) and refrigerated (4 °C). The study was performed using pooled urine
for both samples and standards. For samples to be considered stable, they must have a loss of
less than 10% over a period of seven days [14]. Once at the laboratory, the analysis might be
further delayed for various reasons; therefore, the study was extended for 30 days.
A 2-L volume of pooled control urine was prepared in a volumetric flask so that it
contained 21.1 and 21.5 mg/mL of acetone and MEK, respectively (approximately 10 x LOQ).
The spiked urine was immediately split into 30 samples by pouring it into 20-mL amber VOA
vials. The urine was added until the vial was completely full. The vials were capped with Teflon
PTFE septa and screw-cap tops. When inverted, no air bubbles were visible on the bottom of the
containers. Eight blank samples were prepared in the same manner using pooled control urine
that was not spiked with the analytes of interest. The samples were then either left at room
temperature or stored in a refrigerator at 4 °C. On each day, the designated samples plus one
blank were analyzed. With each sample set, a fresh series of standards was prepared and
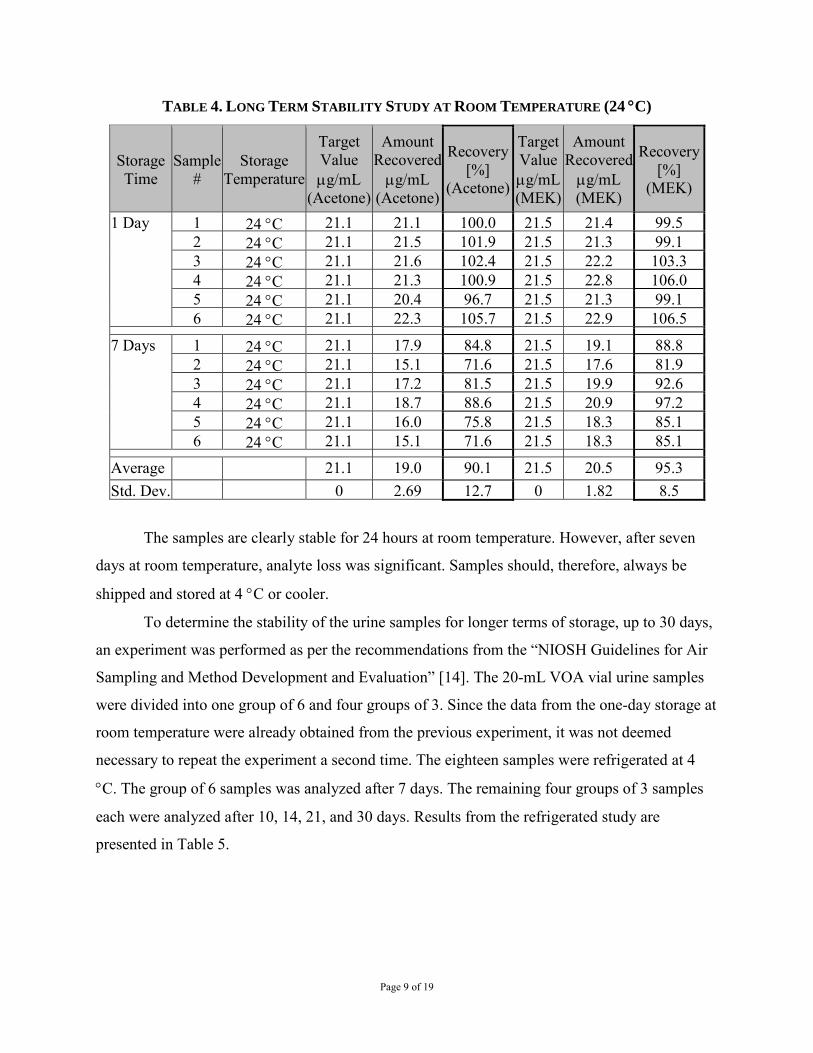
analyzed each day to produce a calibration curve. Table 4 shows the schedule for the analysis of
the samples stored at room temperature (24 °C), the length of storage and the results for each set
of samples.
Page 9 of 19
TABLE 4. LONG TERM STABILITY STUDY AT ROOM TEMPERATURE (24 °C)
Storage Time
Sample #
Storage Temperature
Target Value mg/mL
(Acetone)
Amount Recovered mg/mL
(Acetone)
Recovery [%]
(Acetone)
Target Value mg/mL (MEK)
Amount Recovered mg/mL (MEK)
Recovery [%]
(MEK)
1 Day 1 24 °C 21.1 21.1 100.0 21.5 21.4 99.5 2 24 °C 21.1 21.5 101.9 21.5 21.3 99.1 3 24 °C 21.1 21.6 102.4 21.5 22.2 103.3 4 24 °C 21.1 21.3 100.9 21.5 22.8 106.0 5 24 °C 21.1 20.4 96.7 21.5 21.3 99.1 6 24 °C 21.1 22.3 105.7 21.5 22.9 106.5
7 Days 1 24 °C 21.1 17.9 84.8 21.5 19.1 88.8 2 24 °C 21.1 15.1 71.6 21.5 17.6 81.9 3 24 °C 21.1 17.2 81.5 21.5 19.9 92.6 4 24 °C 21.1 18.7 88.6 21.5 20.9 97.2 5 24 °C 21.1 16.0 75.8 21.5 18.3 85.1 6 24 °C 21.1 15.1 71.6 21.5 18.3 85.1
Average 21.1 19.0 90.1 21.5 20.5 95.3 Std. Dev. 0 2.69 12.7 0 1.82 8.5
The samples are clearly stable for 24 hours at room temperature. However, after seven
days at room temperature, analyte loss was significant. Samples should, therefore, always be
shipped and stored at 4 °C or cooler.
To determine the stability of the urine samples for longer terms of storage, up to 30 days,
an experiment was performed as per the recommendations from the “NIOSH Guidelines for Air
Sampling and Method Development and Evaluation” [14]. The 20-mL VOA vial urine samples
were divided into one group of 6 and four groups of 3. Since the data from the one-day storage at
room temperature were already obtained from the previous experiment, it was not deemed
necessary to repeat the experiment a second time. The eighteen samples were refrigerated at 4
°C. The group of 6 samples was analyzed after 7 days. The remaining four groups of 3 samples
each were analyzed after 10, 14, 21, and 30 days. Results from the refrigerated study are
presented in Table 5.
Page 10 of 19
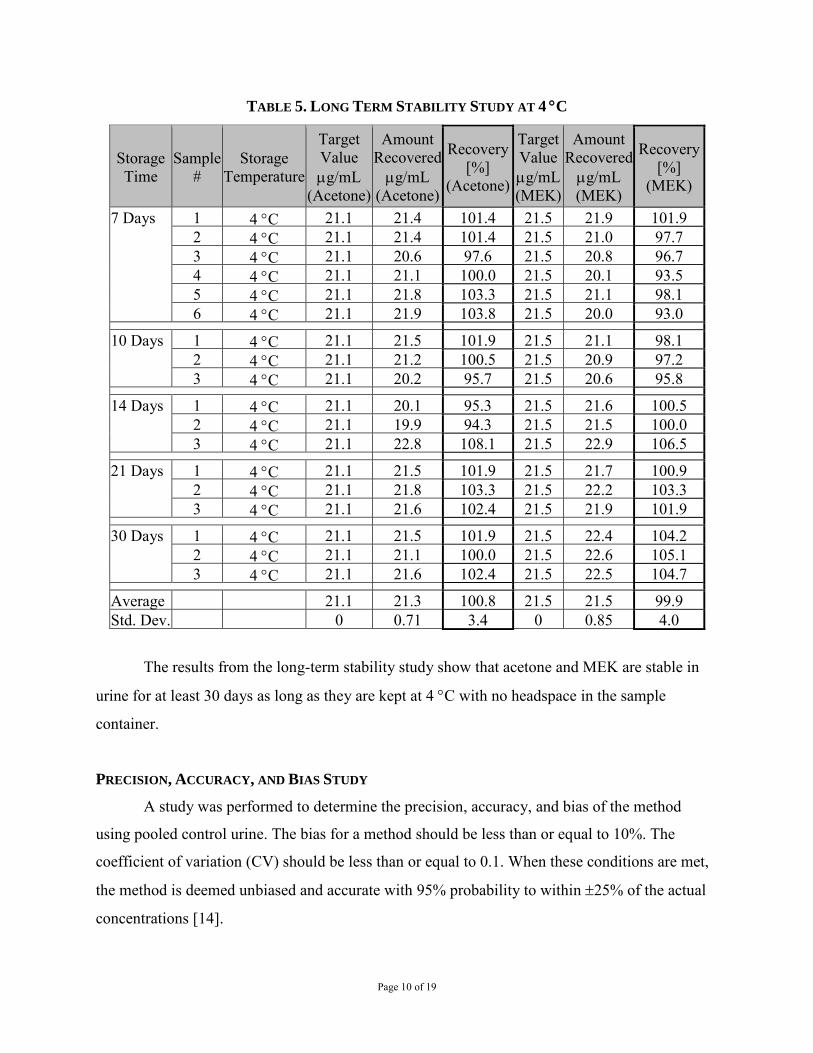
TABLE 5. LONG TERM STABILITY STUDY AT 4 °C
Storage Time
Sample #
Storage Temperature
Target Value mg/mL
(Acetone)
Amount Recovered mg/mL
(Acetone)
Recovery [%]
(Acetone)
Target Value mg/mL (MEK)
Amount Recovered mg/mL (MEK)
Recovery [%]
(MEK)
7 Days 1 4 °C 21.1 21.4 101.4 21.5 21.9 101.9 2 4 °C 21.1 21.4 101.4 21.5 21.0 97.7 3 4 °C 21.1 20.6 97.6 21.5 20.8 96.7 4 4 °C 21.1 21.1 100.0 21.5 20.1 93.5 5 4 °C 21.1 21.8 103.3 21.5 21.1 98.1 6 4 °C 21.1 21.9 103.8 21.5 20.0 93.0
10 Days 1 4 °C 21.1 21.5 101.9 21.5 21.1 98.1
2 4 °C 21.1 21.2 100.5 21.5 20.9 97.2 3 4 °C 21.1 20.2 95.7 21.5 20.6 95.8
14 Days 1 4 °C 21.1 20.1 95.3 21.5 21.6 100.5
2 4 °C 21.1 19.9 94.3 21.5 21.5 100.0 3 4 °C 21.1 22.8 108.1 21.5 22.9 106.5
21 Days 1 4 °C 21.1 21.5 101.9 21.5 21.7 100.9
2 4 °C 21.1 21.8 103.3 21.5 22.2 103.3 3 4 °C 21.1 21.6 102.4 21.5 21.9 101.9
30 Days 1 4 °C 21.1 21.5 101.9 21.5 22.4 104.2
2 4 °C 21.1 21.1 100.0 21.5 22.6 105.1 3 4 °C 21.1 21.6 102.4 21.5 22.5 104.7
Average 21.1 21.3 100.8 21.5 21.5 99.9 Std. Dev. 0 0.71 3.4 0 0.85 4.0
The results from the long-term stability study show that acetone and MEK are stable in
urine for at least 30 days as long as they are kept at 4 °C with no headspace in the sample
container.
PRECISION, ACCURACY, AND BIAS STUDY
A study was performed to determine the precision, accuracy, and bias of the method
using pooled control urine. The bias for a method should be less than or equal to 10%. The
coefficient of variation (CV) should be less than or equal to 0.1. When these conditions are met,
the method is deemed unbiased and accurate with 95% probability to within ±25% of the actual
concentrations [14].

Page 11 of 19
During the study, six concentrations ranging from 1 x LOQ (2.0 mg/mL) to 300 x LOQ
(600 mg/mL) were studied. For each sample, a volume of 10 mL of pooled urine was used. Seven
samples at each level (a total of 42 samples) were spiked with an acetone and MEK solution
(described in Reagents and Materials section) to produce the desired concentrations. A sample
blank was also included at each level. The samples were then prepared and analyzed according to
the method. Table 6 displays the average recoveries of the analytes over the ranges studied.
TABLE 6. AVERAGE RECOVERIES OVER VARIOUS LEVELS
Level (xLOQ)
Rough Target
(mg/mL)
Actual Spike (mg/mL)
Average Recovery (%) CV
Both Both Acetone MEK Acetone MEK Acetone MEK 1 2 2.12 2.16 106 98.0 0.110 0.076 3 6 6.06 6.17 92.2 85.5 0.043 0.066 10 20 21.2 21.6 94.9 89.3 0.032 0.044 30 60 60.6 61.7 96.8 96.8 0.019 0.018 100 200 212 216 99.0 98.1 0.062 0.056 300 600 606 617 94.1 89.4 0.062 0.058
The data were processed to determine the coefficient of variation (CV) at each
concentration level and whether these levels could be pooled using Barlett’s test of homogeneity
[14]. The pooled coefficients of variation were then used for calculating the overall precision and
accuracy of the method as presented in Table 7. The 1 x LOQ level was not included in the
calculations presented in Table 7.
TABLE 7. PRECISION, BIAS, AND ACCURACY
Analyte Range
(µg/mL) Accuracy
(%) Bias Precision
Average Range Overall (ŜrT) Acetone 6.1 to 606 11.5 -0.0444 -0.0780 to -0.0103 0.0468
MEK 6.2 to 617 15.0 -0.0782 -0.1453 to -0.0316 0.0507
Page 12 of 19
SUMMARY
All data obtained during the method development met all NIOSH criteria for precision,
bias, and accuracy in all studies performed [14]. The method proved to be rugged and adaptable
to human urine samples.
REFERENCES
[1] Pezzagno G, Imbriani M, Ghittori S, Capodaglio E, Huang J [1986]. Urinary elimination of acetone in experimental and occupational exposure. Scand J Work Environ Health 12:603-608.
[2] Ghittori S, Imbriani M, Pezzagno G, Capodaglio E [1987]. The urinary concentration of solvents as a biological indicator of exposure: Proposal for the biological equivalent exposure limit for nine solvents. Am Ind Hyg Assoc J 48:786-790.
[3] Perbellini L, Brugnone F, Mozzo P, Cocheo V, Caretta D [1984]. Methyl ethyl ketone exposure in industrial workers. Uptake and kinetics. Int Arch Occup Environ Health 54:73-81.
[4] Yoshikawa M, Kawamoto T, Murata K, Arashidani K, Katoh T, Kodama Y [1995]. Biological monitoring of occupational exposure to methyl ethyl ketone in Japanese workers. Arch Environ Contam Toxicol 29:135-9.
[5] US EPA [2003]. Toxicologial review of acetone. EPA 635/R-03/004.
www.epa.gov/iris/toxreviews/0128tr.pdf. [6] US EPA [2003]. Toxicologial review of methyl ethyl ketone. EPA 635/R-03/009.
www.epa.gov/iris/toxreviews/0071tr.pdf. [7] Bales JR, Bell JD, Nicholson JK, Sadler PJ [1986]. 1H NMR studies of urine during
fasting: Excretion of ketone bodies and acetylcamitine. Magn Reson Med 3:849-856.
[8] Kawai T, Yasugi T, Horiguchi S, Uchida Y, Iwami O, Iguchi H, Inoue O, Watanabe T, Nakatsuka H, Ikeda M [1990]. Biological monitoring of occupational exposure to isopropyl alcohol vapor by urinalysis for acetone. Int Arch Occup Environ Health 62:409-413.
[9] Williams RT [1959]. Detoxication mechanisms: The metabolism and detoxication of drugs, toxic substances and other organic compounds. New York, New York: John Wiley and Sons, Inc., p. 96.
[10] Liira J, Riihimaki V, Engstrom K [1990]. Effects of ethanol on the kinetics of inhaled methyl ethyl ketone in man. Br J Ind Med 47:325-330.
[11] ACGIH [2013]. TLVs® and BEIs® based on the documentation of the threshold limit values for chemical substances and physical agents and biological exposure indices. Cincinnati, Ohio: American Conference of Governmental Industrial Hygienists, pp. 108 and 112.
Page 13 of 19
[12] CDC [2007]. 2007 Guidelines for isolation precautions: Preventing transmission of infectious agents in healthcare settings. [http://www.cdc.gov/hicpac/2007IP/2007isolationPrecautions.html]. Date accessed: April 2013.
[13] Burkart JA [1986]. General procedures for limit of detection calculations in the industrial hygiene chemistry laboratory. Appl Ind Hyg 1(3):153-155.
[14] Kennedy ER, Fischbach TJ, Song R, Eller PM, Shulman, SA [1995]. Guidelines for Air and Analytical Method Development and Evaluation. Cincinnati, OH: National Institute for Occupational Safety and Health, DHHS (NIOSH) Publication No. 95-117.
Written By: Corey C. Downs and James B. Perkins, DataChem Laboratories, Inc, Salt Lake City, Utah under NIOSH CDC Contract 200-95-2955 and CDC-200-2001-08000. Edited and User Check data added by Dale A. Shoemaker, Ph.D., NIOSH/DART/CEMB.

Page 14 of 19
APPENDIX User Check Conditions There are three types of headspace autosamplers in common use: syringe injection, balanced pressure, and pressurized loop. The type used in the development of this method and the conditions found herein are for a balanced pressure system. The secondary laboratory validation, known as a User Check, was performed on a syringe injection type system. The chromatographic conditions remain the same, but different autosampler parameters are employed in the different systems. The autosampler conditions utilized in the User Check are as follows:
Incubation Temp: 95 °C Injection volume: 500 µL Incubation Time: 15 min Fill speed: 120 µL/sec Agitation speed: 250 rpm Delay: 5 sec Run time: 26 min Injection speed: 300 µL/sec Syringe Temp: 95 °C Delay: 500 msec
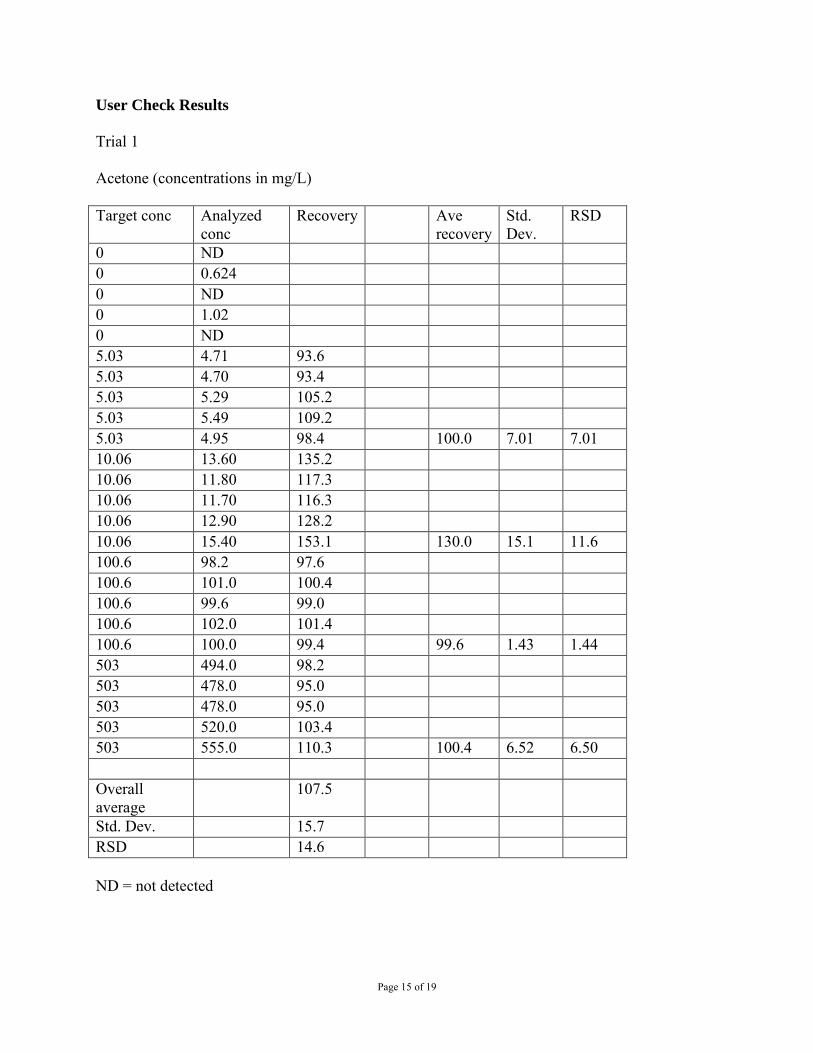
User Check data for acetone and MEK from a first trial is shown in the following tables.
Page 15 of 19
User Check Results Trial 1 Acetone (concentrations in mg/L) Target conc Analyzed
conc Recovery Ave
recovery Std. Dev.
RSD
0 ND 0 0.624 0 ND 0 1.02 0 ND 5.03 4.71 93.6 5.03 4.70 93.4 5.03 5.29 105.2 5.03 5.49 109.2 5.03 4.95 98.4 100.0 7.01 7.01 10.06 13.60 135.2 10.06 11.80 117.3 10.06 11.70 116.3 10.06 12.90 128.2 10.06 15.40 153.1 130.0 15.1 11.6 100.6 98.2 97.6 100.6 101.0 100.4 100.6 99.6 99.0 100.6 102.0 101.4 100.6 100.0 99.4 99.6 1.43 1.44 503 494.0 98.2 503 478.0 95.0 503 478.0 95.0 503 520.0 103.4 503 555.0 110.3 100.4 6.52 6.50 Overall 107.5 average Std. Dev. 15.7 RSD 14.6 ND = not detected
Page 16 of 19
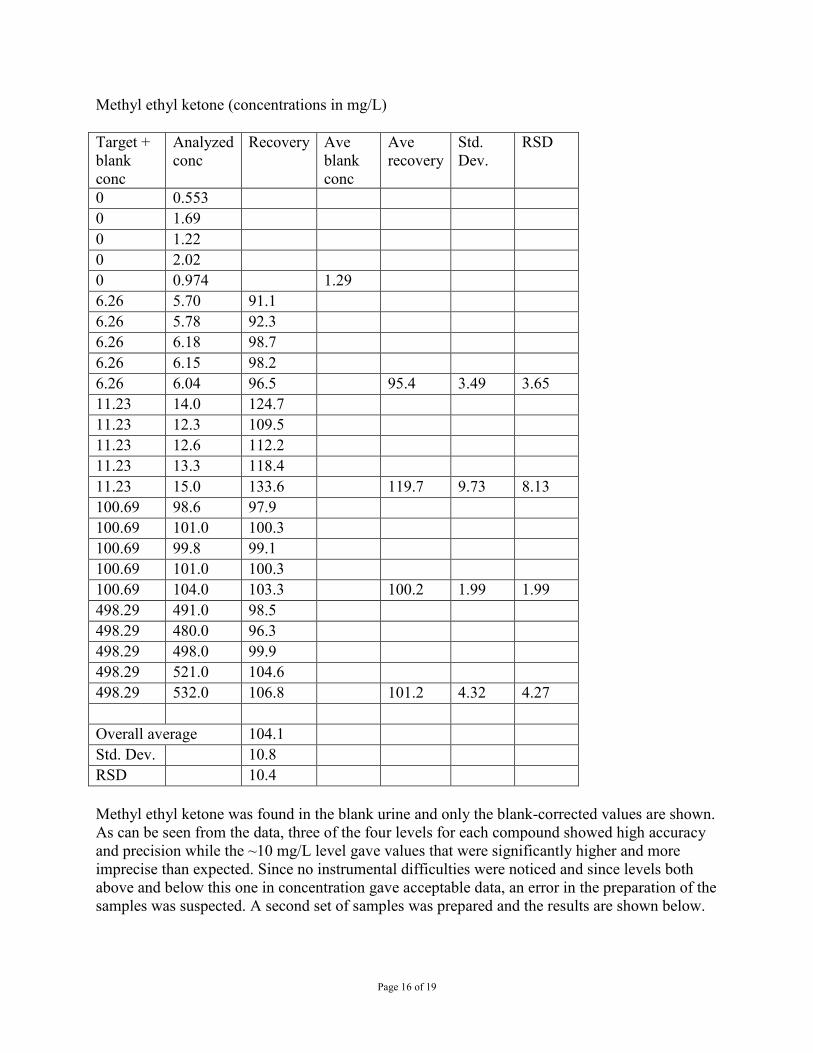
Methyl ethyl ketone (concentrations in mg/L) Target blank
+ Analyzed conc
Recovery Ave blank
Ave recovery
Std. Dev.
RSD
conc conc 0 0.553 0 1.69 0 1.22 0 2.02 0 0.974 1.29 6.26 5.70 91.1 6.26 5.78 92.3 6.26 6.18 98.7 6.26 6.15 98.2 6.26 6.04 96.5 95.4 3.49 3.65 11.23 14.0 124.7 11.23 12.3 109.5 11.23 12.6 112.2 11.23 13.3 118.4 11.23 15.0 133.6 119.7 9.73 8.13 100.69 98.6 97.9 100.69 101.0 100.3 100.69 99.8 99.1 100.69 101.0 100.3 100.69 104.0 103.3 100.2 1.99 1.99 498.29 491.0 98.5 498.29 480.0 96.3 498.29 498.0 99.9 498.29 521.0 104.6 498.29 532.0 106.8 101.2 4.32 4.27 Overall average 104.1 Std. Dev. 10.8 RSD 10.4 Methyl ethyl ketone was found in the blank urine and only the blank-corrected values are shown. As can be seen from the data, three of the four levels for each compound showed high accuracy and precision while the ~10 mg/L level gave values that were significantly higher and more imprecise than expected. Since no instrumental difficulties were noticed and since levels both above and below this one in concentration gave acceptable data, an error in the preparation of the samples was suspected. A second set of samples was prepared and the results are shown below.

Page 17 of 19
Trial 2 Acetone (concentrations in mg/L)
Target conc Analyzed conc
Recovery Ave recovery
Std. Dev.
RSD
0 0.08 0 0.246 0 0.272 0 0.214 0 0.209 4.97 4.76 95.8 4.97 5.01 100.8 4.97 5.20 104.6 4.97 5.66 113.9 4.97 5.64 113.5 105.7 7.92 7.50 9.94 9.92 99.8 9.94 10.60 106.6 9.94 10.50 105.6 9.94 10.50 105.6 9.94 11.30 113.7 106.3 4.94 4.65 99.4 97.8 98.4 99.4 102.0 102.6 99.4 103.0 103.6 99.4 104.0 104.6 99.4 99.5 100.1 101.9 2.57 2.53 497 472.0 95.0 497 499.0 100.4 497 507.0 102.0 497 537.0 108.1 497 528.0 106.2 102.3 5.15 5.03 Overall 104.1 average Std. Dev. 5.42 RSD 5.21
Page 18 of 19
Methyl ethyl ketone (concentrations in mg/L) Target conc Analyzed
conc Recovery Ave
recovery Std. Dev.
RSD
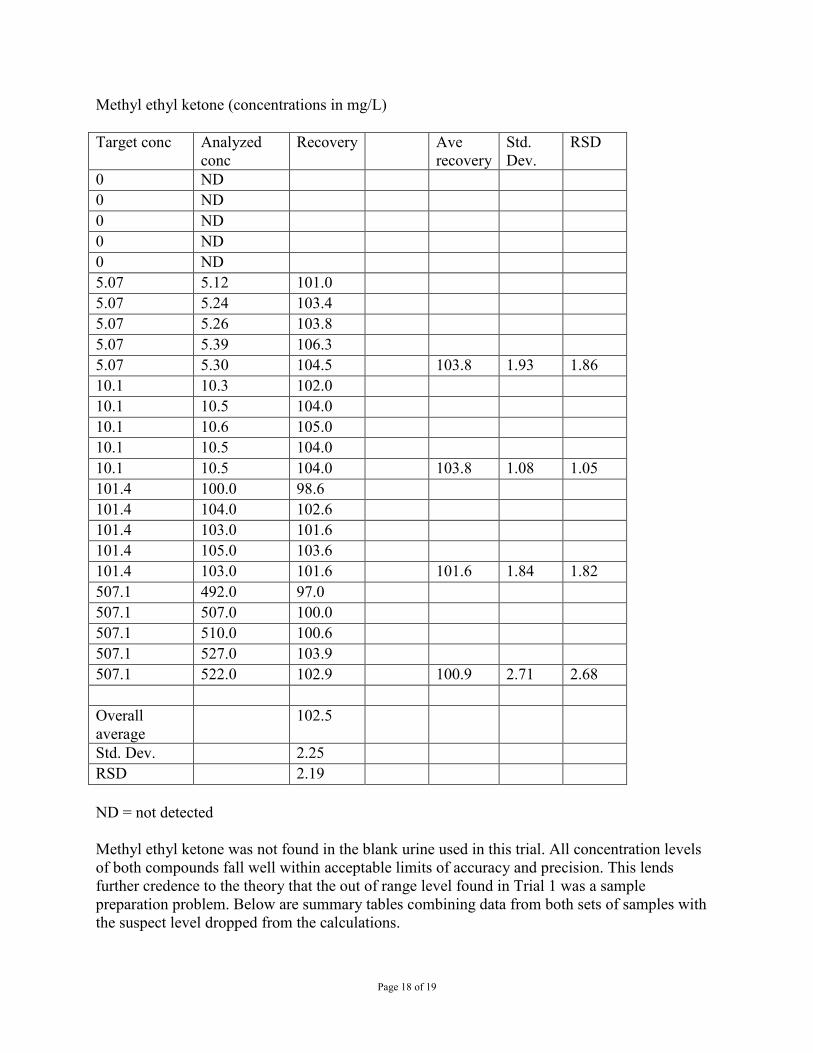
0 ND 0 ND 0 ND 0 ND 0 ND 5.07 5.12 101.0 5.07 5.24 103.4 5.07 5.26 103.8 5.07 5.39 106.3 5.07 5.30 104.5 103.8 1.93 1.86 10.1 10.3 102.0 10.1 10.5 104.0 10.1 10.6 105.0 10.1 10.5 104.0 10.1 10.5 104.0 103.8 1.08 1.05 101.4 100.0 98.6 101.4 104.0 102.6 101.4 103.0 101.6 101.4 105.0 103.6 101.4 103.0 101.6 101.6 1.84 1.82 507.1 492.0 97.0 507.1 507.0 100.0 507.1 510.0 100.6 507.1 527.0 103.9 507.1 522.0 102.9 100.9 2.71 2.68 Overall 102.5 average Std. Dev. 2.25 RSD 2.19 ND = not detected Methyl ethyl ketone was not found in the blank urine used in this trial. All concentration levels of both compounds fall well within acceptable limits of accuracy and precision. This lends further credence to the theory that the out of range level found in Trial 1 was a sample preparation problem. Below are summary tables combining data from both sets of samples with the suspect level dropped from the calculations.

Page 19 of 19
Acetone Concentration (mg/L) Average recovery (%) Std. Dev. RSD 5 102.8 7.68 7.46 10 106.3 4.94 4.65 100 100.7 2.31 2.29 500 101.4 5.63 5.56 All combined 102.3 5.63 5.50 Methyl ethyl ketone Concentration (mg/L) Average recovery (%) Std. Dev. RSD 5 99.6 5.17 5.19 10 103.8 1.08 1.05 100 100.9 1.95 1.94 500 101.1 3.40 3.37 All combined 101.0 3.61 3.57
Related Documents