Science is hard. Flow cytometry should be easy. ®

Welcome message from author
This document is posted to help you gain knowledge. Please leave a comment to let me know what you think about it! Share it to your friends and learn new things together.
Transcript
Science is hard. Flow cytometry should be easy.®

CFlow User Guide
7820011-01 Rev-D i
TABLE OF CONTENTS
1 INTRODUCTION TO CFLOW ............................................................................................... 1 1.1 Installing CFlow ........................................................................................................... 1 1.2 Starting CFlow ............................................................................................................. 1 1.3 CFlow Workspace ....................................................................................................... 2 1.4 Opening a New CFlow Workspace ............................................................................. 2 1.5 Exiting CFlow .............................................................................................................. 3 1.6 Using the Example CFlow File .................................................................................... 3
2 VALIDATING THE PERFORMANCE OF THE C6 ................................................................. 4 2.1 Running Validation Beads ........................................................................................... 4 2.2 Saving Validation Bead Data ....................................................................................... 8 2.3 Analyzing and Recording Validation Bead Data .......................................................... 8 2.4 Monitoring Validation Bead Data ............................................................................... 13 2.5 Troubleshooting Validation ........................................................................................ 13
3 COLLECTING DATA ........................................................................................................... 15 3.1 Viewing the Collect Tab ............................................................................................. 15 3.2 Collecting Sample Data ............................................................................................. 18
3.2.1 Setting the Fluidics Rate ................................................................................ 19 3.2.2 Setting the Threshold .................................................................................... 19 3.2.3 Setting a Run Limit ........................................................................................ 21 3.2.4 Naming the Sample ....................................................................................... 22 3.2.5 Running the Sample ...................................................................................... 22 3.2.6 Adding New Sample Data to a CFlow File .................................................... 23 3.2.7 Pausing Data Collection ................................................................................ 24
3.3 Ending a Data Collection Session ............................................................................. 25 3.4 Creating Plots ............................................................................................................ 25 3.5 Changing Plot Specifications ..................................................................................... 27 3.6 Using Gates and Markers .......................................................................................... 28
3.6.1 Creating a New Gate ..................................................................................... 28 3.6.2 Applying a Gate to a Plot ............................................................................... 29 3.6.3 Creating and Applying Nested Gates ............................................................ 31
3.7 Changing the Number of Events in a Plot ................................................................. 34 3.8 Naming Plot Axes ...................................................................................................... 36 3.9 Zooming on a Plot ..................................................................................................... 37
3.9.1 Basic Zoom .................................................................................................... 37 3.9.2 Zooming to a Specified Channel Range ........................................................ 38
3.10 Saving a CFlow File .................................................................................................. 38 3.10.1 Auto-Saving Files .......................................................................................... 39 3.10.2 Manually Saving Files .................................................................................... 40
3.11 Creating a CFlow Template ....................................................................................... 40 3.12 Understanding Fluorescence Spillover ...................................................................... 41
3.12.1 Recognizing Fluorescence Spillover ............................................................. 42 3.12.2 Correcting Fluorescence Spillover ................................................................. 43 3.12.3 Troubleshooting Color Compensation ........................................................... 46
3.13 Changing Parameters ............................................................................................... 48 3.14 Copying and Pasting Plots ........................................................................................ 48 3.15 Printing Data .............................................................................................................. 48 3.16 Exporting and Importing Files .................................................................................... 49
4 ANALYZING SAMPLE DATA .............................................................................................. 50
Accuri Cytometers
ii 7820011-01 Rev-D
4.1 Viewing the Analyze Tab ........................................................................................... 50 4.2 Setting up Plots ......................................................................................................... 52
4.2.1 Copying Plots from the Collect Tab ............................................................... 52 4.2.2 Creating Plots ................................................................................................ 53 4.2.3 Creating an Overlay Histogram ..................................................................... 53
4.3 Viewing Plots ............................................................................................................. 55
5 VIEWING STATISTICS ........................................................................................................ 57 5.1 Viewing the Statistics Tab ......................................................................................... 58 5.2 Creating the Master Statistics Table ......................................................................... 58 5.3 Previewing a Plot in the Statistics Tab ...................................................................... 59 5.4 Copying Data into Other Applications ....................................................................... 60
6 MAINTAINING THE C6 ........................................................................................................ 61 6.1 Cleaning the SIP ....................................................................................................... 61 6.2 Cleaning the Flow Cell .............................................................................................. 61
6.2.1 Running the Unclog Cycle ............................................................................. 61 6.2.2 Running an Extended Clean of the Flow Cell ................................................ 61
6.3 Cleaning the Fluidics Lines ....................................................................................... 62 6.4 Decontaminating the Fluidics System ....................................................................... 62 6.5 Calibrating the Fluidics System for Precise Volume Measurements ......................... 62
7 ADJUSTING PEAK POSITION WITH VIRTUALGAIN® ....................................................... 64 7.1 Applying VirtualGain .................................................................................................. 65 7.2 Viewing VirtualGain ................................................................................................... 69 7.3 Removing VirtualGain ............................................................................................... 70
APPENDIX A CFLOW MENU QUICK REFERENCE ........................................................... 71
APPENDIX B ADVANCED FLUIDICS SETTINGS ............................................................... 73
APPENDIX C TRACKING USER ACTIVITY ........................................................................ 75 C.1 Installing the User Tracking Module .......................................................................... 75 C.2 Using the Tracking Feature for the First Time ........................................................... 76 C.3 Adding, Deleting, and Modifying User Accounts ....................................................... 76
C.3.1 Adding User Accounts ................................................................................... 76 C.3.2 Deleting User Accounts ................................................................................. 77 C.3.3 Changing a Password ................................................................................... 78
C.4 Signing In and Signing Out ........................................................................................ 78 C.5 Restoring a Forgotten Administrator Password ......................................................... 79 C.6 Monitoring User Activity ............................................................................................. 79
APPENDIX D CFLOW ANALYSIS SOFTWARE .................................................................. 81
APPENDIX E SELECTABLE LASERS ................................................................................. 82 E.1 Installing the Selectable Lasers Module .................................................................... 82 E.2 Validating Proper Function After Installation ............................................................. 85 E.3 Annotating Selected Laser Configuration .................................................................. 88 E.4 Optical Filter Placement ............................................................................................ 88 E.5 Selectable Laser Application Examples .................................................................... 91
E.5.1 2 Blue 2 Red Configuration Examples ........................................................... 91 E.5.2 4 Blue Configuration Examples ..................................................................... 93
APPENDIX F FCS KEYWORDS .......................................................................................... 96
APPENDIX G EXAMPLE .CSV FILE .................................................................................... 99
CFlow User Guide
7820011-01 Rev-D iii
TABLE OF FIGURES
Figure 1-1. Collect Tab Workspace .............................................................................................. 2 Table 1-1. Experimental Design for HPB 4 Color Tutorial File ..................................................... 3 Figure 2-1. Open the Bead Template ........................................................................................... 4 Figure 2-2. Select an Empty Well ................................................................................................. 5 Figure 2-3. Run Limits: Disable Run Unlimited ............................................................................ 5 Figure 2-4. Run Limits: 50000 Events .......................................................................................... 6 Figure 2-5. Sample Name: 8-Peak Beads ................................................................................... 6 Figure 2-6. Select an Empty Well ................................................................................................. 7 Figure 2-7. Run Limits: 50000 Events .......................................................................................... 7 Figure 2-8. Sample Name: 6-Peak Beads ................................................................................... 7 Figure 2-9. Run Limits: 2 Minutes ................................................................................................ 8 Figure 2-10. Plot with Bead Doublets ........................................................................................... 9 Figure 2-11. Gate Applied to 8-Peak Bead Plot ........................................................................... 9 Figure 2-12. Zoomed View of Plot .............................................................................................. 10 Figure 2-13. 8-Peak Validation Bead Data ................................................................................. 11 Figure 2-14. 6-Peak Validation Bead Data ................................................................................. 12 Figure 2-15. Statistics Tab: 8-Peak Bead Data from Successive Days ..................................... 13 Figure 3-1. Collect Tab Workspace ............................................................................................ 16 Table 3-1. Collect Tab Controls .................................................................................................. 16 Figure 3-2. New CFlow Workspace ........................................................................................... 18 Figure 3-3. Threshold Settings Warning Message ..................................................................... 20 Figure 3-4. Primary Threshold Drop-Down List .......................................................................... 20 Figure 3-5. Threshold Settings Dialog Box ................................................................................ 21 Figure 3-6. Run Limits Controls ................................................................................................. 21 Figure 3-7. Sample Name Field ................................................................................................. 22 Figure 3-8. CFlow Workspace after Collecting a Sample .......................................................... 23 Figure 3-9. CFlow Workspace with Empty Sample Well and Empty Plots ................................. 24 Figure 3-10. View of a Plot ......................................................................................................... 25 Figure 3-11. New Density and Histogram Plots ......................................................................... 26 Figure 3-12. Set Plot Specs Dialog Box ..................................................................................... 27 Figure 3-13. Using Polygonal Gating Tool ................................................................................. 28 Figure 3-14. Using the Vertical Marker ...................................................................................... 29 Figure 3-15. Using the Horizontal Marker .................................................................................. 29 Figure 3-16. Selecting a Gating Option ...................................................................................... 30 Figure 3-17. Plot Gated to Include P1 ........................................................................................ 31 Figure 3-18. First Gate for Creating Nested Gates, Drawn in Plot 4 .......................................... 31 Figure 3-19. Applying the Parent Gate to Plot 5 ........................................................................ 32 Figure 3-20. Parent Gate Applied to Dot Plot ............................................................................. 32 Figure 3-21. Second Gate for Creating Nested Gates ............................................................... 33 Figure 3-22. Applying the Child Gate ......................................................................................... 33 Figure 3-23. Third Plot with Nested Gate Applied (R1 in P1) ..................................................... 34 Figure 3-24. Statistics of Plot with Nested Gate ......................................................................... 34 Figure 3-25. Before and After Changing Events Displayed ....................................................... 34 Figure 3-26. Events Display Settings Dialog Box ....................................................................... 35 Figure 3-27. Plot with Events Display Settings Applied ............................................................. 35 Figure 3-28. Click on an Axis Label ........................................................................................... 36 Figure 3-29. Rename Parameters Dialog Box ........................................................................... 36 Figure 3-30. Rename Parameters Dialog Box with Axis Label Drop-Down List......................... 37 Figure 3-31. Before and After Using Zoom Tool ........................................................................ 37 Figure 3-32. Plot Spec Dialog Box: Set Min and Max Channel Values for the X- and Y-Axes .. 38
Accuri Cytometers
iv 7820011-01 Rev-D
Figure 3-33. Title Bar with File Name ......................................................................................... 39 Figure 3-34. Auto-Save Settings Dialog Box .............................................................................. 39 Figure 3-35. Save CFlow File ..................................................................................................... 40 Figure 3-36. Save CFlow Template ........................................................................................... 41 Figure 3-37. Fluorescence Spillover in Different Plots ............................................................... 42 Figure 3-38. Corrected Fluorescence Spillover .......................................................................... 43 Figure 3-39. Placing a Quadrant Tool ........................................................................................ 44 Figure 3-40. Statistics Table Displaying Median Values ............................................................ 44 Figure 3-41. Compensation Settings Dialog Box ....................................................................... 45 Table 3-2. Fluorochrome Spillover per Channel ......................................................................... 45 Figure 3-42. Results of Subtracting Spillover ............................................................................. 46 Figure 3-43. Plot Displaying Overcompensation ........................................................................ 46 Figure 3-44. Set Plot Specs Dialog Box with Hide 1st decade Disabled ................................... 47 Figure 3-45. Properly Compensated Data After First Decade Is Rehidden ............................... 47 Figure 3-46. Plots Selected for Printing ..................................................................................... 48 Figure 3-47. Open an FCS file ................................................................................................... 49 Figure 4-1. Analyze Tab Workspace .......................................................................................... 51 Table 4-1. Analyze Tab Controls ................................................................................................ 51 Figure 4-2. Selecting Plots to Copy from the Collect Tab .......................................................... 52 Figure 4-3. Plot List Containing Copied Plots ............................................................................ 53 Figure 4-4. Blank Overlay Histogram Plot .................................................................................. 54 Figure 4-5. Overlay Histogram Plot with Data ............................................................................ 54 Figure 4-6. Overlay Histogram Legend ...................................................................................... 55 Figure 4-7. Analyze Tab: Plots with Gating Applied ................................................................... 55 Figure 4-8. Analyze Tab: Two Samples Displayed with the Same Plots ................................... 56 Figure 5-1. Statistics Tab Workspace ........................................................................................ 57 Table 5-1. Statistics Tab Controls .............................................................................................. 58 Figure 5-2. Creating Master Statistics Table: Adding Plots ........................................................ 58 Figure 5-3. Creating Master Statistics Table: Adding Samples .................................................. 59 Figure 5-4. Plot Preview ............................................................................................................. 59 Figure 5-5. Sample Selector List and Plot .................................................................................. 60 Figure 7-1. Before and After Applying VirtualGain ..................................................................... 64 Figure 7-2. Setting Up Histograms for VirtualGain ..................................................................... 65 Figure 7-3. Aligning Plots ........................................................................................................... 66 Figure 7-4. Pick the Sample to Align .......................................................................................... 67 Figure 7-5. Move the Peak Definition Marker ............................................................................. 67 Figure 7-6. Align Additional Samples ......................................................................................... 68 Figure 7-7. Black Asterisk Identifier ........................................................................................... 69 Figure 7-8. Plot with Black Asterisk ............................................................................................ 69 Figure 7-9. VirtualGain Applied in an Overlay Histogram .......................................................... 70 Table A-1. CFlow Menus ............................................................................................................ 71 Figure B-1. Custom Radio Button .............................................................................................. 73 Figure B-2. Set Core Size .......................................................................................................... 73 Table B-1. Core Size/Flow Rate Combinations .......................................................................... 74 Figure C-1. User Tracking Installer Icon .................................................................................... 75 Figure C-2. Installation Dialog Box ............................................................................................. 75 Figure C-3. Username and Password Dialog Box ..................................................................... 76 Figure C-4. The Users Information Box ..................................................................................... 77 Figure C-5. Adding a New User ................................................................................................. 77 Figure C-6. Deleting a User ....................................................................................................... 78 Figure C-7. Username and Password Dialog Box ..................................................................... 78
CFlow User Guide
7820011-01 Rev-D v
Figure C-8. userUsage Log ........................................................................................................ 79 Figure C-9. CFlowSupportFiles Folder ....................................................................................... 80 Figure E-1. Selectable Lasers Installer ...................................................................................... 82 Figure E-2. Install Wizard: Choose Activation Keys Directory ................................................... 83 Figure E-3. Install Wizard: Install the Module ............................................................................. 84 Figure E-4. Install Wizard: Setup Completed Successfully ........................................................ 84 Figure E-5. Selectable Laser Controls in the CFlow Workspace ............................................... 85 Figure E-6. Selectable Laser Options: 3 Blue 1 Red ................................................................. 85 Figure E-7. Selectable Laser Options: 2 Blue 2 Red ................................................................. 86 Figure E-8. Selectable Laser Options: 4 Blue ............................................................................ 86 Figure E-9. Evaluation of 6-Peak Validation Beads for the 2 blue 2 red configuration............... 86 Figure E-10. Evaluation of 8-Peak Validation Beads for the 4 Blue Configuration .................... 87 Figure E-11. Renamed Data Well to Indicate 4 Blue Configuration ........................................... 88 Table E-1. 3 Blue 1 Red: Configuration 1 (Standard Filters) ...................................................... 89 Table E-2. 3 Blue 1 Red: Configuration 2 ................................................................................... 89 Table E-3. 2 Blue 2 Red Configuration ....................................................................................... 90 Table E-4. 4 Blue: Configuration 1 ............................................................................................. 90 Table E-5. 4 Blue: Configuration 2 ............................................................................................. 90 Table E-6. 4 Blue: Configuration 3 ............................................................................................. 91 Table E-7. Detector and Filter Configuration for 2 Blue 2 Red, Examples 1 and 2 .................... 91 Figure E-12. Gating Example Using the 2 Blue 2 Red Configuration ........................................ 92 Figure E-13. Standard Beads (30-plex) for a Cytokine Bead Array ........................................... 93 Table E-8. Detector and Filter Configuration for Selectable Lasers 4 Blue Example 1 .............. 93 Figure E-14. 4 Blue Configuration and the Optional 780/60 Optical Filter at Detector FL3........ 94 Table E-9. Detector and Filter Configuration for Selectable Lasers 4 Blue, Example 2 ............. 94 Figure E-15. HPB Stained with CD45-FITC, CD4-PE, CD8-PE-TexasRed and CD3-PE-Cy5 .. 95 Table F-1. Standard FCS Tags .................................................................................................. 96 Table F-2. Custom FCS Tags ..................................................................................................... 98 Table F-3. FCS Tags Not in CFlow Exported Files .................................................................... 98 Table G-1. Example .csv File ..................................................................................................... 99

CFlow User Guide
7820011-01 Rev-D 1
1 INTRODUCTION TO CFLOW The Accuri CFlow® or CFlow Plus software (CFlow) allows you to control the C6 Flow Cytometer® system to acquire data, generate statistics, and analyze results. CFlow is both powerful and easy to use.
CFlow software provides the following features:
Tabbed views for collection, analysis, and statistics
Plots that display more than six decades of dynamic range
Digital signal processing and compensation at any time
Drag and drop plots
Export files in FCS 3.0 format
Seamless importation into FCS Express
1.1 Installing CFlow To install CFlow:
1. Ensure the USB cable is not connected between the computer and cytometer.
2. Turn on the computer and monitor.
3. Insert the CFlow Software CD or flash drive provided by Accuri. When prompted, double-click on CFlowInstaller.exe.
4. Follow the instructions in the installation wizard.
1.2 Starting CFlow Do not use CFlow until the C6 Cytometer has been completely set up (see the C6 Flow Cytometer Instrument Manual).
To open CFlow:
1. Double-click on the CFlow icon on the computer desktop. CFlow opens a new, blank workspace.
NOTE: If CFlow displays the message Extra startup time needed due to cleaning or improper shutdown, the C6 will take several more minutes than usual to recover and return to the green-light ready state. This may occur on initial C6 startup after you receive the unit. It will also occur after an interruption of power to the unit.
Accuri Cytometers
2 7820011-01 Rev-D
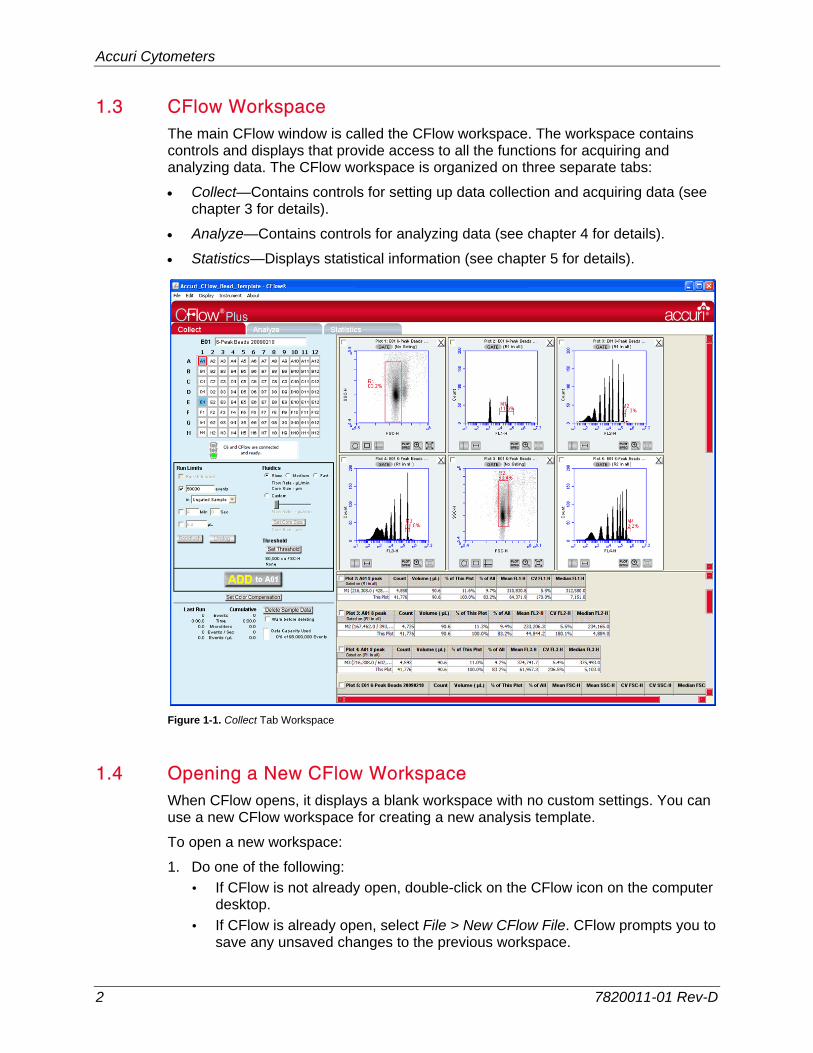
1.3 CFlow Workspace The main CFlow window is called the CFlow workspace. The workspace contains controls and displays that provide access to all the functions for acquiring and analyzing data. The CFlow workspace is organized on three separate tabs:
Collect—Contains controls for setting up data collection and acquiring data (see chapter 3 for details).
Analyze—Contains controls for analyzing data (see chapter 4 for details).
Statistics—Displays statistical information (see chapter 5 for details).
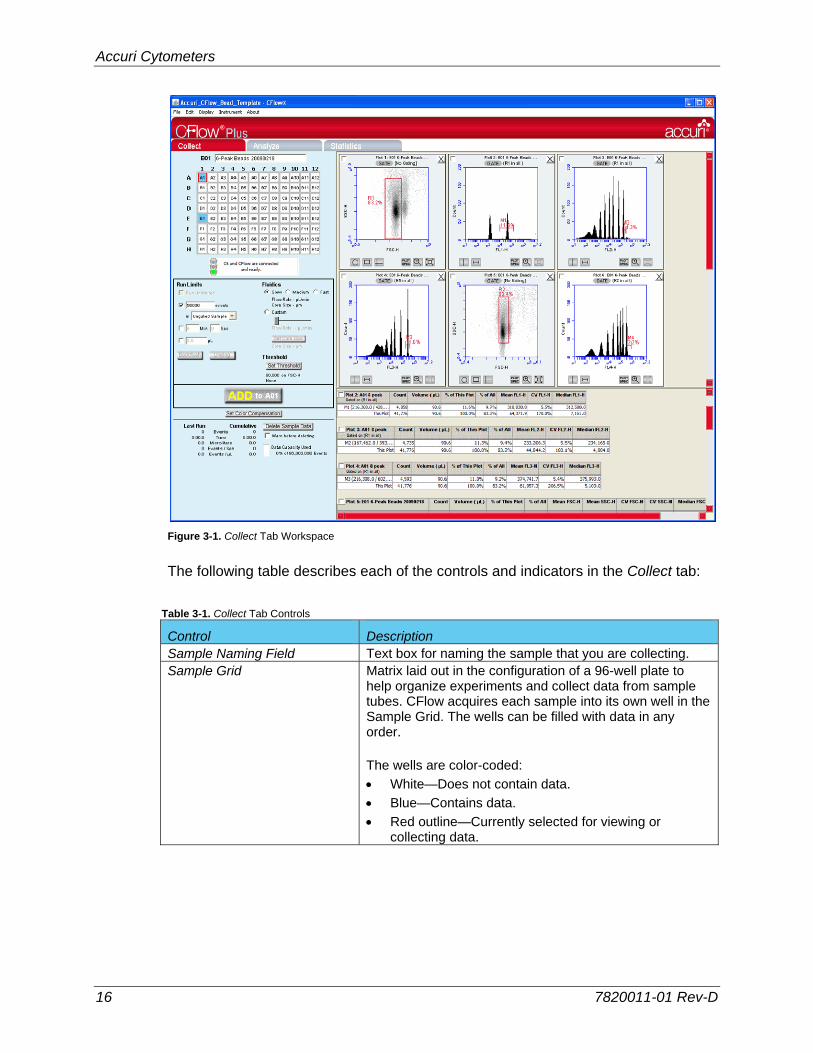
Figure 1-1. Collect Tab Workspace
1.4 Opening a New CFlow Workspace When CFlow opens, it displays a blank workspace with no custom settings. You can use a new CFlow workspace for creating a new analysis template.
To open a new workspace:
1. Do one of the following:
If CFlow is not already open, double-click on the CFlow icon on the computer desktop.
If CFlow is already open, select File > New CFlow File. CFlow prompts you to save any unsaved changes to the previous workspace.
CFlow User Guide
7820011-01 Rev-D 3
1.5 Exiting CFlow To exit CFlow:
1. Select File > Quit.
2. If prompted to save changes to the CFlow workspace, do one of the following:
Click on the Yes button to save changes.
Click on the No button to close CFlow without saving changes.
Click on the Cancel button to cancel the exit and keep CFlow open.
1.6 Using the Example CFlow File An example CFlow file of a four-color analysis of human peripheral blood (HPB 4 Color Tutorial.c6) can be downloaded from the Accuri website (www.accuricytometers.com/technical_information/tutorials/). You can use the data in this file to explore various tools in CFlow without the worry of corrupting or losing your own experimental data. Figures throughout this user guide show data from the example file.
To create the example file, four sample tubes were used to assess the CD3+CD4+ and CD3+CD8+ cell populations. These samples were prepared by staining peripheral blood with directly conjugated antibodies, followed by red cell lysis, according to standard methods.
The following table describes the experimental design:
Tube 1—Background control
Tube 2—White blood cell gating control
Tube 3—Control required for determining the percent of CD4+ and CD8+ cells within the CD45+CD3+ subset
Tube 4—Actual test sample
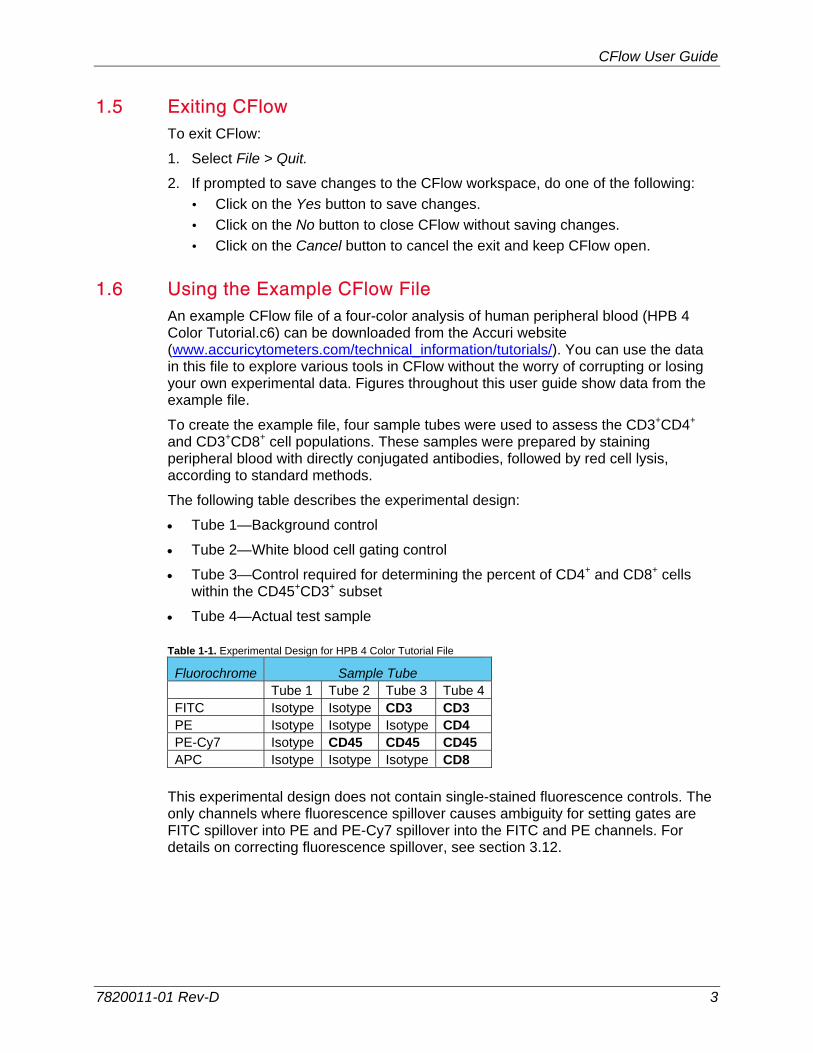
Table 1-1. Experimental Design for HPB 4 Color Tutorial File
Fluorochrome Sample Tube Tube 1 Tube 2 Tube 3 Tube 4FITC Isotype Isotype CD3 CD3 PE Isotype Isotype Isotype CD4 PE-Cy7 Isotype CD45 CD45 CD45 APC Isotype Isotype Isotype CD8
This experimental design does not contain single-stained fluorescence controls. The only channels where fluorescence spillover causes ambiguity for setting gates are FITC spillover into PE and PE-Cy7 spillover into the FITC and PE channels. For details on correcting fluorescence spillover, see section 3.12.

Accuri Cytometers
4 7820011-01 Rev-D
2 VALIDATING THE PERFORMANCE OF THE C6 Perform a validation of the fluidics at least once each day that you use the C6. This ensures that the C6 is working properly before running experimental samples.
Use the same CFlow file each day to collect validation bead data so that you can compare trends over time. When you run a validation, advance to the next empty well in row A-D (for 8-peak beads) or E-H (for 6-peak beads). Include the date in the Sample Naming Field when you name the sample to keep track of each day’s validation. Start a new validation bead file when you fill up the wells.
Reagents required:
Spherotech 8-Peak Validation Beads (Accuri Part# QA-100, supplied with the initial C6 shipment)
Spherotech 6-Peak Validation Beads (Accuri Part# QA-110, supplied with the initial C6 shipment)
Sheath fluid: De-ionized, filtered water (0.2 µm filter) plus Bacteriostatic Concentration Solution (Accuri Part# KR-220, supplied with the initial C6 shipment)
2.1 Running Validation Beads To run the validation beads:
Setup:
1. If this is the first time using the C6 Cytometer, open a CFlow file and run filtered de-ionized water from a 12x75 mm sample tube for at least 15 minutes.
2. Verify that the file named CFlow 8 & 6 Peak Bead Template.c6t has been copied to the CFlow computer. The file is located on the CFlow CD or flash drive and is on the Accuri website (www.accuricytometers.com/technical_information/templates/).
3. Select File > Open CFlow File or Template.
4. In the Open dialog box, browse to the location of the template file and open the file.
Figure 2-1. Open the Bead Template
CFlow User Guide
7820011-01 Rev-D 5
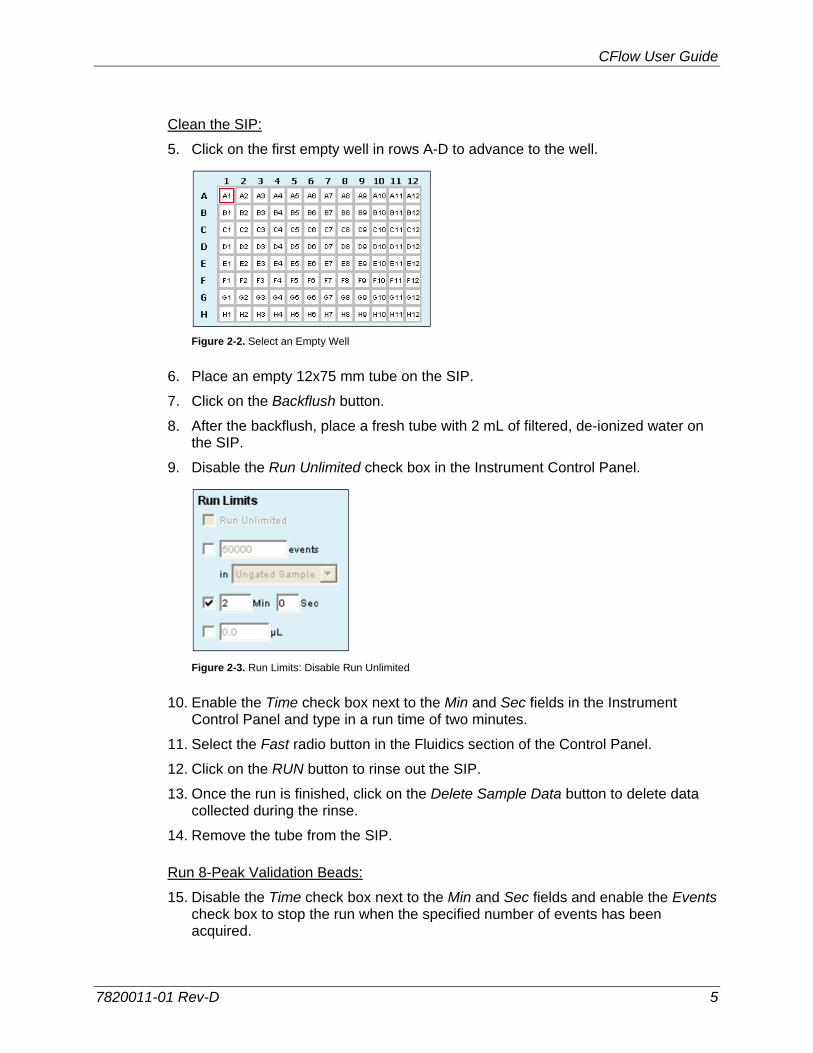
Clean the SIP:
5. Click on the first empty well in rows A-D to advance to the well.
Figure 2-2. Select an Empty Well
6. Place an empty 12x75 mm tube on the SIP.
7. Click on the Backflush button.
8. After the backflush, place a fresh tube with 2 mL of filtered, de-ionized water on the SIP.
9. Disable the Run Unlimited check box in the Instrument Control Panel.
Figure 2-3. Run Limits: Disable Run Unlimited
10. Enable the Time check box next to the Min and Sec fields in the Instrument Control Panel and type in a run time of two minutes.
11. Select the Fast radio button in the Fluidics section of the Control Panel.
12. Click on the RUN button to rinse out the SIP.
13. Once the run is finished, click on the Delete Sample Data button to delete data collected during the rinse.
14. Remove the tube from the SIP.
Run 8-Peak Validation Beads:
15. Disable the Time check box next to the Min and Sec fields and enable the Events check box to stop the run when the specified number of events has been acquired.

Accuri Cytometers
6 7820011-01 Rev-D
16. Type 50000 in the events edit box and select Ungated Sample from the associated drop-down list.
Figure 2-4. Run Limits: 50000 Events
17. Vortex a sample tube containing suspended 8-peak validation beads, prepared according to the package instructions. Place the tube on the SIP.
18. Select the Slow radio button in the Fluidics section of the Control Panel.
19. Click on the RUN button to start acquisition. Acquisition automatically stops after 50,000 total events are acquired.
CAUTION: Make sure the well in CFlow is empty before starting the run. If the button displays ADD TO, the well already contains data.
NOTE: The R1 region may not encompass the main population of bead events on the FSC-H vs. SSC-H plot. This is common and acceptable at this stage.
20. Name the sample by typing a name in the text box just above the Sample Grid. Include the date in the sample name to differentiate it from samples collected on other dates.
NOTE: You can also name samples before, during, or after collection.
Figure 2-5. Sample Name: 8-Peak Beads
21. When the collection is finished, remove the sample tube and wipe off the end of the SIP with a lint-free tissue (or similar material) to minimize sample carryover.
Run 6-Peak Validation Beads:
22. Vortex a tube of suspended 6-peak validation beads, prepared according to the package instructions. Place the tube on the SIP.
CFlow User Guide
7820011-01 Rev-D 7
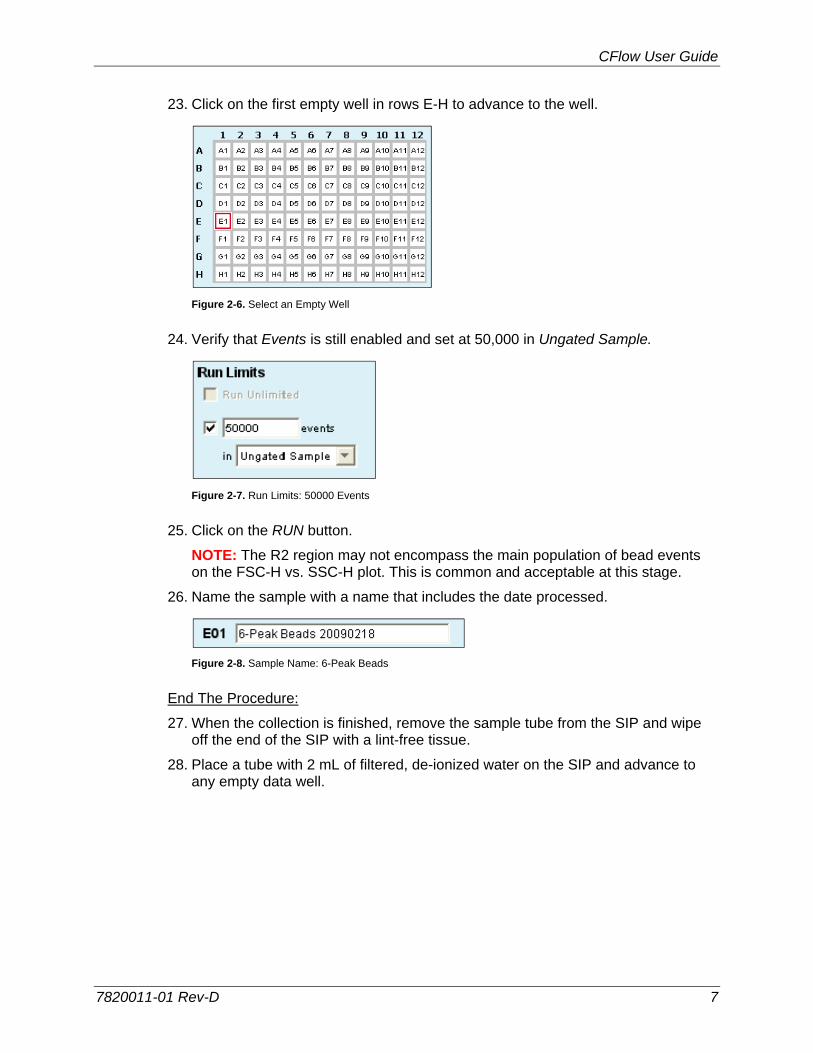
23. Click on the first empty well in rows E-H to advance to the well.
Figure 2-6. Select an Empty Well
24. Verify that Events is still enabled and set at 50,000 in Ungated Sample.
Figure 2-7. Run Limits: 50000 Events
25. Click on the RUN button.
NOTE: The R2 region may not encompass the main population of bead events on the FSC-H vs. SSC-H plot. This is common and acceptable at this stage.
26. Name the sample with a name that includes the date processed.
Figure 2-8. Sample Name: 6-Peak Beads
End The Procedure:
27. When the collection is finished, remove the sample tube from the SIP and wipe off the end of the SIP with a lint-free tissue.
28. Place a tube with 2 mL of filtered, de-ionized water on the SIP and advance to any empty data well.
Accuri Cytometers
8 7820011-01 Rev-D
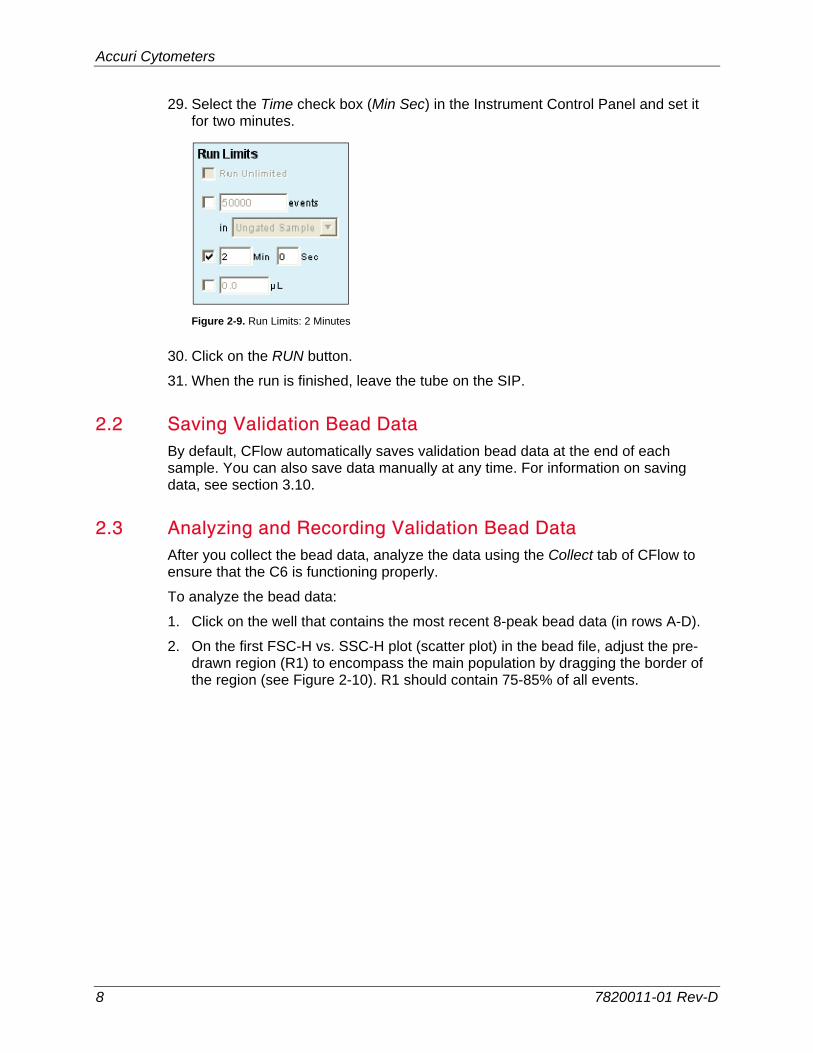
29. Select the Time check box (Min Sec) in the Instrument Control Panel and set it for two minutes.
Figure 2-9. Run Limits: 2 Minutes
30. Click on the RUN button.
31. When the run is finished, leave the tube on the SIP.
2.2 Saving Validation Bead Data By default, CFlow automatically saves validation bead data at the end of each sample. You can also save data manually at any time. For information on saving data, see section 3.10.
2.3 Analyzing and Recording Validation Bead Data After you collect the bead data, analyze the data using the Collect tab of CFlow to ensure that the C6 is functioning properly.
To analyze the bead data:
1. Click on the well that contains the most recent 8-peak bead data (in rows A-D).
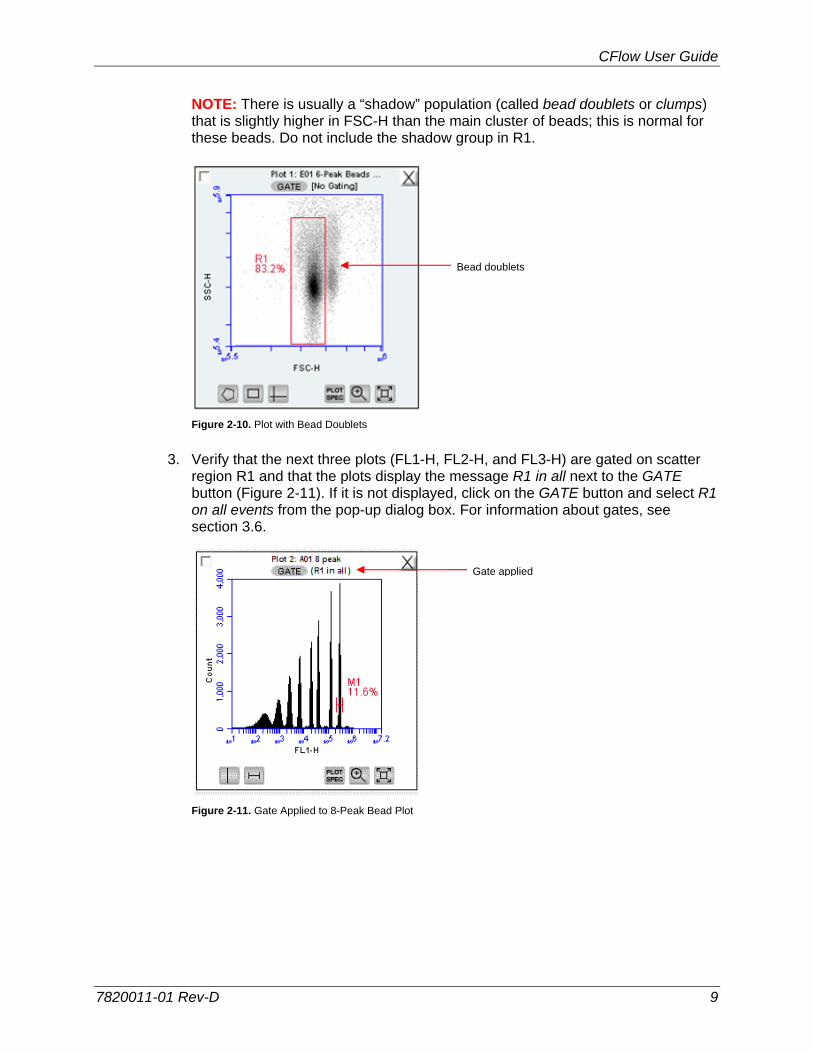
2. On the first FSC-H vs. SSC-H plot (scatter plot) in the bead file, adjust the pre-drawn region (R1) to encompass the main population by dragging the border of the region (see Figure 2-10). R1 should contain 75-85% of all events.
CFlow User Guide
7820011-01 Rev-D 9
NOTE: There is usually a “shadow” population (called bead doublets or clumps) that is slightly higher in FSC-H than the main cluster of beads; this is normal for these beads. Do not include the shadow group in R1.
Figure 2-10. Plot with Bead Doublets
3. Verify that the next three plots (FL1-H, FL2-H, and FL3-H) are gated on scatter region R1 and that the plots display the message R1 in all next to the GATE button (Figure 2-11). If it is not displayed, click on the GATE button and select R1 on all events from the pop-up dialog box. For information about gates, see section 3.6.
Figure 2-11. Gate Applied to 8-Peak Bead Plot
Gate applied
Bead doublets
Accuri Cytometers
10 7820011-01 Rev-D
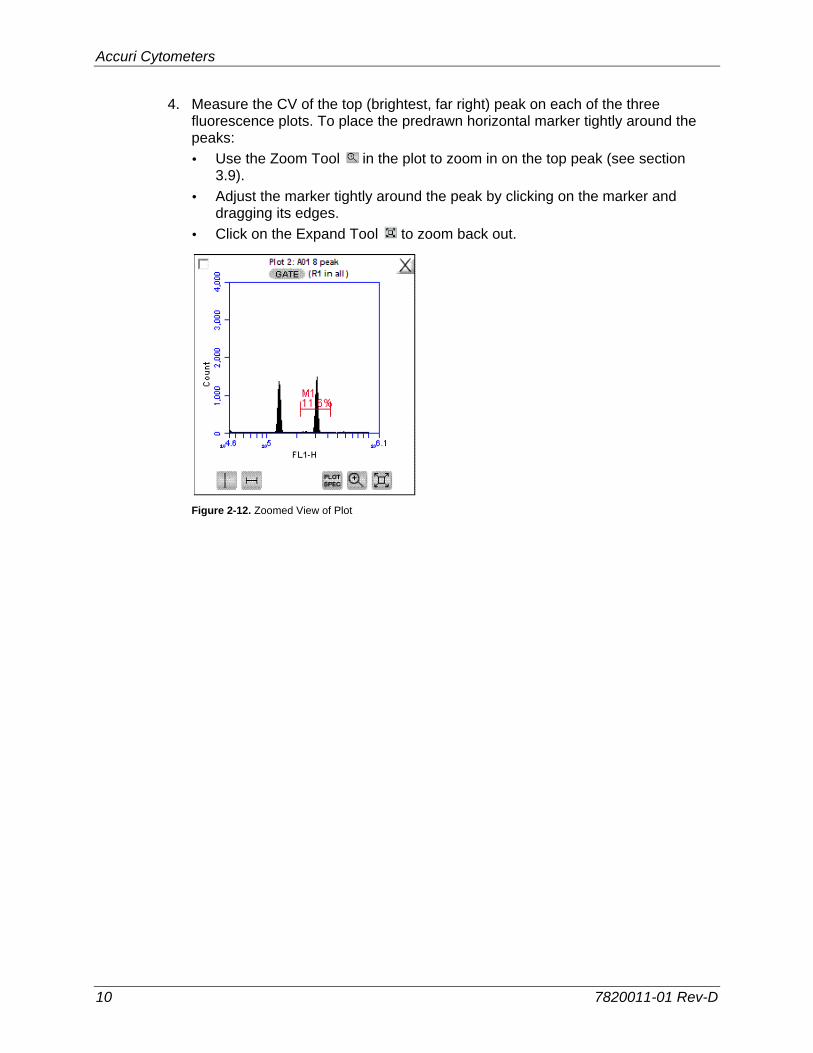
4. Measure the CV of the top (brightest, far right) peak on each of the three fluorescence plots. To place the predrawn horizontal marker tightly around the peaks:
Use the Zoom Tool in the plot to zoom in on the top peak (see section 3.9).
Adjust the marker tightly around the peak by clicking on the marker and dragging its edges.
Click on the Expand Tool to zoom back out.
Figure 2-12. Zoomed View of Plot
CFlow User Guide
7820011-01 Rev-D 11
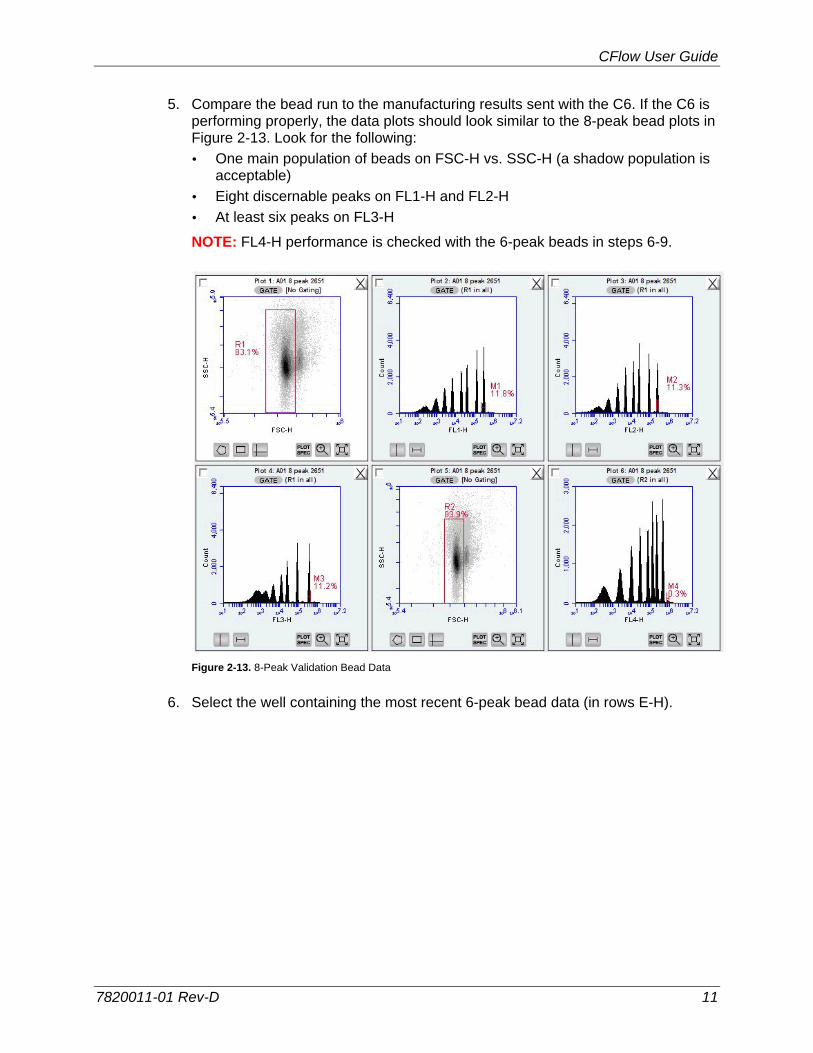
5. Compare the bead run to the manufacturing results sent with the C6. If the C6 is performing properly, the data plots should look similar to the 8-peak bead plots in Figure 2-13. Look for the following:
One main population of beads on FSC-H vs. SSC-H (a shadow population is acceptable)
Eight discernable peaks on FL1-H and FL2-H
At least six peaks on FL3-H
NOTE: FL4-H performance is checked with the 6-peak beads in steps 6-9.
Figure 2-13. 8-Peak Validation Bead Data
6. Select the well containing the most recent 6-peak bead data (in rows E-H).
Accuri Cytometers
12 7820011-01 Rev-D
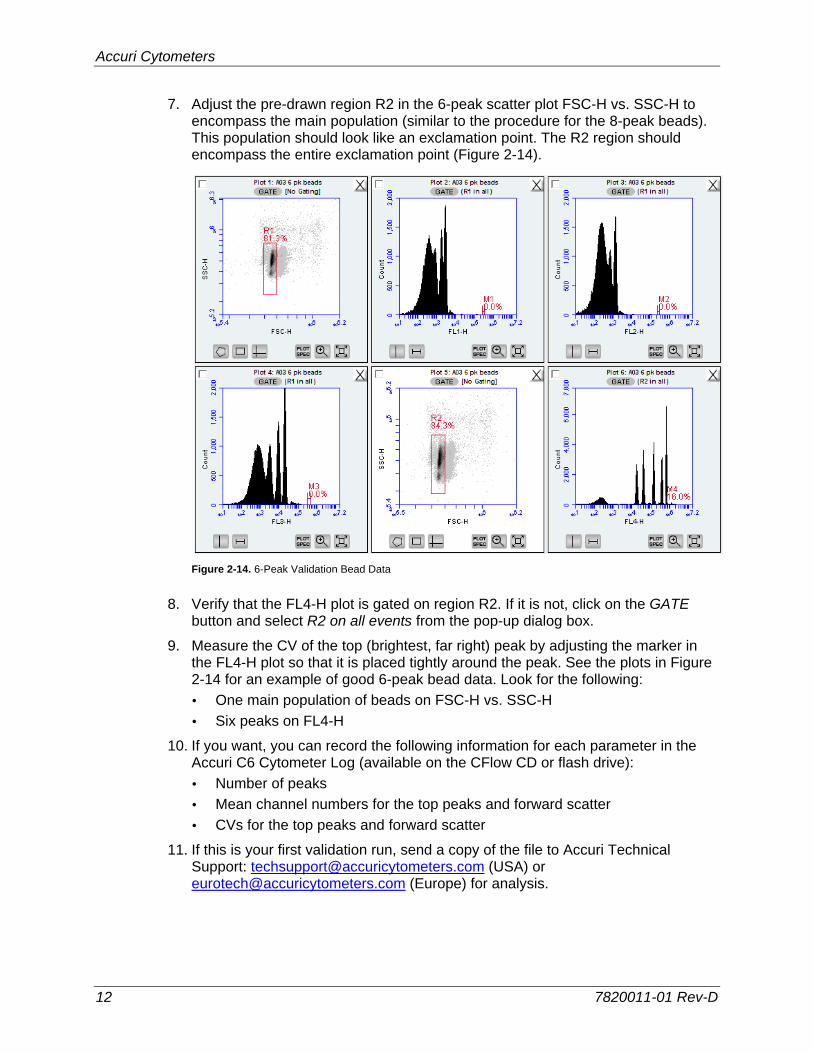
7. Adjust the pre-drawn region R2 in the 6-peak scatter plot FSC-H vs. SSC-H to encompass the main population (similar to the procedure for the 8-peak beads). This population should look like an exclamation point. The R2 region should encompass the entire exclamation point (Figure 2-14).
Figure 2-14. 6-Peak Validation Bead Data
8. Verify that the FL4-H plot is gated on region R2. If it is not, click on the GATE button and select R2 on all events from the pop-up dialog box.
9. Measure the CV of the top (brightest, far right) peak by adjusting the marker in the FL4-H plot so that it is placed tightly around the peak. See the plots in Figure 2-14 for an example of good 6-peak bead data. Look for the following:
One main population of beads on FSC-H vs. SSC-H
Six peaks on FL4-H
10. If you want, you can record the following information for each parameter in the Accuri C6 Cytometer Log (available on the CFlow CD or flash drive):
Number of peaks
Mean channel numbers for the top peaks and forward scatter
CVs for the top peaks and forward scatter
11. If this is your first validation run, send a copy of the file to Accuri Technical Support: [email protected] (USA) or [email protected] (Europe) for analysis.
CFlow User Guide
7820011-01 Rev-D 13
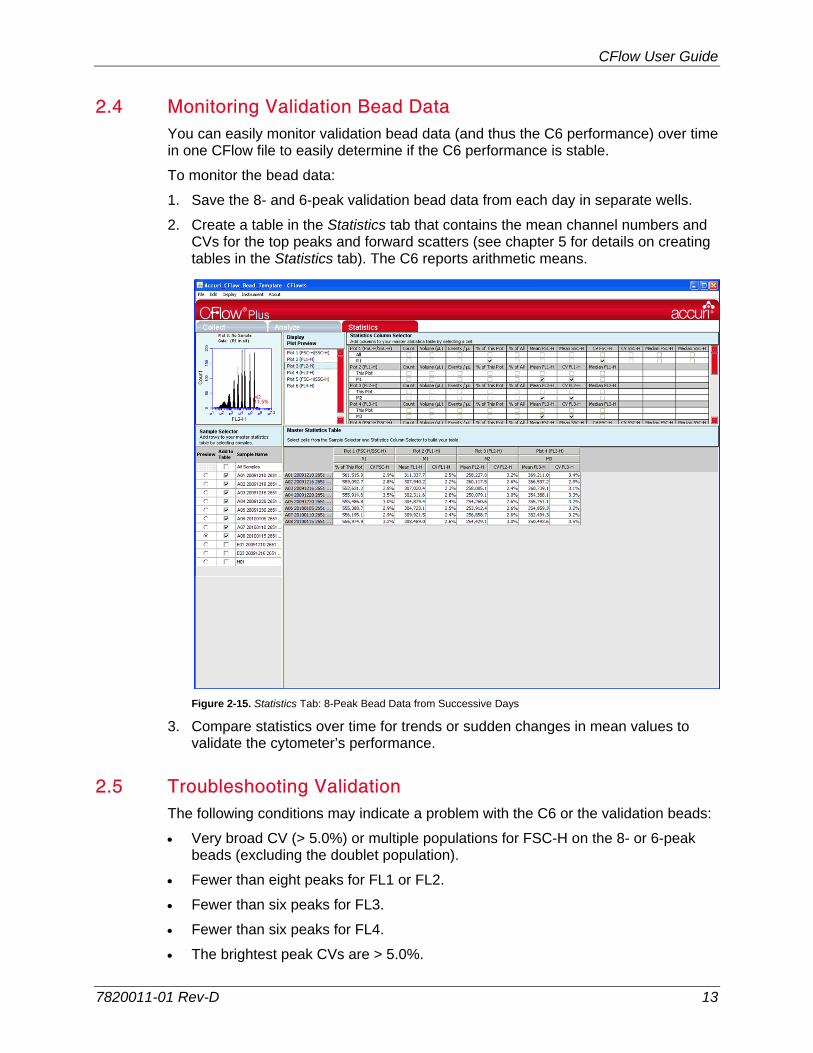
2.4 Monitoring Validation Bead Data You can easily monitor validation bead data (and thus the C6 performance) over time in one CFlow file to easily determine if the C6 performance is stable.
To monitor the bead data:
1. Save the 8- and 6-peak validation bead data from each day in separate wells.
2. Create a table in the Statistics tab that contains the mean channel numbers and CVs for the top peaks and forward scatters (see chapter 5 for details on creating tables in the Statistics tab). The C6 reports arithmetic means.
Figure 2-15. Statistics Tab: 8-Peak Bead Data from Successive Days
3. Compare statistics over time for trends or sudden changes in mean values to validate the cytometer’s performance.
2.5 Troubleshooting Validation The following conditions may indicate a problem with the C6 or the validation beads:
Very broad CV (> 5.0%) or multiple populations for FSC-H on the 8- or 6-peak beads (excluding the doublet population).
Fewer than eight peaks for FL1 or FL2.
Fewer than six peaks for FL3.
Fewer than six peaks for FL4.
The brightest peak CVs are > 5.0%.
Accuri Cytometers
14 7820011-01 Rev-D
To troubleshoot validation:
1. If bead data were not acquired using the slow rate, select Slow, resuspend the beads, and recollect the data.
2. If the beads have been diluted for more than one week, kept at room temperature or warmer, or exposed to light for long periods of time, their performance may be substandard. Make new bead suspensions and run the bead sample again.
3. There may be a bubble or clog in the flow cell. Do one or more of the following:
Run the bead sample again.
Remove the tube from the SIP, place an empty tube under the SIP, and click on the Unclog button. When the unclog cycle is finished (CFlow displays a green Traffic Light), run the bead sample again.
Remove the tube from the SIP, place an empty tube under the SIP, and click on the Backflush button. When the cycle is finished (CFlow displays a green Traffic Light), run the bead sample again.
CFlow User Guide
7820011-01 Rev-D 15
3 COLLECTING DATA The Collect tab allows you to set data collection criteria, start and stop data acquisition, and view data on collected samples. The tab contains buttons and controls for performing the following functions:
Controlling sample collection
Acquiring data
Creating plots (histogram, dot, or density) for viewing data
Setting stop criteria and thresholds
Controlling the fluidics
Using regions and markers to create gates and obtain statistics
Saving and printing plots and data
Accessing the following analytic functions in CFlow:
Creating complex gates
Setting fluorescence compensation
Generating statistics
3.1 Viewing the Collect Tab CFlow displays the Collect tab when CFlow opens. You can also view the tab by clicking on Collect from the Analyze or Statistics tabs.
The Collect tab is organized into two major sections:
Instrument Control Panel—Panel on the left side of the window that contains controls for collecting data.
Data display—Large area on the right side of the window that shows sample data in plots and in a Statistics Table.
Accuri Cytometers
16 7820011-01 Rev-D
Figure 3-1. Collect Tab Workspace
The following table describes each of the controls and indicators in the Collect tab:
Table 3-1. Collect Tab Controls
Control Description Sample Naming Field Text box for naming the sample that you are collecting. Sample Grid Matrix laid out in the configuration of a 96-well plate to
help organize experiments and collect data from sample tubes. CFlow acquires each sample into its own well in the Sample Grid. The wells can be filled with data in any order. The wells are color-coded:
White—Does not contain data.
Blue—Contains data.
Red outline—Currently selected for viewing or collecting data.
CFlow User Guide
7820011-01 Rev-D 17
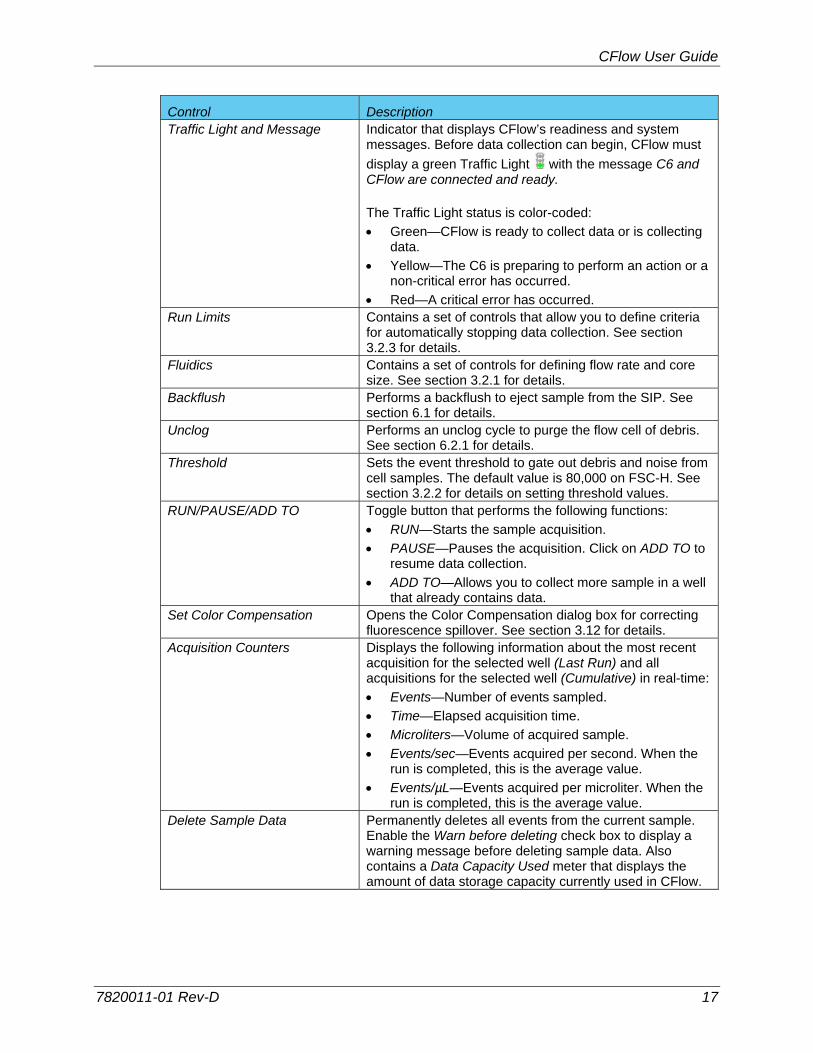
Control Description Traffic Light and Message Indicator that displays CFlow’s readiness and system
messages. Before data collection can begin, CFlow must
display a green Traffic Light with the message C6 and CFlow are connected and ready. The Traffic Light status is color-coded:
Green—CFlow is ready to collect data or is collecting data.
Yellow—The C6 is preparing to perform an action or a non-critical error has occurred.
Red—A critical error has occurred. Run Limits Contains a set of controls that allow you to define criteria
for automatically stopping data collection. See section 3.2.3 for details.
Fluidics Contains a set of controls for defining flow rate and core size. See section 3.2.1 for details.
Backflush Performs a backflush to eject sample from the SIP. See section 6.1 for details.
Unclog Performs an unclog cycle to purge the flow cell of debris. See section 6.2.1 for details.
Threshold Sets the event threshold to gate out debris and noise from cell samples. The default value is 80,000 on FSC-H. See section 3.2.2 for details on setting threshold values.
RUN/PAUSE/ADD TO Toggle button that performs the following functions:
RUN—Starts the sample acquisition.
PAUSE—Pauses the acquisition. Click on ADD TO to resume data collection.
ADD TO—Allows you to collect more sample in a well that already contains data.
Set Color Compensation Opens the Color Compensation dialog box for correcting fluorescence spillover. See section 3.12 for details.
Acquisition Counters Displays the following information about the most recent acquisition for the selected well (Last Run) and all acquisitions for the selected well (Cumulative) in real-time:
Events—Number of events sampled.
Time—Elapsed acquisition time.
Microliters—Volume of acquired sample.
Events/sec—Events acquired per second. When the run is completed, this is the average value.
Events/µL—Events acquired per microliter. When the run is completed, this is the average value.
Delete Sample Data Permanently deletes all events from the current sample. Enable the Warn before deleting check box to display a warning message before deleting sample data. Also contains a Data Capacity Used meter that displays the amount of data storage capacity currently used in CFlow.
Accuri Cytometers
18 7820011-01 Rev-D
Control Description Plots Pane Area displaying two rows of plot corrals for graphically
viewing data on the selected sample. Scroll up or down to view additional plots. You can create multiple plots for each sample. Each plot corral contains buttons for creating histogram, scatter, and dot plots. For information on creating and using plots, see section 3.4.
Statistics Table Table below the plots that displays statistical information on individual plots.
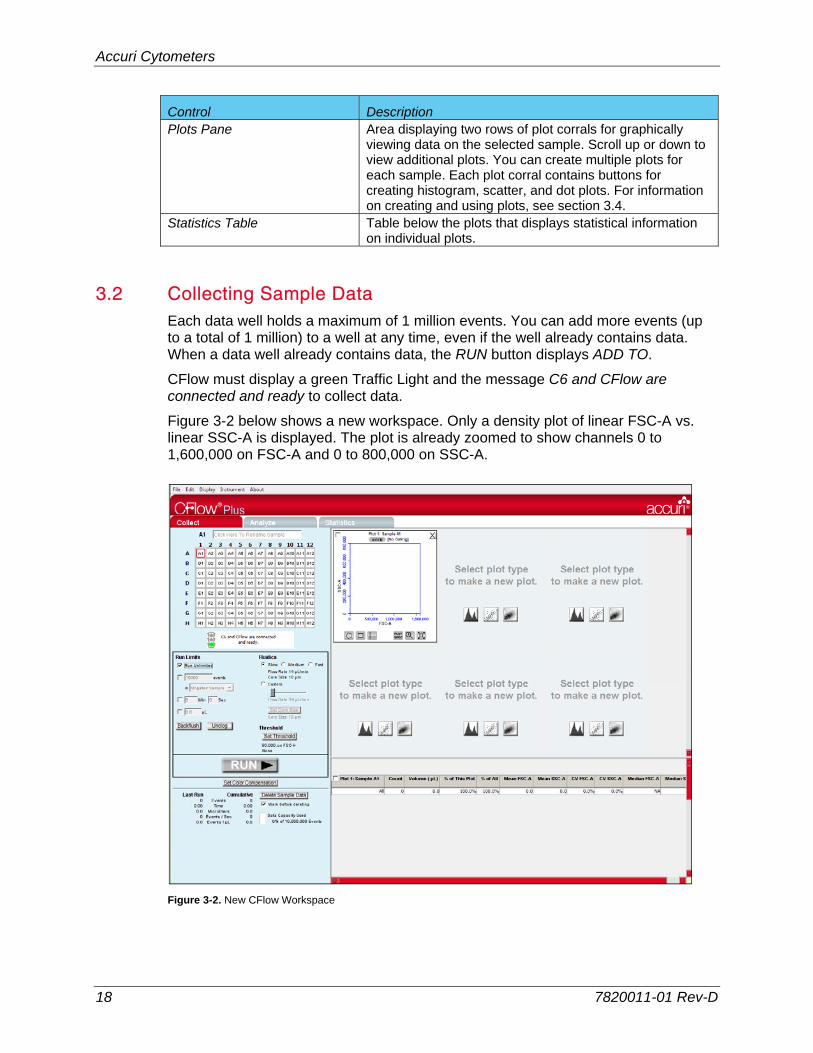
3.2 Collecting Sample Data Each data well holds a maximum of 1 million events. You can add more events (up to a total of 1 million) to a well at any time, even if the well already contains data. When a data well already contains data, the RUN button displays ADD TO.
CFlow must display a green Traffic Light and the message C6 and CFlow are connected and ready to collect data.
Figure 3-2 below shows a new workspace. Only a density plot of linear FSC-A vs. linear SSC-A is displayed. The plot is already zoomed to show channels 0 to 1,600,000 on FSC-A and 0 to 800,000 on SSC-A.
Figure 3-2. New CFlow Workspace
CFlow User Guide
7820011-01 Rev-D 19
To collect sample data:
1. Set the fluidics rate (see section 3.2.1), threshold (see section 3.2.2), and run limits (see section 3.2.3).
2. Optionally, name the sample (see section 3.2.4).
3. Collect sample data (see section 3.2.5).
4. Open plots (see section 3.4).
5. Set and apply gates (see section 3.6).
6. Name plot axes (see section 3.8).
7. Apply fluorescence compensation values (see section 3.12).
8. Analyze the sample data (see chapter 4).
Alternatively, you can collect all data with minimal setup and perform analysis at a later time (including setting gates and applying fluorescence compensation).
To collect data with minimal setup:
1. Set the run limits, fluidics rate, and thresholds.
2. Collect the data for all samples.
3.2.1 Setting the Fluidics Rate The system can accommodate an upper limit of 10,000 events per second, but it is recommended to acquire samples at a rate of 2,500 events per second or less to ensure the best data resolution.
To set the fluidics rate:
1. Click on the Slow, Medium, or Fast radio button in the Fluidics section of the Collect tab.
NOTE: It is recommended to start data collection on slow and observe the data rate. You can then adjust the setting to medium or fast, if necessary.
You can customize your fluidics rate settings and adjust the sample core size for a range of cell sizes.
3.2.2 Setting the Threshold Thresholds gate out debris and noise from cell samples so that sample data are not compromised. By default, CFlow filters out events lower than channel 80,000.
You can change the threshold settings at any time before, during, or after data acquisition. The primary threshold is the parameter that triggers data collection. You can optionally set a secondary threshold to filter out additional data. FSC-H is the default primary threshold.
Accuri Cytometers
20 7820011-01 Rev-D
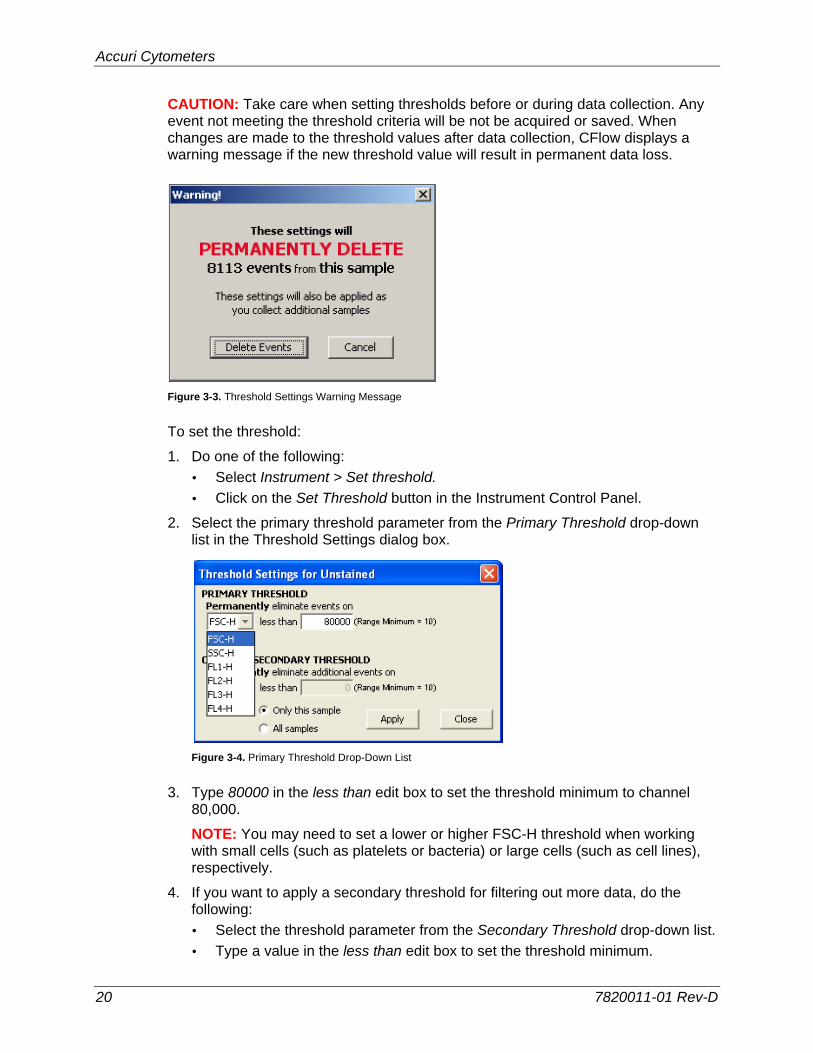
CAUTION: Take care when setting thresholds before or during data collection. Any event not meeting the threshold criteria will be not be acquired or saved. When changes are made to the threshold values after data collection, CFlow displays a warning message if the new threshold value will result in permanent data loss.
Figure 3-3. Threshold Settings Warning Message
To set the threshold:
1. Do one of the following:
Select Instrument > Set threshold.
Click on the Set Threshold button in the Instrument Control Panel.
2. Select the primary threshold parameter from the Primary Threshold drop-down list in the Threshold Settings dialog box.
Figure 3-4. Primary Threshold Drop-Down List
3. Type 80000 in the less than edit box to set the threshold minimum to channel 80,000.
NOTE: You may need to set a lower or higher FSC-H threshold when working with small cells (such as platelets or bacteria) or large cells (such as cell lines), respectively.
4. If you want to apply a secondary threshold for filtering out more data, do the following:
Select the threshold parameter from the Secondary Threshold drop-down list.
Type a value in the less than edit box to set the threshold minimum.
CFlow User Guide
7820011-01 Rev-D 21
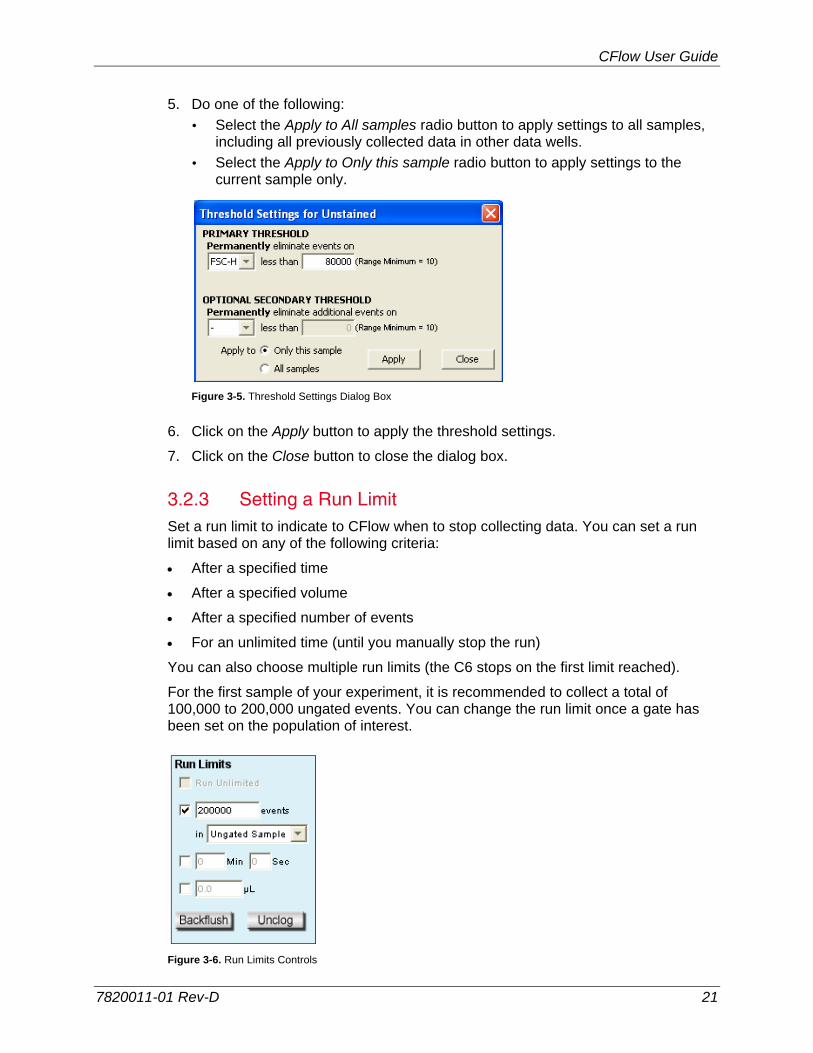
5. Do one of the following:
Select the Apply to All samples radio button to apply settings to all samples, including all previously collected data in other data wells.
Select the Apply to Only this sample radio button to apply settings to the current sample only.
Figure 3-5. Threshold Settings Dialog Box
6. Click on the Apply button to apply the threshold settings.
7. Click on the Close button to close the dialog box.
3.2.3 Setting a Run Limit Set a run limit to indicate to CFlow when to stop collecting data. You can set a run limit based on any of the following criteria:
After a specified time
After a specified volume
After a specified number of events
For an unlimited time (until you manually stop the run)
You can also choose multiple run limits (the C6 stops on the first limit reached).
For the first sample of your experiment, it is recommended to collect a total of 100,000 to 200,000 ungated events. You can change the run limit once a gate has been set on the population of interest.
Figure 3-6. Run Limits Controls
Accuri Cytometers
22 7820011-01 Rev-D
To collect samples without setting a run limit:
1. Disable all check boxes in the Run Limits section of the Collect tab.
2. Enable the Run Unlimited check box.
To stop the run after a specified number of events have been sampled:
1. Enable the check box next to the events field.
2. In the associated text box, type the number of events at which to stop the run.
3. Do one of the following in the drop-down list below the text box:
Select Ungated Sample.
Select a gating strategy (if one exists) to stop the run when the assigned number of events has been collected in the gating region.
To stop the run after a time has expired:
1. Enable the check box next to the min and sec fields.
2. Type the number of minutes (min) and seconds (sec) at which to stop the run.
To stop the run after a specified volume has been sampled:
1. Enable the check box next to the µL field.
2. Type the volume in microliters (µL) at which to stop the run.
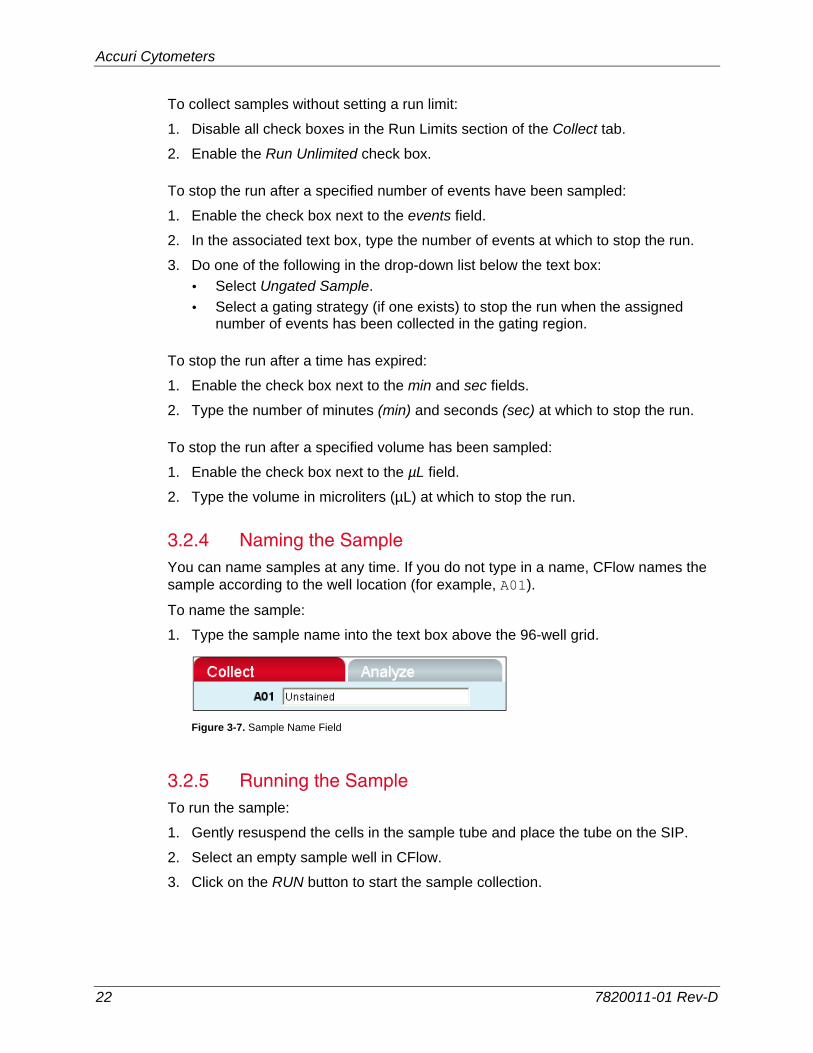
3.2.4 Naming the Sample You can name samples at any time. If you do not type in a name, CFlow names the sample according to the well location (for example, A01).
To name the sample:
1. Type the sample name into the text box above the 96-well grid.
Figure 3-7. Sample Name Field
3.2.5 Running the Sample To run the sample:
1. Gently resuspend the cells in the sample tube and place the tube on the SIP.
2. Select an empty sample well in CFlow.
3. Click on the RUN button to start the sample collection.
CFlow User Guide
7820011-01 Rev-D 23
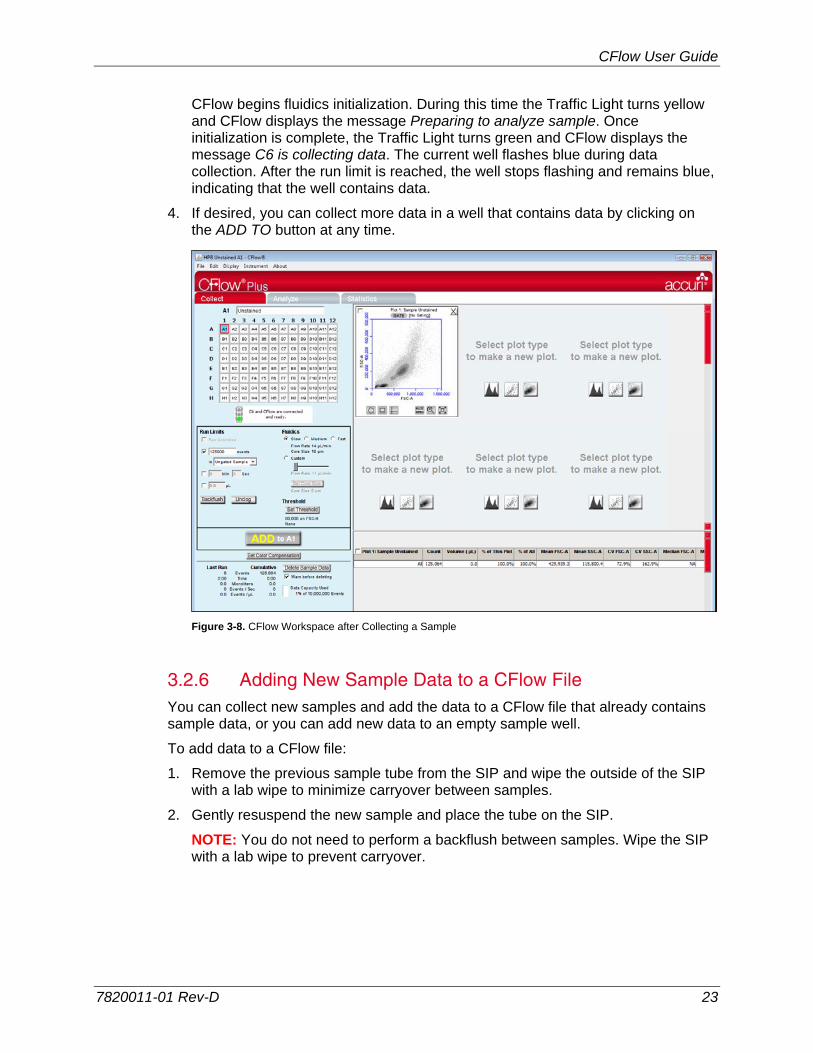
CFlow begins fluidics initialization. During this time the Traffic Light turns yellow and CFlow displays the message Preparing to analyze sample. Once initialization is complete, the Traffic Light turns green and CFlow displays the message C6 is collecting data. The current well flashes blue during data collection. After the run limit is reached, the well stops flashing and remains blue, indicating that the well contains data.
4. If desired, you can collect more data in a well that contains data by clicking on the ADD TO button at any time.
Figure 3-8. CFlow Workspace after Collecting a Sample
3.2.6 Adding New Sample Data to a CFlow File You can collect new samples and add the data to a CFlow file that already contains sample data, or you can add new data to an empty sample well.
To add data to a CFlow file:
1. Remove the previous sample tube from the SIP and wipe the outside of the SIP with a lab wipe to minimize carryover between samples.
2. Gently resuspend the new sample and place the tube on the SIP.
NOTE: You do not need to perform a backflush between samples. Wipe the SIP with a lab wipe to prevent carryover.
Accuri Cytometers
24 7820011-01 Rev-D
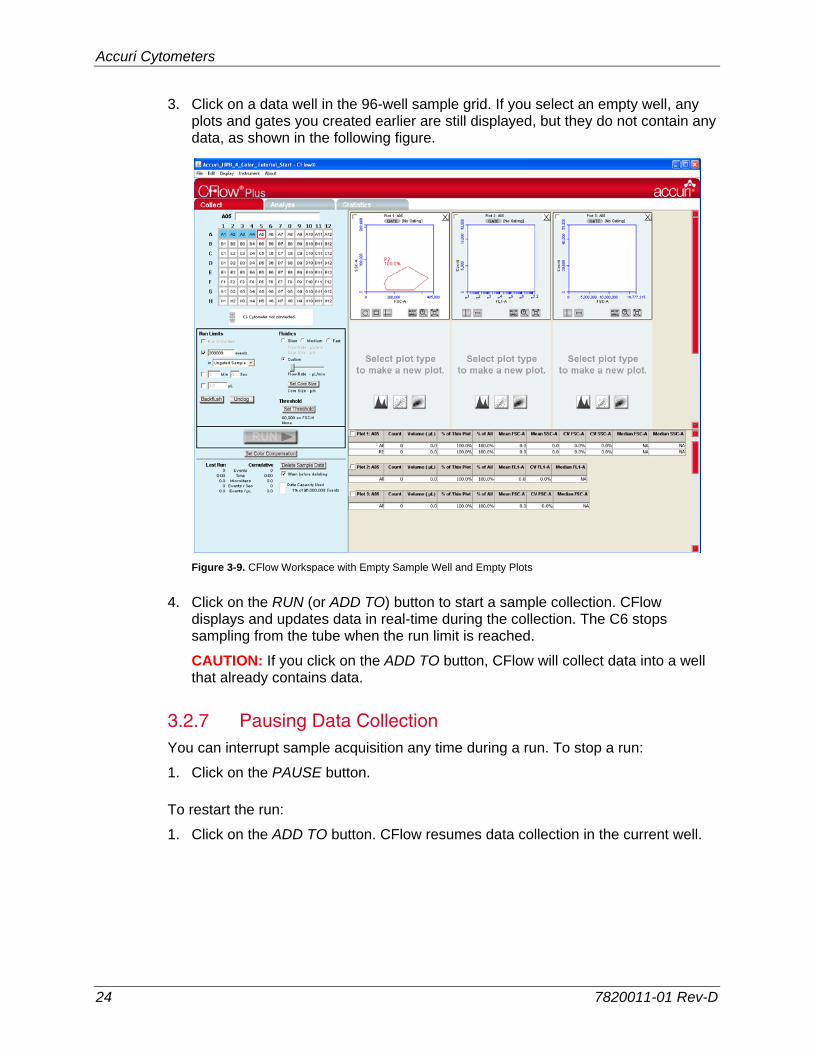
3. Click on a data well in the 96-well sample grid. If you select an empty well, any plots and gates you created earlier are still displayed, but they do not contain any data, as shown in the following figure.
Figure 3-9. CFlow Workspace with Empty Sample Well and Empty Plots
4. Click on the RUN (or ADD TO) button to start a sample collection. CFlow displays and updates data in real-time during the collection. The C6 stops sampling from the tube when the run limit is reached.
CAUTION: If you click on the ADD TO button, CFlow will collect data into a well that already contains data.
3.2.7 Pausing Data Collection You can interrupt sample acquisition any time during a run. To stop a run:
1. Click on the PAUSE button.
To restart the run:
1. Click on the ADD TO button. CFlow resumes data collection in the current well.
CFlow User Guide
7820011-01 Rev-D 25
3.3 Ending a Data Collection Session When you finish collecting samples, rinse out the SIP to ensure cells or other particles are not left in the SIP.
To end a data collection session:
NOTE: If you plan to collect more samples later in the day, you can skip steps 1-8.
1. Place a tube with 2 mL of filtered, de-ionized water on the SIP and advance to any empty data well.
2. Set the time limit for two minutes.
3. Click on the RUN button.
4. Place a tube with 2 mL of decontamination solution (#KR-200) on the SIP.
5. Select an empty data well.
6. Set the time limit for two minutes and the fluidics speed to fast.
7. Click on the RUN button.
8. Once the run is finished, remove the tube of decontamination solution from the SIP.
9. Place a tube with 2 mL of filtered, de-ionized water on the SIP and advance to any empty data well.
10. Set the time limit for two minutes.
11. Click on the RUN button.
12. When the run is finished, leave the tube on the SIP.
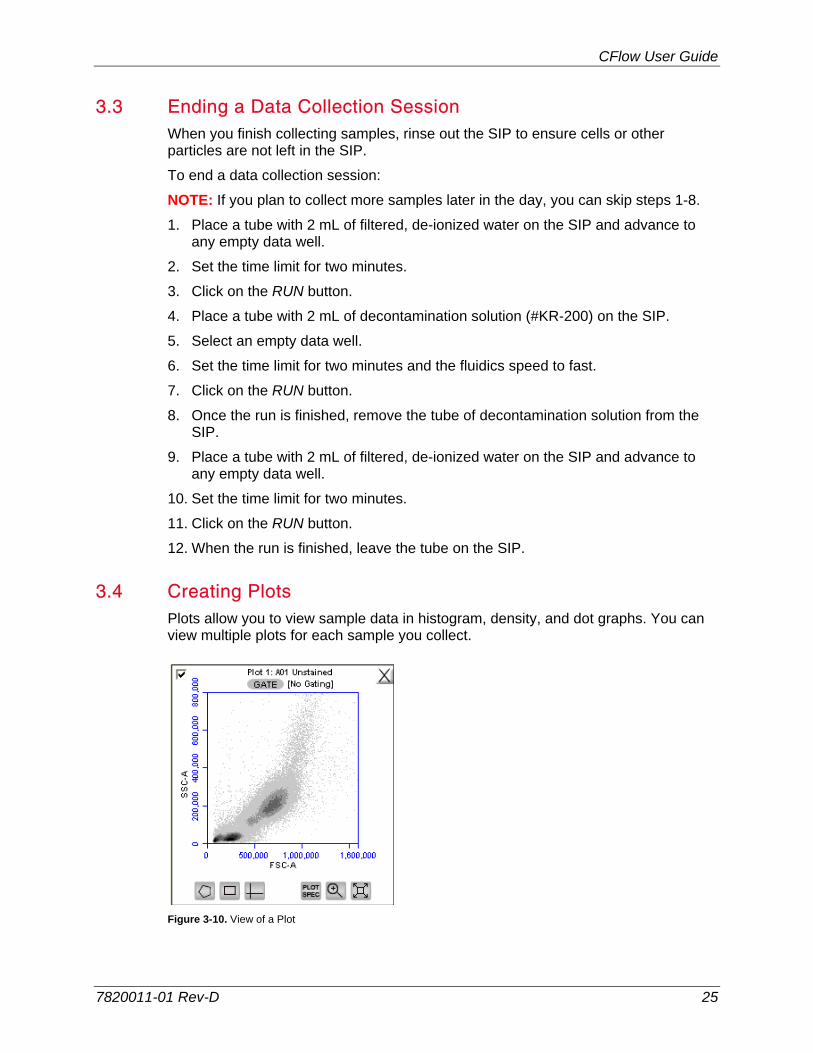
3.4 Creating Plots Plots allow you to view sample data in histogram, density, and dot graphs. You can view multiple plots for each sample you collect.
Figure 3-10. View of a Plot
Accuri Cytometers
26 7820011-01 Rev-D
Each plot contains a set of gating and marking tools and a set of viewing tools:
Gating and marking tools:
Gate button —Opens the Change Gating dialog box for applying gates to a plot.
Polygonal Gating Tool —Used for drawing irregularly shaped gates around a population of events.
Rectilinear Gating Tool —Used for drawing a rectilinear gate around a population of events.
Quadrant Gating Tool —Used for gating the plot in quadrants.
Vertical Marker Tool —Used for gating histograms to the right or left of a vertical marker.
Horizontal Marker Tool —Used for gating histograms within a horizontal marker.
Viewing tools:
Plot Spec Tool —Opens the Set Plot Specs dialog box for changing the x- and y-axis parameters, scaling the plot, and setting log or linear view.
Zoom Tool —Allows you to draw a rectilinear range in the plot to zoom in on.
Expand Tool —Zooms out one level.
To create a new plot:
1. Click on one of the following icons in an empty plot corral:
Density Plot
Dot Plot
Histogram Plot
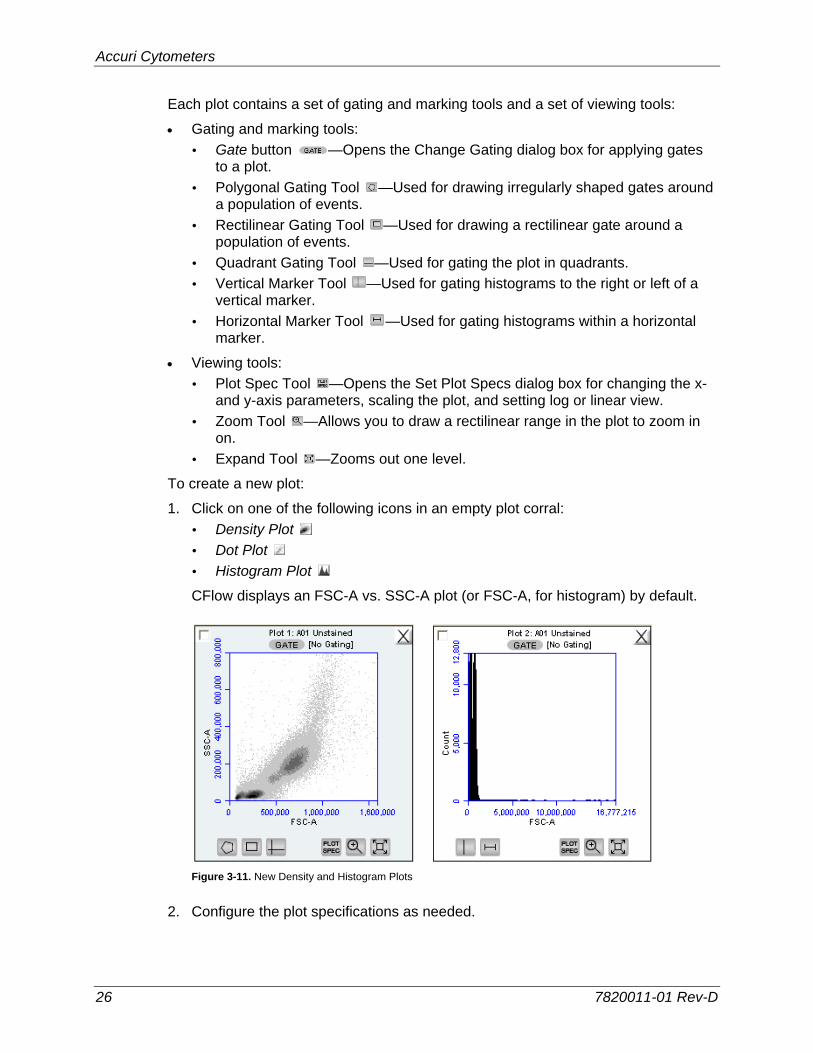
CFlow displays an FSC-A vs. SSC-A plot (or FSC-A, for histogram) by default.
Figure 3-11. New Density and Histogram Plots
2. Configure the plot specifications as needed.
CFlow User Guide
7820011-01 Rev-D 27
3.5 Changing Plot Specifications The Plot Spec Tool allows you to change the way data are displayed in a plot. You can change axis parameters, specify channel ranges, and toggle between linear and logarithmic scales. The Plot Spec Tool is available in the Collect and Analyze tabs.
You can set up or modify plot specifications at any time before or after collecting data.
To change the plot specifications:
1. Click on the Plot Spec Tool icon.
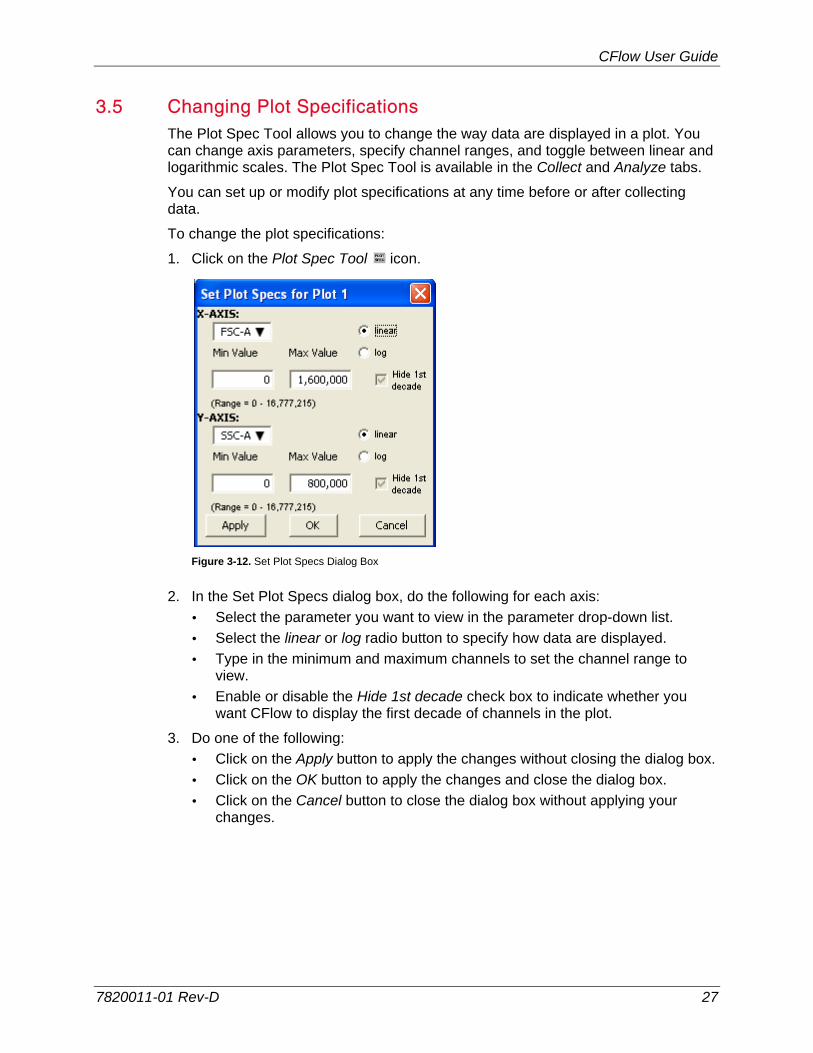
Figure 3-12. Set Plot Specs Dialog Box
2. In the Set Plot Specs dialog box, do the following for each axis:
Select the parameter you want to view in the parameter drop-down list.
Select the linear or log radio button to specify how data are displayed.
Type in the minimum and maximum channels to set the channel range to view.
Enable or disable the Hide 1st decade check box to indicate whether you want CFlow to display the first decade of channels in the plot.
3. Do one of the following:
Click on the Apply button to apply the changes without closing the dialog box.
Click on the OK button to apply the changes and close the dialog box.
Click on the Cancel button to close the dialog box without applying your changes.
Accuri Cytometers
28 7820011-01 Rev-D
3.6 Using Gates and Markers A gate is a specified area within a plot that is used to designate a set of events to analyze. You can create any of the following types of gates:
Polygonal gate—Gates an irregularly shaped area around a population of events.
Rectilinear gate—Gates a rectilinear area around a population of events.
Quadrant gate—Gates the plot in quadrants.
Vertical marker—Gates a histogram plot to the right or left of a vertical marker.
Horizontal marker—Gates a histogram plot within a horizontal marker.
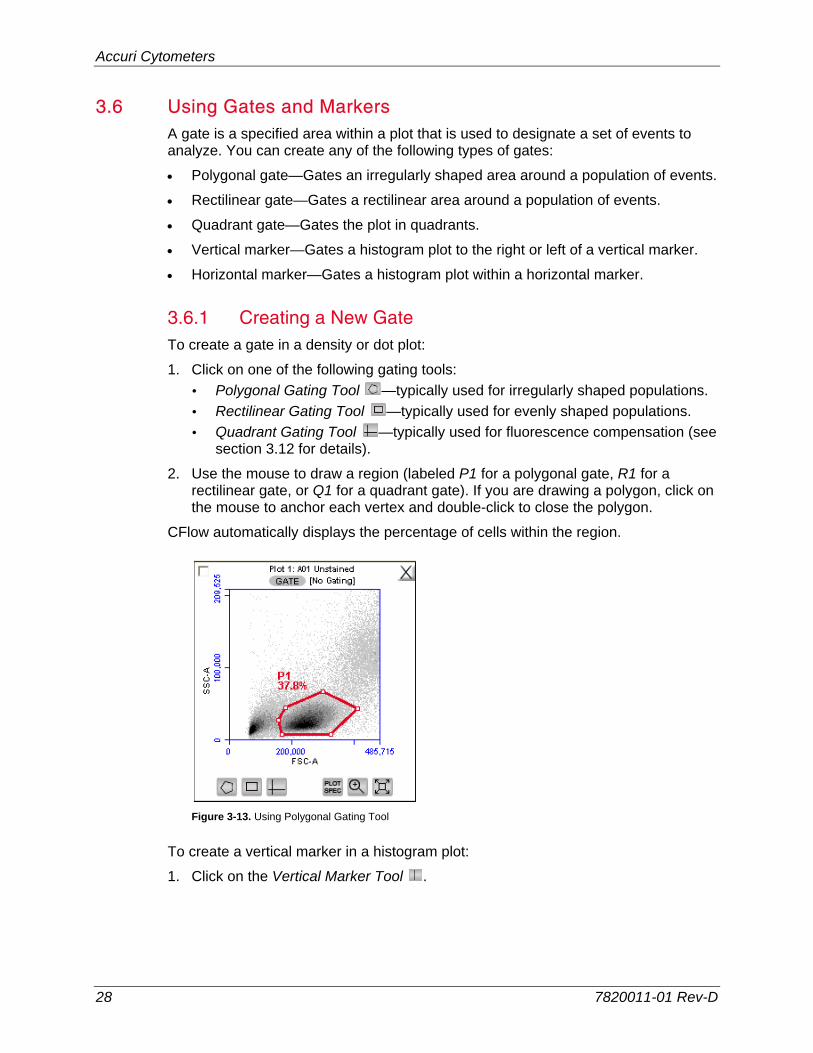
3.6.1 Creating a New Gate To create a gate in a density or dot plot:
1. Click on one of the following gating tools:
Polygonal Gating Tool —typically used for irregularly shaped populations.
Rectilinear Gating Tool —typically used for evenly shaped populations.
Quadrant Gating Tool —typically used for fluorescence compensation (see section 3.12 for details).
2. Use the mouse to draw a region (labeled P1 for a polygonal gate, R1 for a rectilinear gate, or Q1 for a quadrant gate). If you are drawing a polygon, click on the mouse to anchor each vertex and double-click to close the polygon.
CFlow automatically displays the percentage of cells within the region.
Figure 3-13. Using Polygonal Gating Tool
To create a vertical marker in a histogram plot:
1. Click on the Vertical Marker Tool .
CFlow User Guide
7820011-01 Rev-D 29
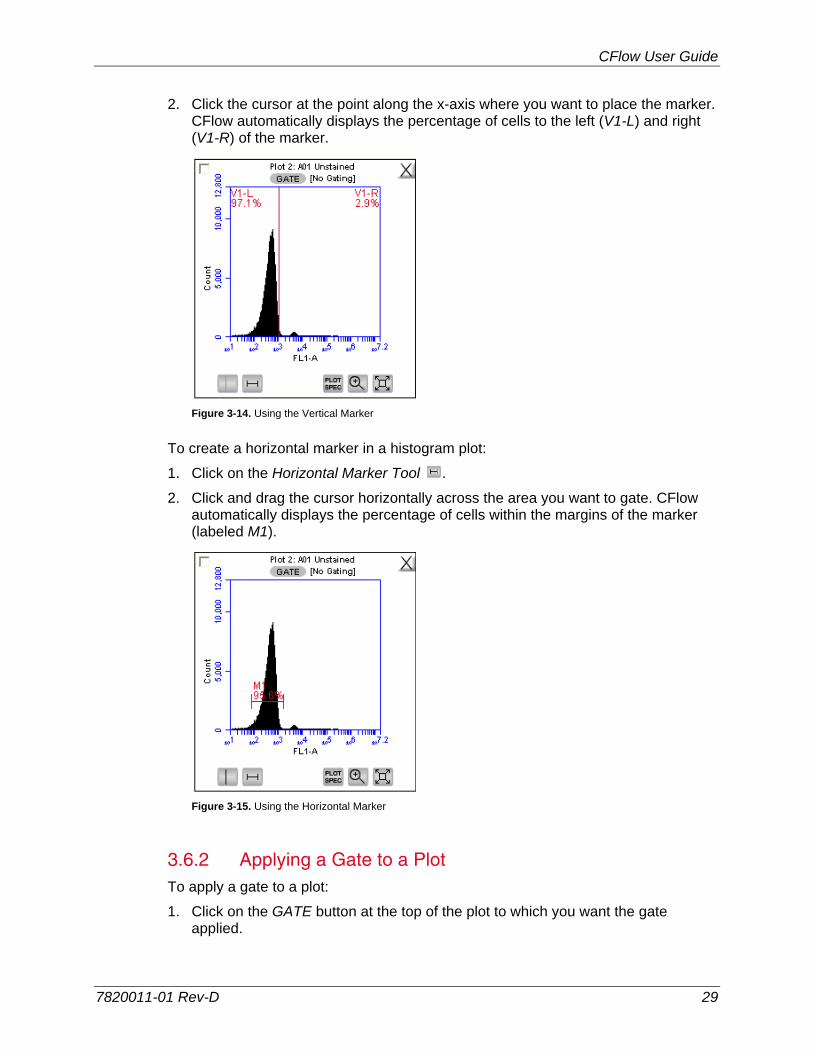
2. Click the cursor at the point along the x-axis where you want to place the marker. CFlow automatically displays the percentage of cells to the left (V1-L) and right (V1-R) of the marker.
Figure 3-14. Using the Vertical Marker
To create a horizontal marker in a histogram plot:
1. Click on the Horizontal Marker Tool .
2. Click and drag the cursor horizontally across the area you want to gate. CFlow automatically displays the percentage of cells within the margins of the marker (labeled M1).
Figure 3-15. Using the Horizontal Marker
3.6.2 Applying a Gate to a Plot To apply a gate to a plot:
1. Click on the GATE button at the top of the plot to which you want the gate applied.
Accuri Cytometers
30 7820011-01 Rev-D
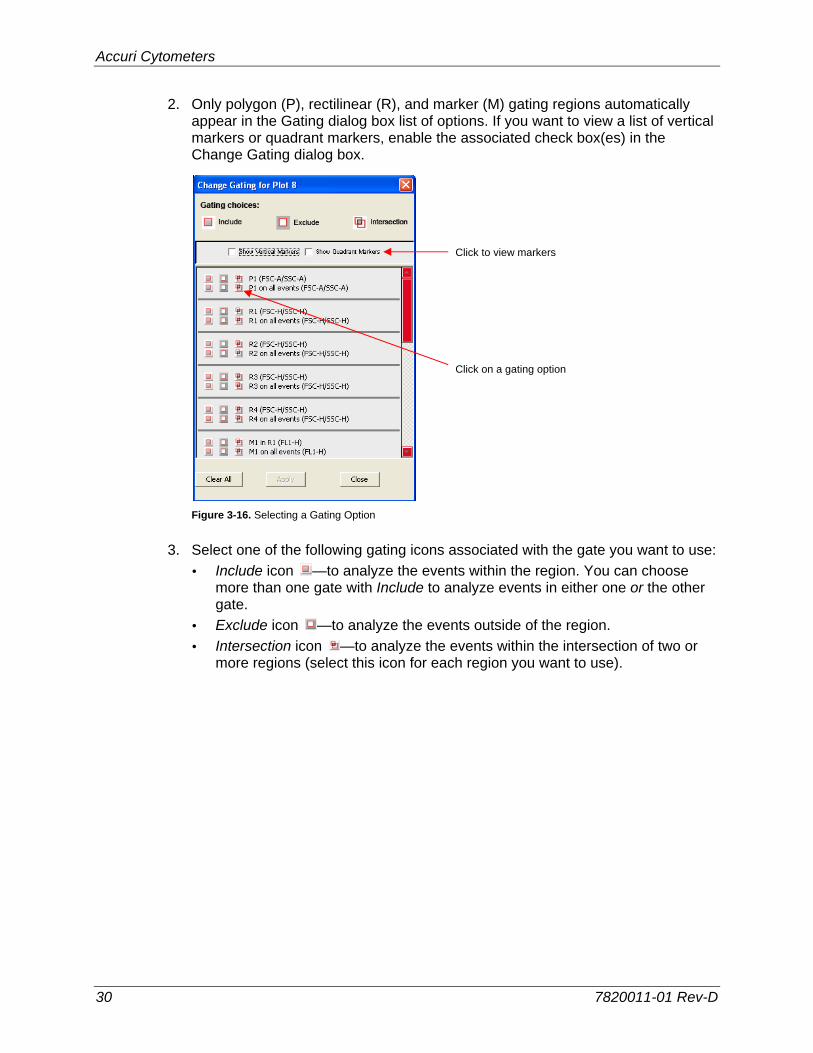
2. Only polygon (P), rectilinear (R), and marker (M) gating regions automatically appear in the Gating dialog box list of options. If you want to view a list of vertical markers or quadrant markers, enable the associated check box(es) in the Change Gating dialog box.
Figure 3-16. Selecting a Gating Option
3. Select one of the following gating icons associated with the gate you want to use:
Include icon —to analyze the events within the region. You can choose more than one gate with Include to analyze events in either one or the other gate.
Exclude icon —to analyze the events outside of the region.
Intersection icon —to analyze the events within the intersection of two or more regions (select this icon for each region you want to use).
Click to view markers
Click on a gating option
CFlow User Guide
7820011-01 Rev-D 31
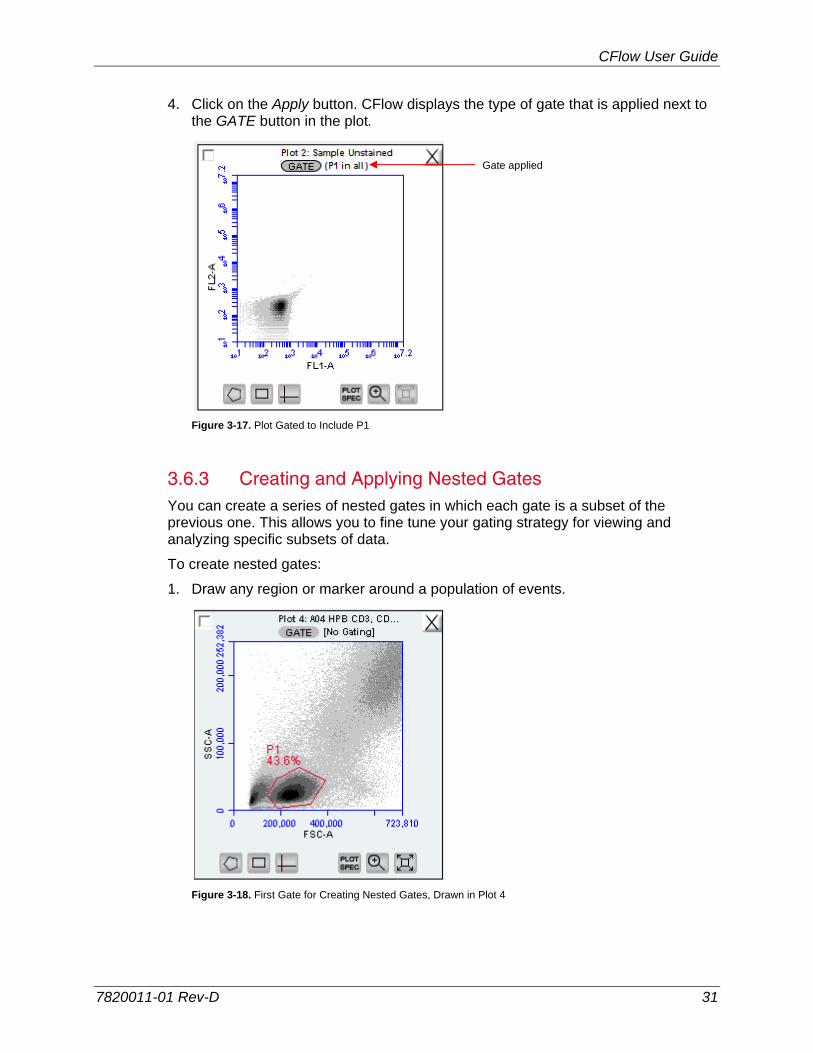
4. Click on the Apply button. CFlow displays the type of gate that is applied next to the GATE button in the plot.
Figure 3-17. Plot Gated to Include P1
3.6.3 Creating and Applying Nested Gates You can create a series of nested gates in which each gate is a subset of the previous one. This allows you to fine tune your gating strategy for viewing and analyzing specific subsets of data.
To create nested gates:
1. Draw any region or marker around a population of events.
Figure 3-18. First Gate for Creating Nested Gates, Drawn in Plot 4
Gate applied
Accuri Cytometers
32 7820011-01 Rev-D
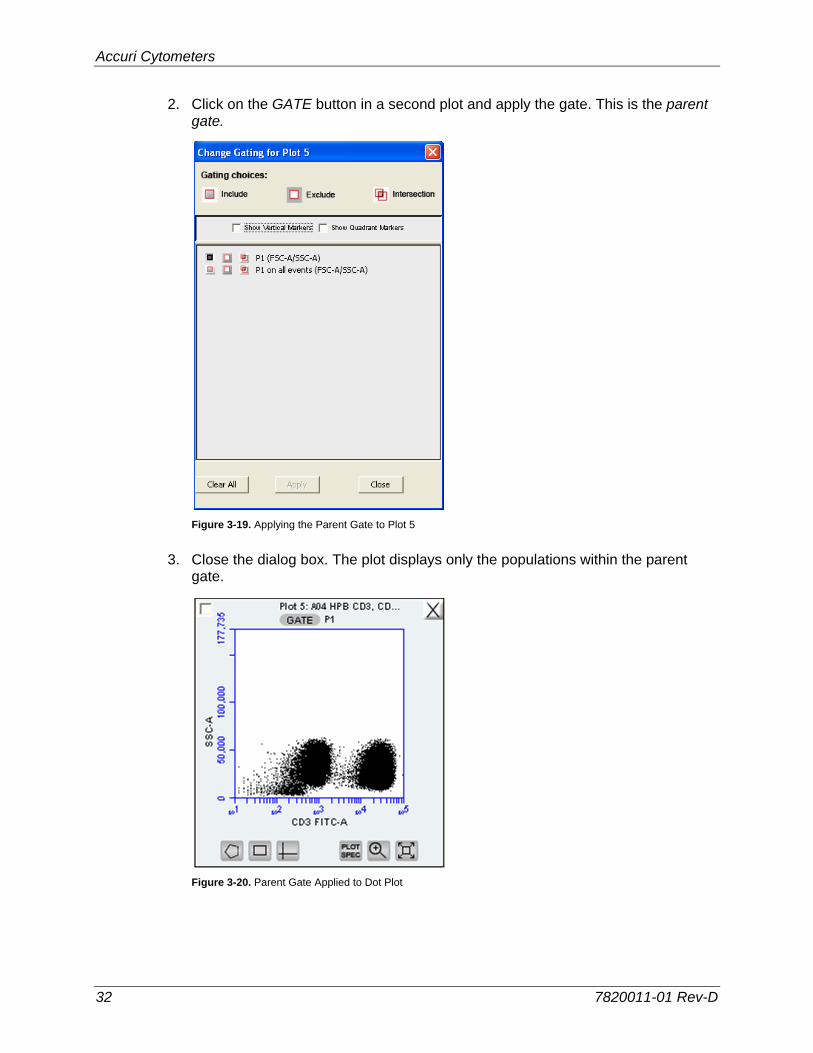
2. Click on the GATE button in a second plot and apply the gate. This is the parent gate.
Figure 3-19. Applying the Parent Gate to Plot 5
3. Close the dialog box. The plot displays only the populations within the parent gate.
Figure 3-20. Parent Gate Applied to Dot Plot
CFlow User Guide
7820011-01 Rev-D 33
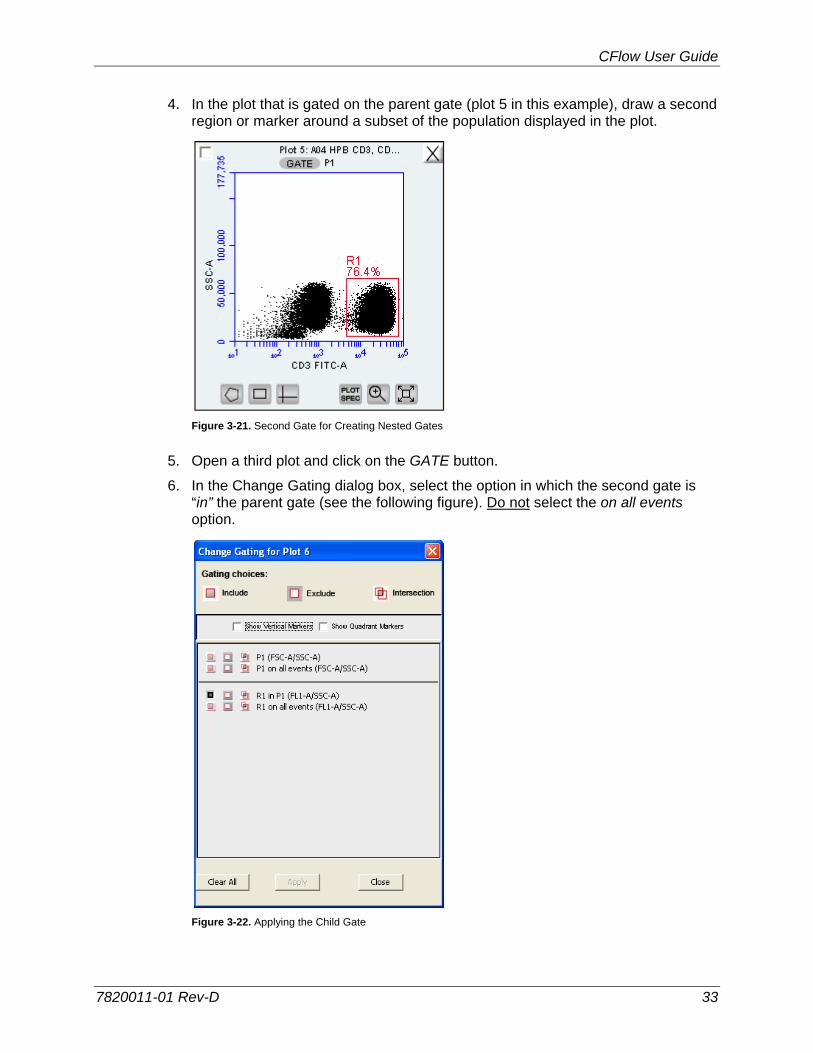
4. In the plot that is gated on the parent gate (plot 5 in this example), draw a second region or marker around a subset of the population displayed in the plot.
Figure 3-21. Second Gate for Creating Nested Gates
5. Open a third plot and click on the GATE button.
6. In the Change Gating dialog box, select the option in which the second gate is “in” the parent gate (see the following figure). Do not select the on all events option.
Figure 3-22. Applying the Child Gate
Accuri Cytometers
34 7820011-01 Rev-D
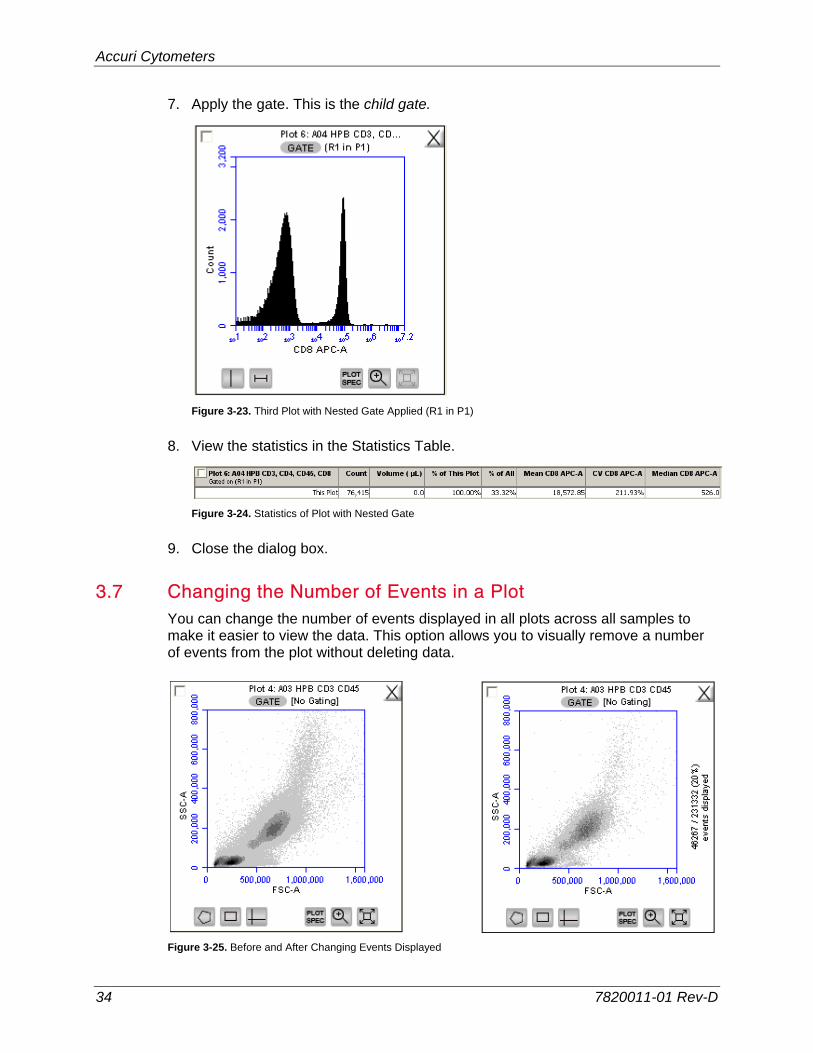
7. Apply the gate. This is the child gate.
Figure 3-23. Third Plot with Nested Gate Applied (R1 in P1)
8. View the statistics in the Statistics Table.
Figure 3-24. Statistics of Plot with Nested Gate
9. Close the dialog box.
3.7 Changing the Number of Events in a Plot You can change the number of events displayed in all plots across all samples to make it easier to view the data. This option allows you to visually remove a number of events from the plot without deleting data.
Figure 3-25. Before and After Changing Events Displayed
CFlow User Guide
7820011-01 Rev-D 35
To change the events displayed in a plot:
1. Select Display > Events Display Settings.
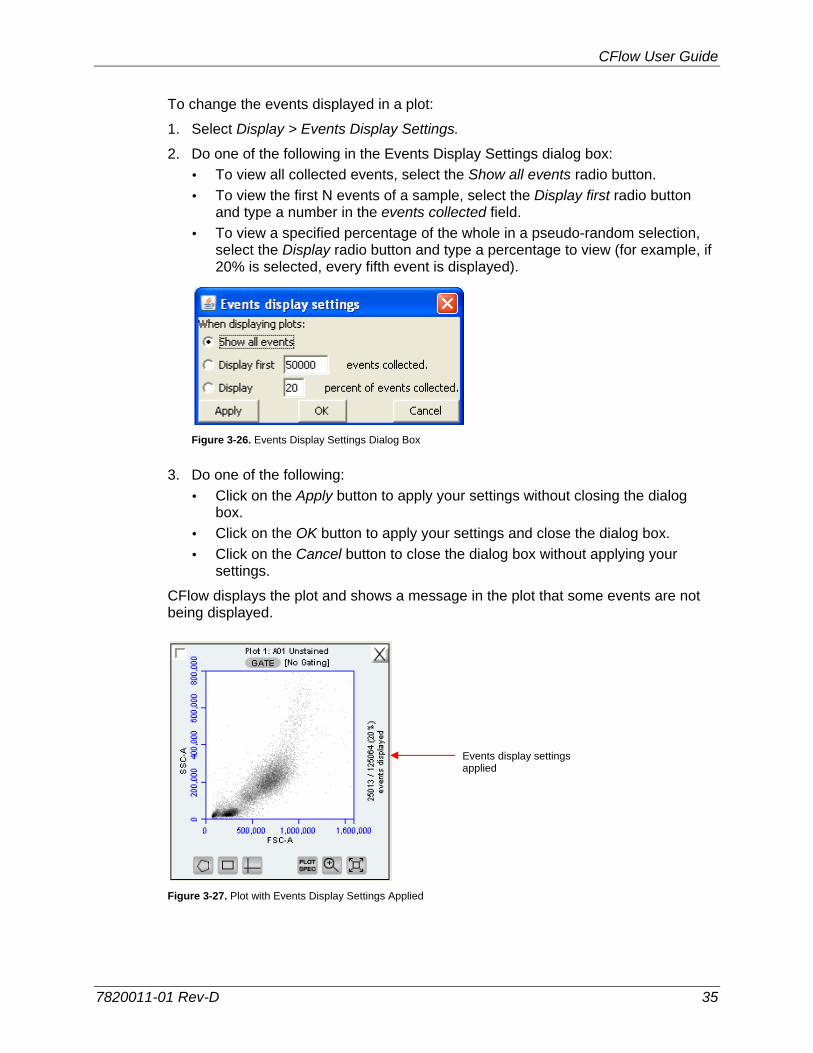
2. Do one of the following in the Events Display Settings dialog box:
To view all collected events, select the Show all events radio button.
To view the first N events of a sample, select the Display first radio button and type a number in the events collected field.
To view a specified percentage of the whole in a pseudo-random selection, select the Display radio button and type a percentage to view (for example, if 20% is selected, every fifth event is displayed).
Figure 3-26. Events Display Settings Dialog Box
3. Do one of the following:
Click on the Apply button to apply your settings without closing the dialog box.
Click on the OK button to apply your settings and close the dialog box.
Click on the Cancel button to close the dialog box without applying your settings.
CFlow displays the plot and shows a message in the plot that some events are not being displayed.
Figure 3-27. Plot with Events Display Settings Applied
Events display settings applied
Accuri Cytometers
36 7820011-01 Rev-D
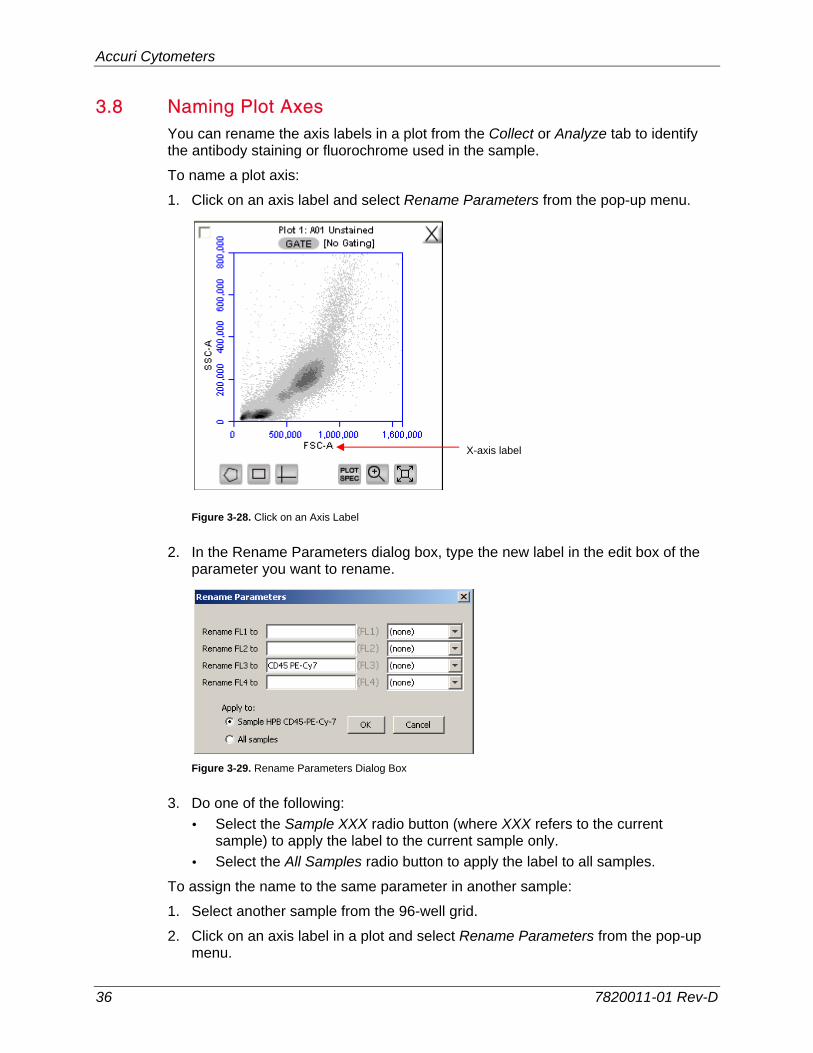
3.8 Naming Plot Axes You can rename the axis labels in a plot from the Collect or Analyze tab to identify the antibody staining or fluorochrome used in the sample.
To name a plot axis:
1. Click on an axis label and select Rename Parameters from the pop-up menu.
Figure 3-28. Click on an Axis Label
2. In the Rename Parameters dialog box, type the new label in the edit box of the parameter you want to rename.
Figure 3-29. Rename Parameters Dialog Box
3. Do one of the following:
Select the Sample XXX radio button (where XXX refers to the current sample) to apply the label to the current sample only.
Select the All Samples radio button to apply the label to all samples.
To assign the name to the same parameter in another sample:
1. Select another sample from the 96-well grid.
2. Click on an axis label in a plot and select Rename Parameters from the pop-up menu.
X-axis label
CFlow User Guide
7820011-01 Rev-D 37
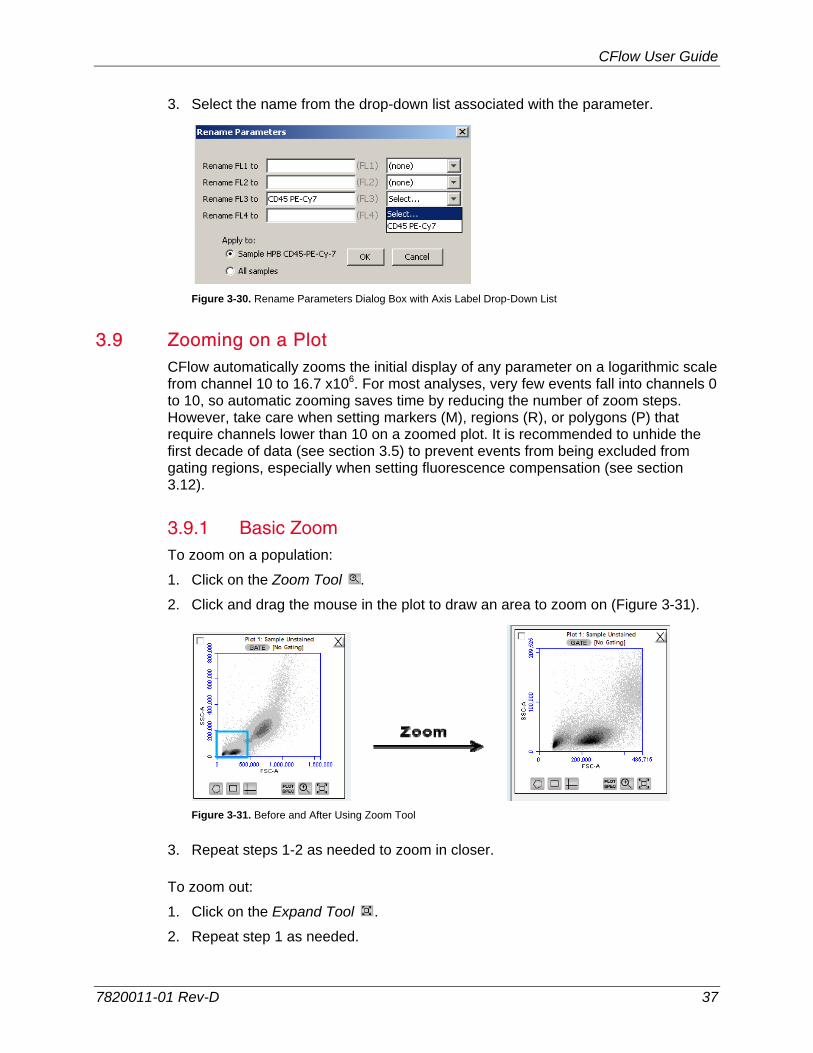
3. Select the name from the drop-down list associated with the parameter.
Figure 3-30. Rename Parameters Dialog Box with Axis Label Drop-Down List
3.9 Zooming on a Plot CFlow automatically zooms the initial display of any parameter on a logarithmic scale from channel 10 to 16.7 x10⁶. For most analyses, very few events fall into channels 0 to 10, so automatic zooming saves time by reducing the number of zoom steps. However, take care when setting markers (M), regions (R), or polygons (P) that require channels lower than 10 on a zoomed plot. It is recommended to unhide the first decade of data (see section 3.5) to prevent events from being excluded from gating regions, especially when setting fluorescence compensation (see section 3.12).
3.9.1 Basic Zoom To zoom on a population:
1. Click on the Zoom Tool .
2. Click and drag the mouse in the plot to draw an area to zoom on (Figure 3-31).
Figure 3-31. Before and After Using Zoom Tool
3. Repeat steps 1-2 as needed to zoom in closer.
To zoom out:
1. Click on the Expand Tool .
2. Repeat step 1 as needed.

Accuri Cytometers
38 7820011-01 Rev-D
3.9.2 Zooming to a Specified Channel Range Sometimes it can be helpful to view a plot in a specified channel range.
To view a specified channel range in a plot:
1. Click on the Plot Spec Tool in the plot you want to zoom.
Figure 3-32. Plot Spec Dialog Box: Set Min and Max Channel Values for the X- and Y-Axes
2. Specify the x-axis channel range by typing a minimum (Min Value) and maximum (Max Value) value under X-Axis in the Set Plot Specs dialog box.
3. Specify the y-axis channel range by typing a minimum and maximum value under Y-Axis.
4. Click on the Apply button to apply the changes and click on the OK button to close the Plot Spec dialog box.
3.10 Saving a CFlow File Always save C6 data as a CFlow file (.c6). A CFlow file is a comprehensive (and often large) data file that contains instrument settings, FCS files, and plot layouts.
The CFlow file contains the entire CFlow workspace, including the following elements:
Sample data
Plot layouts
Gating
Color compensation
Threshold settings
Collect tab settings
Changes made in the Analysis or Statistics tabs
CFlow User Guide
7820011-01 Rev-D 39
By default, CFlow automatically saves CFlow data at the end of each sample run. You can also manually save data at any time. To save the entire CFlow file, save the file manually (see section 3.10.2).
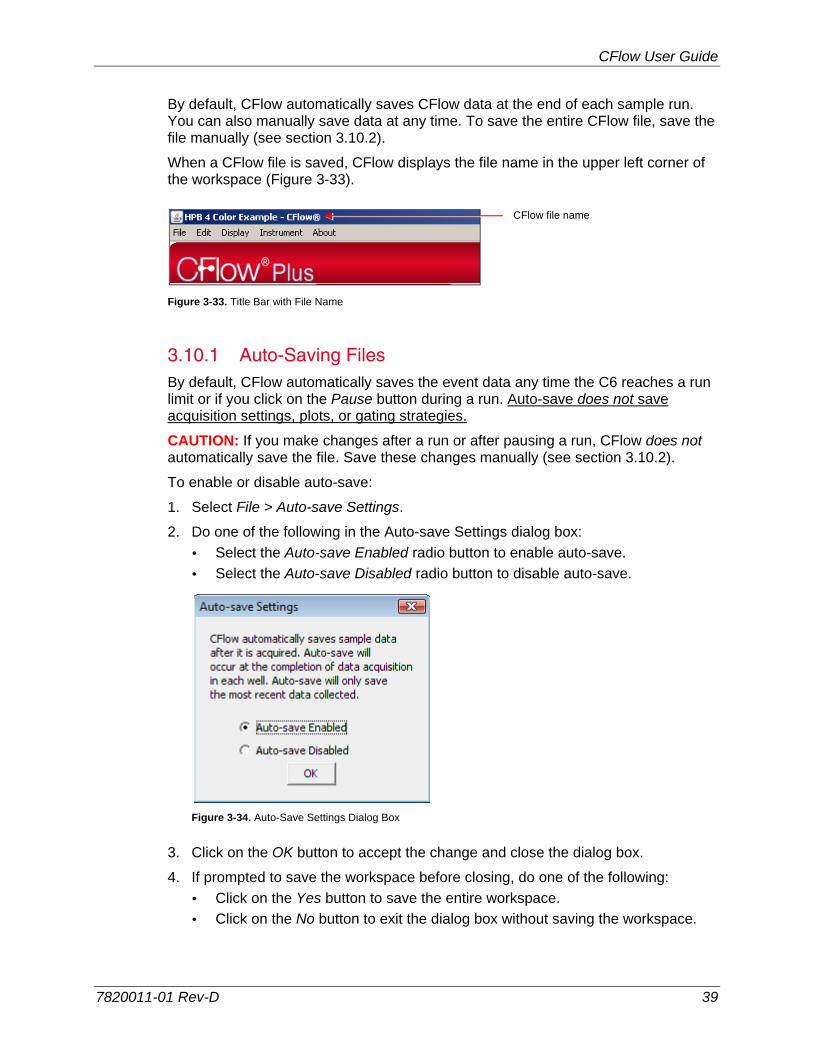
When a CFlow file is saved, CFlow displays the file name in the upper left corner of the workspace (Figure 3-33).
Figure 3-33. Title Bar with File Name
3.10.1 Auto-Saving Files By default, CFlow automatically saves the event data any time the C6 reaches a run limit or if you click on the Pause button during a run. Auto-save does not save acquisition settings, plots, or gating strategies.
CAUTION: If you make changes after a run or after pausing a run, CFlow does not automatically save the file. Save these changes manually (see section 3.10.2).
To enable or disable auto-save:
1. Select File > Auto-save Settings.
2. Do one of the following in the Auto-save Settings dialog box:
Select the Auto-save Enabled radio button to enable auto-save.
Select the Auto-save Disabled radio button to disable auto-save.
Figure 3-34. Auto-Save Settings Dialog Box
3. Click on the OK button to accept the change and close the dialog box.
4. If prompted to save the workspace before closing, do one of the following:
Click on the Yes button to save the entire workspace.
Click on the No button to exit the dialog box without saving the workspace.
CFlow file name

Accuri Cytometers
40 7820011-01 Rev-D
3.10.2 Manually Saving Files You can manually save a CFlow file at any time.
To manually save a CFlow file:
1. Select File > Save.
To manually save a CFlow file with a new name:
1. Select File > Save CFlow File As.
Figure 3-35. Save CFlow File
2. If necessary, navigate to the location to save the file.
3. In the Save dialog box, enter the file name and click on the Save button. The file is saved with the extension .c6.
3.11 Creating a CFlow Template A CFlow template contains a predefined CFlow workspace for quick and easy setup and analysis. All markers, regions, gates, parameter names, and sample names are saved without any data points. Accuri provides several templates (see the CFlow Installation CD (or flash drive) or the Accuri website at www.accuricytometers.com/technical_information/templates/) or you can create your own customized templates.
To create a template:
1. Define plot, gating, and acquisition settings in a blank workspace, or use the current .c6 file.
CFlow User Guide
7820011-01 Rev-D 41
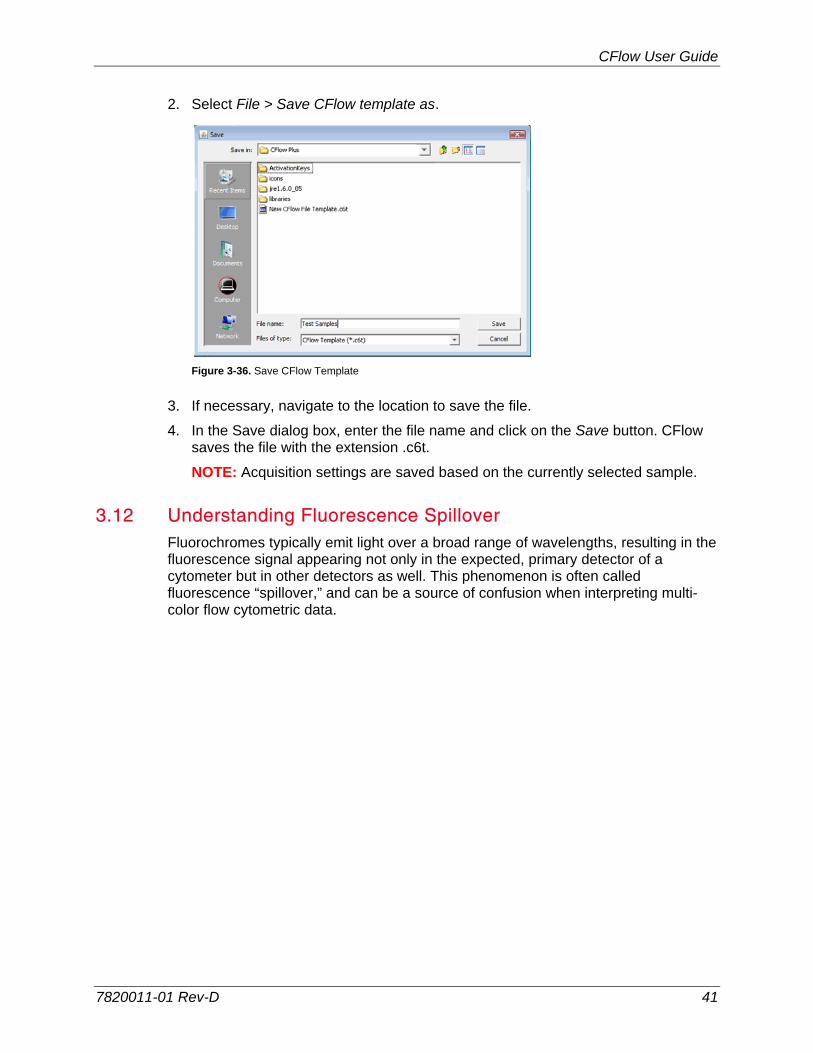
2. Select File > Save CFlow template as.
Figure 3-36. Save CFlow Template
3. If necessary, navigate to the location to save the file.
4. In the Save dialog box, enter the file name and click on the Save button. CFlow saves the file with the extension .c6t.
NOTE: Acquisition settings are saved based on the currently selected sample.
3.12 Understanding Fluorescence Spillover Fluorochromes typically emit light over a broad range of wavelengths, resulting in the fluorescence signal appearing not only in the expected, primary detector of a cytometer but in other detectors as well. This phenomenon is often called fluorescence “spillover,” and can be a source of confusion when interpreting multi-color flow cytometric data.
Accuri Cytometers
42 7820011-01 Rev-D
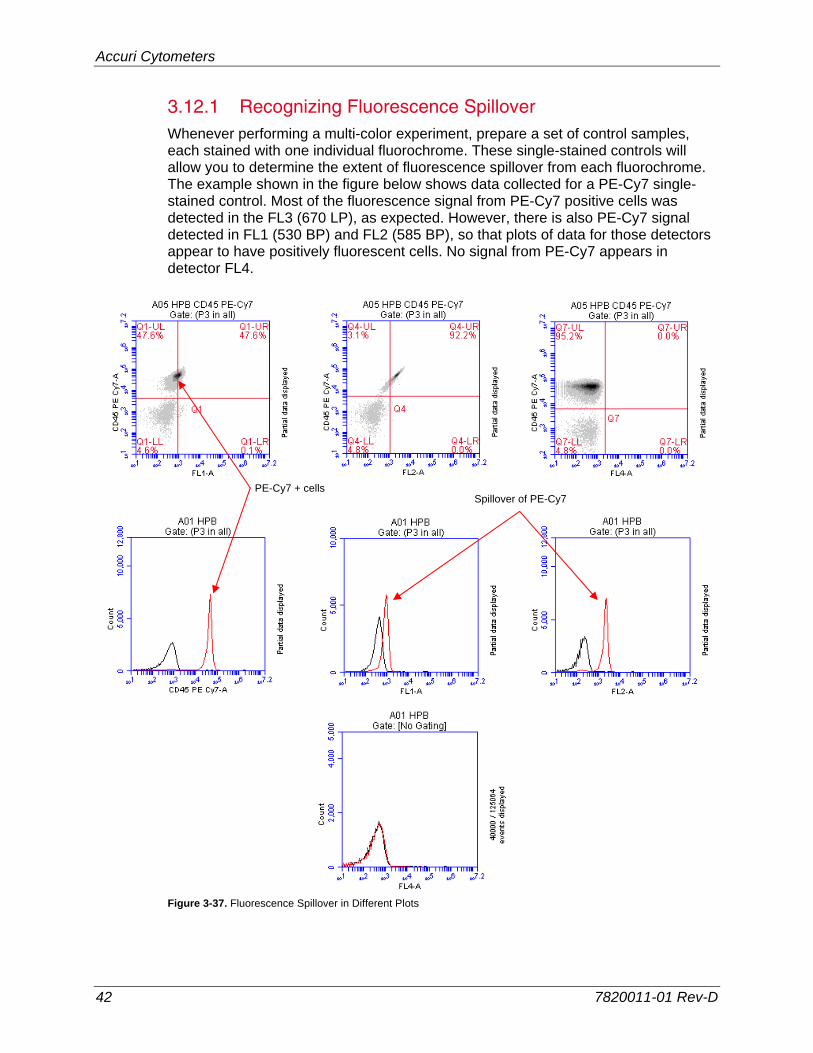
3.12.1 Recognizing Fluorescence Spillover Whenever performing a multi-color experiment, prepare a set of control samples, each stained with one individual fluorochrome. These single-stained controls will allow you to determine the extent of fluorescence spillover from each fluorochrome. The example shown in the figure below shows data collected for a PE-Cy7 single-stained control. Most of the fluorescence signal from PE-Cy7 positive cells was detected in the FL3 (670 LP), as expected. However, there is also PE-Cy7 signal detected in FL1 (530 BP) and FL2 (585 BP), so that plots of data for those detectors appear to have positively fluorescent cells. No signal from PE-Cy7 appears in detector FL4.
Figure 3-37. Fluorescence Spillover in Different Plots
PE-Cy7 + cells Spillover of PE-Cy7
CFlow User Guide
7820011-01 Rev-D 43
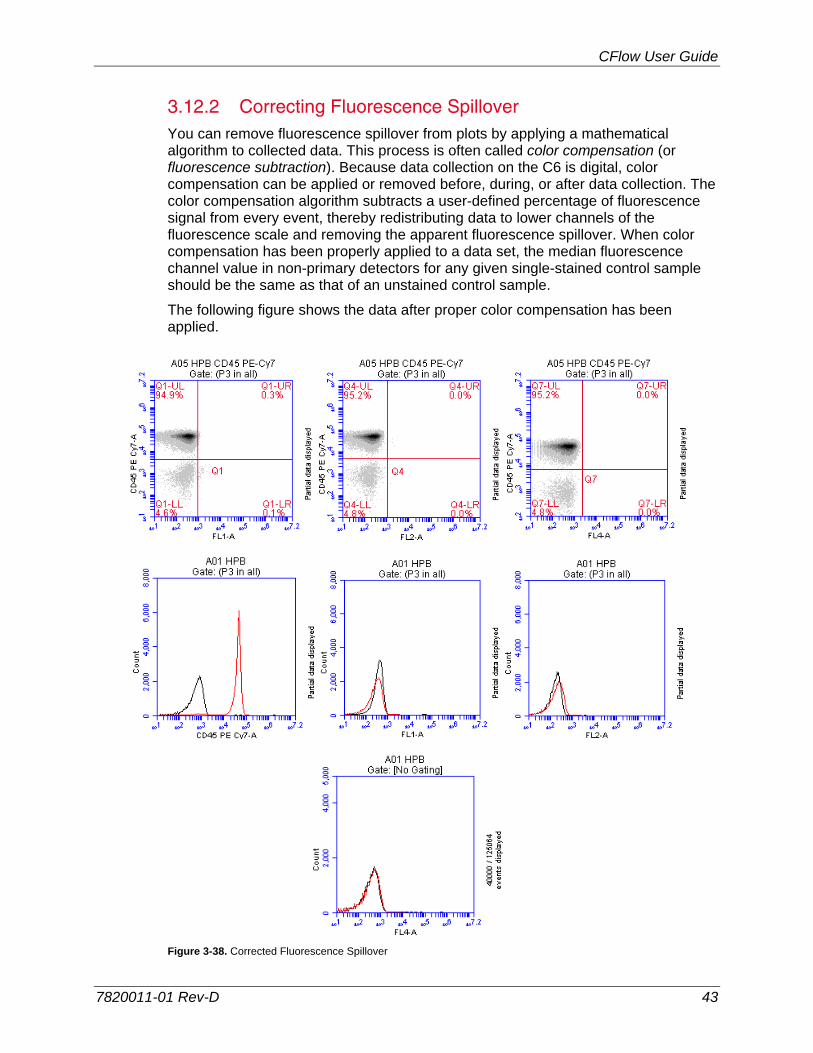
3.12.2 Correcting Fluorescence Spillover You can remove fluorescence spillover from plots by applying a mathematical algorithm to collected data. This process is often called color compensation (or fluorescence subtraction). Because data collection on the C6 is digital, color compensation can be applied or removed before, during, or after data collection. The color compensation algorithm subtracts a user-defined percentage of fluorescence signal from every event, thereby redistributing data to lower channels of the fluorescence scale and removing the apparent fluorescence spillover. When color compensation has been properly applied to a data set, the median fluorescence channel value in non-primary detectors for any given single-stained control sample should be the same as that of an unstained control sample.
The following figure shows the data after proper color compensation has been applied.
Figure 3-38. Corrected Fluorescence Spillover
Accuri Cytometers
44 7820011-01 Rev-D
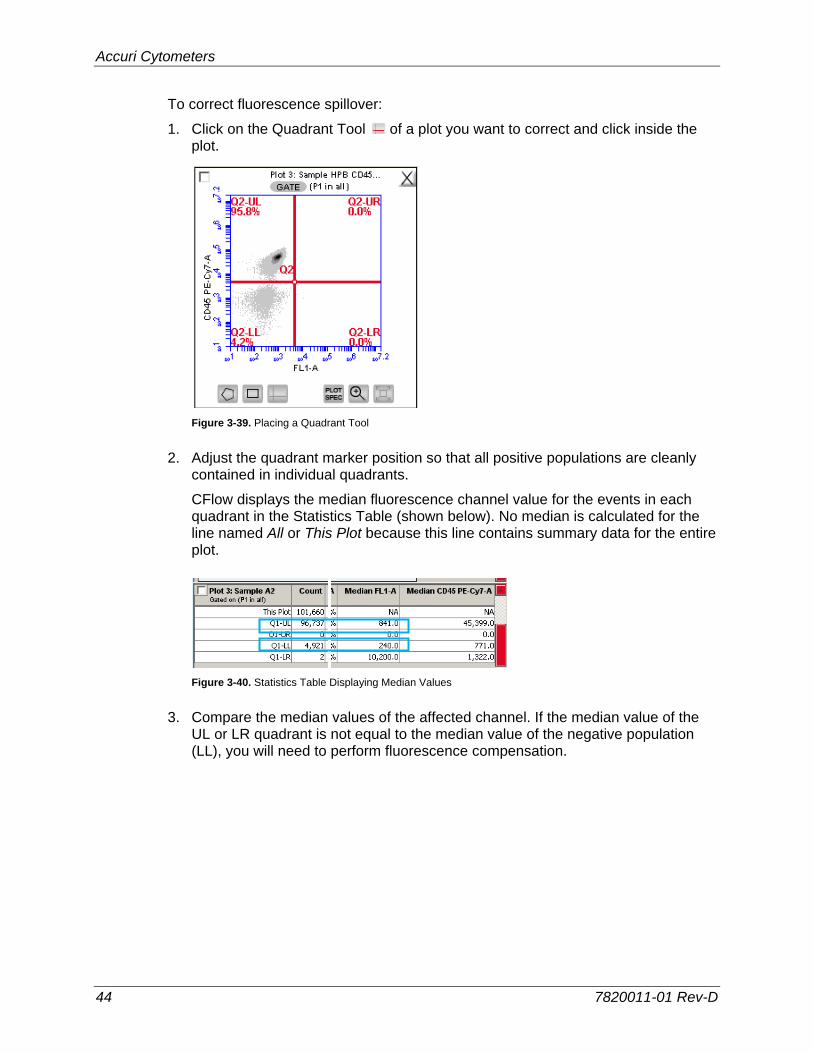
To correct fluorescence spillover:
1. Click on the Quadrant Tool of a plot you want to correct and click inside the plot.
Figure 3-39. Placing a Quadrant Tool
2. Adjust the quadrant marker position so that all positive populations are cleanly contained in individual quadrants.
CFlow displays the median fluorescence channel value for the events in each quadrant in the Statistics Table (shown below). No median is calculated for the line named All or This Plot because this line contains summary data for the entire plot.
Figure 3-40. Statistics Table Displaying Median Values
3. Compare the median values of the affected channel. If the median value of the UL or LR quadrant is not equal to the median value of the negative population (LL), you will need to perform fluorescence compensation.
CFlow User Guide
7820011-01 Rev-D 45
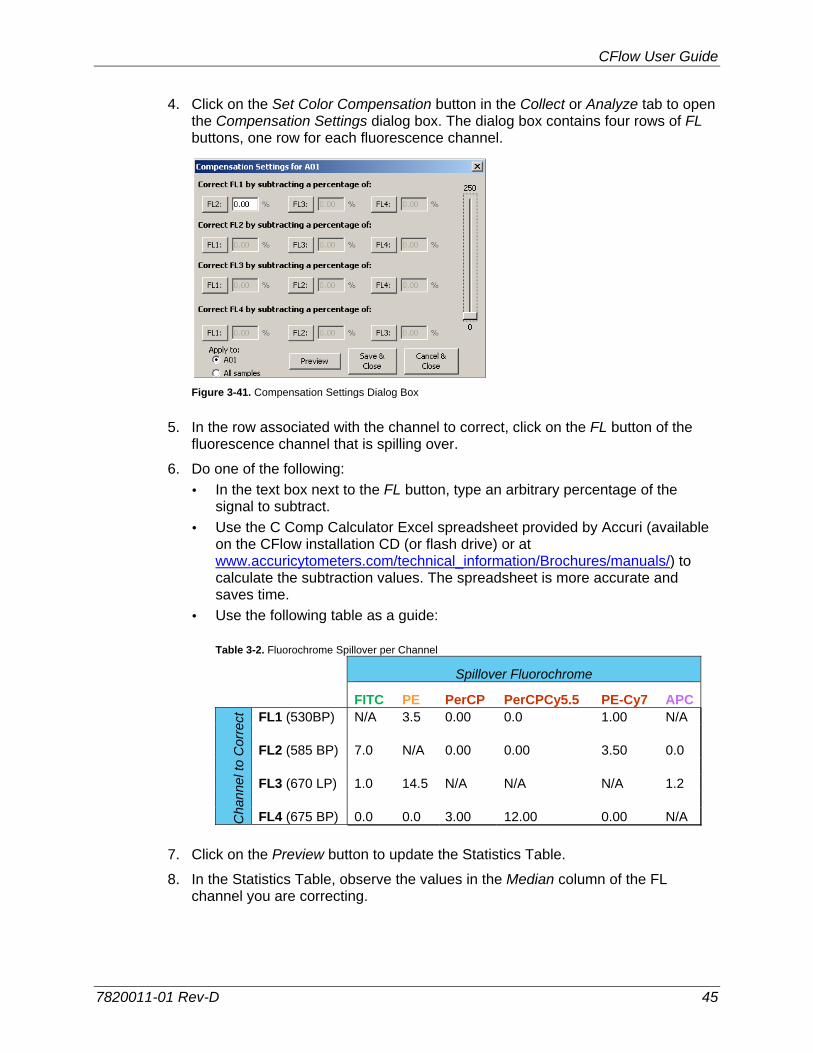
4. Click on the Set Color Compensation button in the Collect or Analyze tab to open the Compensation Settings dialog box. The dialog box contains four rows of FL buttons, one row for each fluorescence channel.
Figure 3-41. Compensation Settings Dialog Box
5. In the row associated with the channel to correct, click on the FL button of the fluorescence channel that is spilling over.
6. Do one of the following:
In the text box next to the FL button, type an arbitrary percentage of the signal to subtract.
Use the C Comp Calculator Excel spreadsheet provided by Accuri (available on the CFlow installation CD (or flash drive) or at www.accuricytometers.com/technical_information/Brochures/manuals/) to calculate the subtraction values. The spreadsheet is more accurate and saves time.
Use the following table as a guide:
Table 3-2. Fluorochrome Spillover per Channel
Spillover Fluorochrome
FITC PE PerCP PerCPCy5.5 PE-Cy7 APC
Cha
nnel
to C
orre
ct
FL1 (530BP) N/A 3.5 0.00 0.0 1.00 N/A FL2 (585 BP) 7.0 N/A 0.00 0.00 3.50 0.0 FL3 (670 LP) 1.0 14.5 N/A N/A N/A 1.2 FL4 (675 BP) 0.0 0.0 3.00 12.00 0.00 N/A
7. Click on the Preview button to update the Statistics Table.
8. In the Statistics Table, observe the values in the Median column of the FL channel you are correcting.
Accuri Cytometers
46 7820011-01 Rev-D
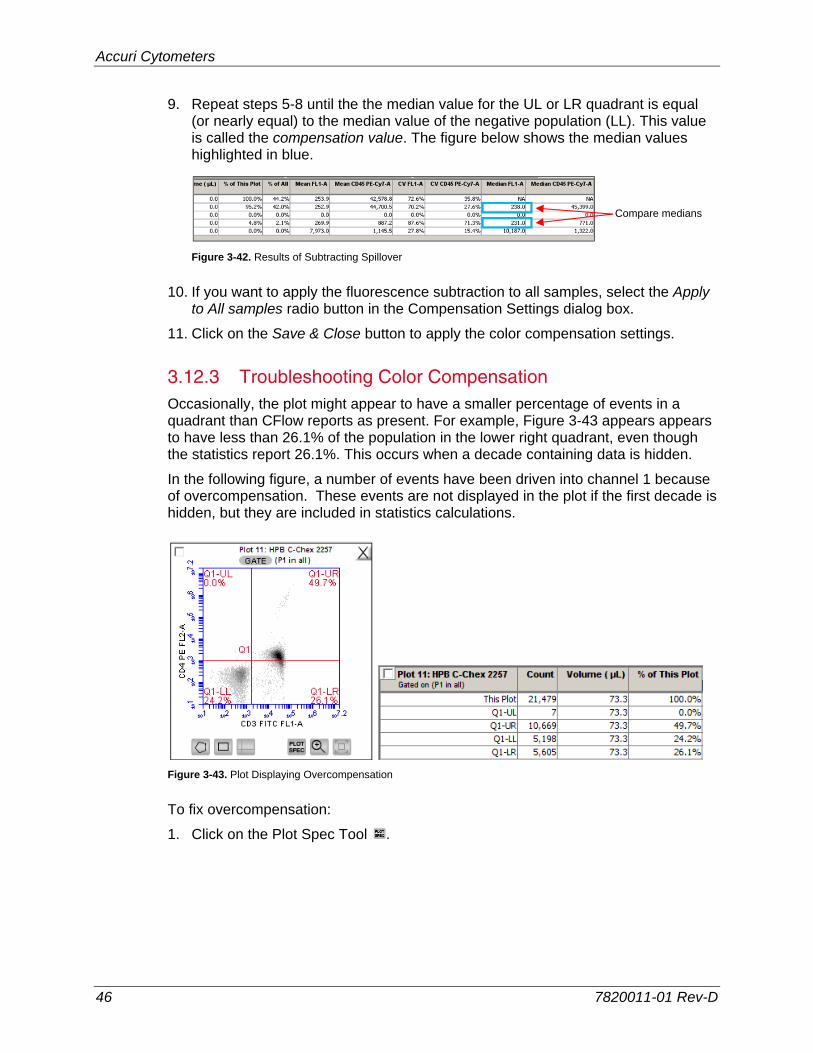
9. Repeat steps 5-8 until the the median value for the UL or LR quadrant is equal (or nearly equal) to the median value of the negative population (LL). This value is called the compensation value. The figure below shows the median values highlighted in blue.
Figure 3-42. Results of Subtracting Spillover
10. If you want to apply the fluorescence subtraction to all samples, select the Apply to All samples radio button in the Compensation Settings dialog box.
11. Click on the Save & Close button to apply the color compensation settings.
3.12.3 Troubleshooting Color Compensation Occasionally, the plot might appear to have a smaller percentage of events in a quadrant than CFlow reports as present. For example, Figure 3-43 appears appears to have less than 26.1% of the population in the lower right quadrant, even though the statistics report 26.1%. This occurs when a decade containing data is hidden.
In the following figure, a number of events have been driven into channel 1 because of overcompensation. These events are not displayed in the plot if the first decade is hidden, but they are included in statistics calculations.
Figure 3-43. Plot Displaying Overcompensation
To fix overcompensation:
1. Click on the Plot Spec Tool .
Compare medians
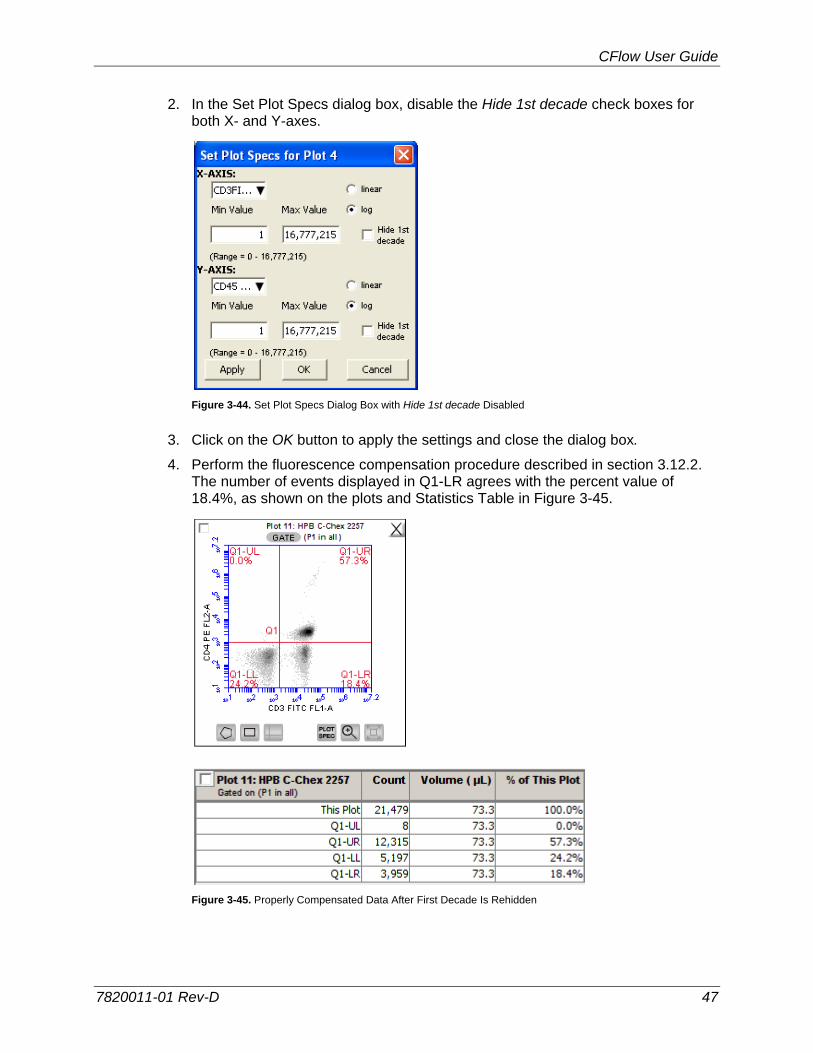
CFlow User Guide
7820011-01 Rev-D 47
2. In the Set Plot Specs dialog box, disable the Hide 1st decade check boxes for both X- and Y-axes.
Figure 3-44. Set Plot Specs Dialog Box with Hide 1st decade Disabled
3. Click on the OK button to apply the settings and close the dialog box.
4. Perform the fluorescence compensation procedure described in section 3.12.2. The number of events displayed in Q1-LR agrees with the percent value of 18.4%, as shown on the plots and Statistics Table in Figure 3-45.
Figure 3-45. Properly Compensated Data After First Decade Is Rehidden
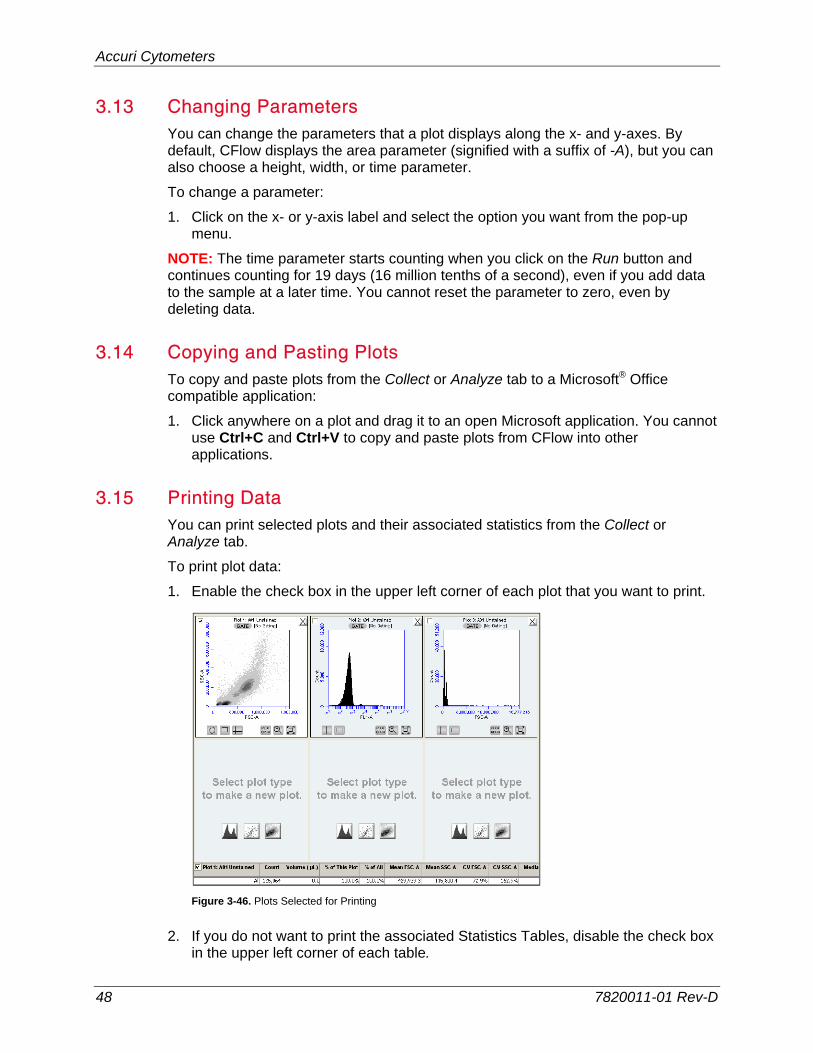
Accuri Cytometers
48 7820011-01 Rev-D
3.13 Changing Parameters You can change the parameters that a plot displays along the x- and y-axes. By default, CFlow displays the area parameter (signified with a suffix of -A), but you can also choose a height, width, or time parameter.
To change a parameter:
1. Click on the x- or y-axis label and select the option you want from the pop-up menu.
NOTE: The time parameter starts counting when you click on the Run button and continues counting for 19 days (16 million tenths of a second), even if you add data to the sample at a later time. You cannot reset the parameter to zero, even by deleting data.
3.14 Copying and Pasting Plots To copy and paste plots from the Collect or Analyze tab to a Microsoft® Office compatible application:
1. Click anywhere on a plot and drag it to an open Microsoft application. You cannot use Ctrl+C and Ctrl+V to copy and paste plots from CFlow into other applications.
3.15 Printing Data You can print selected plots and their associated statistics from the Collect or Analyze tab.
To print plot data:
1. Enable the check box in the upper left corner of each plot that you want to print.
Figure 3-46. Plots Selected for Printing
2. If you do not want to print the associated Statistics Tables, disable the check box in the upper left corner of each table.
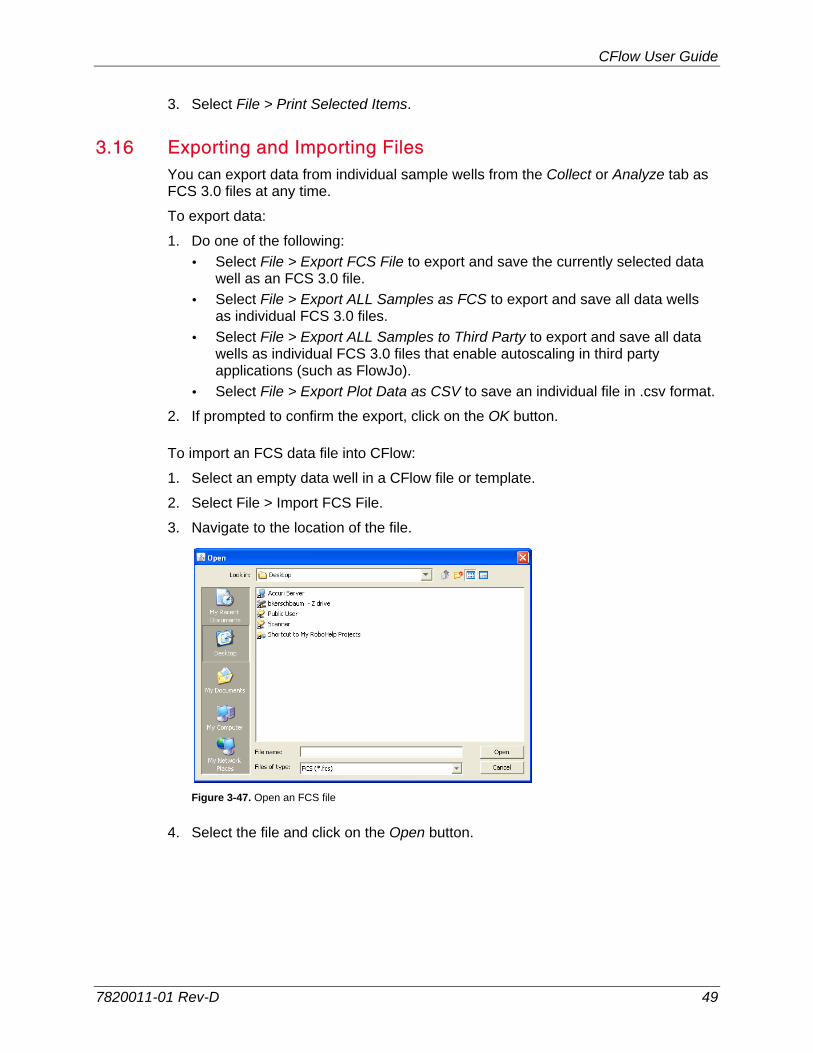
CFlow User Guide
7820011-01 Rev-D 49
3. Select File > Print Selected Items.
3.16 Exporting and Importing Files You can export data from individual sample wells from the Collect or Analyze tab as FCS 3.0 files at any time.
To export data:
1. Do one of the following:
Select File > Export FCS File to export and save the currently selected data well as an FCS 3.0 file.
Select File > Export ALL Samples as FCS to export and save all data wells as individual FCS 3.0 files.
Select File > Export ALL Samples to Third Party to export and save all data wells as individual FCS 3.0 files that enable autoscaling in third party applications (such as FlowJo).
Select File > Export Plot Data as CSV to save an individual file in .csv format.
2. If prompted to confirm the export, click on the OK button.
To import an FCS data file into CFlow:
1. Select an empty data well in a CFlow file or template.
2. Select File > Import FCS File.
3. Navigate to the location of the file.
Figure 3-47. Open an FCS file
4. Select the file and click on the Open button.
Accuri Cytometers
50 7820011-01 Rev-D
4 ANALYZING SAMPLE DATA The Analyze tab allows you to simultaneously view data from multiple samples using the same plots and gating.
Use the tab to do the following:
View several plots and samples in any combination for easy analysis.
Compare specific samples from the 96-well grid.
Create new plots, hide or delete plots, or copy and reuse plots from the Collect tab.
View different samples with the same plots.
Create color overlay histograms.
Print multiple plots.
Adjust peak position.
Calculate median statistics.
4.1 Viewing the Analyze Tab The Analyze tab is organized into two major sections:
Setup panel—Panel on the left side of the window that contains controls for selecting samples and plots.
Data display—Large area on the right side of the window that shows sample data in plots and in a Statistics Table.
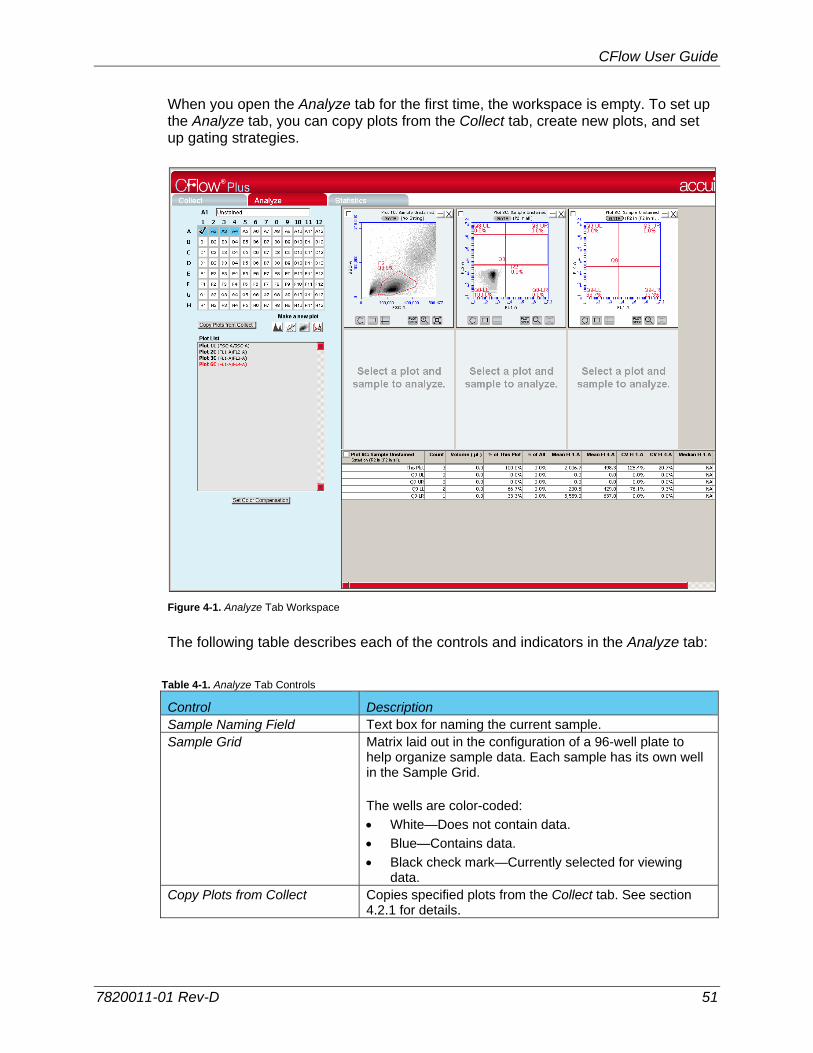
CFlow User Guide
7820011-01 Rev-D 51
When you open the Analyze tab for the first time, the workspace is empty. To set up the Analyze tab, you can copy plots from the Collect tab, create new plots, and set up gating strategies.
Figure 4-1. Analyze Tab Workspace
The following table describes each of the controls and indicators in the Analyze tab:
Table 4-1. Analyze Tab Controls
Control Description Sample Naming Field Text box for naming the current sample. Sample Grid Matrix laid out in the configuration of a 96-well plate to
help organize sample data. Each sample has its own well in the Sample Grid. The wells are color-coded:
White—Does not contain data.
Blue—Contains data.
Black check mark—Currently selected for viewing data.
Copy Plots from Collect Copies specified plots from the Collect tab. See section 4.2.1 for details.
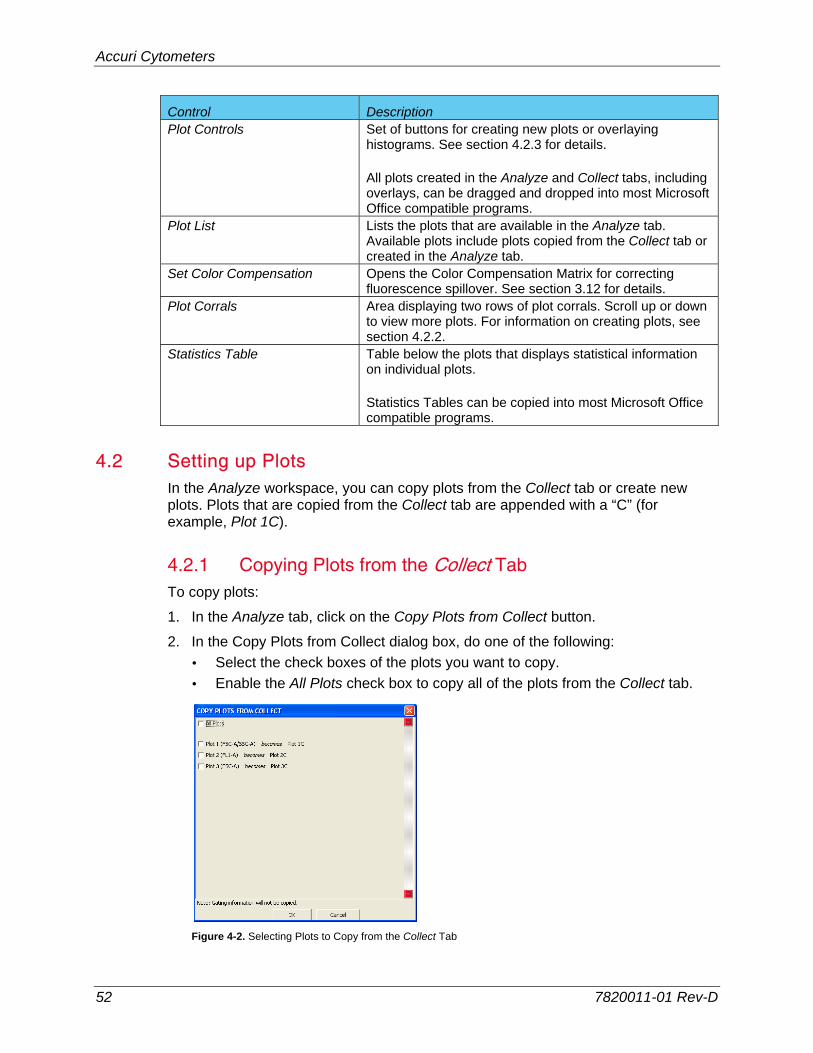
Accuri Cytometers
52 7820011-01 Rev-D
Control Description Plot Controls Set of buttons for creating new plots or overlaying
histograms. See section 4.2.3 for details. All plots created in the Analyze and Collect tabs, including overlays, can be dragged and dropped into most Microsoft Office compatible programs.
Plot List Lists the plots that are available in the Analyze tab. Available plots include plots copied from the Collect tab or created in the Analyze tab.
Set Color Compensation Opens the Color Compensation Matrix for correcting fluorescence spillover. See section 3.12 for details.
Plot Corrals Area displaying two rows of plot corrals. Scroll up or down to view more plots. For information on creating plots, see section 4.2.2.
Statistics Table Table below the plots that displays statistical information on individual plots. Statistics Tables can be copied into most Microsoft Office compatible programs.
4.2 Setting up Plots In the Analyze workspace, you can copy plots from the Collect tab or create new plots. Plots that are copied from the Collect tab are appended with a “C” (for example, Plot 1C).
4.2.1 Copying Plots from the Collect Tab To copy plots:
1. In the Analyze tab, click on the Copy Plots from Collect button.
2. In the Copy Plots from Collect dialog box, do one of the following:
Select the check boxes of the plots you want to copy.
Enable the All Plots check box to copy all of the plots from the Collect tab.
Figure 4-2. Selecting Plots to Copy from the Collect Tab
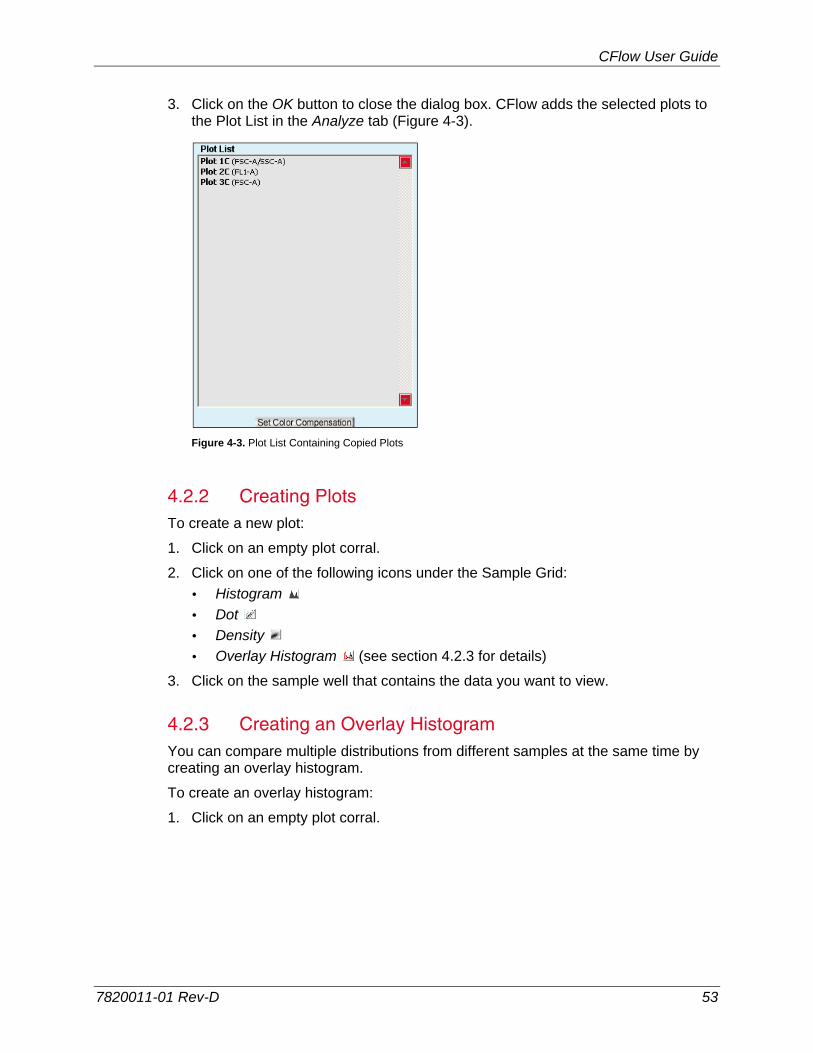
CFlow User Guide
7820011-01 Rev-D 53
3. Click on the OK button to close the dialog box. CFlow adds the selected plots to the Plot List in the Analyze tab (Figure 4-3).
Figure 4-3. Plot List Containing Copied Plots
4.2.2 Creating Plots To create a new plot:
1. Click on an empty plot corral.
2. Click on one of the following icons under the Sample Grid:
Histogram
Dot
Density
Overlay Histogram (see section 4.2.3 for details)
3. Click on the sample well that contains the data you want to view.
4.2.3 Creating an Overlay Histogram You can compare multiple distributions from different samples at the same time by creating an overlay histogram.
To create an overlay histogram:
1. Click on an empty plot corral.
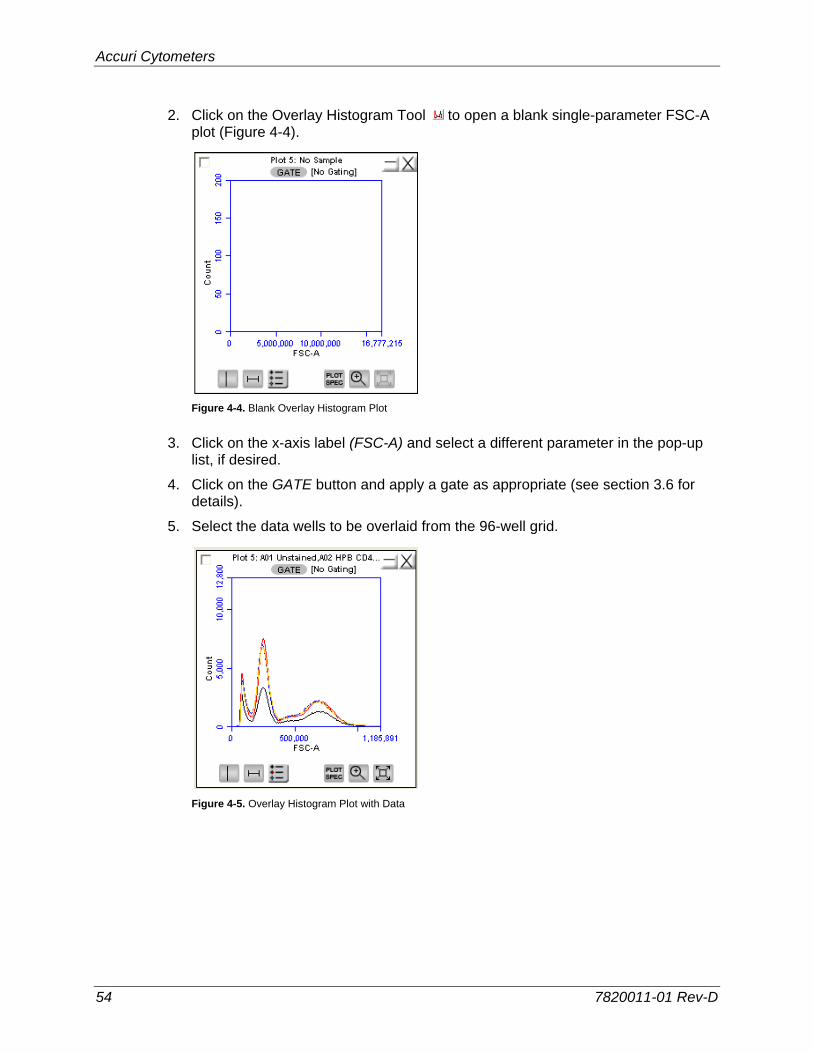
Accuri Cytometers
54 7820011-01 Rev-D
2. Click on the Overlay Histogram Tool to open a blank single-parameter FSC-A plot (Figure 4-4).
Figure 4-4. Blank Overlay Histogram Plot
3. Click on the x-axis label (FSC-A) and select a different parameter in the pop-up list, if desired.
4. Click on the GATE button and apply a gate as appropriate (see section 3.6 for details).
5. Select the data wells to be overlaid from the 96-well grid.
Figure 4-5. Overlay Histogram Plot with Data
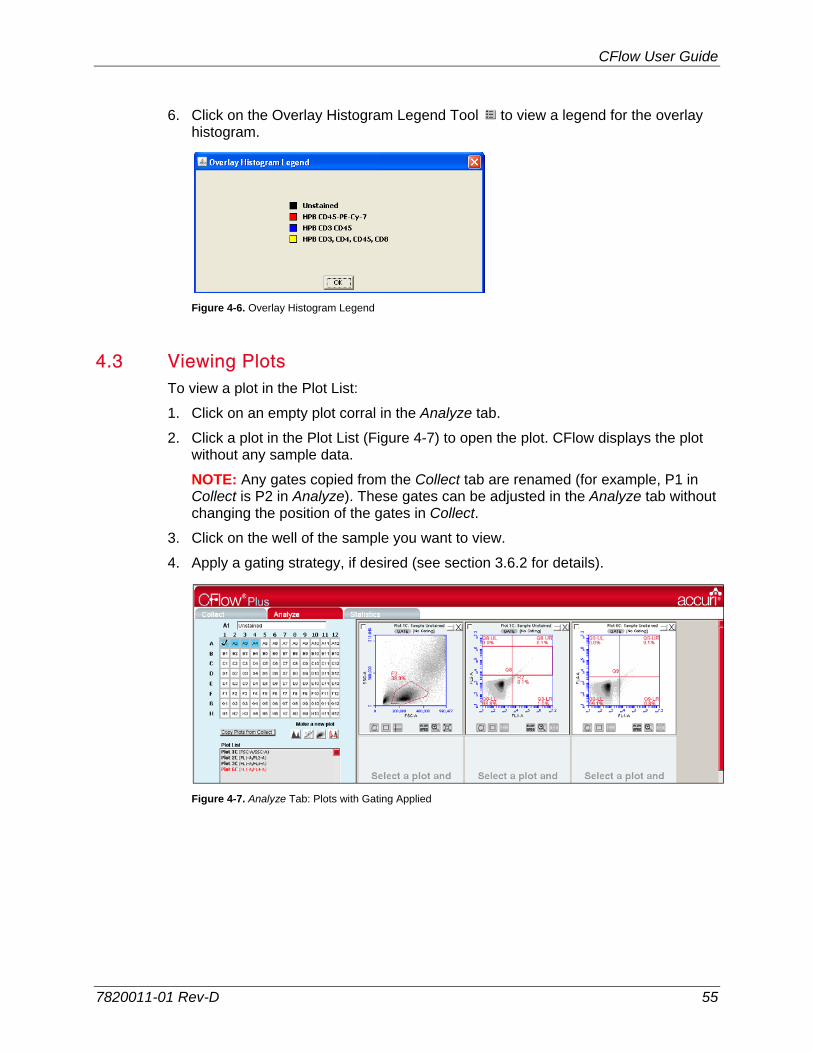
CFlow User Guide
7820011-01 Rev-D 55
6. Click on the Overlay Histogram Legend Tool to view a legend for the overlay histogram.
Figure 4-6. Overlay Histogram Legend
4.3 Viewing Plots To view a plot in the Plot List:
1. Click on an empty plot corral in the Analyze tab.
2. Click a plot in the Plot List (Figure 4-7) to open the plot. CFlow displays the plot without any sample data.
NOTE: Any gates copied from the Collect tab are renamed (for example, P1 in Collect is P2 in Analyze). These gates can be adjusted in the Analyze tab without changing the position of the gates in Collect.
3. Click on the well of the sample you want to view.
4. Apply a gating strategy, if desired (see section 3.6.2 for details).
Figure 4-7. Analyze Tab: Plots with Gating Applied
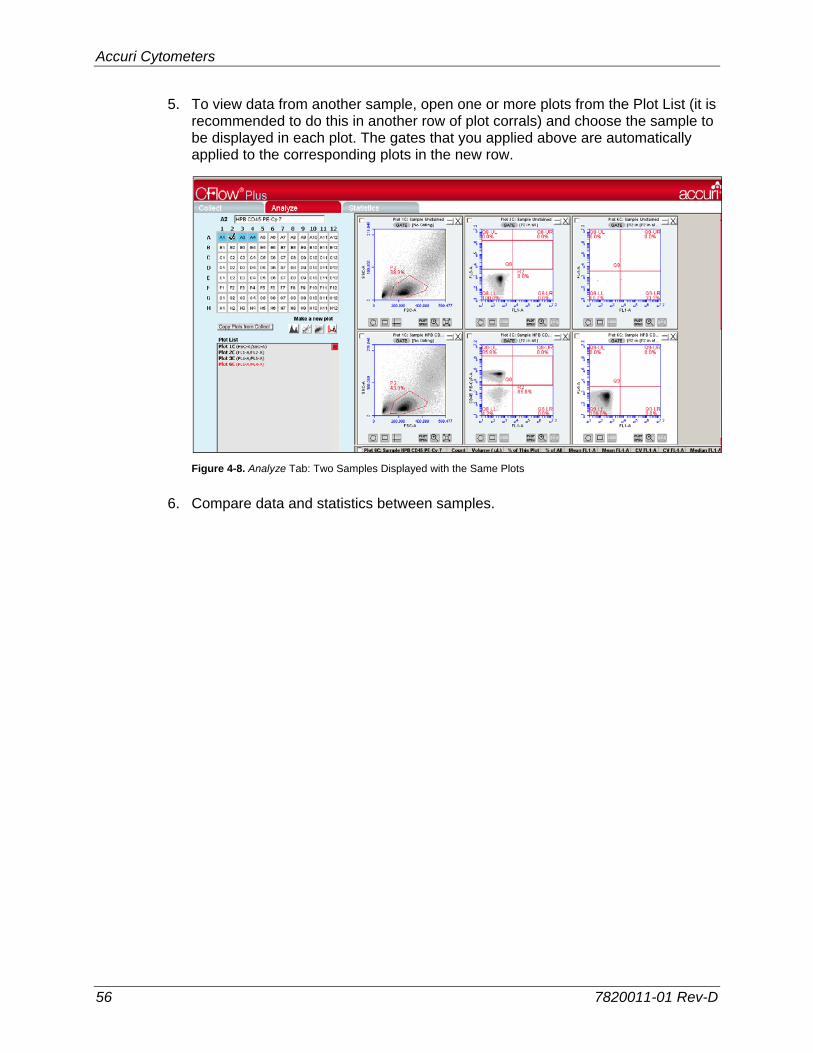
Accuri Cytometers
56 7820011-01 Rev-D
5. To view data from another sample, open one or more plots from the Plot List (it is recommended to do this in another row of plot corrals) and choose the sample to be displayed in each plot. The gates that you applied above are automatically applied to the corresponding plots in the new row.
Figure 4-8. Analyze Tab: Two Samples Displayed with the Same Plots
6. Compare data and statistics between samples.
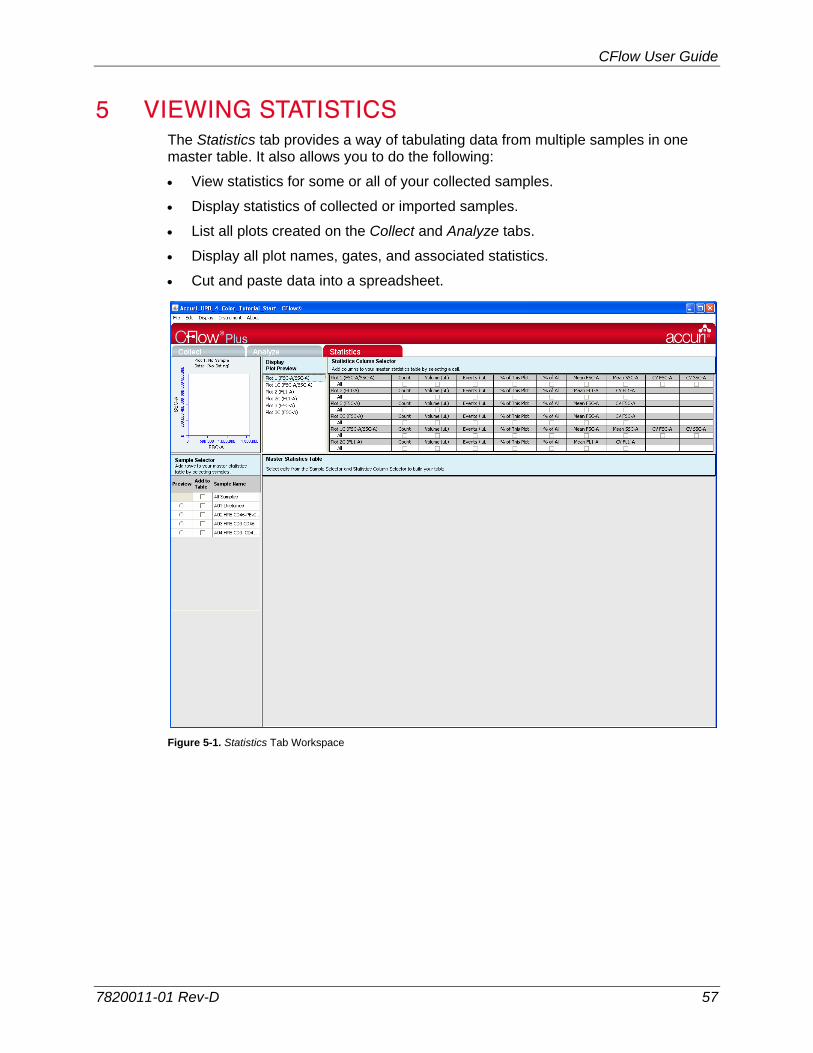
CFlow User Guide
7820011-01 Rev-D 57
5 VIEWING STATISTICS The Statistics tab provides a way of tabulating data from multiple samples in one master table. It also allows you to do the following:
View statistics for some or all of your collected samples.
Display statistics of collected or imported samples.
List all plots created on the Collect and Analyze tabs.
Display all plot names, gates, and associated statistics.
Cut and paste data into a spreadsheet.
Figure 5-1. Statistics Tab Workspace
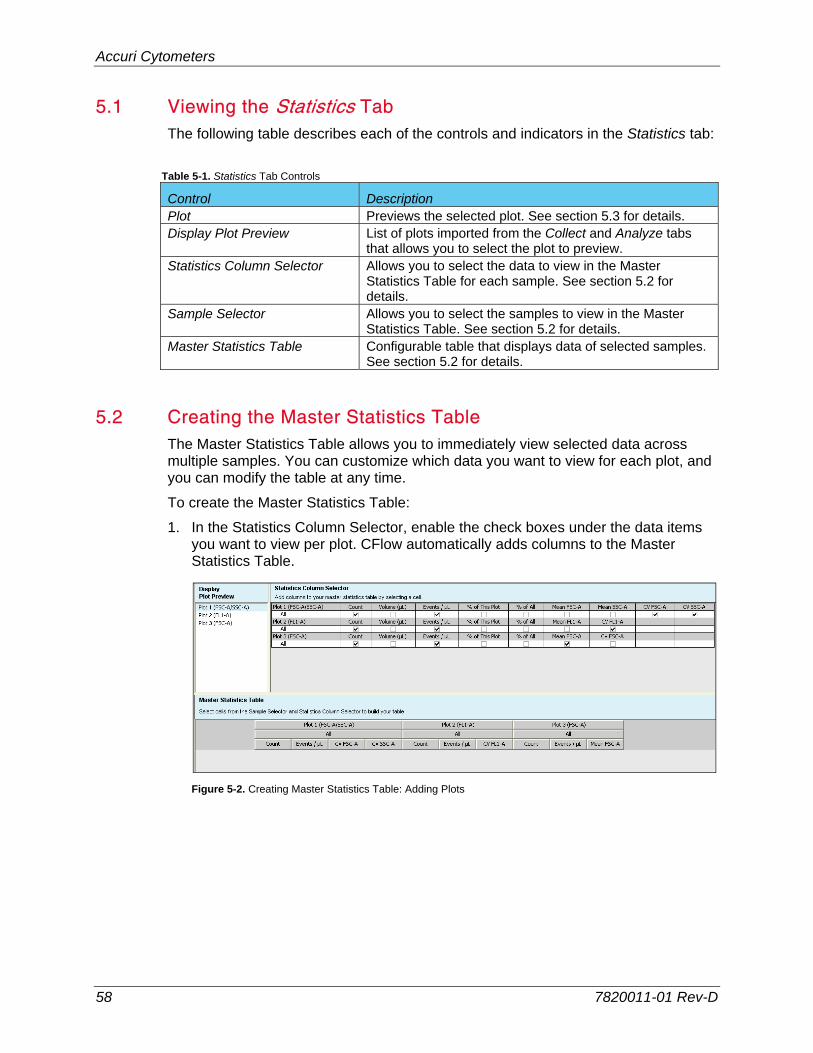
Accuri Cytometers
58 7820011-01 Rev-D
5.1 Viewing the Statistics Tab The following table describes each of the controls and indicators in the Statistics tab:
Table 5-1. Statistics Tab Controls
Control Description Plot Previews the selected plot. See section 5.3 for details. Display Plot Preview List of plots imported from the Collect and Analyze tabs
that allows you to select the plot to preview. Statistics Column Selector Allows you to select the data to view in the Master
Statistics Table for each sample. See section 5.2 for details.
Sample Selector Allows you to select the samples to view in the Master Statistics Table. See section 5.2 for details.
Master Statistics Table Configurable table that displays data of selected samples. See section 5.2 for details.
5.2 Creating the Master Statistics Table The Master Statistics Table allows you to immediately view selected data across multiple samples. You can customize which data you want to view for each plot, and you can modify the table at any time.
To create the Master Statistics Table:
1. In the Statistics Column Selector, enable the check boxes under the data items you want to view per plot. CFlow automatically adds columns to the Master Statistics Table.
Figure 5-2. Creating Master Statistics Table: Adding Plots

CFlow User Guide
7820011-01 Rev-D 59
2. In the Sample Selector list, enable the check box of each sample you want to view. CFlow automatically adds rows of samples to the Master Statistics Table and displays the sample data.
Figure 5-3. Creating Master Statistics Table: Adding Samples
5.3 Previewing a Plot in the Statistics Tab To preview a plot in the Statistics tab:
1. In the Display Plot Preview list, click on the plot you want to preview.
Figure 5-4. Plot Preview
Click to add samples
Statistics by plot
Statistics by sample
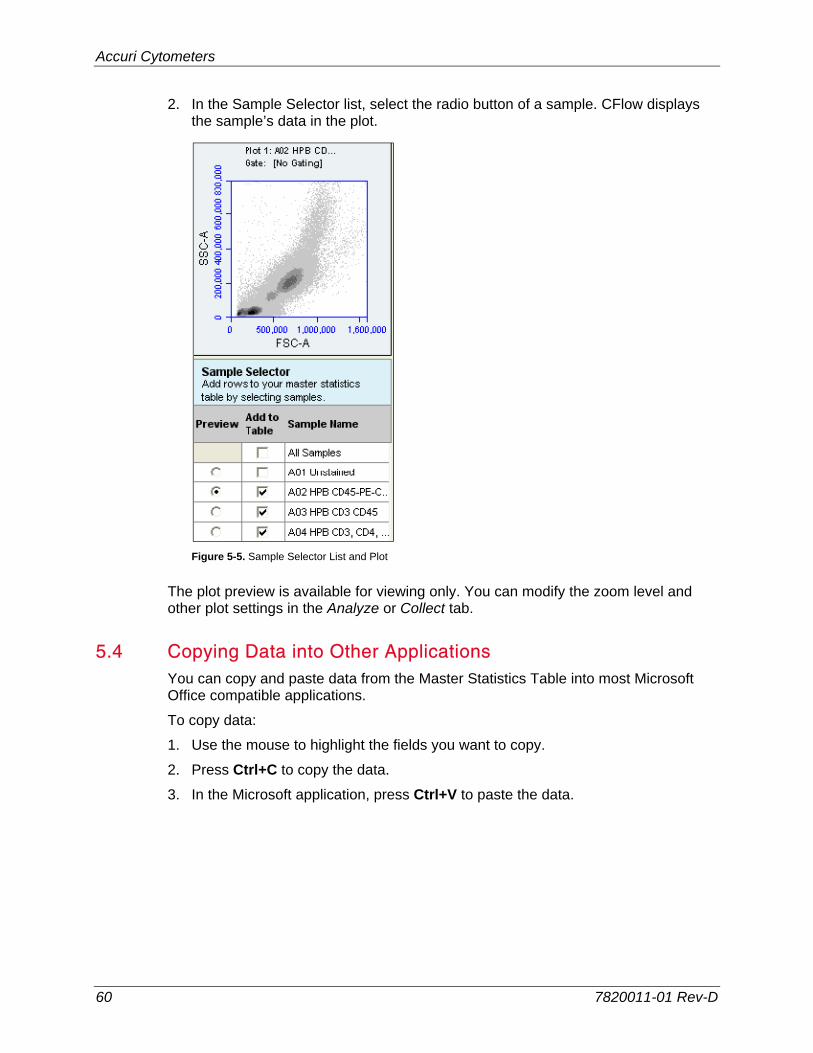
Accuri Cytometers
60 7820011-01 Rev-D
2. In the Sample Selector list, select the radio button of a sample. CFlow displays the sample’s data in the plot.
Figure 5-5. Sample Selector List and Plot
The plot preview is available for viewing only. You can modify the zoom level and other plot settings in the Analyze or Collect tab.
5.4 Copying Data into Other Applications You can copy and paste data from the Master Statistics Table into most Microsoft Office compatible applications.
To copy data:
1. Use the mouse to highlight the fields you want to copy.
2. Press Ctrl+C to copy the data.
3. In the Microsoft application, press Ctrl+V to paste the data.
CFlow User Guide
7820011-01 Rev-D 61
6 MAINTAINING THE C6 To ensure that your C6 Flow Cytometer maintains optimal performance, follow the routines in this chapter on a regular basis. See the C6 Flow Cytometer Instrument Manual for mechanical maintenance procedures (such as replacing tubing).
6.1 Cleaning the SIP Run the backflush cycle to clean the SIP and remove clogs at the base of the SIP.
To perform a backflush:
1. Place a blotter or empty sample tube under the SIP to catch dripping fluid.
2. Click on the Backflush button to clear any residue from the SIP.
3. When the backflush is completed, remove the tube from the SIP.
6.2 Cleaning the Flow Cell Clean the flow cell as a part of regular maintenance or to correct performance issues of the cytometer.
6.2.1 Running the Unclog Cycle The unclog cycle purges the flow cell of debris.
To purge the flow cell:
1. Remove the sample tube from the SIP and place a blotter or empty sample tube under the SIP to catch dripping fluid.
2. Do one of the following:
Click on the Unclog button in the Collect tab.
Select Instrument > Run Unclog Cycle.
6.2.2 Running an Extended Clean of the Flow Cell You can clean the flow cell for an extended time. During extended flow cell cleaning, the flow cell fills completely with cleaning solution from the sample tube on the SIP. This cycle automatically shuts down the C6 with cleaning solution in the flow cell, allowing the flow cell to soak.
To run the extended clean of the flow cell:
1. Place a tube with at least 500 µL of cleaning solution on the SIP.
CAUTION: Never run the Extended Clean of the Flow Cell cycle without a tube containing at least 500 µL of fluid.
2. Select Instrument > Extended clean of flow cell.
3. After the C6 is shut down, leave the cytometer off for at least 30 minutes (or longer, for a more thorough cleaning).
Accuri Cytometers
62 7820011-01 Rev-D
4. Restart the cytometer. The C6 performs a longer fluidics startup cycle and CFlow displays the message Extra startup time needed due to cleaning or improper shutdown. This longer cycle purges cleaning solution from the flow cell.
5. Operate the C6 as usual when startup is complete.
6.3 Cleaning the Fluidics Lines The cleaning fluid cycle pulls cleaning solution from the cleaner tank and runs it through the fluidic lines. After filling the system with cleaning solution, the cleaning fluid cycle purges the cytometer with fresh sheath fluid and performs a backflush. This cycle takes about five minutes.
To run a cleaning fluid cycle:
1. Place a tube of cleaning solution on the SIP.
2. Select Instrument > Run cleaning fluid cycle.
6.4 Decontaminating the Fluidics System CFlow decontaminates the fluidics system of biohazardous materials every time you shut down the C6. You can also manually run the decontamination fluid cycle at any time. Decontamination takes about 13 minutes.
To manually decontaminate the fluidics:
1. Place a tube of water on the SIP.
2. Select Instrument > Run decontamination fluid cycle. The C6 pulls decontamination fluid from the decontamination bottle then pulls sheath fluid from the sheath fluid bottle.
6.5 Calibrating the Fluidics System for Precise Volume Measurements If you validate performance with the Accuri Volumetric Validation Beads (QA-120) and validation fails, you can recalibrate the C6 Cytometer.
Do the following on a regular basis to ensure that the C6 continues to be correctly calibrated:
Replace any peristaltic pump tubing that is at least two months old.
Run samples at medium or fast speeds.
Use the same sample volume/fluid height in the tube during calibration as you will use during your experiment.
To calibrate the C6:
1. Fill a tube with 500 µL of sheath fluid.
NOTE: Use the same kind of tube that you will use during the experiment.
2. Place the tube on the SIP.
3. In CFlow, select Instrument > Calibrate fluidics to begin calibration. The calibration takes about five minutes.
CFlow User Guide
7820011-01 Rev-D 63
If calibration fails, the C6 automatically reverts to the factory calibration settings and operates normally. However, the volumes recorded will not be optimized for the new sample volume. If more precise measurement is essential, try calibrating again.
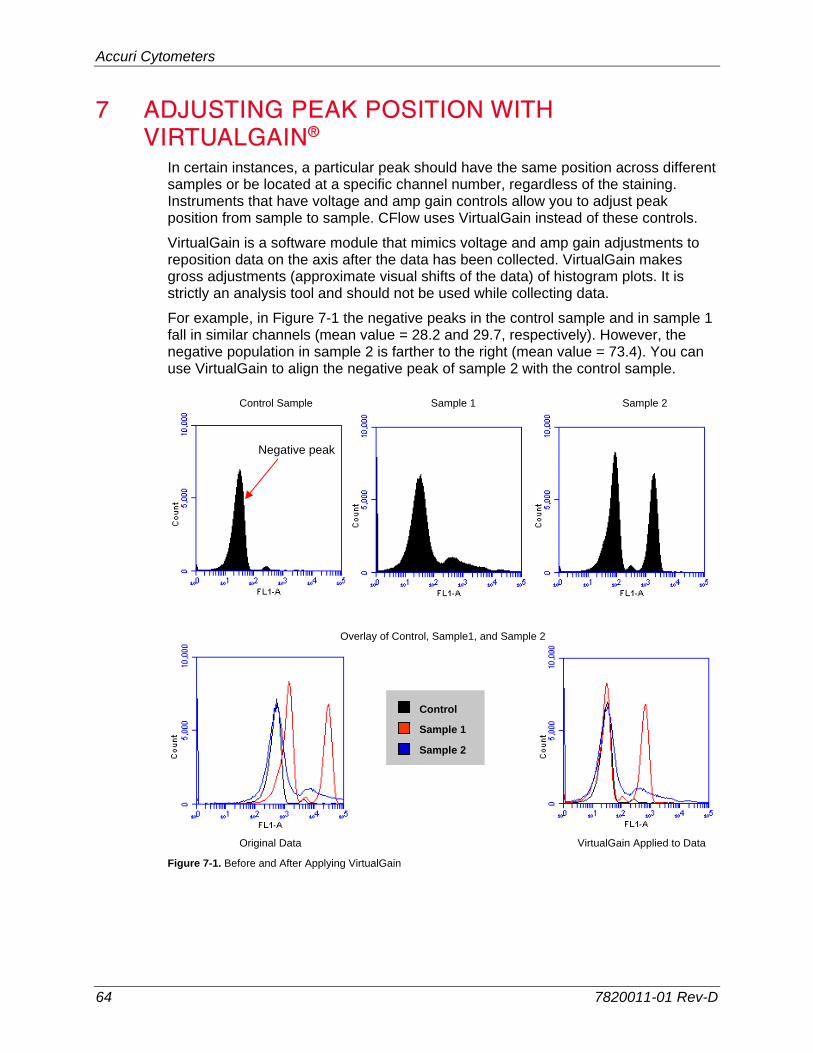
Accuri Cytometers
64 7820011-01 Rev-D
7 ADJUSTING PEAK POSITION WITH VIRTUALGAIN®
In certain instances, a particular peak should have the same position across different samples or be located at a specific channel number, regardless of the staining. Instruments that have voltage and amp gain controls allow you to adjust peak position from sample to sample. CFlow uses VirtualGain instead of these controls.
VirtualGain is a software module that mimics voltage and amp gain adjustments to reposition data on the axis after the data has been collected. VirtualGain makes gross adjustments (approximate visual shifts of the data) of histogram plots. It is strictly an analysis tool and should not be used while collecting data.
For example, in Figure 7-1 the negative peaks in the control sample and in sample 1 fall in similar channels (mean value = 28.2 and 29.7, respectively). However, the negative population in sample 2 is farther to the right (mean value = 73.4). You can use VirtualGain to align the negative peak of sample 2 with the control sample.
Control Sample Sample 1 Sample 2
Overlay of Control, Sample1, and Sample 2
Original Data VirtualGain Applied to Data
Figure 7-1. Before and After Applying VirtualGain
Control
Sample 1
Sample 2
Negative peak
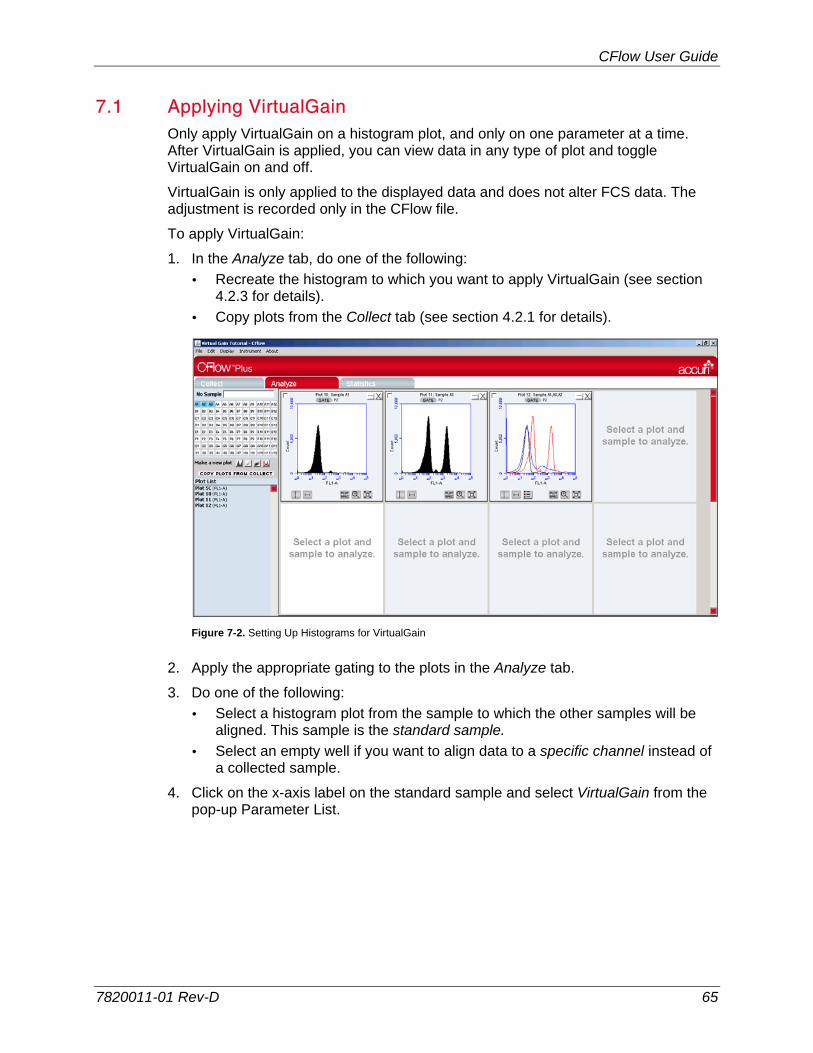
CFlow User Guide
7820011-01 Rev-D 65
7.1 Applying VirtualGain Only apply VirtualGain on a histogram plot, and only on one parameter at a time. After VirtualGain is applied, you can view data in any type of plot and toggle VirtualGain on and off.
VirtualGain is only applied to the displayed data and does not alter FCS data. The adjustment is recorded only in the CFlow file.
To apply VirtualGain:
1. In the Analyze tab, do one of the following:
Recreate the histogram to which you want to apply VirtualGain (see section 4.2.3 for details).
Copy plots from the Collect tab (see section 4.2.1 for details).
Figure 7-2. Setting Up Histograms for VirtualGain
2. Apply the appropriate gating to the plots in the Analyze tab.
3. Do one of the following:
Select a histogram plot from the sample to which the other samples will be aligned. This sample is the standard sample.
Select an empty well if you want to align data to a specific channel instead of a collected sample.
4. Click on the x-axis label on the standard sample and select VirtualGain from the pop-up Parameter List.
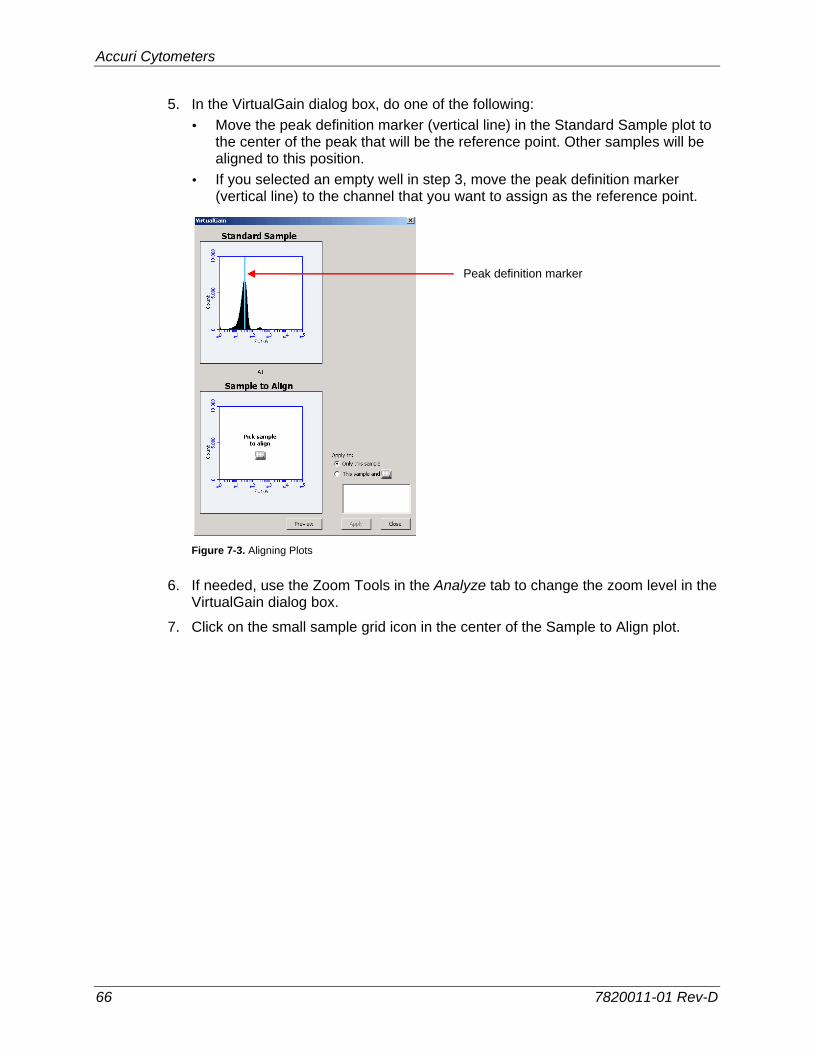
Accuri Cytometers
66 7820011-01 Rev-D
5. In the VirtualGain dialog box, do one of the following:
Move the peak definition marker (vertical line) in the Standard Sample plot to the center of the peak that will be the reference point. Other samples will be aligned to this position.
If you selected an empty well in step 3, move the peak definition marker (vertical line) to the channel that you want to assign as the reference point.
Figure 7-3. Aligning Plots
6. If needed, use the Zoom Tools in the Analyze tab to change the zoom level in the VirtualGain dialog box.
7. Click on the small sample grid icon in the center of the Sample to Align plot.
Peak definition marker
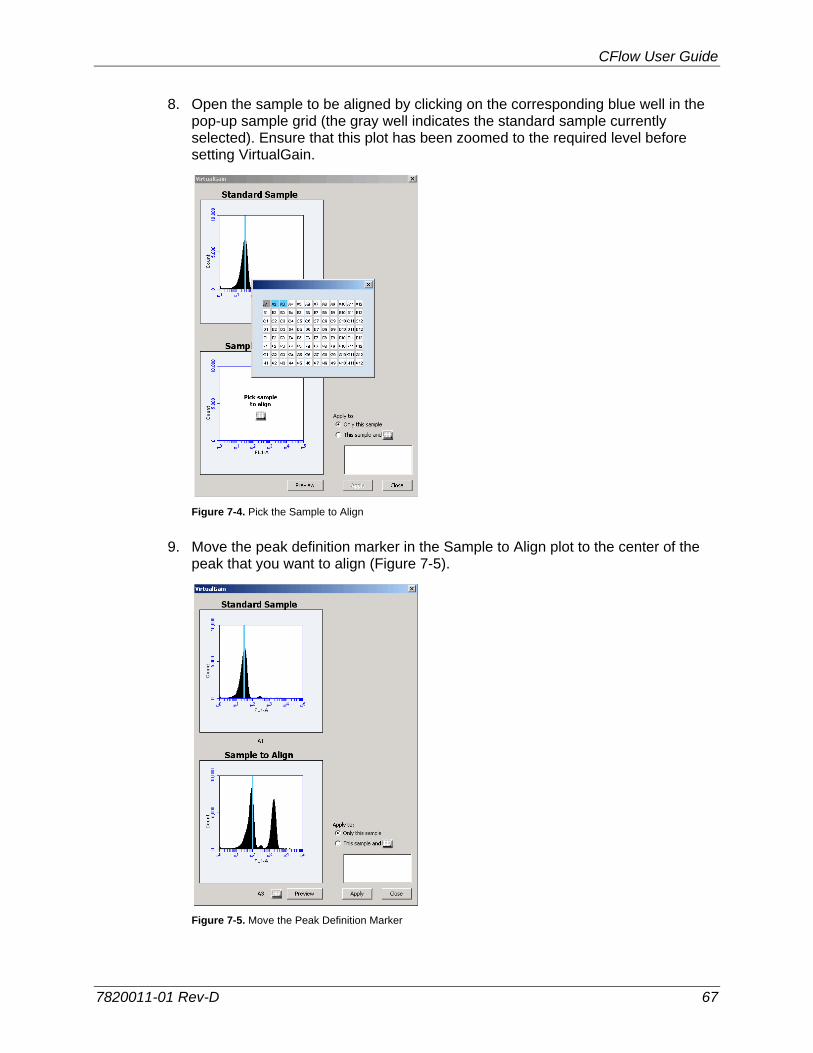
CFlow User Guide
7820011-01 Rev-D 67
8. Open the sample to be aligned by clicking on the corresponding blue well in the pop-up sample grid (the gray well indicates the standard sample currently selected). Ensure that this plot has been zoomed to the required level before setting VirtualGain.
Figure 7-4. Pick the Sample to Align
9. Move the peak definition marker in the Sample to Align plot to the center of the peak that you want to align (Figure 7-5).
Figure 7-5. Move the Peak Definition Marker
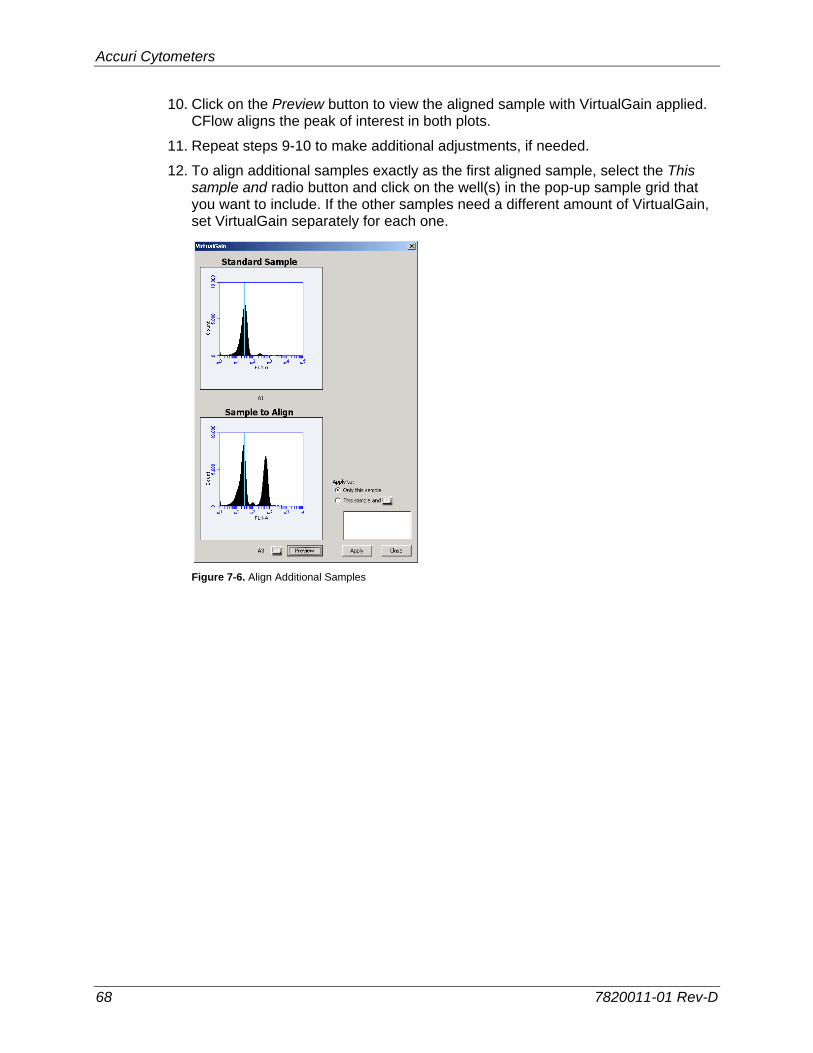
Accuri Cytometers
68 7820011-01 Rev-D
10. Click on the Preview button to view the aligned sample with VirtualGain applied. CFlow aligns the peak of interest in both plots.
11. Repeat steps 9-10 to make additional adjustments, if needed.
12. To align additional samples exactly as the first aligned sample, select the This sample and radio button and click on the well(s) in the pop-up sample grid that you want to include. If the other samples need a different amount of VirtualGain, set VirtualGain separately for each one.
Figure 7-6. Align Additional Samples
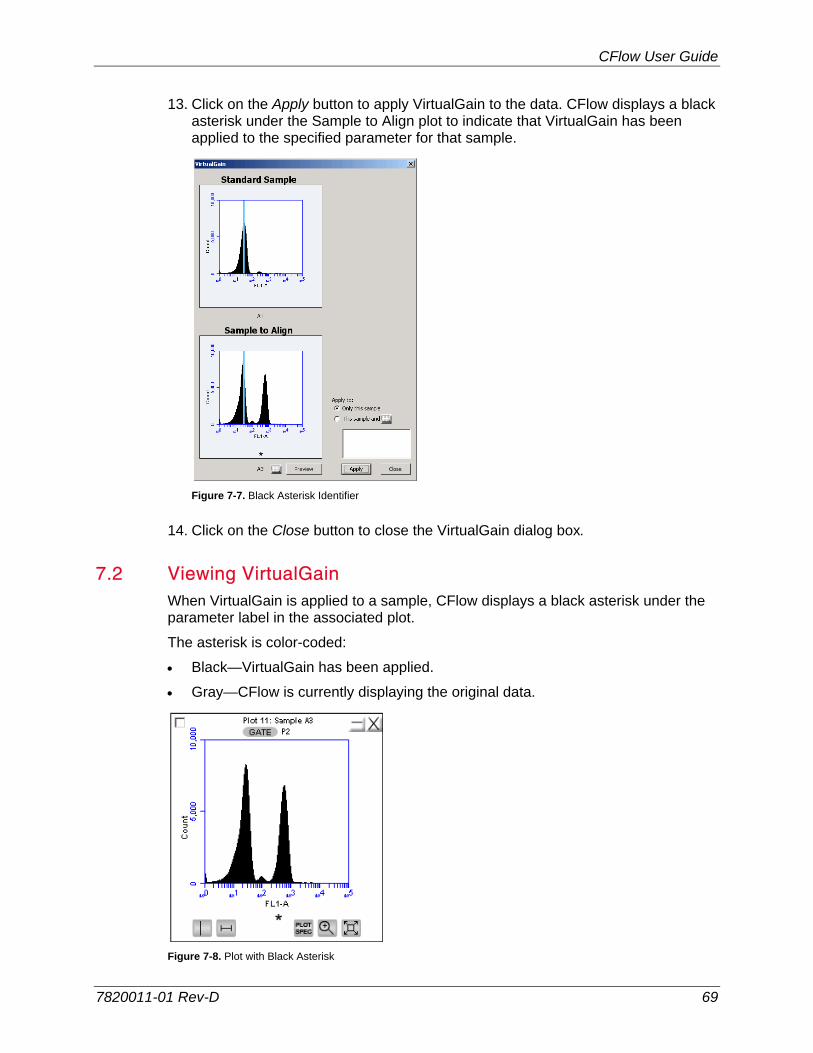
CFlow User Guide
7820011-01 Rev-D 69
13. Click on the Apply button to apply VirtualGain to the data. CFlow displays a black asterisk under the Sample to Align plot to indicate that VirtualGain has been applied to the specified parameter for that sample.
Figure 7-7. Black Asterisk Identifier
14. Click on the Close button to close the VirtualGain dialog box.
7.2 Viewing VirtualGain When VirtualGain is applied to a sample, CFlow displays a black asterisk under the parameter label in the associated plot.
The asterisk is color-coded:
Black—VirtualGain has been applied.
Gray—CFlow is currently displaying the original data.
Figure 7-8. Plot with Black Asterisk
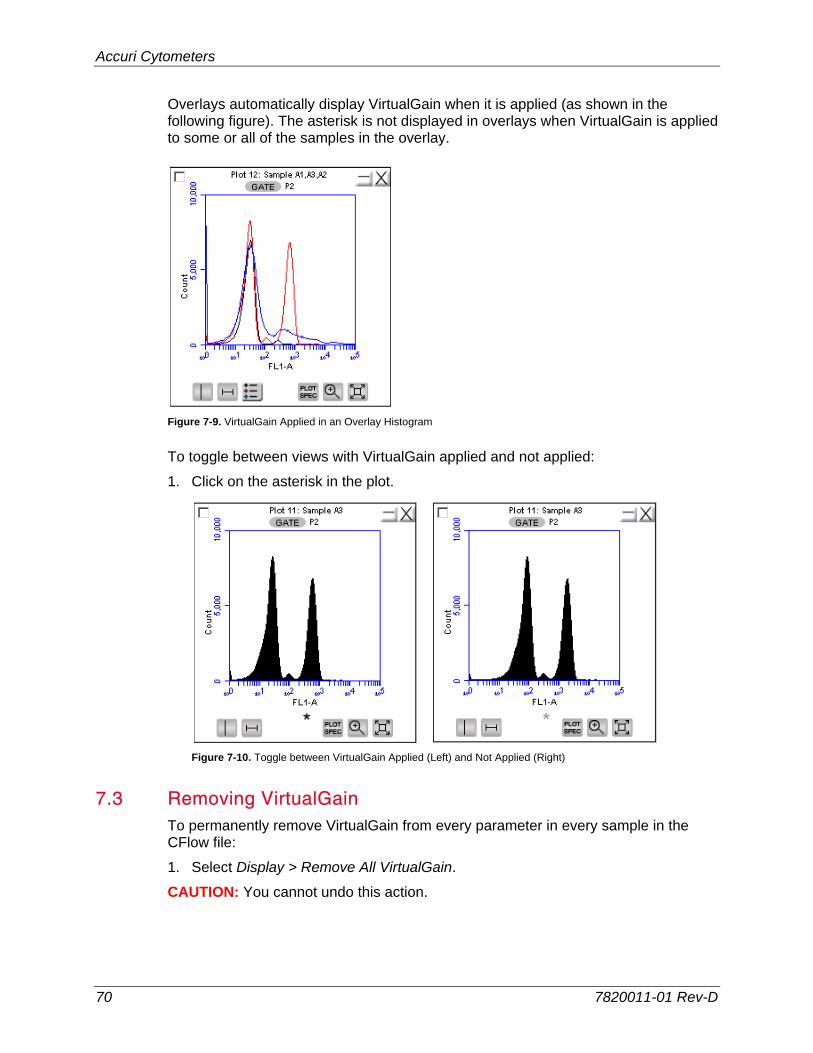
Accuri Cytometers
70 7820011-01 Rev-D
Overlays automatically display VirtualGain when it is applied (as shown in the following figure). The asterisk is not displayed in overlays when VirtualGain is applied to some or all of the samples in the overlay.
Figure 7-9. VirtualGain Applied in an Overlay Histogram
To toggle between views with VirtualGain applied and not applied:
1. Click on the asterisk in the plot.
Figure 7-10. Toggle between VirtualGain Applied (Left) and Not Applied (Right)
7.3 Removing VirtualGain To permanently remove VirtualGain from every parameter in every sample in the CFlow file:
1. Select Display > Remove All VirtualGain.
CAUTION: You cannot undo this action.
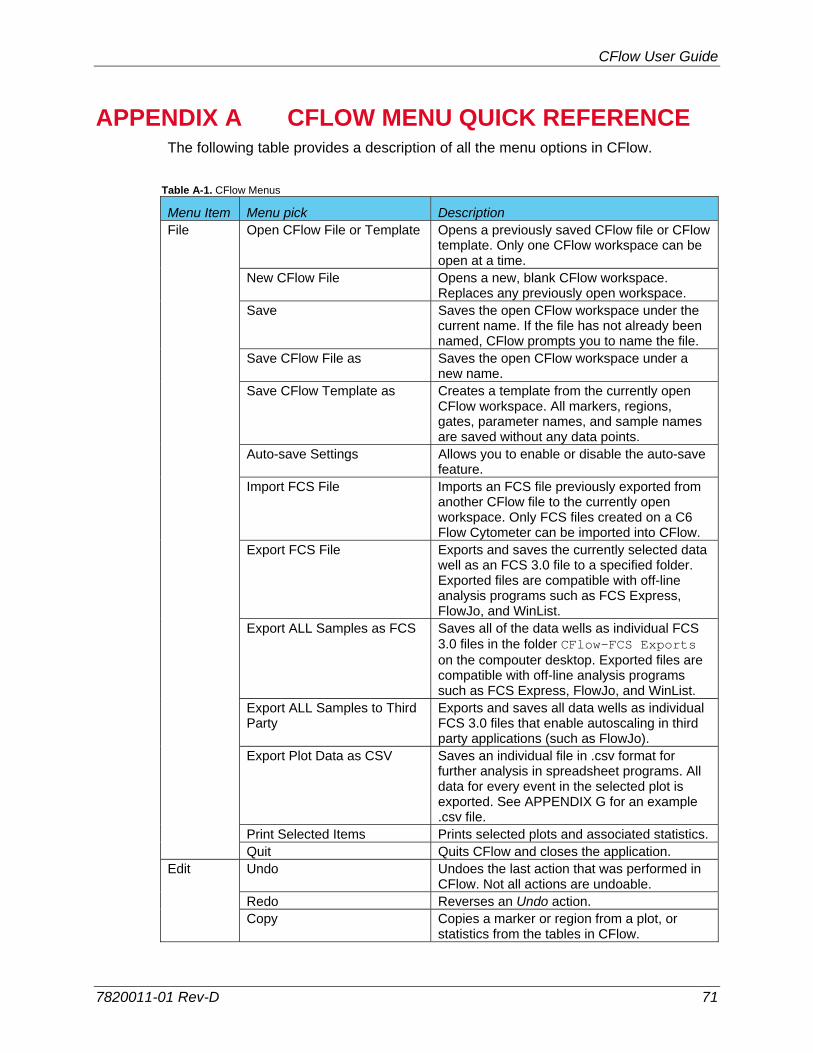
CFlow User Guide
7820011-01 Rev-D 71
APPENDIX A CFLOW MENU QUICK REFERENCE The following table provides a description of all the menu options in CFlow.
Table A-1. CFlow Menus
Menu Item Menu pick Description File Open CFlow File or Template Opens a previously saved CFlow file or CFlow
template. Only one CFlow workspace can be open at a time.
New CFlow File Opens a new, blank CFlow workspace. Replaces any previously open workspace.
Save Saves the open CFlow workspace under the current name. If the file has not already been named, CFlow prompts you to name the file.
Save CFlow File as Saves the open CFlow workspace under a new name.
Save CFlow Template as Creates a template from the currently open CFlow workspace. All markers, regions, gates, parameter names, and sample names are saved without any data points.
Auto-save Settings Allows you to enable or disable the auto-save feature.
Import FCS File Imports an FCS file previously exported from another CFlow file to the currently open workspace. Only FCS files created on a C6 Flow Cytometer can be imported into CFlow.
Export FCS File Exports and saves the currently selected data well as an FCS 3.0 file to a specified folder. Exported files are compatible with off-line analysis programs such as FCS Express, FlowJo, and WinList.
Export ALL Samples as FCS Saves all of the data wells as individual FCS 3.0 files in the folder CFlow-FCS Exports on the compouter desktop. Exported files are compatible with off-line analysis programs such as FCS Express, FlowJo, and WinList.
Export ALL Samples to Third Party
Exports and saves all data wells as individual FCS 3.0 files that enable autoscaling in third party applications (such as FlowJo).
Export Plot Data as CSV Saves an individual file in .csv format for further analysis in spreadsheet programs. All data for every event in the selected plot is exported. See APPENDIX G for an example .csv file.
Print Selected Items Prints selected plots and associated statistics. Quit Quits CFlow and closes the application. Edit Undo Undoes the last action that was performed in
CFlow. Not all actions are undoable. Redo Reverses an Undo action. Copy Copies a marker or region from a plot, or
statistics from the tables in CFlow.
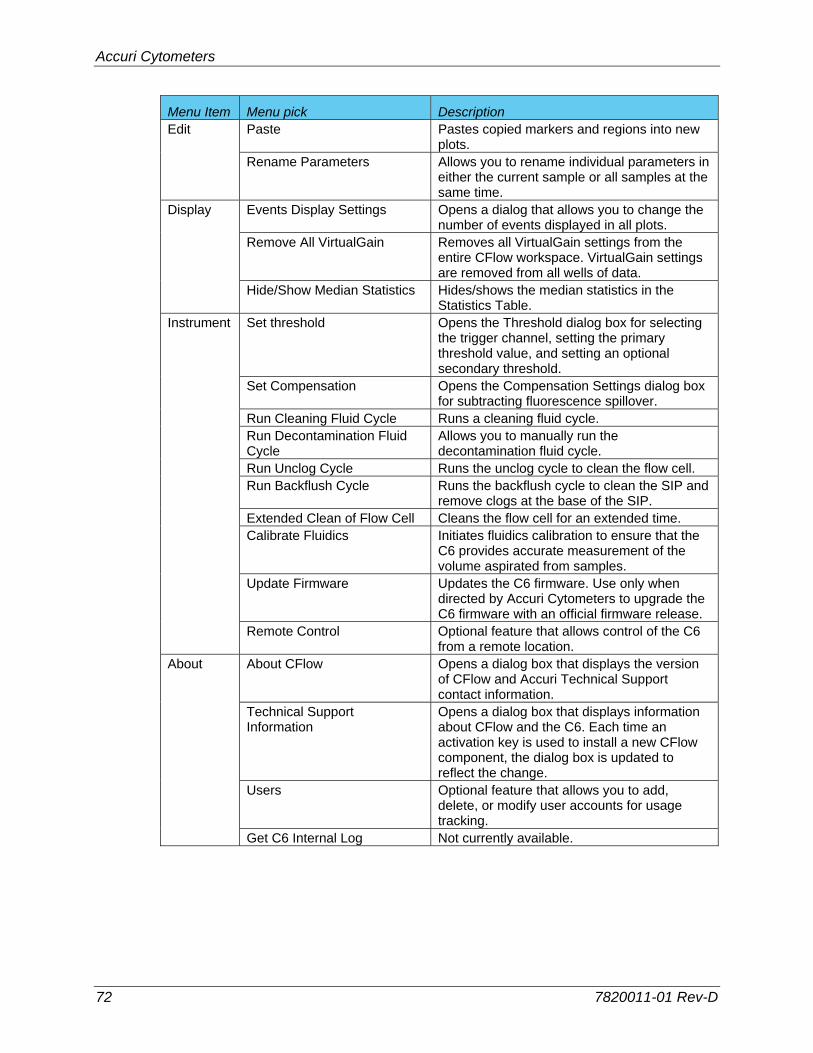
Accuri Cytometers
72 7820011-01 Rev-D
Menu Item Menu pick Description Edit Paste Pastes copied markers and regions into new
plots. Rename Parameters Allows you to rename individual parameters in
either the current sample or all samples at the same time.
Display Events Display Settings Opens a dialog that allows you to change the number of events displayed in all plots.
Remove All VirtualGain Removes all VirtualGain settings from the entire CFlow workspace. VirtualGain settings are removed from all wells of data.
Hide/Show Median Statistics Hides/shows the median statistics in the Statistics Table.
Instrument Set threshold Opens the Threshold dialog box for selecting the trigger channel, setting the primary threshold value, and setting an optional secondary threshold.
Set Compensation Opens the Compensation Settings dialog box for subtracting fluorescence spillover.
Run Cleaning Fluid Cycle Runs a cleaning fluid cycle. Run Decontamination Fluid
Cycle Allows you to manually run the decontamination fluid cycle.
Run Unclog Cycle Runs the unclog cycle to clean the flow cell. Run Backflush Cycle Runs the backflush cycle to clean the SIP and
remove clogs at the base of the SIP. Extended Clean of Flow Cell Cleans the flow cell for an extended time. Calibrate Fluidics Initiates fluidics calibration to ensure that the
C6 provides accurate measurement of the volume aspirated from samples.
Update Firmware Updates the C6 firmware. Use only when directed by Accuri Cytometers to upgrade the C6 firmware with an official firmware release.
Remote Control Optional feature that allows control of the C6 from a remote location.
About About CFlow Opens a dialog box that displays the version of CFlow and Accuri Technical Support contact information.
Technical Support Information
Opens a dialog box that displays information about CFlow and the C6. Each time an activation key is used to install a new CFlow component, the dialog box is updated to reflect the change.
Users Optional feature that allows you to add, delete, or modify user accounts for usage tracking.
Get C6 Internal Log Not currently available.
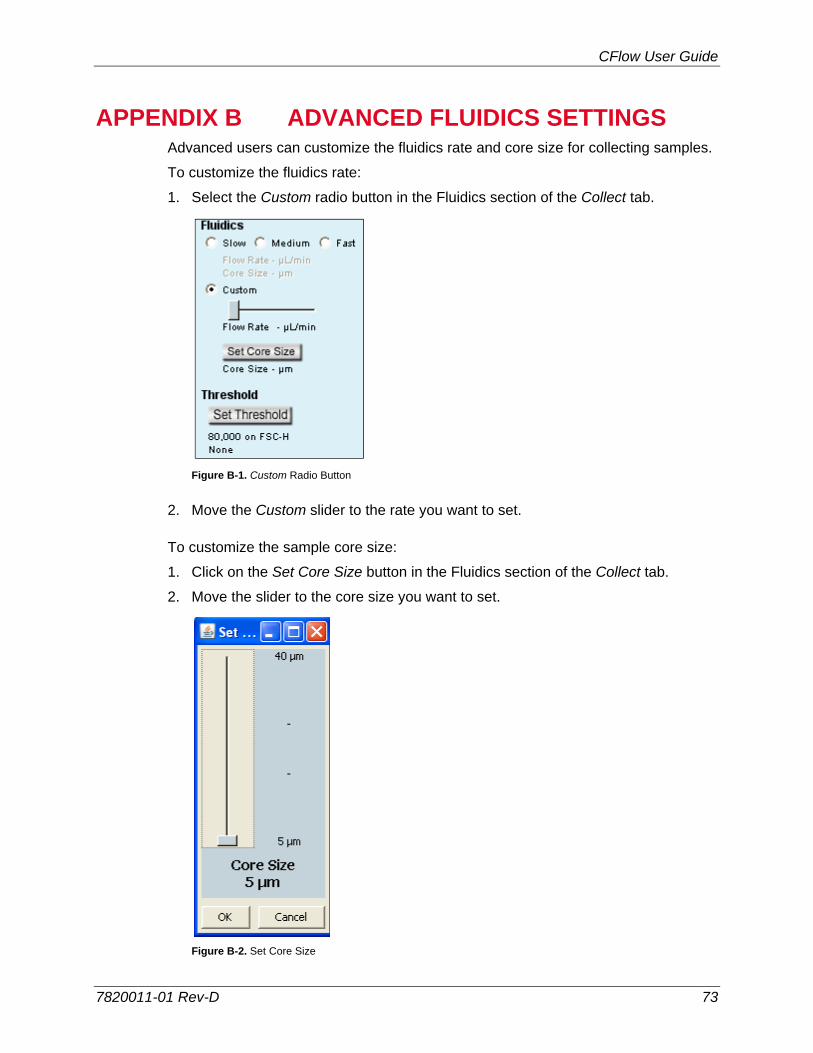
CFlow User Guide
7820011-01 Rev-D 73
APPENDIX B ADVANCED FLUIDICS SETTINGS Advanced users can customize the fluidics rate and core size for collecting samples.
To customize the fluidics rate:
1. Select the Custom radio button in the Fluidics section of the Collect tab.
Figure B-1. Custom Radio Button
2. Move the Custom slider to the rate you want to set.
To customize the sample core size:
1. Click on the Set Core Size button in the Fluidics section of the Collect tab.
2. Move the slider to the core size you want to set.
Figure B-2. Set Core Size
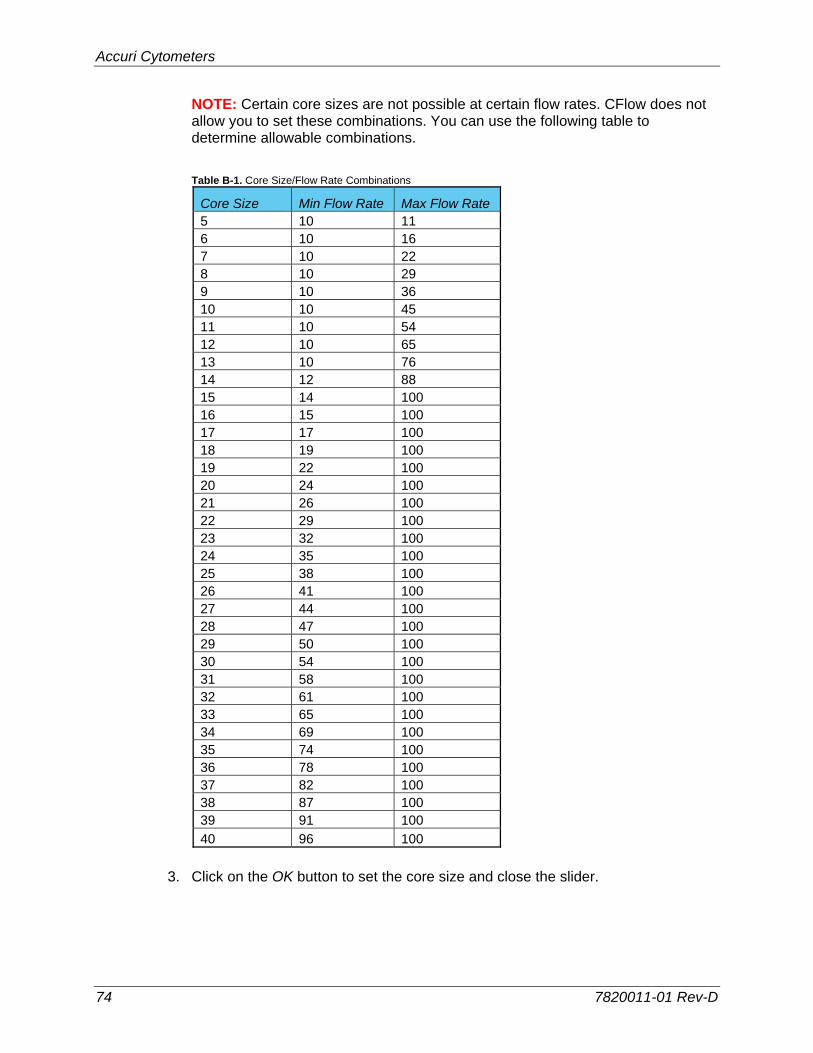
Accuri Cytometers
74 7820011-01 Rev-D
NOTE: Certain core sizes are not possible at certain flow rates. CFlow does not allow you to set these combinations. You can use the following table to determine allowable combinations.
Table B-1. Core Size/Flow Rate Combinations
Core Size Min Flow Rate Max Flow Rate 5 10 11 6 10 16 7 10 22 8 10 29 9 10 36 10 10 45 11 10 54 12 10 65 13 10 76 14 12 88 15 14 100 16 15 100 17 17 100 18 19 100 19 22 100 20 24 100 21 26 100 22 29 100 23 32 100 24 35 100 25 38 100 26 41 100 27 44 100 28 47 100 29 50 100 30 54 100 31 58 100 32 61 100 33 65 100 34 69 100 35 74 100 36 78 100 37 82 100 38 87 100 39 91 100
40 96 100
3. Click on the OK button to set the core size and close the slider.
CFlow User Guide
7820011-01 Rev-D 75
APPENDIX C TRACKING USER ACTIVITY User tracking allows laboratory administrators to track the activities of C6 operators by assigning a user name and password to each individual. Passwords are created and used in CFlow and are unrelated to any Windows passwords used on the host computer or network.
User Tracking is an optional upgrade for CFlow Plus and CFlow Sampler software and requires the use of CFlow version 227 or above.
C.1 Installing the User Tracking Module To install user tracking on your CFlow computer:
1. Ensure CFlow Plus or CFlow Sampler version 227 or above is loaded on the computer.
2. Copy the User Tracking Activation Key from the installation CD or flash drive to the computer desktop.
3. Double-click on the User Tracking Installer icon on the desktop.
Figure C-1. User Tracking Installer Icon
4. In the installation wizard, choose the correct directory to install the Activation Key. The location depends on where CFlow Plus or CFlow Sampler has been installed. In most cases, the location is in one of two places:
C:\Program Files\CFlow\CFlow Plus\ActivationKeys
C:\Program Files\CFlow\CFlow Sampler\ActivationKeys
If necessary, use the browse button to navigate to the correct folder.
Figure C-2. Installation Dialog Box
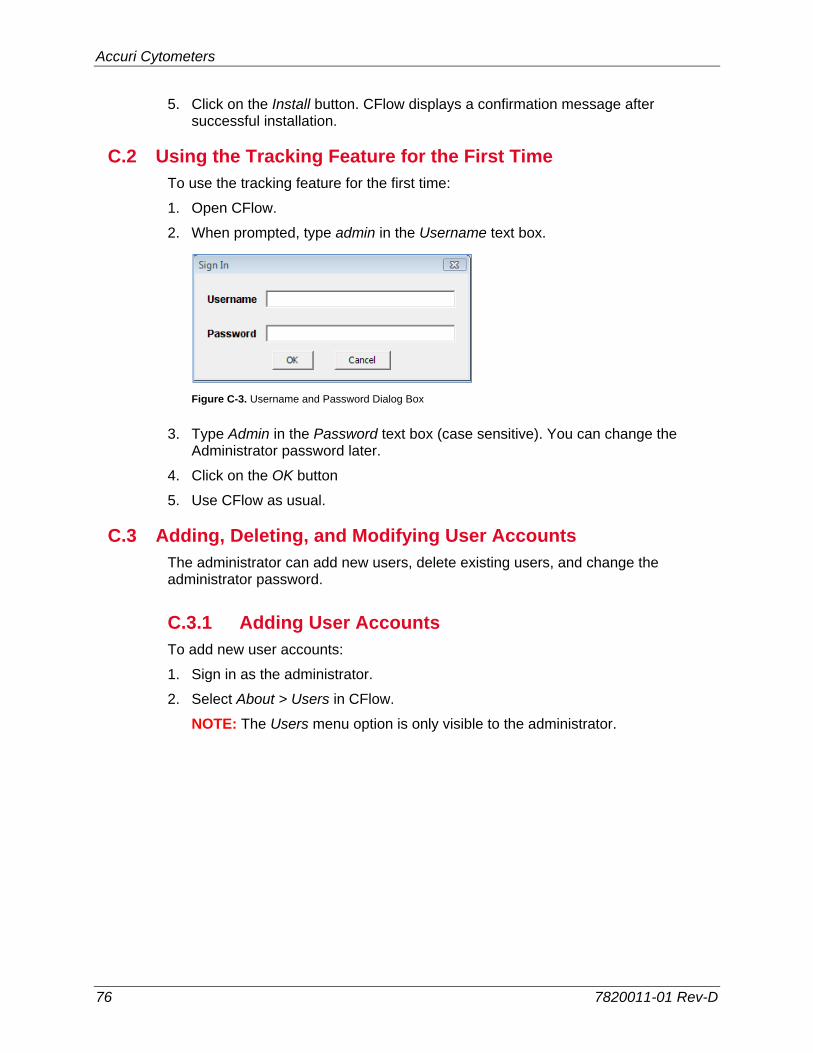
Accuri Cytometers
76 7820011-01 Rev-D
5. Click on the Install button. CFlow displays a confirmation message after successful installation.
C.2 Using the Tracking Feature for the First Time To use the tracking feature for the first time:
1. Open CFlow.
2. When prompted, type admin in the Username text box.
Figure C-3. Username and Password Dialog Box
3. Type Admin in the Password text box (case sensitive). You can change the Administrator password later.
4. Click on the OK button
5. Use CFlow as usual.
C.3 Adding, Deleting, and Modifying User Accounts The administrator can add new users, delete existing users, and change the administrator password.
C.3.1 Adding User Accounts To add new user accounts:
1. Sign in as the administrator.
2. Select About > Users in CFlow.
NOTE: The Users menu option is only visible to the administrator.
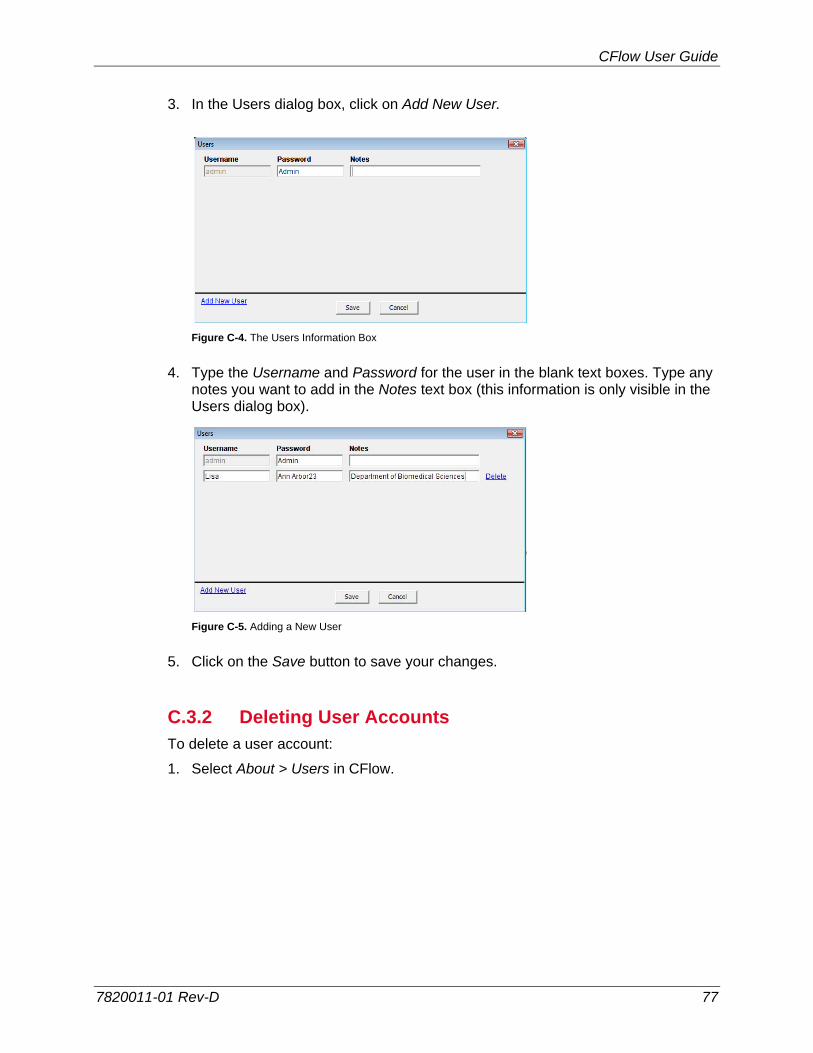
CFlow User Guide
7820011-01 Rev-D 77
3. In the Users dialog box, click on Add New User.
Figure C-4. The Users Information Box
4. Type the Username and Password for the user in the blank text boxes. Type any notes you want to add in the Notes text box (this information is only visible in the Users dialog box).
Figure C-5. Adding a New User
5. Click on the Save button to save your changes.
C.3.2 Deleting User Accounts To delete a user account:
1. Select About > Users in CFlow.
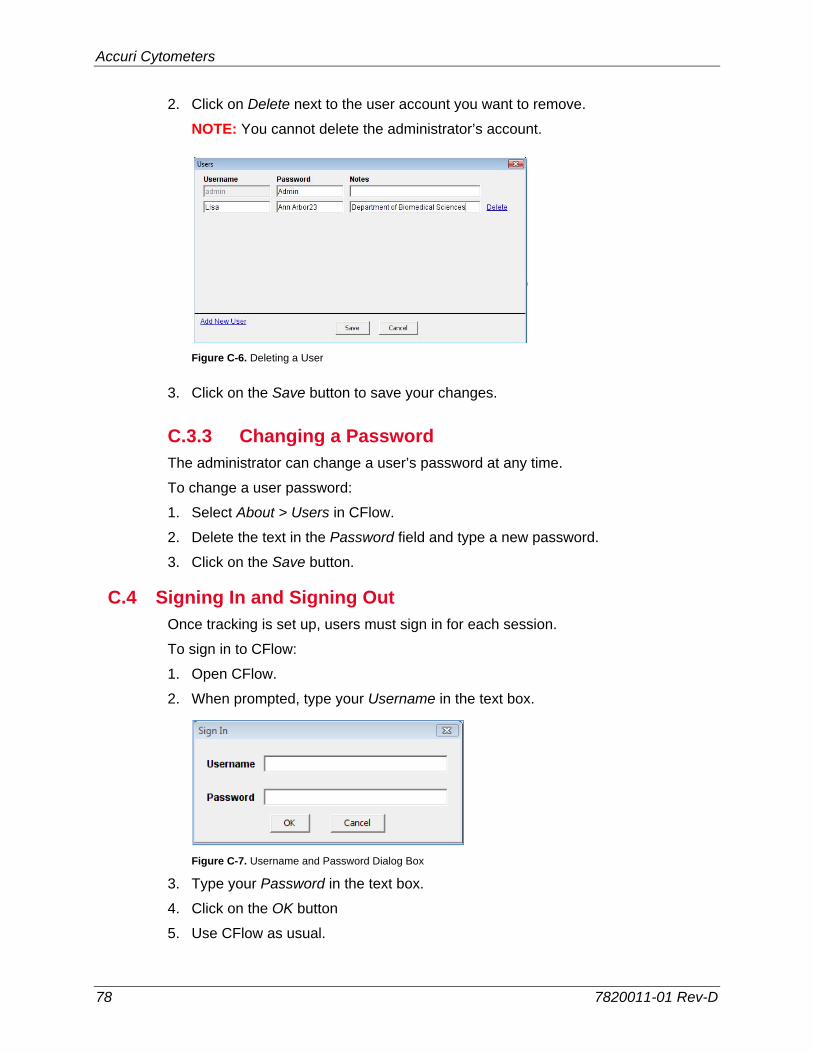
Accuri Cytometers
78 7820011-01 Rev-D
2. Click on Delete next to the user account you want to remove.
NOTE: You cannot delete the administrator’s account.
Figure C-6. Deleting a User
3. Click on the Save button to save your changes.
C.3.3 Changing a Password The administrator can change a user’s password at any time.
To change a user password:
1. Select About > Users in CFlow.
2. Delete the text in the Password field and type a new password.
3. Click on the Save button.
C.4 Signing In and Signing Out Once tracking is set up, users must sign in for each session.
To sign in to CFlow:
1. Open CFlow.
2. When prompted, type your Username in the text box.
Figure C-7. Username and Password Dialog Box
3. Type your Password in the text box.
4. Click on the OK button
5. Use CFlow as usual.
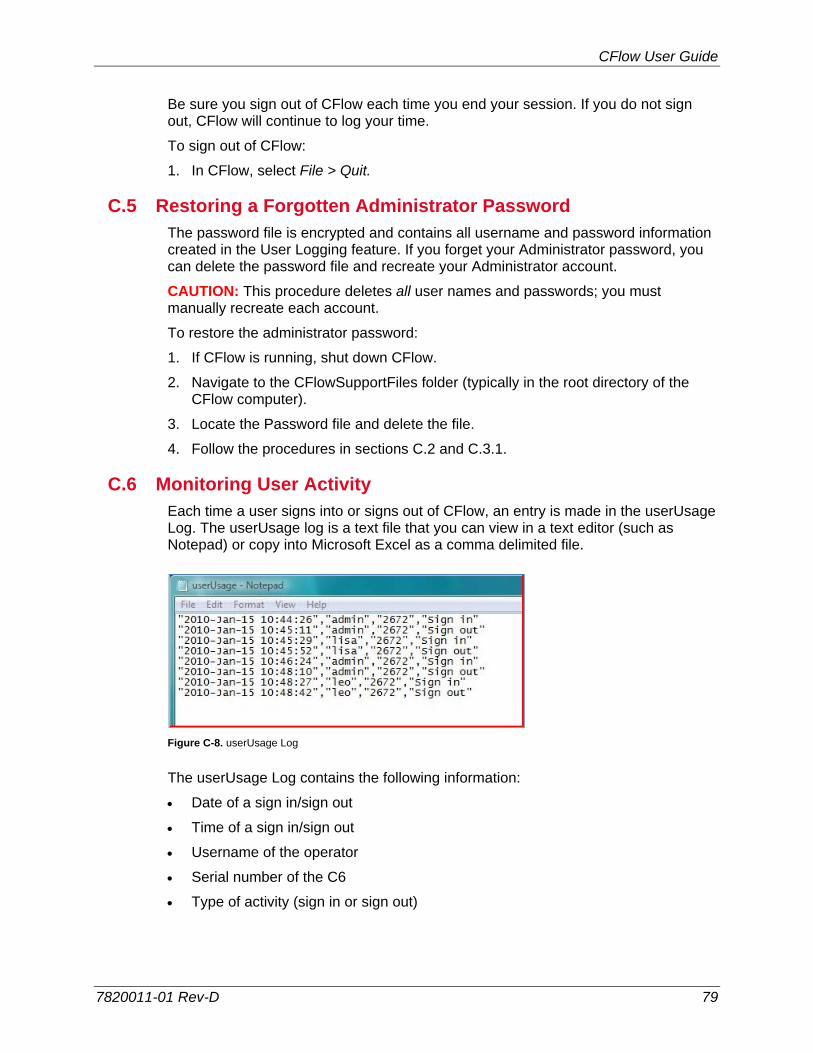
CFlow User Guide
7820011-01 Rev-D 79
Be sure you sign out of CFlow each time you end your session. If you do not sign out, CFlow will continue to log your time.
To sign out of CFlow:
1. In CFlow, select File > Quit.
C.5 Restoring a Forgotten Administrator Password The password file is encrypted and contains all username and password information created in the User Logging feature. If you forget your Administrator password, you can delete the password file and recreate your Administrator account.
CAUTION: This procedure deletes all user names and passwords; you must manually recreate each account.
To restore the administrator password:
1. If CFlow is running, shut down CFlow.
2. Navigate to the CFlowSupportFiles folder (typically in the root directory of the CFlow computer).
3. Locate the Password file and delete the file.
4. Follow the procedures in sections C.2 and C.3.1.
C.6 Monitoring User Activity Each time a user signs into or signs out of CFlow, an entry is made in the userUsage Log. The userUsage log is a text file that you can view in a text editor (such as Notepad) or copy into Microsoft Excel as a comma delimited file.
Figure C-8. userUsage Log
The userUsage Log contains the following information:
Date of a sign in/sign out
Time of a sign in/sign out
Username of the operator
Serial number of the C6
Type of activity (sign in or sign out)
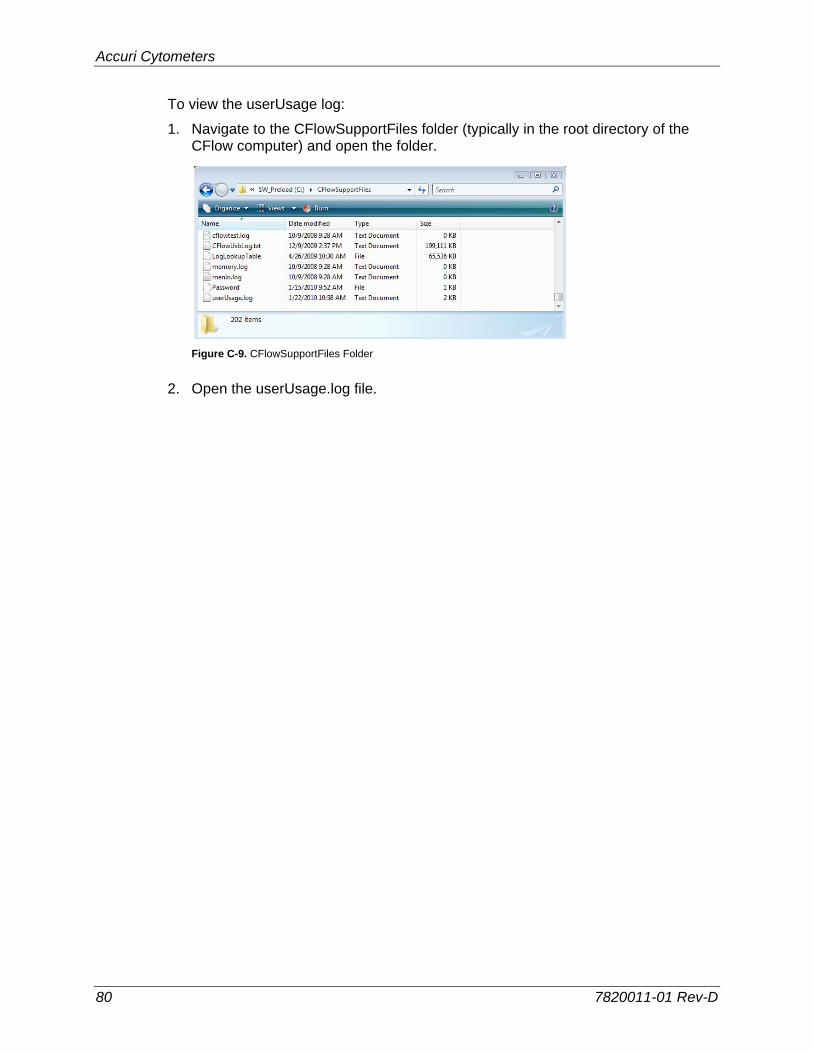
Accuri Cytometers
80 7820011-01 Rev-D
To view the userUsage log:
1. Navigate to the CFlowSupportFiles folder (typically in the root directory of the CFlow computer) and open the folder.
Figure C-9. CFlowSupportFiles Folder
2. Open the userUsage.log file.
CFlow User Guide
7820011-01 Rev-D 81
APPENDIX D CFLOW ANALYSIS SOFTWARE The optional CFlow Analysis software allows you to analyze CFlow files on a computer that does not have a connection to the C6 Flow Cytometer. CFlow Analysis is available in two forms:
CF-20—CFlow Plus Analysis Software for PC or Mac
CF-30—CFlow Sampler Analysis Software for PC or Mac
CFlow Analysis has all the functionality of CFlow, but the instrument control functions in the Instrument menu are disabled (except Set Threshold and Set Compensation). CFlow Analysis software is not intended for controlling the C6 for data acquisition.
MINIMUM SYSTEM REQUIREMENTS
PC version:
Intel Core Duo processor, 2.8GHz
2GB RAM
CD-ROM Drive
Windows® XP (Service Pack 2) or Windows Vista (recommended)
Language selection: US or UK English
5GB hard disk space
Display resolution 1152 x 864 or higher
Mac version:
Intel or PowerPC processor, 1.66 GHz (Intel processor recommended)
1GB RAM
CD-ROM Drive
Mac OS X software
Language selection: US or UK English
5GB hard disk space
Display resolution 1152 x 864 or higher
SOFTWARE OPERATION
See the relevant chapters in this guide for operational information.
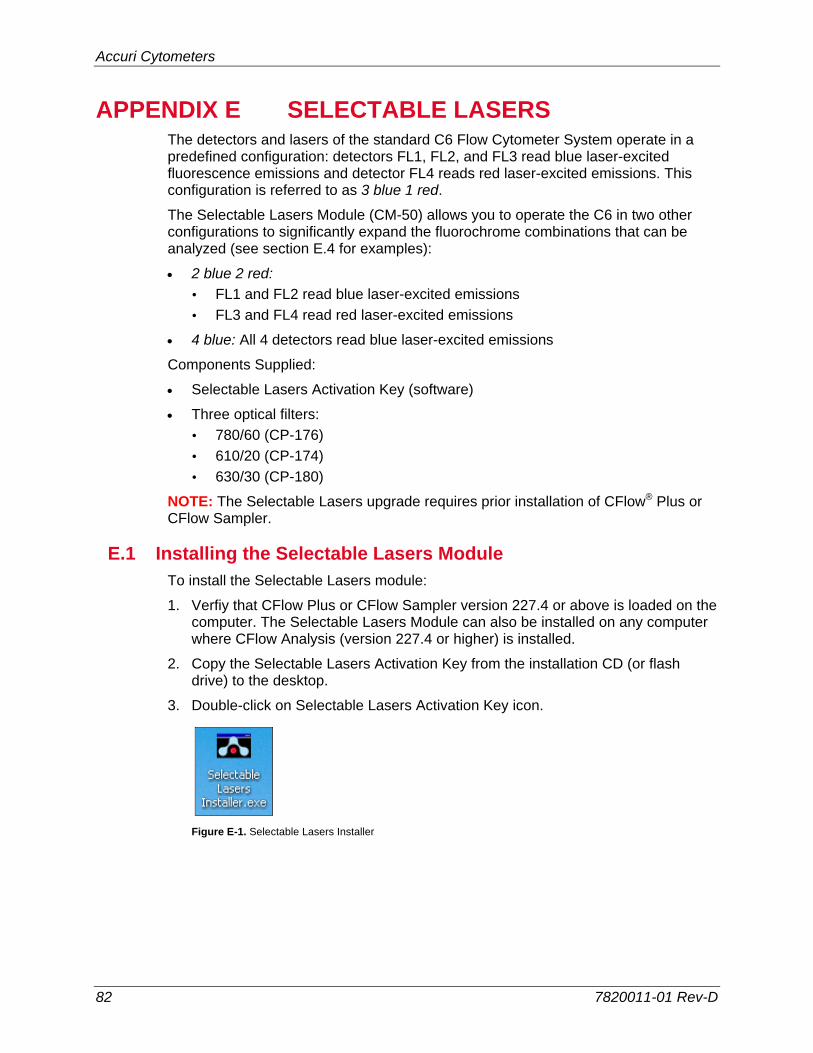
Accuri Cytometers
82 7820011-01 Rev-D
APPENDIX E SELECTABLE LASERS The detectors and lasers of the standard C6 Flow Cytometer System operate in a predefined configuration: detectors FL1, FL2, and FL3 read blue laser-excited fluorescence emissions and detector FL4 reads red laser-excited emissions. This configuration is referred to as 3 blue 1 red.
The Selectable Lasers Module (CM-50) allows you to operate the C6 in two other configurations to significantly expand the fluorochrome combinations that can be analyzed (see section E.4 for examples):
2 blue 2 red:
FL1 and FL2 read blue laser-excited emissions
FL3 and FL4 read red laser-excited emissions
4 blue: All 4 detectors read blue laser-excited emissions
Components Supplied:
Selectable Lasers Activation Key (software)
Three optical filters:
780/60 (CP-176)
610/20 (CP-174)
630/30 (CP-180)
NOTE: The Selectable Lasers upgrade requires prior installation of CFlow® Plus or CFlow Sampler.
E.1 Installing the Selectable Lasers Module To install the Selectable Lasers module:
1. Verfiy that CFlow Plus or CFlow Sampler version 227.4 or above is loaded on the computer. The Selectable Lasers Module can also be installed on any computer where CFlow Analysis (version 227.4 or higher) is installed.
2. Copy the Selectable Lasers Activation Key from the installation CD (or flash drive) to the desktop.
3. Double-click on Selectable Lasers Activation Key icon.
Figure E-1. Selectable Lasers Installer
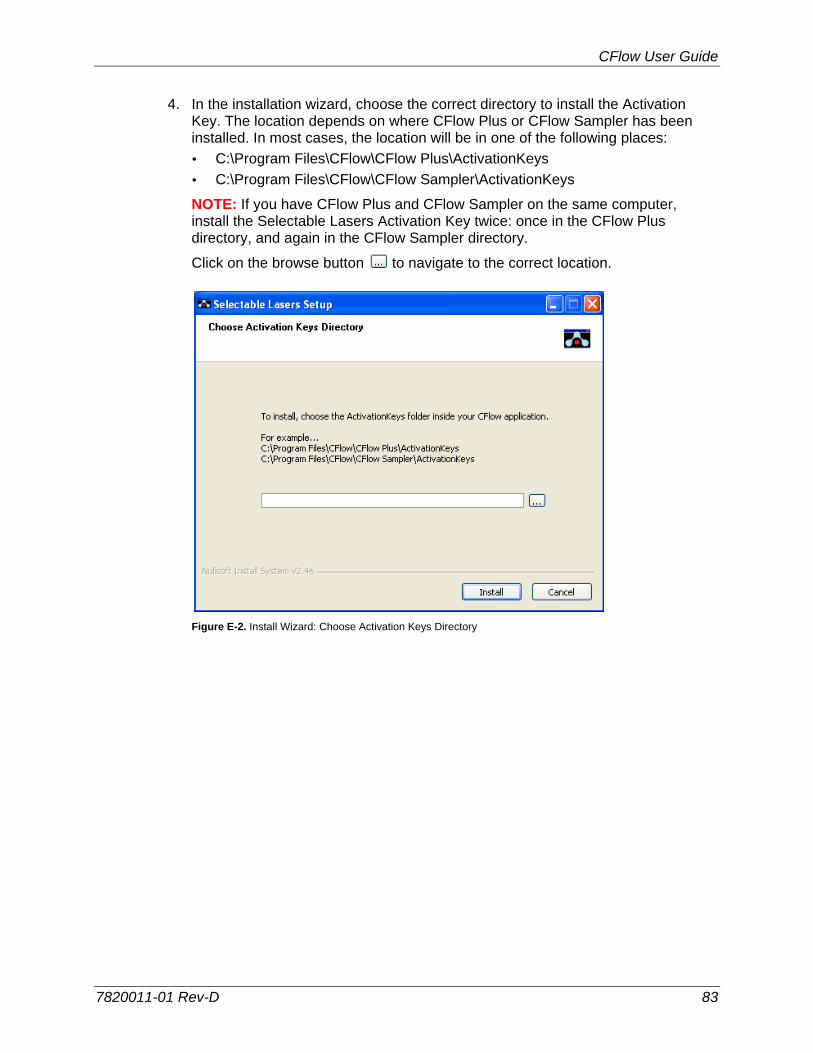
CFlow User Guide
7820011-01 Rev-D 83
4. In the installation wizard, choose the correct directory to install the Activation Key. The location depends on where CFlow Plus or CFlow Sampler has been installed. In most cases, the location will be in one of the following places:
C:\Program Files\CFlow\CFlow Plus\ActivationKeys
C:\Program Files\CFlow\CFlow Sampler\ActivationKeys
NOTE: If you have CFlow Plus and CFlow Sampler on the same computer, install the Selectable Lasers Activation Key twice: once in the CFlow Plus directory, and again in the CFlow Sampler directory.
Click on the browse button to navigate to the correct location.
Figure E-2. Install Wizard: Choose Activation Keys Directory
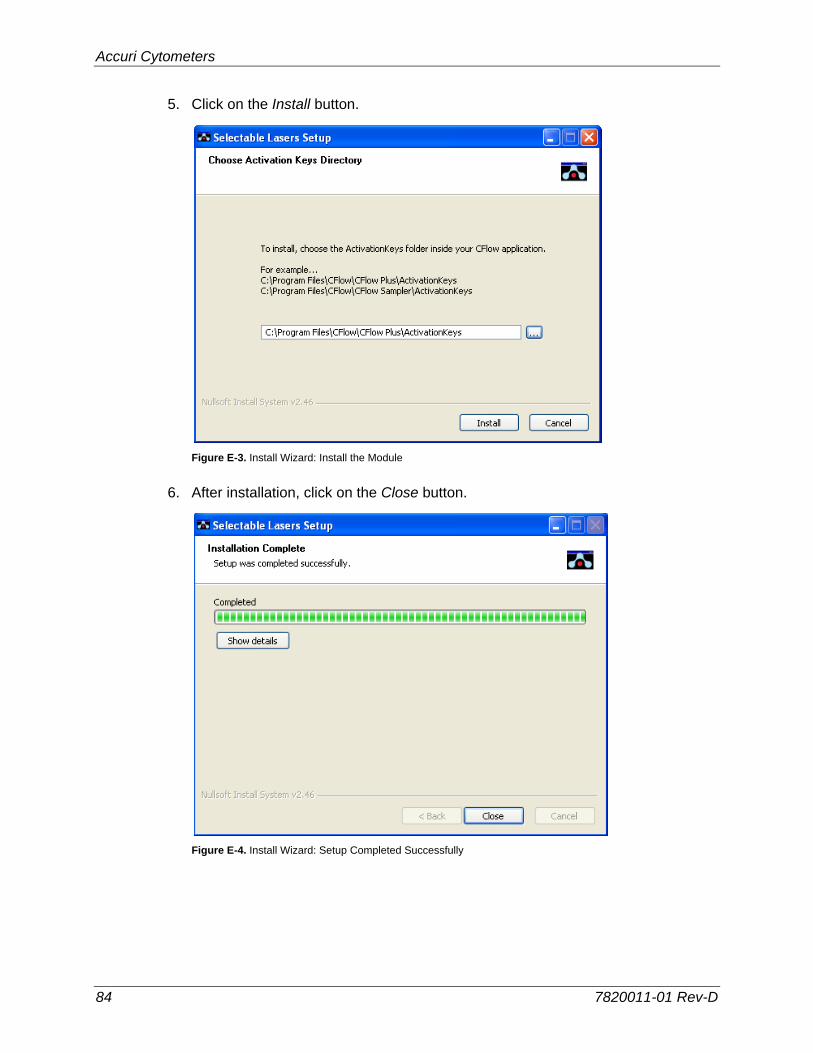
Accuri Cytometers
84 7820011-01 Rev-D
5. Click on the Install button.
Figure E-3. Install Wizard: Install the Module
6. After installation, click on the Close button.
Figure E-4. Install Wizard: Setup Completed Successfully
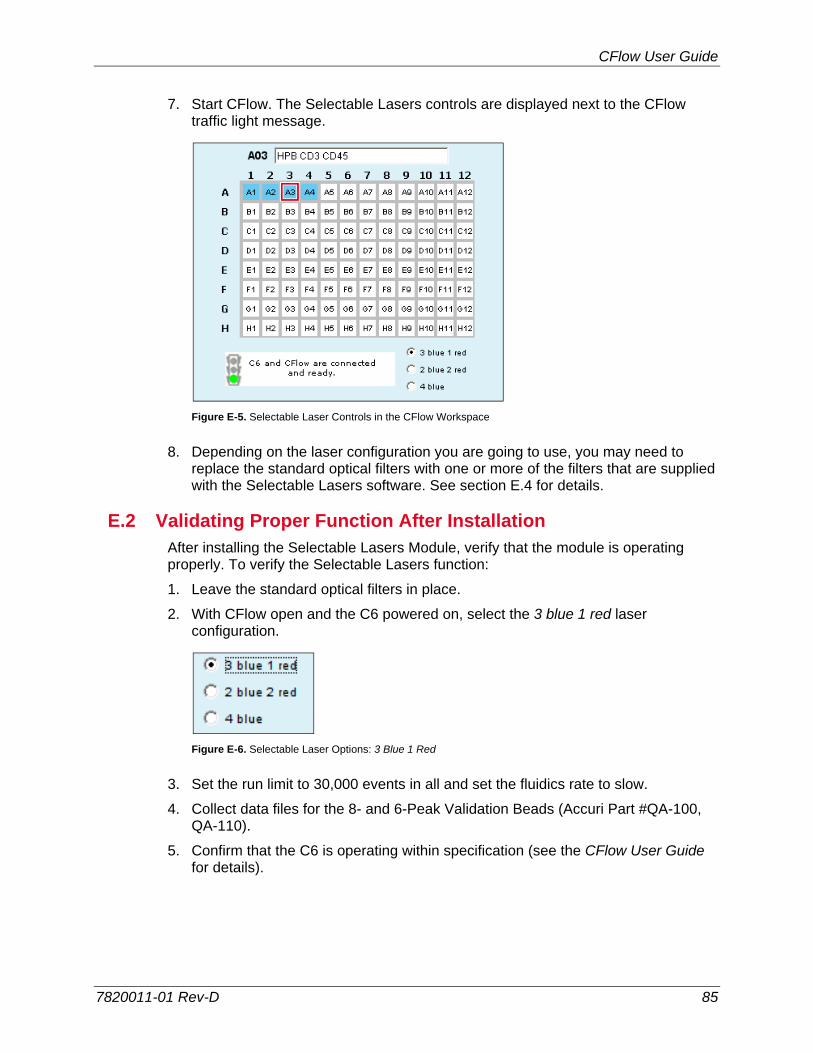
CFlow User Guide
7820011-01 Rev-D 85
7. Start CFlow. The Selectable Lasers controls are displayed next to the CFlow traffic light message.
Figure E-5. Selectable Laser Controls in the CFlow Workspace
8. Depending on the laser configuration you are going to use, you may need to replace the standard optical filters with one or more of the filters that are supplied with the Selectable Lasers software. See section E.4 for details.
E.2 Validating Proper Function After Installation After installing the Selectable Lasers Module, verify that the module is operating properly. To verify the Selectable Lasers function:
1. Leave the standard optical filters in place.
2. With CFlow open and the C6 powered on, select the 3 blue 1 red laser configuration.
Figure E-6. Selectable Laser Options: 3 Blue 1 Red
3. Set the run limit to 30,000 events in all and set the fluidics rate to slow.
4. Collect data files for the 8- and 6-Peak Validation Beads (Accuri Part #QA-100, QA-110).
5. Confirm that the C6 is operating within specification (see the CFlow User Guide for details).
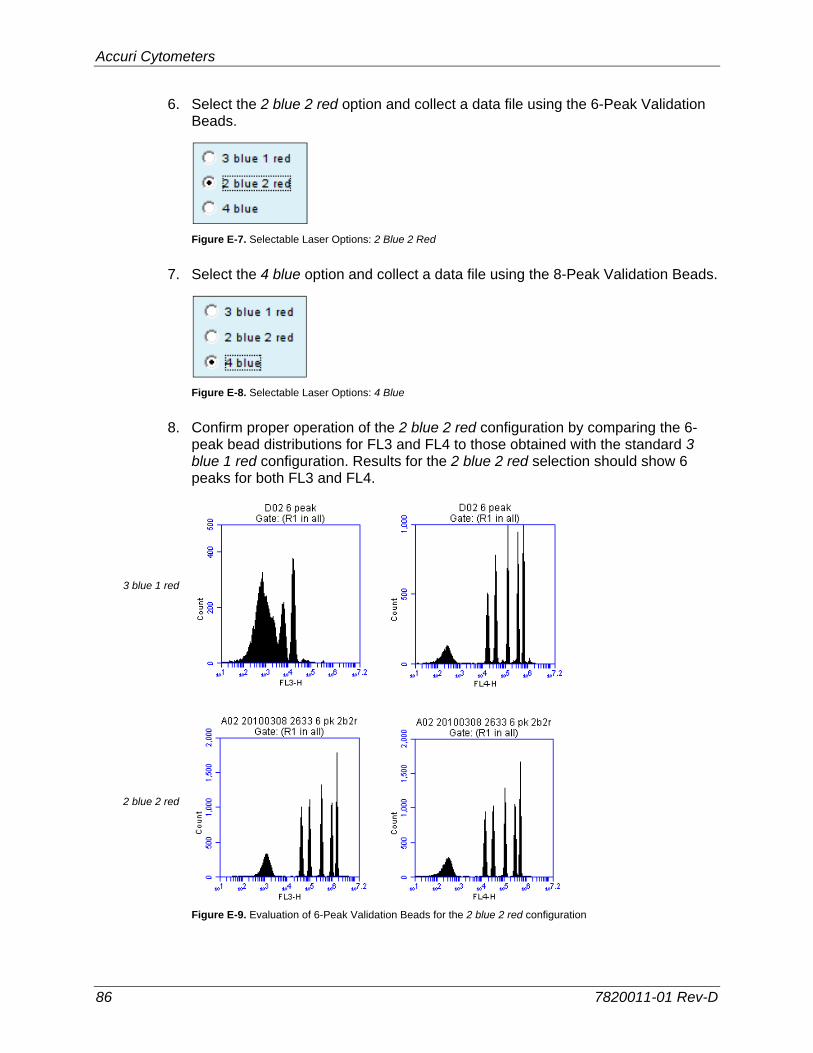
Accuri Cytometers
86 7820011-01 Rev-D
6. Select the 2 blue 2 red option and collect a data file using the 6-Peak Validation Beads.
Figure E-7. Selectable Laser Options: 2 Blue 2 Red
7. Select the 4 blue option and collect a data file using the 8-Peak Validation Beads.
Figure E-8. Selectable Laser Options: 4 Blue
8. Confirm proper operation of the 2 blue 2 red configuration by comparing the 6-peak bead distributions for FL3 and FL4 to those obtained with the standard 3 blue 1 red configuration. Results for the 2 blue 2 red selection should show 6 peaks for both FL3 and FL4.
Figure E-9. Evaluation of 6-Peak Validation Beads for the 2 blue 2 red configuration
3 blue 1 red
2 blue 2 red
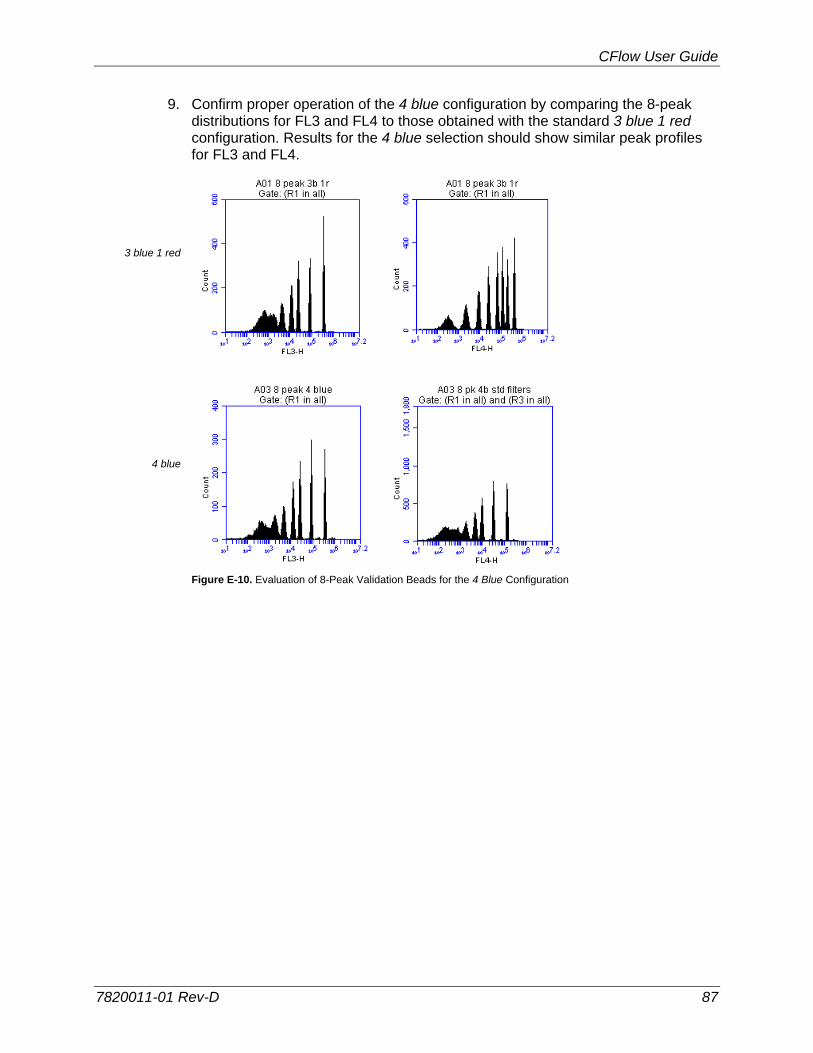
CFlow User Guide
7820011-01 Rev-D 87
9. Confirm proper operation of the 4 blue configuration by comparing the 8-peak distributions for FL3 and FL4 to those obtained with the standard 3 blue 1 red configuration. Results for the 4 blue selection should show similar peak profiles for FL3 and FL4.
Figure E-10. Evaluation of 8-Peak Validation Beads for the 4 Blue Configuration
3 blue 1 red
4 blue
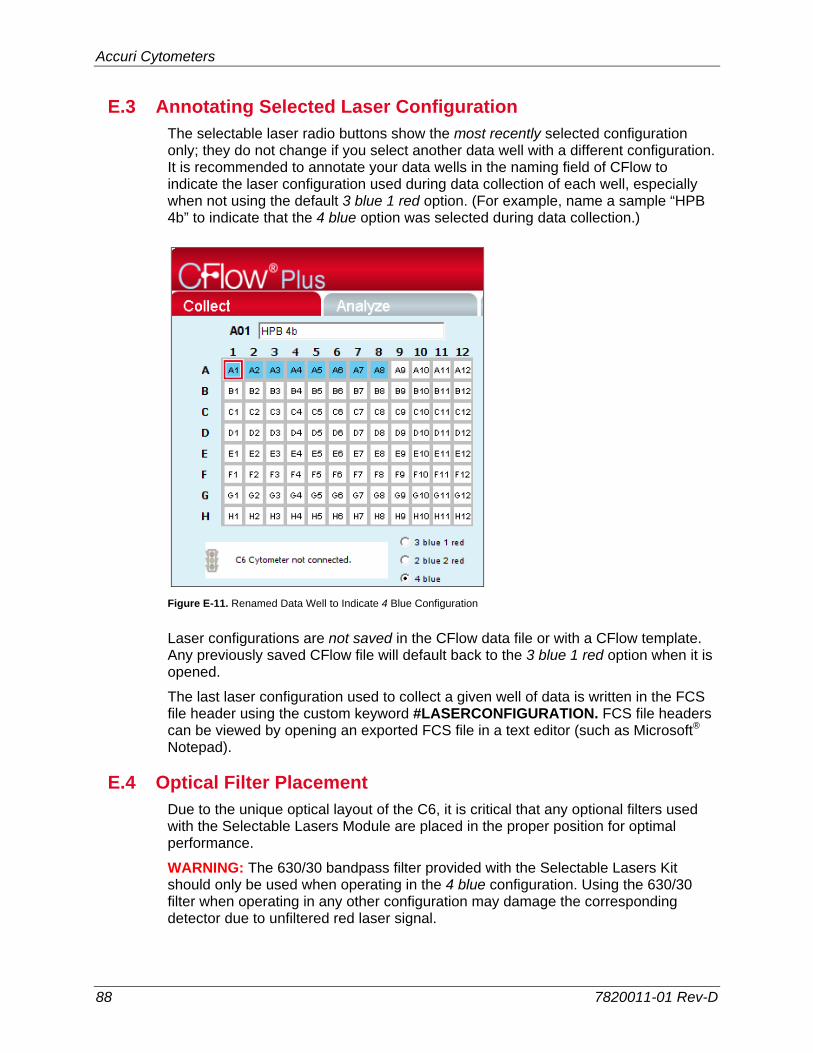
Accuri Cytometers
88 7820011-01 Rev-D
E.3 Annotating Selected Laser Configuration The selectable laser radio buttons show the most recently selected configuration only; they do not change if you select another data well with a different configuration. It is recommended to annotate your data wells in the naming field of CFlow to indicate the laser configuration used during data collection of each well, especially when not using the default 3 blue 1 red option. (For example, name a sample “HPB 4b” to indicate that the 4 blue option was selected during data collection.)
Figure E-11. Renamed Data Well to Indicate 4 Blue Configuration
Laser configurations are not saved in the CFlow data file or with a CFlow template. Any previously saved CFlow file will default back to the 3 blue 1 red option when it is opened.
The last laser configuration used to collect a given well of data is written in the FCS file header using the custom keyword #LASERCONFIGURATION. FCS file headers can be viewed by opening an exported FCS file in a text editor (such as Microsoft® Notepad).
E.4 Optical Filter Placement Due to the unique optical layout of the C6, it is critical that any optional filters used with the Selectable Lasers Module are placed in the proper position for optimal performance.
WARNING: The 630/30 bandpass filter provided with the Selectable Lasers Kit should only be used when operating in the 4 blue configuration. Using the 630/30 filter when operating in any other configuration may damage the corresponding detector due to unfiltered red laser signal.
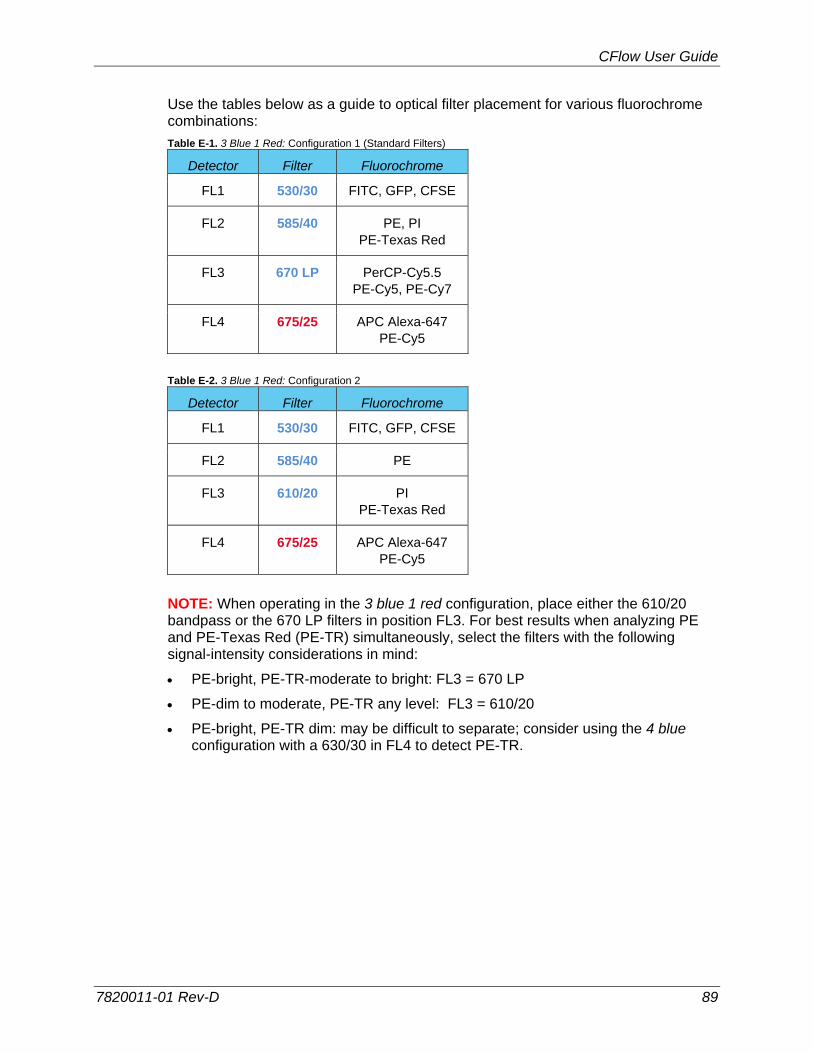
CFlow User Guide
7820011-01 Rev-D 89
Use the tables below as a guide to optical filter placement for various fluorochrome combinations:
Table E-1. 3 Blue 1 Red: Configuration 1 (Standard Filters)
Detector Filter Fluorochrome
FL1 530/30 FITC, GFP, CFSE
FL2 585/40 PE, PI PE-Texas Red
FL3 670 LP PerCP-Cy5.5 PE-Cy5, PE-Cy7
FL4 675/25 APC Alexa-647 PE-Cy5
Table E-2. 3 Blue 1 Red: Configuration 2
Detector Filter Fluorochrome
FL1 530/30 FITC, GFP, CFSE
FL2 585/40 PE
FL3 610/20 PI PE-Texas Red
FL4 675/25 APC Alexa-647 PE-Cy5
NOTE: When operating in the 3 blue 1 red configuration, place either the 610/20 bandpass or the 670 LP filters in position FL3. For best results when analyzing PE and PE-Texas Red (PE-TR) simultaneously, select the filters with the following signal-intensity considerations in mind:
PE-bright, PE-TR-moderate to bright: FL3 = 670 LP
PE-dim to moderate, PE-TR any level: FL3 = 610/20
PE-bright, PE-TR dim: may be difficult to separate; consider using the 4 blue configuration with a 630/30 in FL4 to detect PE-TR.
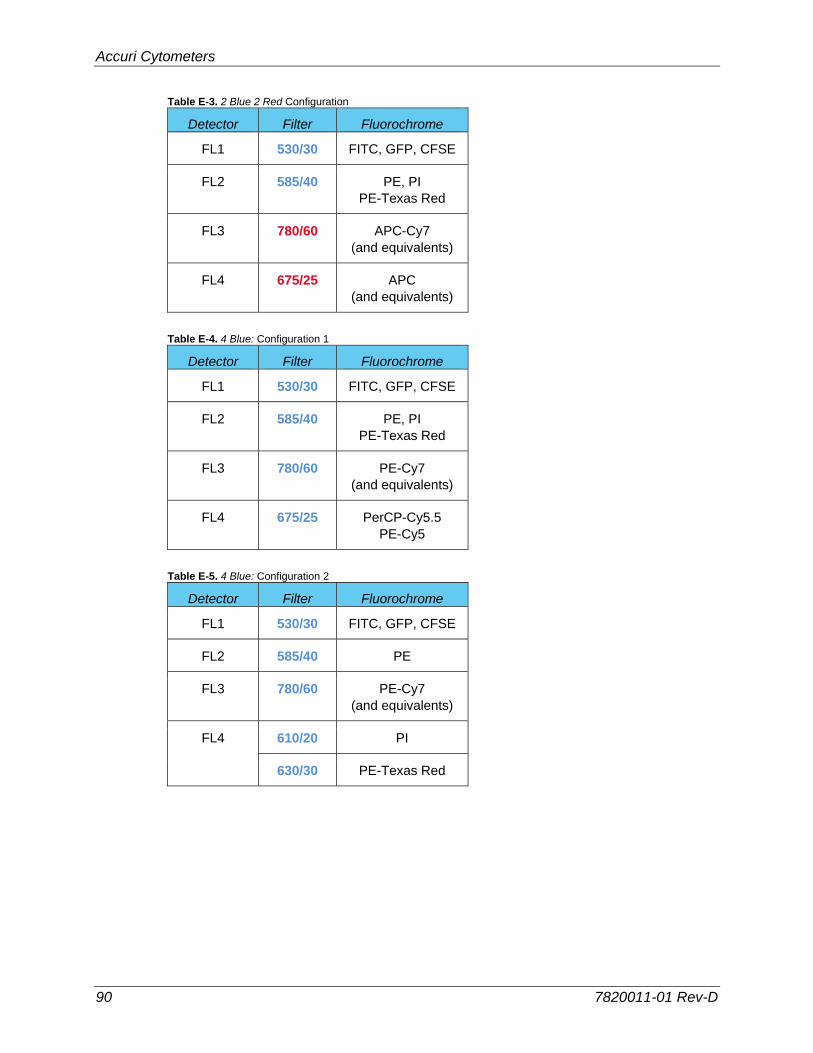
Accuri Cytometers
90 7820011-01 Rev-D
Table E-3. 2 Blue 2 Red Configuration
Detector Filter Fluorochrome
FL1 530/30 FITC, GFP, CFSE
FL2 585/40 PE, PI PE-Texas Red
FL3 780/60 APC-Cy7 (and equivalents)
FL4 675/25 APC (and equivalents)
Table E-4. 4 Blue: Configuration 1
Detector Filter Fluorochrome
FL1 530/30 FITC, GFP, CFSE
FL2 585/40 PE, PI PE-Texas Red
FL3 780/60 PE-Cy7 (and equivalents)
FL4 675/25 PerCP-Cy5.5 PE-Cy5
Table E-5. 4 Blue: Configuration 2
Detector Filter Fluorochrome
FL1 530/30 FITC, GFP, CFSE
FL2 585/40 PE
FL3 780/60 PE-Cy7 (and equivalents)
FL4 610/20 PI
630/30 PE-Texas Red
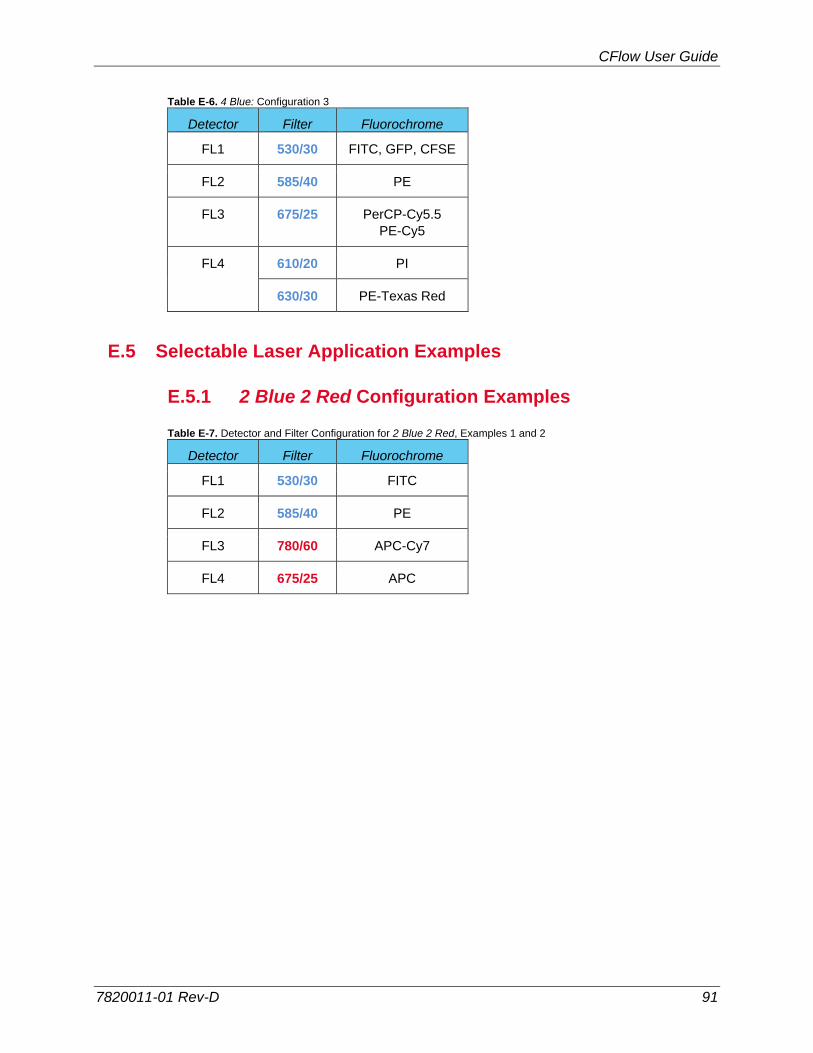
CFlow User Guide
7820011-01 Rev-D 91
Table E-6. 4 Blue: Configuration 3
Detector Filter Fluorochrome
FL1 530/30 FITC, GFP, CFSE
FL2 585/40 PE
FL3 675/25 PerCP-Cy5.5 PE-Cy5
FL4 610/20 PI
630/30 PE-Texas Red
E.5 Selectable Laser Application Examples
E.5.1 2 Blue 2 Red Configuration Examples
Table E-7. Detector and Filter Configuration for 2 Blue 2 Red, Examples 1 and 2
Detector Filter Fluorochrome
FL1 530/30 FITC
FL2 585/40 PE
FL3 780/60 APC-Cy7
FL4 675/25 APC
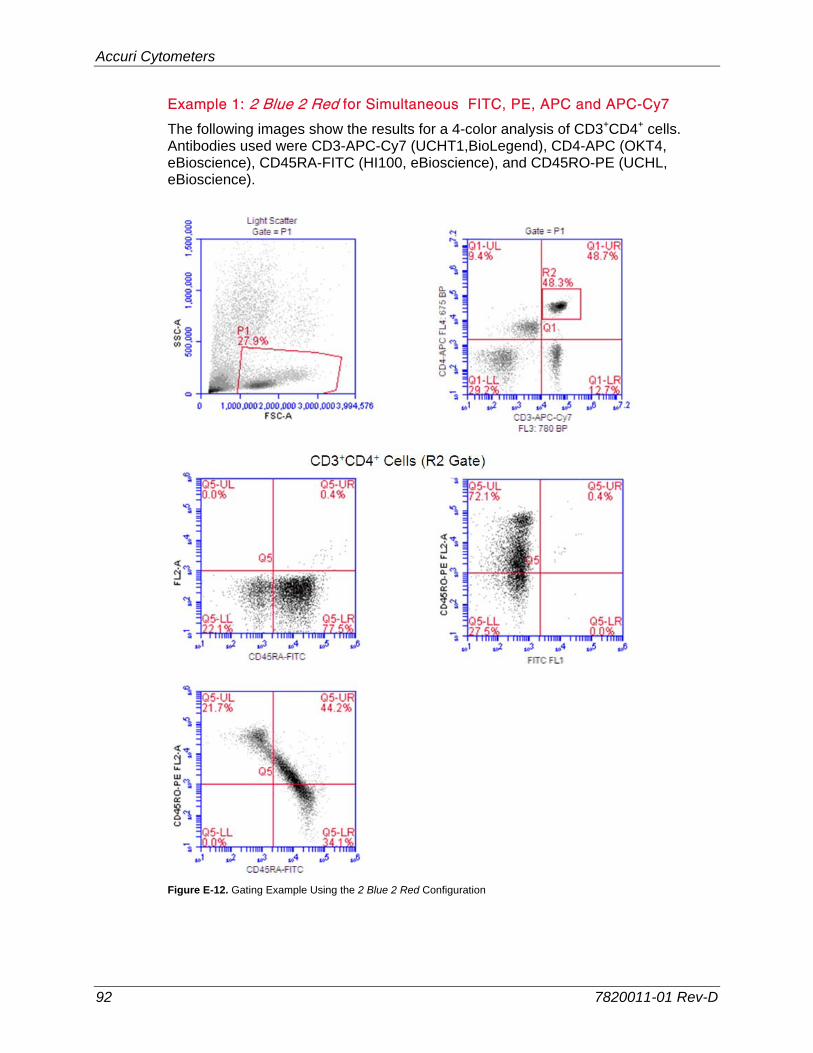
Accuri Cytometers
92 7820011-01 Rev-D
Example 1: 2 Blue 2 Red for Simultaneous FITC, PE, APC and APC-Cy7
The following images show the results for a 4-color analysis of CD3+CD4+ cells. Antibodies used were CD3-APC-Cy7 (UCHT1,BioLegend), CD4-APC (OKT4, eBioscience), CD45RA-FITC (HI100, eBioscience), and CD45RO-PE (UCHL, eBioscience).
Figure E-12. Gating Example Using the 2 Blue 2 Red Configuration
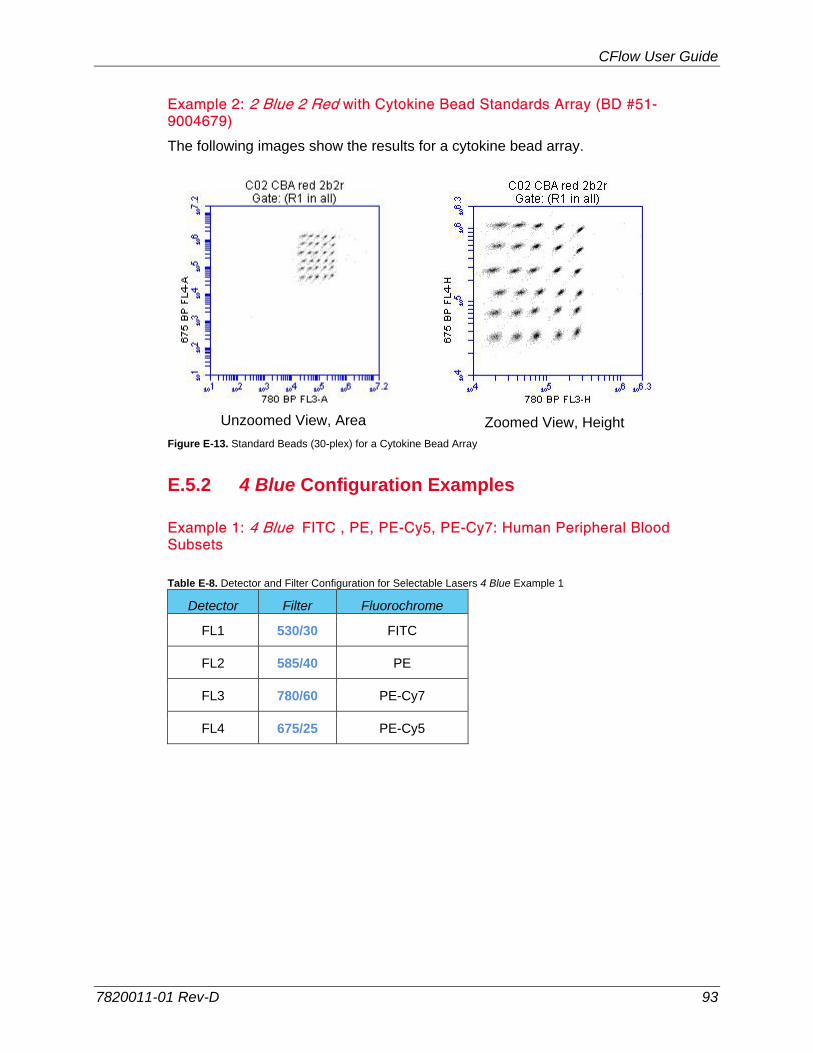
CFlow User Guide
7820011-01 Rev-D 93
Example 2: 2 Blue 2 Red with Cytokine Bead Standards Array (BD #51-9004679)
The following images show the results for a cytokine bead array.
Figure E-13. Standard Beads (30-plex) for a Cytokine Bead Array
E.5.2 4 Blue Configuration Examples
Example 1: 4 Blue FITC , PE, PE-Cy5, PE-Cy7: Human Peripheral Blood Subsets
Table E-8. Detector and Filter Configuration for Selectable Lasers 4 Blue Example 1
Detector Filter Fluorochrome
FL1 530/30 FITC
FL2 585/40 PE
FL3 780/60 PE-Cy7
FL4 675/25 PE-Cy5
Zoomed View, Height Unzoomed View, Area
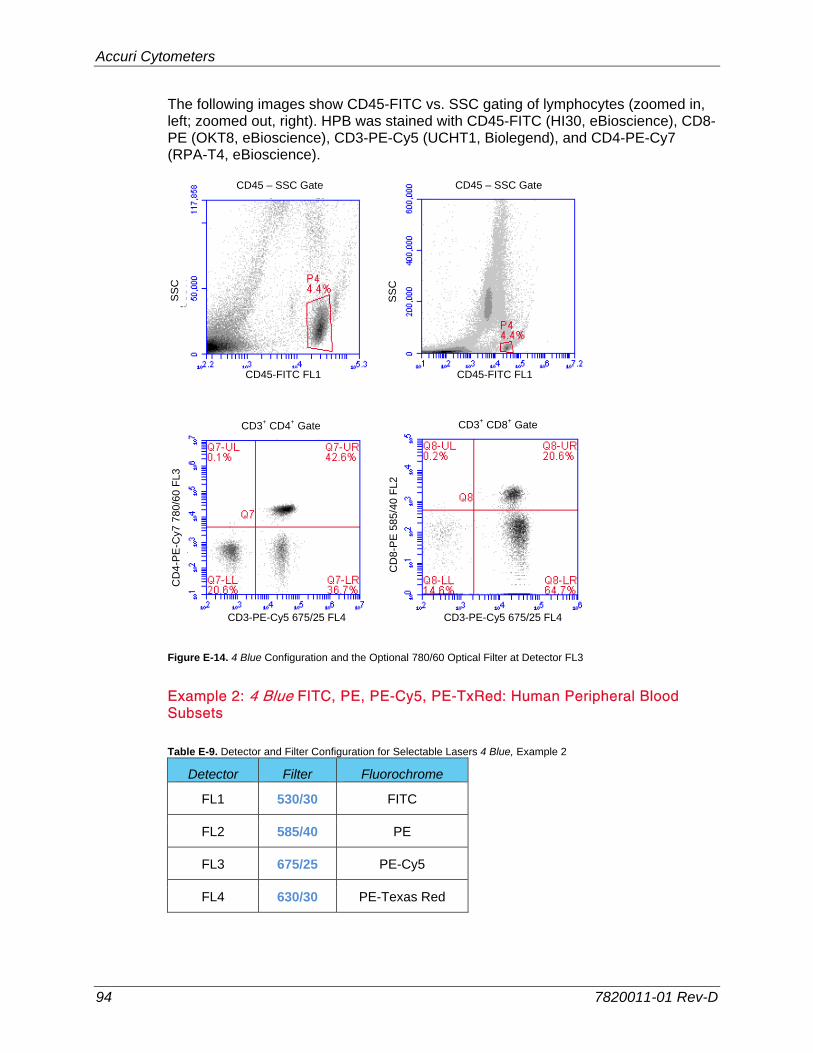
Accuri Cytometers
94 7820011-01 Rev-D
The following images show CD45-FITC vs. SSC gating of lymphocytes (zoomed in, left; zoomed out, right). HPB was stained with CD45-FITC (HI30, eBioscience), CD8-PE (OKT8, eBioscience), CD3-PE-Cy5 (UCHT1, Biolegend), and CD4-PE-Cy7 (RPA-T4, eBioscience).
Figure E-14. 4 Blue Configuration and the Optional 780/60 Optical Filter at Detector FL3
Example 2: 4 Blue FITC, PE, PE-Cy5, PE-TxRed: Human Peripheral Blood Subsets
Table E-9. Detector and Filter Configuration for Selectable Lasers 4 Blue, Example 2
Detector Filter Fluorochrome
FL1 530/30 FITC
FL2 585/40 PE
FL3 675/25 PE-Cy5
FL4 630/30 PE-Texas Red
CD45-FITC FL1 CD45-FITC FL1
SS
C
CD45 – SSC Gate CD45 – SSC Gate
CD3+ CD8+ Gate CD3+ CD4+ Gate
CD
4-P
E-C
y7 7
80/
60 F
L3
CD
8-P
E 5
85/4
0 F
L2
SS
C
CD3-PE-Cy5 675/25 FL4 CD3-PE-Cy5 675/25 FL4
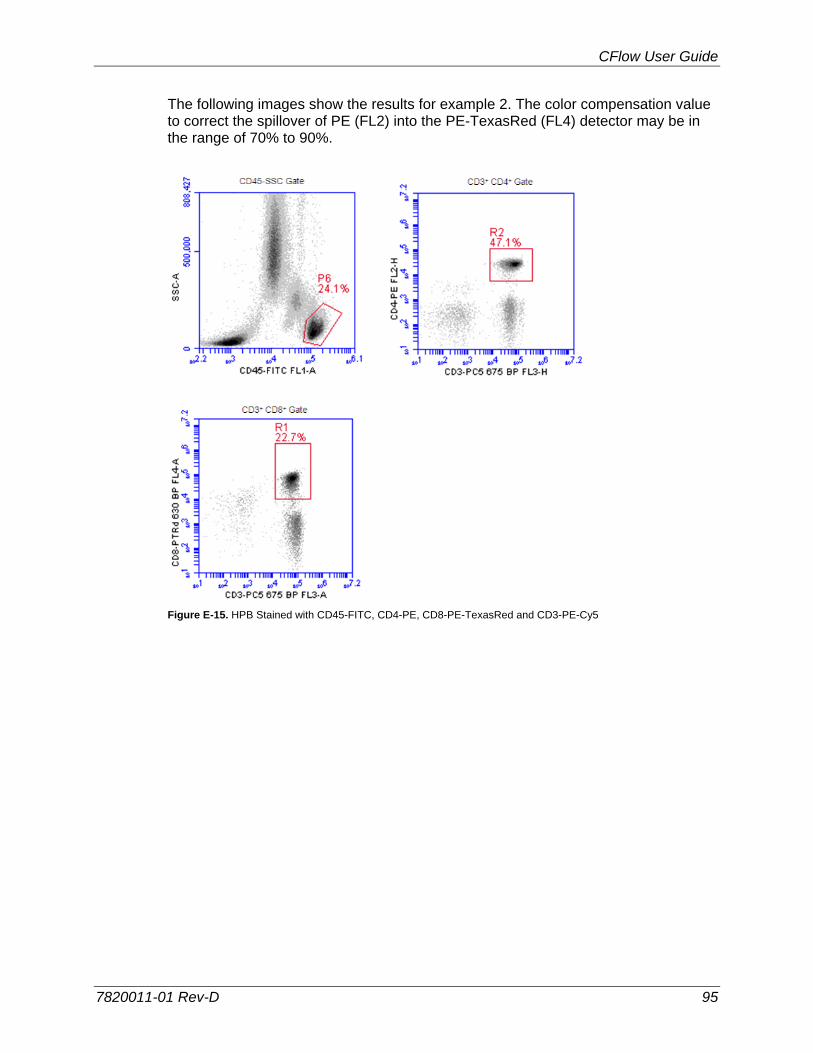
CFlow User Guide
7820011-01 Rev-D 95
The following images show the results for example 2. The color compensation value to correct the spillover of PE (FL2) into the PE-TexasRed (FL4) detector may be in the range of 70% to 90%.
Figure E-15. HPB Stained with CD45-FITC, CD4-PE, CD8-PE-TexasRed and CD3-PE-Cy5
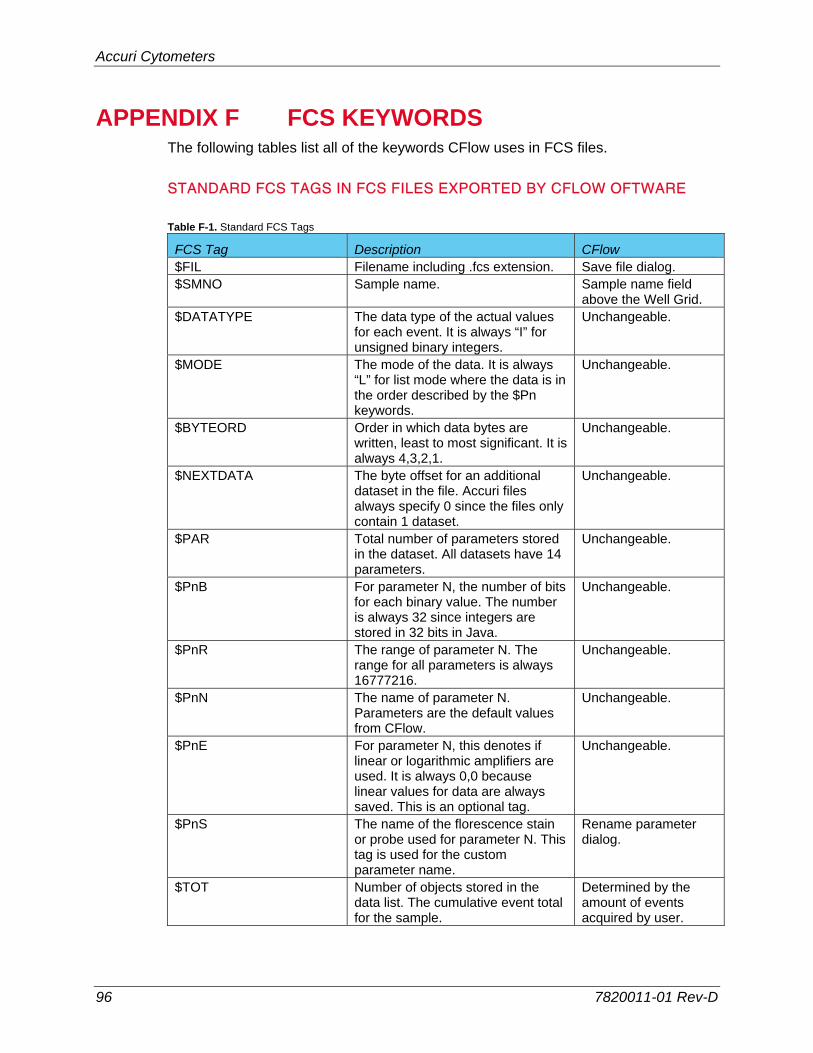
Accuri Cytometers
96 7820011-01 Rev-D
APPENDIX F FCS KEYWORDS The following tables list all of the keywords CFlow uses in FCS files.
STANDARD FCS TAGS IN FCS FILES EXPORTED BY CFLOW OFTWARE
Table F-1. Standard FCS Tags
FCS Tag Description CFlow $FIL Filename including .fcs extension. Save file dialog. $SMNO Sample name. Sample name field
above the Well Grid. $DATATYPE The data type of the actual values
for each event. It is always “I” for unsigned binary integers.
Unchangeable.
$MODE The mode of the data. It is always “L” for list mode where the data is in the order described by the $Pn keywords.
Unchangeable.
$BYTEORD Order in which data bytes are written, least to most significant. It is always 4,3,2,1.
Unchangeable.
$NEXTDATA The byte offset for an additional dataset in the file. Accuri files always specify 0 since the files only contain 1 dataset.
Unchangeable.
$PAR Total number of parameters stored in the dataset. All datasets have 14 parameters.
Unchangeable.
$PnB For parameter N, the number of bits for each binary value. The number is always 32 since integers are stored in 32 bits in Java.
Unchangeable.
$PnR The range of parameter N. The range for all parameters is always 16777216.
Unchangeable.
$PnN The name of parameter N. Parameters are the default values from CFlow.
Unchangeable.
$PnE For parameter N, this denotes if linear or logarithmic amplifiers are used. It is always 0,0 because linear values for data are always saved. This is an optional tag.
Unchangeable.
$PnS The name of the florescence stain or probe used for parameter N. This tag is used for the custom parameter name.
Rename parameter dialog.
$TOT Number of objects stored in the data list. The cumulative event total for the sample.
Determined by the amount of events acquired by user.
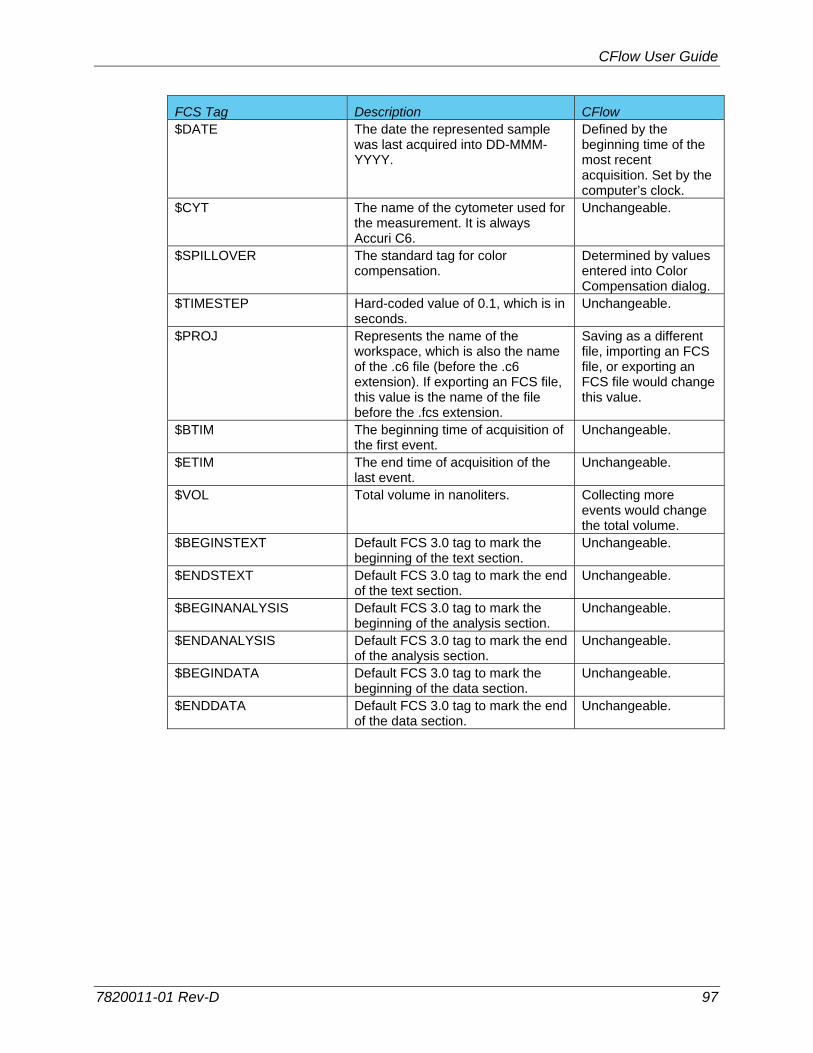
CFlow User Guide
7820011-01 Rev-D 97
FCS Tag Description CFlow $DATE The date the represented sample
was last acquired into DD-MMM-YYYY.
Defined by the beginning time of the most recent acquisition. Set by the computer’s clock.
$CYT The name of the cytometer used for the measurement. It is always Accuri C6.
Unchangeable.
$SPILLOVER The standard tag for color compensation.
Determined by values entered into Color Compensation dialog.
$TIMESTEP Hard-coded value of 0.1, which is in seconds.
Unchangeable.
$PROJ Represents the name of the workspace, which is also the name of the .c6 file (before the .c6 extension). If exporting an FCS file, this value is the name of the file before the .fcs extension.
Saving as a different file, importing an FCS file, or exporting an FCS file would change this value.
$BTIM The beginning time of acquisition of the first event.
Unchangeable.
$ETIM The end time of acquisition of the last event.
Unchangeable.
$VOL Total volume in nanoliters. Collecting more events would change the total volume.
$BEGINSTEXT Default FCS 3.0 tag to mark the beginning of the text section.
Unchangeable.
$ENDSTEXT Default FCS 3.0 tag to mark the end of the text section.
Unchangeable.
$BEGINANALYSIS Default FCS 3.0 tag to mark the beginning of the analysis section.
Unchangeable.
$ENDANALYSIS Default FCS 3.0 tag to mark the end of the analysis section.
Unchangeable.
$BEGINDATA Default FCS 3.0 tag to mark the beginning of the data section.
Unchangeable.
$ENDDATA Default FCS 3.0 tag to mark the end of the data section.
Unchangeable.
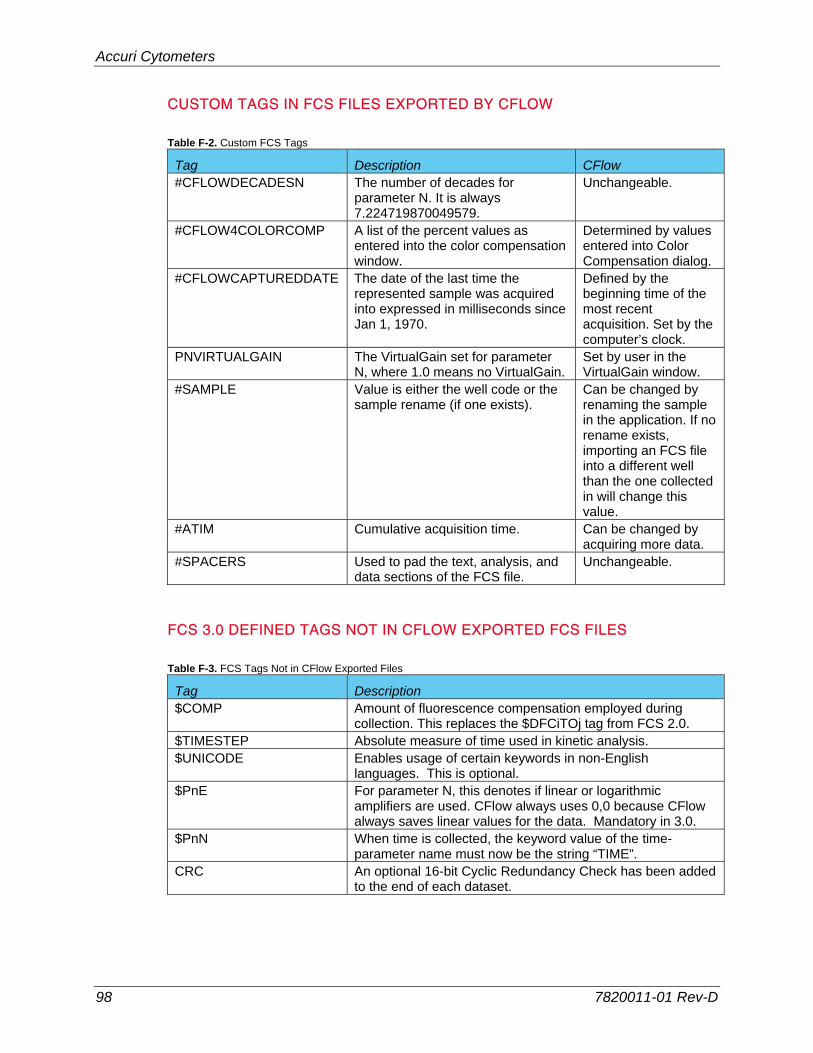
Accuri Cytometers
98 7820011-01 Rev-D
CUSTOM TAGS IN FCS FILES EXPORTED BY CFLOW
Table F-2. Custom FCS Tags
Tag Description CFlow #CFLOWDECADESN The number of decades for
parameter N. It is always 7.224719870049579.
Unchangeable.
#CFLOW4COLORCOMP A list of the percent values as entered into the color compensation window.
Determined by values entered into Color Compensation dialog.
#CFLOWCAPTUREDDATE The date of the last time the represented sample was acquired into expressed in milliseconds since Jan 1, 1970.
Defined by the beginning time of the most recent acquisition. Set by the computer’s clock.
PNVIRTUALGAIN The VirtualGain set for parameter N, where 1.0 means no VirtualGain.
Set by user in the VirtualGain window.
#SAMPLE Value is either the well code or the sample rename (if one exists).
Can be changed by renaming the sample in the application. If no rename exists, importing an FCS file into a different well than the one collected in will change this value.
#ATIM Cumulative acquisition time. Can be changed by acquiring more data.
#SPACERS Used to pad the text, analysis, and data sections of the FCS file.
Unchangeable.
FCS 3.0 DEFINED TAGS NOT IN CFLOW EXPORTED FCS FILES
Table F-3. FCS Tags Not in CFlow Exported Files
Tag Description $COMP Amount of fluorescence compensation employed during
collection. This replaces the $DFCiTOj tag from FCS 2.0. $TIMESTEP Absolute measure of time used in kinetic analysis. $UNICODE Enables usage of certain keywords in non-English
languages. This is optional. $PnE For parameter N, this denotes if linear or logarithmic
amplifiers are used. CFlow always uses 0,0 because CFlow always saves linear values for the data. Mandatory in 3.0.
$PnN When time is collected, the keyword value of the time-parameter name must now be the string “TIME”.
CRC An optional 16-bit Cyclic Redundancy Check has been added to the end of each dataset.
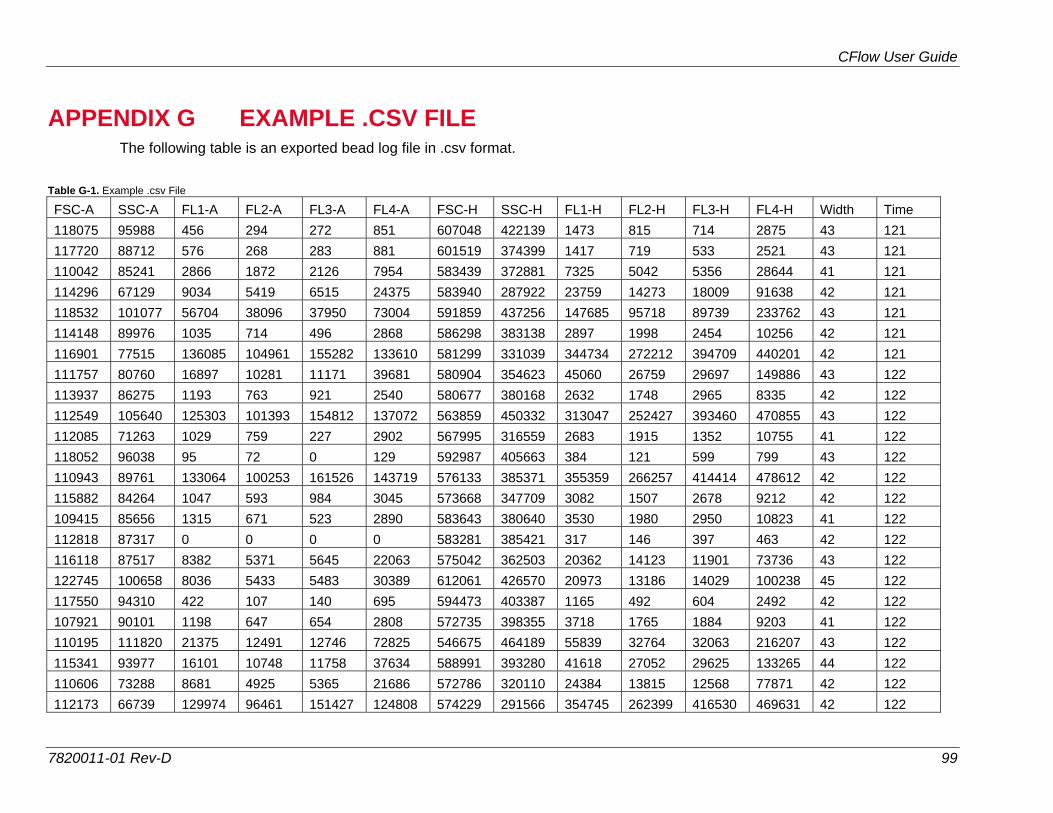
CFlow User Guide
7820011-01 Rev-D 99
APPENDIX G EXAMPLE .CSV FILE The following table is an exported bead log file in .csv format.
Table G-1. Example .csv File
FSC-A SSC-A FL1-A FL2-A FL3-A FL4-A FSC-H SSC-H FL1-H FL2-H FL3-H FL4-H Width Time
118075 95988 456 294 272 851 607048 422139 1473 815 714 2875 43 121
117720 88712 576 268 283 881 601519 374399 1417 719 533 2521 43 121
110042 85241 2866 1872 2126 7954 583439 372881 7325 5042 5356 28644 41 121
114296 67129 9034 5419 6515 24375 583940 287922 23759 14273 18009 91638 42 121
118532 101077 56704 38096 37950 73004 591859 437256 147685 95718 89739 233762 43 121
114148 89976 1035 714 496 2868 586298 383138 2897 1998 2454 10256 42 121
116901 77515 136085 104961 155282 133610 581299 331039 344734 272212 394709 440201 42 121
111757 80760 16897 10281 11171 39681 580904 354623 45060 26759 29697 149886 43 122
113937 86275 1193 763 921 2540 580677 380168 2632 1748 2965 8335 42 122
112549 105640 125303 101393 154812 137072 563859 450332 313047 252427 393460 470855 43 122
112085 71263 1029 759 227 2902 567995 316559 2683 1915 1352 10755 41 122
118052 96038 95 72 0 129 592987 405663 384 121 599 799 43 122
110943 89761 133064 100253 161526 143719 576133 385371 355359 266257 414414 478612 42 122
115882 84264 1047 593 984 3045 573668 347709 3082 1507 2678 9212 42 122
109415 85656 1315 671 523 2890 583643 380640 3530 1980 2950 10823 41 122
112818 87317 0 0 0 0 583281 385421 317 146 397 463 42 122
116118 87517 8382 5371 5645 22063 575042 362503 20362 14123 11901 73736 43 122
122745 100658 8036 5433 5483 30389 612061 426570 20973 13186 14029 100238 45 122
117550 94310 422 107 140 695 594473 403387 1165 492 604 2492 42 122
107921 90101 1198 647 654 2808 572735 398355 3718 1765 1884 9203 41 122
110195 111820 21375 12491 12746 72825 546675 464189 55839 32764 32063 216207 43 122
115341 93977 16101 10748 11758 37634 588991 393280 41618 27052 29625 133265 44 122
110606 73288 8681 4925 5365 21686 572786 320110 24384 13815 12568 77871 42 122
112173 66739 129974 96461 151427 124808 574229 291566 354745 262399 416530 469631 42 122
Accuri Cytometers
100 7820011-01 Rev-D
Accuri Cytometers Inc.
Accuri Cytometers (Europe) Ltd
173 Parkland Plaza 56 Edison Road Ann Arbor MI 48103 St. Ives USA Cambs PE27 3LF UK +1.734.994.8000 +44 (0)1480 308380 Fax +1.734.994.8002 Fax +44 (0)1480 308381 Accuri, CFlow, CSampler, VirtualGain, and C6 Flow Cytometer and Science is hard. Flow cytometry should be easy are registered trademarks of Accuri Cytometers. ©2010
Related Documents