1 Accurate telemonitoring of Parkinson’s disease progression by non-invasive speech tests Authors: Athanasios Tsanas 1,2 , Max A. Little 1,2 , Patrick E. McSharry 1,2 , Lorraine Ramig 3,4 Affiliations: 1 Systems Analysis, Modelling and Prediction (SAMP), Mathematical Institute, University of Oxford, Oxford, UK 2 Oxford Centre for Industrial and Applied Mathematics (OCIAM), University of Oxford, Oxford, UK 3 Speech, Language, and Hearing Science, University of Colorado, Boulder, Colorado, USA 4 National Center for Voice and Speech, Denver, Colorado, USA Contact Information: Athanasios Tsanas OCIAM Mathematical Institute 24-29 St. Giles Oxford, UK OX 1 3LB Emails: (A. Tsanas) [email protected] , [email protected] (M. Little) [email protected] (P. McSharry) [email protected] (L. Ramig) [email protected]

Welcome message from author
This document is posted to help you gain knowledge. Please leave a comment to let me know what you think about it! Share it to your friends and learn new things together.
Transcript

1
Accurate telemonitoring of Parkinson’s disease progression by non-invasive speech tests
Authors: Athanasios Tsanas1,2, Max A. Little1,2, Patrick E. McSharry1,2, Lorraine
Ramig3,4
Affiliations: 1Systems Analysis, Modelling and Prediction (SAMP), Mathematical
Institute, University of Oxford, Oxford, UK 2Oxford Centre for Industrial and Applied Mathematics (OCIAM),
University of Oxford, Oxford, UK
3Speech, Language, and Hearing Science, University of Colorado,
Boulder, Colorado, USA
4National Center for Voice and Speech, Denver, Colorado, USA
Contact Information:
Athanasios Tsanas
OCIAM
Mathematical Institute
24-29 St. Giles
Oxford, UK
OX 1 3LB
Emails: (A. Tsanas) [email protected], [email protected]
(M. Little) [email protected]
(P. McSharry) [email protected]
(L. Ramig) [email protected]

2
Key Words: At-Home Testing Device, dysphonia measures, nonlinear speech
signal processing, Unified Parkinson’s Disease Rating Scale (UPDRS), machine
learning algorithm, telemedicine

3
Tracking Parkinson's disease (PD) symptom progression often uses the Unified
Parkinson’s Disease Rating Scale (UPDRS), which requires the patient's
presence in clinic, and time-consuming physical examinations by trained medical
staff. Thus, symptom monitoring is costly and logistically inconvenient for
patient and clinical staff alike, also hindering recruitment for future large-scale
clinical trials. Here, for the first time, we demonstrate rapid, remote replication
of UPDRS assessment with clinically useful accuracy (5% prediction error),
using only simple, self-administered, and non-invasive speech tests. We
characterize speech with signal processing algorithms, and statistically map these
algorithms to UPDRS. We verify our findings on the largest database of PD
speech in existence (~6,000 recordings from 42 PD patients, recruited to a six-
month, multi-centre trial). This supports the feasibility of frequent, remote and
accurate UPDRS tracking. This technology could play a key part in
telemonitoring frameworks that enable large-scale clinical trials into novel PD
treatments.
4
Introduction
We are aware of neurological control through muscle movement and sensing so
early in life that is easy to take it for granted. However, neurological disorders affect
people profoundly and claim lives at an epidemic rate worldwide. Parkinson’s disease
(PD) is the second most common neurodegenerative disorder after Alzheimer’s1, and
it is estimated that more than one million people in North America alone are affected2.
Rajput et al. report that incidence rates have been approximately constant for the last
55 years, with 20/100,000 new cases every year3. A further estimated 20% of people
with Parkinson’s (PWP) are never diagnosed4. Moreover, these statistics are expected
to increase because worldwide the population is growing older5. In fact, all studies
suggest age is the single most important risk factor for the onset of PD, which
increases steeply after age 506. Although medication and surgical intervention can
hold back the progression of the disease and alleviate some of the symptoms, there is
no available cure7,8. Thus, early diagnosis is critical in order to improve the patient’s
quality of life and prolong it9.
The etiology of PD is largely unknown, but the symptoms result from substantial
dopaminergic neuron reduction, leading to dysfunction of the basal ganglia circuitry
mediating motor and some cognitive abilities8. Parkinsonism exhibits similar PD-like
symptoms, but these are caused by drugs, exposure to neurotoxins etc. The main
symptoms of PD are tremor, rigidity and other general movement disorders. Of
particular importance to this study, vocal impairment is also common10,11, with studies
reporting 70-90% prevalence after the onset of the disease11,12,13. In addition, it may
be one of the earliest indicators14,15 of the disease and 29% of patients consider it one
of their greatest hindrances13. There is supporting evidence of degrading performance
5
in voice with PD progression14,16,17, with hypophonia (reduced voice volume) and
dysphonia (breathiness, hoarseness or creakiness in the voice) typically preceding
more generalized speech disorders11,12.
Management of PD typically involves the administration of physical examinations
applying various empirical tests, including speech and voice tests, with a medical rater
subjectively assessing the subject’s ability to perform a range of tasks. However, the
necessity for the development of reliable, objective tools for assessing PD is
manifested in the fact that current diagnosis is poor2 and autopsy studies are
reportedly inaccurate18,19.
Physical test observations are mapped to a metric specifically designed to follow
disease progress, typically the Unified Parkinson’s Disease Rating Scale (UPDRS),
which reflects the presence and severity of symptoms (but does not measure their
underlying causes). For untreated patients it spans across 0-176, with 0 representing
healthy state and 176 total disability, and consists of three sections: (1) Mentation,
Behavior and Mood; (2) Activities of daily living; (3) Motor. The motor UPDRS
ranges from 0-108, with 0 denoting symptom free and 108 severe motor impairment,
and encompasses tasks such as speech, facial expression, tremor and rigidity. Speech
has two explicit headings, and ranges between 0-8 with 8 being unintelligible
communication.
Noninvasive telemonitoring is an emerging option in general medical care,
potentially affording reliable, cost-effective screening of PWP alleviating the burden
of frequent and often inconvenient visits to the clinic. This also relieves national
health systems from excessive additional workload, decreasing the cost and increasing
the accuracy of clinical evaluation of the subject’s condition.

6
The potential for telemonitoring of PD depends heavily on the design of simple
tests that can be self-administered quickly and remotely. Since the recording of
speech signals is noninvasive and can be readily integrated into telemedicine
applications, such tests are good candidates in this regard. The use of sustained vowel
phonations to assess the extent of vocal symptoms, where the patient is requested to
hold the frequency of phonation steady for as long as possible, is common in general
speech clinical practice20 and in PD monitoring21,22. This circumvents some of the
confounding articulatory effects and linguistic components of running speech, i.e. the
recording of standard phrases read aloud by the subject. In order to objectively
characterize dysphonic symptoms, the recorded voice signals are analyzed by speech
processing algorithms22,23.
Intel Corporation’s At-Home Testing Device (AHTD) is a novel telemonitoring
system facilitating remote, Internet-enabled measurement of a range of PD-related
motor impairment symptoms, recently described in detail24. It records both manual
dexterity and speech tests; in this study we concentrate only on sustained vowel
phonations.
Previous studies have focused on separating PWP from healthy controls14,22; we
extend this concept to map the severity of voice symptoms to UPDRS. We also
wanted to determine the feasibility of remote PD clinical trials on large scale voice
data recorded in typical home acoustic environments, where previous studies have
been limited to controlled acoustic environments and small numbers of recordings22.
Recent studies have raised the important topic of finding a statistical mapping
between speech properties and UPDRS as an issue worthy of further investigation, but
have not addressed it explicitly17,24. Here we present a method that first computes a
range of classical and non-classical speech signal processing algorithms, which act as

7
features for statistical regression techniques. These features establish a relationship
between speech signal properties and UPDRS. We show that this method leads to
clinically useful UPDRS estimation, and demonstrate remote PD monitoring on a
weekly basis, tracking UPDRS fluctuations for a six-month period. This can be a
useful guide for clinical staff, following the progression of clinical PD symptoms on a
regular basis, tracking the UPDRS that would be obtained by a subjective clinical
rater. We envisage this method finding applications in future clinical trials involving
the study of large populations remote from the clinic.
8
Results
Overview and novel results of this study
Fig. 1 concisely summarizes the study with the recording, transmission, analysis
of the speech signals, and the UPDRS estimation/tracking accuracy. We demonstrate
UPDRS tracking of a typical patient throughout the six-month trial for the best linear
method, iteratively re-weighted least squares (IRLS), and for classification and
regression tree (CART). CART achieves the smallest prediction error, and tracks the
linearly interpolated UPDRS more accurately.
Data exploration and correlation analysis
Table 1 summarizes the dysphonia measures used in this study. All measures
were significantly correlated (p<0.001) with linearly interpolated motor-UPDRS and
total-UPDRS scores. Although statistically significant, none of the measures taken
individually appears to have a large magnitude of correlation to either motor or total-
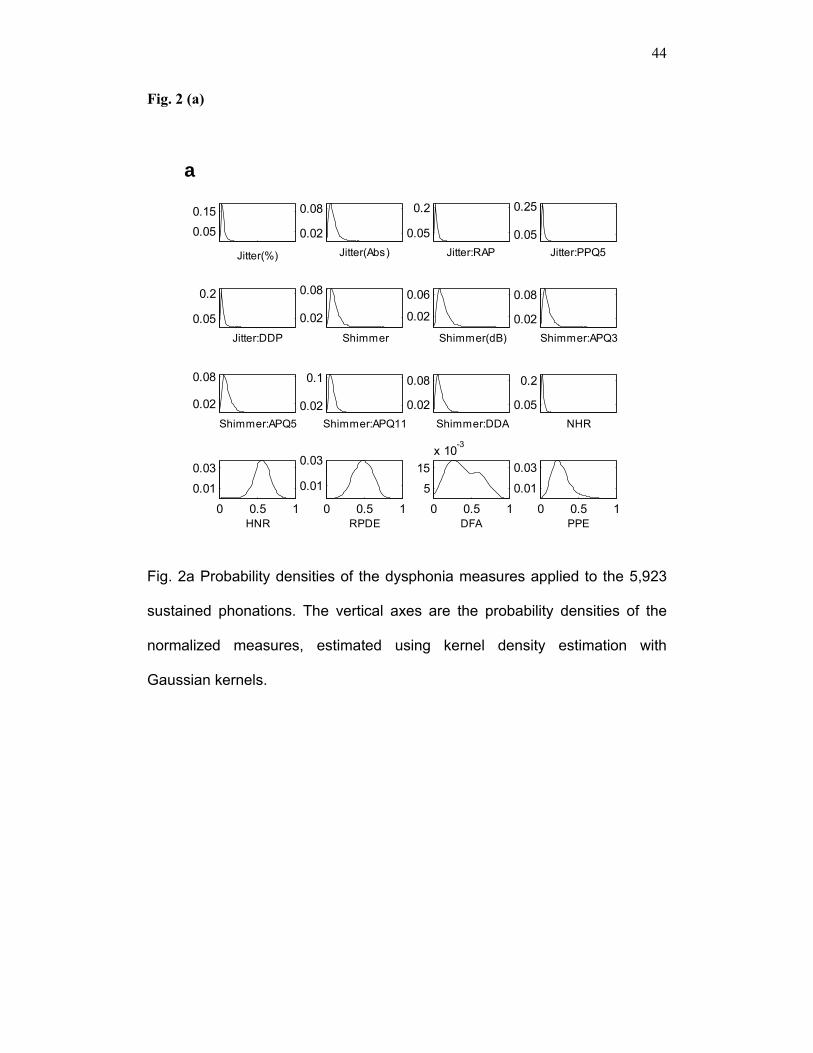
UPDRS. Following normalization to the range 0 to 1, the probability densities of each
dysphonia measure are shown in Fig. 2a. The jitter, shimmer and NHR measures are
distributed close to zero, whereas HNR, RPDE, DFA and PPE are more evenly
distributed. Table 2 presents the Spearman rank-correlations between all the
dysphonia measures. All measures were statistically significantly correlated
(p<0.001). Fig. 2 (b, c) displays the normalized dysphonia measures against motor
and total-UPDRS, providing an indication of their associated relationship to UPDRS.
9
Regression analysis
Table 3 presents the regression coefficient values for all dysphonia measures, for
all three linear prediction methods. The obtained coefficients differed over cross-
validation runs for all three linear models, as evidenced by the large standard
deviation of some of the coefficients. However, the testing mean absolute error
(MAE) and its standard deviation across the 1,000-run cross-validation was relatively
low (Supplementary Table 1), suggesting that these indicative coefficients are
sufficient for useful UPDRS prediction. The training MAE for the linearly
interpolated motor-UPDRS was 6.7 for least squares (LS) and IRLS, and 6.8 for least
absolute shrinkage and selection operator (Lasso). The testing MAE was 6.7 for LS
and IRLS, and 6.8 for Lasso. The CART method outperforms the linear predictors
with a training MAE of 4.5 and testing MAE of 5.8. The training error for the linearly
interpolated total-UPDRS was 8.5 for LS, 8.4 for IRLS, and 8.5 for Lasso. The testing
error was 8.5 for LS, 8.4 for IRLS, and 8.6 for Lasso. CART performs better again,
producing a training MAE of 6.0 and testing MAE of 7.5. Given that the maximum
value of motor-UPDRS is 108, the testing error is 6.2% for IRLS and 5.3% for
CART. Similarly, the maximum value of total-UPDRS is 176, and the testing error is
4.8% for IRLS, and 4.2% for CART. IRLS is slightly superior compared to the linear
predictors. However, CART outperforms it, displaying the smallest deviation from the
interpolated score.
10
Model selection and validation
Supplementary Table 1 summarizes the subset selection of dysphonia measures,
which were dictated by sweeping the Lasso algorithm regularization parameter λ,
along with the out-of-sample MAE results for IRLS and CART. The pruning level for
CART was set to minimize the MAE, following manual spot-checks. We noted that a
difference in value of up to 20 for the pruning level did not produce significantly
different results, given that the number of splits of the data was in excess of 5,000.
Supplementary Fig. 2 displays the Bayesian Information Criterion (BIC) results
aiming to determine the optimal subset which obtains the best trade-off between
model complexity and prediction accuracy (similar results were obtained with the
Akaike Information Criterion (AIC)). Both criteria agree on a subset containing six
measures: MDVP: Jitter (Abs), MDVP: Shimmer, NHR, HNR, DFA, PPE for the
CART method. This subset is used for the subsequent analysis.
The testing errors remain low and close to the training error, indicating that the
model has achieved a reasonable estimate of the performance we might expect on
novel data. The probability densities of the 1,000-runs 10-fold cross-validation out-of-
sample differences between the predicted and the linearly interpolated UPDRS values
for all methods are seen in Supplementary Fig. 3. The difference between predicted
and linearly interpolated UPDRS values is typically low.

11
Discussion
In this study, we have established a mapping between dysphonia measures and
UPDRS. The association strength of these measures and (motor and total) UPDRS
was explored, using three linear and one nonlinear regression methods. We have
selected an optimally reduced subset of the measures producing a clinically useful
model, where each measure in the subset extracts non-overlapping physiological
characteristics of the speech signal. The comparatively small MAE is notable: the
sustained vowel phonations convey sufficient information to predict UPDRS to
clinically useful accuracy. It has been demonstrated that motor-UPDRS can be
estimated within approximately 6 points (out of 108) and total-UPDRS within 7.5
points (out of 176), predictions which are within 5-6% of the clinician’s observations.
Furthermore, we showed the feasibility of tracking UPDRS changes in time (Fig. 1).
Perhaps most importantly, the satisfactory reception of the patients themselves
towards the AHTD and speech tests24 makes this a promising field for further
experimentation. The 42 PWP in the present study were diagnosed within the
previous five years at trial onset and displayed moderate symptoms (max motor-
UPDRS 41, max total-UPDRS 55), so it would be important to look at a more
severely impaired group in the future. The satisfactory UPDRS estimation in
moderate symptoms, which are difficult to detect, accentuates the potential of the
dysphonia measures in PD assessment and supports the feasibility of successful
UPDRS tracking in more severely affected patients.
Speech appears explicitly in two UPDRS categories (part II, activities of daily
living section and part III, motor section). One could argue that speech is more
strongly related to the motor section rather than daily living activities and mentation,
12
behavior and mood (part I), because the underlying etiology of dysphonic sustained
phonations may be physiologically attributed to flawed muscle control, most likely
caused by dopaminergic neuron reduction. This would imply that only motor-UPDRS
estimation would be tractable. However, the results of this study indicate that total-
UPDRS estimation with clinically useful accuracy is plausible, suggesting that PD
speech dysphonias could be at least partly related to mood as well. This makes it
possible to suggest the generalization that the underlying causes of PD symptoms
such as tremor and mood are manifested in impaired speech control. Stebbins et al.25
have reported that motor-UPDRS can be explained by six distinct and clinically
useful, underlying factors: speech, facial expression, balance and gait (factor I), rest
tremor (factor II), rigidity (factor IV), right and left bradykinesia (factors III and V),
and postural tremor (factor VI). They found relatively low correlations between the
six factors, suggesting all contribute to accurate UPDRS estimation by capturing
different aspects of PD symptoms. In terms of that study, we have used measures
within factor I, extracting PD information properties only from speech. The implicit
argument is that the dysphonia measures can adequately reveal PD symptom severity
estimated by UPDRS, because they capture the effects of PD motor impairment
manifested in speech production. We have demonstrated that predicting both motor
and total-UPDRS scores to useful precision is possible, because the dysphonia
measures aid in uncovering functional features of PD impairment.
Additionally, our findings support the argument that non-classical dysphonia
measures convey important information for clinical speech signal processing. This is
evidenced in the results of the Lasso algorithm, which selected non-standard
dysphonia measures in all the performed tests (especially HNR, RPDE, DFA and
PPE), and reflected in the optimal dysphonia measure subset selected by the BIC in

13
Supplementary Table 1. This suggests that these dysphonia measures contain
significant information for tracking UPDRS. It also reinforces the conclusion reached
in a previous study22, where these non-standard measures outperformed their classical
counterparts in separating PWP from healthy controls. Nevertheless, the classical
measures convey useful information which may not be captured by the non-classical
techniques: a parsimonious combination of classical and non-classical is optimal. That
is, different dysphonia measures appear to characterize different aspects of the PD
symptoms represented in the speech signal, so that their combination in a regression
method captures properties useful for clinical purposes.
Interestingly, the linear predictors performed very well, with the IRLS always
presenting slightly better prediction results than LS and Lasso. This indicates that the
tails of the error distributions of UPDRS around the regression line may depart from
Gaussianity and outliers need to be eliminated from the Gaussian prediction error
supposed by classical least squares methods. Still, its performance is not usefully
superior to the standard linear LS method. However, CART always provides
approximately 1-2 UPDRS points’ improvement in prediction performance over the
linear methods.
Some of the dysphonia measures are highly correlated with each other (Table 2),
which suggested the removal of those with insignificant contribution towards UPDRS
estimation. This large correlation between measures manifests in the parameter values
obtained through LS regression, where two highly correlated measures are allocated
opposite signed, but similar magnitude, large value parameters. For example, the
measures Shimmer APQ5 and MDVP: APQ have a correlation coefficient 0.96 and
their parameters almost exactly cancel each other. To address this artifact, the Lasso
algorithm offers a principled mathematical framework for reducing the number of
14
relevant input variables. Furthermore, recent theoretical work has shown that,
remarkably, where there is a subset of input measures that contribute no additional
information over others in the set, this algorithm is essentially equivalent to a brute
force search through all possible combinations of measures to find the smallest
combination that produces the minimum prediction error26.
The principle of parsimony suggests that given several different combinations of
dysphonia measures that have equal prediction accuracy, preference should be given
to the combination with the smallest number of measures. To account for estimation
precision versus model complexity (number of dysphonia measures in the subset), we
used the AIC and BIC values to determine the ‘optimal’ subset. The selected subset
according to these criteria is given in bold in Supplementary Table 1. Both criteria
suggest using the subset with the six measures: (MDVP: Jitter (Abs), MDVP:
Shimmer, NHR, HNR, DFA, PPE) in combination with the CART method, which
offers an attractive compromise between performance and complexity. That is, the
selected dysphonia measures in this subset complement each other with minimal
overlapping information, and at the same time capture practically the entire range of
possible differentiating features of the speech signals useful in determining UPDRS
values.
This selected subset and associated coefficients can be given a tentative
physiological interpretation. Fundamental frequency variations (measured with
absolute jitter) and variations in signal amplitude (shimmer), are well established
methods, capturing symptoms manifested in vocal fold vibration and lung efficiency.
NHR and HNR suggest that UPDRS is affected by increased noise, caused by
turbulent airflow in the glottis, often resulting from incomplete closure of the vocal
folds. This concept is further backed up by the inclusion of DFA. Finally PPE

15
indicates impaired pitch control which could be interpreted as deteriorating muscle
co-ordination. This is a sign of flawed neuron action potential averaging, suggesting
the reduction of dopaminergic neurons devoted to speech control. The remaining
dysphonia measures were shown to convey insignificant additional information to be
included in the model.
We believe these exploratory results could be of value in clinical trials, presenting
clinical staff with a useful guide to clinical rater tracking of PD symptoms by UPDRS
remotely, and at weekly intervals. This could be particularly useful in those cases
where the patients are reluctant or unable to make frequent physical visits to the
clinic. This may also be invaluable for future clinical trials of novel treatments which
will require high-frequency, remote, and very large study populations. We remark that
it is highly likely that combining these results with other PD symptom measures such
as those obtained using the AHTD dexterity tests may well help to reduce the UPDRS
prediction error and enhance the clinical value of such multimodal testing in
telemedicine applications.
We stress again the fact that UPDRS is subjective, and the clinicians’ verdict on a
patient’s score could vary. In the end, often the most relevant aspect of disease
progression (or PD treatment) is the patient’s perception of symptoms, i.e. symptom
self-rating. This study was confined to using dysphonia measures to predict the
average clinical overview of the widely used PD metric, the UPDRS. Although the
dysphonia measures have physiological interpretation, it is difficult to link self-
perception and physiology. In ongoing research work we focus our attempts to
establish a more physiologically-based model, which will explain the data-driven
findings in this study in terms of the relevant physiological changes that occur in PD.
16
Methods
Subjects
This study makes use of the recordings described in Goetz et al.24, where 52
subjects with idiopathic PD were recruited. The study was supervised by six US
medical centers: Georgia Institute of Technology (7 subjects), National Institutes of
Health (10 subjects), Oregon Health and Science University (14 subjects), Rush
University Medical Center (11 subjects), Southern Illinois University (6 subjects) and
University of California Los Angeles (4 subjects). All patients gave written informed
consent. We disregarded data from 10 recruits – two that dropped out the study early,
and a further eight due to insufficient performed tests. The selected subjects had at
least 20 valid study sessions during the trial period. We used data from the 42 PWP
(28 males) with diagnosis within the previous five years at trial onset (mean 72 ± 69,
min. 1, max. 260, median 48 weeks since diagnosis), with an age range 64.4 ± 9.24,
min. 36, max. 85, median 65 years. All subjects remained un-medicated for the six-
month duration of the study. UPDRS was assessed at baseline (onset of trial), and
after three and six months, the scores were 20.84 ± 8.82, min. 5, max. 41, median 19.5
points for motor UPDRS, and 28.44 ± 11.52, min. 7, max. 55, median 26.5 points for
total UPDRS.
17
Data acquisition
Fig. 1a displays graphically the data acquisition and UPDRS estimation procedure.
The data is collected at the patient’s home, transmitted over the internet, and
processed appropriately in the clinic to predict the UPDRS score. The data was
collected using the Intel At-Home Testing Device (AHTD), which is a telemonitoring
system designed to facilitate remote, Internet-enabled measurement of a variety of
PD-related motor impairment symptoms. It contains a docking station for measuring
tremor, paddles and pegboards for assessing upper body dexterity, a high-quality
microphone headset for recording patient voice signals and a USB data stick to store
test data. A LCD displays instructions for taking the tests. Typical audible prompts
instruct the patient to undertake tasks to measure tremor, bradykinesia (slow
movement), complex co-ordinated motor function, speech and voice. As part of a trial
to test the effectiveness of the AHTD system in practice, PWP were recruited and
trained to use the device. Subsequently, an AHTD was installed in their home and
they performed tests on a weekly basis. Each patient specified a day and time of the
week during which they had to complete the protocol, prompted with an automatic
alarm reminder on the device. The collected data was encrypted and transmitted to a
dedicated server automatically when the USB stick was inserted in a computer with
internet connection. Further details of the AHTD apparatus and trial protocol can be
found in the work of Goetz et al24.
The audio recordings are of two types: sustained phonations, and running speech
tests in which the subject is instructed to describe static photographs displayed on the
AHTD’s screen. They were recorded using a head-mounted microphone placed 5 cm
from the patient’s lips. The AHTD software was devised such that an initial audible,
18
spoken instruction followed by a “beep” prompted the subject to begin phonation: an
audio amplitude threshold detector triggered the capture of audio, and subsequently
the capture was stopped one second after the detected signal amplitude dropped below
that threshold, or 30 seconds of audio had been captured (whichever occurred sooner).
The voice signals were recorded directly to the AHTD USB stick sampled at 24 KHz
with 16 bit resolution.
In total, after initial screening, 5,923 sustained phonations of the vowel “ahhh…”
were digitally processed using algorithms implemented in the Matlab software
package. The patients were required to keep their frequency of phonation as steady as
possible, for as long as possible. Six phonations were recorded each day on which the
test was performed: four at comfortable pitch and loudness and two at twice the initial
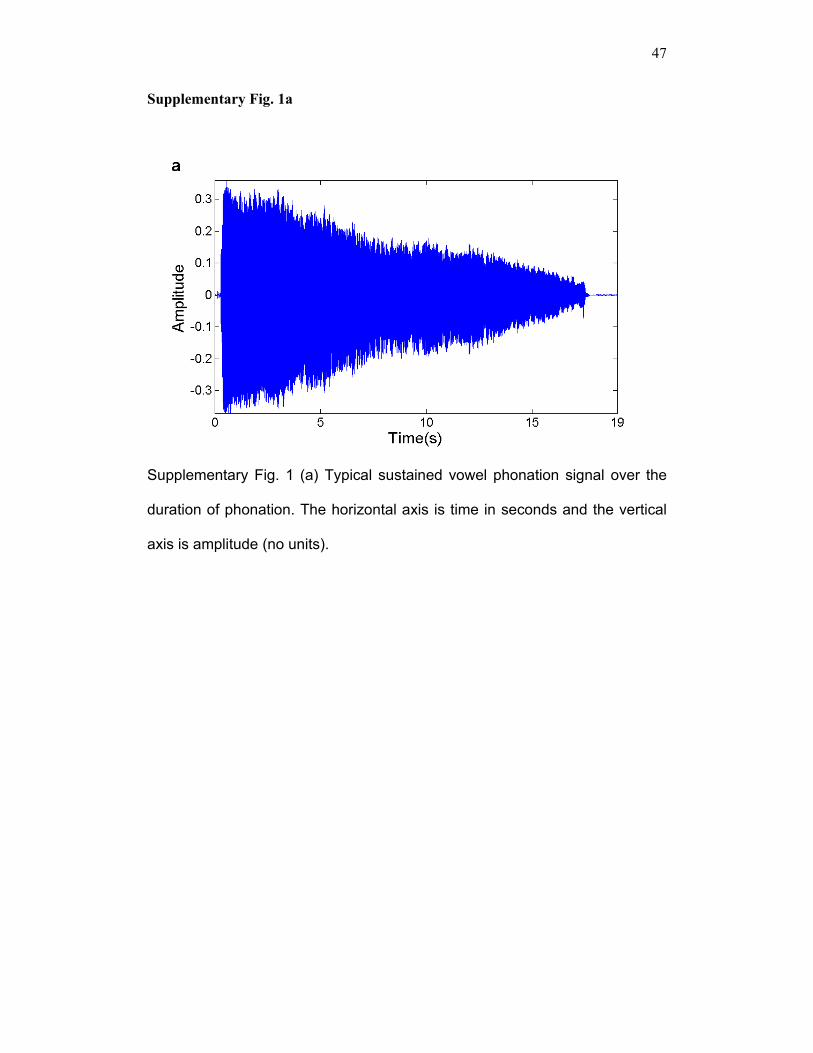
loudness (but without shouting). A typical sustained phonation speech signal appears
in Supplementary Fig. 1, with Supplementary Fig. 1a exhibiting it from a
macroscopic view over the duration of phonation, and Supplementary Fig. 1b
exhibiting a zoomed in view.
Feature extraction and statistical regression techniques
The aim of this study is to analyze the signal, extract features representing its
characteristics, and map these features to UPDRS using regression methods.
Ultimately, we want to mimic the UPDRS to useful precision with clinical importance
from the speech signal.

19
Feature extraction
Algorithms aiming to characterize clinically relevant properties from speech
signals can be broadly categorized into classical linear and non-classical, nonlinear
methods, see22,27,28,29) and the references therein for a detailed overview. With the
term linear we refer to a method where the output is proportional to a linear
combination of the inputs; conversely, nonlinear methods have more general
relationships between the inputs and the output. Here, we applied a range of classical,
and more recently proposed, speech signal processing techniques (henceforth we will
collectively refer to these as ‘dysphonia measures’) to all the 5,923 signals. Each of
the dysphonia measures is aimed at extracting distinct characteristics of the speech
signal, and produces a single number. Inevitably, some of them are highly correlated,
a concept we discuss elsewhere in this paper.
The classical methods are largely based on linear signal processing techniques
such as short-time autocorrelation, followed by ‘peak picking’ to estimate the
fundamental frequency F0, which corresponds to the vibration frequency of the vocal
folds (on average 120 Hz for men and 200 Hz for women). The pitch period (or
simply pitch), is the reciprocal of F0. The voice amplitude also has clinical value and
is determined as the difference between maximum and minimum values within a pitch
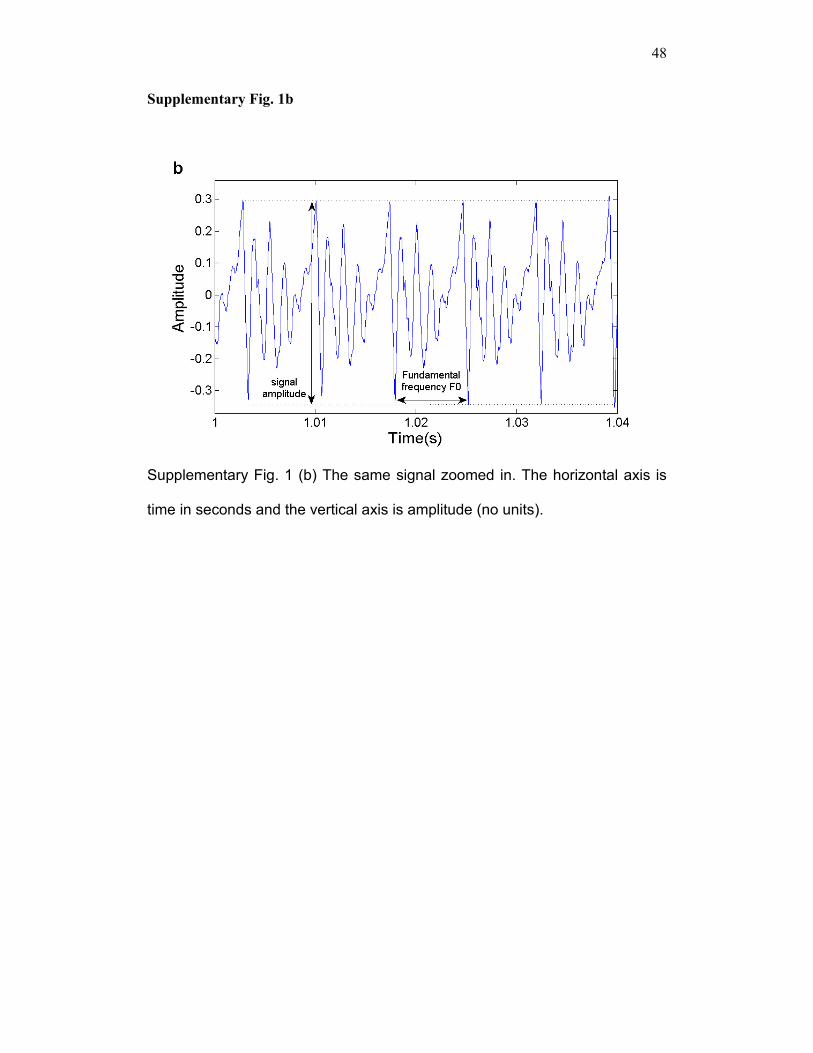
period. Successive cycles are not exactly alike (see also Supplementary Fig. 1b); the
terms jitter and shimmer are regularly used to describe the cycle to cycle variability in
F0 and amplitude, respectively. Similarly, the harmonics to noise ratio (HNR) and
noise to harmonics ratio (NHR) denote the signal-to-noise estimates. Please refer to27,
30 for a more detailed description of these classical speech processing techniques. The
software package Praat27 was used to calculate the classical algorithms: for
20
comparison, the corresponding algorithms in the well-used Kay Pentax Multi-
Dimensional Voice Program (MDVP)30 are prefixed by ‘MDVP’ in Table 1.
The recently proposed speech signal processing methods are Recurrence Period
Density Entropy (RPDE), Detrended Fluctuation Analysis (DFA) and Pitch Period
Entropy (PPE)22,29. The RPDE addresses the ability of the vocal folds to sustain
simple vibration, quantifying the deviations from exact periodicity. It is determined
from the entropy of the distribution of the signal recurrence periods, representing the
uncertainty in the measurement of the exact period in the signal. Dysphonias such as
hoarseness or creaky voice typically cause an increase in RPDE. DFA characterizes
the extent of turbulent noise in the speech signal, quantifying the stochastic self-
similarity of the noise caused by turbulent air-flow in the vocal tract. Breathiness or
other similar dysphonias caused by, e.g. incomplete vocal fold closure can increase
the DFA value. Both methods have been shown to contain clinically valuable
information regarding general voice disorders29, and PD-dysphonia in particular22.
PPE measures the impaired control of stable pitch during sustained phonation22, a
symptom common to PWP31. The novelty of this measure is that it uses a logarithmic
pitch scale and is robust to confounding factors such as smooth vibrato which is
present in healthy voices as well as dysphonic voices. It has been shown that this
measure contributes significant information in separating healthy controls and PWP22.
Data exploration and correlation analysis
In the AHTD trial, UPDRS values were obtained at baseline, three-month and six-
month trial periods, but the voice recordings were obtained at weekly intervals.
Therefore, a straightforward piecewise linear interpolation was used to obtain weekly

21
UPDRS values to associate with each phonation. We interpolated both motor UPDRS
and total UPDRS to assess the efficacy of the dysphonia measures for predicting both
scores. The tacit assumption is that symptom severity did not fluctuate wildly within
the three-month intervals over which the UPDRS were obtained.
Initially, we performed correlation analysis to identify the strength of association
of dysphonia measures with the linearly interpolated UPDRS values. The data was
non-normal, so we used non-parametric statistical tests. We computed p-values (at the
95% level) of the null hypothesis having no linear correlation ρ, between each
measure and UPDRS. Similarly, we calculated correlation coefficients between the
dysphonia measures. We used the Spearman correlation coefficient to assess the
strength of association between each measure and UPDRS, and between measures.
The probability densities were computed with kernel density estimation with Gaussian
kernels.
Regression mapping of dysphonia measures to UPDRS
This preliminary correlation analysis suggests that, taken individually, the
dysphonia measures are weakly correlated to UPDRS. However, individual
correlations alone do not reveal the (potentially nonlinear) functional relationship
between these measures combined together and the associated UPDRS. To find this
relationship, statistical regression techniques have been proposed, the simplest of
which is classical least-squares regression32. Our aim is to maximally exploit the
information contained in the combined dysphonia measures to produce a predictor
that maximizes the accuracy of UPDRS prediction. We used three linear and one
nonlinear regression method to map the dysphonia measures to interpolated UPDRS
22
values, and compared their predictive performance32. Linear regression methods
assume that the regression function f(x)=y, which maps the dysphonia measures
x=(x1,…, xM) (M is the number of inputs) to the UPDRS output y, is linear in the
inputs. It can be expressed as 01
( )M
j jj
f b x b=
= +∑x , with the use of the bias term b0
being optional, i.e. b0 = 0 is quite common (this study does not use a bias term). The
aim is to determine the coefficients (or parameters) b, given a large number of input
values x and output values f(x)=y, that minimizes the error in the predictions of
UPDRS over the whole data set. The linear techniques used were classical least
squares (LS), iteratively re-weighted least squares (IRLS), and least absolute
shrinkage and selection operator (Lasso). We describe these techniques next.
LS determines the coefficients b that minimize the residual sum of squares
between the actual (measured) UPDRS and the predicted UPDRS:
( )2
2
1 1 1
ˆ arg min ( ) arg minN N M
i i i ij jbi i j
y f y x b= = =
⎛ ⎞= − = −⎜ ⎟
⎝ ⎠∑ ∑ ∑
bb x ,
where 1( ,..., )i i ijx x=x is a vector of input measurements giving rise to the measured
quantity yi, for each ith case and N is the number of observations. The statistical
assumption underlying LS is that the residuals (the difference between the actual and
predicted UPDRS) are independent and identically distributed Gaussian random
variables, which may not always be a valid assertion, and this can lead to poor
estimates of the parameters. Thus, to mitigate any large deviations from Gaussianity,
our proposed IRLS method effectively reduces the influence of values distant from
the main bulk of the data (outliers) by making iterative LS predictions that reweight
outliers at each step. This robust estimator is computed using the following algorithm:

23
1) Determine the residuals: 1 1
N M
i ij ji j
y x b= =
= −∑ ∑r
2) Determine the weights w using r: ( )( )exp 2 / max( )T
= − ⋅w r r
3) Solve the least squares problem using w: 2
1 1
ˆ arg minN M
i i ij ji j
w y x b= =
⎛ ⎞= −⎜ ⎟
⎝ ⎠∑ ∑
bb
4) Repeat from the 1st step, for a pre-specified number of iterations (we used 100).
In the first iteration, the coefficients b are determined using the LS method.
A problem often encountered in such regression methods when using a large
number of input variables (16 in this case) is the curse of dimensionality: fewer input
variables could potentially lead to a simpler model with more accurate prediction.
Research has shown that many of the dysphonia measures are highly correlated22 and
this finding is confirmed in this study (see Table 2), so we can assume that taken
together, highly correlated measures contribute little additional information for
UPDRS prediction. Following the general principle of parsimony, we would like to
reduce the number of measures in the analysis and still obtain accurate UPDRS
prediction.
Little et al. used pre-filtering to reduce the number of dysphonia measures22: this
method combines pairs of measures and computes correlation coefficients; when the
correlation is above a pre-defined high threshold, one of the pair of measures is
removed. The process continues until no more coefficients can be eliminated.
Although viable, it is less principled than shrinkage methods such as the Lasso, which
also offers a mathematical framework enhancing the physiological interpretability of
the resulting regression coefficients33. The Lasso has the desirable characteristic of
24
simultaneously minimizing the prediction error whilst producing some coefficients
that are effectively zero (reducing the number of relevant input variables) by adjusting
a shrinkage parameter. The algorithm selects the best, smallest subset of variables for
the given shrinkage parameter. Decreasing this parameter value causes additional
coefficients to shrink towards zero, further reducing the number of relevant input
variables. Then it becomes a matter of experimentation to find the optimal
compromise between reducing the number of relevant input measures and minimizing
the error in the UPDRS prediction. Specifically, the Lasso induces the sum of absolute
values penalty:
2
1 1 1
ˆ arg min subject to N M M
Lasso i ij j ji j j
y x b b t= = =
⎛ ⎞= − ≤⎜ ⎟
⎝ ⎠∑ ∑ ∑
bb
where t is the shrinkage parameter, and the constraint 1
M
jj
b t=
≤∑ can be seen as
imposing the penalty 1
M
jj
λ b=∑ to the residual sum of squares, which yields:
2
1 1 1
ˆ arg minN M M
Lasso i ij j jb i j j
y x b λ b= = =
⎛ ⎞= − +⎜ ⎟
⎝ ⎠∑ ∑ ∑b
Other penalties are possible, including the sum of squares of coefficients b (ridge
regression), but it can be shown that the sum of absolute values penalty leads to many
coefficients which are almost exactly zero, when the problem is underdetermined due
to highly redundant inputs, as in this case26. In practical terms, this also enhances the
interpretability of the model.
It may well be the case that the dysphonia measures do not combine linearly to
predict the UPDRS. Thus, nonlinear regression may be required, where the prediction
25
function f(x) is a nonlinear combination of the inputs x. To test this idea, we used the
classification and regression tree (CART) method, which is a conceptually simple
nonlinear method that often provides excellent regression results32. The key idea
behind CART is in finding the best split of the input variables, and partitioning the
ranges of these variables into two sub-regions. This partitioning process is repeated on
each of the resulting sub-regions, recursively partitioning the input variables into
smaller and smaller sub-regions. This recursive procedure can be represented
graphically as a tree that splits into successively smaller branches, each branch
representing a sub-region of input variable ranges. This tree is “grown” up to T0 splits,
learning a successively detailed mapping between all the available data and the
UPDRS. Although this process is in principle very flexible and hence able to
reproduce highly convoluted mappings, it can easily overfit the data: that is, become
highly sensitive to noisy fluctuations in the input data. To address this danger some
splits are collapsed (a process known as pruning) and the amount of split reduction is
determined by the pruning level.
Here we employed the following strategy: we have experimented with the Lasso
method by adjusting the constant parameter λ, and then observed the surviving and
shrinking coefficients associated with each dysphonia measure. Subsequently, various
reduced sets of dysphonia measures have been tested with all the regression methods
(LS, IRLS and CART).
Model selection – Bayesian Information Criterion and Akaike Information Criterion
The Bayesian Information Criterion (BIC) and Akaike Information Criterion
(AIC) offer a framework of comparing fits of models with a different number of

26
parameters32, and have often been used in the context of medical applications34. These
criteria induce a penalty on the number of measures in the selected subset, offering a
compromise between in-sample error and model complexity. The ‘optimal’ subset of
dysphonia measures is the model with the lower BIC and AIC values. These two
criteria are defined as32:
( )2
2
ˆBIC log( )
N
i ii
ε
U UN D
σ
−= +∑
( )2
2
ˆAIC 2 /
N
i ii
ε
U UD N
σ
−= +∑
where N is the number of data samples, D is the number of measures, Ui is the true
UPDRS value as provided by the dataset, ˆiU the predicted estimate and 2
εσ is the
mean squared error (MSE) variance, where the MSE is defined as
( )2
1
1 ˆN
i ii
MSE U UN =
= −∑ .
Cross-validation and model generalization
To objectively test the generalization performance of the proposed regression
methods in predicting UPDRS (that is, the ability of the models to perform well on
data not used in estimating the model parameters), we used cross validation, a well-
known statistical re-sampling technique35. Specifically, the data set of 5,923
phonations was split into a training subset (5,331 phonations) and a testing subset
(592 phonations), which was used to assess generalization performance. The model
parameters were derived using the training subset, and errors were computed using
the testing subset (out-of-sample error or testing error). The process was repeated a

27
total of 1,000 times, with the data set randomly permuted in each run prior to splitting
in training and testing subsets, in order to obtain confidence in this assessment. On
each test repetition, we recorded the mean absolute error (MAE) for both training and
testing subsets:
Q
1 ˆi i
i
MAE U UN ∈
= −∑
where Ui is the true UPDRS value as provided by the dataset, ˆiU the predicted
estimate and N is the number of phonations in the training or testing dataset, denoted
by Q, containing the indices of that set. Testing errors from all 1,000 repetitions were
averaged. In all cases, the prediction performance results were determined following
cross-validation.

28
Acknowledgments: We are grateful to Ralph Gregory for medical insight and to Mike Deisher, Bill
DeLeeuw and Sangita Sharma at Intel Corporation for fruitful discussions and comments on early
drafts of the paper. We also want to thank James McNames, Lucia M. Blasucci, Eric Dishman, Rodger
Elble, Christopher G. Goetz, Andy S. Grove, Mark Hallett, Peter H. Kraus, Ken Kubota, John Nutt,
Terence Sanger, Kapil D. Sethi, Ejaz A. Shamim, Helen Bronte-Stewart, Jennifer Spielman, Barr C.
Taylor, David Wolff, and Allan D. Wu, who were responsible for the design and construction of the
AHTD device and organizing the trials in which the data used in this study was collected.
Declaration: The trial protocol was conducted by the Kinetics Foundation (Los Altos,
CA), with technical support from Intel. A. Tsanas is funded, in part, by Intel
Corporation. A. Tsanas, M. Little and P. McSharry had full access to all the data, and
have the final responsibility for the decision to submit for publication.
Conflict of interest: We have no conflict of interest.
29
References
1. de Rijk, M.C. et al. Prevalence of Parkinson’s disease in Europe: a
collaborative study of population-based cohorts. Neurology. 54, 21–23,
(2000)
2. Lang, A.E., Lozano, A.M. Parkinson’s disease – First of two parts, New
England Journal Medicine. 339, 1044-1053 (1998)
3. Rajput, M., Rajput, A., Rajput, A.H. Epidemiology (chapter 2). In Handbook
of Parkinson’s disease, edited by R. Pahwa and K. E. Lyons, 4th edition,
Informa Healthcare, USA (2007)
4. Schrag, A., Ben-Schlomo, Y., Quinn, N. How valid is the clinical diagnosis
of Parkinson’s disease in the community?. Journal of Neurology,
Neurosurgery Psychiatry 73, 529-535 (2002)
5. Van Den Eeden, S.K. et al.. Incidence of Parkinson’s disease: Variation by
age, gender, and Race/Ethnicity. Am J Epidem 157, 1015-1022 (2003)
6. Elbaz, A. et al. Risk tables for parkinsonism and Parkinson’s disease.
Journal of Clinical Epidemiology. 55, 25-31 (2002)
7. Sapir, S., Spielman, J., Ramig, L., Story, B., Fox, C. Effects of Intensive
Voice Treatment (LSVT) on Vowel Articulation in Dysarthric Individuals

30
with Idiopathic Parkinson Disease: Acoustic and Perceptual Findings.
Journal of Speech, Language and Hearing Research 50, 899-912 (2007)
8. Singh, N., Pillay, V., Choonara, Y.E. Advances in the treatment of
Parkinson’s disease, Progress in Neurobiology 81, 29-44 (2007)
9. King, J., Ramig, L., Lemke, J.H., Horii, Y. Parkinson’s disease: longitudinal
changes in acoustic parameters of phonation, Journal of Medical Speech and
Language Pathology 2, 29-42 (1994)
10. Hanson, D., Gerratt, B. and Ward, P. Cinegraphic observations of laryngeal
function in Parkinson’s disease. Laryngoscope 94, 348-353 (1984)
11. Ho, A., Iansek, R., Marigliani, C., Bradshaw, J., Gates, S. Speech
impairment in a large sample of patients with Parkinson’s disease.
Behavioral Neurology 11, 131-37 (1998)
12. Logemann, J.A., Fisher, H.B., Boshes, B., Blonsky, E.R. Frequency and
coocurrence of vocal tract dysfunctions in the speech of a large sample of
Parkinson patients. Journal of Speech and Hearing Disorders 43, 47-57
(1978)
13. Hartelius, L., Svensson, P. Speech and swallowing symptoms associated
with Parkinson’s disease and multiple sclerosis: A survey, Folia Phoniatr
Logop 46, 9-17 (1994)
31
14. Harel, B., Cannizzaro, M. and Snyder, P.J. Variability in fundamental
frequency during speech in prodromal and incipient Parkinson’s disease: A
longitudinal case study, Brain and Cognition 56, 24–29 (2004)
15. Duffy JR. Motor Speech Disorders: substrates, differential diagnosis and
management, New York: Mosby, 2nd ed., 2005
16. Holmes, R.J., Oates, J.M., Phyland, D.J., Hughes, A.J. Voice characteristics
in the progression of Parkinson’s disease. Int J Lang Comm Dis 35, 407-418,
(2000)
17. Skodda, S., Rinsche, H., Schlegel, U. Progression of dysprosody in
Parkinson’s disease over time – A longitudinal study. Movement Disorders
(December 31, 2008). Doi: 10.1002/mds.22430
18. Rajput, A.H., Rozdilsky, B., Rajput, A. Accuracy of clinical diagnosis in
parkinsonism – a prospective study, Canadian Journal of Neurological
Sciences 18 (3), 275-278 (1991)
19. Hughes, A.J., Daniel, S.E., Blankson, S., Lees, A.J. A clinicopathologic
study of 100 cases of Parkinson’s disease, Archives of Neurology 50, 140–
148 (1993)
32
20. Titze, I.R. Summary statement: Workshop on Acoustic Voice Analysis,
(available online at: http://www.ncvs.org/museum-archive/sumstat.pdf, last
accessed on 30 Mar. 2009) NCVS, Denver, Colorado, Feb. 1994
21. Rosen, K.M., Kent, R.D., Duffy, J.R. Task-based profile of vocal intensity
decline in Parkinson’s disease. Folia Phoniatr. Logop 57, 28-37 (2005)
22. Little, M.A., McSharry, P.E., Hunter, E.J., Spielman, J., Ramig, L.O.
Suitability of dysphonia measurements for telemonitoring of Parkinson’s
disease, IEEE Transactions Biomedical Engineering (September 11, 2008),
doi: 10101/npre.2008.2298.1
23. Titze, I.R. Principles of Voice Production. National Center for Voice and
Speech, Iowa City, US, 2nd ed. (2000)
24. Goetz, C.G. et al. Testing objective measures of motor impairment in early
Parkinson’s disease: Feasibility study of an at-home testing device.
Movement Disorders (December 11, 2008) doi. 10.1002/mds.22379
25. Stebbins, G.T., Goetz, C.G., Lang, A.E., Cubo, E. Factor analysis of the
motor section of the Unified Parkinson’s Disease Rating Scale during the
off-state. Movement Disorders 14 (4), 585-589 (1999)

33
26. Donoho, D. For most large underdetermined systems of equations, the
minimal L1-norm near-solution approximates the sparsest near-solution.
Communications on Pure and Applied Mathematics. 59(7), 904-934 (2006)
27. Boersma, P., Weenik, D. Praat, a system for doing phonetics by computer,
Glot Int. 5, 341-345 (2001) (available online at http://www.praat.org/)
28. Little, M.A. Biomechanically Informed Nonlinear Speech Signal Processing,
DPhil Thesis, University of Oxford, Oxford, UK (2007)
29. Little, M.A., McSharry, P.E., Roberts, S.J., Costello, D., Moroz, I.M.
Exploiting Nonlinear Recurrence and Fractal Scaling Properties for Voice
Disorder Detection. Biomedical Engineering Online 6:23 (2007)
30. KayPENTAX, Kay Elemetrics Disordered Voice Database, Model 4337,
Kay Elemetrics, Lincoln Park, NJ, USA, 1996-2005
31. Cnockaert, L. et al. Low frequency vocal modulations in vowels produced
by Parkinsonian subjects, Speech Comm 50, 288-300 (2008)
32. Hastie, T., Tibshirani, R., Friedman, J. The elements of statistical learning:
data mining, inference, and prediction. Springer (2001)
33. Tibshirani, R. Regression Shrinkage and Selection via the Lasso. J. R.
Statist. Soc. B 58, 267-288 (1996)

34
34. Stergiopulos, N., Westerhof, B.E., Westerhof, N. Total Arterial Inertance as
the fourth element of the windkessel model. Am. J. Physiol. Heart Circ.
Physiol. 276, 81-88, 1999
35. Webb, A. Statistical Pattern Recognition, John Wiley and Sons Ltd (2002)

35
Figure Legends
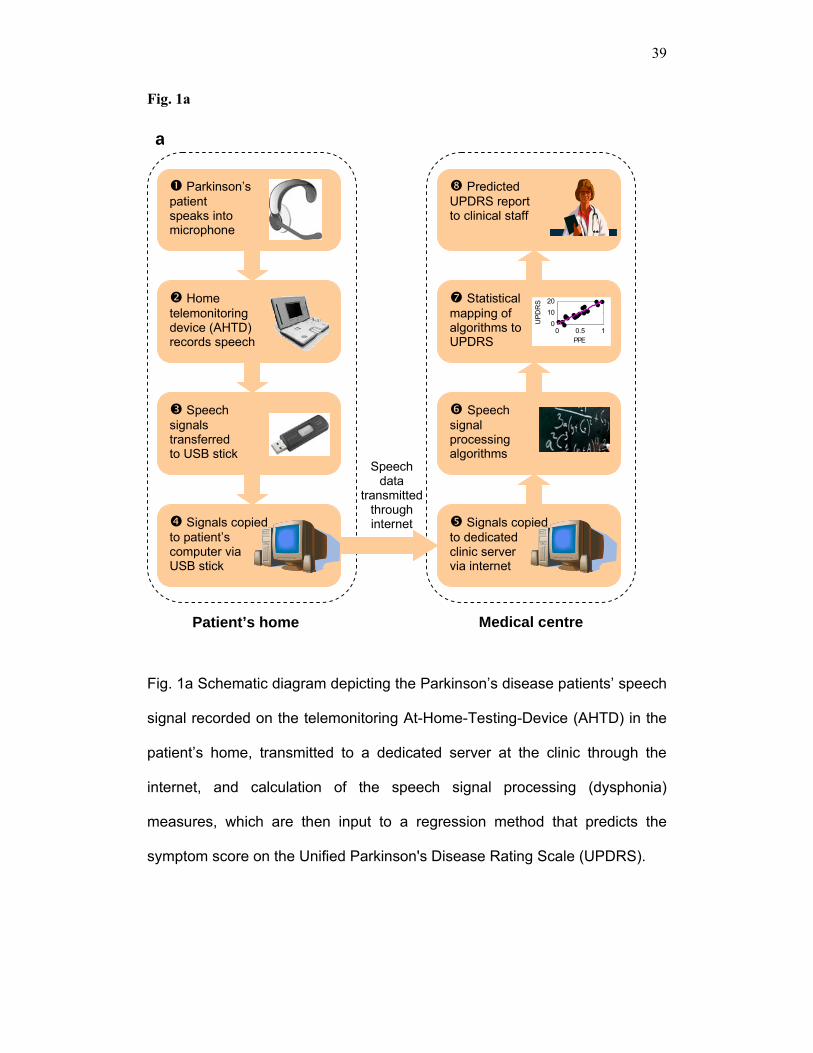
Fig. 1a Schematic diagram depicting the Parkinson’s disease patients’ speech
signal recorded on the telemonitoring At-Home-Testing-Device (AHTD) in the
patient’s home, transmitted to a dedicated server at the clinic through the
internet, and calculation of the speech signal processing (dysphonia)
measures, which are then input to a regression method that predicts the
symptom score on the Unified Parkinson's Disease Rating Scale (UPDRS).
(b) Motor Unified Parkinson's Disease Rating Scale (UPDRS) and (c) total-
UPDRS tracking over the 6-month trial period for one of the patients. The dots
denote the piecewise linearly interpolated UPDRS value and the circles,
predicted UPDRS. The light gray bands are the 5-95 percentile confidence
interval of the UPDRS prediction, and the dark gray bands are the 25-75
percentile confidence intervals. Confidence intervals are estimated using
1,000-runs of 10-fold cross-validated out-of-sample UPDRS prediction. The
mean absolute prediction error (MAE) of each model is also quoted, along
with the standard deviation. The Classification And Regression Tree (CART)
method tracks Parkinson's disease symptom progression more accurately
than Iteratively Reweighted Least Squares (IRLS). The out-of-sample MAE
was computed by taking the average MAE of the 1,000 runs of the cross-
validation of each testing subset (n = 592 phonations).
Fig. 2 (a) Probability densities of the dysphonia measures applied to the 5,923
sustained phonations. The vertical axes are the probability densities of the
36
normalized measures, estimated using kernel density estimation with
Gaussian kernels. (b) Dysphonia measures against motor Unified Parkinson's
Disease Rating Scale (UPDRS). The horizontal axes are the normalized
dysphonia measures and the vertical axes correspond to motor UPDRS. The
grey lines are the best linear fit obtained using Iteratively Reweighted Least
Squares (IRLS - see methods section for description of the algorithm). The R-
values denote the Spearman correlation coefficient of each measure with
motor UPDRS. See also Table 2 for the correlation coefficients between the
measures. (c). Dysphonia measures against total Unified Parkinson's Disease
Rating Scale (UPDRS). The horizontal axes are the normalized dysphonia
measures and the vertical axes correspond to total UPDRS. The horizontal
axes are the normalized dysphonia measures and the vertical axes
correspond to total UPDRS. The grey lines are the best linear fit obtained
using Iteratively Reweighted Least Squares (IRLS - see methods section for
description of the algorithm). The R-values denote the Spearman correlation
coefficient of each measure with total UPDRS. See also Table 2 for the
correlation coefficients between the measures. All phonations were used to
generate these results (n=5,923).
Supplementary Fig. 1 (a) Typical sustained vowel phonation signal over the
duration of phonation. The horizontal axis is time in seconds and the vertical
axis is amplitude (no units). (b) The same signal zoomed in. The horizontal
axis is time in seconds and the vertical axis is amplitude (no units).

37
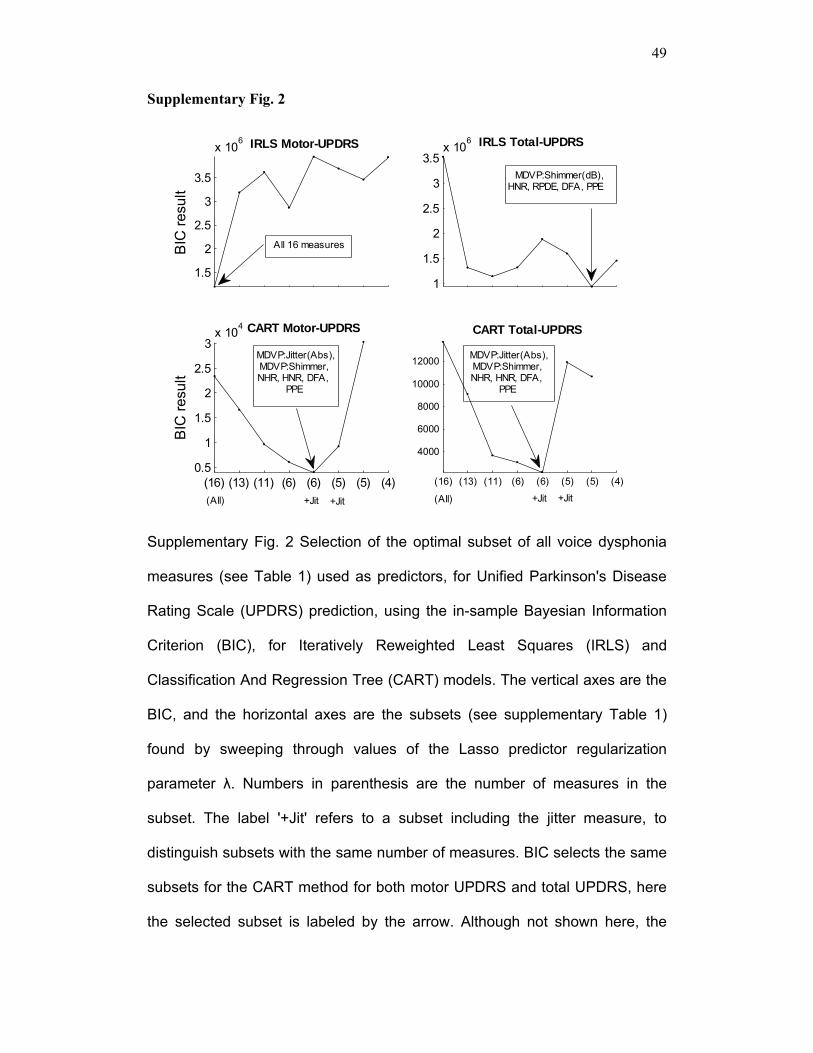
Supplementary Fig. 2 Selection of the optimal subset of all voice dysphonia
measures (see Table 1) used as predictors, for Unified Parkinson's Disease
Rating Scale (UPDRS) prediction, using the in-sample Bayesian Information
Criterion (BIC), for Iteratively Reweighted Least Squares (IRLS) and
Classification And Regression Tree (CART) models. The vertical axes are the
BIC, and the horizontal axes are the subsets (see supplementary Table 1)
found by sweeping through values of the Lasso predictor regularization
parameter λ. Numbers in parenthesis are the number of measures in the
subset. The label '+Jit' refers to a subset including the jitter measure, to
distinguish subsets with the same number of measures. BIC selects the same
subsets for the CART method for both motor UPDRS and total UPDRS, here
the selected subset is labeled by the arrow. Although not shown here, the
Akaike Information Criterion (AIC) selected exactly the same optimal subset of
measures. The BIC for the smallest subset of size four, for the CART method,
is off the scale and omitted for clarity. The in-sample error was computed by
taking the average error of the 1,000 runs of the cross-validation of each
training subset (n = 5,331 phonations).
Supplementary Fig. 3 (a, b) Probability density of the 1,000-runs 10-fold
cross-validation out-of-sample differences between model predicted (U ) and
piecewise linearly interpolated (U) Unified Parkinson's Disease Rating Scale
(UPDRS) values, using Least Squares (LS), Iteratively Reweighted Least
Squares (IRLS) and Classification And Regression Tree (CART) models to
predict (a) motor-UPDRS and (b) total-UPDRS. The vertical axes are the
probability densities of the regression methods, estimated using kernel

38
density estimation with Gaussian kernels. The mean absolute prediction error
(MAE) of each model is also quoted, along with the standard deviation. IRLS
outperforms the other linear regression methods, in terms of smallest MAE.
The distribution of prediction errors for the CART method has the smallest
spread and is also the most unimodal. The out-of-sample MAE was computed
by taking the average MAE of the 1,000 runs of the cross-validation of each
testing subset (n = 592 phonations).
39
Fig. 1a
Fig. 1a Schematic diagram depicting the Parkinson’s disease patients’ speech
signal recorded on the telemonitoring At-Home-Testing-Device (AHTD) in the
patient’s home, transmitted to a dedicated server at the clinic through the
internet, and calculation of the speech signal processing (dysphonia)
measures, which are then input to a regression method that predicts the
symptom score on the Unified Parkinson's Disease Rating Scale (UPDRS).
Parkinson’s patient speaks into microphone
Home telemonitoring device (AHTD) records speech
Speech signals transferred to USB stick
Speech data
transmitted through internet Signals copied
to patient’s computer via USB stick
Speech signal processing algorithms
Statistical mapping of algorithms to UPDRS
Predicted UPDRS report to clinical staff
Signals copied to dedicated clinic server via internet
a
Patient’s home Medical centre
0 0.5 10
1020
PPE
UPD
RS
40
Fig. 1b
0
10
20
30
40U
PD
RS
Motor UPDRS tracking
15-Oct-2006 15-Jan-2007 15-Apr-20070
10
20
30
40
Trial period
UP
DR
SIRLS
MAE: 6.80 ±0.17
MAE: 5.95 ±0.19
b
CART
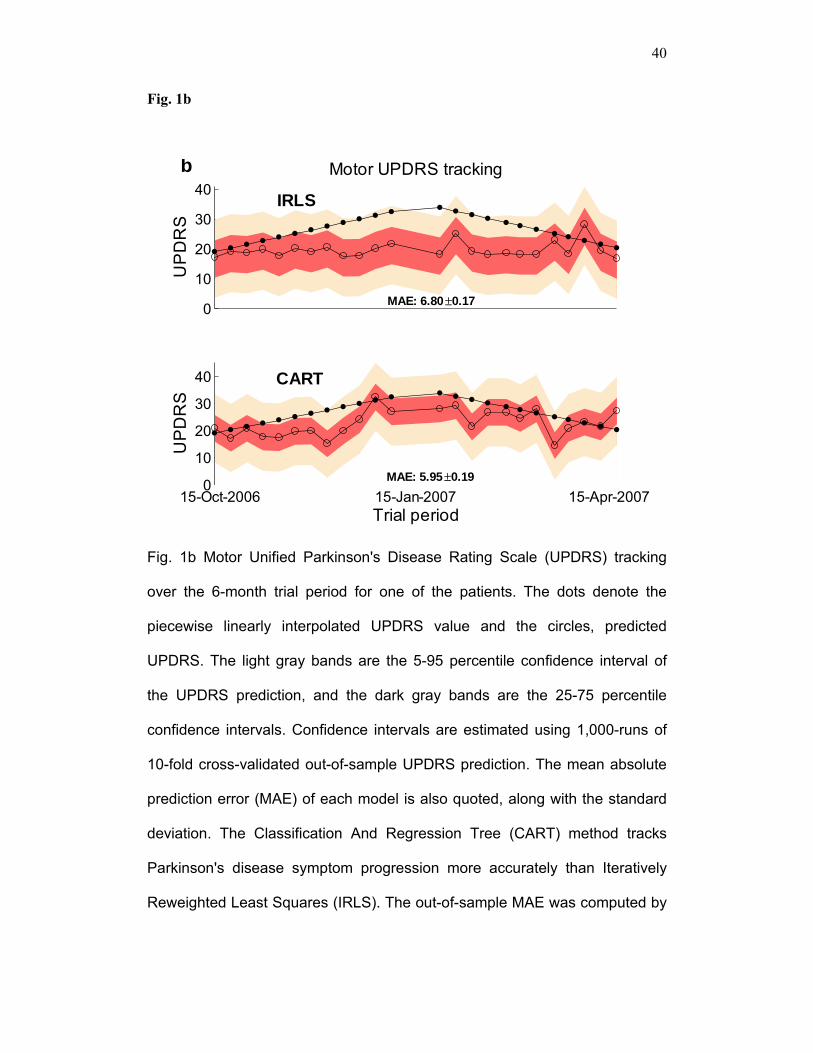
Fig. 1b Motor Unified Parkinson's Disease Rating Scale (UPDRS) tracking
over the 6-month trial period for one of the patients. The dots denote the
piecewise linearly interpolated UPDRS value and the circles, predicted
UPDRS. The light gray bands are the 5-95 percentile confidence interval of
the UPDRS prediction, and the dark gray bands are the 25-75 percentile
confidence intervals. Confidence intervals are estimated using 1,000-runs of
10-fold cross-validated out-of-sample UPDRS prediction. The mean absolute
prediction error (MAE) of each model is also quoted, along with the standard
deviation. The Classification And Regression Tree (CART) method tracks
Parkinson's disease symptom progression more accurately than Iteratively
Reweighted Least Squares (IRLS). The out-of-sample MAE was computed by

41
taking the average MAE of the 1,000 runs of the cross-validation of each
testing subset (n = 592 phonations).
42
Fig. 1c
0
10
20
30
40
50U
PD
RS
Total UPDRS tracking
15-Oct-2006 15-Jan-2007 15-Apr-20070
1020304050
Trial period
UP
DR
SIRLS
MAE: 8.47±0.27
CART
MAE: 7.52 ±0.25
c
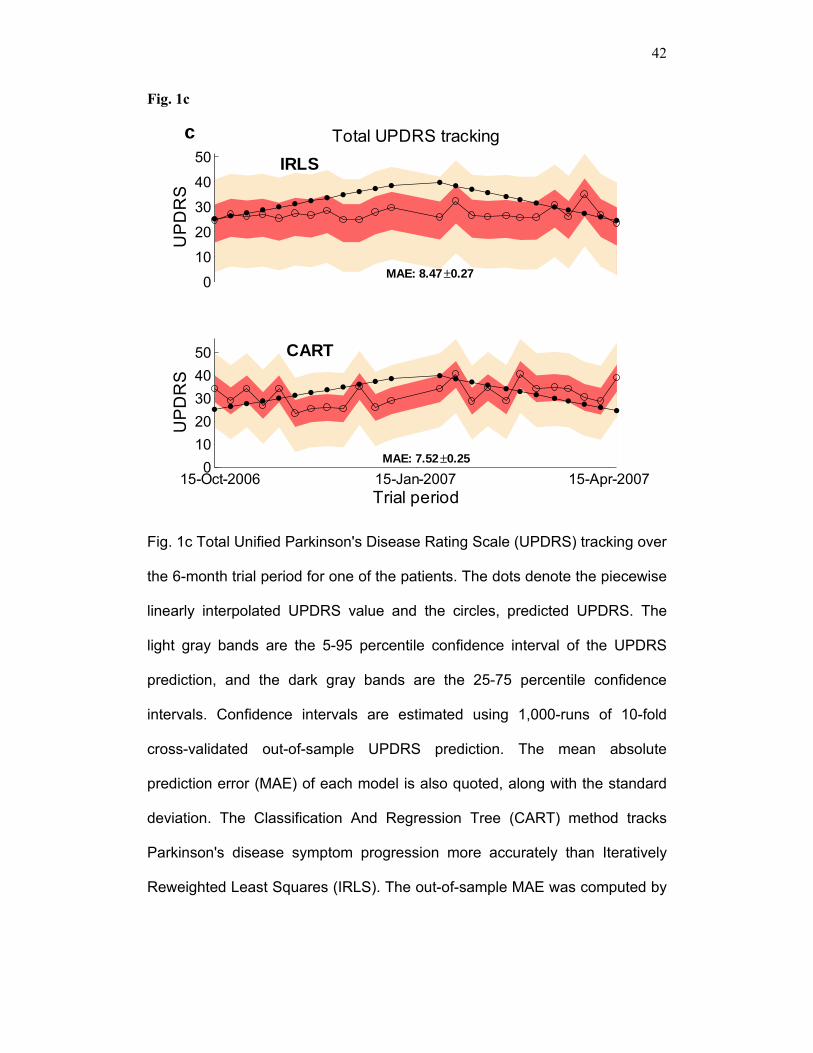
Fig. 1c Total Unified Parkinson's Disease Rating Scale (UPDRS) tracking over
the 6-month trial period for one of the patients. The dots denote the piecewise
linearly interpolated UPDRS value and the circles, predicted UPDRS. The
light gray bands are the 5-95 percentile confidence interval of the UPDRS
prediction, and the dark gray bands are the 25-75 percentile confidence
intervals. Confidence intervals are estimated using 1,000-runs of 10-fold
cross-validated out-of-sample UPDRS prediction. The mean absolute
prediction error (MAE) of each model is also quoted, along with the standard
deviation. The Classification And Regression Tree (CART) method tracks
Parkinson's disease symptom progression more accurately than Iteratively
Reweighted Least Squares (IRLS). The out-of-sample MAE was computed by

43
taking the average MAE of the 1,000 runs of the cross-validation of each
testing subset (n = 592 phonations).
44
Fig. 2 (a)
0.050.15
Jitter(%)
0.02
0.08
Jitter(Abs)
0.05
0.2
Jitter:RAP0.05
0.25
Jitter:PPQ5
0.05
0.2
Jitter:DDP
0.02
0.08
Shimmer
0.02
0.06
Shimmer(dB)
0.02
0.08
Shimmer:APQ3
0.02
0.08
Shimmer:APQ50.02
0.1
Shimmer:APQ11
0.02
0.08
Shimmer:DDA
0.05
0.2
NHR
0 0.5 1
0.01
0.03
HNR0 0.5 1
0.01
0.03
RPDE0 0.5 1
5
15x 10-3
DFA0 0.5 1
0.01
0.03
PPE
a
Fig. 2a Probability densities of the dysphonia measures applied to the 5,923
sustained phonations. The vertical axes are the probability densities of the
normalized measures, estimated using kernel density estimation with
Gaussian kernels.

45
Fig. 2b
Fig. 2b Dysphonia measures against motor Unified Parkinson's Disease
Rating Scale (UPDRS). The horizontal axes are the normalized dysphonia
measures and the vertical axes correspond to motor UPDRS. The grey lines
are the best linear fit obtained using Iteratively Reweighted Least Squares
(IRLS - see methods section for description of the algorithm). The R-values
denote the Spearman correlation coefficient of each measure with motor
UPDRS. See also Table 2 for the correlation coefficients between the
measures. All phonations were used to generate these results (n=5,923).

46
Fig 2c
Fig. 2c Dysphonia measures against total Unified Parkinson's Disease Rating
Scale (UPDRS). The horizontal axes are the normalized dysphonia measures
and the vertical axes correspond to total UPDRS. The horizontal axes are the
normalized dysphonia measures and the vertical axes correspond to total
UPDRS. The grey lines are the best linear fit obtained using Iteratively
Reweighted Least Squares (IRLS - see methods section for description of the
algorithm). The R-values denote the Spearman correlation coefficient of each
measure with total UPDRS. See also Table 2 for the correlation coefficients
between the measures. All phonations were used to generate these results
(n=5,923).
47
Supplementary Fig. 1a
Supplementary Fig. 1 (a) Typical sustained vowel phonation signal over the
duration of phonation. The horizontal axis is time in seconds and the vertical
axis is amplitude (no units).
48
Supplementary Fig. 1b
Supplementary Fig. 1 (b) The same signal zoomed in. The horizontal axis is
time in seconds and the vertical axis is amplitude (no units).
49
Supplementary Fig. 2
1.5
2
2.5
3
3.5
x 106 IRLS Motor-UPDRS
BIC
resu
lt
1
1.5
2
2.5
3
3.5x 10⁶ IRLS Total-UPDRS
(16) (13) (11) (6) (6) (5) (5) (4)0.5
1
1.5
2
2.5
3x 10⁴ CART Motor-UPDRS
BIC
resu
lt
(16) (13) (11) (6) (6) (5) (5) (4)
4000
6000
8000
10000
12000
CART Total-UPDRS
MDVP:Shimmer(dB),HNR, RPDE, DFA, PPE
+Jit (All)(All) +Jit +Jit
MDVP:Jitter(Abs),MDVP:Shimmer,
NHR, HNR, DFA, PPE
MDVP:Jitter(Abs),MDVP:Shimmer,NHR, HNR, DFA,
PPE
All 16 measures
+Jit
Supplementary Fig. 2 Selection of the optimal subset of all voice dysphonia
measures (see Table 1) used as predictors, for Unified Parkinson's Disease
Rating Scale (UPDRS) prediction, using the in-sample Bayesian Information
Criterion (BIC), for Iteratively Reweighted Least Squares (IRLS) and
Classification And Regression Tree (CART) models. The vertical axes are the
BIC, and the horizontal axes are the subsets (see supplementary Table 1)
found by sweeping through values of the Lasso predictor regularization
parameter λ. Numbers in parenthesis are the number of measures in the
subset. The label '+Jit' refers to a subset including the jitter measure, to
distinguish subsets with the same number of measures. BIC selects the same
subsets for the CART method for both motor UPDRS and total UPDRS, here
the selected subset is labeled by the arrow. Although not shown here, the

50
Akaike Information Criterion (AIC) selected exactly the same optimal subset of
measures. The BIC for the smallest subset of size four, for the CART method,
is off the scale and omitted for clarity. The in-sample error was computed by
taking the average error of the 1,000 runs of the cross-validation of each
training subset (n = 5,331 phonations).

51
Supplementary Fig. 3a
Supplementary Fig. 3a Probability density of the 1,000-runs 10-fold cross-
validation out-of-sample differences between model predicted (U ) and
piecewise linearly interpolated (U) Unified Parkinson's Disease Rating Scale
(UPDRS) values, using Least Squares (LS), Iteratively Reweighted Least
Squares (IRLS) and Classification And Regression Tree (CART) models to
predict motor-UPDRS. The vertical axes are the probability densities of the
regression methods, estimated using kernel density estimation with Gaussian
kernels. The mean absolute prediction error (MAE) of each model is also
quoted, along with the standard deviation. IRLS outperforms the other linear
regression methods, in terms of smallest MAE. The distribution of prediction
errors for the CART method has the smallest spread and is also the most
unimodal. The out-of-sample MAE was computed by taking the average MAE

52
of the 1,000 runs of the cross-validation of each testing subset (n = 592
phonations).

53
Supplementary Fig. 3b
Supplementary Fig. 3b Probability density of the 1,000-runs 10-fold cross-
validation out-of-sample differences between model predicted (U ) and
piecewise linearly interpolated (U) Unified Parkinson's Disease Rating Scale
(UPDRS) values, using Least Squares (LS), Iteratively Reweighted Least
Squares (IRLS) and Classification And Regression Tree (CART) models to
predict total-UPDRS. The vertical axes are the probability densities of the
regression methods, estimated using kernel density estimation with Gaussian
kernels. The mean absolute prediction error (MAE) of each model is also
quoted, along with the standard deviation. IRLS outperforms the other linear
regression methods, in terms of smallest MAE. The distribution of prediction
errors for the CART method has the smallest spread and is also the most
unimodal. The out-of-sample MAE was computed by taking the average MAE

54
of the 1,000 runs of the cross-validation of each testing subset (n = 592
phonations).
55
Table Legends
Table 1: Classical and non-classical dysphonia measures applied to
sustained vowel phonations, and their Unified Parkinson's Disease
Rating Scale (UPDRS) correlations.
KP-MDVP stands for Kay Pentax Multidimensional Voice Program. Classical measures were
obtained using the Praat software package. The Unified Parkinson's Disease Rating Scale
(UPDRS) correlation columns are the Spearman non-parametric correlation coefficient
between each measure and piecewise linearly interpolated motor and total UPDRS. All
measures were statistically significantly correlated (p < 0.0001) with UPDRS. All speech
signals were used to generate these results (n = 5,923 phonations).
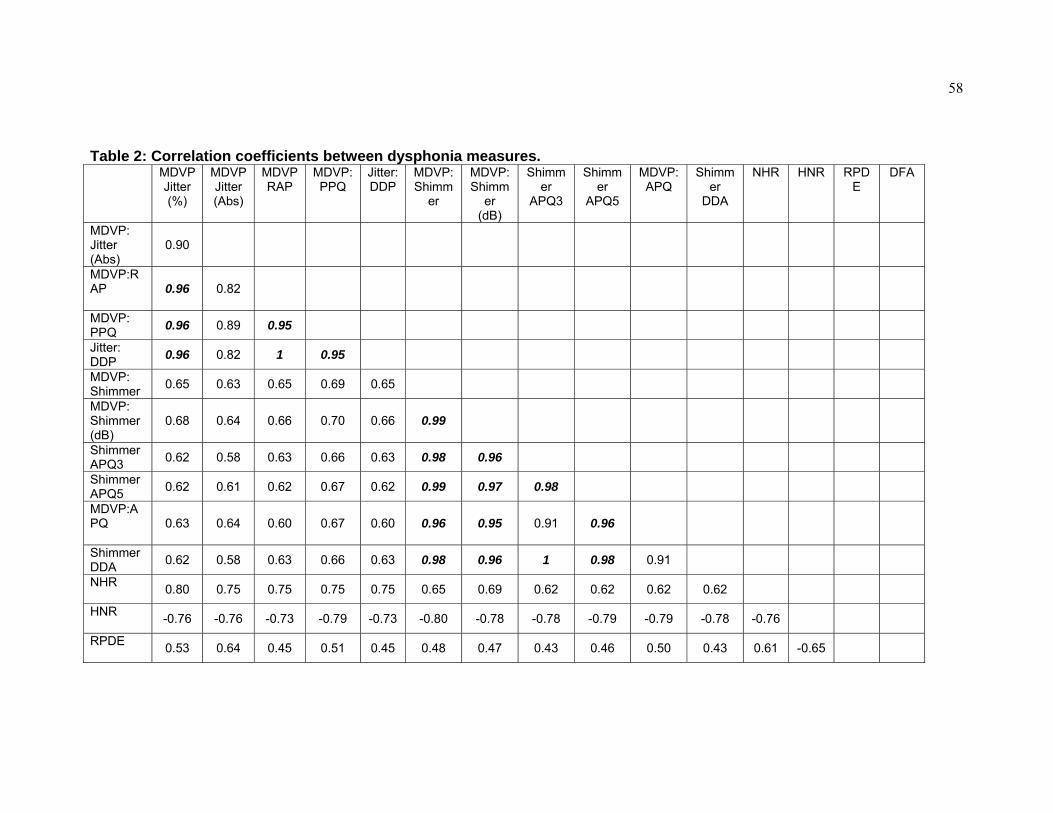
Table 2: Correlation coefficients between dysphonia measures. The correlation columns are the Spearman non-parametric correlation coefficients ρ between
two measures. All measures were statistically significantly correlated (p < 0.0001). Bold italic
entries indicate high correlation between measures (Spearman ρ ≥ 0.95). All speech signals
were used to generate these results (n = 5,923 phonations).
Table 3: Regression coefficients of the three linear methods (LS, IRLS,
Lasso, see text) for all dysphonia measures and piecewise linearly
interpolated motor and total Unified Parkinson's Disease Rating Scale
(UPDRS).
The coefficients in this table are indicative (derived over one run of cross-validation with the
training subset, n = 5,331). We have noticed considerably different values in the 1,000 runs of
10-fold cross validation. However, the fact that the cross-validated test error and test error
standard deviation remained small, suggests that confidence can be assumed for the above
coefficient values.

56
Supplementary Table 1: Subsets of dysphonia measures and out-of-
sample MAE for the Iteratively Reweighted Least Squares (IRLS) and the
Classification And Regression Tree (CART) method.
The particular subsets above were dictated by sweeping the regularization parameter λ in the
Least Absolute Shrinkage and Selection Operator (Lasso) prediction model. The numbers in
parenthesis denote the chosen pruning level of the CART method that minimizes the MAE,
and ± denotes one standard deviation around the quoted MAE. The bold subset is the optimal
subset, minimizing the Bayesian Information Criterion. The out-of-sample MAE was computed
by taking the average MAE of the 1,000 runs of the cross-validation of each testing subset (n
= 592 phonations).

57
TABLE 1 Table 1: Classical and non-classical dysphonia measures applied to sustained vowel phonations, and their Unified Parkinson's Disease Rating Scale (UPDRS) correlations.
Measure Description Motor
UPDRS correlation
Total UPDRS
correlationMDVP: Jitter(%) KP-MDVP jitter as a percentage 0.124 0.125
MDVP: Jitter(Abs) KP-MDVP absolute jitter in microseconds 0.072 0.103
MDVP:RAP KP-MDVP Relative Amplitude Perturbation 0.105 0.107
MDVP:PPQ KP-MDVP five-point Period Perturbation Quotient 0.120 0.117
Jitter:DDP Average absolute difference of differences between cycles, divided by the average period 0.105 0.107
MDVP: Shimmer KP-MDVP local shimmer 0.138 0.139
MDVP: Shimmer(dB) KP-MDVP local shimmer in decibels 0.139 0.139
Shimmer: APQ3 Three point Amplitude Perturbation Quotient 0.116 0.122
Shimmer: APQ5 Five point Amplitude Perturbation Quotient 0.123 0.127
MDVP:APQ KP-MDVP 11-point Amplitude Perturbation Quotient 0.166 0.163
Shimmer: DDA
Average absolute difference between consecutive differences between the amplitudes of consecutive periods
0.116 0.122
NHR Noise-to-Harmonics Ratio 0.131 0.139
HNR Harmonics-to-Noise Ratio -0.159 -0.163
RPDE Recurrence Period Density Entropy 0.112 0.143
DFA Detrended Fluctuation Analysis -0.131 -0.141
PPE Pitch Period Entropy 0.160 0.152
KP-MDVP stands for Kay Pentax Multidimensional Voice Program. Classical measures were obtained using the Praat software package. The Unified Parkinson's Disease Rating Scale (UPDRS) correlation columns are the Spearman non-parametric correlation coefficient between each measure and piecewise linearly interpolated motor and total UPDRS. All measures were statistically significantly correlated (p < 0.0001) with motor-UPDRS and total-UPDRS. All speech signals were used to generate these results (n = 5,923 phonations).
58
Table 2: Correlation coefficients between dysphonia measures. MDVP
Jitter (%)
MDVP Jitter (Abs)
MDVPRAP
MDVP: PPQ
Jitter: DDP
MDVP: Shimm
er
MDVP: Shimm
er (dB)
Shimmer
APQ3
Shimmer
APQ5
MDVP:APQ
Shimmer
DDA
NHR HNR RPDE
DFA
MDVP: Jitter (Abs)
0.90
MDVP:RAP
0.96 0.82
MDVP: PPQ 0.96 0.89 0.95
Jitter: DDP 0.96 0.82 1 0.95
MDVP: Shimmer 0.65 0.63 0.65 0.69 0.65
MDVP: Shimmer (dB)
0.68 0.64 0.66 0.70 0.66 0.99
Shimmer APQ3 0.62 0.58 0.63 0.66 0.63 0.98 0.96
Shimmer APQ5 0.62 0.61 0.62 0.67 0.62 0.99 0.97 0.98
MDVP:APQ
0.63 0.64 0.60 0.67 0.60 0.96 0.95 0.91 0.96
Shimmer DDA 0.62 0.58 0.63 0.66 0.63 0.98 0.96 1 0.98 0.91
NHR 0.80 0.75 0.75 0.75 0.75 0.65 0.69 0.62 0.62 0.62 0.62
HNR -0.76 -0.76 -0.73 -0.79 -0.73 -0.80 -0.78 -0.78 -0.79 -0.79 -0.78 -0.76
RPDE 0.53 0.64 0.45 0.51 0.45 0.48 0.47 0.43 0.46 0.50 0.43 0.61 -0.65

59
DFA 0.44 0.50 0.43 0.48 0.43 0.29 0.27 0.26 0.29 0.31 0.26 0.15 -0.36 0.19
PPE 0.85 0.81 0.77 0.84 0.77 0.64 0.66 0.59 0.62 0.66 0.59 0.73 -0.75 0.55 0.42
The correlation columns are the Spearman non-parametric correlation coefficients ρ between two measures. All measures were statistically significantly correlated (p < 0.0001). Bold italic entries indicate high correlation between measures (Spearman ρ ≥ 0.95). All speech signals were used to generate these results (n = 5,923 phonations).

60
TABLE 3
Table 3: Regression coefficients of the three linear methods (LS, IRLS, Lasso, see text) for all dysphonia measures and piecewise linearly interpolated motor and total Unified Parkinson's Disease Rating Scale (UPDRS).
Measure
Motor UPDRS Least
squares coefficients
Motor UPDRS
Iteratively re-weighted
least squares
coefficients
Motor UPDRS Lasso
coefficients (λ=1)
Total UPDRS Least
squares coefficients
Total UPDRS
Iteratively re-weighted
least squares
coefficients
Total UPDRS Lasso
coefficients (λ=1)
MDVP: Jitter (%)
-87.63 -183.28 -214.45 -768.96 -649.19 -537.90
MDVP: Jitter (Abs)
-6.87·104 -7.64·104 0 -7.04·104 -8.49·104 0
MDVP: RAP
-6.02·104 -6.29·104 0 -2.91·104 -3.36·104 0
MDVP: PPQ
-238.07 -62.70 0 209.26 40.02 50.62
Jitter: DDP
2.02·104 2.12·104 75.59 1.02·104 1.17·104 241.81
MDVP: Shimmer
77.78 100.56 23.81 28.62 114.26 9.58
MDVP: Shimmer (dB)
0.31 -2.49 4.37 -0.38 -4.74 1.67
Shimmer: APQ3
-1.85·104 -2.43·104 0 -8.19·104 -7.24·104 0
Shimmer: APQ5
-108.01 -126.06 -66.68 -93.05 -138.32 -2.75
MDVP: APQ
55.12 83.35 66.28 104.35 107.95 85.74
Shimmer:DDA
6.16·103 8.09·103 -4.97 2.73·104 2.41·104 0
NHR
2.14 -5.04 -7.38 -12.45 -8.21 -17.33
HNR
0.52 0.57 0.61 0.65 0.74 0.74
RPDE
16.62 20.24 15.25 26.21 30.77 23.81

61
DFA
-9.54 -15.43 -12.05 -12.47 -19.73 -14.05
PPE
35.34 37.90 28.50 41.37 39.15 33.41
The coefficients in this table are indicative (derived over one run of cross-validation with the training subset, n = 5,331). We have noticed considerably different values in the 1,000 runs of 10-fold cross validation. However, the fact that the cross-validated test error and test error standard deviation remained small, suggests that confidence can be assumed for the above coefficient values.

62
Supplementary Table 1: Subsets of dysphonia measures and out-of-sample Mean Absolute Error (MAE) for the Iteratively Reweighted Least Squares (IRLS) and the Classification And Regression Tree (CART) method.
Number of
measures Measures used
Testing MAE Motor
UPDRS IRLS
Testing MAE Total
UPDRS IRLS
Testing MAE Motor
UPDRS CART
Testing MAE Total
UPDRS CART
16
MDVP:Jitter (%), MDVP:Jitter(Abs), MDVP: RAP, MDVP:PPQ, Jitter:DDP MDVP:Shimmer, MDVP:Shimmer (dB), Shimmer:APQ3,Shimmer:APQ5, MDVP:APQ, Shimmer:DDA, NHR, HNR RPDE, DFA, PPE
6.71±0.18 8.46±0.27 5.77±0.20 (830)
7.45±0.27 (850)
13
MDVP:Jitter (%), MDVP:PPQ, Jitter:DDP MDVP:Shimmer, MDVP:Shimmer (dB), Shimmer:APQ5, MDVP:APQ, Shimmer:DDA, NHR, HNR RPDE, DFA, PPE
6.73±0.17 8.49±0.25 6.01±0.26 (800)
7.64±0.29 (800)
11
MDVP:Jitter(%),MDVP:Shimmer, MDVP:Shimmer(dB), Shimmer:APQ5, MDVP:APQ, Shimmer:DDA, NHR, HNR RPDE, DFA, PPE
6.74±0.16 8.83±0.26 6.06±0.25 (850)
7.67±0.27 (800)
6 MDVP: Shimmer(dB), NHR, HNR, RPDE, DFA, PPE 6.91±0.17 8.60±0.30 6.08±0.19
(780) 7.75±0.26
(750)
6 MDVP:Jitter(Abs), MDVP:Shimmer, NHR, HNR, DFA, PPE
6.80±0.17 8.47±0.27 5.95±0.19 (780)
7.52±0.25 (780)
5 MDVP:Jitter(Abs), MDVP:Shimmer, HNR, DFA, PPE
6.88±0.17 8.71±0.26 5.96±0.19 (750)
7.59±0.25 (780)
5 MDVP:Shimmer(dB), HNR, RPDE, DFA, PPE 6.79±0.17 8.49±0.26 6.14±0.19
(780) 7.72±0.26
(780)
4 MDVP:Shimmer(dB), HNR, RPDE, PPE 6.91±0.17 8.57±0.26 6.82±0.23
(700) 8.43±0.28
(700)
The particular subsets above were dictated by sweeping the regularization parameter λ in the Least Absolute Shrinkage and Selection Operator (Lasso) prediction model. The numbers in parenthesis denote the chosen pruning level of the CART method that minimizes the MAE, and ± denotes one standard deviation around the quoted MAE. The bold subset is the optimal

63
subset, minimizing the Bayesian Information Criterion. The out-of-sample MAE was computed by taking the average MAE of the 1,000 runs of the cross-validation of each testing subset (n = 592 phonations).
Related Documents

![More than Telemonitoring [JMIR2015]](https://static.cupdf.com/doc/110x72/58ecd3931a28ab72278b4597/more-than-telemonitoring-jmir2015.jpg)


![Telemonitoring of Wind Turbines[1]](https://static.cupdf.com/doc/110x72/577d29731a28ab4e1ea6d22a/telemonitoring-of-wind-turbines1.jpg)


