sensors Article Accurate Indoor-Positioning Model Based on People Effect and Ray-Tracing Propagation Firdaus Firdaus 1,2, *, Noor Azurati Ahmad 1, * and Shamsul Sahibuddin 1 1 Razak Faculty of Technology and Informatics, Universiti Teknologi Malaysia, Kuala Lumpur 54100, Malaysia; [email protected] 2 Department of Electrical Engineering, Universitas Islam Indonesia, Yogyakarta 55584, Indonesia * Correspondence: fi[email protected] (F.F.); [email protected] (N.A.A.); Tel.: +62-812-2067-5454 (F.F.); +60-12-214-5045 (N.A.A.) Received: 17 October 2019; Accepted: 11 December 2019; Published: 15 December 2019 Abstract: Wireless local area networks (WLAN)-fingerprinting has been highlighted as the preferred technology for indoor positioning due to its accurate positioning and minimal infrastructure cost. However, its accuracy is highly influenced by obstacles that cause fluctuation in the signal strength. Many researchers have modeled static obstacles such as walls and ceilings, but few studies have modeled the people’s presence effect (PPE), although the human body has a great impact on signal strength. Therefore, PPE must be addressed to obtain accurate positioning results. Previous research has proposed a model to address this issue, but these studies only considered the direct path signal between the transmitter and the receiver whereas multipath effects such as reflection also have a significant influence on indoor signal propagation. This research proposes an accurate indoor-positioning model by considering people’s presence and multipath using ray-tracing, we call it (AIRY). This study proposed two solutions to construct AIRY: an automatic radio map using ray tracing and a constant of people’s effect for the received signal strength indicator (RSSI) adaptation. The proposed model was simulated using MATLAB software and tested at Level 3, Menara Razak, Universiti Teknologi Malaysia. A K-nearest-neighbor (KNN) algorithm was used to define a position. The initial accuracy was 2.04 m, which then reduced to 0.57 m after people’s presence and multipath effects were considered. Keywords: indoor positioning; WLAN fingerprint; people effect; ray-tracing 1. Introduction Indoor-positioning system (IPS)-based services have great economic potential—Estimated to reach a market value of US$ 10 billion in 2020 [1]. According to a Research and Markets report, the global indoor-positioning and navigation market is expected to reach $54.60 billion by 2026 [2]. IPS utilizes many existing technologies such as radio frequencies (RFs) [3], magnetic fields [4], acoustic signals, and thermal [5], optical [6] or other sensory information collected using a mobile device (MD) [7]. The RF technology used in IPS include WLAN/Wi-Fi [8,9], Bluetooth [10], Zig Bee [11], Radio-frequency identification (RFID) [12], frequency modulation (FM) [13], and ultra-wideband (UWB) [14]. Indoor positioning can be classified into device-based and device-free. On device-based systems, users need a device to know their position, such as smartphone-based and tag-based indoor positioning [15]. Instead of a device-free system, the user does not need a device to know his position. Users here can be people or objects. Device-free localization based on signal strength (received signal strength indicator, RSSI) has three main techniques: fingerprinting, link-based, and radio tomographic imaging. From the user side, device-free is more practical. However, from the system side, it will be more complex, for example it takes 6 to 20 transceiver nodes for fingerprinting techniques, Sensors 2019, 19, 5546; doi:10.3390/s19245546 www.mdpi.com/journal/sensors

Welcome message from author
This document is posted to help you gain knowledge. Please leave a comment to let me know what you think about it! Share it to your friends and learn new things together.
Transcript

sensors
Article
Accurate Indoor-Positioning Model Based on PeopleEffect and Ray-Tracing Propagation
Firdaus Firdaus 1,2,*, Noor Azurati Ahmad 1,* and Shamsul Sahibuddin 1
1 Razak Faculty of Technology and Informatics, Universiti Teknologi Malaysia,Kuala Lumpur 54100, Malaysia; [email protected]
2 Department of Electrical Engineering, Universitas Islam Indonesia, Yogyakarta 55584, Indonesia* Correspondence: [email protected] (F.F.); [email protected] (N.A.A.);
Tel.: +62-812-2067-5454 (F.F.); +60-12-214-5045 (N.A.A.)
Received: 17 October 2019; Accepted: 11 December 2019; Published: 15 December 2019�����������������
Abstract: Wireless local area networks (WLAN)-fingerprinting has been highlighted as the preferredtechnology for indoor positioning due to its accurate positioning and minimal infrastructure cost.However, its accuracy is highly influenced by obstacles that cause fluctuation in the signal strength.Many researchers have modeled static obstacles such as walls and ceilings, but few studies havemodeled the people’s presence effect (PPE), although the human body has a great impact on signalstrength. Therefore, PPE must be addressed to obtain accurate positioning results. Previous researchhas proposed a model to address this issue, but these studies only considered the direct pathsignal between the transmitter and the receiver whereas multipath effects such as reflection alsohave a significant influence on indoor signal propagation. This research proposes an accurateindoor-positioning model by considering people’s presence and multipath using ray-tracing, we callit (AIRY). This study proposed two solutions to construct AIRY: an automatic radio map using raytracing and a constant of people’s effect for the received signal strength indicator (RSSI) adaptation.The proposed model was simulated using MATLAB software and tested at Level 3, Menara Razak,Universiti Teknologi Malaysia. A K-nearest-neighbor (KNN) algorithm was used to define a position.The initial accuracy was 2.04 m, which then reduced to 0.57 m after people’s presence and multipatheffects were considered.
Keywords: indoor positioning; WLAN fingerprint; people effect; ray-tracing
1. Introduction
Indoor-positioning system (IPS)-based services have great economic potential—Estimated to reacha market value of US$ 10 billion in 2020 [1]. According to a Research and Markets report, the globalindoor-positioning and navigation market is expected to reach $54.60 billion by 2026 [2]. IPS utilizesmany existing technologies such as radio frequencies (RFs) [3], magnetic fields [4], acoustic signals,and thermal [5], optical [6] or other sensory information collected using a mobile device (MD) [7].The RF technology used in IPS include WLAN/Wi-Fi [8,9], Bluetooth [10], Zig Bee [11], Radio-frequencyidentification (RFID) [12], frequency modulation (FM) [13], and ultra-wideband (UWB) [14].
Indoor positioning can be classified into device-based and device-free. On device-based systems,users need a device to know their position, such as smartphone-based and tag-based indoorpositioning [15]. Instead of a device-free system, the user does not need a device to know hisposition. Users here can be people or objects. Device-free localization based on signal strength (receivedsignal strength indicator, RSSI) has three main techniques: fingerprinting, link-based, and radiotomographic imaging. From the user side, device-free is more practical. However, from the system side,it will be more complex, for example it takes 6 to 20 transceiver nodes for fingerprinting techniques,
Sensors 2019, 19, 5546; doi:10.3390/s19245546 www.mdpi.com/journal/sensors

Sensors 2019, 19, 5546 2 of 27
whereas with the same technique device-based only requires 3 transmitters. In fact the number oftransmitters (access points, APs) available in a building is limited.
Fingerprinting techniques can be applied to device-based and device-free systems. On device-freesystems, a number of nodes (transceivers) will be installed on the building. Then each node will recordthe RSSI emitted by other nodes and forward the data to the computer for the positioning process.On device-based systems, the device held by the user will record RSSI from several transmitters inthe building and can use the same device to determine its position. WLAN fingerprinting can workeither based on measurements of the RSSI or of the channel state information (CSI). CSI-based signalfingerprinting provides better accuracy [16]. However among many devices available on the market,CSI is only available on a few devices using modified drivers.
Another thing to consider is that if there are many users whose locations will be detected, thedevice-free system will find it difficult to identify each user and his position. On the contrary, it is quiteeasy for device-based. The fact is that almost everyone has a smartphone now, so it is easy to applydevice-based localization.
WLAN technology is normally used in IPS because radio waves can pass through obstacles such asfloors, walls, ceilings, and human bodies. Hence, a WLAN positioning system could be implementedover a wide coverage area because it does not need any additional devices.
WLAN IPS has been highlighted as a preferred technology indoors due to its accurate positioningresults and minimal infrastructure cost [17]. WLAN is a wireless local network standard (IEEE 802.11)that is supported by most mobile phones. However, the WLAN signal is greatly influenced byenvironmental conditions, which could decrease the accuracy. Examples of obstacles that can causefluctuations in RSSI are walls, ceilings, and/or people [18,19]. Walls and ceilings have been discussedin depth in past studies [20–22]. People’s effect on signal strengths at band waves of 60 GHz, [23],18–22 GHz, and [24] 2.4 GHz has also been investigated in past studies [25].
The movement of humans in wireless networks is one of the major causes of significant RSSIvariation [26,27]. Iyad [28] presented an experiment to show that people’s presence between the accesspoint (AP) and the mobile device (MD) reduced the RSSI by 2 dBm to 5 dBm. This decline in RSSIcould result in a position error of more than 2 m. However, Iyad [28] only discussed the effect ofone or two people on the RSSI and used a single path signal propagation model to analyze RSSI.Nevertheless, multipath signals such as reflections also have a significant effect on indoor propagation.One of the signal propagation models that have considered the multipath effect is the ray-tracingmodel. Because this model accounts for the effect of people’s presence and multipath propagation, it isa high-accuracy IPS.
2. Related Works
Location-detection techniques in IPS can be categorized into three general categories: Proximity,triangulation, and fingerprinting. WLAN-based RSSI fingerprinting was chosen in this research becausethis technique can provide highly accurate position estimation at minimum cost. Minimum cost, in thiscase, indicates that no extra devices are needed to implement the technique. The fingerprinting patternrecognition is done by combining RF with location information. WLAN fingerprinting is done in2 phases: offline and online.
In the offline phase, a site survey is done to get the vectors of the received signal strength indicator(RSSI) from all the detected access points (APs) at many reference points (RPs) of certain locations.This data forms the radio map (RM) database. In the online phase, a user samples or measures anRSSI vector at his/her position. Then, the system compares the RSSI vector with the RM database.The position is therefore estimated based on the RSSI vector that is most similar to the RM database [19].
2.1. Radio Map Construction
Constructing a manual radio map in the offline step is a time-consuming process, especially in largeurban areas, as the RSSI value has to be collected at each point in a building [29,30]. Automatic radio
Sensors 2019, 19, 5546 3 of 27
map generation was thus developed to reduce the time required for this process [31–33]. Du, Yang, andXiu [32] proposed RSSI geography weighted regression (RGWR) to solve the problem of fingerprintdatabase construction. However, this method requires modified WLAN AP and anchors, so it is lesspractical and incurs high cost because it requires an additional device. Lin [33] and Ferris [34] proposedan unsupervised simultaneous localization and mapping (SLAM) system for automatic floor map andradio map construction. Lin’s [33] solution, however, only works for room-scale indoor positioning anddepends on crowd-sourced data from users to complete missing parts of the floor map and to updatethe radio map. Ferris [34] proposed a novel technique for solving the Wi-Fi SLAM problem using theGaussian process latent variable model (GPLVM) to determine the latent-space locations of unlabeledsignal strength data. The mean localization error is still quite high 3.97 ± 0.59 m. Then Shen et al. [35]proposed an indoor pathway mapping system that can automatically reconstruct internal pathwaymaps of buildings without any a-priori knowledge about the building, such as the floor plan or accesspoint locations. The experiments demonstrate that Walkie-Markie is able to reconstruct a high-qualitypathway map for a real office-building floor after only 5–6 rounds of walks, with accuracy graduallyimproving as more user data becomes available. The average and 90 percentile localization errors are1.65 m and 2.9 m.
A hybrid mechanism that combines manual data collection and user collaboration was proposedby Kim [36] and Suining [37]. Kim’s [36] solution was able to reduce the time and manpower neededto generate the RM database, but the accuracy of the system is strongly influenced by the accuracy ofthe pedestrian dead reckoning (PDR). Suining proposed a new mechanism, called BCCS (BayesianCompressive Crowdsensing), by combining crowdsourcing and bayesian compressive sensing toincentivize the signal map construction. BCCS infers the missing values during sparse crowdsensingand reduces the platform sensing cost. However the RSSI error is still quite high 4.5 dB and thelocalization error is 5 m (Cumulative distribution function (CDF) 80%). Zhuang [38] attempted toimprove the performance of the system by implementing a trusted portable navigator (T-PN) todevelop a radio map automatically. However, this solution still requires an additional device andreturned quite a high error. Gu, Chen, and Zhang [39] further reduced the efforts to collect fingerprintdata. Their study reduced the time for collecting the fingerprint, but still yielded quite high errors.The results showed that when sparsity rank singular value decomposition (SRSVD) was used based on5% of the original data, the error rate was 14%. Jingxue et al. [40] proposed a fast construction methodusing adaptive path loss model interpolation.
In 2017, Iyad [31] used a multi-wall signal path loss model to generate a radio map automatically.The model, however, had to incorporate knowledge of the environmental layout and AP locationinformation. The model could quickly generate a radio map, but it only considered the direct signalfrom the transmitter (AP) to the receiver (MD), although indirect signals such as reflection also have asignificant influence on indoor signal propagation. This research proposes a propagation model thataccounts for multipath effects, namely the ray-tracing model, to obtain a more accurate radio map toimprove IPS accuracy.
The matching process uses a positioning algorithm that includes deterministic [41] and probabilisticmethods [42]. The probabilistic approach is based on probability methods, such as Naïve-Bayes tocompute the probability characteristics of RM instances to find the best-matched fingerprint todetermine the current location of MD. On the other hand, the deterministic approach uses scalarvalues, such as mean or median values, and non-probabilistic methods to determine the currentlocation of the MD. Some examples of deterministic approaches are the K-nearest-neighbor (KNN); theartificial neural network (ANN); and support vector machine (SVM). The deterministic approach iswell-established and requires less computational cost since it does not require a large RM as comparedto the probabilistic approach.
KNN is a simple and powerful classifier [43]. The algorithm validates the distances in a signalspace from the current fingerprint to the fingerprints in the RM database. It also selects the k-nearestpositions. The Weighted-KNN (WKNN) technique is used to weigh the influence of each of the closest
Sensors 2019, 19, 5546 4 of 27
k-neighbors based on its distance from the query instance [44]. KNN based on the fingerprintingapproach is widely used in indoor localization systems due to its high localization accuracy. It isvery simple and fast because it compares an online instance with training dataset entries. Therefore,this research was conducted using the deterministic approach and KNN was adopted as the positioningalgorithm because of its simplicity and high accuracy, besides requiring minimum computationalpower and time.
2.2. People Presence Effect
Many studies have modeled static obstacles such as walls and ceilings, but few have modeled theeffect of people presence. Human bodies absorb, reflect, and diffract WLAN signals, which could affectthe value of RSSI. Thus, if offline mapping were performed with no or few people and positioningwere performed with many people, the system could lose reliability. The results of past studies haveshown that, on average, the presence of human bodies increased the error rate by 11% regardless of thealgorithm used [45].
The human activity around MS affects WLAN signal strength [26]. One past study observeda relationship between the fluctuations in RSSI and people activity within a WLAN coverage area.This relationship can be used to build better human detection and tracking systems [27]. Koda et al. [46]measured the attenuation of IEEE 802.11ad WLAN signals in a 60 GHz band caused by humanblockage. Subsequently, Slezak et al. [25] conducted empirical studies of human-body blockage inmm-Wave communications.
Booranawong et al. [26] proposed well-known filtering methods (i.e., the moving average andthe exponentially weighted moving average filters) and the span thresholding filter to reduce RSSIvariations and obtained an estimated position error because of human movement. Unfortunately,the size of the room used for the test was quite small and the error was still above 1 m.
Iyad et al. [28] presented an experiment and found that people’s presence between the AP and theMD reduced the received signal strength by −2 dBm to −5 dBm. Following that, Iyad et al. [47] alsoperformed other experiments to prove that the effect of human presence could be determined basedon the distance between the MD and the people, also termed as the influence distance. Both studiesexplained the effect of people presence around the MD on RSSI and attempted to determine this effecton the quality of IPS. The result was improved positioning accuracy from 1.9 m to 1.7 m. Although thetechnique succeeded in improving accuracy, it still needs further research to obtain significant accuracyimprovements. Iyad [47] subsequently used a multi-wall propagation model that only focuses onsignals directly from the transmitter to the receiver. This current research proposes new techniquesthat consider the multipath effect such as reflection to overcome radio map generation and the issuesof the people presence effect (PPE), to obtain a signal accuracy of less than 1 m.
3. Materials and Methods
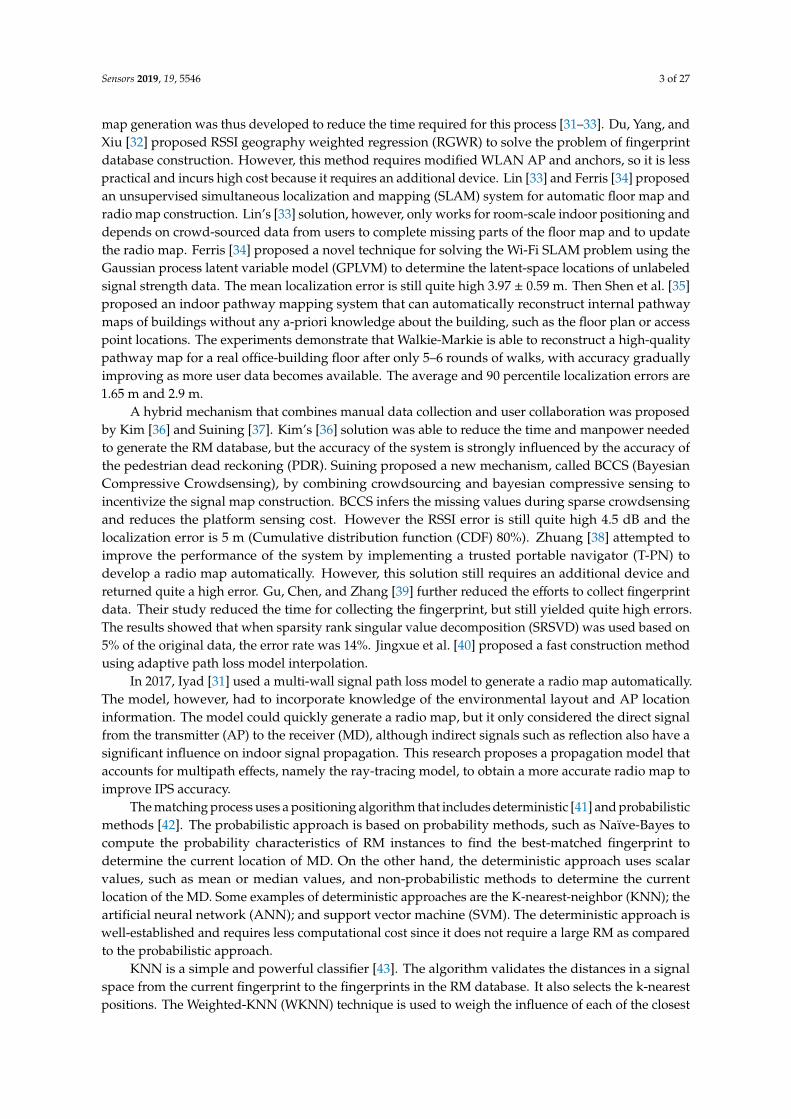
The proposed model, an accurate IPS based on people effect and ray-tracing propagation (AIRY),is outlined in Figure 1. This model was derived from the basic IPS fingerprinting model with someadditional features added to overcome the issues explained in the previous section. The first additionalfeature is an automatic radio map generator using ray-tracing (ARM-RT) to solve the time-consumingproblem of manual radio map construction. ARM-RT can provide a fast and accurate radio map.The second additional feature is RSSI adaptation to solve the fluctuation of RSSI due to PPE to enhancethe accuracy of the IPS.
In the offline stage, an automatic radio map is created using a ray-tracing propagation model.The input is a map of the building, the AP location (x, y, z), and the transmittance power of each AP.In this study, 3 APs with 2.9 m height were used. There are only 3 APs on the whole floor (80 × 16 m)of level 3 Menara Razak, but the detected Wi-Fi signal on the 3rd floor can be up to 6 SSID that comefrom other floors. The system was selected 3 APs based on their MAC address. Then, the locationestimation was done in the online stage. This process was done by matching the initial RSSI vector
Sensors 2019, 19, 5546 5 of 27
measured by the user at a specific position with the RSSI vectors in the RM database [19]. The KNNalgorithm was adopted as the fingerprint matching algorithm because of its acceptable accuracy andits relevance with the limitations of mobile devices [48].
The KNN algorithm requires two parameters: (1) “k”, which is the number of the considerednearest neighbors, and (2) the distance function. The distance function was set to the Euclideandistance, while “k” was set to a value of 3 to get the best accuracy [48]. The output of this process isan initial location estimation, which is still less accurate because it has not incorporated the effectsof people around the user. Thus, if offline mapping were performed with a few people followed bypositioning with many people, the system could lose reliability. To improve accuracy, the next stepmust incorporate the conditions around the initial position, especially the people around the initialposition. Based on the position of people around the MD, an RSSI adaptation process was appliedto the RSSI vectors to produce adapted RSSI vectors (ARV). Then, the ARV was matched with theRM, as per the previous process using the KNN algorithm. As a result, accurate position estimationsare obtained.
The adopted methodology of this research is shown in Figure 2, consisting of 5 steps, startingfrom the development of a manual radio map until the validation of the proposed model.
Sensors 2020, 20, x FOR PEER REVIEW 5 of 26
The KNN algorithm requires two parameters: (1) “k”, which is the number of the considered
nearest neighbors, and (2) the distance function. The distance function was set to the Euclidean
distance, while “k” was set to a value of 3 to get the best accuracy [48]. The output of this process is
an initial location estimation, which is still less accurate because it has not incorporated the effects of
people around the user. Thus, if offline mapping were performed with a few people followed by
positioning with many people, the system could lose reliability. To improve accuracy, the next step
must incorporate the conditions around the initial position, especially the people around the initial
position. Based on the position of people around the MD, an RSSI adaptation process was applied to
the RSSI vectors to produce adapted RSSI vectors (ARV). Then, the ARV was matched with the RM,
as per the previous process using the KNN algorithm. As a result, accurate position estimations are
obtained.
The adopted methodology of this research is shown in Figure 2, consisting of 5 steps, starting
from the development of a manual radio map until the validation of the proposed model.
Figure 1. The proposed model for accurate indoor positioning considering the people effect and
multipath signal propagation (AIRY).
Figure 1. The proposed model for accurate indoor positioning considering the people effect andmultipath signal propagation (AIRY).

Sensors 2019, 19, 5546 6 of 27Sensors 2020, 20, x FOR PEER REVIEW 6 of 26
Figure 2. Method of research.
3.1. The Development of a Manual Radio Map (MRM)
The first step is the development of a manual radio map (MRM) database. The goal of this step
is to build a testing set that will be used to calibrate and validate the proposed solution of this
research. This step uses a Wi-Fi scanner Android application to collect information (MAC address
and RSSI) from the IEEE 802.11 beacon frames broadcasted by the APs.
Data were recorded at points separated by a distance of 1 m. A total of 30 RSSIs were recorded
at each point and the median value taken as the radio map data. Data retrieval was undertaken
when there were no people around the MD. The collected RSSI and location data were then stored in
a Microsoft Excel file, which was later used for simulation and computing in MATLAB software. The
location of the study was Level 3 of Menara Razak, Universiti Teknologi Malaysia Kuala Lumpur
(size of 80 m × 16 m).
The RSSI measurement procedure is the mobile device fixed on a tripod in all experiments. The
MD height is 1 m above the floor. Then the experimenter walked away about 10 m from the MD
when measuring each point. The experimenter pressed the button on the android application used
to record RSSI. There is a time delay feature in the application before starting the RSSI recording so
that there is time for the experimenter to walk away from the MD. After the RSSI recording is
finished there is a beep sound so the experimenter knows when he can return to the MD.
3.2. The Development of an Automatic Radio Map Using Ray Tracing (ARM-RT)
The second step involves the development of an automatic radio map using a ray-tracing
propagation model (ARM-RT). The details of this device and the process of ARM-RT construction
are shown in Figure 3. The inputs are a map of the building, information on material type, relative
permittivity, transmitter location (AP) in (x, y, z), the transmit power of AP, and the receiver (MD)
height. The output is the RSSI for all rooms, where the RSSI is calculated using a ray-tracing model at
every 1 m distance, the same position as that of MRM. Then, the RRSI, which is the output of the
modeling, was compared with MRM and an automatic radio map using a multi-wall model
(ARM-MW) as per Iyad [48] was constructed using mean squared error (MSE).
Figure 2. Method of research.
3.1. The Development of a Manual Radio Map (MRM)
The first step is the development of a manual radio map (MRM) database. The goal of this step isto build a testing set that will be used to calibrate and validate the proposed solution of this research.This step uses a Wi-Fi scanner Android application to collect information (MAC address and RSSI)from the IEEE 802.11 beacon frames broadcasted by the APs.
Data were recorded at points separated by a distance of 1 m. A total of 30 RSSIs were recordedat each point and the median value taken as the radio map data. Data retrieval was undertakenwhen there were no people around the MD. The collected RSSI and location data were then storedin a Microsoft Excel file, which was later used for simulation and computing in MATLAB software.The location of the study was Level 3 of Menara Razak, Universiti Teknologi Malaysia Kuala Lumpur(size of 80 m × 16 m).
The RSSI measurement procedure is the mobile device fixed on a tripod in all experiments.The MD height is 1 m above the floor. Then the experimenter walked away about 10 m from the MDwhen measuring each point. The experimenter pressed the button on the android application used torecord RSSI. There is a time delay feature in the application before starting the RSSI recording so thatthere is time for the experimenter to walk away from the MD. After the RSSI recording is finished thereis a beep sound so the experimenter knows when he can return to the MD.
3.2. The Development of an Automatic Radio Map Using Ray Tracing (ARM-RT)
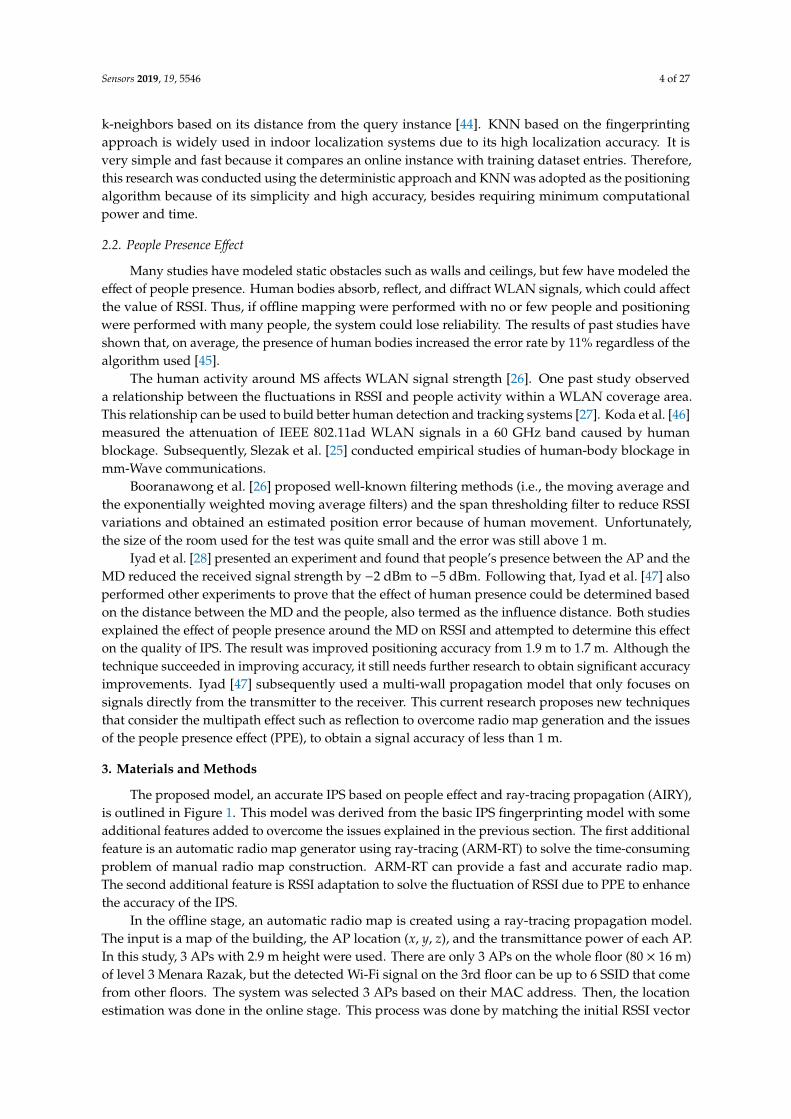
The second step involves the development of an automatic radio map using a ray-tracingpropagation model (ARM-RT). The details of this device and the process of ARM-RT constructionare shown in Figure 3. The inputs are a map of the building, information on material type, relativepermittivity, transmitter location (AP) in (x, y, z), the transmit power of AP, and the receiver (MD)height. The output is the RSSI for all rooms, where the RSSI is calculated using a ray-tracing modelat every 1 m distance, the same position as that of MRM. Then, the RRSI, which is the output of themodeling, was compared with MRM and an automatic radio map using a multi-wall model (ARM-MW)as per Iyad [48] was constructed using mean squared error (MSE).
Sensors 2019, 19, 5546 7 of 27Sensors 2020, 20, x FOR PEER REVIEW 7 of 26
Figure 3. Process diagram of automatic radio map generator using ray-tracing (ARM-RT)
development.
The ray-tracing (RT) method was based on ray optics, which solves Maxwell’s equations in the
high-frequency regime. Thus, the RT method is a general propagation modeling tool that provides
estimates of path loss, the angle of arrival/departure, and time delays [49]. The RT model was
initially applied in optical propagation models. The RT model is based on the ray-optic
approximation of the propagating field [50] and the uniform theory of diffraction (UTD) [51].
Following that, RT started to be applied in the field of radio propagation in the early 1990s [52]. RT is
used for received signal strength (RSS) prediction in urban [53] and indoor environments [54].
The RT technique is an approach that can obtain channel characteristics by identifying the
contributions of individual multipath components and then calculating their composition at the
receiver, as outlined in Equation (1) [55].
E⃗⃗ r = E⃗⃗ 0 {∏R̿i} {∏T̿i} {∏e−jβ0li} SF (1)
E̅0 is the field on the unit sphere; ∏ R̿i and ∏ T̿i are, respectively, the reflection and
transmission coefficient dyads along the whole ray path; ∏e−jβoli is the product of the propagation
phase variations of this ray contribution starting from the unit sphere; and SF = √A0 √Ar⁄ is the
spreading factor. Additionally, A0, and Ar are the cross-sectional areas at the unit sphere and the
receiver point, respectively [56].
The dielectric properties of the materials affect the field strength of the propagation paths.
Permittivity is one of the main material qualities that is important to consider in RT. Permittivity is
typically denoted by ε. Permittivity is a measure of how much the molecules in a material oppose
the external E-field. Ray tracing uses relative permittivity (εr) or a dielectric constant. The
permittivity of a medium is expressed as the product of the dielectric constant and free space
permittivity (ε0). Each material, including human tissue, has a different relative permittivity value.
The relative permittivity of building materials is listed in Table 1.
Table 1. Material properties used for ray tracing [57].
Material Relative Permittivity (Ɛ𝒓)
Brick wall 5.86
Reinforced concrete 7.00
Wooden door 2.58
Window 6.38
Wooden floor 2.58
Ceiling 5.86
The building map image file was first changed to csv file format containing the coordinate of
each wall, floor, ceiling, as well as relative permittivity value. The server then calculated the RSSI
using MATLAB by running the ray-tracing model and storing the ARM-RT database. Relative
permittivity values were referred from the databases of previous studies (Table 1). The procedures
started with writing the program script based on the ray-tracing propagation model then by
Figure 3. Process diagram of automatic radio map generator using ray-tracing (ARM-RT) development.
The ray-tracing (RT) method was based on ray optics, which solves Maxwell’s equations in thehigh-frequency regime. Thus, the RT method is a general propagation modeling tool that providesestimates of path loss, the angle of arrival/departure, and time delays [49]. The RT model was initiallyapplied in optical propagation models. The RT model is based on the ray-optic approximation of thepropagating field [50] and the uniform theory of diffraction (UTD) [51]. Following that, RT startedto be applied in the field of radio propagation in the early 1990s [52]. RT is used for received signalstrength (RSS) prediction in urban [53] and indoor environments [54].
The RT technique is an approach that can obtain channel characteristics by identifying thecontributions of individual multipath components and then calculating their composition at thereceiver, as outlined in Equation (1) [55].
→
Er =→
E0
{∏ =Ri
}{∏=Ti
}{∏e−jβ0li
}SF (1)
E0 is the field on the unit sphere;∏ =
Ri and∏=
Ti are, respectively, the reflection and transmissioncoefficient dyads along the whole ray path;
∏e−jβoli is the product of the propagation phase variations
of this ray contribution starting from the unit sphere; and SF =√
A0/√
Ar is the spreading factor.Additionally, A0, and Ar are the cross-sectional areas at the unit sphere and the receiver point,respectively [56].
The dielectric properties of the materials affect the field strength of the propagation paths.Permittivity is one of the main material qualities that is important to consider in RT. Permittivity istypically denoted by ε. Permittivity is a measure of how much the molecules in a material oppose theexternal E-field. Ray tracing uses relative permittivity (εr) or a dielectric constant. The permittivityof a medium is expressed as the product of the dielectric constant and free space permittivity(ε0). Each material, including human tissue, has a different relative permittivity value. The relativepermittivity of building materials is listed in Table 1.
Table 1. Material properties used for ray tracing [57].
Material Relative Permittivity (εr)
Brick wall 5.86Reinforced
concrete 7.00
Wooden door 2.58Window 6.38
Wooden floor 2.58Ceiling 5.86
The building map image file was first changed to csv file format containing the coordinate of eachwall, floor, ceiling, as well as relative permittivity value. The server then calculated the RSSI usingMATLAB by running the ray-tracing model and storing the ARM-RT database. Relative permittivity

Sensors 2019, 19, 5546 8 of 27
values were referred from the databases of previous studies (Table 1). The procedures started withwriting the program script based on the ray-tracing propagation model then by defining the layoutand parameters of the building; running the simulation; and comparing it to MRM by calculatingmean squared error (MSE). The pseudocode of the ray-tracing propagation model is presented inAlgorithm 1.
Algorithm 1: Automatic Radio Map Ray-Tracing (ARM-RT) Generation
Input: Building Map, Relative Permittivity List, AccessPoint ListOutput: Automatic Radio Map Ray Tracing(ARMRT)
1: De f ining a Finite Panel (Walls)2: 3D Formation o f the Structure3: Calculating Fresnel Coe f f icients f or Walls4: For i← 1 to size (wall.xyz1, 1) do5: f ind re f lection and transmission Fresnel coe f f icient f or each wall6: End For7: Meshing the Boundary Volume and Assign the RX height8: Calculating the Distance o f TX(s) f rom every mesh node RXi9: For i← 1 to do10: f ind the distance11: End For12: Equating the Panels (Walls) in 3D13: f inding the projection o f TX on each panel14: calculating the re f lection (mirror) o f TX across each panel15: Calculating the 2nd Image o f TX across each wall16: Calculating LOS Components17: Calculating Multipath & Re f lection Components18: f ind the re f lection coe f f icient19: count the walls between re f lection paths20: f ind the antenna gain and beam departure angle21: calculating the angle o f arrival22: f ind the walls between TX and the re f lection point23: f ind f inite walls between re f lection point and RX24: f ind the number o f walls between re f lection paths25: calculate the received signal at RX f rom the re f lection point on wall j26: calculate 2nd re f lection27: Drawing the Maps28: LOS Propagation Map Only (a)29: 1st Re f lection Propagation Map Only (b)30: 2nd Re f lection Propagation Map Only (c)31: LOS and Propagation Map = a + b + c32: Return ARMRT
Information on the building layout and type of material used is required to run ray-tracingsimulations. The building layout is given in Figure 4 while the type of material is described in Table 2.Then the parameters of ray-tracing simulation in Matlab is shown in Table 3.

Sensors 2019, 19, 5546 9 of 27Sensors 2020, 20, x FOR PEER REVIEW 9 of 26
Figure 4. The layout of the walls on Razak Tower Level 3.
Table 2. The material of the walls on Level 3 of Razak Tower.
Walls Material
1, 3, 5, 10, 12, 18–20, 27–28, 40 Brick
2, 4, 6–8, 22–23, 41 Glass
9, 11, 13–17, 21, 24–26, 29–39 Particleboard
Table 3. Parameters of the ray-tracing model simulation.
Parameters Value
Frequency 2.4 GHz
Method Image Method
Multipath Transmission,
1st and 2nd Reflections
Transmit power –30 dBm
The shape, size, and relative permittivity value of each wall, floor, and ceiling were defined
according to the type of material used to construct them. The ray-tracing method is based on ray
optics, which solves Maxwell’s equations in the high-frequency regime. Thus, the ray-tracing
method is a general propagation modeling tool that provides estimates of path loss, the angle of
arrival/departure, and time delays [49]. The ray-tracing technique has been verified in numerous
past works as a promising method for indoor radio propagation modeling. The RT model is a good
solution to provide an accurate, site-specific field prediction and multidimensional characterization
of the radio propagation channel in the time, space, and polarization domains. This is because the
model has an intrinsic capability to simulate multipath propagation [58].
The image method was used for the ray-tracing model in the current simulation. RT considers
transmission and reflections to predict RSSI. Although using three reflection rays is not an important
contributor to signal strength [52]; when considering more than 2 reflections, up to 6, the signal
strength changes by only 1 dB, but the complexity and execution time increase exponentially [59].
Therefore, two reflection rays were used in the current simulation. The detail of the parameters used
in the simulation is listed in Table 4.
Figure 4. The layout of the walls on Razak Tower Level 3.
Table 2. The material of the walls on Level 3 of Razak Tower.
Walls Material
1, 3, 5, 10, 12, 18–20, 27–28, 40 Brick
2, 4, 6–8, 22–23, 41 Glass
9, 11, 13–17, 21, 24–26, 29–39 Particleboard
Table 3. Parameters of the ray-tracing model simulation.
Parameters Value
Frequency 2.4 GHzMethod Image Method
Multipath Transmission,1st and 2nd Reflections
Transmit power −30 dBm
The shape, size, and relative permittivity value of each wall, floor, and ceiling were definedaccording to the type of material used to construct them. The ray-tracing method is based on ray optics,which solves Maxwell’s equations in the high-frequency regime. Thus, the ray-tracing method is ageneral propagation modeling tool that provides estimates of path loss, the angle of arrival/departure,and time delays [49]. The ray-tracing technique has been verified in numerous past works as a promisingmethod for indoor radio propagation modeling. The RT model is a good solution to provide an accurate,site-specific field prediction and multidimensional characterization of the radio propagation channelin the time, space, and polarization domains. This is because the model has an intrinsic capability tosimulate multipath propagation [58].
The image method was used for the ray-tracing model in the current simulation. RT considerstransmission and reflections to predict RSSI. Although using three reflection rays is not an importantcontributor to signal strength [52]; when considering more than 2 reflections, up to 6, the signal strengthchanges by only 1 dB, but the complexity and execution time increase exponentially [59]. Therefore,
Sensors 2019, 19, 5546 10 of 27
two reflection rays were used in the current simulation. The detail of the parameters used in thesimulation is listed in Table 4.
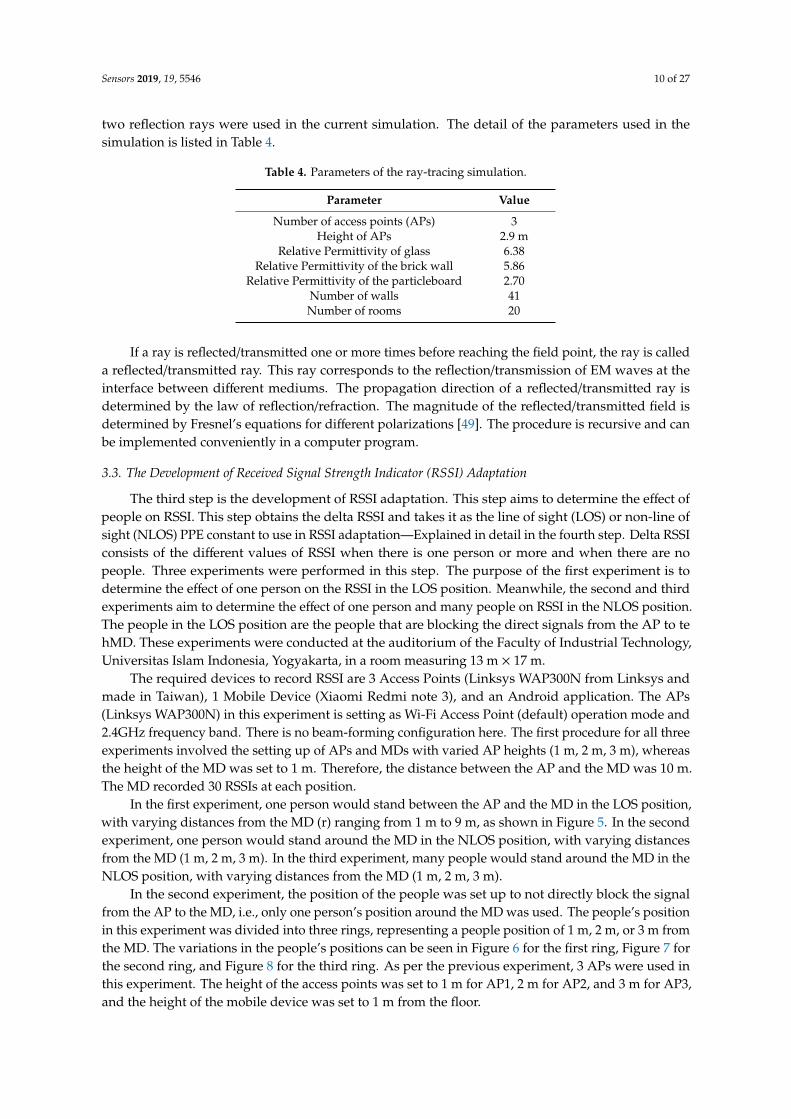
Table 4. Parameters of the ray-tracing simulation.
Parameter Value
Number of access points (APs) 3Height of APs 2.9 m
Relative Permittivity of glass 6.38Relative Permittivity of the brick wall 5.86
Relative Permittivity of the particleboard 2.70Number of walls 41Number of rooms 20
If a ray is reflected/transmitted one or more times before reaching the field point, the ray is calleda reflected/transmitted ray. This ray corresponds to the reflection/transmission of EM waves at theinterface between different mediums. The propagation direction of a reflected/transmitted ray isdetermined by the law of reflection/refraction. The magnitude of the reflected/transmitted field isdetermined by Fresnel’s equations for different polarizations [49]. The procedure is recursive and canbe implemented conveniently in a computer program.
3.3. The Development of Received Signal Strength Indicator (RSSI) Adaptation
The third step is the development of RSSI adaptation. This step aims to determine the effect ofpeople on RSSI. This step obtains the delta RSSI and takes it as the line of sight (LOS) or non-line ofsight (NLOS) PPE constant to use in RSSI adaptation—Explained in detail in the fourth step. Delta RSSIconsists of the different values of RSSI when there is one person or more and when there are nopeople. Three experiments were performed in this step. The purpose of the first experiment is todetermine the effect of one person on the RSSI in the LOS position. Meanwhile, the second and thirdexperiments aim to determine the effect of one person and many people on RSSI in the NLOS position.The people in the LOS position are the people that are blocking the direct signals from the AP to tehMD. These experiments were conducted at the auditorium of the Faculty of Industrial Technology,Universitas Islam Indonesia, Yogyakarta, in a room measuring 13 m × 17 m.
The required devices to record RSSI are 3 Access Points (Linksys WAP300N from Linksys andmade in Taiwan), 1 Mobile Device (Xiaomi Redmi note 3), and an Android application. The APs(Linksys WAP300N) in this experiment is setting as Wi-Fi Access Point (default) operation mode and2.4GHz frequency band. There is no beam-forming configuration here. The first procedure for all threeexperiments involved the setting up of APs and MDs with varied AP heights (1 m, 2 m, 3 m), whereasthe height of the MD was set to 1 m. Therefore, the distance between the AP and the MD was 10 m.The MD recorded 30 RSSIs at each position.
In the first experiment, one person would stand between the AP and the MD in the LOS position,with varying distances from the MD (r) ranging from 1 m to 9 m, as shown in Figure 5. In the secondexperiment, one person would stand around the MD in the NLOS position, with varying distancesfrom the MD (1 m, 2 m, 3 m). In the third experiment, many people would stand around the MD in theNLOS position, with varying distances from the MD (1 m, 2 m, 3 m).
In the second experiment, the position of the people was set up to not directly block the signalfrom the AP to the MD, i.e., only one person’s position around the MD was used. The people’s positionin this experiment was divided into three rings, representing a people position of 1 m, 2 m, or 3 m fromthe MD. The variations in the people’s positions can be seen in Figure 6 for the first ring, Figure 7 forthe second ring, and Figure 8 for the third ring. As per the previous experiment, 3 APs were used inthis experiment. The height of the access points was set to 1 m for AP1, 2 m for AP2, and 3 m for AP3,and the height of the mobile device was set to 1 m from the floor.

Sensors 2019, 19, 5546 11 of 27Sensors 2020, 20, x FOR PEER REVIEW 11 of 26
Figure 5. People in the line of sight (LOS) position between transmitter TX (access points, APs) and
receiver RX (mobile device, MD).
Figure 6. Top view of the people position around MD (the first ring).
Figure 7. Top view of the people position around MD (the second ring).
Figure 5. People in the line of sight (LOS) position between transmitter TX (access points, APs) andreceiver RX (mobile device, MD).
Sensors 2020, 20, x FOR PEER REVIEW 11 of 26
Figure 5. People in the line of sight (LOS) position between transmitter TX (access points, APs) and
receiver RX (mobile device, MD).
Figure 6. Top view of the people position around MD (the first ring).
Figure 7. Top view of the people position around MD (the second ring).
Figure 6. Top view of the people position around MD (the first ring).
Sensors 2020, 20, x FOR PEER REVIEW 11 of 26
Figure 5. People in the line of sight (LOS) position between transmitter TX (access points, APs) and
receiver RX (mobile device, MD).
Figure 6. Top view of the people position around MD (the first ring).
Figure 7. Top view of the people position around MD (the second ring). Figure 7. Top view of the people position around MD (the second ring).

Sensors 2019, 19, 5546 12 of 27Sensors 2020, 20, x FOR PEER REVIEW 12 of 26
Figure 8. Top view of the people position around MD (the third ring).
The third experiment aimed to determine how the presence of many people around MD would
affect RSSI. This experiment used 2 to 13 people with a varied position and distance to the MD
starting at a distance of 1 m (first ring), as shown in Table 5, followed by a distance of 2 m and 3 m, as
described in Table 6, Table 7.
Table 5. Position variation of many people around MD in the first ring (see Figure 6).
People Position in the First Ring
2 people
• 1b, 1f
• 1a, 1g
• 1c, 1e
• 1b, 1d
• 1d, 1f
• 1c, 1g
• 1a, 1e
3 people
• 1a,1d,1g
• 1b,1d,1f
• 1a,1b,1c
• 1c,1d,1e
• 1e,1f,1g
4 people
• 1a,1c,1e,1g
• 1a,1b,1f,1g
• 1b,1c,1e,1f
6 people
• 1a,1b,1c,1e, 1f,1g
7 people
• 1a,1b,1c,1d,1e,1f,1g
Table 6. Position variation of many people around MD in the second ring (see Figure 7).
People Position in the Second Ring
2 people
• 2d,2l
• 2b,2n
• 2f,2j
• 2d,2h
• 2h,2l
• 2f,2n
• 2b,2j
3 people
• 2b,2h,2n
• 2d,2h,2l
• 2c,2d,2e
• 2g,2h,2i
• 2k,2l,2m
4 people
• 2b,2f,2j,2n
5 people
• 2b,2c,2d,2e,2f
• 2j,2k,2l,2m,2n
• 2f,2g,2h,2i,2j
6 people
• 2b,2c,2d,2l, 2m,2n
• 2d,2e,2f,2j, 2k,2l
9 people
• 2b,2c,2d,2e,2f, 2g,2h,2i,2j
• 2f,2g,2h,2i,2j, 2k,2l,2m,2n
10 people
• 2b,2c,2d,2e,2f, 2j,2k,2l,2m,2n
Table 7. Position variation of many people around MD in the third ring (see Figure 8).
People Position in the Third Ring
2 people
• 3f,3r
• 3c,3u
• 3i,3o
• 3f,3l
• 3l,3r
• 3i,3u
• 3c,3o
3 people
• 3c,3l,3u
• 3f,3l,3r
• 3e,3f,3g
• 3k,3l,3m
• 3q,3r,3s
4 people
• 3c,3i,3o,3u
7 people
• 3c,3d,3e,3f,3g,3h,3i
• 3i,3j,3k,3l,3m,3n,3o
• 3o,3p,3q,3r,3s,3t,3u
13 people
• 3c to 3o
• 3i to 3u
Figure 8. Top view of the people position around MD (the third ring).
The third experiment aimed to determine how the presence of many people around MD wouldaffect RSSI. This experiment used 2 to 13 people with a varied position and distance to the MD startingat a distance of 1 m (first ring), as shown in Table 5, followed by a distance of 2 m and 3 m, as describedin Table 6, Table 7.
Table 5. Position variation of many people around MD in the first ring (see Figure 6).
People Position in the First Ring
2 people 3 people 4 people 6 people• 1b, 1f• 1a, 1g• 1c, 1e• 1b, 1d
• 1d, 1f• 1c, 1g• 1a, 1e
• 1a, 1d, 1g• 1b, 1d, 1f• 1a, 1b, 1c• 1c, 1d, 1e• 1e, 1f, 1g
• 1a, 1c, 1e, 1g• 1a, 1b, 1f, 1g• 1b, 1c, 1e, 1f
• 1a, 1b, 1c, 1e, 1f, 1g7 people• 1a, 1b, 1c, 1d, 1e, 1f, 1g
Table 6. Position variation of many people around MD in the second ring (see Figure 7).
People Position in the Second Ring
2 people 3 people 5 people 9 people• 2d, 2l• 2b, 2n• 2f, 2j• 2d, 2h• 2h, 2l• 2f, 2n• 2b, 2j
• 2b, 2h, 2n• 2d, 2h, 2l• 2c, 2d, 2e• 2g, 2h, 2i• 2k, 2l, 2m4 people• 2b, 2f, 2j, 2n
• 2b, 2c, 2d, 2e, 2f• 2j, 2k, 2l, 2m, 2n• 2f, 2g, 2h, 2i, 2j6 people• 2b, 2c, 2d, 2l, 2m, 2n• 2d, 2e, 2f, 2j, 2k, 2l
• 2b, 2c, 2d, 2e, 2f, 2g, 2h, 2i, 2j• 2f, 2g, 2h, 2i, 2j, 2k, 2l, 2m, 2n10 people• 2b, 2c, 2d, 2e, 2f, 2j, 2k, 2l, 2m, 2n
Table 7. Position variation of many people around MD in the third ring (see Figure 8).
People Position in the Third Ring
2 people 3 people 4 people 13 people• 3f, 3r• 3c, 3u• 3i, 3o• 3f, 3l• 3l, 3r
• 3i, 3u• 3c, 3o
• 3c, 3l, 3u• 3f, 3l, 3r• 3e, 3f, 3g• 3k, 3l, 3m• 3q, 3r, 3s
• 3c, 3i, 3o, 3u7 people• 3c, 3d, 3e, 3f, 3g, 3h, 3i• 3i, 3j, 3k, 3l, 3m, 3n, 3o• 3o, 3p, 3q, 3r, 3s, 3t, 3u
• 3c to 3o• 3i to 3u

Sensors 2019, 19, 5546 13 of 27
3.4. The Development of an Accurate Indoor-Positioning System (IPS) Based on People Effect andRay-Tracing (AIRY)
The basic concept of the fingerprint technique has been explained in the literature review section.In the offline stage, the automatic radio map database was obtained using ray-tracing propagation.In the online stage, the user measures the RSSI in which he/she stands and holds the MD. Then, themeasurement results are referred to as the initial RSSI vectors. These initial RSSI vectors were matchedwith the ARM-RT database using the KNN algorithm, which produces initial position estimations.
The additional steps in the proposed method involved counting the adapted RSSI vectors toobtain an accurate position. Adapted RSSI vectors were calculated based on the initial RSSI as inputand considering the presence of people around the initial position. If people were present around theinitial position, then the next step involved detecting whether the people positions were in the LOS orNLOS positions. The LOS position means that the people stood to block the direct path between thetransmitter (AP) and the receiver (MD) while the NLOS position meant that the position of the persondid not block the direct path.
The following rules were applied for the adaptation of the RSSI vector:
• If there are people in the NLOS position between the AP position and the initial position, then, theRSSI is added with an “NLOS PPE constant”.
• If the people are in the LOS position between the AP position and the initial position, then theRSSI is added with a “LOS PPE constant”.
• Then, if there are no people, the RSSI value does not change.
The value of both parameters, NLOS PPE and LOS PPE constants, was calculated in the previousstep. After obtaining an adapted RSSI vector, the last step involved calculating accurate positions usingthe KNN algorithm. Finally, the accuracy of the accurate position was compared to the initial position.
3.5. Validating the Proposed Method
This step consists of two validation processes—the validation of ARM and the validation of AIRY.The validation of ARM was done by calculating the error of the system. To evaluate the positioningmethod, different performance metrics including accuracy, precision, and responsiveness have beenproposed in past studies. Liu et al. [60] used accuracy, complexity, scalability, robustness, and cost asperformance metrics. On the other hand, Farid et al. [18] used accuracy, responsiveness, coverage,adaptiveness, scalability, cost, and complexity. Dardari [61] used position estimation error, coverage,robustness, and scalability.
One of the most important features of a localization system is the accuracy of the user/deviceposition [62]. Indoor environments provide a challenging space for localization systems to operatedue to the presence of obstacles and multipath effects. Therefore, the system needs to limit theimpact of multipath effects and other environmental noises to obtain highly accurate estimates.Positioning accuracy is used as a performance metric in this research. Positioning accuracy refers tothe difference between the estimated position and the actual position [63] as in Equation (2):
Accuracy =
√(xa − xp
)2+
(ya − yp
)2(2)
Accuracy can be calculated as the root of the squared difference between each pair of location pointswhere
(xa, ya
)is the coordinate of an actual point and
(xp, yp
)is the coordinate of the predicted point.
Sensors 2019, 19, 5546 14 of 27
4. Results and Discussion
4.1. The Development of a Manual Radio Map
This experiment was carried out on the third floor of Razak Tower, UTM Kuala Lumpur, whereRSSI was obtained at 523 points from 20 rooms and corridors. The maximum values of RSSI were−50 dBm, −40 dBm, and −45 dBm for the RSSI transmitted from AP1, AP2, and AP3, respectively.Following that, the minimum RSSI were −89 dBm, −84 dBm, and −87 dBm. The standard deviationsfor RSSI1, RSSI2, and RSSI3 were 7.1, 11.06, and 10.45, respectively. This manual radio map (MRM)was used for the calibration of automatic radio map (ARM) generation.
4.2. The Development of an Automatic Radio Map Using Ray-Tracing
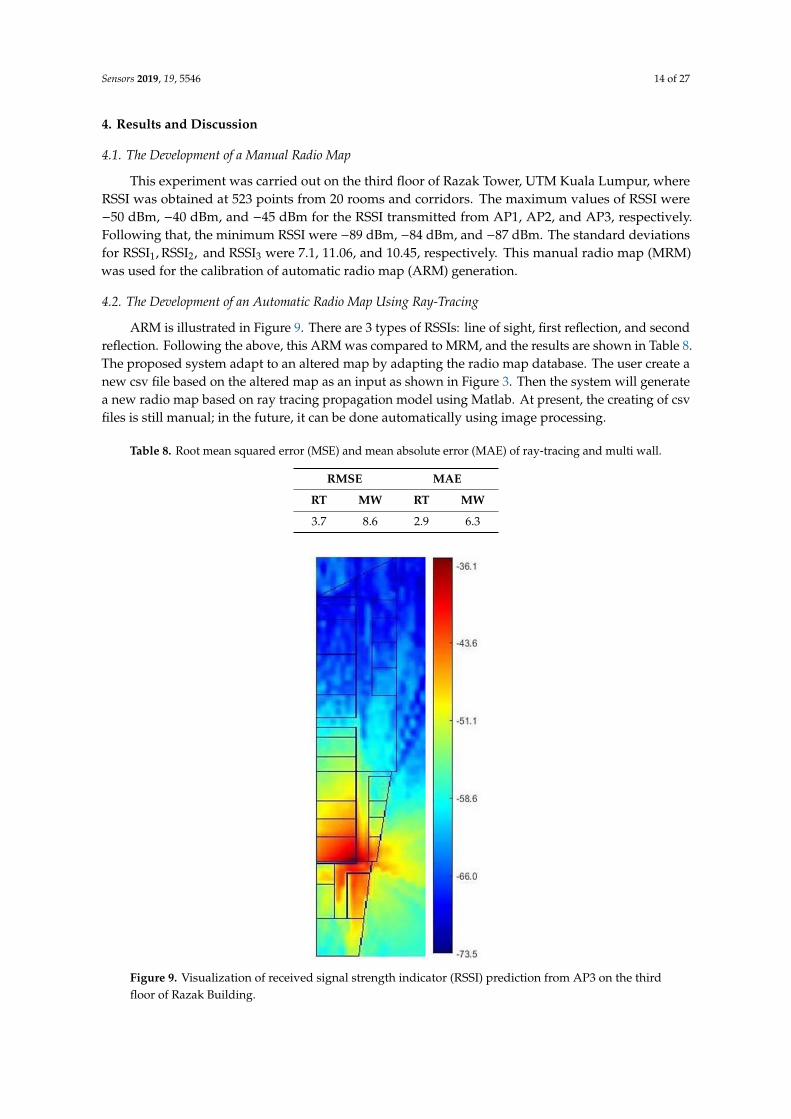
ARM is illustrated in Figure 9. There are 3 types of RSSIs: line of sight, first reflection, and secondreflection. Following the above, this ARM was compared to MRM, and the results are shown in Table 8.The proposed system adapt to an altered map by adapting the radio map database. The user create anew csv file based on the altered map as an input as shown in Figure 3. Then the system will generatea new radio map based on ray tracing propagation model using Matlab. At present, the creating of csvfiles is still manual; in the future, it can be done automatically using image processing.
Table 8. Root mean squared error (MSE) and mean absolute error (MAE) of ray-tracing and multi wall.
RMSE MAE
RT MW RT MW
3.7 8.6 2.9 6.3
Sensors 2020, 20, x FOR PEER REVIEW 14 of 26
−50 dBm, −40 dBm, and −45 dBm for the RSSI transmitted from AP1, AP2, and AP3, respectively.
Following that, the minimum RSSI were −89 dBm, −84 dBm, and −87 dBm. The standard deviations
for RSSI1, RSSI2, and RSSI3 were 7.1, 11.06, and 10.45, respectively. This manual radio map (MRM)
was used for the calibration of automatic radio map (ARM) generation.
4.2. The Development of an Automatic Radio Map Using Ray-Tracing
ARM is illustrated in Figure 9. There are 3 types of RSSIs: line of sight, first reflection, and
second reflection. Following the above, this ARM was compared to MRM, and the results are shown
in Table 8. The proposed system adapt to an altered map by adapting the radio map database. The
user create a new csv file based on the altered map as an input as shown in Figure 3. Then the system
will generate a new radio map based on ray tracing propagation model using Matlab. At present, the
creating of csv files is still manual; in the future, it can be done automatically using image
processing.
Table 8. Root mean squared error (MSE) and mean absolute error (MAE) of ray-tracing and multi wall.
RMSE MAE
RT MW RT MW
3.7 8.6 2.9 6.3
Figure 9. Visualization of received signal strength indicator (RSSI) prediction from AP3 on the third
floor of Razak Building.
MSE-RT is the mean squared error obtained using the ray-tracing model, while MSE-MW is the
mean squared error using the multi-wall model. Table 8 and Figure 10 show the RSSI error. The
MSE-RT was smaller than the MSE-MW, meaning that the ray-tracing model was better than the
multi-wall model in predicting RSSI. This is because MW only counted the direct signal between TX
Figure 9. Visualization of received signal strength indicator (RSSI) prediction from AP3 on the thirdfloor of Razak Building.

Sensors 2019, 19, 5546 15 of 27
MSE-RT is the mean squared error obtained using the ray-tracing model, while MSE-MW is themean squared error using the multi-wall model. Table 8 and Figure 10 show the RSSI error. The MSE-RTwas smaller than the MSE-MW, meaning that the ray-tracing model was better than the multi-wallmodel in predicting RSSI. This is because MW only counted the direct signal between TX and RX, whileRT also calculated indirect signals such as reflection and diffraction. Therefore, the RSSI predictionsusing RT are more accurate than MW.
Some previous studies on ray-tracing propagation models have succeeded in obtaining results ofMAE ranging from 3 to 8.52 [64–67]. The results of this study showed an average MAE of 2.9—A muchbetter result than the results of the above studies. Other studies used RMSE to measure the error of thesystem. The average RMSE obtained in this study was 3.67, which is still better than some previousstudies that obtained an RMSE above 4 [57,58,68,69]. The accuracy of the RSSI prediction based on theray-tracing propagation modeling is, therefore, very high.
Sensors 2020, 20, x FOR PEER REVIEW 15 of 26
and RX, while RT also calculated indirect signals such as reflection and diffraction. Therefore, the
RSSI predictions using RT are more accurate than MW.
Some previous studies on ray-tracing propagation models have succeeded in obtaining results
of MAE ranging from 3 to 8.52 [64–67]. The results of this study showed an average MAE of 2.9—A
much better result than the results of the above studies. Other studies used RMSE to measure the
error of the system. The average RMSE obtained in this study was 3.67, which is still better than
some previous studies that obtained an RMSE above 4 [57,58,68,69]. The accuracy of the RSSI
prediction based on the ray-tracing propagation modeling is, therefore, very high.
(a) (b)
Figure 10. Cumulative distribution function (CDF) of RSSI error using (a) multi-wall (b) ray-tracing.
4.3. The Development of RSSI Adaptation
The results of the first experiment are presented in Figure 11. As a comparison, when no people
are blocking the LOS, the values of RSSI received by the MD were −45 dBm for AP1 and AP2, and
−46 dBm for AP3. It appears that when people bar the signal path between AP and MD and stand in
the LOS path, the value of RSSI reduces, especially when the people’s positions are close to the MD.
Figure 11. RSSI because of one person effect in LOS position.
The difference in the values of RSSI when there is one person as opposed to no persons (Δ RSSI)
is shown in Figure 12. RSSI decreased by an average of 5 dBm when one person was 1 m to 3 m away
from the MD. When the distance of the person was 4 m to 6 m, then, the RSSI decreased by an
average of 3 dBm. The RSSI further decreased by 1 dBm when the distance of the person was 7 m to
9 m. An average value (5 dBm) was used as the value of the LOS PPE constant, later used in the RSSI
adaptation for the development of AIRY.
Figure 10. Cumulative distribution function (CDF) of RSSI error using (a) multi-wall (b) ray-tracing.
4.3. The Development of RSSI Adaptation
The results of the first experiment are presented in Figure 11. As a comparison, when no peopleare blocking the LOS, the values of RSSI received by the MD were −45 dBm for AP1 and AP2, and−46 dBm for AP3. It appears that when people bar the signal path between AP and MD and stand inthe LOS path, the value of RSSI reduces, especially when the people’s positions are close to the MD.
Sensors 2020, 20, x FOR PEER REVIEW 15 of 26
and RX, while RT also calculated indirect signals such as reflection and diffraction. Therefore, the
RSSI predictions using RT are more accurate than MW.
Some previous studies on ray-tracing propagation models have succeeded in obtaining results
of MAE ranging from 3 to 8.52 [64–67]. The results of this study showed an average MAE of 2.9—A
much better result than the results of the above studies. Other studies used RMSE to measure the
error of the system. The average RMSE obtained in this study was 3.67, which is still better than
some previous studies that obtained an RMSE above 4 [57,58,68,69]. The accuracy of the RSSI
prediction based on the ray-tracing propagation modeling is, therefore, very high.
(a) (b)
Figure 10. Cumulative distribution function (CDF) of RSSI error using (a) multi-wall (b) ray-tracing.
4.3. The Development of RSSI Adaptation
The results of the first experiment are presented in Figure 11. As a comparison, when no people
are blocking the LOS, the values of RSSI received by the MD were −45 dBm for AP1 and AP2, and
−46 dBm for AP3. It appears that when people bar the signal path between AP and MD and stand in
the LOS path, the value of RSSI reduces, especially when the people’s positions are close to the MD.
Figure 11. RSSI because of one person effect in LOS position.
The difference in the values of RSSI when there is one person as opposed to no persons (Δ RSSI)
is shown in Figure 12. RSSI decreased by an average of 5 dBm when one person was 1 m to 3 m away
from the MD. When the distance of the person was 4 m to 6 m, then, the RSSI decreased by an
average of 3 dBm. The RSSI further decreased by 1 dBm when the distance of the person was 7 m to
9 m. An average value (5 dBm) was used as the value of the LOS PPE constant, later used in the RSSI
adaptation for the development of AIRY.
Figure 11. RSSI because of one person effect in LOS position.

Sensors 2019, 19, 5546 16 of 27
The difference in the values of RSSI when there is one person as opposed to no persons (∆ RSSI)is shown in Figure 12. RSSI decreased by an average of 5 dBm when one person was 1 m to 3 maway from the MD. When the distance of the person was 4 m to 6 m, then, the RSSI decreased by anaverage of 3 dBm. The RSSI further decreased by 1 dBm when the distance of the person was 7 m to 9m. An average value (5 dBm) was used as the value of the LOS PPE constant, later used in the RSSIadaptation for the development of AIRY.Sensors 2020, 20, x FOR PEER REVIEW 16 of 26
Figure 12. The difference in RSSI when there is one person in the LOS position as opposed to no one.
Figure 12 shows that the closer the distance of people to the MD in the LOS position, the greater
the decrease in RSSI. The closer the people are to the MD, the more the people will block the signal
from the transmitter. This case applied to the RSSI originating from AP1, AP2, and AP3.
The results of the second experiment are shown in Figure 13. The RSSI values are still around
48 dBm, i.e., between 47 dBm and 49 dBm. As a reference, the RSSI when there was no one was
47.34 dBm for AP1, 48 dBm for AP2, and 48 dBm for AP3. It can be seen in Figure 11 that when one
person was around the MD, at a varied position and distance, the value of RSSI did not significantly
reduce compared to the RSSI obtained when there were no people.
Figure 13. The effect of one person around the MD on RSSI.
The average difference in RSSI between the conditions in which one person was around the MD
as opposed to no people can be seen in Table 9. Therefore, the further the distance between the
people and the MD, the smaller the impact of the people on RSSI. People at a distance of 1 m from
the MD reduced the RSSI of the MD by around 0.5 dB. This value then decreased to around 0.4 dB
when the distance was 2 m and around 0.3 dB at 3 m. The maximum value (0.5 dBm) was, therefore,
used as the value of the NLOS PPE constant, later used in the RSSI adaptation.
Figure 12. The difference in RSSI when there is one person in the LOS position as opposed to no one.
Figure 12 shows that the closer the distance of people to the MD in the LOS position, the greaterthe decrease in RSSI. The closer the people are to the MD, the more the people will block the signalfrom the transmitter. This case applied to the RSSI originating from AP1, AP2, and AP3.
The results of the second experiment are shown in Figure 13. The RSSI values are still around48 dBm, i.e., between 47 dBm and 49 dBm. As a reference, the RSSI when there was no one was47.34 dBm for AP1, 48 dBm for AP2, and 48 dBm for AP3. It can be seen in Figure 11 that when oneperson was around the MD, at a varied position and distance, the value of RSSI did not significantlyreduce compared to the RSSI obtained when there were no people.
Sensors 2020, 20, x FOR PEER REVIEW 16 of 26
Figure 12. The difference in RSSI when there is one person in the LOS position as opposed to no one.
Figure 12 shows that the closer the distance of people to the MD in the LOS position, the greater
the decrease in RSSI. The closer the people are to the MD, the more the people will block the signal
from the transmitter. This case applied to the RSSI originating from AP1, AP2, and AP3.
The results of the second experiment are shown in Figure 13. The RSSI values are still around
48 dBm, i.e., between 47 dBm and 49 dBm. As a reference, the RSSI when there was no one was
47.34 dBm for AP1, 48 dBm for AP2, and 48 dBm for AP3. It can be seen in Figure 11 that when one
person was around the MD, at a varied position and distance, the value of RSSI did not significantly
reduce compared to the RSSI obtained when there were no people.
Figure 13. The effect of one person around the MD on RSSI.
The average difference in RSSI between the conditions in which one person was around the MD
as opposed to no people can be seen in Table 9. Therefore, the further the distance between the
people and the MD, the smaller the impact of the people on RSSI. People at a distance of 1 m from
the MD reduced the RSSI of the MD by around 0.5 dB. This value then decreased to around 0.4 dB
when the distance was 2 m and around 0.3 dB at 3 m. The maximum value (0.5 dBm) was, therefore,
used as the value of the NLOS PPE constant, later used in the RSSI adaptation.
Figure 13. The effect of one person around the MD on RSSI.
The average difference in RSSI between the conditions in which one person was around the MDas opposed to no people can be seen in Table 9. Therefore, the further the distance between the peopleand the MD, the smaller the impact of the people on RSSI. People at a distance of 1 m from the MD
Sensors 2019, 19, 5546 17 of 27
reduced the RSSI of the MD by around 0.5 dB. This value then decreased to around 0.4 dB when thedistance was 2 m and around 0.3 dB at 3 m. The maximum value (0.5 dBm) was, therefore, used as thevalue of the NLOS PPE constant, later used in the RSSI adaptation.
Table 9. The average difference in RSSI for the conditions of one people around MD versus no people.
People Position ∆ RSSI
AP1 AP2 AP3
1st Ring −0.51 −0.42 −0.452nd Ring −0.35 −0.39 −0.383rd Ring −0.27 −0.35 −0.30
The decrease in RSSI, in this case, was much smaller than the decrease in RSSI when the peoplewere at the LOS position. This is because the people in the LOS position blocked the direct signal andcaused significant attenuation, whereas the people in the NLOS position mainly blocked the reflectionsignal. The reflection signal power was much smaller than the direct signal.
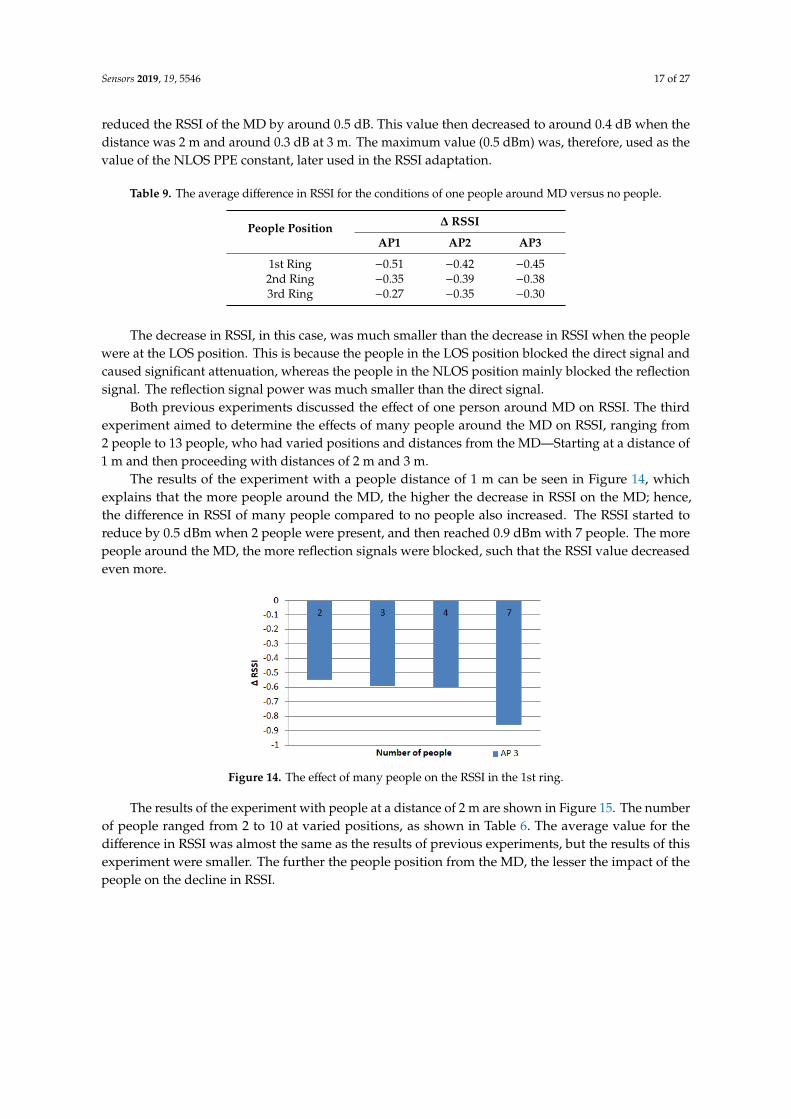
Both previous experiments discussed the effect of one person around MD on RSSI. The thirdexperiment aimed to determine the effects of many people around the MD on RSSI, ranging from2 people to 13 people, who had varied positions and distances from the MD—Starting at a distance of1 m and then proceeding with distances of 2 m and 3 m.
The results of the experiment with a people distance of 1 m can be seen in Figure 14, whichexplains that the more people around the MD, the higher the decrease in RSSI on the MD; hence,the difference in RSSI of many people compared to no people also increased. The RSSI started toreduce by 0.5 dBm when 2 people were present, and then reached 0.9 dBm with 7 people. The morepeople around the MD, the more reflection signals were blocked, such that the RSSI value decreasedeven more.
Sensors 2020, 20, x FOR PEER REVIEW 17 of 26
Table 9. The average difference in RSSI for the conditions of one people around MD versus no people.
People Position Δ RSSI
AP1 AP2 AP3
1st Ring −0.51 −0.42 −0.45
2nd Ring −0.35 −0.39 −0.38
3rd Ring −0.27 −0.35 −0.30
The decrease in RSSI, in this case, was much smaller than the decrease in RSSI when the people
were at the LOS position. This is because the people in the LOS position blocked the direct signal and
caused significant attenuation, whereas the people in the NLOS position mainly blocked the
reflection signal. The reflection signal power was much smaller than the direct signal.
Both previous experiments discussed the effect of one person around MD on RSSI. The third
experiment aimed to determine the effects of many people around the MD on RSSI, ranging from 2
people to 13 people, who had varied positions and distances from the MD—Starting at a distance of
1 m and then proceeding with distances of 2 m and 3 m.
The results of the experiment with a people distance of 1 m can be seen in Figure 14, which
explains that the more people around the MD, the higher the decrease in RSSI on the MD; hence, the
difference in RSSI of many people compared to no people also increased. The RSSI started to reduce
by 0.5 dBm when 2 people were present, and then reached 0.9 dBm with 7 people. The more people
around the MD, the more reflection signals were blocked, such that the RSSI value decreased even
more.
Figure 14. The effect of many people on the RSSI in the 1st ring.
The results of the experiment with people at a distance of 2 m are shown in Figure 15. The
number of people ranged from 2 to 10 at varied positions, as shown in Table 6. The average value for
the difference in RSSI was almost the same as the results of previous experiments, but the results of
this experiment were smaller. The further the people position from the MD, the lesser the impact of
the people on the decline in RSSI.
Figure 15. The effect of many people on RSSI in the 2nd ring.
Figure 14. The effect of many people on the RSSI in the 1st ring.
The results of the experiment with people at a distance of 2 m are shown in Figure 15. The numberof people ranged from 2 to 10 at varied positions, as shown in Table 6. The average value for thedifference in RSSI was almost the same as the results of previous experiments, but the results of thisexperiment were smaller. The further the people position from the MD, the lesser the impact of thepeople on the decline in RSSI.

Sensors 2019, 19, 5546 18 of 27
Sensors 2020, 20, x FOR PEER REVIEW 17 of 26
Table 9. The average difference in RSSI for the conditions of one people around MD versus no people.
People Position Δ RSSI
AP1 AP2 AP3
1st Ring −0.51 −0.42 −0.45
2nd Ring −0.35 −0.39 −0.38
3rd Ring −0.27 −0.35 −0.30
The decrease in RSSI, in this case, was much smaller than the decrease in RSSI when the people
were at the LOS position. This is because the people in the LOS position blocked the direct signal and
caused significant attenuation, whereas the people in the NLOS position mainly blocked the
reflection signal. The reflection signal power was much smaller than the direct signal.
Both previous experiments discussed the effect of one person around MD on RSSI. The third
experiment aimed to determine the effects of many people around the MD on RSSI, ranging from 2
people to 13 people, who had varied positions and distances from the MD—Starting at a distance of
1 m and then proceeding with distances of 2 m and 3 m.
The results of the experiment with a people distance of 1 m can be seen in Figure 14, which
explains that the more people around the MD, the higher the decrease in RSSI on the MD; hence, the
difference in RSSI of many people compared to no people also increased. The RSSI started to reduce
by 0.5 dBm when 2 people were present, and then reached 0.9 dBm with 7 people. The more people
around the MD, the more reflection signals were blocked, such that the RSSI value decreased even
more.
Figure 14. The effect of many people on the RSSI in the 1st ring.
The results of the experiment with people at a distance of 2 m are shown in Figure 15. The
number of people ranged from 2 to 10 at varied positions, as shown in Table 6. The average value for
the difference in RSSI was almost the same as the results of previous experiments, but the results of
this experiment were smaller. The further the people position from the MD, the lesser the impact of
the people on the decline in RSSI.
Figure 15. The effect of many people on RSSI in the 2nd ring. Figure 15. The effect of many people on RSSI in the 2nd ring.
Figure 16 shows the average RSSI results of experiments according to the number of peopleinvolved. The results were generally the same as the previous experiment, but for the same number ofpeople, the ∆RSSI was smaller than the results of previous experiments. This result shows that thepeople distance from the MD affected the RSSI received by the MD.
Sensors 2020, 20, x FOR PEER REVIEW 18 of 26
Figure 16 shows the average RSSI results of experiments according to the number of people
involved. The results were generally the same as the previous experiment, but for the same number
of people, the ΔRSSI was smaller than the results of previous experiments. This result shows that the
people distance from the MD affected the RSSI received by the MD.
Figure 16. The effect of many people on the RSSI in the 3rd ring.
The three experiments above show that the number, the position, and the distance of people to
the MD in the NLOS position affected the value of RSSI; the more the people, the greater the
influence, and the closer the distance of the people to the MD, the greater the influence.
Finally, the rules of the RSSI adaptation are (see Figure 17 and Algorithm 2) listed below:
• If there are people in the NLOS position between the AP position and the initial position, then
0.5 dBm is added to the RSSI.
• If the people are in the LOS position between the AP position and the initial position, then 5
dBm is added to the RSSI.
• Then, if there are no people, the RSSI value does not change.
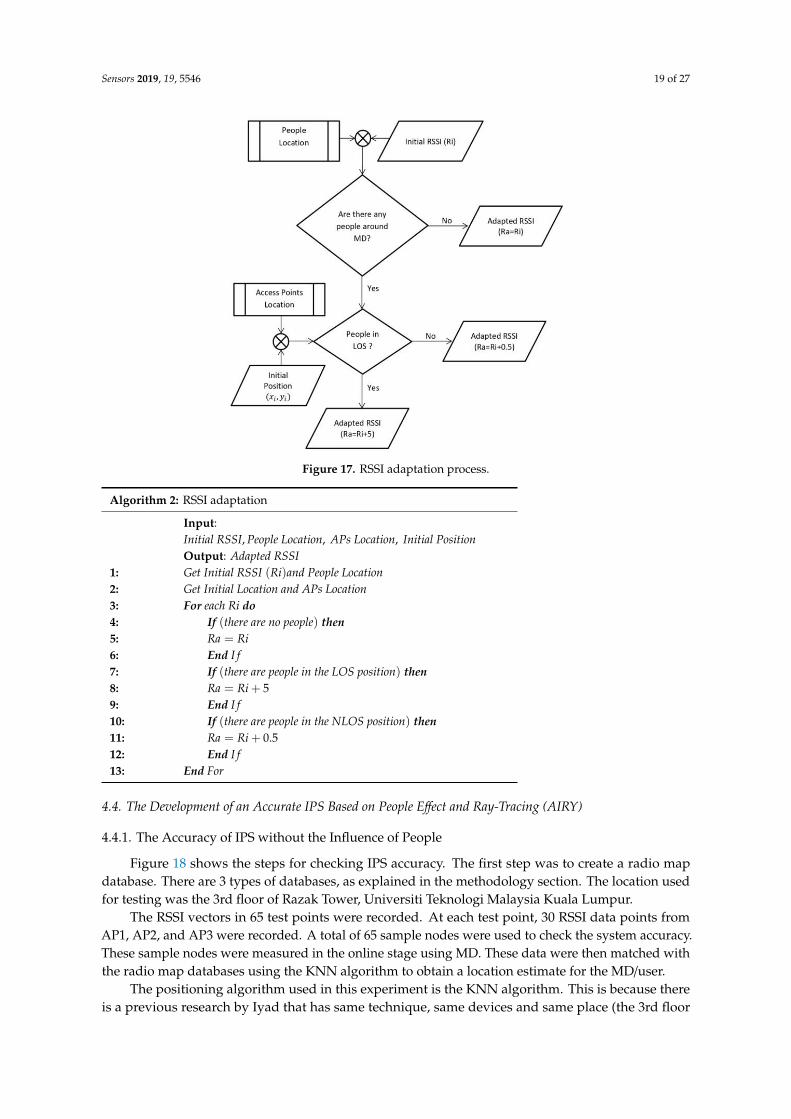
Figure 17. RSSI adaptation process.
Figure 16. The effect of many people on the RSSI in the 3rd ring.
The three experiments above show that the number, the position, and the distance of people tothe MD in the NLOS position affected the value of RSSI; the more the people, the greater the influence,and the closer the distance of the people to the MD, the greater the influence.
Finally, the rules of the RSSI adaptation are (see Figure 17 and Algorithm 2) listed below:
• If there are people in the NLOS position between the AP position and the initial position,then 0.5 dBm is added to the RSSI.
• If the people are in the LOS position between the AP position and the initial position, then 5 dBmis added to the RSSI.
• Then, if there are no people, the RSSI value does not change.
Sensors 2019, 19, 5546 19 of 27
Sensors 2020, 20, x FOR PEER REVIEW 18 of 26
Figure 16 shows the average RSSI results of experiments according to the number of people
involved. The results were generally the same as the previous experiment, but for the same number
of people, the ΔRSSI was smaller than the results of previous experiments. This result shows that the
people distance from the MD affected the RSSI received by the MD.
Figure 16. The effect of many people on the RSSI in the 3rd ring.
The three experiments above show that the number, the position, and the distance of people to
the MD in the NLOS position affected the value of RSSI; the more the people, the greater the
influence, and the closer the distance of the people to the MD, the greater the influence.
Finally, the rules of the RSSI adaptation are (see Figure 17 and Algorithm 2) listed below:
• If there are people in the NLOS position between the AP position and the initial position, then
0.5 dBm is added to the RSSI.
• If the people are in the LOS position between the AP position and the initial position, then 5
dBm is added to the RSSI.
• Then, if there are no people, the RSSI value does not change.
Figure 17. RSSI adaptation process.
Figure 17. RSSI adaptation process.
Algorithm 2: RSSI adaptation
Input:Initial RSSI, People Location, APs Location, Initial PositionOutput: Adapted RSSI
1: Get Initial RSSI (Ri)and People Location2: Get Initial Location and APs Location3: For each Ri do4: If (there are no people) then5: Ra = Ri6: End I f7: If (there are people in the LOS position) then8: Ra = Ri + 59: End I f10: If (there are people in the NLOS position) then11: Ra = Ri + 0.512: End I f13: End For
4.4. The Development of an Accurate IPS Based on People Effect and Ray-Tracing (AIRY)
4.4.1. The Accuracy of IPS without the Influence of People
Figure 18 shows the steps for checking IPS accuracy. The first step was to create a radio mapdatabase. There are 3 types of databases, as explained in the methodology section. The location usedfor testing was the 3rd floor of Razak Tower, Universiti Teknologi Malaysia Kuala Lumpur.
The RSSI vectors in 65 test points were recorded. At each test point, 30 RSSI data points fromAP1, AP2, and AP3 were recorded. A total of 65 sample nodes were used to check the system accuracy.These sample nodes were measured in the online stage using MD. These data were then matched withthe radio map databases using the KNN algorithm to obtain a location estimate for the MD/user.
The positioning algorithm used in this experiment is the KNN algorithm. This is because thereis a previous research by Iyad that has same technique, same devices and same place (the 3rd floor

Sensors 2019, 19, 5546 20 of 27
of the UTM Kuala Lumpur Razak Tower) [48]. Iyad nominated 2 positioning algorithms: KNN andANN. The results obtained showed that KNN can achieve more accurate positioning results thanANN. The KNN algorithm with k = 3 is chosen because it produces the highest percentage of accuracy.Another reason is because KNN is simpler than ANN. Furthermore, ANN is a complex system thatneeds heavy computations especially in the training phase, and this complexity does not fit withmobile device limitation.
Sensors 2020, 20, x FOR PEER REVIEW 19 of 26
Algorithm 2: RSSI adaptation
Input: 𝐼𝑛𝑖𝑡𝑖𝑎𝑙 𝑅𝑆𝑆𝐼, 𝑃𝑒𝑜𝑝𝑙𝑒 𝐿𝑜𝑐𝑎𝑡𝑖𝑜𝑛, 𝐴𝑃𝑠 𝐿𝑜𝑐𝑎𝑡𝑖𝑜𝑛, 𝐼𝑛𝑖𝑡𝑖𝑎𝑙 𝑃𝑜𝑠𝑖𝑡𝑖𝑜𝑛
Output: 𝐴𝑑𝑎𝑝𝑡𝑒𝑑 𝑅𝑆𝑆𝐼
1: 𝐺𝑒𝑡 𝐼𝑛𝑖𝑡𝑖𝑎𝑙 𝑅𝑆𝑆𝐼 (𝑅𝑖)𝑎𝑛𝑑 𝑃𝑒𝑜𝑝𝑙𝑒 𝐿𝑜𝑐𝑎𝑡𝑖𝑜𝑛
2: 𝐺𝑒𝑡 𝐼𝑛𝑖𝑡𝑖𝑎𝑙 𝐿𝑜𝑐𝑎𝑡𝑖𝑜𝑛 𝑎𝑛𝑑 𝐴𝑃𝑠 𝐿𝑜𝑐𝑎𝑡𝑖𝑜𝑛
3: 𝑭𝒐𝒓 𝑒𝑎𝑐ℎ 𝑅𝑖 𝒅𝒐
4: 𝑰𝒇 (𝑡ℎ𝑒𝑟𝑒 𝑎𝑟𝑒 𝑛𝑜 𝑝𝑒𝑜𝑝𝑙𝑒) 𝒕𝒉𝒆𝒏
5: 𝑅𝑎 = 𝑅𝑖
6: 𝑬𝒏𝒅 𝐼𝑓
7: 𝑰𝒇 (𝑡ℎ𝑒𝑟𝑒 𝑎𝑟𝑒 𝑝𝑒𝑜𝑝𝑙𝑒 𝑖𝑛 𝑡ℎ𝑒 𝐿𝑂𝑆 𝑝𝑜𝑠𝑖𝑡𝑖𝑜𝑛) 𝒕𝒉𝒆𝒏
8: 𝑅𝑎 = 𝑅𝑖 + 5
9: 𝑬𝒏𝒅 𝐼𝑓
10: 𝑰𝒇 (𝑡ℎ𝑒𝑟𝑒 𝑎𝑟𝑒 𝑝𝑒𝑜𝑝𝑙𝑒 𝑖𝑛 𝑡ℎ𝑒 𝑁𝐿𝑂𝑆 𝑝𝑜𝑠𝑖𝑡𝑖𝑜𝑛) 𝒕𝒉𝒆𝒏
11: 𝑅𝑎 = 𝑅𝑖 + 0.5
12: 𝑬𝒏𝒅 𝐼𝑓
13: 𝑬𝒏𝒅 𝐹𝑜𝑟
4.4. The Development of an Accurate IPS Based on People Effect and Ray-Tracing (AIRY)
4.4.1. The Accuracy of IPS without the Influence of People
Figure 18 shows the steps for checking IPS accuracy. The first step was to create a radio map
database. There are 3 types of databases, as explained in the methodology section. The location used
for testing was the 3rd floor of Razak Tower, Universiti Teknologi Malaysia Kuala Lumpur.
The RSSI vectors in 65 test points were recorded. At each test point, 30 RSSI data points from
AP1, AP2, and AP3 were recorded. A total of 65 sample nodes were used to check the system
accuracy. These sample nodes were measured in the online stage using MD. These data were then
matched with the radio map databases using the KNN algorithm to obtain a location estimate for the
MD/user.
The positioning algorithm used in this experiment is the KNN algorithm. This is because there
is a previous research by Iyad that has same technique, same devices and same place (the 3rd floor of
the UTM Kuala Lumpur Razak Tower) [48]. Iyad nominated 2 positioning algorithms: KNN and
ANN. The results obtained showed that KNN can achieve more accurate positioning results than
ANN. The KNN algorithm with k = 3 is chosen because it produces the highest percentage of
accuracy. Another reason is because KNN is simpler than ANN. Furthermore, ANN is a complex
system that needs heavy computations especially in the training phase, and this complexity does not
fit with mobile device limitation.
Figure 18. Steps to find accuracy. Figure 18. Steps to find accuracy.
The error values of the 65 test points for the ARM-RT database are shown in Figure 19.The maximum errors of the MRM database, the ARM-RT database, and the ARM-MW databasewere 1.37 m, 1.47 m, and 2 m, respectively.
Sensors 2020, 20, x FOR PEER REVIEW 20 of 26
The error values of the 65 test points for the ARM-RT database are shown in Figure 19. The
maximum errors of the MRM database, the ARM-RT database, and the ARM-MW database were
1.37 m, 1.47 m, and 2 m, respectively.
Figure 19. CDF of the the accuracy of the system using the ray-tracing automatic radio map.
The smallest average error (0.62 m) was obtained using the MRM database followed by
ARM-RT and ARM-MW, with an average accuracy of 0.97 m and 1.27 m, respectively. The
localization error using MRM database is significantly lower than in RADAR (a radio-frequency
based system for locating and tracking users inside buildings) [41], by a factor of four (0.62 vs. 2.5 m)
because AIRY used more radio map database than RADAR. RADAR collected RSSI vectors at 70
reference points (RPs) for the floor that has dimension of 43.5 m by 22.5 m, and AIRY has 523 RSSI
vectors for the floor that has a dimension of 80 × 16 m. The number of RPs has a profound effect on
the fingerprint positioning methods. Too few results in inaccurate fingerprint data, leading to poor
performance
The best accuracy was achieved by the MRM database. However, the MRM database requires
more time and energy to construct. The highest average error using the ARM-MW database was
1.27 m, similar to the results of previous studies conducted in the same building by Iyad [48]. A
better average error, 0.97 m, was obtained when using the ARM-RT database. The time needed to
create an ARM-RT database was indeed longer than for the ARM-MW database. The generation of
ARM-RT took around 25 to 30 min while ARM-MW took only 5 to 10 min to generate. Based on error
value, ARM-RT is the most promising choice of all the databases. The accuracy of the RSSI
prediction greatly affects the accuracy of IPS. After testing the accuracy of IPS with 3 types of radio
maps, the next step involved testing the accuracy of the system when PPE was accounted for.
4.4.2. The Accuracy of IPS Considering the People Presence around the User
The more RSSI from APs affected by PPE, the less accurate the system. As a comparison, the
accuracy of the system when there were no people was 0.62 m when using the MRM, 0.97 m when
using ARM-RT, and 1.27 m when using ARM-MW. Figure 20 shows the accuracy of IPS when the
effect of people around the user in the NLOS position was considered. The presence of people
caused a decrease in accuracy of 33%, 44%, and 57% for the affected 1 AP, 2 APs, and 3 APs,
respectively.
Figure 19. CDF of the the accuracy of the system using the ray-tracing automatic radio map.
The smallest average error (0.62 m) was obtained using the MRM database followed by ARM-RTand ARM-MW, with an average accuracy of 0.97 m and 1.27 m, respectively. The localization errorusing MRM database is significantly lower than in RADAR (a radio-frequency based system forlocating and tracking users inside buildings) [41], by a factor of four (0.62 vs. 2.5 m) because AIRY usedmore radio map database than RADAR. RADAR collected RSSI vectors at 70 reference points (RPs) forthe floor that has dimension of 43.5 m by 22.5 m, and AIRY has 523 RSSI vectors for the floor that hasa dimension of 80 × 16 m. The number of RPs has a profound effect on the fingerprint positioningmethods. Too few results in inaccurate fingerprint data, leading to poor performance
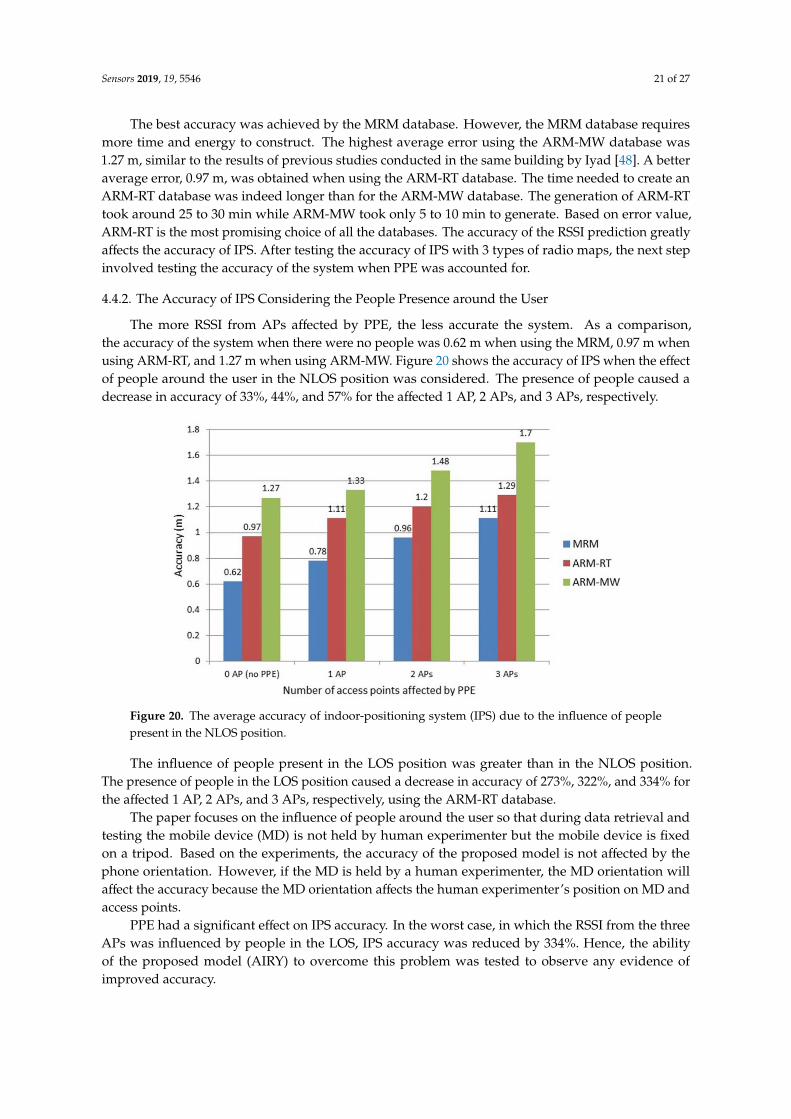
Sensors 2019, 19, 5546 21 of 27
The best accuracy was achieved by the MRM database. However, the MRM database requiresmore time and energy to construct. The highest average error using the ARM-MW database was1.27 m, similar to the results of previous studies conducted in the same building by Iyad [48]. A betteraverage error, 0.97 m, was obtained when using the ARM-RT database. The time needed to create anARM-RT database was indeed longer than for the ARM-MW database. The generation of ARM-RTtook around 25 to 30 min while ARM-MW took only 5 to 10 min to generate. Based on error value,ARM-RT is the most promising choice of all the databases. The accuracy of the RSSI prediction greatlyaffects the accuracy of IPS. After testing the accuracy of IPS with 3 types of radio maps, the next stepinvolved testing the accuracy of the system when PPE was accounted for.
4.4.2. The Accuracy of IPS Considering the People Presence around the User
The more RSSI from APs affected by PPE, the less accurate the system. As a comparison,the accuracy of the system when there were no people was 0.62 m when using the MRM, 0.97 m whenusing ARM-RT, and 1.27 m when using ARM-MW. Figure 20 shows the accuracy of IPS when the effectof people around the user in the NLOS position was considered. The presence of people caused adecrease in accuracy of 33%, 44%, and 57% for the affected 1 AP, 2 APs, and 3 APs, respectively.Sensors 2020, 20, x FOR PEER REVIEW 21 of 26
Figure 20. The average accuracy of indoor-positioning system (IPS) due to the influence of people
present in the NLOS position.
The influence of people present in the LOS position was greater than in the NLOS position. The
presence of people in the LOS position caused a decrease in accuracy of 273%, 322%, and 334% for
the affected 1 AP, 2 APs, and 3 APs, respectively, using the ARM-RT database.
The paper focuses on the influence of people around the user so that during data retrieval and
testing the mobile device (MD) is not held by human experimenter but the mobile device is fixed on
a tripod. Based on the experiments, the accuracy of the proposed model is not affected by the phone
orientation. However, if the MD is held by a human experimenter, the MD orientation will affect the
accuracy because the MD orientation affects the human experimenter’s position on MD and access
points.
PPE had a significant effect on IPS accuracy. In the worst case, in which the RSSI from the three
APs was influenced by people in the LOS, IPS accuracy was reduced by 334%. Hence, the ability of
the proposed model (AIRY) to overcome this problem was tested to observe any evidence of
improved accuracy.
4.4.3. The Accuracy of the Proposed Model (AIRY)
The ability of the system to overcome the issue of the presence of people in this experiment was
examined using 65 testing points. The system targeted accuracy improvements of less than 1 m. The
average accuracy in the initial position was 2.04 m. After the RSSI adaptation process, which
considered the people effect, a new average accuracy of 0.57 m was obtained, indicating a very
significant improvement in accuracy. The proposed model succeeded at reaching the target of under
1 m accuracy.
The AIRY model requires the knowledge of people’s positions around the MD. Outside the
controlled experiment, at this time this knowledge can be acquired manually by users. There is a
feature in the AIRY apps that can be used by the user to provide the information about people’s
positions around the MD. In future work, it can use image processing to provide this information
automatically based on an image from closed-circuit television (CCTV). The proposed approach
tracked the position of people with 3m distance from MD. Then based on people’s positions around
MD, initial position of MD, and position of APs, the system will determine the position of the people
whether in the LOS or NLOS position to apply the RSSI adjustments (RSSI adaptation).
A total of 3 RSSIs were recorded by the MD as emitted by 3 APs. The people influenced each
RSSI when they were positioned around the MD in the LOS or NLOS positions. Because there were 3
APs, there were also 8 variations in the position of the people, as shown in Table 10. When the
positions of the people against the 3 APs were all in the NLOS, an initial error value of 1.92 m was
Figure 20. The average accuracy of indoor-positioning system (IPS) due to the influence of peoplepresent in the NLOS position.
The influence of people present in the LOS position was greater than in the NLOS position.The presence of people in the LOS position caused a decrease in accuracy of 273%, 322%, and 334% forthe affected 1 AP, 2 APs, and 3 APs, respectively, using the ARM-RT database.
The paper focuses on the influence of people around the user so that during data retrieval andtesting the mobile device (MD) is not held by human experimenter but the mobile device is fixedon a tripod. Based on the experiments, the accuracy of the proposed model is not affected by thephone orientation. However, if the MD is held by a human experimenter, the MD orientation willaffect the accuracy because the MD orientation affects the human experimenter’s position on MD andaccess points.
PPE had a significant effect on IPS accuracy. In the worst case, in which the RSSI from the threeAPs was influenced by people in the LOS, IPS accuracy was reduced by 334%. Hence, the abilityof the proposed model (AIRY) to overcome this problem was tested to observe any evidence ofimproved accuracy.
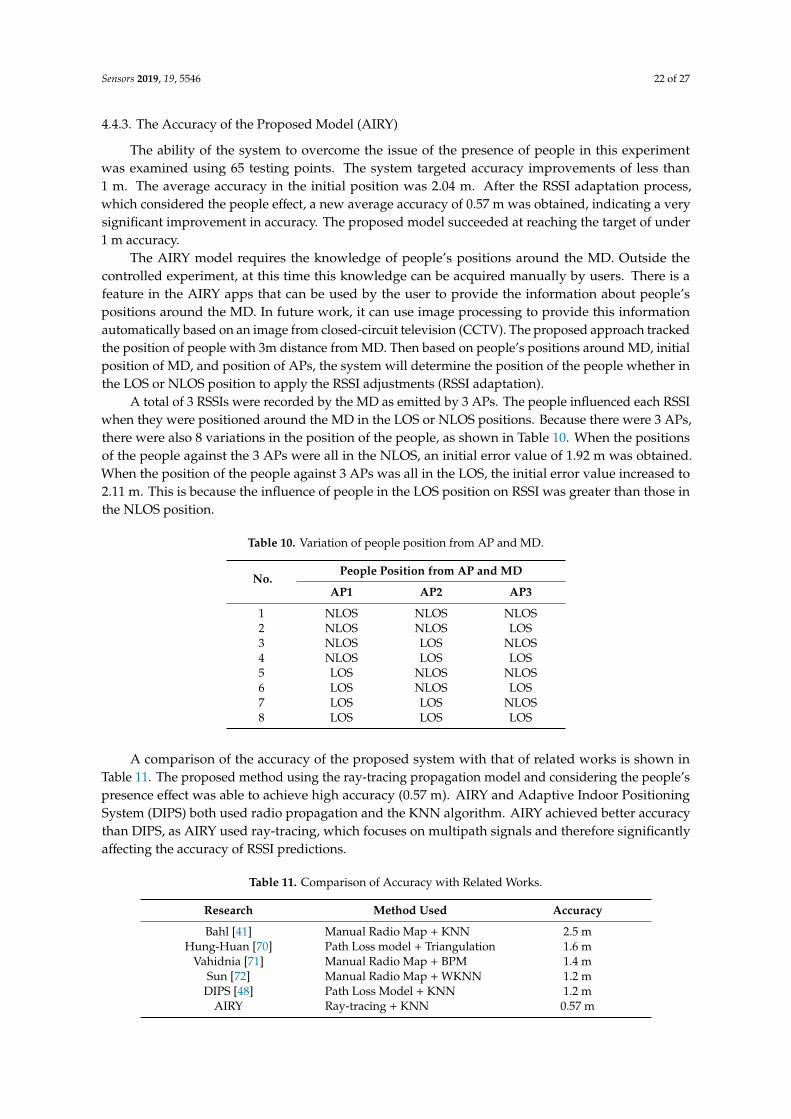
Sensors 2019, 19, 5546 22 of 27
4.4.3. The Accuracy of the Proposed Model (AIRY)
The ability of the system to overcome the issue of the presence of people in this experimentwas examined using 65 testing points. The system targeted accuracy improvements of less than1 m. The average accuracy in the initial position was 2.04 m. After the RSSI adaptation process,which considered the people effect, a new average accuracy of 0.57 m was obtained, indicating a verysignificant improvement in accuracy. The proposed model succeeded at reaching the target of under1 m accuracy.
The AIRY model requires the knowledge of people’s positions around the MD. Outside thecontrolled experiment, at this time this knowledge can be acquired manually by users. There is afeature in the AIRY apps that can be used by the user to provide the information about people’spositions around the MD. In future work, it can use image processing to provide this informationautomatically based on an image from closed-circuit television (CCTV). The proposed approach trackedthe position of people with 3m distance from MD. Then based on people’s positions around MD, initialposition of MD, and position of APs, the system will determine the position of the people whether inthe LOS or NLOS position to apply the RSSI adjustments (RSSI adaptation).
A total of 3 RSSIs were recorded by the MD as emitted by 3 APs. The people influenced each RSSIwhen they were positioned around the MD in the LOS or NLOS positions. Because there were 3 APs,there were also 8 variations in the position of the people, as shown in Table 10. When the positionsof the people against the 3 APs were all in the NLOS, an initial error value of 1.92 m was obtained.When the position of the people against 3 APs was all in the LOS, the initial error value increased to2.11 m. This is because the influence of people in the LOS position on RSSI was greater than those inthe NLOS position.
Table 10. Variation of people position from AP and MD.
No.People Position from AP and MD
AP1 AP2 AP3
1 NLOS NLOS NLOS2 NLOS NLOS LOS3 NLOS LOS NLOS4 NLOS LOS LOS5 LOS NLOS NLOS6 LOS NLOS LOS7 LOS LOS NLOS8 LOS LOS LOS
A comparison of the accuracy of the proposed system with that of related works is shown inTable 11. The proposed method using the ray-tracing propagation model and considering the people’spresence effect was able to achieve high accuracy (0.57 m). AIRY and Adaptive Indoor PositioningSystem (DIPS) both used radio propagation and the KNN algorithm. AIRY achieved better accuracythan DIPS, as AIRY used ray-tracing, which focuses on multipath signals and therefore significantlyaffecting the accuracy of RSSI predictions.
Table 11. Comparison of Accuracy with Related Works.
Research Method Used Accuracy
Bahl [41] Manual Radio Map + KNN 2.5 mHung-Huan [70] Path Loss model + Triangulation 1.6 m
Vahidnia [71] Manual Radio Map + BPM 1.4 mSun [72] Manual Radio Map + WKNN 1.2 m
DIPS [48] Path Loss Model + KNN 1.2 mAIRY Ray-tracing + KNN 0.57 m

Sensors 2019, 19, 5546 23 of 27
5. Conclusions
In this paper, an accurate indoor-positioning model based on WLAN fingerprinting was designedand validated. This model addressed the drawbacks of the traditional fingerprint method by generatingan automatic RM database based on a ray-tracing model (ARM-RT), an indoor propagation model thatconsiders the multipath effect, and an accurate indoor-positioning model based on the people effectand ray-tracing (AIRY). ARM-RT is the major contribution of this research. It is a solution to one ofthe main problems in IPS WLAN fingerprinting because RM construction requires a lot of time andenergy. RM construction not only focuses on the direct signal from the AP to the MD but also takesinto account reflection. The construction of a manual radio map for the 3rd floor of Razak Tower took8 h, while the automatic radio map construction using ray-tracing only took about 30 min. Also, verysatisfactory MSE values were obtained compared to the automatic radio map that used multi-wallmodels, where 12.19 dBm2 was obtained for the ray-tracing model and 92.38 dBm2 was recordedfor the multi wall-model. The system accuracy was also very good, which was 0.97 m. The maincontribution of this study is a highly accurate positioning system. Such high accuracy was obtainedby adding an adaptation process in the initial RSSI. The adapted RSSI vectors were calculated basedon initial RSSI as input and considering the presence of people around the initial position. The rulesthat applied to the adaptation of the RSSI vector were as follows: if there are people in the NLOSposition (between the APx position and the initial position), the RSSI value of the APx received byMD was increased by 0.5 dBm (NLOS PPE constant), and if the people are in the LOS position, RSSIwas increased by 5 dBm (LOS PPE constant). Then, if there are no people, the RSSI value does notchange. The average accuracy in the initial position was 2.04 m. After the RSSI adaptation process, anew average accuracy of 0.57 m was obtained, indicating a very significant improvement in accuracy.
Author Contributions: F.F. and N.A.A. conceived and designed the experiments; F.F. performed the experiments;F.F., N.A.A. and S.S. analyzed the data; F.F. presented the data and wrote the paper.
Funding: This work has been supported by UTM Grant (UTM-TDR 9.2(T1)). Hence, the authors would like tothank Universiti Teknologi Malaysia (UTM) for their support.
Conflicts of Interest: The authors declare no conflict of interest.
References
1. ABI Research. Retail Indoor Location Market Breaks US$10 Billion in 2020; ABI Research: New York, NY, USA, 2015.2. Indoor Positioning and Navigation—Global Market Outlook (2017–2026). Available online: https://www.
researchandmarkets.com/reports/4765038/indoor-positioning-and-navigation-global-market (accessed on11 August 2019).
3. Mier, J.; Jaramillo-Alcázar, A.; Freire, J.J. At a Glance: Indoor Positioning Systems Technologies and TheirApplications Areas. In Information Technology and Systems; Springer: Cham, Switzerland, 2019; pp. 483–493.
4. Shu, Y.; Bo, C.; Shen, G.; Zhao, C.; Li, L.; Zhao, F. Magicol: Indoor Localization Using Pervasive MagneticField and Opportunistic WiFi Sensing. IEEE J. Sel. Areas Commun. 2015, 33, 1443–1457. [CrossRef]
5. Lu, G.; Yan, Y.; Ren, L.; Saponaro, P.; Sebe, N.; Kambhamettu, C. Where am i in the dark: Exploring activetransfer learning on the use of indoor localization based on thermal imaging. Neurocomputing 2016, 173,83–92. [CrossRef]
6. Mautz, R.; Tilch, S. Survey of optical indoor positioning systems. In Proceedings of the 2011 InternationalConference on Indoor Positioning and Indoor Navigation, Guimaraes, Portugal, 21–23 September 2011;pp. 1–7.
7. Han, D.; Jung, S.; Lee, S. A sensor fusion method for Wi-Fi-based indoor positioning. ICT Express 2016, 2,71–74. [CrossRef]
8. Zourmand, A.; Sheng, N.W.; Hing, A.L.K.; AbdulRehman, M. Human Counting and Indoor PositioningSystem Using WiFi Technology. In Proceedings of the 2018 IEEE International Conference on AutomaticControl and Intelligent Systems (I2CACIS), Shah Alam, Malaysia, 20 October 2018; pp. 142–147.
Sensors 2019, 19, 5546 24 of 27
9. Hsieh, H.-Y.; Prakosa, S.W.; Leu, J.-S. Towards the Implementation of Recurrent Neural Network Schemesfor WiFi Fingerprint-Based Indoor Positioning. In Proceedings of the 2018 IEEE 88th Vehicular TechnologyConference (VTC-Fall), Chicago, IL, USA, 27–30 August 2018; pp. 1–5.
10. Faragher, R.; Harle, R. Location Fingerprinting with Bluetooth Low Energy Beacons. IEEE J. Sel. Areas Commun.2015, 33, 2418–2428. [CrossRef]
11. Dong, Z.Y.; Xu, W.M.; Zhuang, H. Research on ZigBee Indoor Technology Positioning Based on RSSI.Procedia Comput. Sci. 2019, 154, 424–429. [CrossRef]
12. Tsirmpas, C.; Rompas, A.; Fokou, O.; Koutsouris, D. An indoor navigation system for visually impaired andelderly people based on Radio Frequency Identification (RFID). Inf. Sci. 2015, 320, 288–305. [CrossRef]
13. Popleteev, A. Improving ambient FM indoor localization using multipath-induced amplitude modulationeffect: A year-long experiment. Pervasive Mob. Comput. 2019, 58, 101022. [CrossRef]
14. Witrisal, K.; Hinteregger, S.; Kulmer, J.; Leitinger, E.; Meissner, P. High-accuracy positioning for indoorapplications: RFID, UWB, 5G, and beyond. In Proceedings of the 2016 IEEE International Conference onRFID (RFID), Orlando, FL, USA, 3–5 May 2016; pp. 1–7.
15. Konings, D.; Alam, F.; Noble, F.; Lai, E.M. Device-Free Localization Systems Utilizing Wireless RSSI:A Comparative Practical Investigation. IEEE Sens. J. 2018, 19, 2747–2757. [CrossRef]
16. Pecoraro, G.; Di Domenico, S.; Cianca, E.; De Sanctis, M. LTE signal fingerprinting localization based onCSI. In Proceedings of the 2017 IEEE 13th International Conference on Wireless and Mobile Computing,Networking and Communications (WiMob), Rome, Italy, 9–11 October 2017; pp. 1–8.
17. Yang, C.; Shao, H.-R. WiFi-based indoor positioning. IEEE Commun. Mag. 2015, 53, 150–157. [CrossRef]18. Farid, Z.; Nordin, R.; Ismail, M. Recent advances in wireless indoor localization techniques and system.
J. Comput. Netw. Commun. 2013, 2013, 185138. [CrossRef]19. He, S.; Chan, S.-H.G. Wi-Fi fingerprint-based indoor positioning: Recent advances and comparisons.
IEEE Commun. Surv. Tutor. 2016, 18, 466–490. [CrossRef]20. Ubom, E.A.; Akpanobong, A.C.; Abraham, I.I. Characterization of Indoor Propagation Properties and
Performance Evaluation for 2.4 Ghz Band Wi-Fi. Int. J. Wirel. Mob. Netw. 2019, 11, 27–37. [CrossRef]21. Saito, K.; Omiya, M. A Computational Study of Indoor-to-Outdoor Propagation in Office Environment at
2.4 GHz and 5.2 GHz Bands. In Proceedings of the 2018 IEEE International Workshop on Electromagnetics:Applications and Student Innovation Competition (iWEM), Nagoya, Japan, 29–31 August 2018; pp. 1–2.
22. Santana, J.A.; Macías, E.; Suárez, Á.; Marrero, D.; Mena, V. Adaptive estimation of WiFi RSSI and its impactover advanced wireless services. Mob. Netw. Appl. 2017, 22, 1100–1112. [CrossRef]
23. Alabish, A.; Kara, A.; Dalveren, Y. An Experimental Study towards Examining Human Body Movements inIndoor Wave Propagation at 18–22 GHz. In Proceedings of the 2018 International Symposium on Networks,Computers and Communications (ISNCC), Rome, Italy, 19–21 June 2018; pp. 1–4.
24. Alshami, I.H.; Ahmad, N.A.; Sahibuddin, S. People effects on WLAN-Based IPS’ accuracy experimentalpreliminary results. In Proceedings of the 2014 8th Malaysian Software Engineering Conference (MySEC)2014, Langkawi, Malaysia, 23–24 September 2014; pp. 206–209.
25. Slezak, C.; Semkin, V.; Andreev, S.; Koucheryavy, Y.; Rangan, S. Empirical effects of dynamic human-bodyblockage in 60 GHz communications. IEEE Commun. Mag. 2018, 56, 60–66. [CrossRef]
26. Booranawong, A.; Sengchuai, K.; Jindapetch, N. Implementation and test of an RSSI-based indoor targetlocalization system: Human movement effects on the accuracy. Measurement 2019, 133, 370–382. [CrossRef]
27. Booranawong, A.; Jindapetch, N.; Saito, H. A system for detection and tracking of human movements usingRSSI signals. IEEE Sens. J. 2018, 18, 2531–2544. [CrossRef]
28. Alshami, I.H.; Ahmad, N.A.; Sahibuddin, S. People’s Presence Effect on WLAN-Based IPS Accuracy. J. Teknol.2015, 77.
29. Trogh, J.; Joseph, W.; Martens, L.; Plets, D. An unsupervised learning technique to optimize radio maps forindoor localization. Sensors 2019, 19, 752. [CrossRef]
30. Meneses, F.; Moreira, A.; Costa, A.; Nicolau, M.J. Radio Maps for Fingerprinting in Indoor Positioning.In Geographical and Fingerprinting Data to Create Systems for Indoor Positioning and Indoor/Outdoor Navigation;Elsevier: Amsterdam, The Netherlands, 2019; pp. 69–95.
31. Alshami, I.H.M.; Salleh, N.A.; Sahibuddin, S. Automatic WLAN fingerprint radio map generation foraccurate indoor positioning based on signal path loss model. ARPN J. Eng. Appl. Sci. 2015, 10, 17930–17936.

Sensors 2019, 19, 5546 25 of 27
32. Du, Y.; Yang, D.; Xiu, C. A Novel Method for Constructing a WIFI Positioning System with EfficientManpower. Sensors 2015, 15, 8358–8381. [CrossRef]
33. Lin, K.-S.; Wong, A.K.-S.; Wong, T.-L.; Lea, C.-T. Adaptive WiFi Positioning System with UnsupervisedMap Construction. In Proceedings of the 17th International Conference on Artificial Intelligence,Las Vegas, NV, USA, 27–30 July 2015; p. 636.
34. Ferris, B.; Fox, D.; Lawrence, N.D. Wifi-slam using gaussian process latent variable models. In Proceedingsof the 20th International Joint Conference on Artifical Intelligence, Hyderabad, India, 6–12 January 2007;Volume 7, pp. 2480–2485.
35. Shen, G.; Chen, Z.; Zhang, P.; Moscibroda, T.; Zhang, Y. Walkie-Markie: Indoor pathway mapping madeeasy. In Proceedings of the 10th USENIX Conference on Networked Systems Design and Implementation,Lombard, IL, USA, 2–5 April 2013; pp. 85–98.
36. Kim, Y.; Shin, H.; Chon, Y.; Cha, H. Crowdsensing-based Wi-Fi radio map management using a lightweightsite survey. Comput. Commun. 2015, 60, 86–96. [CrossRef]
37. He, S.; Shin, K.G. Steering crowdsourced signal map construction via Bayesian compressivesensing. In Proceedings of the IEEE INFOCOM 2018-IEEE Conference on Computer Communications,Honolulu, HI, USA, 16–19 April 2018; pp. 1016–1024.
38. Zhuang, Y.; Syed, Z.; Georgy, J.; El-Sheimy, N. Autonomous smartphone-based WiFi positioning system byusing access points localization and crowdsourcing. Pervasive Mob. Comput. 2015, 18, 118–136. [CrossRef]
39. Gu, Z.; Chen, Z.; Zhang, Y.; Zhu, Y.; Lu, M.; Chen, A. Reducing fingerprint collection for indoor localization.Comput. Commun. 2016, 83, 56–63. [CrossRef]
40. Bi, J.; Wang, Y.; Li, Z.; Xu, S.; Zhou, J.; Sun, M.; Si, M. Fast radio map construction by using adaptive pathloss model interpolation in large-scale building. Sensors 2019, 19, 712. [CrossRef]
41. Bahl, P.; Padmanabhan, V.N. RADAR: An in-building RF-based user location and tracking system.In Proceedings of the INFOCOM 2000, Nineteenth Annual Joint Conference of the IEEE Computer andCommunications Societies, Tel Aviv, Israel, 26–30 March 2000; Volume 2, pp. 775–784.
42. Schauer, L.; Marcus, P.; Linnhoff-Popien, C. Towards feasible Wi-Fi based indoor tracking systems usingprobabilistic methods. In Proceedings of the 2016 International Conference on Indoor Positioning and IndoorNavigation (IPIN), Sapporo, Japan, 18–21 September 2017; pp. 1–8.
43. Yadav, R.K.; Bhattarai, B.; Gang, H.-S.; Pyun, J.-Y. Trusted K Nearest Bayesian Estimation for IndoorPositioning System. IEEE Access 2019, 7, 51484–51498. [CrossRef]
44. Hu, J.; Liu, D.; Yan, Z.; Liu, H. Experimental Analysis on Weight K-Nearest Neighbor Indoor FingerprintPositioning. IEEE Internet Things J. 2018, 6, 891–897. [CrossRef]
45. Garcia-Villalonga, S.; Perez-Navarro, A. Influence of human absorption of Wi-Fi signal in indoor positioningwith Wi-Fi fingerprinting. In Proceedings of the 2015 International Conference on Indoor Positioning andIndoor Navigation (IPIN), Banff, AB, Canada, 13–16 October 2015; pp. 1–10.
46. Koda, Y.; Yamamoto, K.; Nishio, T.; Morikura, M. Measurement method of temporal attenuation by humanbody in off-the-shelf 60 GHz WLAN with HMM-based transmission state estimation. Wirel. Commun.Mob. Comput. 2018, 2018, 7846936. [CrossRef]
47. Alshami, I.H.; Ahmad, N.A.; Sahibuddin, S.; Yusof, Y.M. The effect of people presence on WLAN RSS isgoverned by influence distance. In Proceedings of the 2016 3rd International Conference on Computer andInformation Sciences (ICCOINS), Kuala Lumpur, Malaysia, 15–17 August 2016; pp. 197–202.
48. Alshami, I.H.; Ahmad, N.A.; Sahibuddin, S.; Firdaus, F. Adaptive Indoor Positioning Model Based onWLAN-Fingerprinting for Dynamic and Multi-Floor Environments. Sensors 2017, 17, 1789. [CrossRef]
49. Yun, Z.; Iskander, M.F. Ray tracing for radio propagation modeling: Principles and applications. IEEE Access2015, 3, 1089–1100. [CrossRef]
50. Felsen, L.B.; Marcuvitz, N. Radiation and Scattering of Waves; John Wiley & Sons: Hoboken, NJ, USA, 1994;ISBN 978-0-7803-1088-9.
51. Kouyoumjian, R.G.; Pathak, P.H. A uniform geometrical theory of diffraction for an edge in a perfectlyconducting surface. Proc. IEEE 1974, 62, 1448–1461. [CrossRef]
52. McKown, J.W.; Hamilton, R.L. Ray tracing as a design tool for radio networks. IEEE Netw. 1991, 5, 27–30.[CrossRef]

Sensors 2019, 19, 5546 26 of 27
53. Rossi, J.P.; Bic, J.C.; Levy, A.J.; Gabillett, Y.; Rosen, M. A ray launching method for radio-mobile propagationin urban area. In Proceedings of the Antennas and Propagation Society Symposium 1991 Digest,London, ON, Canada, 24–28 June 1991; pp. 1540–1543.
54. Seidel, S.Y.; Rappaport, T.S. A ray tracing technique to predict path loss and delay spread insidebuildings. In Proceedings of the GLOBECOM’92-Communications for Global Users, Orlando, FL, USA,6–9 December 1992; pp. 649–653.
55. He, J.; Li, S.; Pahlavan, K.; Wang, Q. A realtime testbed for performance evaluation of indoor TOAlocation system. In Proceedings of the 2012 IEEE International Conference on Communications (ICC),Ottawa, ON, Canada, 10–15 June 2012; pp. 482–486.
56. Saeidi, C.; Kamyab, M.; Fard, A. Fast Ray Tracing Propagation Prediction Model for Indoor Environments.In Proceedings of the 7th International Symposium on Antennas, Propagation & EM Theory (ISAPE’06),Guilin, China, 26–29 October 2006; pp. 1–4.
57. El-Kafrawy, K.; Youssef, M.; El-Keyi, A.; Naguib, A. Propagation modeling for accurate indoor WLANRSS-based localization. In Proceedings of the 2010 IEEE 72nd Vehicular Technology Conference—Fall,Ottawa, ON, Canada, 6–9 September 2010; pp. 1–5.
58. Fuschini, F.; Vitucci, E.M.; Barbiroli, M.; Falciasecca, G.; Degli-Esposti, V. Ray tracing propagation modelingfor future small-cell and indoor applications: A review of current techniques. Radio Sci. 2015, 50, 469–485.[CrossRef]
59. Hosseinzadeh, S.; Larijani, H.; Curtis, K.; Wixted, A.; Amini, A. Empirical propagation performanceevaluation of LoRa for indoor environment. In Proceedings of the 2017 IEEE 15th International Conferenceon Industrial Informatics (INDIN), Emden, Germany, 24–26 July 2017; pp. 26–31.
60. Liu, H.; Darabi, H.; Banerjee, P.; Liu, J. Survey of wireless indoor positioning techniques and systems.IEEE Trans. Syst. ManCybern. Part C 2007, 37, 1067–1080. [CrossRef]
61. Dardari, D.; Closas, P.; Djuric, P.M. Indoor Tracking: Theory, Methods, and Technologies. IEEE Trans.Veh. Technol. 2015, 64, 1263–1278. [CrossRef]
62. Zafari, F.; Gkelias, A.; Leung, K.K. A survey of indoor localization systems and technologies. IEEE Commun.Surv. Tutor. 2019, 21, 2568–2599. [CrossRef]
63. Brena, R.F.; García-Vázquez, J.P.; Galván-Tejada, C.E.; Muñoz-Rodriguez, D.; Vargas-Rosales, C.; Fangmeyer, J.Evolution of indoor positioning technologies: A survey. J. Sens. 2017, 2017, 2630413. [CrossRef]
64. Hossain, F.; Geok, T.; Rahman, T.; Hindia, M.; Dimyati, K.; Abdaziz, A. Indoor Millimeter-Wave PropagationPrediction by Measurement and Ray Tracing Simulation at 38 GHz. Symmetry 2018, 10, 464. [CrossRef]
65. Azpilicueta, L.; Falcone, F.; Janaswamy, R. A Hybrid Ray Launching-Diffusion Equation Approach forPropagation Prediction in Complex Indoor Environments. IEEE Antennas Wirel. Propag. Lett. 2017, 16,214–217. [CrossRef]
66. Casino, F.; Azpilicueta, L.; Lopez-Iturri, P.; Aguirre, E.; Falcone, F.; Solanas, A. Optimized WirelessChannel Characterization in Large Complex Environments by Hybrid Ray Launching-Collaborative FilteringApproach. IEEE Antennas Wirel. Propag. Lett. 2017, 16, 780–783. [CrossRef]
67. Ji, Y.; Player, R. A 3-D indoor radio propagation model for WiFi and RFID. In Proceedings of the9th ACM International Symposium on Mobility Management and Wireless Access, Miami, FL, USA,31 October–4 November 2011; pp. 27–34.
68. Chizhik, D.; Valenzuela, R.A.; Rodriguez, M.; Feick, R. Propagation into buildings: Theory vs. measurements.In Proceedings of the 2016 IEEE International Symposium on Antennas and Propagation (APSURSI),Fajardo, Puerto Rico, 26 June–1 July 2016; pp. 1455–1456.
69. Salem, M.; Ismail, M.; Misran, N. Validation of Three-Dimensional Ray-Tracing Algorithm for IndoorWireless Propagations. Available online: https://www.hindawi.com/journals/isrn/2011/324758/ (accessed on12 December 2018).
70. Liu, H.-H.; Yang, Y.-N. WiFi-based indoor positioning for multi-floor environment. In Proceedings of the2011 IEEE Region 10 Conference (TENCON 2011), Bali, Indonesia, 21–24 November 2011; pp. 597–601.

Sensors 2019, 19, 5546 27 of 27
71. Vahidnia, M.H.; Malek, M.R.; Mohammadi, N.; Alesheikh, A.A. A hierarchical signal-space partitioningtechnique for indoor positioning with WLAN to support location-awareness in mobile map services.Wirel. Pers. Commun. 2013, 69, 689–719. [CrossRef]
72. Sun, L.; Zheng, Z.; He, T.; Li, F. Multifloor Wi-Fi localization system with floor identification. Int. J. Distrib.Sens. Netw. 2015, 11, 131523. [CrossRef]
© 2019 by the authors. Licensee MDPI, Basel, Switzerland. This article is an open accessarticle distributed under the terms and conditions of the Creative Commons Attribution(CC BY) license (http://creativecommons.org/licenses/by/4.0/).
Related Documents