1 Accuracy, precision and reliability in anthropometric surveys for ergonomics purposes in adult working populations: A literature review Viviani, C. (1)*, Arezes, P.M. (2), Bragança, S (3), Molenbroek, J. (4), Dianat, I. (5), Castellucci, H.I. (6)*. (1), Facultad de Ciencias, Escuela de Kinesiología, Pontificia Universidad Católica de Valparaíso, Chile (2) Research Centre on Industrial and Technology Management, School of Engineering, University of Minho, 4800-058 Guimarães, Portugal. (3) Research and Innovation, Southampton Solent University, Southampton, United Kingdom. (4) Delft University of Technology, Faculty of Industrial Design Engineering Section Applied Ergonomics and Design, Landbergstraat 15 2628 CE Delft, The Netherlands. (5) Department of Ergonomics, Faculty of Health, Tabriz University of Medical Sciences, Tabriz, Iran (6) Centro de Estudio del Trabajo y Factores Humanos, Escuela de Kinesiología, Facultad de Medicina, Universidad de Valparaíso, Chile. *Corresponding author: Tel.: +56-9-54123855; E-mail: [email protected] Tel.: +56-9-54123829; E-mail: [email protected] ABSTRACT Anthropometric surveys are the most common method of gathering human morphometric data, used to design clothing, products and workspaces. The aim of this paper was to assess how current peer reviewed literature addresses the accuracy, reliability and precision regarding manual anthropometric surveys applied to adult working populations in the field of ergonomics. A literature review was performed in two electronic databases for finding relevant papers. A total of 312 papers were reviewed, of which 79 met the inclusion criteria. The results shown that the subjects of these publications are poorly addressed, so that only 27 studies mentioned at least one of the terms and none of the studies evaluated all of the terms. Only one paper mentioned and assessed precision and reliability of the measurement procedure. Furthermore, none of the publications evaluated accuracy. Moreover, the reviewed papers presented large differences in the factors that affect precision, reliability and accuracy. This was particularly clear in the measurer technique/training, measurement tools, subject posture and clothing. Researchers in this area should take more rigorous approaches and explicit indicators with their results should be presented in any report. Relevance for industry: It is important that scientific literature related to manual anthropometric measurements uses methods for assessing measurement error, since these data are often used to design clothing and workspaces as well as to calibrate non manual methods such as 3D scanners. Keywords: Anthropometry, measures, physical ergonomics, quality control, measurement error. 1. INTRODUCTION Anthropometry is the branch of the human sciences that deals with body measurements: measurements of body size, shape, strength and working capacity (Pheasant & Steenbekkers, 2005). The characteristics of any given population will depend upon a number of factors, of which the most relevant ones from an ergonomics point of view are: gender, age, ethnicity and occupation (Pheasant & Steenbekkers, 2005). All of these aspects must be considered in order to match the designs of products, environments and systems, as a whole. The

Welcome message from author
This document is posted to help you gain knowledge. Please leave a comment to let me know what you think about it! Share it to your friends and learn new things together.
Transcript
1
Accuracy, precision and reliability in anthropometric surveys for ergonomics purposes in adult working populations: A literature review
Viviani, C. (1)*, Arezes, P.M. (2), Bragança, S (3), Molenbroek, J. (4), Dianat, I. (5), Castellucci, H.I. (6)*.
(1), Facultad de Ciencias, Escuela de Kinesiología, Pontificia Universidad Católica de Valparaíso, Chile
(2) Research Centre on Industrial and Technology Management, School of Engineering, University of Minho, 4800-058 Guimarães, Portugal.
(3) Research and Innovation, Southampton Solent University, Southampton, United Kingdom.
(4) Delft University of Technology, Faculty of Industrial Design Engineering Section Applied Ergonomics and Design, Landbergstraat 15 2628 CE Delft, The Netherlands.
(5) Department of Ergonomics, Faculty of Health, Tabriz University of Medical Sciences, Tabriz, Iran
(6) Centro de Estudio del Trabajo y Factores Humanos, Escuela de Kinesiología, Facultad de Medicina, Universidad de Valparaíso, Chile.
*Corresponding author:
Tel.: +56-9-54123855; E-mail: [email protected]
Tel.: +56-9-54123829; E-mail: [email protected]
ABSTRACT
Anthropometric surveys are the most common method of gathering human morphometric data, used to design clothing, products and workspaces. The aim of this paper was to assess how current peer reviewed literature addresses the accuracy, reliability and precision regarding manual anthropometric surveys applied to adult working populations in the field of ergonomics. A literature review was performed in two electronic databases for finding relevant papers. A total of 312 papers were reviewed, of which 79 met the inclusion criteria. The results shown that the subjects of these publications are poorly addressed, so that only 27 studies mentioned at least one of the terms and none of the studies evaluated all of the terms. Only one paper mentioned and assessed precision and reliability of the measurement procedure. Furthermore, none of the publications evaluated accuracy. Moreover, the reviewed papers presented large differences in the factors that affect precision, reliability and accuracy. This was particularly clear in the measurer technique/training, measurement tools, subject posture and clothing. Researchers in this area should take more rigorous approaches and explicit indicators with their results should be presented in any report. Relevance for industry: It is important that scientific literature related to manual anthropometric measurements uses methods for assessing measurement error, since these data are often used to design clothing and workspaces as well as to calibrate non manual methods such as 3D scanners.
Keywords: Anthropometry, measures, physical ergonomics, quality control, measurement error.
1. INTRODUCTION
Anthropometry is the branch of the human sciences that deals with body measurements: measurements of body size, shape, strength and working capacity (Pheasant & Steenbekkers, 2005). The characteristics of any given population will depend upon a number of factors, of which the most relevant ones from an ergonomics point of view are: gender, age, ethnicity and occupation (Pheasant & Steenbekkers, 2005). All of these aspects must be considered in order to match the designs of products, environments and systems, as a whole. The
2
physical characteristics of target users (Garneau & Parkinson, 2016) have to be considered to allow the workplaces and products to be suited to the workers’ body size and motion (Kroemer & Grandjean, 1997). The criteria that define a successful outcome to the design process falls into three main groups: comfort, performance, and health and safety. These three factors together benefit the companies’ productivity and efficiency (Pheasant & Steenbekkers, 2005).
Currently, anthropometry is considered as an important factor for the prevention of several work-related problems. This matter is being addressed by specific international technical standards (ISO, 2008, 2010a, 2010b, 2013) and other technical standards that take into account anthropometry for prevention of diseases and accidents (ISO, 2000, 2002, 2003). Additionally, there are even standards for specific industrial sectors like control rooms (ISO, 2011) and healthcare (ISO, 2012a). There are several large anthropometry databases, some of the most relevant ones being mentioned in ISO (2010b), such as the CAESAR database that considered US and European populations (Harrison & Robinette, 2002; Robinette et al., 2002). Furthermore, ISO (2010b) also includes databases from other countries like Japan, Korea, Thailand, Italy, Kenya. All the databases presented in ISO 7250-2 collected anthropometric measurements with either just manual techniques (Thailand, Germany, Italy, Japan, Kenya, Korea), with 3D scans (US), or both techniques (Netherlands). Other highly relevant large sources of anthropometric data are the ANSUR, MC-ANSUR and ANSUR II surveys, where military personnel were measured (Gordon et al., 1988; 2012; 2013). Likewise, NASA has collected large amounts of data, for their interspace shuttle designs (NASA, 1978) and even for specific sectors such as truck drivers (Guan et al., 2015). Similar research efforts have also produced large anthropometric databases using civilians of other countries such as Korea (Korean Agency for Technology and Standards, 2004) and Japan (Research Institute of Human Engineering for Quality Life, 2007).
Manual measurements of anthropometric characteristics are commonly used due to their main benefits: relatively low cost compared to more automated equipment like 3D scans; ease of measurements and the need for less complex equipment. However, manual anthropometric techniques can present issues related to human measurement errors (Sicotte et al., 2010). When anthropometrical measures are repeated the two sources of variation are: biological variation of individuals – that cannot be avoided – and technical variations – that can be avoided. The variability on the anthropometrical measurements caused by variations on the technique execution is responsible for a higher incidence of error (Perini et al., 2005).
Anthropometry is very sensitive to measurement error (Villamor & Bosch, 2014). To avoid the variability of the measures and reduce measurement error, the World Health Organization proposed the following quality assurance measures (WHO, 2006): (i) standardized data collection methodology, (ii) rigorous training and monitoring of data collection personnel, (iii) frequent and effective equipment calibration and maintenance, and (iv) periodic assessment of anthropometric measurement reliability. Furthermore, the International Standard Organization (ISO) developed some standards (ISO, 2008, 2013) that provide a description of anthropometric measurements which can serve as a guide for ergonomists to make possible comparisons between international population segments.
Published scientific literature use several terms to define anthropometric measurement error. Regardless of the terms used, the effects of measurement error can be mainly categorized depending by the extent to which the repeated measures give the same value or the extent to which a measure departs from the true value (Ulijaszek & Kerr, 1999).
1.1. Repeated Measures: precision and reliability
While there are several definitions of precision and reliability in the published literature (Habicht et al., 1979; Heymsfield et al., 1984; Mueller & Martorell, 1988; Norton & Olds, 1996; Ulijaszek & Kerr, 1999; Wong et al., 2008), they may confuse readers since they are very similar, thus, for the purposes of this paper, we defined the precision according to Norton and Olds (1996). Precision is a characteristic of a specific measurer executing a specific measurement technique on a specific body dimension (Norton & Olds, 1996). Reliability has the same
3
features plus being dependent on the individual differences (Norton & Olds, 1996). These individual differences are grouped by dependability term. Dependability is a function of physiological variation, such as biological factors, that can modify the reproducibility of the measure, even if the technique does not vary (Sicotte et al., 2010; Ulijaszek & Kerr, 1999). One example of dependability is the variation of stature in the same subject, between hours of the day, despite of the technique used to take it, as stature decreases throughout the day (Tillmann, 2001). Since reliability is usually measured using coefficients, its indicators will be, in general, more correlated in highly heterogeneous subjects than for a group of more similar ones (Pederson & Gore, 1996). Another difference is that precision measurements may be used in subsequent calculations (i.e. confidence intervals, sample size), while measures of reliability, conversely, are just technique indicators and should not be used for further calculations (Pederson & Gore, 1996). According to Pederson and Gore (1996) precision is the most basic indicator of an anthropometrist's expertise or ability. When the levels of precision are quoted in a technical report, the readers should be given both the results and the acceptable standards in order to assess the precision of each variable (Norton & Olds, 1996). For example, according to the International Society for the Advancement of Kinanthropometry (ISAK), some anthropometric dimensions like skinfolds, should have an accepted precision measured in mm, depending on the skinfold taken (Norton & Olds, 1996). Precision levels for several body measurements can be found in Gordon et al. (1988; 2012) and other technical reports that researchers can use in order to establish a baseline. Regarding other differences between precision and reliability, Bruton et al. (2000) state that reliability is related to the repeatability or consistency of measurements, measurers or instruments, and it is usually assumed that the reliability of a measurement relies on precision and dependability, where the former being the most important determinant (Mueller & Martorell, 1988). Finally, it is important to mention that precision and reliability evaluation can be performed to evaluate repeated measurers in two situations e.g.: single measurer in two or more different times (intra-measurer) or two or more measurers (inter-measurers).
1.2. True value: accuracy
Accuracy refers to the closeness of the measurements to some reference or standard value accepted as the ‘truth’ and expresses a relation to a value external to the measurement process (Roebuck et al., 1975). In anthropometry, accuracy is related to the “gold standard” which is used to compare the results of new anthropometrists against expert anthropometrists (Norton & Olds, 1996). In general, true values are complicated to identify in anthropometrics. However, those values are usually determined by comparing experienced measurers results against the research team, until a certain standard is achieved (Gordon et al.1988; Norton & Olds, 1996). Despite that, in practice this would imply that throughout the project the results obtained by the research team should be systematically compared against a gold standard, which may be very time consuming and expensive to achieve, since at least a sample of subjects should be re-measured by the experts in order to assess accuracy. Roebuck et al. (1975) mention that accuracy is generally best approximated by the use of precisely calibrated, rigid instruments carefully positioned by trained investigators under controlled environmental conditions. This statement implies that the best a research team can do is trying to be the closest to the true value, since the difficulties inherent to measure humans is a major obstacle to obtain a true value, as Pheasant & Halsegrave (2006) have pointed out: “The human body has very few sharp edges—its contours are rounded and it is generally squashy and unstable”, thus generally it must be admitted that ‘true’ values are very difficult to obtain or calculate (Ulijaszek & Kerr, 1999).
This research study, carried out mainly through a literature review, sought to answer the following research question: ‘Did the currently existing anthropometric studies published only in peer reviewed journals of adult working populations, related to ergonomics, mentioned and/or evaluated precision, reliability or accuracy of the measurement methods and data collected?
4
2. METHOD
In order to properly answer the research question, a Literature Review was used (Tranfield, Denyer, & Smart, 2003). This methodology, besides being replicable and scientifically transparent, it is also very useful to generate a basic framework for an in-depth analysis of the existing literature (Tranfield et al., 2003).
Two databases, SciVerse Scopus and PubMed, were used for finding relevant papers published in the field studies of anthropometric surveys for ergonomics purposes involving adult working population.
Regarding the search criteria, the search terms used were: ‘anthropometric characteristics’, ‘anthropometric dimensions’ and ‘anthropometric measures’. To avoid papers not falling into the topic under study, the search was performed using the Boolean operator ‘‘AND’’, together with the search term ‘ergonomics’. The following combination were used: ‘anthropometric characteristics’ AND ‘ergonomics’; ‘anthropometric dimensions’ AND ‘ergonomics’; ‘anthropometric measures’ AND ‘ergonomics’.
Apart from the criteria mentioned above, the following additional inclusion criteria were also adopted:
• Original and review articles written in English published, or in press, in peer-reviewed journals; • Published or in press between January 1990 and June 2016; • Papers that considered the evaluation of anthropometric measures by using manual methods; • Papers with an ergonomics research/application purpose; • Papers that focused on describing the execution of manual anthropometric surveys in order to
establish a database; • Papers with adult samples, with ages between 18 and 65 years old. Studies were also considered and
included if part of the study sample fell in the selected age range. Samples that included adult college/university students were also included.
Studies that merely presented anthropometric measures with focus in nutritional status, body composition or sports performance (e.g. stature, weight, body mass index, skinfolds, hip and waist circumference) were excluded. Examples of exclusions are Salamat et al. (2015), Sett & Sahu (2016) and Gabbett (2005). Studies that presented exclusively 3D or photography methods to collected data were also excluded, such as the examples of the works from Barroso et al. (2005) and Coblentz et al. (1991). In cases where manual methods where used together with other 3D methods or digitizing arms, the paper was included, and that was the case of the paper by Hsiao et al. (2014). Exclusion was also applied to studies that aimed to validate another anthropometric survey method using traditional methods (Li et al., 2008; Meunier & Yin, 2000). Studies that focused only on school children (Castellucci et al., 2015) or children only (Stone et al., 2013) were also excluded. Although some papers did use working adults anthropometric data in an ergonomics context, they were not considered since they used some already available anthropometric databases and did not take any manual measurement, thus based their findings in previously executed surveys or technical reports (e.g., Hong et al., 2014; Mavrikios et al., 2006; Snook & Ciriello, 1991; Van Veelen et al., 2003). Studies that only used special populations, such as wheel chair/disabled subjects (Kozey & Das, 2004), elderly (Dawal et al., 2015) and pregnant women (Wu et al., 2015) were also excluded.
Before starting the results and discussion process and to avoid misunderstandings, the terms/variables (e.g. accuracy, precision, reliability and their synonymous) were considered to be evaluated when an equation or formula was applied and the results were presented. Another alternative for consideration of a particular term was when there was a clear mentioning of the analysis for that term/variable. There were some cases where the terms were mentioned without any evaluation, like the study of Chavalitsakulchai and Shahnavaz (1993): “the accuracy of the measurements was checked and confirmed by rechecking measurements three times for each subject”. In these cases, although the accuracy was mentioned, it was not considered to be evaluated since neither formula nor results were presented (Table 1). Also, in the study of Chavalitsakulchai and Shahnavaz (1993) is important to notice that accuracy was not considered as “true value” but as repeated measures, which is conceptually wrong.
5
Titles and abstracts were checked separately by two of the authors in order to select relevant papers that were later analyzed for their full text. If any paper seemed suitable but the abstract was not available, then the full text was downloaded. Discrepancies among authors were referred to the others three authors, in order to perform joint discussion of the publication; thus the particular publication was included or excluded. Two authors using a standardized data extraction form reviewed full versions independently, and disagreements between them were referred to the other authors. Primary studies meeting the inclusion criteria were identified and the corresponding relevant information required was analyzed.
3. RESULTS AND DISCUSSION
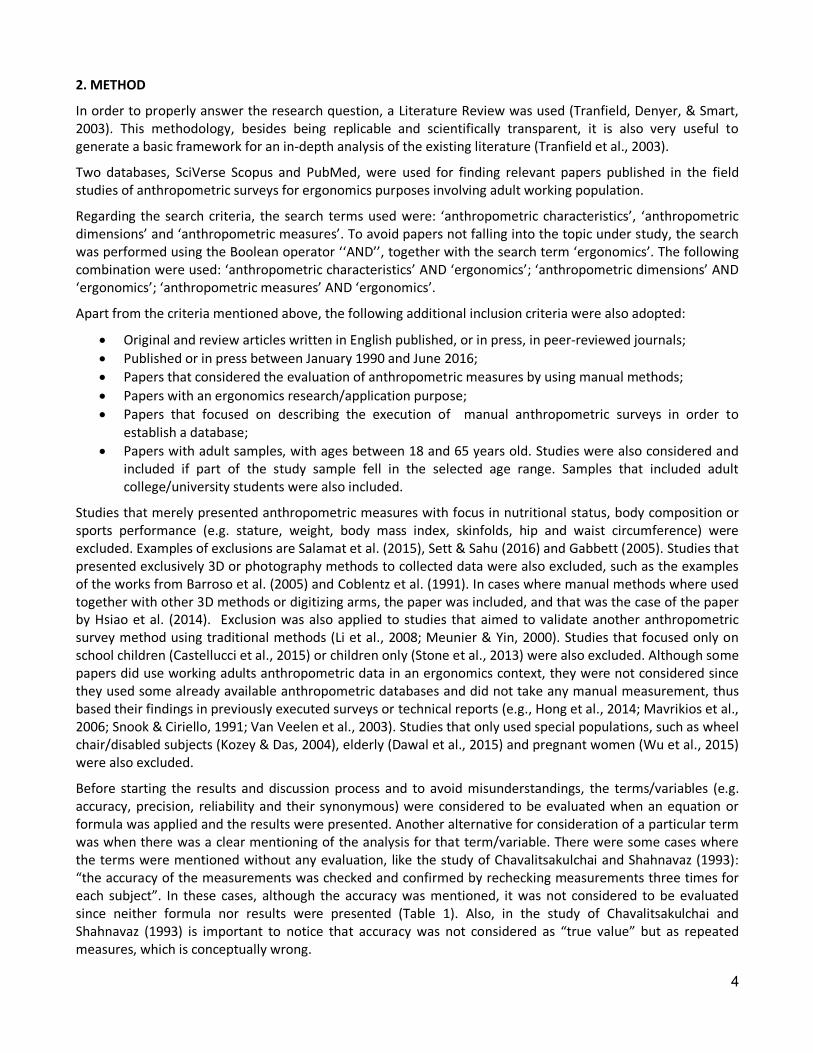
Figure 1 shows the results of the search strategy. The search on the databases resulted in an initial number of 541 papers (SCOPUS: 363 and Pubmed: 178), which was then reduced to 312 after the removal of duplicate entries. After screening the title, abstract and keywords of each article, 247 papers were identified as being potentially relevant. Additionally, when trying to access and download the articles, nine of them were not available. After reviewing the corresponding full-texts, 79 papers were selected on the basis of the inclusion criteria.
Figure 1 - Diagram of the used search strategy
3.1. True value: Accuracy
The results from Table 1 show that nine out of the 79 studies mentioned the word accuracy but none of them evaluated it. Other five authors mentioned accuracy but it was related to the instrument accuracy, not the measurement procedure (Eksioglu, 2016; Hanson et al., 2009; Khadem & Islam 2014; Mahmoudi & Bazrafshan, 2013; Mousavifard & Alvandian, 2011). It is important to point out that this study did not consider the accuracy
6
related to a gold standard, as defined on this review, thus accuracy was used here to illustrate that the used instruments were the appropriate ones. Some of the authors mentioned that accuracy of measurements was achieved by practicing prior to the data collection sessions or that it was achieved by taking more than one time and using the average value, for example the papers from Chavalitsakulchai and Shahnavaz, (1993) and Ismaila et al. (2013). This assumption is far from being correct, since the average value may not be necessarily accurate, for example one can take 3 measurements of wrist breadth for a particular subject and getting an average value that was not even measured (e.g.: (7 cm + 6 cm + 6 cm) / 3 = 6,3 cm). Therefore, it is difficult to state that using this procedure of averaging 3 measurements will, in fact, assure getting accurate or true measures (Pheasant & Haslegrave, 2006). Furthermore, most authors declared that the accuracy of the measurements was achieved by undergoing training and supervision, such as the papers by Ismaila et al. (2013) and Pourtaghi et al. (2014). In some way, the presented results of achieved accuracy could be supported by the ISO 15535 (ISO, 2012b), in which it is mentioned that "frequent and regular measurer training and quality control shall be carried out by persons experienced in anthropometry, in order to ensure acceptable standards of accuracy".
However, there are some issues that need to be addressed, considering that inaccuracy is a systematic bias, and could be associated with instrument or technique error (Ulijaszek & Kerr, 1999):
a) Instruments: considering the recommendation from ISO 7250-1 (ISO, 2008), nine of the 79 studies that mentioned accuracy, used the recommended instruments (anthropometer or sliding calliper) for data collection in the studies. However, only four specified both the type and brand, where the remaining five did not specified the brand (Table 2). On the other hand, some authors, used plastic tape (Hanson et al., 2009), steel measuring tape (Sadeghi et al., 2015) or retractable tape (Bello & Sepenu, 2013) to collect linear distances, such as foot breadth, hip breadth and popliteal height, which may affect the level of accuracy (Table 2). Other authors, such as Cai & Chen (2016), did not specify the type of instruments used for taking a particular set of measures (Table 2). Five studies mentioned accuracy in relation to the instruments, but not the procedure of measurement itself (see Table 2). Among these, two studies mentioned that equipment was calibrated or tested for accuracy, but did not present any indicators or results that shows that it was the actual measurement procedure that was under assessment and not the instruments (Eksioglu, 2016; Mahmoudi, 2013); two other studies mentioned that the equipment was also accurate did not present results or indicators for accuracy (Khadem & Islam, 2014; Mousavifard & Alvandian, 2011) and finally only one study has mentioned unit accuracy levels (i.e., the accuracy levels for the measuring tape was of 2mm) (Hanson et al., 2009) but did not present any equation or procedure adopted to determine that specific value that might have helped to know if the measurement procedure was under assessment. Instrument accuracy is an important issue that is related to the observer accuracy, and though it was a concern for many authors, this issue was poorly addressed in the reviewed papers. A deeper analysis of the measurement tools used is presented in section 3.3.2.
b) Measurement technique: assuming that the studies used a measurer that was experienced in anthropometry, without applying any equation or formula it is very difficult to calculate the differences between the expert anthropometrists (considered as "true value") with the new measurers. One solution to prove the level of accuracy was developed by the International Society for the Advancement of Kinanthropometry (ISAK), which use the Technical Error of Measurement (TEM) as an evaluation index to the accreditation of new anthropometrists (Geeta et al., 2009; Perini et al., 2005). The TEM is basically the square root of measurement error variance (Arroyo et al., 2010), and is used to compare the results of the new anthropometrists against the expert anthropometrists (ISAK level 3 or 4). It is important to mention that despite the fact that ISAK, in levels 2 and 3, considers teaching anthropometry as an option in the ergonomics field (Norton & Olds, 1996), it does not consider the same measurements normally applied in the field of ergonomics stated in ISO 7250-1 (ISO, 2008). For example, they only included certain lengths and breadths and overlooked other dimensions, such as
7
popliteal height and elbow height, both of which are critical for workplace design that might be not fully covered by ISAK`s gold standards (Kroemer & Grandjean, 1997; Pheasant & Haslegrave, 2006).
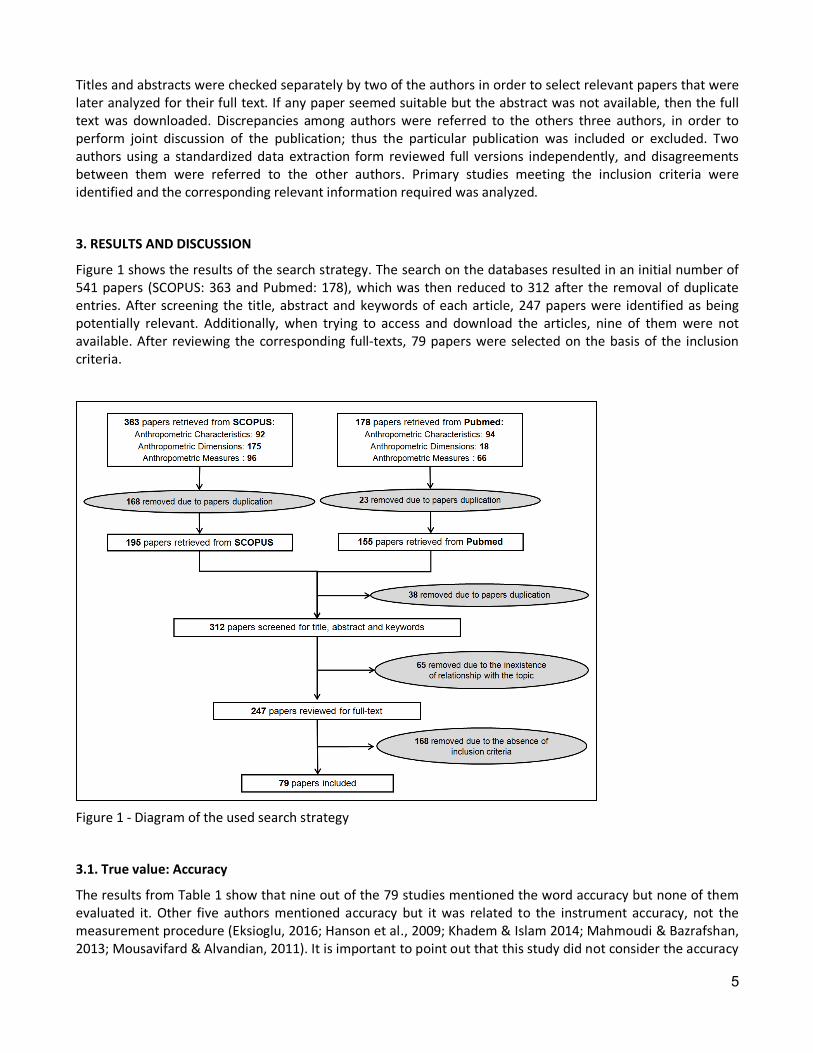
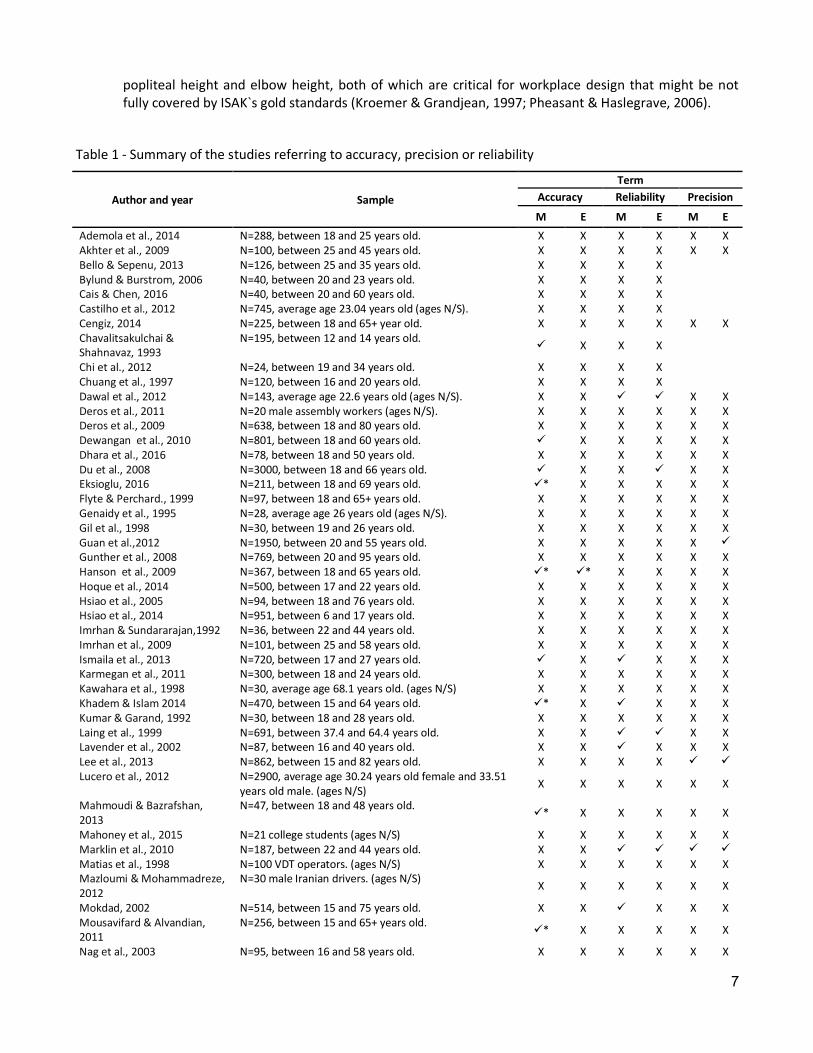
Table 1 - Summary of the studies referring to accuracy, precision or reliability
Author and year Sample
Term Accuracy Reliability Precision
M E M E M E Ademola et al., 2014 N=288, between 18 and 25 years old. X X X X X X Akhter et al., 2009 N=100, between 25 and 45 years old. X X X X X X Bello & Sepenu, 2013 N=126, between 25 and 35 years old. X X X X X X Bylund & Burstrom, 2006 N=40, between 20 and 23 years old. X X X X X X Cais & Chen, 2016 N=40, between 20 and 60 years old. X X X X X X Castilho et al., 2012 N=745, average age 23.04 years old (ages N/S). X X X X X X Cengiz, 2014 N=225, between 18 and 65+ year old. X X X X X X Chavalitsakulchai & Shahnavaz, 1993
N=195, between 12 and 14 years old. ü X X X X X
Chi et al., 2012 N=24, between 19 and 34 years old. X X X X X X Chuang et al., 1997 N=120, between 16 and 20 years old. X X X X X X Dawal et al., 2012 N=143, average age 22.6 years old (ages N/S). X X ü ü X X Deros et al., 2011 N=20 male assembly workers (ages N/S). X X X X X X Deros et al., 2009 N=638, between 18 and 80 years old. X X X X X X Dewangan et al., 2010 N=801, between 18 and 60 years old. ü X X X X X Dhara et al., 2016 N=78, between 18 and 50 years old. X X X X X X Du et al., 2008 N=3000, between 18 and 66 years old. ü X X ü X X Eksioglu, 2016 N=211, between 18 and 69 years old. ü* X X X X X Flyte & Perchard., 1999 N=97, between 18 and 65+ years old. X X X X X X Genaidy et al., 1995 N=28, average age 26 years old (ages N/S). X X X X X X Gil et al., 1998 N=30, between 19 and 26 years old. X X X X X X Guan et al.,2012 N=1950, between 20 and 55 years old. X X X X X ü Gunther et al., 2008 N=769, between 20 and 95 years old. X X X X X X Hanson et al., 2009 N=367, between 18 and 65 years old. ü* ü* X X X X Hoque et al., 2014 N=500, between 17 and 22 years old. X X X X X X Hsiao et al., 2005 N=94, between 18 and 76 years old. X X X X X X Hsiao et al., 2014 N=951, between 6 and 17 years old. X X X X X X Imrhan & Sundararajan,1992 N=36, between 22 and 44 years old. X X X X X X Imrhan et al., 2009 N=101, between 25 and 58 years old. X X X X X X Ismaila et al., 2013 N=720, between 17 and 27 years old. ü X ü X X X Karmegan et al., 2011 N=300, between 18 and 24 years old. X X X X X X Kawahara et al., 1998 N=30, average age 68.1 years old. (ages N/S) X X X X X X Khadem & Islam 2014 N=470, between 15 and 64 years old. ü* X ü X X X Kumar & Garand, 1992 N=30, between 18 and 28 years old. X X X X X X Laing et al., 1999 N=691, between 37.4 and 64.4 years old. X X ü ü X X Lavender et al., 2002 N=87, between 16 and 40 years old. X X ü X X X Lee et al., 2013 N=862, between 15 and 82 years old. X X X X ü ü Lucero et al., 2012 N=2900, average age 30.24 years old female and 33.51
years old male. (ages N/S) X X X X X X
Mahmoudi & Bazrafshan, 2013
N=47, between 18 and 48 years old. ü* X X X X X
Mahoney et al., 2015 N=21 college students (ages N/S) X X X X X X Marklin et al., 2010 N=187, between 22 and 44 years old. X X ü ü ü ü Matias et al., 1998 N=100 VDT operators. (ages N/S) X X X X X X Mazloumi & Mohammadreze, 2012
N=30 male Iranian drivers. (ages N/S) X X X X X X
Mokdad, 2002 N=514, between 15 and 75 years old. X X ü X X X Mousavifard & Alvandian, 2011
N=256, between 15 and 65+ years old. ü* X X X X X
Nag et al., 2003 N=95, between 16 and 58 years old. X X X X X X
8
Nicolay & Walter, 2005 N=51, between 18 and 33 years old. X X X X X X Oñate et al., 2012 N=447, average age 38.9 years old. (ages N/S) X X X X X X Osquei-Zadeh et al., 2012 N=267, between 18 and 26 years old. X X X X X X Pennathur & Dowling 2003 N=not specified, between 20 and 85 years old. X X X X X X Pourtaghi et al., 2014 N=12635, between 18 and 30 years old. ü X ü ü X X Reis et al., 2012 N=200, average age 33.5 years old female and 35.7
years old male. X X X X X X
Sadeghi et al., 2014 N=3436, between 20 and 60 years old. ü X ü X X X Sadeghi et al., 2015 N=3720, between 20 and 60 years old. ü X ü X X X Shah et al., 2015 N=200, between 25 and 45 years old. X X X X X X Shrestha et al., 2009 N=444, between 25 and 50 years old. X X X X X X Simeonov et al., 2012 N=40, average age 42.7and 37.2 years old. (ages N/S) X X X X X X Singh et al., 2015 N=940, between 20 and 60 years old. X X X X X X Spasojević et al., 2015 N=64,average age 47.64 years old. (ages N/S) X X X X ü X Stålhammar & Louhevaara, 1992
N=18, average age 33.8 years old. (ages N/S) X X X X X X
Sudhakaran & Mirka, 2005 N=24, between 18 and 26 years old. X X X X X X Sutjana et al., 2008 N=124, between 18 and 23 years old X X X X X X Syuaib, 2015a N=141 palm oil male workers (ages N/S) X X X X X X Syuaib, 2015b N=371, average age 39,3 years old female and 43,7
years old male. (ages N/S) ü X X X X X
Taha et al., 2009 N=887, between 20 and 30 years old X X X X X X Thariq et al., 2010 N=385, between 20 and 28 years old. X X X X X X Toro & Henrich, 1997 N=281 puerto rican workers , (ages N/S) X X X X X X Tunay & Melemez, 2008 N=1049 university students, (ages N/S) X X X X X X Ugurlu & Ozdogan, 2011 N=770, between 18 and 25 years old X X X X X X Van Driel et al., 2013 N=8, between 18 and 28 years old X X X X X X Verhaert et al., 2011 N=17, average age 24.3 years old (ages N/S) X X X X X X Wang & Chao, 2010 N=30, between 18 and 60 years old X X X X X X Werner et al., 1998 N=727, between 25 and 69 years old X X X X X X Wibowo et al., 2013 N=321 indonesian farmers , (ages N/S) X X X X X X Widyanti et al., 2015 N=1133 university students, (ages N/S) X X ü X ü X Xiong et al., 2008 N=50, between 19 and 24 years old X X ü ü X X Yang et al., 2007 N=461, between 23 and 43 years old ü X ü X X X Yun et al., 2002 N=8 college students, (ages N/S) X X X X X X Zetterberg & Ofverholm, 1999
N=564, between 20 and 61 years old X X ü X X X
Zujnic et al., 2015 N=64 crane operators, average age 46.6 years old (ages N/S) X X X X X X
M: mention; E: evaluated
* Accuracy related to the measurements tools.
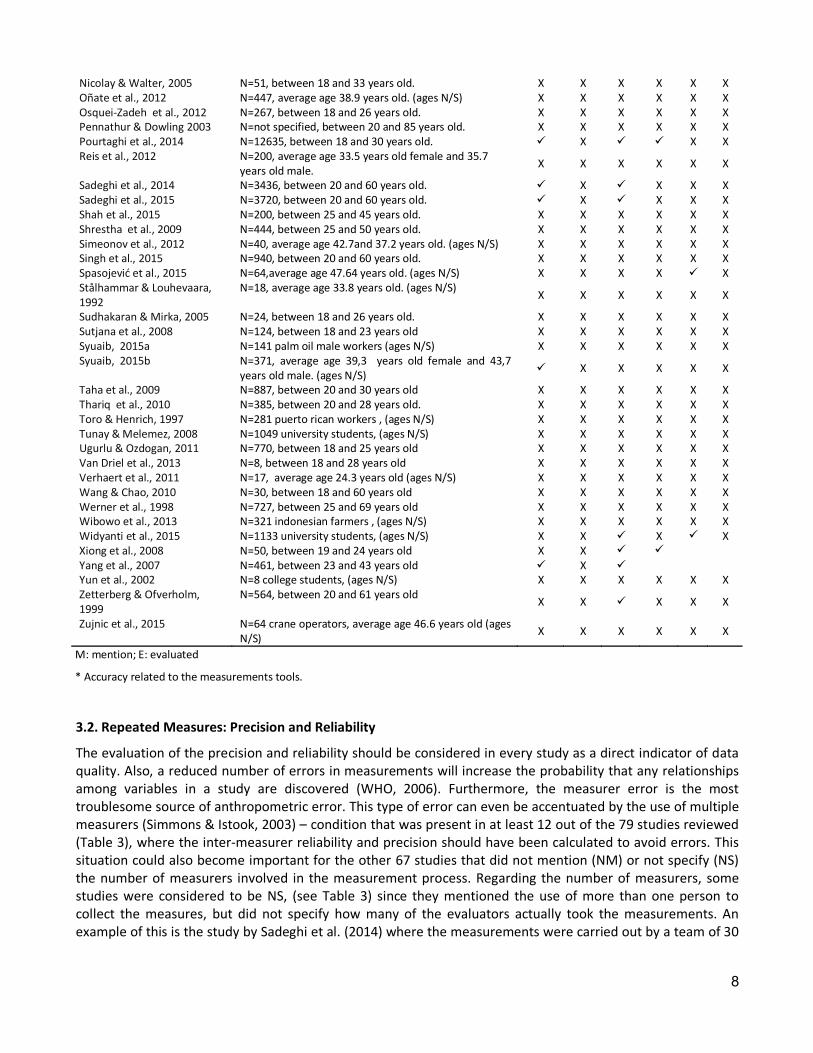
3.2. Repeated Measures: Precision and Reliability
The evaluation of the precision and reliability should be considered in every study as a direct indicator of data quality. Also, a reduced number of errors in measurements will increase the probability that any relationships among variables in a study are discovered (WHO, 2006). Furthermore, the measurer error is the most troublesome source of anthropometric error. This type of error can even be accentuated by the use of multiple measurers (Simmons & Istook, 2003) – condition that was present in at least 12 out of the 79 studies reviewed (Table 3), where the inter-measurer reliability and precision should have been calculated to avoid errors. This situation could also become important for the other 67 studies that did not mention (NM) or not specify (NS) the number of measurers involved in the measurement process. Regarding the number of measurers, some studies were considered to be NS, (see Table 3) since they mentioned the use of more than one person to collect the measures, but did not specify how many of the evaluators actually took the measurements. An example of this is the study by Sadeghi et al. (2014) where the measurements were carried out by a team of 30
9
engineers and one anthropologist. Still, it was not specified if the engineers or the anthropologist took the measurements or who was a recorder and who was the measurer or if they were able to switch roles.
Only three out of the 79 studies included measurements by only one measurer (Cengiz, 2014; Ismaila et al., 2013; Zetterberg & Ofverholm, 1999).
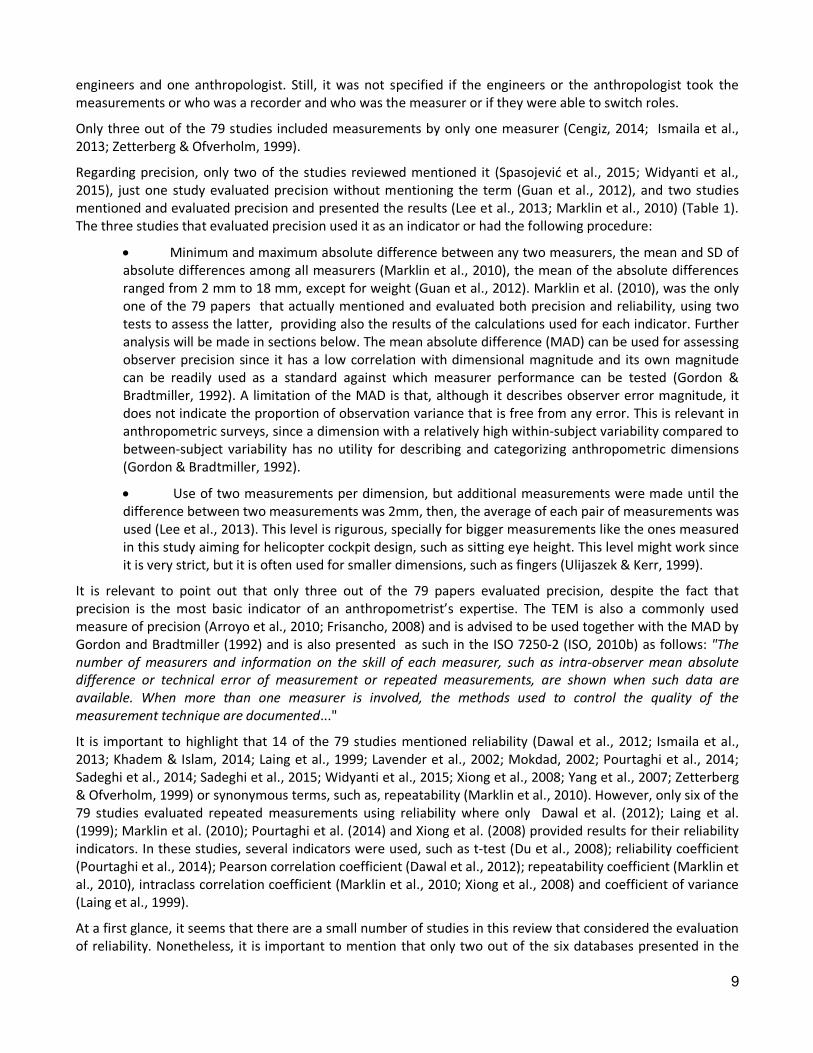
Regarding precision, only two of the studies reviewed mentioned it (Spasojević et al., 2015; Widyanti et al., 2015), just one study evaluated precision without mentioning the term (Guan et al., 2012), and two studies mentioned and evaluated precision and presented the results (Lee et al., 2013; Marklin et al., 2010) (Table 1). The three studies that evaluated precision used it as an indicator or had the following procedure:
• Minimum and maximum absolute difference between any two measurers, the mean and SD of absolute differences among all measurers (Marklin et al., 2010), the mean of the absolute differences ranged from 2 mm to 18 mm, except for weight (Guan et al., 2012). Marklin et al. (2010), was the only one of the 79 papers that actually mentioned and evaluated both precision and reliability, using two tests to assess the latter, providing also the results of the calculations used for each indicator. Further analysis will be made in sections below. The mean absolute difference (MAD) can be used for assessing observer precision since it has a low correlation with dimensional magnitude and its own magnitude can be readily used as a standard against which measurer performance can be tested (Gordon & Bradtmiller, 1992). A limitation of the MAD is that, although it describes observer error magnitude, it does not indicate the proportion of observation variance that is free from any error. This is relevant in anthropometric surveys, since a dimension with a relatively high within-subject variability compared to between-subject variability has no utility for describing and categorizing anthropometric dimensions (Gordon & Bradtmiller, 1992).
• Use of two measurements per dimension, but additional measurements were made until the difference between two measurements was 2mm, then, the average of each pair of measurements was used (Lee et al., 2013). This level is rigurous, specially for bigger measurements like the ones measured in this study aiming for helicopter cockpit design, such as sitting eye height. This level might work since it is very strict, but it is often used for smaller dimensions, such as fingers (Ulijaszek & Kerr, 1999).
It is relevant to point out that only three out of the 79 papers evaluated precision, despite the fact that precision is the most basic indicator of an anthropometrist’s expertise. The TEM is also a commonly used measure of precision (Arroyo et al., 2010; Frisancho, 2008) and is advised to be used together with the MAD by Gordon and Bradtmiller (1992) and is also presented as such in the ISO 7250-2 (ISO, 2010b) as follows: "The number of measurers and information on the skill of each measurer, such as intra-observer mean absolute difference or technical error of measurement or repeated measurements, are shown when such data are available. When more than one measurer is involved, the methods used to control the quality of the measurement technique are documented..."
It is important to highlight that 14 of the 79 studies mentioned reliability (Dawal et al., 2012; Ismaila et al., 2013; Khadem & Islam, 2014; Laing et al., 1999; Lavender et al., 2002; Mokdad, 2002; Pourtaghi et al., 2014; Sadeghi et al., 2014; Sadeghi et al., 2015; Widyanti et al., 2015; Xiong et al., 2008; Yang et al., 2007; Zetterberg & Ofverholm, 1999) or synonymous terms, such as, repeatability (Marklin et al., 2010). However, only six of the 79 studies evaluated repeated measurements using reliability where only Dawal et al. (2012); Laing et al. (1999); Marklin et al. (2010); Pourtaghi et al. (2014) and Xiong et al. (2008) provided results for their reliability indicators. In these studies, several indicators were used, such as t-test (Du et al., 2008); reliability coefficient (Pourtaghi et al., 2014); Pearson correlation coefficient (Dawal et al., 2012); repeatability coefficient (Marklin et al., 2010), intraclass correlation coefficient (Marklin et al., 2010; Xiong et al., 2008) and coefficient of variance (Laing et al., 1999).
At a first glance, it seems that there are a small number of studies in this review that considered the evaluation of reliability. Nonetheless, it is important to mention that only two out of the six databases presented in the
10
ISO 7250-2 (ISO, 2010b), that used manual measurements, considered the evaluation of reliability. In the following paragraphs, studies that evaluated reliability will be discussed by the indicators they used.
In the studies reviewed, only one used paired samples t-tests to assess the inter- and intra-measurer reliability (Du et al., 2008). The use of this test is consistent with the procedure used by Steenbekkers (1993) and reinforced by Goto and Mascie-Taylor (2007), who indicated that inconsistency between two measurements can be assessed using a paired samples t-test, which determines whether the mean is significantly different or not. However, Bruton et al. (2000), indicated that paired samples t-test, are better suited for obtaining systematic bias among observations and are commonly used in reliability testing, but they have the limitation of only providing results about systematic differences between the means of two groups of observations, not taking into account individual differences.
A better alternative is using the reliability coefficient (R), as used by Pourtaghi et al. (2014). The R, is useful since it can be readily calculated using random effects analysis of variance where measurer effects are nested within subject effects, thus providing results related to the error free proportion of variance (Gordon & Bradtmiller, 1992). In other words, this coefficient shows the proportion of between-subject variance free from measurement error (Arroyo et al., 2010). Additionally, because R is unit-free, it allows to perform observer variations among diverse magnitude variables (Gordon & Bradtmiller, 1992).
The repeatability coefficient can also be used to calculate observer error over measurements. In this review only Marklin et al. (2010) used it. Care should be taken when using this coefficient, since it may confuse readers, mainly because coefficients, like the R, are unit-free and in a range from zero to one, while the repeatability coefficient has the units of the measurement, for example millimeters. In general the reliability coefficient is not a very commonly used indicator (Bruton et al., 2000) and literature related to anthropometrics shows that there are two ways to calculate it, varying slightly between the two ways to do it (Bland and Altman, 1986; Bland, 1987).
Pearson correlation coefficient (r) was another method used in one of the studies reviewed (Dawal et al., 2012). The r reflects the extent of association between two groups of measurements, or the consistency of the position within them. However, this coefficient fails to detect systematic errors, thus reliability calculations using r can present highly correlated variables that at the same time are poorly repeatable (Bruton et al., 2000).
The intra-class correlation coefficient (ICC) can be used to bridge over the restrictions of r and it was used in two of the papers reviewed, to test the inter- and intra-measurer reliability (Marklin et al., 2010; Xiong et al., 2008). The ICC is an indicator computed using variance estimates obtained through the separation of total variance into between-and within-subject variance (ANOVA). It has the strength of showing the extent of consistency and agreement between measurements (Bruton et al., 2000).
The coefficient of variation (CV) is an indicator for measurement error commonly used (especially where multiple repeated tests are standard procedure), which shows the standard deviation as a proportion of the mean in percentage, thus being independent of units (Bruton et al., 2000). This method was used by only one author (Laing et al., 1999). This indicator has a limitation, as Bland (1987) clearly explains it, the weakness of presenting observer error as a percentage, is that the percentage of the smaller measurement result will differ highly from the percentage of the largest measurement. It is more suitable to use ICC instead of the CV since the ICC establishes the relationship of error size variation to the size of the variation studied (Chinn, 1991). Despite its limitations, Bruton et al. (2000) mentioned that the CV is a pertinent indicator to assess reliability.
During the last three decades a great effort has been done by means of the ISO standards to have more accurate and reliable anthropometric measurements. Still, the results in the area of anthropometric surveys for ergonomics purposes does not differ from the idea presented more than three decades ago by Ulijaszek and Mascie-Taylor (1994). These authors explained that reports of growth and physique measurements in human populations rarely include estimates of measurement error and this issue could be due to a lack of standardized terminology to describe the reliability of measurement in a clear and understandable way.
11
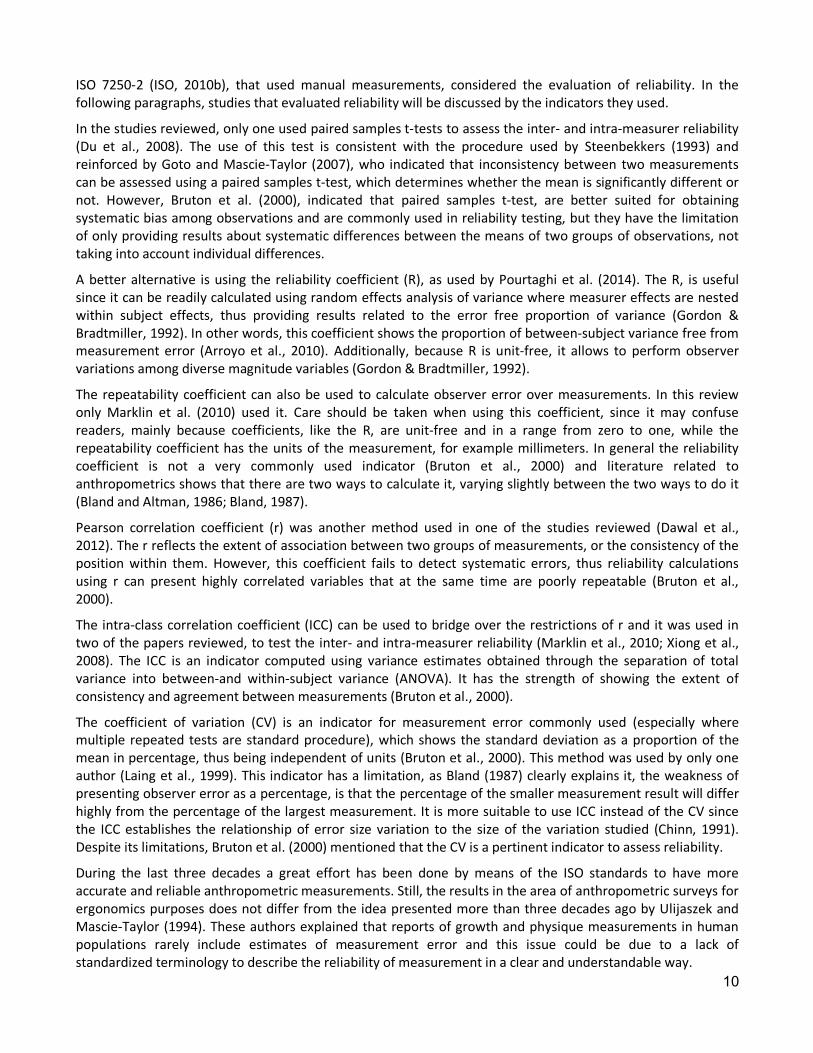
Finally, the results from the present review shows that despite the fact that anthropometric measurements need to present direct indicators of observer errors (WHO, 2006), only 24 of the 79 papers mentioned at least one of the terms and only nine evaluated at least one of them. Only one study (Marklin et al., 2010) both mentioned and evaluated reliability and precision. None of the reviewed studies mentioned and evaluated all the three terms accuracy, precision and reliability.
3.3. Other findings that may affect the accuracy, precision and reliability
The results show that only a few studies have evaluated the level of accuracy, precision and reliability. Furthermore, a deeper analysis of the reviewed papers can be done through the examination of three factors that may affect the measurement error, as described in the following sections: training, measurement tools and procedures.
3.3.1. Training
Of the reviewed studies, Only 16 studies considered training procedure before the data collection (Table 3). This is a very important aspect since consistent training can reduce differences between measurements taken by different people (Bragança et al., 2016). In most studies, training included a theoretical approach about anthropometry, as well as practical training. One of the studies has also considered training by showing a video of the anthropometric measurements and by test-measuring the required dimensions (Du et al., 2008).
The majority of studies did not specify the timeframes used in training (Table 3). Nevertheless, with the available information it can be stated that there are significant discrepancies related to the training time used. For example, Sadeghi et al. (2015) used a two day training session, Khadem & Islam (2014) used a three day training session, whilst other authors used a one- week training session (Karmegam et al., 2011; Mokdad, 2002).
3.3.2. Measurement tools
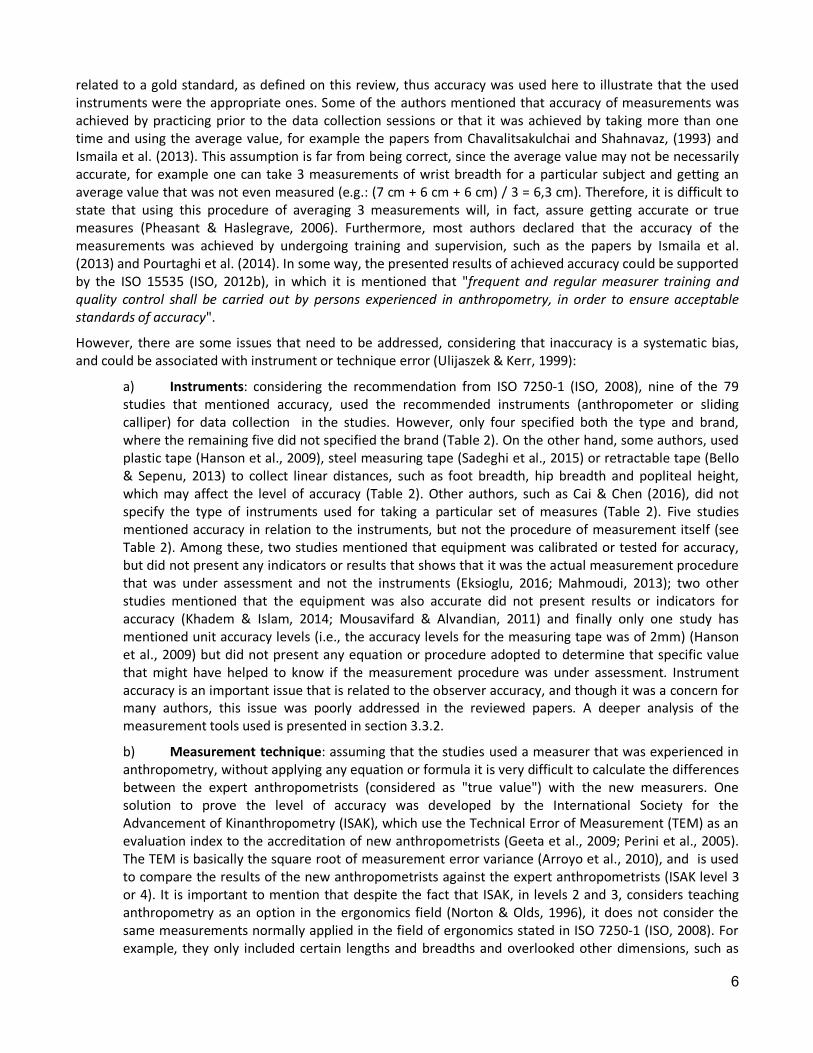
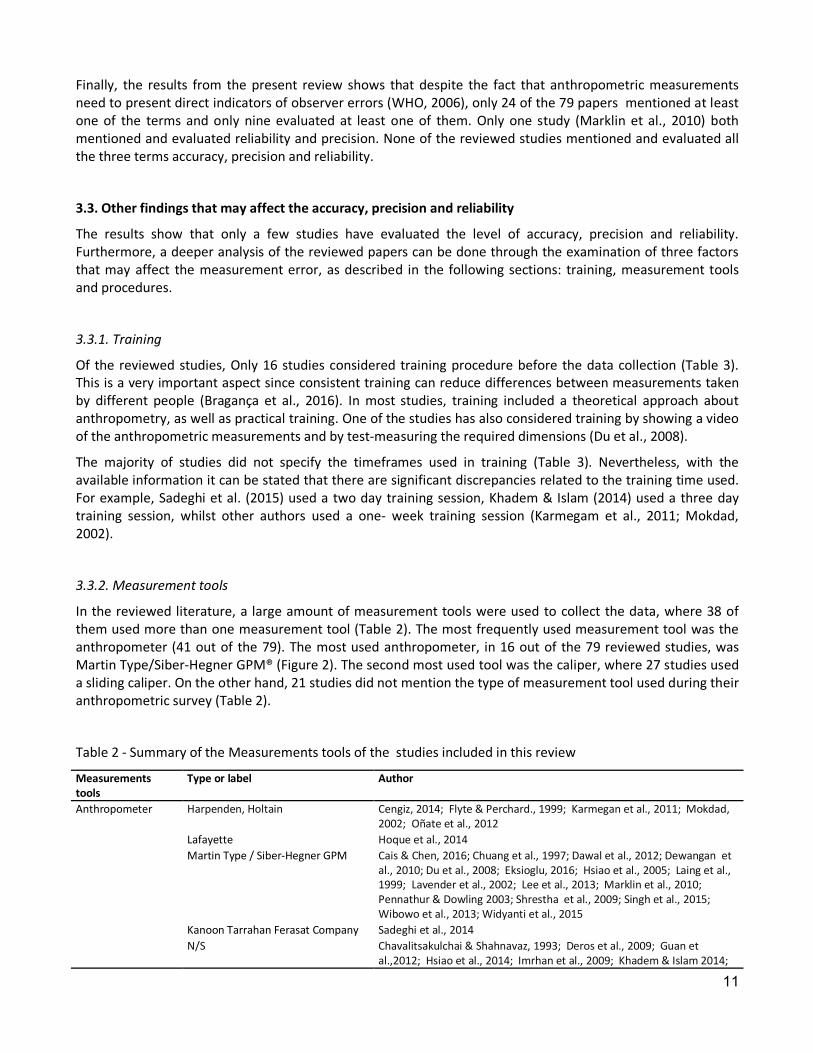
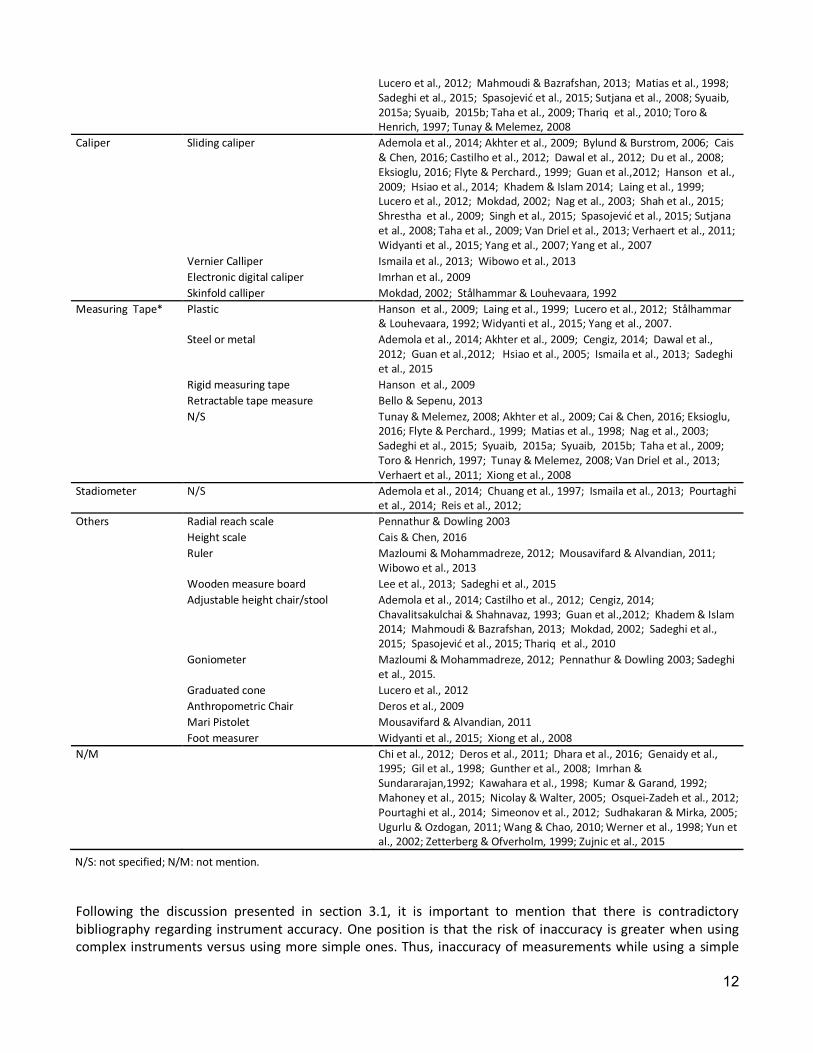
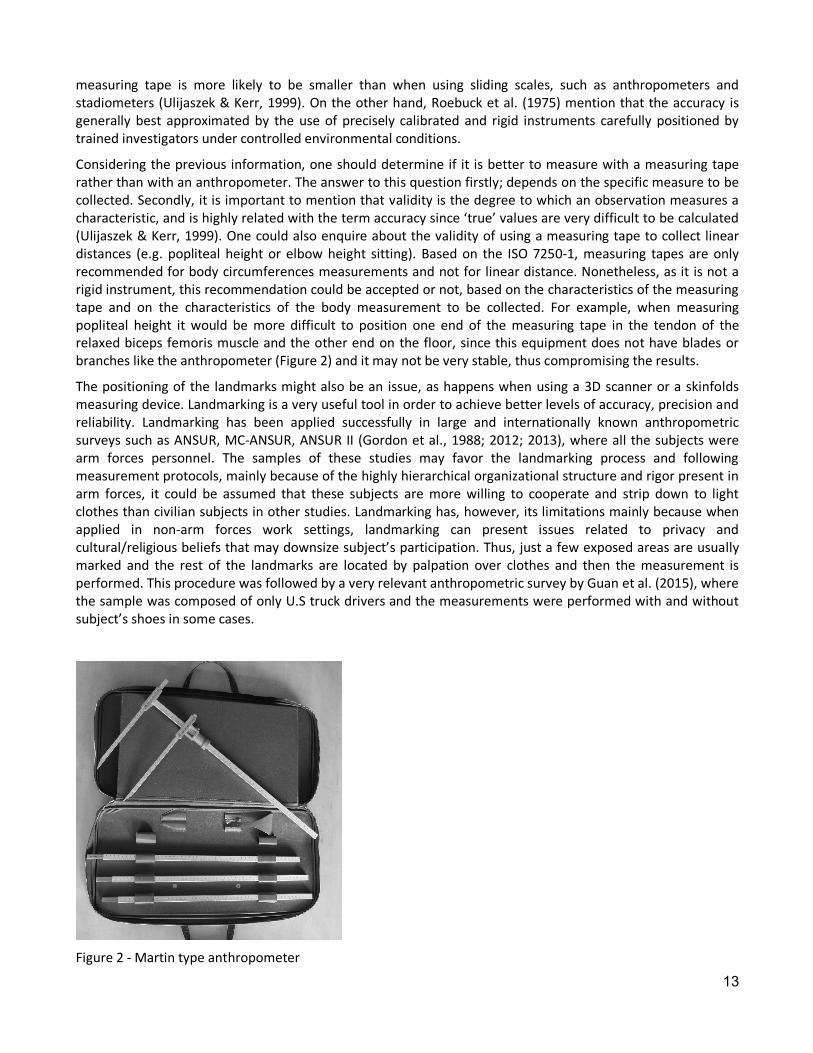
In the reviewed literature, a large amount of measurement tools were used to collect the data, where 38 of them used more than one measurement tool (Table 2). The most frequently used measurement tool was the anthropometer (41 out of the 79). The most used anthropometer, in 16 out of the 79 reviewed studies, was Martin Type/Siber-Hegner GPM® (Figure 2). The second most used tool was the caliper, where 27 studies used a sliding caliper. On the other hand, 21 studies did not mention the type of measurement tool used during their anthropometric survey (Table 2).
Table 2 - Summary of the Measurements tools of the studies included in this review
Measurements tools
Type or label Author
Anthropometer Harpenden, Holtain Cengiz, 2014; Flyte & Perchard., 1999; Karmegan et al., 2011; Mokdad, 2002; Oñate et al., 2012
Lafayette Hoque et al., 2014 Martin Type / Siber-Hegner GPM Cais & Chen, 2016; Chuang et al., 1997; Dawal et al., 2012; Dewangan et
al., 2010; Du et al., 2008; Eksioglu, 2016; Hsiao et al., 2005; Laing et al., 1999; Lavender et al., 2002; Lee et al., 2013; Marklin et al., 2010; Pennathur & Dowling 2003; Shrestha et al., 2009; Singh et al., 2015; Wibowo et al., 2013; Widyanti et al., 2015
Kanoon Tarrahan Ferasat Company Sadeghi et al., 2014 N/S Chavalitsakulchai & Shahnavaz, 1993; Deros et al., 2009; Guan et
al.,2012; Hsiao et al., 2014; Imrhan et al., 2009; Khadem & Islam 2014;
12
Lucero et al., 2012; Mahmoudi & Bazrafshan, 2013; Matias et al., 1998; Sadeghi et al., 2015; Spasojević et al., 2015; Sutjana et al., 2008; Syuaib, 2015a; Syuaib, 2015b; Taha et al., 2009; Thariq et al., 2010; Toro & Henrich, 1997; Tunay & Melemez, 2008
Caliper Sliding caliper Ademola et al., 2014; Akhter et al., 2009; Bylund & Burstrom, 2006; Cais & Chen, 2016; Castilho et al., 2012; Dawal et al., 2012; Du et al., 2008; Eksioglu, 2016; Flyte & Perchard., 1999; Guan et al.,2012; Hanson et al., 2009; Hsiao et al., 2014; Khadem & Islam 2014; Laing et al., 1999; Lucero et al., 2012; Mokdad, 2002; Nag et al., 2003; Shah et al., 2015; Shrestha et al., 2009; Singh et al., 2015; Spasojević et al., 2015; Sutjana et al., 2008; Taha et al., 2009; Van Driel et al., 2013; Verhaert et al., 2011; Widyanti et al., 2015; Yang et al., 2007; Yang et al., 2007
Vernier Calliper Ismaila et al., 2013; Wibowo et al., 2013 Electronic digital caliper Imrhan et al., 2009 Skinfold calliper Mokdad, 2002; Stålhammar & Louhevaara, 1992
Measuring Tape* Plastic Hanson et al., 2009; Laing et al., 1999; Lucero et al., 2012; Stålhammar & Louhevaara, 1992; Widyanti et al., 2015; Yang et al., 2007.
Steel or metal Ademola et al., 2014; Akhter et al., 2009; Cengiz, 2014; Dawal et al., 2012; Guan et al.,2012; Hsiao et al., 2005; Ismaila et al., 2013; Sadeghi et al., 2015
Rigid measuring tape Hanson et al., 2009 Retractable tape measure Bello & Sepenu, 2013 N/S Tunay & Melemez, 2008; Akhter et al., 2009; Cai & Chen, 2016; Eksioglu,
2016; Flyte & Perchard., 1999; Matias et al., 1998; Nag et al., 2003; Sadeghi et al., 2015; Syuaib, 2015a; Syuaib, 2015b; Taha et al., 2009; Toro & Henrich, 1997; Tunay & Melemez, 2008; Van Driel et al., 2013; Verhaert et al., 2011; Xiong et al., 2008
Stadiometer N/S Ademola et al., 2014; Chuang et al., 1997; Ismaila et al., 2013; Pourtaghi et al., 2014; Reis et al., 2012;
Others Radial reach scale Pennathur & Dowling 2003 Height scale Cais & Chen, 2016 Ruler Mazloumi & Mohammadreze, 2012; Mousavifard & Alvandian, 2011;
Wibowo et al., 2013 Wooden measure board Lee et al., 2013; Sadeghi et al., 2015 Adjustable height chair/stool Ademola et al., 2014; Castilho et al., 2012; Cengiz, 2014;
Chavalitsakulchai & Shahnavaz, 1993; Guan et al.,2012; Khadem & Islam 2014; Mahmoudi & Bazrafshan, 2013; Mokdad, 2002; Sadeghi et al., 2015; Spasojević et al., 2015; Thariq et al., 2010
Goniometer Mazloumi & Mohammadreze, 2012; Pennathur & Dowling 2003; Sadeghi et al., 2015.
Graduated cone Lucero et al., 2012 Anthropometric Chair Deros et al., 2009 Mari Pistolet Mousavifard & Alvandian, 2011 Foot measurer Widyanti et al., 2015; Xiong et al., 2008
N/M Chi et al., 2012; Deros et al., 2011; Dhara et al., 2016; Genaidy et al., 1995; Gil et al., 1998; Gunther et al., 2008; Imrhan & Sundararajan,1992; Kawahara et al., 1998; Kumar & Garand, 1992; Mahoney et al., 2015; Nicolay & Walter, 2005; Osquei-Zadeh et al., 2012; Pourtaghi et al., 2014; Simeonov et al., 2012; Sudhakaran & Mirka, 2005; Ugurlu & Ozdogan, 2011; Wang & Chao, 2010; Werner et al., 1998; Yun et al., 2002; Zetterberg & Ofverholm, 1999; Zujnic et al., 2015
N/S: not specified; N/M: not mention.
Following the discussion presented in section 3.1, it is important to mention that there is contradictory bibliography regarding instrument accuracy. One position is that the risk of inaccuracy is greater when using complex instruments versus using more simple ones. Thus, inaccuracy of measurements while using a simple
13
measuring tape is more likely to be smaller than when using sliding scales, such as anthropometers and stadiometers (Ulijaszek & Kerr, 1999). On the other hand, Roebuck et al. (1975) mention that the accuracy is generally best approximated by the use of precisely calibrated and rigid instruments carefully positioned by trained investigators under controlled environmental conditions.
Considering the previous information, one should determine if it is better to measure with a measuring tape rather than with an anthropometer. The answer to this question firstly; depends on the specific measure to be collected. Secondly, it is important to mention that validity is the degree to which an observation measures a characteristic, and is highly related with the term accuracy since ‘true’ values are very difficult to be calculated (Ulijaszek & Kerr, 1999). One could also enquire about the validity of using a measuring tape to collect linear distances (e.g. popliteal height or elbow height sitting). Based on the ISO 7250-1, measuring tapes are only recommended for body circumferences measurements and not for linear distance. Nonetheless, as it is not a rigid instrument, this recommendation could be accepted or not, based on the characteristics of the measuring tape and on the characteristics of the body measurement to be collected. For example, when measuring popliteal height it would be more difficult to position one end of the measuring tape in the tendon of the relaxed biceps femoris muscle and the other end on the floor, since this equipment does not have blades or branches like the anthropometer (Figure 2) and it may not be very stable, thus compromising the results.
The positioning of the landmarks might also be an issue, as happens when using a 3D scanner or a skinfolds measuring device. Landmarking is a very useful tool in order to achieve better levels of accuracy, precision and reliability. Landmarking has been applied successfully in large and internationally known anthropometric surveys such as ANSUR, MC-ANSUR, ANSUR II (Gordon et al., 1988; 2012; 2013), where all the subjects were arm forces personnel. The samples of these studies may favor the landmarking process and following measurement protocols, mainly because of the highly hierarchical organizational structure and rigor present in arm forces, it could be assumed that these subjects are more willing to cooperate and strip down to light clothes than civilian subjects in other studies. Landmarking has, however, its limitations mainly because when applied in non-arm forces work settings, landmarking can present issues related to privacy and cultural/religious beliefs that may downsize subject’s participation. Thus, just a few exposed areas are usually marked and the rest of the landmarks are located by palpation over clothes and then the measurement is performed. This procedure was followed by a very relevant anthropometric survey by Guan et al. (2015), where the sample was composed of only U.S truck drivers and the measurements were performed with and without subject’s shoes in some cases.
Figure 2 - Martin type anthropometer
14
Considering the previous information, there are four studies that present instruments that may be inadequate to collected the required measurements (Bello & Sepenu, 2013; Hanson et al., 2009; Sadeghi et al., 2015; Stålhammar & Louhevaara, 1992). For example, all of these studies used a measuring tape to measure linear distances, breadths and depths, instead of using an anthropometer and/or sliding /spreading calipers. Finally, other authors (Hanson et al., 2009; Laing et al., 1999; Lucero et al., 2012; Stålhammar & Louhevaara, 1992; Widyanti et al., 2015; Yang et al., 2007) used plastic measuring tape (tailor’s measuring tape type), which may be considered as an unreliable instrument since it is made from a material that can stretch and get deformed over time (Bragança et al., 2016).
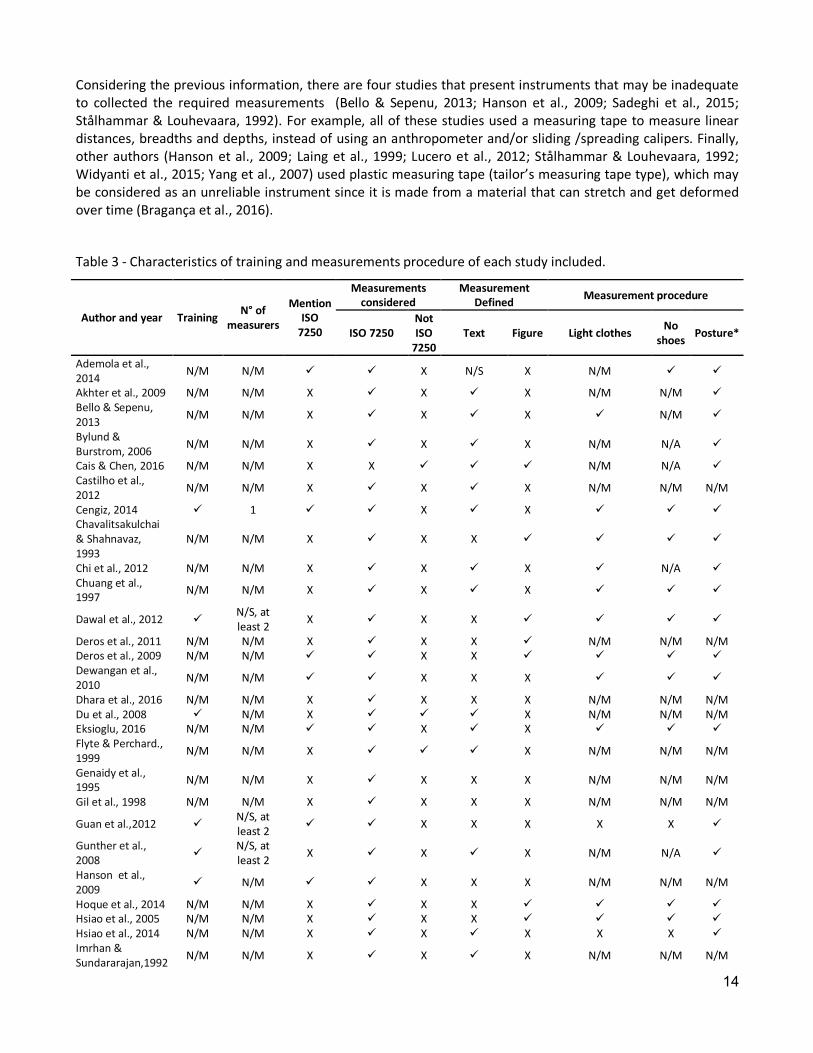
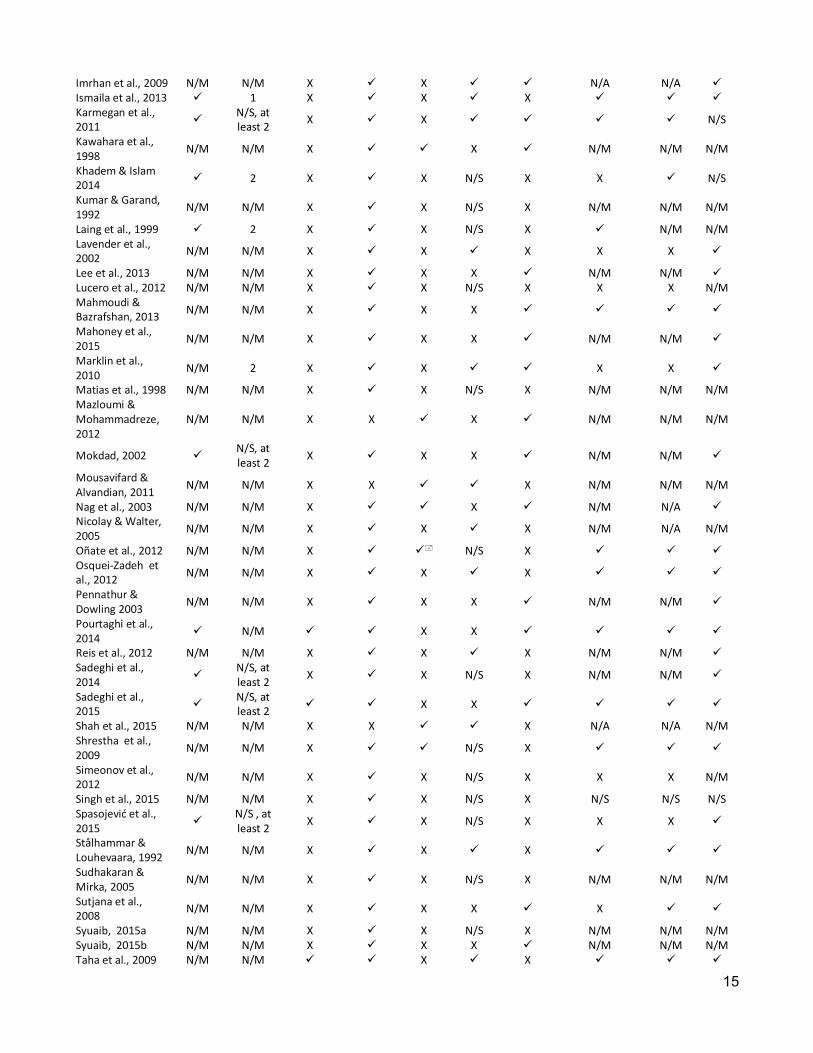
Table 3 - Characteristics of training and measurements procedure of each study included.
Author and year Training N° of measurers
Mention ISO
7250
Measurements considered
Measurement Defined Measurement procedure
ISO 7250 Not ISO
7250 Text Figure Light clothes No
shoes Posture*
Ademola et al., 2014 N/M N/M ü ü X N/S X N/M ü ü
Akhter et al., 2009 N/M N/M X ü X ü X N/M N/M ü Bello & Sepenu, 2013 N/M N/M X ü X ü X ü N/M ü
Bylund & Burstrom, 2006 N/M N/M X ü X ü X N/M N/A ü
Cais & Chen, 2016 N/M N/M X X ü ü ü N/M N/A ü Castilho et al., 2012 N/M N/M X ü X ü X N/M N/M N/M
Cengiz, 2014 ü 1 ü ü X ü X ü ü ü Chavalitsakulchai & Shahnavaz, 1993
N/M N/M X ü X X ü ü ü ü
Chi et al., 2012 N/M N/M X ü X ü X ü N/A ü Chuang et al., 1997 N/M N/M X ü X ü X ü ü ü
Dawal et al., 2012 ü N/S, at least 2 X ü X X ü ü ü ü
Deros et al., 2011 N/M N/M X ü X X ü N/M N/M N/M Deros et al., 2009 N/M N/M ü ü X X ü ü ü ü Dewangan et al., 2010 N/M N/M ü ü X X X ü ü ü
Dhara et al., 2016 N/M N/M X ü X X X N/M N/M N/M Du et al., 2008 ü N/M X ü ü ü X N/M N/M N/M Eksioglu, 2016 N/M N/M ü ü X ü X ü ü ü Flyte & Perchard., 1999 N/M N/M X ü ü ü X N/M N/M N/M
Genaidy et al., 1995 N/M N/M X ü X X X N/M N/M N/M
Gil et al., 1998 N/M N/M X ü X X X N/M N/M N/M
Guan et al.,2012 ü N/S, at least 2 ü ü X X X X X ü
Gunther et al., 2008 ü N/S, at
least 2 X ü X ü X N/M N/A ü
Hanson et al., 2009 ü N/M ü ü X X X N/M N/M N/M
Hoque et al., 2014 N/M N/M X ü X X ü ü ü ü Hsiao et al., 2005 N/M N/M X ü X X ü ü ü ü Hsiao et al., 2014 N/M N/M X ü X ü X X X ü Imrhan & Sundararajan,1992 N/M N/M X ü X ü X N/M N/M N/M
15
Imrhan et al., 2009 N/M N/M X ü X ü ü N/A N/A ü Ismaila et al., 2013 ü 1 X ü X ü X ü ü ü Karmegan et al., 2011 ü N/S, at
least 2 X ü X ü ü ü ü N/S
Kawahara et al., 1998 N/M N/M X ü ü X ü N/M N/M N/M
Khadem & Islam 2014 ü 2 X ü X N/S X X ü N/S
Kumar & Garand, 1992 N/M N/M X ü X N/S X N/M N/M N/M
Laing et al., 1999 ü 2 X ü X N/S X ü N/M N/M Lavender et al., 2002 N/M N/M X ü X ü X X X ü
Lee et al., 2013 N/M N/M X ü X X ü N/M N/M ü Lucero et al., 2012 N/M N/M X ü X N/S X X X N/M Mahmoudi & Bazrafshan, 2013 N/M N/M X ü X X ü ü ü ü
Mahoney et al., 2015 N/M N/M X ü X X ü N/M N/M ü
Marklin et al., 2010 N/M 2 X ü X ü ü X X ü
Matias et al., 1998 N/M N/M X ü X N/S X N/M N/M N/M Mazloumi & Mohammadreze, 2012
N/M N/M X X ü X ü N/M N/M N/M
Mokdad, 2002 ü N/S, at least 2 X ü X X ü N/M N/M ü
Mousavifard & Alvandian, 2011 N/M N/M X X ü ü X N/M N/M N/M
Nag et al., 2003 N/M N/M X ü ü X ü N/M N/A ü Nicolay & Walter, 2005 N/M N/M X ü X ü X N/M N/A N/M
Oñate et al., 2012 N/M N/M X ü ü+ N/S X ü ü ü Osquei-Zadeh et al., 2012 N/M N/M X ü X ü X ü ü ü
Pennathur & Dowling 2003 N/M N/M X ü X X ü N/M N/M ü
Pourtaghi et al., 2014 ü N/M ü ü X X ü ü ü ü
Reis et al., 2012 N/M N/M X ü X ü X N/M N/M ü Sadeghi et al., 2014 ü N/S, at
least 2 X ü X N/S X N/M N/M ü
Sadeghi et al., 2015 ü N/S, at
least 2 ü ü X X ü ü ü ü
Shah et al., 2015 N/M N/M X X ü ü X N/A N/A N/M Shrestha et al., 2009 N/M N/M X ü ü N/S X ü ü ü
Simeonov et al., 2012 N/M N/M X ü X N/S X X X N/M
Singh et al., 2015 N/M N/M X ü X N/S X N/S N/S N/S Spasojević et al., 2015 ü N/S , at
least 2 X ü X N/S X X X ü
Stålhammar & Louhevaara, 1992 N/M N/M X ü X ü X ü ü ü
Sudhakaran & Mirka, 2005 N/M N/M X ü X N/S X N/M N/M N/M
Sutjana et al., 2008 N/M N/M X ü X X ü X ü ü
Syuaib, 2015a N/M N/M X ü X N/S X N/M N/M N/M Syuaib, 2015b N/M N/M X ü X X ü N/M N/M N/M Taha et al., 2009 N/M N/M ü ü X ü X ü ü ü
16
Thariq et al., 2010 N/M N/M X ü X X ü X ü ü Toro & Henrich, 1997 N/M N/M X ü X ü ü N/M N/M N/M
Tunay & Melemez, 2008 N/M N/M X ü X ü X X N/M N/M
Ugurlu & Ozdogan, 2011 N/M N/M X ü X X X N/M N/M N/M
Van Driel et al., 2013 N/M N/M X ü ü ü X N/M N/M N/M
Verhaert et al., 2011 N/M N/M X ü ü N/S X N/M N/M N/M
Wang & Chao, 2010 N/M N/M X ü ü X ü N/M N/M N/M
Werner et al., 1998 N/M N/M X ü ü N/S X N/M N/M N/M
Wibowo et al., 2013 N/M N/M X ü ü N/S X N/S N/S N/S
Widyanti et al., 2015 ü N/M X ü X X ü ü ü ü
Xiong et al., 2008 N/M 2 X ü ü N/S X N/S N/S ü Yang et al., 2007 N/M N/M X X ü ü ü N/A N/A N/S Yun et al., 2002 N/M N/M X X ü N/S X N/A N/A N/M Zetterberg & Ofverholm, 1999 N/M 1 X ü X N/S X N/M N/M N/M
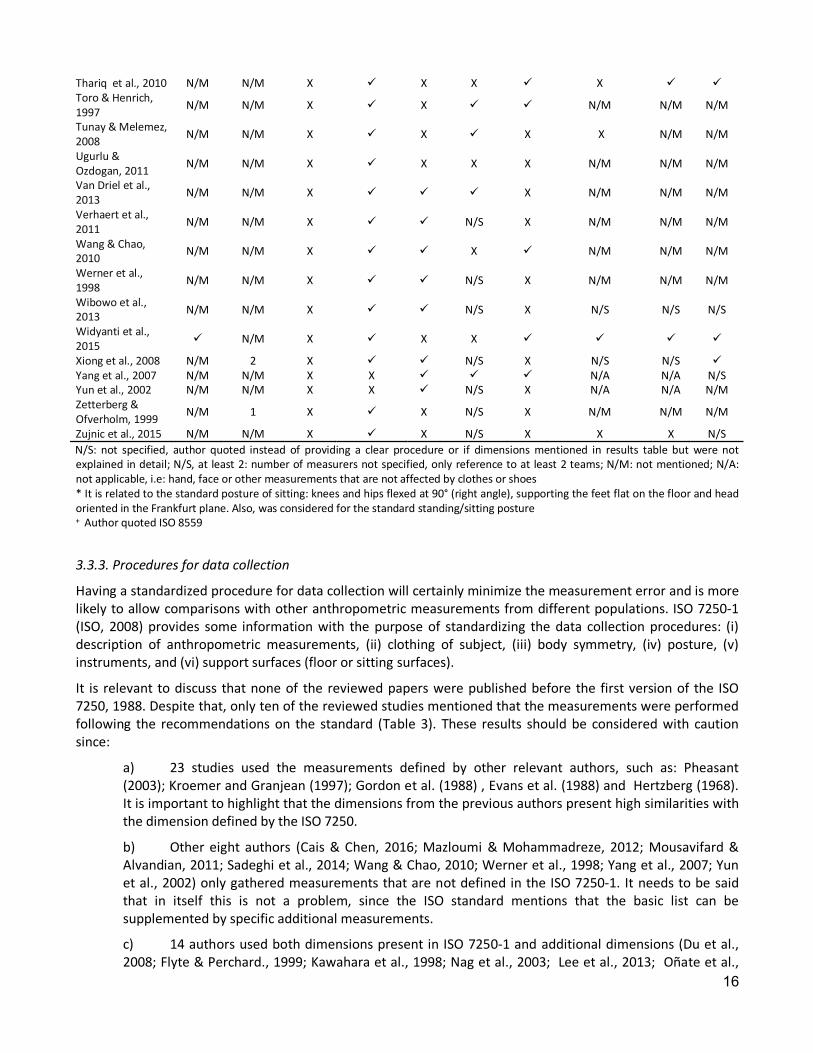
Zujnic et al., 2015 N/M N/M X ü X N/S X X X N/S N/S: not specified, author quoted instead of providing a clear procedure or if dimensions mentioned in results table but were not explained in detail; N/S, at least 2: number of measurers not specified, only reference to at least 2 teams; N/M: not mentioned; N/A: not applicable, i.e: hand, face or other measurements that are not affected by clothes or shoes * It is related to the standard posture of sitting: knees and hips flexed at 90° (right angle), supporting the feet flat on the floor and head oriented in the Frankfurt plane. Also, was considered for the standard standing/sitting posture + Author quoted ISO 8559
3.3.3. Procedures for data collection
Having a standardized procedure for data collection will certainly minimize the measurement error and is more likely to allow comparisons with other anthropometric measurements from different populations. ISO 7250-1 (ISO, 2008) provides some information with the purpose of standardizing the data collection procedures: (i) description of anthropometric measurements, (ii) clothing of subject, (iii) body symmetry, (iv) posture, (v) instruments, and (vi) support surfaces (floor or sitting surfaces).
It is relevant to discuss that none of the reviewed papers were published before the first version of the ISO 7250, 1988. Despite that, only ten of the reviewed studies mentioned that the measurements were performed following the recommendations on the standard (Table 3). These results should be considered with caution since:
a) 23 studies used the measurements defined by other relevant authors, such as: Pheasant (2003); Kroemer and Granjean (1997); Gordon et al. (1988) , Evans et al. (1988) and Hertzberg (1968). It is important to highlight that the dimensions from the previous authors present high similarities with the dimension defined by the ISO 7250.
b) Other eight authors (Cais & Chen, 2016; Mazloumi & Mohammadreze, 2012; Mousavifard & Alvandian, 2011; Sadeghi et al., 2014; Wang & Chao, 2010; Werner et al., 1998; Yang et al., 2007; Yun et al., 2002) only gathered measurements that are not defined in the ISO 7250-1. It needs to be said that in itself this is not a problem, since the ISO standard mentions that the basic list can be supplemented by specific additional measurements.
c) 14 authors used both dimensions present in ISO 7250-1 and additional dimensions (Du et al., 2008; Flyte & Perchard., 1999; Kawahara et al., 1998; Nag et al., 2003; Lee et al., 2013; Oñate et al.,
17
2012; Sadeghi et al., 2015; Taha et al., 2009; Thariq et al., 2010; Toro & Henrich, 1997; Tunay & Melemez, 2008; Ugurlu & Ozdogan, 2011; Verhaert et al., 2011; Xiong et al., 2008). Furthermore, the ISO 15535 mentions that measurements that are different from those specified in ISO 7250-1 can also be collected according to the purpose of the investigation. In such cases, definitions, methods, instruments and measurement units shall be clearly indicated in the report. This was the case for Oñate et al. (2012) that used the ISO 8559 standard for clothing design, where most measurements are related to girths and body curvatures. The authors of this review believe that when measurements have not been extracted from ISO 7250-1, it is important to clearly defining them, thus indicating the relevant related anatomic points, and if possible bones, since these are more easily located and represent a solid point to place the measurement instruments. However, if measurements required do not consider bony body parts, it should clearly specify the location of instrument placement in order to minimize the measurement error. One example of this is thigh clearance, where one of the blades of the anthropometer should be placed on the highest point (on the top) of the thigh. Although thigh clearance is part of ISO 7250-1, it shows that when measurements consider soft parts, and clearance is being sought, the tallest, biggest or widest parts should be used as reference points. This approach was done in ANSUR II (Gordon et al., 2012) with similar measurements that use “soft” landmarks, such as chest circumference or shoulder circumference, in order to actually measure the whole spectrum of the measurement, especially in bigger subjects. The consideration of a standard posture of the subjects and the use of proper instruments selection is also a key aspect, where the researcher can follow ISO 7250-1 standard as a guideline and complement it with other relevant technical text in order to accommodate their required measurements for particular needs.
Considering the previous points, this critical situation needs to be addressed since only six studies defined the measurements using text and figure, 45 studies used only text or figure and seven studies did not present any definition for their measurements (see Table 3). It is important to point out that 21 studies presented the dimensions in an unspecified manner, thus they were classified as not specified (N/S) since the authors only presented the dimensions in the results tables, not specifying referential landmarks nor any other particular definition (Table 3).
Regarding the clothing of the subjects, there are four studies that need to be excluded of the analysis since they considered measurements that are not affected by clothes such as: hand dimensions and head/neck/face dimensions (Imrhan et al., 2009; Shah et al., 2015; Yang et al., 2007; Yun et al., 2002). For the remaining 75 studies, in 23 studies the subjects were measured in t-shirts and shorts or lightly clothed. Is of interest the paper by Oñate et al., (2012) that made reference to another ISO standard (ISO, 1989), where it is stated that the procedure of measurement should be done nude or lightly clothed. On the other hand, 12 studies performed the measurements with the participants wearing casual or working clothes (See table 3). A particular study was the one by Hsiao et al. (2014) since they performed the measurements with the subjects both wearing light clothes and working clothes. This paper actually shows a very interesting approach that should be given more consideration, and shows a clever way to overpass the gap between standard measuring procedures (light clothing) and future practical design/intervention implications. Since the sample used by Hsiao et al. (2014) were firefighters that inherently use several protective equipment such as helmets, masks, boots and bulky jackets; the procedure used in this publication allows calculating easily and realistically the variation of the anthropometric dimensions experienced by subjects while wearing real work protective garments. Since human work in its essence is heterogeneous, the authors of this review believe that this approach in field anthropometric surveys should be more used in order to properly address variation in anthropometric dimensions among workers, especially for those who need to use protective equipment, use complex tools or work in adverse climate conditions, such as in cold environments. This is reinforced by Guan et al. (2015) who performed some measurements (height) with and without shoes when subjects where wearing the shoes that used while driving, they even made a thorough description on the shoe types worn by male and female truck drivers.
18
Other three studies were labeled as N/S since the authors provided references to other authors instead of stating a clear procedure regarding clothing (Singh et al., 2015; Wibowo et al., 2013; Xiong et al., 2008). This was done since referring to an author in particular does not necessarily communicate the actual procedure followed. For example in the case of Wibowo et al., 2013, they quoted Pheasant & Halsegrave 2006 regarding subject clothing. They measured Indonesian farmers, where in this country the main religious tendencies might difficult to perform measurements on “unclothed” women, as suggested by Pheasant & Halsegrave 2006. The authors of this review think that without going into further detail, one can both cite the author and describe briefly the clothes the subject used and other procedure related circumstances. Finally, 37 studies did not mention the clothing of subjects. It is relevant to discuss that in some countries religion or culture imply that certain measurements must be taken with clothes, especially when women are the ones being measured, as it was stated by Karmegam et al. (2011). According to the authors’ experience, it is common that field anthropometric surveys are taken also with clothes (at least shirt /dress/pants and no shoes). This happens because it is hard to convince people to undress at their jobs or to change into light clothes and then put again their regular clothes, especially if there are no suitable facilities and for the time loss that may compromise productivity. This was clearly stated by Guan et al. (2015) as the main reason why they measured their subjects with their regular clothes. This can usually be solved with subject`s compensation, however in developing countries, the authors of this review recognize the challenges that can be found, since funding can be an issue, thus the incentive for subjects to undress or participate might not be enough.
The posture adopted by the participants is marked as being a factor that affects errors in anthropometry (Kouchi & Mochimaru, 2011). To minimize the effect of this, many of the studies reviewed (42 out of the 79) measured the participants sitting and/or on the standard standing position. However, 31 studies did not mention the adopted posture at all, and six studies did not specified the posture used or quoted another in their procedure, thus they were labeled as not specified N/S since no explicit description of the posture was made (Karmegan et al., 2011; Khadem & Islam 2014; Singh et al., 2015; Wibowo et al., 2013; Yang et al., 2007; Zujnic et al., 2015).
Furthermore, some authors evaluated measurements with participants wearing shoes, such eye height standing, shoulder height standing, elbow height standing (Lavender et al,. 2012; Lucero et al., 2012; Simeonov et al., 2012), upper leg height (Spasojević et al., 2015) and knee height sitting (Zujnic et al., 2015). Another author (Guan et al., 2012) was not explicit about if some measurements, such as popliteal height, were measured with or without shoes, since they sometimes measured height both with and without shoes, depending if the subjects wore their typical driving shoes. However, they based their measurements on the definitions present in ANSUR (Gordon et al., 1989), which states that popliteal height should be measured barefoot. In this particular case, one of their aims was to describe the types of shoes worn typically by male and female truck drivers, which we believe is very useful for design/ergonomics purposes (i.e. actually knowing which type of shoes are worn by truck drivers). This paper derives from the extensive technical report of U.S truck drivers’ anthropometrics (Guan et al., 2015). The procedure followed by these authors is consistent with the view of the authors of the current review, and it is a good example on how to practically overpass the high variability in shoe types, being similar to the approach previously made regarding clothing. Care should be taken if not following and describing the exact measurement definition nor procedure, since it may lead the reader to believe that some type of error might be present because measurements have been made with shoes. This is the reason why it is recommended to always measure the participants barefoot, keeping in mind that shoes may naturally vary according to culture, fashion, and country. To get more representative values of the sample under study, an option is to measure the shoe heel and, in the cases where this is not possible for the researchers, an alternative would be to consider shoe correction as a value between 2–3 cm (Castellucci et al., 2014). Another author, Marklin et al. (2010), who measured relevant dimensions such as popliteal height with shoes, did apply corrections for both clothing and shoes in order to make comparisons with other databases that measured subjects with light clothes as the standard procedure that should be used when doing those comparisons. Also when measuring people with their clothes, the results may be influenced by the geographical location where colder or hotter weather has an impact on the type of clothes used by the subjects

19
and that may not be the clothes actually used at their work. Thus as stated previously, while discussing the paper of Hsiao et al. (2014), a practical suggestion could be to present actual data of workers with and without clothes, ideally measuring both conditions.
Finally, based on the findings of this study it can be concluded that more importance should be given to the procedure of anthropometric surveys in peer reviewed journals, not only on how to collect the data (measurement tools, training and data collection procedures) and test the measurement error, but also on how the data is presented in a scientific paper, since many authors did not mention nor specified relevant information of the data collection process. Generally technical reports use very comprehensive and clear procedures, as those used by Gordon et al. (1988; 2012), where they even had observer error tested daily (Gordon et al., 2013). These reports should be used as a guideline in order to point out the most relevant parts that should be included in a peer reviewed paper addressing manual anthropometric procedures, such as: detailed descriptions of measuring tools; anthropometric measurement definitions specifying relevant landmarks, subjects posture and clothing/shoes; number of observers with the corresponding observer error testing results; and presenting error levels specifically for each dimension. Technical reports offer a great guideline which should be transferred, in a more summarized format, to any peer reviewed paper that takes anthropometric measurements manually, where a small table showing the above recommendations can be conveniently included in the paper.
Specific dimension observer error limits are present in highly rigorous technical reports (Gordon et al., 1988; 2012; 2013; Guan et al., 2015), but the reader might think about the practical design implications of, for example, a 5 mm error, in a particular dimension. The answer depends on the dimension itself. According to Norton and Olds (1996), the smaller the measure, the lower the error tolerance should be. This means that, for example, when designing highly specific garments or equipment for smaller body parts (face, hands and feet) a 5mm error difference could have a critical impact on the product´s fit. For example, a CPAP mask, aircraft masks, gloves, protective masks or shoes that are poorly fitted, can cause discomfort and/or injury, besides not achieving the desired performance level. Conversely, bigger dimensions may be more permissive, but that does not mean that observer error should be unaccounted for.
Another relevant consideration is that manual measurements are standards, which can be used to validate 3D scanned derived dimensions (ISO, 2010a). 3D scans measurements are not free from error. The main sources of error in this type of measurement are related to the devices (software and hardware) and to the measured participants, mainly because of their adopted posture and of the poor landmarking (Kouchi & Mochimaru, 2011). The validation of 3D derived measurements using traditional measurements has been followed in peer-reviewed papers (Lu & Wang, 2010; Sims et al., 2012). However, it has been acknowledged that the quality parameters of these studies are not usually consistent, mainly because of the lack of explicit accuracy standards and quality evaluation protocol procedures (Kouchi and Mochimaru, 2011). Thus, it could be implied that if measurement error of manual anthropometric methods is not tested, even the use of the most advanced technology could be improperly validated, producing the obvious negative outcomes. It is therefore relevant to evaluate, wherever possible, observer differences between anthropometrists and to explicitly show the results in peer-reviewed papers. It is also relevant to designate a criterion to both assess anthropometrists error and training novel anthropometrists, specially throughout the execution of the anthropometric surveys in order to maintain quality of measurement, and to avoid deviations during long periods of measurements (Ulijaszek & Kerr, 1999). Since in anthropometry accuracy is related to the “gold standard” which is used to compare the results of the new anthropometrists against the expert anthropometrists (Norton & Olds, 1996), the authors of this paper suggest that when significant discrepancies appear between experienced anthropometrists, both measuring techniques and measuring instruments, should be tested and compared to reduce the difference and establish an agreement among the anthropometrists on practical error levels.
20
3.4. Limitations
A limitation of this study is the fact that some relevant articles might have not been considered due to the wide variety of terminology used to refer to the same issues. Another limitation is the fact that technical reports were excluded from this analysis and only used as a reference guide, since in general those reports are not publically available, which makes the peer-reviewed papers published in scientific journal the most common source of information about the use of anthropometrics in an ergonomics context.
This work has also some inherent limitations, which researchers using this information should be aware of when interpreting the results presented in this paper. This literature review was based on peer-reviewed journals found in only two specific bibliographic databases (Scopus and PubMed). Although it is known that these databases cover a very wide range of different areas, searching in different databases, such as Google Scholar, or considered conference articles, could also have had relevant information that might have been relevant to this review.
4. CONCLUSION
The objective of this paper was to evaluate, though a literature review, whether if the currently available anthropometric studies of working adult populations in the field of ergonomics, take in consideration precision, reliability or accuracy issues. After reviewing the 79 papers it can be concluded that this topic is poorly addressed in the literature, as only 27 studies mentioned at least one of the terms and none of the studies evaluates all of the terms.
Only 3 studies evaluated precision, where the most used indicator was the MAD, used in two of these studies. The six papers that assessed reliability, four presented the recommended methods such as the ICC, which allows the identification of individual differences and systematic errors; the R and the CV.
Regarding the variables that may affect precision, reliability and accuracy, the majority of the papers reviewed presented great differences in terms of the measurement tools used. Furthermore, there is a clear lack of information regarding the training and procedures for anthropometric data collection.
Finally, more attention should be given to the procedures used to collect anthropometric data for ergonomics purposes. They should take in consideration the procedures defined in the relevant standards and technical reports, test for measurement error and report the entire information explicitly when presenting the collected data.
REFERENCES Ademola, J., Rohani, J. M., Olusegun, A. G., & Rani, M. R. A. (2014). Anthropometric data reduction using confirmatory factor analysis. Work (Reading, Mass.), 47(2), 173–81. http://doi.org/10.3233/WOR-121530
Akhter, Z., Begum, J. A., Banu, M. L. A., Alam, M. M., Hossain, S., Amin, N. F., … Yasmin, Q. S. (2010). Stature Estimation Using Head Measurements in Bangladeshi Garo Adult Females. Bangladesh Journal of Anatomy, 7(2), 101–104. http://doi.org/10.3329/bja.v7i2.6096
Arroyo, M., Freire, M., Ansotegui, L., & Rocandio, A. M. (2010). Intraobserver error associated with anthropometric measurements made by dietitians. Nutricion Hospitalaria, 25(6), 1053–1056. http://doi.org/10.3305/nh.2010.25.6.4854
Barroso, M. P., Arezes, P. M., Da Costa, L. G., & Miguel, A. S. (2005). Anthropometric study of Portuguese workers. International Journal of Industrial Ergonomics, 35(5), 401–410. http://doi.org/10.1016/j.ergon.2004.10.005
Bello, A. I., & Sepenu, A. S. (2013). Mismatch in Body–Chair Dimensions and the Associated Musculoskeletal Pain Among Selected Undergraduate Students in Ghana. Journal of Musculoskeletal Research, 16(3), 1350016. http://doi.org/10.1142/S0218957713500164
Bragança, S., Arezes, P., Carvalho, M., & Ashdown, S. P. (2016). Current state of the art and enduring issues in anthropometric data collection Estado actual de la técnica y cuestiones perdurables en la recogida de datos antropométricos. DYNA, 83(197), 22–30.
Bruton, A., Conway, J. H., & Holgate, S. T. (2000). Reliability: What is it, and how is it measured? Physiotherapy, 86(2), 94–99.
21
http://doi.org/S0004-27302006000400003 [pii]
Bylund, S. H., & Burström, L. (2006). The influence of gender, handle size, anthropometric measures, and vibration on the performance of a precision task. International Journal of Industrial Ergonomics, 36(10), 907–914. http://doi.org/10.1016/j.ergon.2006.07.009
Cai, D., & Chen, H. L. (2016). Ergonomic approach for pillow concept design. Applied Ergonomics, 52, 142–150. http://doi.org/10.1016/j.apergo.2015.07.004
Castellucci, H. I., Arezes, P. M., & Molenbroek, J. F. M. (2014). Applying different equations to evaluate the level of mismatch between students and school furniture. Applied Ergonomics, 45(4), 1123–32. http://doi.org/10.1016/j.apergo.2014.01.012
Castellucci, H. I., Arezes, P. M., & Molenbroek, J. F. M. (2015). Analysis of the Most Relevant Anthropometric Dimensions for School Furniture Selection Based on a Study with Students from One Chilean Region. Applied ergonomics 46PA:201–11. http://www.ncbi.nlm.nih.gov/pubmed/25151312.
Castilho, A. S., Cássia, C. De, Leme, A., Padula, R. S., Cidade, U., Paulo, D. S., … Paulo, S. (2012). Analysis of the suitability of furniture university - anthropometric characteristics of user. WORK A Journal of Prevention, Assessment & Rehabilitation, 41, 5411–5412. http://doi.org/10.3233/WOR-2012-0836-5411
Cengiz, T. G. (2014). A pilot study for defining characteristics of Turkish women via anthropometric measurements. Work (Reading, Mass.), 49(4), 713–22. http://doi.org/10.3233/WOR-141836
Chavalitsakulchai, P., & Shahnavaz, H. (1993). Ergonomics method for prevention of the musculoskeletal discomforts among female industrial workers: physical characteristics and work factors. Journal of Human Ergology, 22, 95–113.
Chi, C. F., Shih, Y. C., & Chen, W. L. (2012). Effect of cold immersion on grip force, EMG, and thermal discomfort. International Journal of Industrial Ergonomics, 42(1), 113–121. http://doi.org/10.1016/j.ergon.2011.08.008
Chuang, M. C., You, M., Cai, D., & Chen, C. C. (1997). Isometric muscle strength of Chinese young males in Taiwan. Ergonomics, 40(5), 576–90. http://doi.org/10.1080/001401397188044
Coblentz, A., Mollard, R., & Ignazi, G. (1991). Three-dimensional face shape analysis of French adults, and its application to the design of protective equipment. Ergonomics, 34(4), 497–517. http://doi.org/10.1080/00140139108967332
Dawal, S. Z. M., Ismail, Z., Yusuf, K., Abdul-Rashid, S. H., Md Shalahim, N. S., Abdullah, N. S., & Mohd Kamil, N. S. (2015). Determination of the significant anthropometry dimensions for user-friendly designs of domestic furniture and appliances - Experience from a study in Malaysia. Measurement: Journal of the International Measurement Confederation, 59, 205–215. http://doi.org/10.1016/j.measurement.2014.09.030
Dawal, S. Z., Zadry, H. R., Azmi, S. N. S., Rohim, S. R., & Sartika, S. J. (2012). Anthropometric database for the learning environment of high school and university students. International Journal of Occupational Safety and Ergonomics : JOSE, 18(4), 461–72. http://doi.org/10.1080/10803548.2012.11076953
De Paula, a J. F., Silva, J. C. P., Paschoarelli, L. C., & Fujii, J. B. (2012). Backpacks and school children’s obesity: challenges for public health and ergonomics. Work (Reading, Mass.), 41 Suppl 1, 900–6. http://doi.org/10.3233/WOR-2012-0261-900
Deros, B. M., Khamis, N. K., Ismail, A. R., Jamaluddin, H., Adam, A. M., & Rosli, S. (2011). An Ergonomics study on assembly line workstation design. American Journal of Applied Sciences, 8(11), 1195–1201. http://doi.org/10.3844/ajassp.2011.1195.1201
Deros, B. M., Mohamad, D., Ismail, A. Ra., & Soon, O. W. (2009). Recommended Chair and Work Surfaces Dimensions of VDT Tasks for Malaysian Citizens. European Journal of Scientific Research, 34(2), 156–167.
Dewangan, K. N., Owary, C., & Datta, R. K. (2010). Anthropometry of male agricultural workers of north-eastern India and its use in design of agricultural tools and equipment. International Journal of Industrial Ergonomics, 40(5), 560–573. http://doi.org/10.1016/j.ergon.2010.05.006
Dhara, P. C., Pradhan, P., Chatterjee, M., Division, S. P., & Bengal, W. (2016). ORIGINAL ARTICLE AN ERGONOMIC APPROACH FOR DESIGNING A SEAT FOR FISH PROCESSING. Malaysian Journal of Public Health Medicine, 16, 14–21.
Du, L., Zhuang, Z., Guan, H., Xing, J., Tang, X., Wang, L., … Chen, W. (2008). Head-and-face anthropometric survey of Chinese workers. Annals of Occupational Hygiene, 52(8), 773–782. http://doi.org/10.1093/annhyg/men056
Eksioglu, M. (2016). Normative static grip strength of population of Turkey, effects of various factors and a comparison with international norms. Applied Ergonomics, 52, 8–17. http://doi.org/10.1016/j.apergo.2015.06.023
Evans, W. A., Courtney, A. J., & Fok, K. F. (1988). The design of school furniture for Hong Kong school children: an anthropometric case study. Applied Ergonomics, 19(June), 122–134.
Flyte, M. D. G., & Perchard, M. F. (1999). The prediction of car driver size and position to enhance safety in crashes. Ergonomics, 42(9), 1149–1166. http://doi.org/10.1080/001401399185045
22
Frisancho, A. R. (2008). Anthropometric Standards: An Interactive Nutritional Reference of Body Size and Body Composition for Children and Adults. University of Michigan Press.
Gabbett, T. J. (2005). A comparison of physiological and anthropometric characteristics among playing positions in junior rugby league players. British Journal of Sports Medicine, 39(9), 675–680. http://doi.org/10.1136/bjsm.2005.018275
Garneau, C. J., & Parkinson, M. B. (2016). A survey of anthropometry and physical accommodation in ergonomics curricula. Ergonomics, 59(1), 143–154. http://doi.org/10.1080/00140139.2015.1052853
Geeta, A., Jamaiyah, H., Safiza, M. N., Khor, G. L., Kee, C. C., Ahmad, A. Z., … Faudzi, A. (2009). Reliability, technical error of measurements and validity of instruments for nutritional status assessment of adults in Malaysia. Singapore Medical Journal, 50(10), 1013–1018.
Genaidy, a M., Delgado, E., & Bustos, T. (1995). Active microbreak effects on musculoskeletal comfort ratings in meatpacking plants. Ergonomics, 38(2), 326–36. http://doi.org/10.1080/00140139508925107
Gil Coury, H. J. C., Kumar, S., Rodgher, S., & Narayan, Y. (1998). Measurements of shoulder adduction strength in different postures. International Journal of Industrial Ergonomics, 22(3), 195–206. http://doi.org/10.1016/S0169-8141(97)00015-2
Gordon, C.C., Blackwell, C.L., Bradtmiller, B., & Hotzman, J. (2013). 2010 Anthropometric Survey of U.S. Marine Corps Personnel : Methods and Summary. Technical Report, Natick/Tr-13/018, (June).
Gordon, C.C., Blackwell, C. L., Bradtmiller, B., Parham, J. L., Barrientos, P., Paquette, S. P., … Kristensen, S. (2012). 2012 Anthropometric Survey Of U.S. Army Personnel: Methods And Summary Statistics, (October 2010).
Gordon, C.C., & Bradtmiller, B. (1992). Interobserver Error in a Large Scale Anthropometric Survey. American Journal of Human Biology, 4, 253–263. http://doi.org/10.1002/ajhb.1310040210
Gordon, C. C., Churchill, T., Clauser, C. E., Mcconville, J. T., Tebbetts, I., & Walker, R. A. (1988). ANTHROPOMETRIC SURVEY OF U . S . ARMY PERSONNEL : METHODS AND SUMMARY STATISTICS Prepared for. Ohio.
Goto, R., & Mascie-Taylor, C. G. N. (2007). Precision of measurement as a component of human variation. Journal of Physiological Anthropology, 26(2), 253–256. http://doi.org/10.2114/jpa2.26.253
Guan, J., Hsiao, H., Bradtmiller, B., Kau, T.-Y., Reed, M. R., Jahns, S. K., … Piamonte, D. P. T. (2012). U.S. truck driver anthropometric study and multivariate anthropometric models for cab designs. Human Factors, 54(5), 849–71. http://doi.org/10.1177/0018720812442685
Guan, J., Hsiao, H., Bradtmiller, B., Zwiener, J.V., Amendola, A.A., & Weaver,D.L. (2015). Anthropometric Study of U.S. Truck Drivers: Methods, Summary Statistics, and Multivariate Accommodation Models. National Institute for Occupational Safety and Health, Division of Safety Research.
Günther, C. M., Bürger, A., Rickert, M., Crispin, A., & Schulz, C. U. (2008). Grip Strength in Healthy Caucasian Adults: Reference Values. Journal of Hand Surgery, 33(4), 558–565. http://doi.org/10.1016/j.jhsa.2008.01.008
Hanson, L., Sperling, L., Gard, G., Ipsen, S., & Olivares Vergara, C. (2009). Swedish anthropometrics for product and workplace design. Applied Ergonomics, 40(4), 797–806. http://doi.org/10.1016/j.apergo.2008.08.007
Harrison, C. R., & Robinette, K. M. (2002). CAESAR: Summary Statistics for the Adult Population (ages 18-65) Of United States of America. SAE International.
Hertzberg, H. T. E. (1968). The Conference on Standardisation of Anthropometric Technique and Terminology. American Journal of Physical Anthropology, 28, 1–16.
Hong, S., Jung, E. S., & Park, S. (2014). Comparison of Three-Dimensional Korean Male Anthropometric Data with Modeling Data Generated by Digital Human Models. Human Factors and Ergonomics in Manufacturing & Service Industries, 24(6), 671–684. http://doi.org/10.1002/hfm.20511
Hoque, A. S. M., Parvez, M. S., Halder, P. K., & Szecsi, T. (2014). Ergonomic design of classroom furniture for university students of Bangladesh. Journal of Industrial and Production Engineering, 31(5), 239–252. http://doi.org/10.1080/21681015.2014.940069
Hsiao, H., Whitestone, J., Bradtmiller, B., Whisler, R., Zwiener, J., Lafferty, C., … Gross, M. (2005). Anthropometric criteria for the design of tractor cabs and protection frames. Ergonomics, 48(4), 323–53. http://doi.org/10.1080/00140130512331332891
Hsiao, H., Whitestone, J., Kau, T.-Y., Whisler, R., Routley, J. G., & Wilbur, M. (2014). Sizing Firefighters: Method and Implications. Human Factors: The Journal of the Human Factors and Ergonomics Society, 56(5), 873–910. http://doi.org/10.1177/0018720813516359
Ibrahim, A. I., Abdelsalam, M. S., Muaidi, Q. I., & Hawamdeh, Z. M. (2013). Evaluation of isometric muscle strength and magnitude of hand dominance in right-handed school-age boys. International Journal of Rehabilitation Research., 36(2), 118–26. http://doi.org/10.1097/MRR.0b013e32835a23ff
23
Imrhan, S. N., Sarder, M. D., & Mandahawi, N. (2009). Hand anthropometry in Bangladeshis living in America and comparisons with other populations. Ergonomics, 52, 987–998. http://doi.org/10.1080/00140130902792478
Imrhan, S. N., & Sundararajan, K. (1992). An investigation of finger pull strengths. Ergonomics, 35(3), 289–299. http://doi.org/10.1080/00140139208967814
Ismaila, S. O., Musa, A. ., Adejuyigbe, S. ., & Akinyemi, O. . (2013). Anthropometric Design of Furniture for Use in Tertiary Institutions in Abeokuta , South- Western Nigeria. Engineering Review, 33(3), 179–192.
ISO. (1989). ISO 8559: Basic human body measurements for technological design - Part 2: Statistical summaries of body measurements from national populations. International Organization for Standardization, Geneva, Switzerland.
ISO. (2000). ISO 11226 Ergonomics - Evaluation of static working postures- International Organization for Standardization, Geneva, Switzerland.
ISO. (2002). ISO 14738:2002(en) Safety of machinery – Human physical performance – Part 2: Manual handling of machinery and component parts of machinery- International Organization for Standardization, Geneva, Switzerland.
ISO. (2003). ISO 11228-1:2003 Ergonomics — Manual handling — Part 1: Lifting and carrying- International Organization for Standardization, Geneva, Switzerland.
ISO. (2008). ISO 7250-1: Basic human body measurements for technological design - Part 1: Body measurement definitions and landmarks. International Organization for Standardization, Geneva, Switzerland.
ISO. (2010a). ISO 20685: 3D scanning methodologies for internationally compatible anthropometric databases- International Organization for Standardization, Geneva, Switzerland.
ISO. (2010b). ISO 7250-2: Basic human body measurements for technological design - Part 2: Statistical summaries of body measurements from national populations. International Organization for Standardization, Geneva, Switzerland.
ISO. (2011). ISO 11064-2 Ergonomic design of control centres - Principles for the arrangement of control suites- International Organization for Standardization, Geneva, Switzerland. (Vol. 2011).
ISO. (2012a). ISO/TR 12296:2012 Ergonomics - Manual handling of people in the healthcare sector- International Organization for Standardization, Geneva, Switzerland.
ISO. (2012b). ISO 15535: General requirements for establishing anthropometric databases- International Organization for Standardization, Geneva, Switzerland.General requirements for establishing anthropometric databases.
ISO. (2013). ISO/WD 20685-2 3-D scanning methodologies for internationally compatible anthropometric databases — Part 2: Evaluation protocol of surface shape and repeatability of relative landmark positions.
Jinhua Guan, Ph.D., Hongwei Hsiao, Ph.D., Bruce Bradtmiller, Ph.D., Joyce V. Zwiener, M.S., Alfred A. Amendola, Ph.D. , and Darlene L. Weaver, M. S. (2015). Anthropometric Study of U . S . Truck Drivers.
Karmegam, K., Sapuan, S. M., Ismail, M. Y., Ismail, N., Bahri, M. T. S., & Shuib, S. (2011). Anthropometric study among adults of different ethnicity in Malaysia. International Journal of the Physical Sciences, 6(4), 777–788. http://doi.org/10.5897/IJPS10.310
Kawahara, M. (1998). IS A SEITA FITTED TO THE Division of Living Environmental Studies , Kyushu Institute of Design , Most people who live in mountainous areas of Japan carry loads on their backs with carrier frames or carrier baskets . Carrier frames are more suitable for va. Journal of Human Ergology, 27(1975), 39–46.
Khadem, M. M., & Islam, M. A. (2014). Development of anthropometric data for Bangladeshi male population. International Journal of Industrial Ergonomics, 44(3), 407–412. http://doi.org/10.1016/j.ergon.2014.01.007
Korean Agency for Technology and Standards. (2004). Human Body Dimensions Data of Koreans. Size Korea 2003 Project.
Kouchi, M. and Mochimaru, M. (2011). Errors in landmarking and the evaluation of the accuracy of traditional and 3D anthropometry. Applied Ergonomics, 42(3), 518–527. http://doi.org/10.1016/j.apergo.2010.09.011
Kouchi, M., & Mochimaru, M. (2011). Errors in landmarking and the evaluation of the accuracy of traditional and 3D anthropometry. Applied Ergonomics, 42(3), 518–527. http://doi.org/10.1016/j.apergo.2010.09.011
Kozey, J. W., & Das, B. (2004). Determination of the normal and maximum reach measures of adult wheelchair users. International Journal of Industrial Ergonomics, 33(3), 205–213. http://doi.org/10.1016/j.ergon.2003.05.001
Kroemer, K. H. E., & Grandjean, E. (1997). Fitting the task to the human. A textbook of occupational Ergonomics. London: Taylor & Francis.
Kumar, S., & Garand, D. (1992). Static and dynamic lifting strength at different reach distances in symmetrical and asymmetrical planes. Ergonomics, 35(7–8), 861–880. http://doi.org/10.1080/00140139208967367
24
Laing, R. M., Holland, E. J., Wilson, C. a, & Niven, B. E. (1999). Development of sizing systems for protective clothing for the adult male. Ergonomics, 42(February 2012), 1249–1257. http://doi.org/10.1080/001401399184929
Lavender, S., Marras, W., & Sabol, R. (2002). A study of female Mexican anthropometric measures useful for workstation design in light manufacturing facilities. AIHA Journal, 30. http://doi.org/10.1080/15428110208984717
Lee, W., Jung, K., Jeong, J., Park, J., Cho, J., Kim, H., … You, H. (2013). An anthropometric analysis of Korean male helicopter pilots for helicopter cockpit design. Ergonomics, 56(5), 879–87. http://doi.org/10.1080/00140139.2013.776703
Li, Z., Chang, C.-C., Dempsey, P. G., Ouyang, L., & Duan, J. (2008). Validation of a three-dimensional hand scanning and dimension extraction method with dimension data. Ergonomics, 51(11), 1672–92. http://doi.org/10.1080/00140130802287280
Lu, J.M. and Wang, M. J. J. (2010). The evaluation of scan-derived anthropometric measurements. IEEE Transactions on Instrumentation and Measurement, 59(8), 2048–2054. http://doi.org/10.1109/TIM.2009.2031847
Lucero-Duarte, K., De La Vega-Bustillos, E., & López-Millán, F. (2012). A study of automotive workers anthropometric physical characteristics from Mexico Northwest. Work, 41(SUPPL.1), 5405–5407. http://doi.org/10.3233/WOR-2012-0834-5405
Mahmoudi. (2013). A carpet weaver`s chair based on anthropometric data. International Journal of Occupational Safety and Ergonomics : JOSE, 19(4), 543–550.
Mahoney, J. M., Kurczewski, N. A., & Froede, E. W. (2015). Design method for multi-user workstations utilizing anthropometry and preference data. Applied Ergonomics, 46(PA), 60–66. http://doi.org/10.1016/j.apergo.2014.07.003
Marklin, R. W., Saginus, K. A., Seeley, P., & Freier, S. H. (2010). Comparison of Anthropometry of U.S. Electric Utility Field-Workers With North American General Populations. Human Factors: The Journal of the Human Factors and Ergonomics Society, 52(6), 643–662. http://doi.org/10.1177/0018720810383012
Matias, A. C., Salvendy, G., & Kuczek, T. (1998). Predictive models of carpal tunnel syndrome causation among VDT operators. Ergonomics, 41(2), 213–226. http://doi.org/10.1080/001401398187260
Mavrikios, D., Karabatsou, V., Alexopoulos, K., Pappas, M., Gogos, P., & Chryssolouris, G. (2006). An approach to human motion analysis and modelling. International Journal of Industrial Ergonomics, 36(11), 979–989. http://doi.org/10.1016/j.ergon.2006.08.001
Mazloumi, A., & Mohammadreze, F. (2012). Ergonomic evaluation of interior design of Shoka vehicle and proposing recommendations for improvement. Work (Reading, Mass.), 41 Suppl 1(SUPPL.1), 1477–85. http://doi.org/10.3233/WOR-2012-0341-1477
Meunier, P., & Yin, S. (2000). Performance of a 2D image-based anthropometric measurement and clothing sizing system. Applied Ergonomics, 31(5), 445–451. http://doi.org/10.1016/S0003-6870(00)00023-5
Mohamed Thariq, M. G., Munasinghe, H. P., & Abeysekara, J. D. (2010). Designing chairs with mounted desktop for university students: Ergonomics and comfort. International Journal of Industrial Ergonomics, 40(1), 8–18. Retrieved from http://www.sciencedirect.com/science/article/B6V31-4XP8T1W-1/2/10859f2357b0287a7b01ead2a54d5089
Mokdad, M. (2002). Anthropometric study of Algerian farmers. International Journal of Industrial Ergonomics, 29(6), 331–341. http://doi.org/10.1016/S0169-8141(01)00073-7
Mousavifard, S. A., & Alvandian, V. (2011). Evaluation of Human Factors Required for Designing Passengers in Passenger Cars. Australian Journal of Basic and Applied Sciences, 5(7), 1241–1246.
Mueller, W. H., & Martorell, R. (1988). Reliability and accuracy of measurement. In T. G. Lohman, A. F. Roche, & R. Martorell (Eds.), Anthropometric Standardization Reference Manual. (pp. 83–86). Human Kinetic Books, Champaign, Illinois,.
Nag, A., Nag, P. K., & Desai, H. (2003). Hand anthropometry of Indian women. Indian Journal of Medical Research, 117(JUNE), 260–269.
NASA. (1978). Anthropometric Source Book Volume II: A Handbook of Anthropometric Data. (W. Associates, Ed.)NASA reference publication 1024. NASA.
Nicolay, C. W., & Walker, A. L. (2005). Grip strength and endurance: Influences of anthropometric variation, hand dominance, and gender. International Journal of Industrial Ergonomics, 35(7), 605–618. http://doi.org/10.1016/j.ergon.2005.01.007
Norton, K., & Olds, T. (1996). Antropometrica. (K. Norton & T. Olds, Eds.). Sydney: University of New South Wales Press, Sydney 2052 Australia, Tel: (02) 398-8900, Fax: (02) 398-3408.
Oñate, E., Meyer, F., & Espinoza, J. (2012). On the road toward the development of clothing size standards and safety devices for Chilean workers. Work, 41(SUPPL.1), 5400–5402. http://doi.org/10.3233/WOR-2012-0832-5400
Osquei-Zadeh, R., Ghamari, J., Abedi, M., & Shiri, H. (2012). Ergonomic and anthropometric consideration for library furniture in an Iranian public university. International Journal of Occupational and Environmental Medicine, 3(1), 19–26.
Pederson, D., & Gore, C. (1996). Anthropometric measurements error. In K. Norton & T. Olds (Eds.), University of New South Wales
25
Press, Sidney 2052 Australia, (Vol. 1, p. 70). Sydney: University of New South Wales Press, Sydney 2052 Australia, Tel: (02) 398-8900, Fax: (02) 398-3408.
Pennathur, A., & Dowling, W. (2003). Effect of age on functional anthropometry of older Mexican American adults: A cross-sectional study. International Journal of Industrial Ergonomics, 32(1), 39–49. http://doi.org/10.1016/S0169-8141(03)00028-3
Perini, T. a, de Oliveira, G. L., Ornelia, J. S., & de Oliveira, F. P. (2005). Technical error of measurement in anthropometry. Revista Brasileira de Medicina Do Esporte, 11, 81–85. http://doi.org/http://dx.doi.org/10.1590/S1517-86922005000100009
Pheasant, S. (2003). Bodyspace (Second). London: Taylor & Francis.
Pheasant, S., & Haslegrave, C. (2006). Bodyspace: Antrhopometry and Design at Work. (Third). London: Taylor & Francis.
Pheasant, S., & Steenbekkers, B. (2005). Anthropometry and the design of workspaces. In J. Wilson & N. Corlett (Eds.), Evaluation of Human Work (Third, pp. 706–754). Boca Raton: Taylor & Francis.
Pourtaghi, G., Valipour, F., Sadeghialavi, H., & Lahmi, M. A. (2014). Changes over Recent Years. International Journal of Occupational and Environmental Medicine, 5, 115–124.
Reis, P. F., Peres, L. S., Tirloni, A. S., Reis, D. C. Dos, Estrázulas, J. A., Rossato, M., & Moro, A. R. P. (2012). Influence of anthropometry on meat-packing plant workers: An approach to the shoulder joint. Work, 41(SUPPL.1), 4612–4617. http://doi.org/10.3233/WOR-2012-0077-4612
Research Institute of Human Engineering for Quality Life. (2007). Japanese Body Size Database 2004- 2006. (in Japanese).
Robinette, K. M., Blackwell, S., & Daanen, H. (2002). Civilian American and European Surface Anthropometry Resource (CAESAR)- FInal Report, Volume I: Summary. SAE International.
Roebuck, J. A., Kroemer, K. H. E., & Thomson, W. G. (1975). Engineering Anthropometry Method (Second). New York: Wiley.
Sadeghi, F., Bahrami, A. R., & Joneidi Jafari, A. (2014). Comparison of static anthropometric characteristics among workers of three iranian ethnic groups. Anthropologist, 18(2), 601–608.
Sadeghi, F., Mazloumi, A., & Kazemi, Z. (2015). An anthropometric data bank for the Iranian working population with ethnic diversity. Applied Ergonomics, 48, 95–103. http://doi.org/10.1016/j.apergo.2014.10.009
Salamat, A., Asgari, M., Salamat, M., Shanei, A., & Khoshhali, M. (2015). Anthropometric predictive equations for estimating body composition. Advanced Biomedical Research, 4, 34. http://doi.org/10.4103/2277-9175.150429
Sett, M., & Sahu, S. (2016). Anthropometric characteristics and evaluation of nutritional status amongst female brick field workers of the unorganized sectors of West Bengal, India. HOMO- Journal of Comparative Human Biology, 67(3), 235–244. http://doi.org/10.1016/j.jchb.2015.10.003
Shah, M. R. I., Anwar, S., Mondal, D. K., Yesmin, S., & Ahmed, S. (2015). Anthropometry of the nose : a comparative study between adult male Santhals and Bengalis in Bangladesh. Mediscope, 2(2), 28–32.
Shrestha, O., Bhattacharya, S., Jha, N., Dhungel, S., Jha, C. B., Shrestha, S., & Shrestha, U. (2009). Cranio facial anthropometric measurements among Rai and Limbu community of Sunsari District, Nepal. Nepal Medical College Journal : NMCJ, 11(3), 183–5.
Sicotte, M., Ledoux, M., Zunzunegui, M.-V., Ag Aboubacrine, S., & Nguyen, V.-K. (2010). Reliability of anthropometric measures in a longitudinal cohort of patients initiating ART in West Africa. BMC Medical Research Methodology, 10(1), 102. http://doi.org/10.1186/1471-2288-10-102
Simeonov, P., Hsiao, H., Kim, I.-J., Powers, J. R., & Kau, T.-Y. (2012). Factors Affecting Extension Ladder Angular Positioning. Human Factors: The Journal of the Human Factors and Ergonomics Society, 54(3), 334–345. http://doi.org/10.1177/0018720812445805
Simmons, K. P., & Istook, C. L. (2003). Body measurement techniques. Journal of Fashion Marketing and Management: An International Journal (Vol. 7). http://doi.org/10.1108/13612020310484852
Sims, R.E., Marshall, R., Gyi, D.E., Summerskill, S.J. and Case, K. (2012). Collection of anthropometry from older and physically impaired persons: Traditional methods versus TC 2 3-D body scanner. International Journal of Industrial Ergonomics, 42(1), 65–72. http://doi.org/10.1016/j.ergon.2011.10.002
Singh, Inderjeet (Defence Institute of Phsyiology and Allied sciences, D., Rawat, Shweta (Defence Institute of Phsyiology and Allied sciences, D., & Varte, L.R (Defence Institute of Phsyiology and Allied sciences, D. (2015). Workstation Related Anthropometric and Body Composition Parameters of Indian Women of Different Geographical Regions. Journal of Krishna Institute of Medical Sciences University, 4(1), 38–44.
Snook, S. H., & Ciriello, V. M. (1991). The design of manual handling tasks: revised tables of maximum acceptable weights and forces. Ergonomics, 34(9), 1197–1213. http://doi.org/10.1080/00140139108964855
26
Spasojević Brkić, V. K., Klarin, M. M., & Brkić, A. D. (2015). Ergonomic design of crane cabin interior: The path to improved safety. Safety Science, 73, 43–51. http://doi.org/10.1016/j.ssci.2014.11.010
Stålhammar, H. R., & Louhevaara, V. (1992). Anthropometric, muscle strength, and spinal mobility characteristics as predictors in the rating of acceptable loads in parcel sorting. Ergonomics, 35(9), 1033–44. http://doi.org/10.1080/00140139208967380
Steenbekkers, L. (1993). Child development, design implications and accident prevention. Delft, The Netherlands.: Delft University Press.
Stone, M. R., Stevens, D., & Faulkner, G. E. J. (2013). Maintaining recommended sleep throughout the week is associated with increased physical activity in children. Preventive Medicine, 56(2), 112–117. http://doi.org/10.1016/j.ypmed.2012.11.015
Sudhakaran, S., & Mirka, G. A. (2005). A laboratory investigation of personality type and break-taking behavior. International Journal of Industrial Ergonomics, 35(3), 237–246. http://doi.org/10.1016/j.ergon.2004.09.003
Sutjana, I. D., Sutajaya, M., Purnawati, S., Adiatmika, P., Tunas, K., Suardana, E., & Swamardika, I. B. (2008). Preliminary anthropometric data of medical students for equipment applications. Journal of Human Ergology, 37(1), 45–48.
Syuaib, M. F. (2015a). Anthropometric study of farm workers on Java Island, Indonesia, andits implications for the design of farm tools and equipment. Applied Ergonomics, 51, 222–235. http://doi.org/10.1016/j.apergo.2015.05.007
Syuaib, M. F. (2015b). Ergonomic of the manual Harvesting tasks of oil-palm plantation in Indonesia based on anthropometric, postures and work motions analyses. International Agricultural Engineering Journal, 17(3), 248–262.
Taha, Z., Jomoah, I. M., & Zadry, H. R. (2009). A study of anthropometric characteristics between Malaysian and Saudi Arabian males aged 20 to 30 years. J Hum Ergol (Tokyo), 38(1), 27–32.
Toro, Z. (1997). Computers ind. Engng. Computers Ind. Engng, 33(1–2), 213–216.
Tranfield, D., Denyer, D., & Smart, P. (2003). Towards a methodology for developing evidence-informed management knowledge by means of systematic review. British Journal of Management, 14(3), 207–222. http://doi.org/10.1111/1467-8551.00375
Tunay, M. ; M. K. (2008). An analysis of biomechanical and anthropometric parameters on classroom furniture design Metin. African Journal of Biotechnology, 7(8), 1081–1086. http://doi.org/10.5897/AJB08.063
Ugurlu, U., & Ozdogan, H. (2011). Development of normative data for cylindrical grasp pressure. International Journal of Industrial Ergonomics, 41(5), 509–519. http://doi.org/10.1016/j.ergon.2011.03.007
Ulijaszek, S. J., & Kerr, D. A. (1999). Review article Anthropometric measurement error and the assessment of nutritional status. British Journal of Nutrition, 82(3), 165–177.
Ulijaszek, S. J., & Mascie-Taylor, C. G. N. (1994). Anthropometry: the individual and the population. Journal of Chemical Information and Modeling (Vol. 53). New York: Cambridge University. http://doi.org/10.1017/CBO9781107415324.004
Van Driel, R., Trask, C., Johnson, P. W., Callaghan, J. P., Koehoorn, M., & Teschke, K. (2013). Anthropometry-corrected exposure modeling as a method to improve trunk posture assessment with a single inclinometer. Journal of Occupational and Environmental Hygiene, 10(3), 143–154. http://doi.org/10.1080/15459624.2012.757479
Van Veelen, M. A., Meijer, D. W., Uijttewaal, I., Goossens, R. H. M., Snijders, C. J., & Kazemiere, G. (2003). Improvement of the laparoscopic needle holder based on new ergonomic guidelines. Surgical Endoscopy and Other Interventional Techniques, 17(5), 699–703. http://doi.org/10.1007/s00464-002-9186-y
Verhaert, V., Haex, B., De Wilde, T., Berckmans, D., Verbraecken, J., de Valck, E., & Vander Sloten, J. (2011). Ergonomics in bed design: the effect of spinal alignment on sleep parameters. Ergonomics, 54(2), 169–178. http://doi.org/10.1080/00140139.2010.538725
Villamor, E., & Bosch, R. J. (2014). Optimal treatment of replicate measurements in anthropometric studies. Annals of Human Biology, 4460(0), 1–4. http://doi.org/10.3109/03014460.2014.969488
Wang, E., & Chao, W. (2010). In searching for constant body ratio benchmarks. International Journal of Industrial Ergonomics, 40(1), 59–67. http://doi.org/10.1016/j.ergon.2009.08.003
Werner, R. A., Franzblau, A., Albers, J. W., & Armstrong, T. J. (1998). Median mononeuropathy among active workers: Are there differences between symptomatic and asymptomatic workers? American Journal of Industrial Medicine, 33(4), 374–378. http://doi.org/10.1002/(SICI)1097-0274(199804)33:4<374::AID-AJIM7>3.0.CO;2-U
WHO, M. G. R. S. G. (2006). Reliability of anthropometric measurements in the WHO Multicentre Growth Reference Study. Acta Paediatrica. Supplementum, 450, 47–55. http://doi.org/10.1080/08035320500494464
Wibowo, R. K. K., Soni, P., & Salokhe, V. M. (2013). Anthropometric dimensions, hand and isometric strength of farmers in East Java, Indonesia. International Agricultural Engineering Journal, 22(2), 54–64.
Widyanti, A., Susanti, L., Sutalaksana, I. Z., & Muslim, K. (2015). Ethnic differences in Indonesian anthropometry data: Evidence from
27
three different largest ethnics. International Journal of Industrial Ergonomics, 47, 72–78. http://doi.org/10.1016/j.ergon.2015.02.008
Wong, J. Y., Oh, A. K., Ohta, E., Hunt, A. T., Rogers, G. F., Mulliken, J. B., & Deutsch, C. K. (2008). Validity and reliability of craniofacial anthropometric measurement of 3D digital photogrammetric images. Cleft Palate-Craniofacial Journal, 45(3), 232–239.
Wu, G., Liu, S., Wu, X., & Ding, X. (2015). Research on lower body shape of late pregnant women in Shanghai area of China. International Journal of Industrial Ergonomics, 46, 69–75. http://doi.org/10.1016/j.ergon.2014.12.007
Xiong, S., Goonetilleke, R. S., Witana, C. P., & Lee Au, E. Y. (2008). Modelling foot height and foot shape-related dimensions. Ergonomics, 51(8), 1272–1289. http://doi.org/10.1080/00140130801996147
Yang, L., Shen, H., & Wu, G. (2007). Racial differences in respirator fit testing: A pilot study of whether American fit panels are representative of Chinese faces. Annals of Occupational Hygiene, 51(4), 415–421. http://doi.org/10.1093/annhyg/mem005
Yun, M. H., Jun Eoh, H., & Cho, J. (2002). A two-dimensional dynamic finger modeling for the analysis of repetitive finger flexion and extension. International Journal of Industrial Ergonomics, 29(4), 231–248. http://doi.org/10.1016/S0169-8141(01)00066-X
Zetterberg, C., & Ofverholm, T. (1999). Carpal tunnel syndrome and other wrist/hand symptoms and signs in male and female car assembly workers. International Journal of Industrial Ergonomics, 23(3), 193–204. http://doi.org/10.1016/S0169-8141(97)00054-1
Zunjic, A., Brkic, V. S., Klarin, M., Brkic, A., & Krstic, D. (2015). Anthropometric assessment of crane cabins and recommendations for design: A case study. Work, 52(1), 185–194. http://doi.org/10.3233/WOR-152042
Related Documents