Uncorrected Author Proof Journal of Alzheimer’s Disease xx (20xx) x–xx DOI 10.3233/JAD-132264 IOS Press 1 Accuracy of Cerebrospinal Fluid A 1-42 for Alzheimer’s Disease Diagnosis: A Systematic Review and Meta-Analysis 1 2 3 Maria Inˆ es Rosa a,∗ , Josmar Perucchi b , Lidia Rosi Medeiros c , Bruna Fernandes d , Maria Eduarda Fernandes dos Reis b and Bruno Rosa Silvae e 4 5 a Laboratory of Epidemiology at University of Extremo Sul Catarinense, Crici´ uma, SC, Brazil 6 b Postgraduate Program in Health Sciences at University of Extremo Sul Catarinense, Crici´ uma, SC, Brazil 7 c Postgraduate Program in Medicine: Medical Sciences at Federal University of Rio Grande do Sul, Porto Alegre, Brazil 8 9 d Graduate Nutrition at University of Extremo Sul Catarinense, Crici´ uma, SC, Brazil 10 e Graduated in Medicine at University of Extremo Sul Catarinense, Crici´ uma, SC, Brazil 11 Accepted 3 December 2013 Abstract. Background: Alzheimer’s disease (AD) is the most common cause of dementia, accounting for 65–70% of all dementia cases. Objective: We performed a systematic review and meta-analysis to estimate the accuracy of cerebrospinal fluid A 1-42 for the diagnosis of AD. A comprehensive search of the Cochrane Library, MEDLINE, LILACS, Grey literature, and EMBASE was performed for papers published from January 1990 to August 2013. The following Medical Subject Headings (MeSH) terms were searched: “Alzheimer disease” or “AD” and “amyloid-” or “A 1-42 ”. Methods: We included case-control and cross-sectional studies, prospective or retrospective, that evaluated A 1-42 levels in AD. Statistical analysis was performed using REVMAN 5.2, Meta Disc, and Stata 11.0. Results: A total of 804 citations were identified by the search strategy and 41 studies were included. Meta-analysis showed a sensitivity of 84.3% (95% CI: 85.6%–81%) and specificity of 79.4% (95% CI: 77.6%–81.1%). The diagnostic odds ratio was 28.9 (95% CI: 21.2–39.5). Conclusion: Our study demonstrated that A 1-42 can discriminate AD from controls with good sensitivity and specificity. 12 13 14 15 16 17 18 19 20 21 22 23 Keywords: A 1-42 , Alzheimer’s disease, meta-analyses, systematic review 24 INTRODUCTION 25 Alzheimer’s disease (AD) is the most common cause 26 of dementia, accounting for 65–70% of all dementia 27 cases [1]. It is a progressive and insidious dementia 28 that severely debilitates and is characterized patholog- 29 ically by neuronal loss, extracellular amyloid- (A) 30 plaques, and intracellular tau neurofibrillary tangles. 31 ∗ Correspondence to: Maria Inˆ es Rosa, Rua Cruz e Souza, 510, Bairro Pio Correa, CEP 88811-550, Crici ´ uma-SC, Brazil. Tel.: +55 48 34339976; Fax: +55 48 34335766; E-mail: [email protected]. While the etiology of AD remains controversial, the 32 A amyloid hypothesis postulates that A is the pri- 33 mary cause of the disease [2]. AD affects up to 15% of 34 people over the age of 65 years and nearly half of all 35 individuals by the age of 85 years [3]. 36 The diagnosis of AD is based on the identification 37 of dementia with a clinical profile suggestive of the 38 disease from the medical history and clinical examina- 39 tion as well as the exclusion of other causes of dementia 40 using brain imaging and laboratory tests [4]. 41 A 1-42 is considered to be more pathologic as it 42 aggregates more readily and deposits much earlier in 43 ISSN 1387-2877/14/$27.50 © 2014 – IOS Press and the authors. All rights reserved

Welcome message from author
This document is posted to help you gain knowledge. Please leave a comment to let me know what you think about it! Share it to your friends and learn new things together.
Transcript
Unc
orre
cted
Aut
hor P
roof
Journal of Alzheimer’s Disease xx (20xx) x–xxDOI 10.3233/JAD-132264IOS Press
1
Accuracy of Cerebrospinal Fluid A�1-42 forAlzheimer’s Disease Diagnosis: ASystematic Review and Meta-Analysis
1
2
3
Maria Ines Rosaa,∗, Josmar Perucchib, Lidia Rosi Medeirosc, Bruna Fernandesd,Maria Eduarda Fernandes dos Reisb and Bruno Rosa Silvaee
4
5
aLaboratory of Epidemiology at University of Extremo Sul Catarinense, Criciuma, SC, Brazil6
bPostgraduate Program in Health Sciences at University of Extremo Sul Catarinense, Criciuma, SC, Brazil7
cPostgraduate Program in Medicine: Medical Sciences at Federal University of Rio Grande do Sul, Porto Alegre,Brazil
8
9
dGraduate Nutrition at University of Extremo Sul Catarinense, Criciuma, SC, Brazil10
eGraduated in Medicine at University of Extremo Sul Catarinense, Criciuma, SC, Brazil11
Accepted 3 December 2013
Abstract.Background: Alzheimer’s disease (AD) is the most common cause of dementia, accounting for 65–70% of all dementia cases.Objective: We performed a systematic review and meta-analysis to estimate the accuracy of cerebrospinal fluid A�1-42 for thediagnosis of AD. A comprehensive search of the Cochrane Library, MEDLINE, LILACS, Grey literature, and EMBASE wasperformed for papers published from January 1990 to August 2013. The following Medical Subject Headings (MeSH) termswere searched: “Alzheimer disease” or “AD” and “amyloid-�” or “A�1-42”.Methods: We included case-control and cross-sectional studies, prospective or retrospective, that evaluated A�1-42 levels in AD.Statistical analysis was performed using REVMAN 5.2, Meta Disc, and Stata 11.0.Results: A total of 804 citations were identified by the search strategy and 41 studies were included. Meta-analysis showed asensitivity of 84.3% (95% CI: 85.6%–81%) and specificity of 79.4% (95% CI: 77.6%–81.1%). The diagnostic odds ratio was28.9 (95% CI: 21.2–39.5).Conclusion: Our study demonstrated that A�1-42 can discriminate AD from controls with good sensitivity and specificity.
12
13
14
15
16
17
18
19
20
21
22
23
Keywords: A�1-42, Alzheimer’s disease, meta-analyses, systematic review24
INTRODUCTION25
Alzheimer’s disease (AD) is the most common cause26
of dementia, accounting for 65–70% of all dementia27
cases [1]. It is a progressive and insidious dementia28
that severely debilitates and is characterized patholog-29
ically by neuronal loss, extracellular amyloid-� (A�)30
plaques, and intracellular tau neurofibrillary tangles.31
∗Correspondence to: Maria Ines Rosa, Rua Cruz e Souza, 510,Bairro Pio Correa, CEP 88811-550, Criciuma-SC, Brazil. Tel.: +5548 34339976; Fax: +55 48 34335766; E-mail: [email protected].
While the etiology of AD remains controversial, the 32
A� amyloid hypothesis postulates that A� is the pri- 33
mary cause of the disease [2]. AD affects up to 15% of 34
people over the age of 65 years and nearly half of all 35
individuals by the age of 85 years [3]. 36
The diagnosis of AD is based on the identification 37
of dementia with a clinical profile suggestive of the 38
disease from the medical history and clinical examina- 39
tion as well as the exclusion of other causes of dementia 40
using brain imaging and laboratory tests [4]. 41
A�1-42 is considered to be more pathologic as it 42
aggregates more readily and deposits much earlier in 43
ISSN 1387-2877/14/$27.50 © 2014 – IOS Press and the authors. All rights reserved

Unc
orre
cted
Aut
hor P
roof
2 M.I. Rosa et al. / Alzheimer’s Disease Diagnosis
the disease process than A�1-40 [5]. Low concentra-44
tions of A�1-42 in cerebrospinal fluid (CSF) have also45
been shown to predict the transition of mild cognitive46
impairment to AD and parallel brain A� deposition47
[6, 7].48
The mechanisms controlling brain A� deposition49
and clearance and the relationship between peripheral50
and brain A� concentrations are poorly understood.51
Therefore, we performed a systematic review and52
meta-analysis to evaluate the diagnostic potential of53
CSF levels of amyloid-� protein ending at amino acid54
42 (A�1-42) as biomarkers for AD.55
MATERIALS AND METHODS56
Search strategy57
We searched the Cochrane Library, MEDLINE,58
LILACS, EMBASE, Congress Abstracts, and Grey lit-59
erature (Google Scholar and the British Library) for60
papers published from January 1990 to May 2013. We61
searched using the following terms, both as text words62
and Medical Subject Headings (MeSH) or equivalent63
subject heading/thesaurus terms: “Alzheimer disease”64
or “AD” and “amyloid-�” or “A�1-42”. The search was65
limited to human studies and had no language restric-66
tions. Reference lists of all available primary studies67
were reviewed to identify additional relevant citations.68
The complete search strategy is available on request.69
Screening of abstracts for eligibility70
Abstracts/titles identified from the search were71
screened by three reviewers (MIR, JLP, and LRM).72
Disagreements about study inclusion or exclusion were73
solved by consensus, and when this was not possi-74
ble, they were arbitrarily resolved by a fourth reviewer75
(BRS).76
Study selection77
We included cohort, case-control, and cross-78
sectional studies, prospective or retrospective, that79
evaluated the CSF levels of A�1-42 as a biomarker for80
AD.81
Patients82
We analyzed studies that included patients with83
an initial clinical AD diagnosis according to strictly84
applied clinical diagnostic criteria and in which85
CSF concentrations of A�1-42 had been determined.86
Patients with other causes of cognitive impairment,87
including subdural hematoma, brain tumor, central ner- 88
vous system infection, schizophrenia, major depressive 89
episode, or alcohol abuse, were excluded. 90
Index test 91
The diagnostic test consisted of the analysis of CSF 92
concentrations of A�1-42 in AD. 93
Reference standard 94
The diagnosis of reference was a diagnosis of AD 95
based on the criteria of the Diagnostic and Statistical 96
Manual of Mental Disorders, fourth edition (DSM- 97
IV-TR)1 and the National Institute of Neurological 98
Disorders and Stroke–Alzheimer Disease and Related 99
Disorders (NINCDS–ADRDA) working group [8]. 100
Data abstraction 101
Two investigators (MIR, JLP) independently 102
extracted data from the primary studies. The assess- 103
ment of English-language articles was performed by 104
two reviewers (BRS, BF), while the assessment of 105
non-English articles was independently performed by 106
one reviewer (LRM), following translation when nec- 107
essary. Any disagreement was resolved by consensus 108
for both English and non-English studies. We excluded 109
patients with a diagnosis of mild cognitive impairment. 110
We extracted data on study, patients, and test charac- 111
teristics by using a standardized form. Two reviewers 112
(BRS, JLP) independently abstracted data regarding 113
the prevalence of AD. We calculated the sensitivity, 114
specificity, positive likelihood ratio, and diagnostic 115
odds ratio (DOR) from the primary studies of A�1-42 116
diagnosis. Studies that lacked the data needed to create 117
2 × 2 contingency tables were excluded. Any disagree- 118
ment was resolved by consensus for studies published 119
in all languages. Final inclusion or exclusion was 120
made with reference to a selection criteria check- 121
list. Disagreements about study inclusion or exclusion 122
in meta-analysis were initially solved by consensus, 123
and when this was not possible, they were arbitrarily 124
resolved by one reviewer (LRM). Agreement statistics 125
among reviewers were calculated. 126
Quality assessment 127
All articles meeting the eligibility criteria were 128
assessed for their methodological quality. Quality was 129
assessed with the Diagnostic Accuracy Studies tool 130
recommended by the Cochrane Collaboration, the 131
Quality Assessment of Diagnostic Accuracy Stud- 132
ies (QUADAS-2). This tool comprises four domains: 133

Unc
orre
cted
Aut
hor P
roof
M.I. Rosa et al. / Alzheimer’s Disease Diagnosis 3
patient selection, index test, reference standard, and134
flow and timing. Each domain is assessed in terms of135
risk of bias, and the first three domains are also assessed136
in terms of concerns regarding applicability. Signaling137
questions are included to help judge the risk of bias138
[9]. The quality assessment of the studies was indepen-139
dently performed by MIR and JLP. Any disagreement140
was resolved by consensus.141
Data synthesis and statistical analysis142
For each study, 2 × 2 contingency tables were con-143
structed in which all cases were classified as AD and144
non-AD. We calculated the true-positive rate (TPR;145
sensitivity), specificity, and false-positive rate (FPR;146
1 – specificity) [10]. When 2 × 2 tables had a cell147
with a value of 0, the calculations were corrected, and148
when a study contained two cells with the value of149
0, it was excluded from the analysis [11]. Bivariate150
analysis was used to calculate the pooled estimates151
of sensitivity, specificity, and likelihood ratios (LRs)152
along with 95% confidence intervals (CIs) for the sum-153
mary estimates [12]. The bivariate model preserves the154
2-dimensional nature of the diagnostic data by ana-155
lyzing the logit transformed sensitivity and specificity156
of each study in a single model and considers both157
within-study and between-study variability, in contrast158
to the Littenberg and Moses method, which departs159
from a fixed effects model [13]. To detect the cut-off160
threshold effects, the relationship between sensitiv-161
ity and specificity was evaluated using the Spearman162
correlation coefficient. Pooled estimates were calcu-163
lated only for studies showing sufficient clinical and164
statistical homogeneity. I2 or Q tests (commonly used165
in meta-analysis) are not recommended for assessing166
statistical homogeneity in diagnostic reviews because167
they do not consider the association between sensitiv-168
ity and specificity [14]. The prevalence was calculated169
according to the following equation: TP + FN /number170
total appendicitis extracted from contingency tables.171
The DOR can relate to different combinations of sen-172
sitivities and specificities. The DOR describes the odds173
of the positive test results in participants with disease174
compared with the odds of positive test results in those175
without disease. A single DOR corresponds to a set of176
sensitivities and specificities depicted by the summary177
receiver operating characteristic (SROC) curve. It can178
change according to the threshold and to the ROC curve179
used to define an abnormal examination resulting in an180
expected trade-off between sensitivity and specificity.181
Table 1 shows the formulas and definition commonly182
used test indicators in diagnostic research.183
A SROC curve was generated using data from all 184
thresholds, using the Littenberg and Moses method 185
[13]. Additionally, the area under the curve (AUC) 186
can summarize the inherent capacity of a test for dis- 187
criminating a diseased from a non-diseased subject. 188
Accurate tests usually have AUCs close to 1, and 189
poor tests usually have AUCs close to 0.5 [13]. Sen- 190
sitivity analyses were performed to assess excluded 191
studies with a high risk of verification bias according 192
to QUADAS 2. To analyze publication bias, inverted 193
funnel plots of the logarithmic odds ratio (OR) of indi- 194
vidual studies were plotted against sample size [14]. 195
Statistical analysis was performed with the software 196
Stata 11 (Stata Corp, College Station, TX, USA) soft- 197
ware environment, Meta-DiSc® (Clinical Biostatistics 198
Unit, Ramon y Cajal Hospital, Madrid, Spain) (version 199
1.4), and with RevMan 5.2 [15–17]. 200
RESULTS 201
The search identified a total of 804 citations, of 202
which 419 were potentially relevant after initial eval- 203
uation. From these studies, 378 full articles were 204
excluded. Forty-one (41) primary studies [18–57], 205
involving 5,086 patients (2,932 AD and 2,154 con- 206
trols), met the criteria for inclusion and were analyzed 207
(Table 2). The study selection process is summarized 208
in Fig. 1. 209
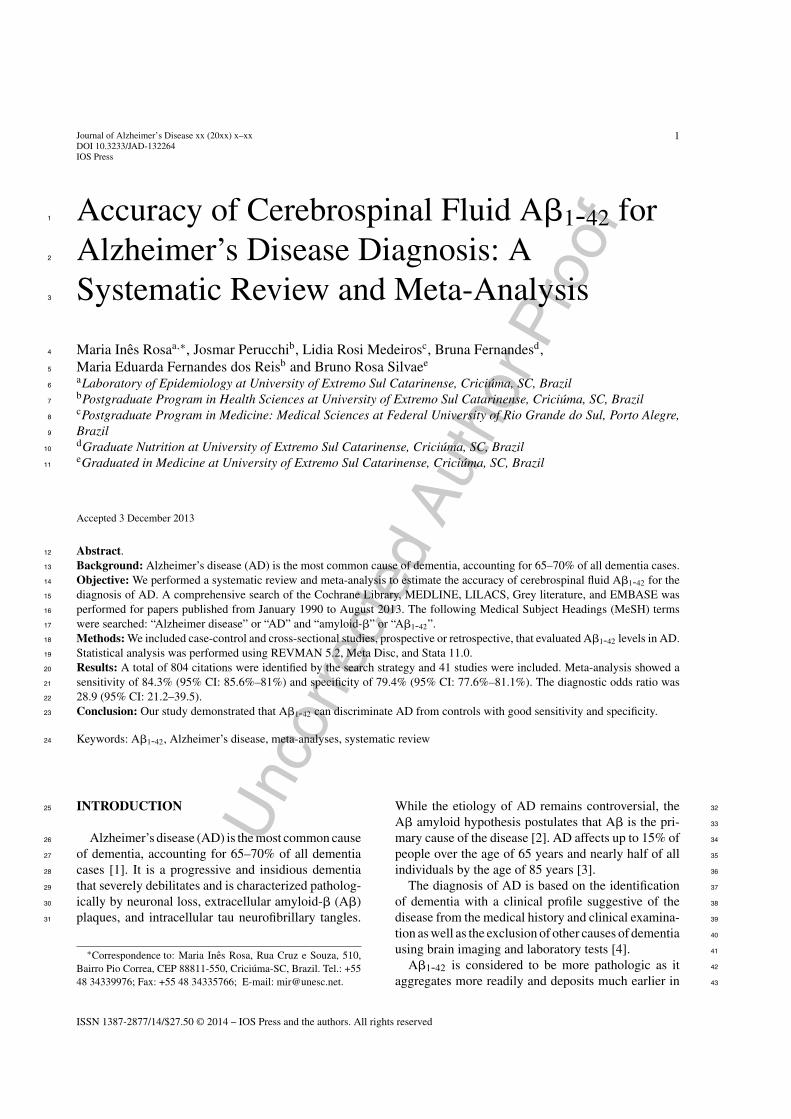
Quality assessment 210
The risk of bias for patient selection, index test, 211
reference standard, and flow and timing as well as 212
the concerns for applicability related to the first three 213
domains are shown in Fig. 2. The QUADAS items 214
were evaluated, and 31 studies received a positive 215
assessment in the all domains. Another showed at 216
least one unclear item in the list. Our inter-rater 217
reliability for assessing the methodological quality 218
with QUADAS was 94% (κ = 0.86), indicating good 219
agreement. 220
Sensitivity analysis 221
Among the 41 studies included in the meta-analysis, 222
some were identified as outliers, and one re-analysis 223
was performed without them. However, no significant 224
difference was found in the sensitivity or specificity; 225
thus, we decided not to exclude these papers from the 226
meta-analysis. 227

Unc
orre
cted
Aut
hor P
roof
4 M.I. Rosa et al. / Alzheimer’s Disease Diagnosis
Table 1Commonly used test indicators in diagnostic research
Reference standardPositive Negative
Positive TP FP TP+FP
Negative FN TNFN+TN
Indextest
TP+FN TN+FP TP+FP+FN+TN
2 x
2 co
ntin
genc
y ta
ble
Test indicator Formula Definition
Sensitivity (true positive rate, TPR) TP/(TP + FN) Proportion negative test results amongthe “healthy”
Specificity (true negative rate, TNR) TN/(TN + FP) Proportion negative test results amongthe “healthy”
Likelihood ratio of a positive test result(LR+)
sensitivity/(1-specificity) Ratio of a positive test result amongdiseased to the same result in the“healthy”
Likelihood ratio of a negative test result(LR−)
(1- sensitivity)/specificity Ratio of a negative test result amongdiseased to the same result in the“healthy”
Diagnostic Odds Ratio (DOR) LR+/LR− = (sensitivity×specificity)/(1–sensitivity) × (1– specificity)= (TP/FN)/(FP/TN)
Summarizes the diagnostic accuracy ofthe index test as a single number thatdescribes how many times higher theodds are of obtaining a test positiveresult in a diseased rather than anon-diseased person.
ROC curve and the area under the curve(AUC)
In a ROC curve the true positive rate(Sensitivity) is plotted in function ofthe false positive rate (100-Specificity)for different cut-off points of aparameter. Each point on the ROCcurve represents asensitivity/specificity paircorresponding to a particular decisionthreshold. The area under the ROCcurve (AUC) is a measure of how wella parameter can distinguish betweentwo diagnostic groups(diseased/normal).
It shows the tradeoff between sensitivityand specificity (any increase insensitivity will be accompanied by adecrease in specificity).
Accuracy is measured by the area underthe ROC curve. An area of 1 representsa perfect test; an area of 0.5 representsa worthless test.
The abbreviations TP, FP, FN, and TN denote the number of true positives, false positives, false negatives, and true negatives, respectively [13].
Fig. 1. Flow chart of trial selection.
Diagnostic performance of CSF concentrations of 228
Aβ1-42 229
Figure 3 shows the forest plot of the DOR and 230
corresponding 95% CI. The DOR showed a signif- 231
icance of 28.9 (95% CI: 21.2–39.5). Meta-analysis 232
showed an overall sensitivity of 84.3% (95% CI: 233
85.6%–81%) and a specificity of 79.4% (95% CI: 234
77.6%–81.1%) (Table 2). Asymmetric SROC curves 235
were used because of the heterogeneity among studies 236
(Fig. 4). The LR+ and LR- were 4.5 (95% CI: 3.7–5.4) 237
and 0.18 (95% CI: 0.14–0.22), respectively. 238
In the subgroup of 11 studies that reported the mean 239
and SD of the A�1-42 levels in the CSF of patients 240
with AD, the mean value was 467.2 pg/ml for AD 241
patients (±189.1), while in controls it was 925.1 pg/ml 242

Unc
orre
cted
Aut
hor P
roof
M.I. Rosa et al. / Alzheimer’s Disease Diagnosis 5
Table 2Characteristics of the studies included in meta-analysis and data extracted from literature
Study/year Country AD Age Cut off TP FP FN TN Sensibility Specificity(pg/ml)
Andreason et al.,1999 [18]
Sweden 53 – 1130 49 2 4 19 0.92 (0.82–0.98) 0.90 (0.70–0.99)
Andreasen et al.,2001 [19]
Sweden 105 75.9 (±6.8) 523 99 11 6 89 0.94 (0.88–0.98) 0.89 (0.81–0.94)
Andreasen et al.,2003 [20]
Sweden 44 73.7 600 34 4 10 28 0.77 (0.62–0.88) 0.87 (0.71–0.96)
Bibl et al., 2006[21]
Germany 18 69.7 (±10.6) 559 18 1 0 13 1.00 (0.81–1.00) 0.93 (0.66–0.1)
Bibl et al., 2007[22]
Germany 71 555 60 4 11 16 0.84 (0.74–0.92) 0.80 (0.56–0.94)
de Jong et al.,2006 [23]
The Netherlands 61 68 (±8.8) 603 57 2 4 28 0.93 (0.84–0.98) 0.93 (0.78–0.99)
de Meyer et al.,2010 [24]
Belgium 100 76 (±4) 188 91 43 7 71 0.93 (0.86–0.97) 0.62 (0.53–0.71)
Galasko et al.,1998 [25]
USA 82 71.7 (±8.4) 1031 74 12 8 48 0.90 (0.82–0.96) 0.80 (0.68–0.89)
Ganzer et al.,2003 [26]
Germany 105 72 (49–87) 293.5 96 29 9 39 0.91 (0.84–0.96) 0.57 (0.45–0.69)
Gao et al., 2010[27]
Sweden 26 71.84 (±7.3) 150 21 1 5 9 0.81 (0.61–0.93) 0.90 (0.55–0.1)
Hertze et al., 2010[28]
Belgium 94 77 (±7.1) 523 51 4 43 34 0.54 (0.44–0.65) 0.89(0.75–0.97)
Hoglund et al.,2008 [29]
Sweden 22 72 (59–80) – 14 0 8 19 0.64 (0.41–0.83) 1.00 (0.82–1.00)
Ibach et al., 2006[30]
Germany 76 – 530 53 12 23 27 0.70 (0.58–0.80) 0.69 (0.52–0.83)
Ivanoiu & Sindic,2005 [31]
Belgium 75 70.6 (±9.8) – 50 2 25 36 0.68 (0.55–0.77) 0.95 (0.82–0.99)
Kanai et al., 1998[32]
Japan 93 70 (40–92) 256 88 10 5 44 0.95 (0.88–0.98) 0.81 (0.69–0.90)
Kandimalla et al.,2011 [33]
India 44 61.84 (±8.97) 662.65 38 6 4 40 0.90 (0.77–0.97) 0.87 (0.74–0.95)
Kapaki et al.,2001 [34]
Greece 38 68 (±10) 375 33 5 11 36 0.75 (0.60–0.87) 0.88 (0.74–0.96)
Kapaki et al.,2003 [35]
Greece 49 67.6 (±9.3) 490 40 10 9 39 0.82 (0.68–0.91) 0.80 (0.66–0.90)
Kapaki et al.,2007 [36]
Greece 67 66 (±10) 445 48 8 19 64 0.72 (0.59–0.82) 0.89 (0.79–0.95)
Kapaki et al.,2008 [36]
Greece 76 66 (±10) 445 41 10 35 83 0.54 (0.42–0.65) 0.89 (0.81–0.95)
Kester et al., 2010[37]
The Netherlands 47 67.74 (±9) 550 37 6 10 12 0.79 (0.64–0.89) 0.67 (0.41–0. 87)
Koopman et al.,2009 [38]
Belgium 95 76 (71–86) 36 70 19 15 31 0.82 (0.73–0.90) 0.62 (0.47–0.75)
Landau et al.,2010 [39]
EUA 193 78.2 (±7.5) – 159 69 34 160 0.82 (0.76–0.87) 0.70 (0.63–0.76)
Lewcsuk et al.,2004 [40]
Germany 22 68 (62–77) 550 19 6 3 29 0.86 (0.65–0.97) 0.83 (0.66–0.93)
Maddalena et al.,2003 [41]
Switzerland 51 62.3 (±11.2) 490 40 3 11 28 0.78 (0.65–0.89) 0.90 (0.74–0.98)
Morinaga et al.,2010 [42]
Japan 111 71.84 (±7.3) 490 96 7 5 43 0.95 (0.89–0.98) 0.86 (0.73–0.84)
Mulder et al.,2010 [43]
The Netherlands 240 66.7 (±9.2) 550 210 22 38 109 0.85 (0.80–0.89) 0.83 (0.76–0.89)
Noguchi et al.,2005 [44]
Japan 69 70.5 289 58 5 11 38 0.84 (0.73–0.92) 0.88 (0.7 5–0.96)
Olsson et al., 2005[45]
Sweden 78 78 (74–82) 515 71 10 7 43 0.91 (0.82–0.96) 0.81 (0.68–0.91)
Riemenschneideret al., 2002 [46]
Germany 74 68.9 (±9.8) 664 66 2 8 38 0.89 (0.80–0.95) 0.95 (0.83–0.99)

Unc
orre
cted
Aut
hor P
roof
6 M.I. Rosa et al. / Alzheimer’s Disease Diagnosis
Table 2(Continued)
Study/year Country AD Age Cut off TP FP FN TN Sensibility Specificity(pg/ml)
Roher et al., 2009[47]
USA 47 79.1 (±9.91) – 36 16 9 27 0.8 0 (0.65–0.90) 0.63 (0.47–0.77)
Rosler et al., 2001[48]
Austria 27 68.7 (±2.2) – 46 1 1 20 0.98 (0.89–0.1) 0.95 (0.7–0.1)
Schoonenboom etal., 2004 [49]
The Netherlands 47 59 (52–68) – 46 1 1 20 0.98 (0.89–0.1) 0.95 (0.76–0.1)
Schoonenboom etal., 2005 [50]
The Netherlands 39 – 473 35 2 4 28 0.90 (0.76–0.97) 0.93 (0.78–0.1)
Schimidt et al.,2010 [51]
Germany 76 – 600 64 11 12 45 0.84 (0.74–0.92) 0.80 (0.68–0.90)
Shaw et al., 2009[52]
USA 100 75 (±8) 192 97 27 3 87 0.97 (0.91–0.99) 0.76 (0.67–0.84)
Smach et al., 2008[53]
Tunisie 87 73 505 68 7 9 22 0.88 (0.79–0.94) 0.76 (0.56–0.90)
Tapiola et al.,2000 [54]
Finland 80 71 (±8) 340 63 5 17 34 0.79 (0.68–0.87) 0.87 (0.73–0.96)
Thaweepoksomboonet al., 2011 [55]
Thailand 12 67.79 (12.3) 487 12 8 2 8 0.86 (0.57–0.98) 0.50 (0.25–0.75)
Vanderstichele etal., 2006 [56]
Italy 94 67.5 (60.3–67) 594 87 10 7 50 0.93 (0.85–0.97) 0.83 (0.71–0.92)
Welge et al., 2009[57]
Germany 44 69.8 (±8.49) – 38 31 6 56 0.86 (0.73–0.95) 0.64(0.53–0.74)
TOTAL 2932 2473 444 459 1710 0.84 (0.85–0.81) 0.79 (0.77–0.81)
Patient Selection
Index Test
Reference Standard
Flow and Timing
0% 25% 50%
Risk of Bias Applicability concerns
75% 100% 0% 25% 50% 75% 100%QU
AD
AS
-2 D
om
ain
High
Proportion of studies with low, high, or unclearCONCERNS regarding APPLICABILITY
Proportion of studies with low, high, or unclearCONCERNS regarding APPLICABILITY
Unclear Low
Fig. 2. Results of the evaluation of each study according to QUADAS-2.
(±414.4). There was a statistically significant differ-243
ence between the A�1-42 level in the CSF of patients244
with AD compared to that of the controls (p < 0.001).245
The weighted mean difference was −450.06 pg/ml246
(95% CI: −611.06-289.06) (Fig. 5).247
Assessment of publication bias248
Begg’s funnel plot and Egger’s test were performed249
to assess the publication bias in the literature in all com-250
parison models. The shape of the funnel plot showed251
evidence of obvious asymmetry. The Egger’s test was252
used to provide statistical evidence of funnel plot sym-253
metry (p value for bias- 0.003) (Fig. 6).
DISCUSSION 254
The diagnosis of AD is based on adherence 255
to clinical criteria, such as the National Institute 256
of Neurological and Communicative Disorders and 257
Stroke/Alzheimer’s Disease and Related Disorders 258
Association (NINCDS/ADRDA) and Diagnostic and 259
Statistical Manual of Mental Disorders (DSM-IV) [8]. 260
A more recent set of diagnostic criteria proposed incor- 261
porating imaging in AD diagnosis [4]. Biomarkers 262
are being studied to improve the diagnosis of AD. 263
In this systematic review, we examined the literature 264
regarding CSF A�1-42. In the current study, we found 265
that CSF A�1-42 could discriminate AD from controls 266

Unc
orre
cted
Aut
hor P
roof
M.I. Rosa et al. / Alzheimer’s Disease Diagnosis 7
Fig. 3. Forest plots of estimates of the diagnostic odds ratio.
with high diagnostic accuracy, showing a sensitivity of267
84.3% (95% CI: 85.6%–81.0%), a specificity of 79.4%268
(95% CI: 77.6%–81.1%), and an OR of 28.9% (95%269
CI: 21.2%–39.5%).270
Several recent studies have demonstrated that low271
CSF A�1-42 is a good indicator of the presence of272
cortical amyloid [58–62]. The pooled sensitivity and273
specificity for A�1-42 in AD versus controls from 13 274
studies involving 600 patients and 450 controls were 275
86% and 90%, respectively [1]. 276
In 2004, a meta-analysis found that the A�1-42/tau 277
ratio had a sensitivity of 71% and specificity of 83% 278
for AD [63]. Rapid cognitive decline was associated 279
with higher CSF-tau and lower A�1-42 levels [64].

Unc
orre
cted
Aut
hor P
roof
8 M.I. Rosa et al. / Alzheimer’s Disease Diagnosis
Fig. 4. Summary receiver operating characteristic curves.
The major core protein deposited early in senile280
plaques is A�1-42. The CSF of AD patients shows281
decreased levels of A�1-42. There is an approximately282
50% reduction in A�1-42 in AD CSF versus controls283
[65]. The reason for low levels of amyloid protein is284
not clear but it was hypothesized to be the result of285
sequestration of A�1-42 in brain tissue.286
The main neuropathological characteristics of AD287
are the presence of cortical intracellular neurofibril-288
lary tangles and extracellular A� plaques. These cause289
synapse dysfunction, neuronal cell loss, and subse-290
quent brain atrophy [66].291
Fig. 6. Funnel plot of estimated publication bias.
According to the amyloid hypothesis, brain amyloi- 292
dosis, the accumulation of A�1-42 and shorter peptides 293
as well as oligomeric A� assemblies is one of the 294
main causes of neurodegeneration in AD [67]. Each 295
biomarker seems to indicate a specific process in AD. 296
Decreased CSF A�1-42 is an indicator of the brain 297
amyloid burden [68]. 298
AD can be quantified in humans using CSF and PET 299
imaging measurements. A number of recent studies 300
have reported that greater fibrillar A� in cortex, which 301
has been measured previously with amyloid positron 302
emission tomography (PET) imaging using the tracer 303
C-Pittsburgh Compound-B (PiB), is associated with 304
low concentrations of CSF A�1-42 in normal aging 305
and dementia. A recent study describes the temporal 306
relationship between changes in CSF A�1-42 and in 307
PiB-PET signals [69]. The work implies that the lat- 308
Fig. 5. Mean difference between levels of A�1-42 in the cerebrospinal fluid of patients with AD versus controls.

Unc
orre
cted
Aut
hor P
roof
M.I. Rosa et al. / Alzheimer’s Disease Diagnosis 9
ter changes precede the former. However, conflicting309
findings have also been reported [70, 71] indicating310
that further research is needed to understand how often311
and under what circumstances discordance between312
the two A� markers occurs.313
Compared to other AD biomarkers, PET seems to314
have certain advantages. Compared to magnetic res-315
onance imaging-based markers, PET directly assesses316
the supposed primary molecular event in AD pathogen-317
esis; compared to CSF markers, PET is less invasive318
and allows the determination of biomarker expression319
on a regional level within the brain.320
A limitation of this study was the use of various321
cutoffs among studies; in addition, most studies were322
not separated into early or advanced AD. The con-323
version to AD dementia in mild cognitive impairment324
subjects has shown significant variability among differ-325
ent CSF studies. A longitudinal CSF study in normal326
controls found no change in the A�1-42 levels after327
1 year of follow-up [72]. A few longitudinal studies328
have assessed which CSF biomarker or combination329
of biomarkers improves the prediction of AD dementia330
or cognitive decline.331
In conclusion, our study showed that A�1-42 can332
discriminate AD from controls with a sensitivity of333
84.3% and specificity of 79.4%.334
Two important questions remain: can CSF biomark-335
ers also be used to monitor biological effects of336
treatment and can they predict future AD deterioration337
rate?338
In the future, the integration of more than one imag-339
ing or biomarker modality will increase the accuracy340
of risk prediction and therefore increase the power of341
clinical trials to detect disease modifying or preven-342
tive treatment effects. At the same time, these markers343
will serve to define different stages of the transition344
from healthy aging to AD dementia so that individual345
counseling becomes possible [73].346
ACKNOWLEDGMENTS347
Financial support was provided by the University of348
Extremo Sul Catarinense.349
Authors’ disclosures available online (http://www.350
j-alz.com/disclosures/view.php?id=2045).351
REFERENCES352
[1] Blennow K, de Leon MJ, Zetterberg H (2006) Alzheimer’s353
disease. Lancet 368, 387-403.354
[2] Masters CL, Cappai R, Barnham KJ, Villemagne VL (2006)355
Molecular mechanisms for Alzheimer’s disease: Implications356
for neuroimaging and therapeutics. J Neurochem 97, 1700- 357
1725. 358
[3] Smith MA (1998) Alzheimer disease. Int Rev Neurobiol 42, 359
1-54. 360
[4] Dubois B, Feldman HH, Jacova C, Dekosky ST, Barberger- 361
Gateau P, Cummings J, Delacourte A, Galasko D, Gauthier S, 362
Jicha G, Meguro K, O’brien J, Pasquier F, Robert P, Rossor M, 363
Salloway S, Stern Y, Visser PJ, Scheltens P (2007) Research 364
criteria for the diagnosis of Alzheimer’s disease: Revising the 365
NINCDS-ADRDA criteria. Lancet Neurol 6, 734-746. 366
[5] Iwatsubo T, Odaka A, Suzuki N, Mizusawa H, Nukina H, 367
Ihara Y (1994) Visualization of A�42(43) and A�40 in senile 368
plaques with end-specific A� monoclonals: Evidence that an 369
initially deposited species is A�42(43). Neuron 13, 45-53. 370
[6] Shaw LM, Vanderstichele H, Knapik-Czajka M, Clark CM, 371
Aisen PS, Petersen RC, Blennow K, Soares H, Simon A, 372
Lewczuk P, Dean R, Siemers E, Potter W, Lee VM, Tro- 373
janowski JQ (2009) Cerebrospinal fluid biomarker signature 374
in Alzheimer’s disease neuroimaging initiative subjects. Ann 375
Neurol 65, 403-413. 376
[7] Leow AD, Yanovsky I, Parikshak N, Hua X, Lee S, Toga AW, 377
Jack CR Jr, Bernstein MA, Britson PJ, Gunter JL, Ward CP, 378
Borowski B, Shaw LM, Trojanowski JQ, Fleisher AS, Harvy 379
D, Kornak J, Schuff N, Alexander GE, Weiner MW, Thomp- 380
son PM (2009) Alzheimer’s Disease Neuroimaging Initiative: 381
A one-year follow up study using tensor-based morphome- 382
try correlating degenerative rates, biomarkers and cognition. 383
Neuroimage 45, 645-655. 384
[8] McKhann G, Drachman DA, Folstein M, Katzman R, Price 385
DL, Stadlan EM (1984) Clinical diagnosis of Alzheimer’s 386
disease—report of the NINCDS–ADRDA work group under 387
the auspices of Department of Health and Human Services 388
Task Force on Alzheimer’s disease. Neurology 34, 939-944. 389
[9] Whiting PF, Rutjes AW, Westwood ME, Mallett S, Deeks JJ, 390
Reitsma JB, Leeflang MM, Sterne JA, Bossuyt PM (2011) 391
QUADAS-2: A revised tool for the quality assessment of 392
diagnostic accuracy studies. Ann Intern Med 155, 529-536. 393
[10] Altman DG (1999) Some common problems in medical 394
research. In: Practical Statistics for Medical Research, 9th 395
ed. Altman DG, ed. Chapman, London, pp. 396-439. 396
[11] Irwig L, Tosteson AN, Gatsonis C, Lau J, Colditz G, Chalmers 397
TC, Mosteller F (1994) Guidelines for meta-analyses evalu- 398
ating diagnostic tests. Ann Intern Med 120, 667-676. 399
[12] Reitsma JB, Glas AS, Rutjes AWS, Scholten R, Bossuy PM, 400
Zwinderman AH (2005) Bivariate analysis of sensitivity and 401
specificity produce informative summary measures in diag- 402
nostic reviews. J Clin Epidemiol 58, 982-990. 403
[13] Gatsonis C, Paliwal P (2006) Meta-analysis of diagnostic and 404
screening test accuracy evaluations: Methodologic primer. 405
AJR Am J Roentgenol 187, 271-281. 406
[14] Deeks JJ, Macaskill P, Irwig L (2005) The performance of 407
tests of publication bias and other sample size effects in sys- 408
tematic reviews of diagnostic test accuracy was assessed. J 409
Clin Epidemiol 58, 882e93. 410
[15] Review Manager (RevMan) [Computer program] (2012) Ver- 411
sion 5.2. Copenhagen: The Nordic Cochrane Centre, The 412
Cochrane Collaboration. 413
[16] Zamora J AV, Muriel A, Khan KS, Coomarasamy A (2006) 414
Meta-DiSc: A software for meta-analysis of test accuracy 415
data. BMC Med Res Method 6, 31. 416
[17] Reitsma JB, Rujes AW, Whiting P, Vlassov VV, Leeflang 417
MM, Deeks JJ (2009) Chapter 9: Assessing method- 418
ological quality. In Cochrane Handobook for Systematic 419
Review of Diagnostic Test Accuracy, Version 1.0.0. Deek 420
JJ, Bossuyt PM, Gatsonis C, eds. The Cochrane Col- 421

Unc
orre
cted
Aut
hor P
roof
10 M.I. Rosa et al. / Alzheimer’s Disease Diagnosis
laboration, http://srdta.cochrane.org/handbook-dta-reviews,422
Accessed 19 July 2013.423
[18] Andreasen N, Hesse C, Davidsson P, Minthon L, Wallin A,424
Winblad B, Vanderstichele H, Vanmechelen E, Blennow K425
(1999) Cerebrospinal fluid beta-amyloid (1-42) in Alzheimer426
disease: Differences between early- and late-onset Alzheimer427
disease and stability during the course of disease. Arch Neurol428
56, 673-680.429
[19] Andreasen N, Minthon L, Davidsson P, Vanmechelen E,430
Vanderstichele H, Winblad B, Blennow K (2001) Evalua-431
tion of CSF-tau and CSF-Abeta42 as diagnostic markers for432
Alzheimer disease in clinical practice. Arch Neurol 58, 373-433
379.434
[20] Andreasen N, Vanmechelen E, Vanderstichele H, Davidsson435
P, Blennow K (2003) Cerebrospinal fluid levels of total-436
tau, phospho-tau and A beta 42 predicts development of437
Alzheimer’s disease in patients with mild cognitive impair-438
ment. Acta Neurol Scand Suppl 179, 47-51.439
[21] Bibl M, Mollenhauer B, Esselmann H, Lewczuk P,440
Trenkwalder C, Brechlin P, Ruther E, Kornhuber J, Otto M,441
Wiltfang J (2006) CSF diagnosis of Alzheimer’s disease and442
dementia with Lewy bodies. J Neural Transm 113, 1771-1778.443
[22] Bibl M, Mollenhauer B, Lewczuk P, Esselmann H, Wolf S,444
Trenkwalder C, Otto M, Stiens G, Ruther E, Kornhuber J,445
Wiltfang J (2007) Validation of amyloid-beta peptides in CSF446
diagnosis of neurodegenerative dementias. Mol Psychiatry 12,447
671-680.448
[23] de Jong D, Jansen RW, Kremer BP, Verbeek MM (2006)449
Cerebrospinal fluid amyloid beta42/phosphorylated tau ratio450
discriminates between Alzheimer’s disease and vascular451
dementia. J Gerontol A Biol Sci Med Sci 61, 755-758.452
[24] De Meyer G, Shapiro F, Vanderstichele H, Vanmechelen453
E, Engelborghs S, De Deyn PP, Coart E, Hansson O,454
Minthon L, Zetterberg H, Blennow K, Shaw L, Trojanowski455
JQ (2010) Alzheimer’s Disease Neuroimaging Initiative.456
Diagnosis-independent Alzheimer disease biomarker signa-457
ture in cognitively normal elderly people. Arch Neurol 67,458
949-956.459
[25] Galasko D, Chang L, Motter R, Clark CM, Kaye J, Knop-460
man D, Thomas R, Kholodenko D, Schenk D, Lieberburg I,461
Miller B, Green R, Basherad R, Kertiles L, Boss MA, Seu-462
bert P (1998) High cerebrospinal fluid tau and low amyloid463
beta42 levels in the clinical diagnosis of Alzheimer disease464
and relation to apolipoprotein E genotype. Arch Neurol 55,465
937-945.466
[26] Ganzer S, Arlt S, Schoder V, Buhmann C, Mandelkow467
EM, Finckh U, Beisiegel U, Naber D, Muller-Thomsen T468
(2003) CSF-tau, CSF-Abeta1-42, ApoE-genotype and clin-469
ical parameters in the diagnosis of Alzheimer’s disease:470
Combination of CSF-tau and MMSE yields highest sensitivity471
and specificity. J Neural Transm 110, 1149-1160.472
[27] Gao CM, Yam AY, Wang X, Magdangal E, Salisbury C, Peretz473
D, Zuckermann RN, Connolly MD, Hansson O, Minthon L,474
Zetterberg H, Blennow K, Fedynyshyn JP, Allauzen S (2010)475
A�40 oligomers identified as a potential biomarker for the476
diagnosis of Alzheimer’s disease. PLoS One 5, e15725.477
[28] Hertze J, Minthon L, Zetterberg H, Vanmechelen E, Blennow478
K, Hansson O (2010) Evaluation of CSF biomarkers as pre-479
dictors of Alzheimer’s disease: A clinical follow-up study of480
4.7 years. J Alzheimers Dis 21, 1119-1128.481
[29] Hoglund K, Hansson O, Buchhave P, Zetterberg H, Lewczuk482
P, Londos E, Blennow K, Minthon L, Wiltfang J (2008) Pre-483
diction of Alzheimer’s disease using a cerebrospinal fluid484
pattern of C-terminally truncated beta-amyloid peptides. Neu-485
rodegener Dis 5, 268-276.486
[30] Ibach B, Binder H, Dragon M, Poljansky S, Haen E, Schmitz 487
E, Koch H, Putzhammer A, Kluenemann H, Wieland W, 488
Hajak G (2006) Cerebrospinal fluid tau and beta-amyloid 489
in Alzheimer patients, disease controls and an age-matched 490
random sample. Neurobiol Aging 27, 1202-1211. 491
[31] Ivanoiu A, Sindic CJ (2005) Cerebrospinal fluid tau protein 492
and amyloid beta42 in mild cognitive impairment: Prediction 493
of progression to Alzheimer’s disease and correlation with the 494
neuropsychological examination. Neurocase 11, 32-39. 495
[32] Kanai M, Matsubara E, Isoe K, Urakami K, Nakashima K, 496
Arai H, Sasaki H, Abe K, Iwatsubo T, Kosaka T, Watanabe 497
M, Tomidokoro Y, Shizuka M, Mizushima K, Nakamura T, 498
Igeta Y, Ikeda Y, Amari M, Kawarabayashi T, Ishiguro K, 499
Harigaya Y, Wakabayashi K, Okamoto K, Hirai S, Shoji M 500
(1998) Longitudinal study of cerebrospinal fluid levels of tau, 501
A beta1-40, and A beta1-42(43) in Alzheimer’s disease: A 502
study in Japan. Ann Neurol 44, 17-26. 503
[33] Kandimalla RJ, Prabhakar S, Binukumar BK, Wani WY, 504
Gupta N, Sharma DR, Sunkaria A, Grover VK, Bhardwaj N, 505
Jain K, Gill KD (2011) Apo-E�4 allele in conjunction with 506
A�42 and tau in CSF: Biomarker for Alzheimer’s disease. 507
Curr Alzheimer Res 8, 187-196. 508
[34] Kapaki E, Paraskevas GP, Zalonis I, Zournas C (2003) CSF 509
tau protein and beta-amyloid (1-42) in Alzheimer’s disease 510
diagnosis: Discrimination from normal ageing and other 511
dementias in the Greek population. Eur J Neurol 10, 119-128. 512
[35] Kapaki EN, Paraskevas GP, Tzerakis NG, Sfagos C, Seretis A, 513
Kararizou E, Vassilopoulos D (2007) Cerebrospinal fluid tau, 514
phospho-tau181 and beta-amyloid1-42 in idiopathic normal 515
pressure hydrocephalus: A discrimination from Alzheimer’s 516
disease. Eur J Neurol 14, 168-173. 517
[36] Kapaki E, Paraskevas GP, Papageorgiou SG, Bonakis A, 518
Kalfakis N, Zalonis I, Vassilopoulos D (2008) Diagnostic 519
value of CSF biomarker profile in frontotemporal lobar degen- 520
eration. Alzheimer Dis Assoc Disord 22, 47-53. 521
[37] Kester MI, Boelaarts L, Bouwman FH, Vogels RL, Groot ER, 522
van Elk EJ, Blankenstein MA (2010) Diagnostic impact of 523
CSF biomarkers in a local hospital memory clinic. Dement 524
Geriatr Cogn Disord 29, 491-497. 525
[38] Koopman K, Le Bastard N, Martin JJ, Nagels G, De Deyn PP, 526
Engelborghs S (2009) Improved discrimination of autopsy- 527
confirmed Alzheimer’s disease (AD) from non-AD dementias 528
using CSF P-tau (181P). Neurochem Int 55, 214-218. 529
[39] Landau SM, Harvey D, Madison CM, Reiman EM, Foster NL, 530
Aisen PS, Petersen RC, Shaw LM, Trojanowski JQ, Jack CR 531
Jr (2010) Alzheimer’s Disease Neuroimaging Initiative. Com- 532
paring predictors of conversion and decline in mild cognitive 533
impairment. Neurology 20, 230-238. 534
[40] Lewczuk P, Esselmann H, Otto M, Maler JM, Henkel AW, 535
Henkel MK, Eikenberg O, Antz C, Krause WR, Reulbach 536
U, Kornhuber J, Wiltfang J (2004) Neurochemical diagnosis 537
of Alzheimer’s dementia by CSF Abeta42, Abeta42/Abeta40 538
ratio and total tau. Neurobiol Aging 25, 273-281. 539
[41] Maddalena A, Papassotiropoulos A, Muller-Tillmanns B, 540
Jung HH, Hegi T, Nitsch RM, Hock C (2003) Biochem- 541
ical diagnosis of Alzheimer disease by measuring the 542
cerebrospinal fluid ratio of phosphorylated tau protein to beta- 543
amyloid peptide 42. Arch Neurol 60, 1202-1206. 544
[42] Morinaga A, Ono K, Ikeda T, Ikeda Y, Shima K, Noguchi- 545
Shinohara M, Samuraki M, Yanase D, Yoshita M, Iwasa 546
K, Mastunari I, Yamada M (2010) A comparison of the 547
diagnostic sensitivity of MRI, CBF-SPECT, FDG-PET and 548
cerebrospinal fluid biomarkers for detecting Alzheimer’s dis- 549
ease in a memory clinic. Dement Geriatr Cogn Disord 30, 550
285-292. 551

Unc
orre
cted
Aut
hor P
roof
M.I. Rosa et al. / Alzheimer’s Disease Diagnosis 11
[43] Mulder C, Verwey NA, van der Flier WM, Bouwman FH, Kok552
A, van Elk EJ, Scheltens P, Blankenstein MA (2010) Amyloid-553
beta (1-42), total tau, and phosphorylated tau as cerebrospinal554
fluid biomarkers for the diagnosis of Alzheimer disease. Clin555
Chem 56, 248-253.556
[44] Noguchi M, Yoshita M, Matsumoto Y, Ono K, Iwasa K,557
Yamada M (2005) Decreased beta-amyloid peptide42 in cere-558
brospinal fluid of patients with progressive supranuclear palsy559
and corticobasal degeneration. J Neurol Sci 15, 61-65.560
[45] Olsson A, Vanderstichele H, Andreasen N, De Meyer G,561
Wallin A, Holmberg B, Rosengren L, Vanmechelen E,562
Blennow K (2005) Simultaneous measurement of beta-563
amyloid (1-42), total tau, and phosphorylated tau (Thr181)564
in cerebrospinal fluid by the xMAP technology. Clin Chem565
51, 336-345.566
[46] Riemenschneider M, Wagenpfeil S, Diehl J, Lautenschlager567
N, Theml T, Heldmann B, Drzezga A, Jahn T, Forstl H, Kurz568
A (2002) Tau and Abeta42 protein in CSF of patients with569
frontotemporal degeneration. Neurology 58, 1622-1628.570
[47] Roher AE, Maarouf CL, Sue LI, Hu Y, Wilson J, Beach571
TG (2009) Proteomics-derived cerebrospinal fluid markers572
of autopsy-confirmed Alzheimer’s disease. Biomarkers 14,573
493-501.574
[48] Rosler N, Wichart I, Jellinger KA (2001) Clinical significance575
of neurobiochemical profiles in the lumbar cerebrospinal fluid576
of Alzheimer’s disease patients. J Neural Transm 108, 231-577
246.578
[49] Schoonenboom NS, Pijnenburg YA, Mulder C, Rosso SM,579
Van Elk EJ, Van Kamp GJ, Van Swieten JC, Scheltens P580
(2004) Amyloid beta(1-42) and phosphorylated tau in CSF581
as markers for early-onset Alzheimer disease. Neurology 11,582
1580-1584.583
[50] Schoonenboom NS, Mulder C, Vanderstichele H, Pijnenburg584
YA, Van Kamp GJ, Scheltens P, Mehta PD, Blankenstein MA585
(2005) Differences and similarities between two frequently586
used assays for amyloid beta 42 in cerebrospinal fluid. Clin587
Chem 51, 1057-1060.588
[51] Schmidt D, Zimmermann R, Lewczuk P, Schaller G, Degir-589
menci U, Kreil S, Wiltfang J, Kuwert T, Kornhuber J, Weih590
M (2010) Confirmation rate of blinded (99m)Tc-SPECT591
compared to neurochemical dementia biomarkers in CSF in592
patients with Alzheimer disease. J Neural Transm 117, 1111-593
1114.594
[52] Shaw LM, Vanderstichele H, Knapik-Czajka M, Clark CM,595
Aisen PS, Petersen RC, Blennow K, Soares H, Simon596
A, Lewczuk P, Dean R, Siemers E, Potter W, Lee VM,597
Trojanowski JQ (2009) Alzheimer’s Disease Neuroimag-598
ing Initiative. Cerebrospinal fluid biomarker signature in599
Alzheimer’s disease neuroimaging initiative subjects. Ann600
Neurol 65, 403-413.601
[53] Smach MA, Charfeddine B, Lammouchi T, Dridi H, Ben602
Othman L, Bennamou S, Limem K (2008) Interest of CSF603
beta-amyloid1-42 and t-tau protein level determinations for604
the diagnosis of Alzheimer’s disease. Ann Biol Clin (Paris)605
66, 531-535.606
[54] Tapiola T, Pirttila T, Mehta PD, Alafuzofff I, Lehtovirta M,607
Soininen H (2000) Relationship between apoE genotype and608
CSF beta-amyloid (1-42) and tau in patients with proba-609
ble and definite Alzheimer’s disease. Neurobiol Aging 21,610
735-740.611
[55] Thaweepoksomboon J, Senanarong V, Poungvarin N,612
Chakorn T, Siwasariyanon N, Washirutmangkur L, Udom-613
punthuruk S (2011) Assessment of cerebrospinal fluid (CSF)614
beta-amyloid (1-42), phosphorylated tau (ptau-181) and total615
Tau protein in patients with Alzheimer’s disease (AD) and616
other dementia at Siriraj Hospital, Thailand. J Med Assoc 617
Thai 94, (Suppl 1), S77-S83. 618
[56] Vanderstichele H, De Vreese K, Blennow K, Andreasen N, 619
Sindic C, IvanoiuA, Hampel H, Burger K, Parnetti L, Lanari 620
A, Padovani A, DiLuca M, Blaser M, Olsson AO, Pottel H, 621
Hulstaert F, Vanmechelen E (2006) Analytical performance 622
and clinical utility of the INNOTEST PHOSPHO-TAU181P 623
assay for discrimination between Alzheimer’s disease and 624
dementia with Lewy bodies. Clin Chem Lab Med 44, 1472- 625
1480. 626
[57] Welge V, Fiege O, Lewczuk P, Mollenhauer B, Esselmann H, 627
Klafki HW, Wolf S, Trenkwalder C, Otto M, Kornhuber J, 628
Wiltfang J, Bibl M (2009) Combined CSF tau, p-tau181 and 629
amyloid-beta 38/40/42 for diagnosing Alzheimer’s disease. J 630
Neural Transm 116, 203-212. 631
[58] Fagan AM, Mintun MA, Shah AR, Aldea P, Roe CM, Mach 632
RH, Marcus D, Morris JC, Holtzman DM (2009) Cere- 633
brospinal fluid tau and ptau (181) increase with cortical 634
amyloid deposition in cognitively normal individuals: Impli- 635
cations for future clinical trials of Alzheimer’s disease. EMBO 636
Mol Med 1, 371-380. 637
[59] Tolboom N, van der Flier WM, Yaqub M, Boellaard R, Ver- 638
wey NA, Blankenstein MA, Windhorst AD, Scheltens P, 639
Lammertsma AA, van Berckel BN (2009) Relationship of 640
cerebrospinal fluid markers to 11CPiB and 18F-FDDNP bind- 641
ing. J Nucl Med 50, 1464-1461. 642
[60] Grimmer T, Riemenschneider M, Forstl H, Henriksen G, 643
Klunk WE, Mathis CA, Shiga T, Wester HJ, Kurz A, Drzezga 644
A (2009) Beta amyloid in Alzheimer’s disease: Increased 645
deposition in brain is reflected in reduced concentration in 646
cerebrospinal fluid. Biol Psychiatry 65, 927-934. 647
[61] Jagust WJ, Landau SM, Shaw LM, Trojanowski JQ, Koeppe 648
RA, Reiman EM, Foster NL, Petersen RC, Weiner MW, Price 649
JC, Mathis CA (2009) Relationships between biomarkers in 650
aging and dementia. Neurology 73, 1193-1199. 651
[62] Tapiola T, Alafuzoff I, Herukka SK, Parkkinen L, Hartikainen 652
P, Soininen H, Pirttila T (2009) Cerebrospinal fluid �-amyloid 653
42 and tau proteins as biomarkers of Alzheimer-type patho- 654
logic changes in the brain. Arch Neurol 66, 382-389. 655
[63] Hampel H, Mitchell A, Blennow K, Frank RA, Brettschnei- 656
der S, Weller L, Moller HJ (2004) Core biological marker 657
candidates of Alzheimer’s disease–perspectives for diagnosis, 658
prediction of outcome and reflection of biological activity. J 659
Neural Transm 111, 247-272. 660
[64] Wallin AK, Blennow K, Zetterberg H (2010) CSF biomark- 661
ers predict a more malignant outcome in Alzheimer disease. 662
Neurology 74, 1531-1537. 663
[65] Braak H, Braak E (1991) Neuropathological stage- 664
ing of Alzheimer-related changes. Acta Neuropathol 82, 665
239-259. 666
[66] Ballard C, Gauthier S, Corbett A, Brayne C, Aarsland D, Jones 667
E (2011) Alzheimer’s disease. Lancet 377, 1019-1031. 668
[67] Hardy (2002) the amyloid hypothesis of Alzheimer’s disease: 669
Progress and problems on the road to therapeutics. Science 670
297, 353-356. 671
[68] Riverol M, Lopez OL (2011) Biomarkers in Alzheimer’s dis- 672
ease. Front Neurol 2, 46. 673
[69] Landau SM, Lu M, Joshi AD, Pontecorvo M, Mintun MA, 674
Trojanowski JQ, Shaw LM, Jagust WJ (2013) Alzheimer’s 675
Disease Neuroimaging Initiative. Comparing PET imag- 676
ing and CSF measurements of A�. Ann Neurol, doi: 677
10.1002/ana.23908. 678
[70] Koivunen J, Pirttila T, Kemppainen N, Aalto S, Herukka SK, 679
Jauhianen AM, Hanninen T, Hallikainen M, Nagren K, Rinne 680
JO, Soininen H (2008) PET amyloid ligand [11C] PIB uptake 681

Unc
orre
cted
Aut
hor P
roof
12 M.I. Rosa et al. / Alzheimer’s Disease Diagnosis
and cerebrospinal fluid beta-amyloid in mild cognitive impair-682
ment. Dement Geriatr Cogn Disord 26, 378-383.683
[71] Tolboom N, van der Flier WM, Yaqub M, Boellaard R,684
Verwey NA, Blankenstein MA, Windhorst AD, Scheltens685
P, Lammertsma AA, van Berckel BN (2009) Relationship686
of cerebrospinal fluid markers to 11C-PiB and 18F-FDDNP687
binding. J Nucl Med 50, 1464.
[72] Vemuri (2010) Serial MRI and CSF biomarkers in normal 688
aging, MCI, and AD. Neurology 75, 143-151. 689
[73] Teipel SJ, Sabri O, Grothe M, Barthel H, Prvulovic D, 690
Buerger K, Bokde AL, Ewers M, Hoffmann W, Hampel H 691
(2013) Perspectives for multimodal neurochemical and imag- 692
ing biomarkers in Alzheimer’s disease. J Alzheimers Dis 33, 693
S329-S347. 694
Related Documents