Accuracy assessment of MODIS, NOAA and IRS data in snow cover mapping under Himalayan conditions SANJAY K. JAIN*{, AJANTA GOSWAMI{ and A. K. SARAF{ {Remote Sensing Division, National Institute of Hydrology, Roorkee 247667 India {Department of Earth Sciences, Indian Institute of Technology, Roorkee, India (Received 13 September 2006; in final form 23 October 2007 ) Snow cover information is an essential parameter for a wide variety of scientific studies and management applications, especially in snowmelt runoff modelling. Until now NOAA and IRS data were widely and effectively used for snow- covered area (SCA) estimation in several Himalayan basins. The suit of snow cover products produced from MODIS data had not previously been used in SCA estimation and snowmelt runoff modelling in any Himalayan basin. The present study was conducted with the aim of assessing the accuracy of MODIS, NOAA and IRS data in snow cover mapping under Himalayan conditions. The total SCA was estimated using these three datasets for 15 dates spread over 4 years. The results were compared with ground-based estimation of snow cover. A good agreement was observed between satellite-based estimation and ground- based estimation. The influence of aspect in SCA estimation was analysed for the three satellite datasets and it was observed that MODIS produced better results. Snow mapping accuracy with respect to elevation was tested and it was observed that at higher elevation MODIS sensed more snow and proved better at mapping snow under mountain shadow conditions. At lower elevation, IRS proved better in mapping patchy snow cover due to higher spatial resolution. The temporal resolution of MODIS and NOAA data is better than IRS data, which means that the chances of getting cloud-free scenes is higher. In addition, MODIS has an automated snow-mapping algorithm, which reduces the time and errors incorporated during processing satellite data manually. Considering all these factors, it was concluded that MODIS data could be effectively used for SCA estimation under Himalayan conditions, which is a vital parameter for snowmelt runoff estimation. 1. Introduction Snow is of great importance as a key environmental parameter. It not only influences the Earth’s radiation balance but also plays a significant role in river discharge. A major source of runoff and ground water recharge in middle and higher latitudes are from snow melt from seasonal snow-covered areas of the Earth’s mountain region. The central Asian mountains contain about 50% of the total glaciated area in the world and a large portion of this area drains into the landmass of the Indian sub-continent. The Himalayan mountain system is the source of one of the world’s largest supplies of freshwater. All the major south Asian rivers originate in the Himalayas and their upper catchments are covered with snow and glaciers. *Corresponding author. Email: [email protected] International Journal of Remote Sensing Vol. 29, No. 20, 20 October 2008, 5863–5878 International Journal of Remote Sensing ISSN 0143-1161 print/ISSN 1366-5901 online # 2008 Taylor & Francis http://www.tandf.co.uk/journals DOI: 10.1080/01431160801908129 Downloaded By: [Indian Institute of Technology] At: 14:18 24 November 2008

Welcome message from author
This document is posted to help you gain knowledge. Please leave a comment to let me know what you think about it! Share it to your friends and learn new things together.
Transcript
Accuracy assessment of MODIS, NOAA and IRS data in snow covermapping under Himalayan conditions
SANJAY K. JAIN*{, AJANTA GOSWAMI{ and A. K. SARAF{{Remote Sensing Division, National Institute of Hydrology, Roorkee 247667 India
{Department of Earth Sciences, Indian Institute of Technology, Roorkee, India
(Received 13 September 2006; in final form 23 October 2007 )
Snow cover information is an essential parameter for a wide variety of scientific
studies and management applications, especially in snowmelt runoff modelling.
Until now NOAA and IRS data were widely and effectively used for snow-
covered area (SCA) estimation in several Himalayan basins. The suit of snow
cover products produced from MODIS data had not previously been used in
SCA estimation and snowmelt runoff modelling in any Himalayan basin. The
present study was conducted with the aim of assessing the accuracy of MODIS,
NOAA and IRS data in snow cover mapping under Himalayan conditions. The
total SCA was estimated using these three datasets for 15 dates spread over 4
years. The results were compared with ground-based estimation of snow cover. A
good agreement was observed between satellite-based estimation and ground-
based estimation. The influence of aspect in SCA estimation was analysed for the
three satellite datasets and it was observed that MODIS produced better results.
Snow mapping accuracy with respect to elevation was tested and it was observed
that at higher elevation MODIS sensed more snow and proved better at mapping
snow under mountain shadow conditions. At lower elevation, IRS proved better
in mapping patchy snow cover due to higher spatial resolution. The temporal
resolution of MODIS and NOAA data is better than IRS data, which means that
the chances of getting cloud-free scenes is higher. In addition, MODIS has an
automated snow-mapping algorithm, which reduces the time and errors
incorporated during processing satellite data manually. Considering all these
factors, it was concluded that MODIS data could be effectively used for SCA
estimation under Himalayan conditions, which is a vital parameter for snowmelt
runoff estimation.
1. Introduction
Snow is of great importance as a key environmental parameter. It not only
influences the Earth’s radiation balance but also plays a significant role in river
discharge. A major source of runoff and ground water recharge in middle and higher
latitudes are from snow melt from seasonal snow-covered areas of the Earth’s
mountain region. The central Asian mountains contain about 50% of the total
glaciated area in the world and a large portion of this area drains into the landmass
of the Indian sub-continent. The Himalayan mountain system is the source of one of
the world’s largest supplies of freshwater. All the major south Asian rivers originate
in the Himalayas and their upper catchments are covered with snow and glaciers.
*Corresponding author. Email: [email protected]
International Journal of Remote Sensing
Vol. 29, No. 20, 20 October 2008, 5863–5878
International Journal of Remote SensingISSN 0143-1161 print/ISSN 1366-5901 online # 2008 Taylor & Francis
http://www.tandf.co.uk/journalsDOI: 10.1080/01431160801908129
Downloaded By: [Indian Institute of Technology] At: 14:18 24 November 2008
The Indus, Ganga and Brahmaputra river systems, originating from the Himalayan
region, receive substantial amounts of meltwater and are considered as the lifeline of
the Indian sub-continent. The perennial nature of Himalayan rivers and the
appropriate topographic setting of the region provide a substantial exploitable
hydropower potential in this area (Singh and Jain 2002). Hence, near real-time
estimation of snow cover is of utmost importance for effective management of water
resource and can serve as a guideline for reservoir operation. In addition, the
planning of new hydroelectric projects on the Himalayan rivers emphasizes the need
for reliable estimation of snow and glacier runoff.
Snow-covered area (SCA) is a vital input to many of the hydrological models. An
accurate estimation of SCA in near real time is an essential parameter for Snow
Runoff Models (Ramamoorthi 1987). Conventional methods of SCA estimation,
such as snow surveys, provide detailed information on snow pack properties, but
under Himalayan conditions such surveys are not feasible. The Himalayan region is
topographically highly rugged and climatically very harsh because of which a poor
snow gauge network exists in the high altitude region of the Himalayas, particularly
where heavy snowfall is experienced. Therefore, ground-based estimation of SCA
over the whole basin becomes very difficult under such conditions.
Snow cover mapping in mountainous areas is demanding due to the interfering
topography and the heterogeneous ground properties. According to Rango (1996),
the only efficient way to monitor the dynamically changing seasonal snow cover on
a sufficiently large scale is by satellite remote sensing. But, one must judiciously
select the proper sensor to use for a particular analysis taking into consideration
factors such as wavelengths, resolution or frequency and timing of ground coverage
(Hall and Martinec 1985). A high temporal resolution is important; particularly for
monitoring changes in snow extent due to melt or accumulation. Although snow
cover can be detected and monitored with a variety of remote sensing devices, the
greatest application has been found in the visible (VIS) and the near-infrared (NIR)
region of the electromagnetic spectrum (Hall et al. 2002). For operational snow
cover monitoring, satellite sensors with moderate spatial resolution but with high
repetition rate are important for the advantage of obtaining a cloud-free image.
Although the cloud problem is removed with the use of microwave data (either
passive or active), interpretation of the images is much more difficult with respect to
optical remote sensing data because they are highly affected by surface and
subsurface properties.
Snow was observed in the first image obtained from the Television and Infrared
Observation Satellite (TIROS-1) following its April 1960 launch (Singer and
Popham 1963). In the mid-1960s, snow was successfully mapped from space on a
weekly basis following the launch of the Environmental Science Service
Administration (ESSA-3) satellite, which carried the Advanced Vidicon Camera
System (AVCS) that operated in the spectral range of 0.5–0.75 mm with a spatial
resolution at nadir of 3.7 km. The National Oceanographic and Atmospheric
Administration (NOAA) has measured snow cover on weekly basis in the Northern
Hemisphere since 1966 using a variety of sensors, including the Scanning
Radiometer (SR), Very High Resolution Radiometer (VHRR) and the Advanced
Very High Resolution Radiometer (AVHRR) (Matson et al. 1986). Now there are
many sensors providing images with great spectral, spatial and temporal resolution,
which can be used, based on the need of the study. With the availability of large
number of satellite sensor data, it is now left up to the choice and requirement of the
5864 S. K. Jain et al.
Downloaded By: [Indian Institute of Technology] At: 14:18 24 November 2008
user community which data is used. The revolutionary role of remote sensing in
snow study is discussed in detail by Rango (1996), Singh and Jain (2003) and Hall
et al. (1995). Nevertheless, field measurements are still required to validate the
satellite sensor data (Saraf et al. 1999).
Satellite images have been extensively used for snow study in Himalayan
conditions by several researchers. Saraf et al. (1999) has used passive microwave
(scanning multichannel microwave radiometer (SMMR)) data for snow-depth and
snow-extent estimation in a part of Satluj basin in the Himalayan Mountains.
Rango (1996) has analysed and reported that NOAA-AVHRR and Aqua/Terra-
Moderate Resolution Imaging Spectroradiometer (MODIS) data are useful for
snow study with basin area above 200 km2. Dey and Goswami (1983) used NOAA-
VHRR data to predict seasonal snowmelt runoff in the Indus basin. Gupta et al.
(2005) have used Indian Remote Sensing (IRS) satellite LISS (Linear Imaging Self
Scanning) III multispectral data to map dry/wet snow cover in Himalaya. In
addition, many studies have been conducted on snow cover study in Himalaya using
satellite sensor data (Gupta et al. 1982, Agarwal et al. 1983, Dey et al. 1988,
Upadhyay et al. 1991, Thapa 1993, Jain 2001).
With the availability of satellite data in a wide range of spectral, spatial and
temporal resolution, the choice is left up to the requirement of the user community.
Many of the data are made freely available to the user community through World
Wide Web, and some can be procured through other agencies against a nominal
charge. The NASA’s Earth Observing System (EOS) Data and Information System
(EOSDIS) and Satellite Active Archive site (NESDIS 2006) are among the few of the
communities which are involved in processing, archiving, and distributing different
satellite data, thereby promoting the inter-disciplinary study and understanding of
the integrated Earth system. The present study was undertaken to estimate SCA
using IRS WiFS images, NOAA-AVHRR images and MODIS SCA data product
for the upper reaches of Satluj river basin. The aim of the present study was to
analyse the snow cover mapping potential of these three datasets under different
conditions, accuracy achieved in snow cover mapping and selection of the most
suitable datasets for SCA estimation for the present study area. Optical remote
sensing data were used in this study due to its easy interpretability. The data have
the added advantage of easy availability, and it is also relatively easy to distinguish
snow from snow-free areas. Besides, the visible satellite sensor data is available in a
wide range of spatial and temporal resolutions. The SCA was estimated from these
three datasets for selected cloud-free dates for the years 2000–2004. The temperature
lapse rate method was used to estimate SCA from air temperature data. The SCA
estimated from both remote sensing and field-based methods were compared. The
findings were considered as an aid to select datasets for the Satluj river basin in snow
melt runoff estimation.
2. The study area
The study area consists of the Satluj River Basin up to the Bhakra dam located in
the Himalayan mountain range (figure 1). The Satluj, also known as Sutlej, is the
longest of the five rivers of Punjab state that flows through Northern India. The
river rises in the lakes of Mansarovar and Rakastal in the Tibetan Plateau at an
elevation of about 4572 m and is one of the main tributaries of the Indus River. It
receives the Beas River in the state of Punjab, India and continues into Pakistan to
join the Chenab river to form the Panjnad river which further joins the Indus river at
Accuracy assessment of MODIS, NOAA and IRS data 5865
Downloaded By: [Indian Institute of Technology] At: 14:18 24 November 2008
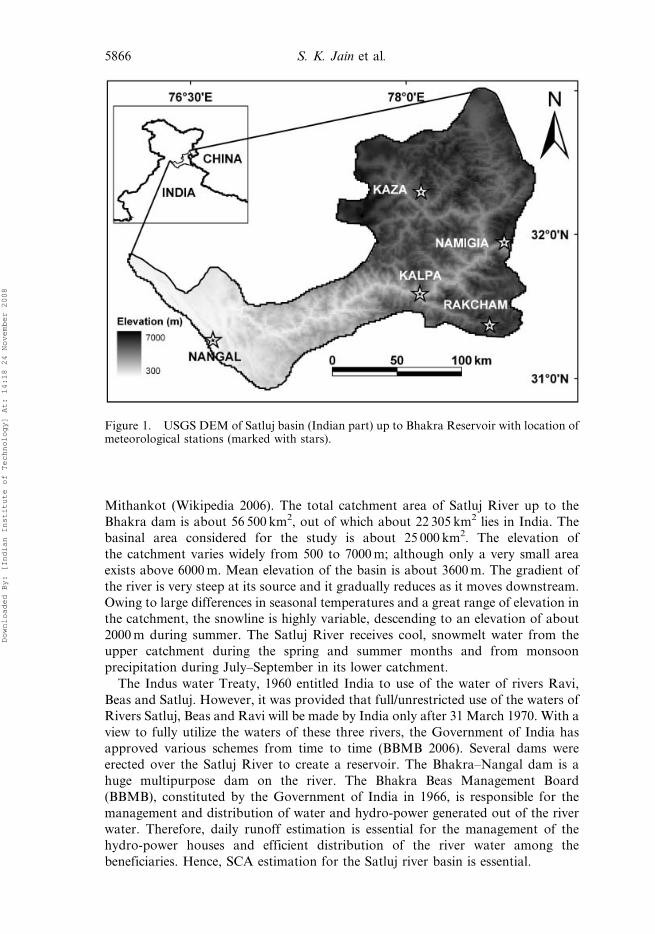
Mithankot (Wikipedia 2006). The total catchment area of Satluj River up to the
Bhakra dam is about 56 500 km2, out of which about 22 305 km2 lies in India. The
basinal area considered for the study is about 25 000 km2. The elevation of
the catchment varies widely from 500 to 7000 m; although only a very small area
exists above 6000 m. Mean elevation of the basin is about 3600 m. The gradient of
the river is very steep at its source and it gradually reduces as it moves downstream.
Owing to large differences in seasonal temperatures and a great range of elevation in
the catchment, the snowline is highly variable, descending to an elevation of about
2000 m during summer. The Satluj River receives cool, snowmelt water from the
upper catchment during the spring and summer months and from monsoon
precipitation during July–September in its lower catchment.
The Indus water Treaty, 1960 entitled India to use of the water of rivers Ravi,
Beas and Satluj. However, it was provided that full/unrestricted use of the waters of
Rivers Satluj, Beas and Ravi will be made by India only after 31 March 1970. With a
view to fully utilize the waters of these three rivers, the Government of India has
approved various schemes from time to time (BBMB 2006). Several dams were
erected over the Satluj River to create a reservoir. The Bhakra–Nangal dam is a
huge multipurpose dam on the river. The Bhakra Beas Management Board
(BBMB), constituted by the Government of India in 1966, is responsible for the
management and distribution of water and hydro-power generated out of the river
water. Therefore, daily runoff estimation is essential for the management of the
hydro-power houses and efficient distribution of the river water among the
beneficiaries. Hence, SCA estimation for the Satluj river basin is essential.
Figure 1. USGS DEM of Satluj basin (Indian part) up to Bhakra Reservoir with location ofmeteorological stations (marked with stars).
5866 S. K. Jain et al.
Downloaded By: [Indian Institute of Technology] At: 14:18 24 November 2008
3. Data used
In this study, data from three different satellites have been used and the details of
datasets used in the study are as follows.
3.1 IRS 1C/1D WiFS data
A total of 15 IRS 1C/1D Wide Field Sensor (WiFS, path/row 29/45) cloud-free data
were procured from the National Remote Sensing Agency (NRSA), Hyderabad, India
for the years 2000–2004. The sensor acquired the images around 11am. The WiFS
instrument is a spaceborne optical sensor that was designed for observation of
vegetation and land surfaces. The specifications of the WiFS sensor are given in table 1.
With a swath of 814 km, WiFS provides temporal resolution of five days at 188 mspatial resolution. Twenty-two scenes cover the entire of India. Unlike scanner sensors
(e.g. AVHRR), the WiFS instrument uses a linear array sensor and thus produces high
quality imagery at regional/national scale for vegetation mapping.
3.2 NOAA-AVHRR Images
The cloud-free NOAA-16 and -17 images used in this study were acquired at around
11am Indian Standard Time (IST). The NOAA images were acquired for the datesand years corresponding to the available IRS 1C/1D WiFS data. The NOAA series
of Sun-synchronous satellites circle the Earth in a near-polar orbit. The specification
of the NOAA-16/17 data used in the study is summarized in table 2. The raw
AVHRR High Resolution Picture Transmission (HRPT) data used in the present
study have been acquired by the Indian Institute of Technology-Roorkee Satellite
Earth Station (SES), which was established on 24 October 2002 and has been
operational ever since (Saraf and Choudhury 2006). This NOAA-HRPT satellite
Earth station receives about 12 images per day and covers an area with a radius ofaround 3000 km. The NOAA images of the study area, before October 2002 were
acquired from Satellite Active Archive site (NESDIS 2006).
3.3 MODIS daily snow cover maps (MOD10A1)
MODIS is an environmental satellite operating in visible, near- and short-wave
infrared and thermal portions of the electromagnetic spectrum and acquires imagesin 36 spectral bands. It has spatial resolution of 250, 500 and 1000 m depending on
the spectral band and has a swath width of 2330 km, enabling the entire surface of
the Earth to be viewed every 2 days. MODIS images have the potential to provide
quantitative measures of numerous geophysical parameters, including snow cover
(Justice et al. 1998).
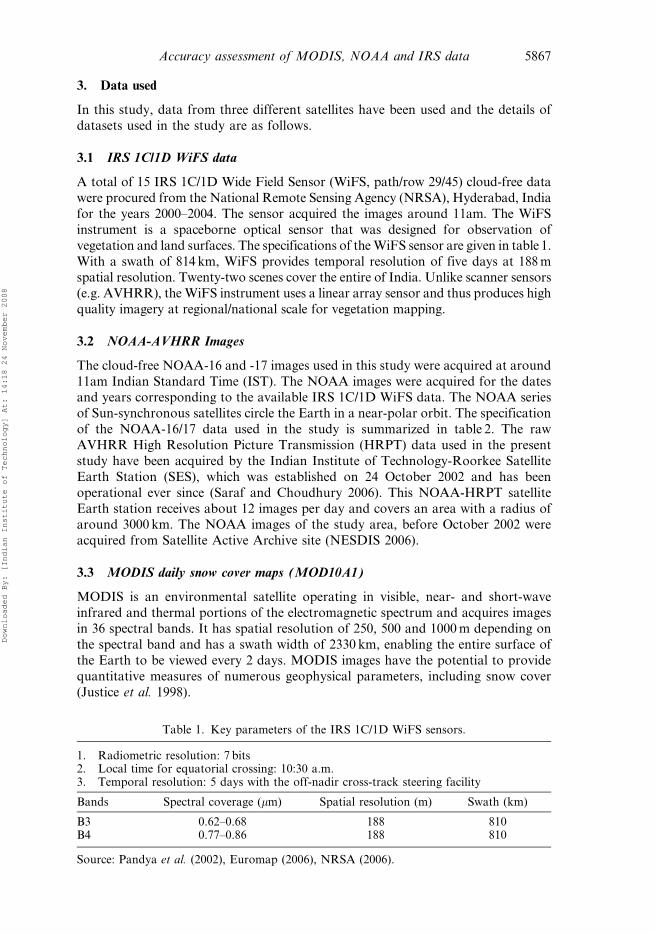
Table 1. Key parameters of the IRS 1C/1D WiFS sensors.
1. Radiometric resolution: 7 bits2. Local time for equatorial crossing: 10:30 a.m.3. Temporal resolution: 5 days with the off-nadir cross-track steering facility
Bands Spectral coverage (mm) Spatial resolution (m) Swath (km)
B3 0.62–0.68 188 810B4 0.77–0.86 188 810
Source: Pandya et al. (2002), Euromap (2006), NRSA (2006).
Accuracy assessment of MODIS, NOAA and IRS data 5867
Downloaded By: [Indian Institute of Technology] At: 14:18 24 November 2008
The MODIS snow-mapping algorithm utilizes the seven MODIS bands designed
especially to image the land surface. MOD10A1 consists of 1200 km by 1200 km tiles
of 500 m resolution data gridded in a sinusoidal map projection. MODIS/Terra
V004 data extend from 24 February 2000 to the present. The product uses MODIS
snow-mapping algorithm, which is based on a long lineage of snow detection
algorithms and was developed using Landsat Thematic Mapper (TM) data (Hall
et al. 1995, Klein et al. 1998, Hall et al. 2002, Klein and Barnett 2003). The MODIS
snow-mapping algorithm is a fully automated and computationally frugal approach
to snow detection. It is based on a series of tests for snow detection including
Normalized Difference Snow Index (NDSI) and other criteria tests. Currently, a
suite of snow cover products is being produced from MODIS data and is distributed
by the Distributed Active Archive Center (DAAC) located at the National Snow
and Ice Data Center (NSIDC). The inputs for MODIS snow-mapping algorithm
are: calibrated radiances (MOD02HKM), the MODIS cloud mask (MOD35) and
the solar and satellite viewing geometries, as well as other ancillary information
from the MOD03 geolocation product. The resulting snow product is the MODIS/
Terra Snow Cover 5-Min L2 Swath 500 m (MOD10_L2) product. It is so named
because it represents snow cover acquired in approximately 5 min of MODIS scans.
It has a nominal spatial resolution of 500 m and a swath width of 1354 km across
track and 2030 km along track length. MOD10A1 data product is the spatial
composite of individual snow observations from all daily MOD10_L2 products
covering a particular area (Klein et al. 1998). A set of five MODIS snow cover
products is currently being distributed to the user community through the NSIDC
DAAC. This suite of snow products represents a progression of products ranging
from snow cover maps produced from individual MODIS swaths (scenes) to spatial
and temporal composites covering 8-day periods at spatial resolutions of
0.05u60.05u. The MODIS Snow Products Users’ Guide contains detailed
information pertaining to the structure of and information contained in all
MODIS snow products (Riggs et al. 2003). The summary of MOD10A1 data is
listed in table 3 (adopted from Riggs et al. 2003).
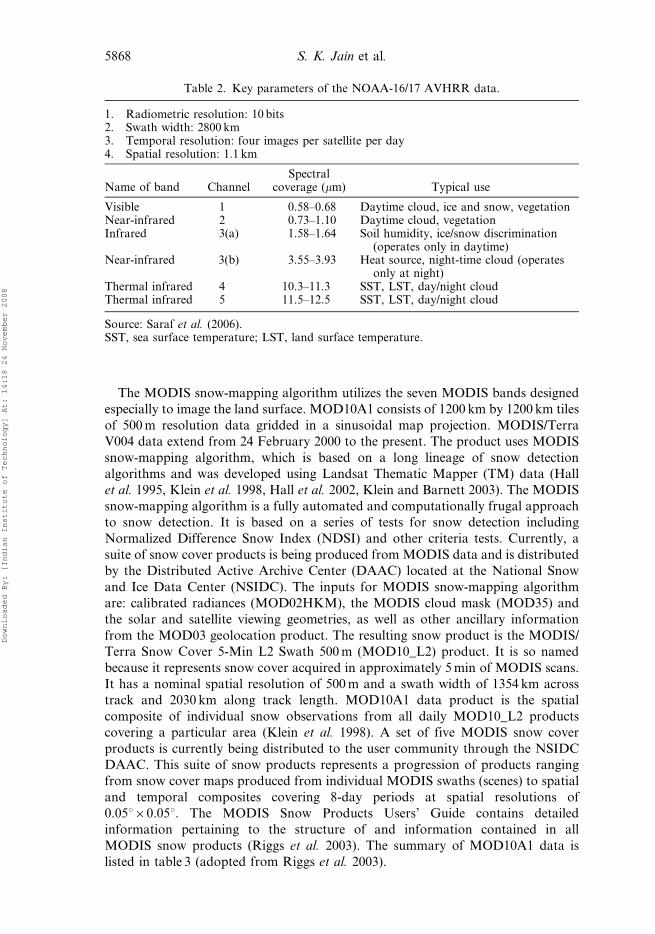
Table 2. Key parameters of the NOAA-16/17 AVHRR data.
1. Radiometric resolution: 10 bits2. Swath width: 2800 km3. Temporal resolution: four images per satellite per day4. Spatial resolution: 1.1 km
Name of band ChannelSpectral
coverage (mm) Typical use
Visible 1 0.58–0.68 Daytime cloud, ice and snow, vegetationNear-infrared 2 0.73–1.10 Daytime cloud, vegetationInfrared 3(a) 1.58–1.64 Soil humidity, ice/snow discrimination
(operates only in daytime)Near-infrared 3(b) 3.55–3.93 Heat source, night-time cloud (operates
only at night)Thermal infrared 4 10.3–11.3 SST, LST, day/night cloudThermal infrared 5 11.5–12.5 SST, LST, day/night cloud
Source: Saraf et al. (2006).SST, sea surface temperature; LST, land surface temperature.
5868 S. K. Jain et al.
Downloaded By: [Indian Institute of Technology] At: 14:18 24 November 2008
The automated snow-mapping algorithm uses at-satellite reflectance in MODIS
band 4 and band 6 to calculate the Normalized Difference Snow Index (NDSI) (Hall
et al. 1995):
NDSI~B4{B6
B4zB6ð1Þ
where B4 stands for reflectance in 0.545–0.565 mm and B6 for reflectance in 1.628–
1.652 mm.
A pixel in a non-densely forested region will be mapped as snow if the NDSI is
>0.4 and reflectance in MODIS band 2 (0.841–0.876 mm) is .11%. However, if the
MODIS band 4 reflectance is 10%, then the pixel will not be mapped as snow even if
the other criteria are met. This prevents pixels containing very dark targets from
being mapped as snow. This is required because very low reflectance causes the
denominator in the NDSI to be quite small, and only a small increase in the visible
wavelengths are required to make the NDSI value high enough to classify a pixel
erroneously as snow (Hall et al. 2002).
3.4 SRTM 90 m digital elevation data
On 19 February 2000, the space shuttle carried onboard, for the first time, a space-
borne, single-pass interferometer. The mission was referred to as the Shuttle Radar
Topographic Mission (SRTM). SRTM successfully mapped the topographic
features of the Earth’s landmasses using radar interferometry (Leblanc et al.
2006). A radar interferogram is produced by measuring the radar phase difference
between two spatially separated antennas, A1 and A2 (Zebker et al. 1994). Two
antennas can be mounted on a single platform or can use repeat passes over the
same site with a single antenna. A more detailed description of the methodology for
extracting interferograms from radar phase measurements is given by Zebker et al.
(1994). The SRTM mission employed two antennae that were separated by a
baseline of 60 m. The prime antenna transmitted and received a radar signal, while
the second only received a signal. Two antennae operating in C- and X-bands
simultaneously illuminated and recorded radar signals over the entire landmass
between 60uN and 57u S (Blumbarg 2006). The C- band radar with a wavelength of
5.6 cm has an electronically steerable antenna and is therefore able to operate in
ScanSAR mode with a 225 km swath. However, the X-band radar system operated
at 3 cm wavelength with its passive primary antenna is historically limited to a 45 km
wide swath. The near global coverage DEM was produced from the C-band data
and processed by NASA’s Jet Propulsion Laboratory (JPL) and the X-band data
provided slightly higher resolution and were processed by the German space
agency’s aerospace centre (DLR). This method requires no ground control, and
hence is very useful for inaccessible regions. The overall absolute horizontal and
vertical accuracy of these 1 arcsecond data is estimated to be significantly better
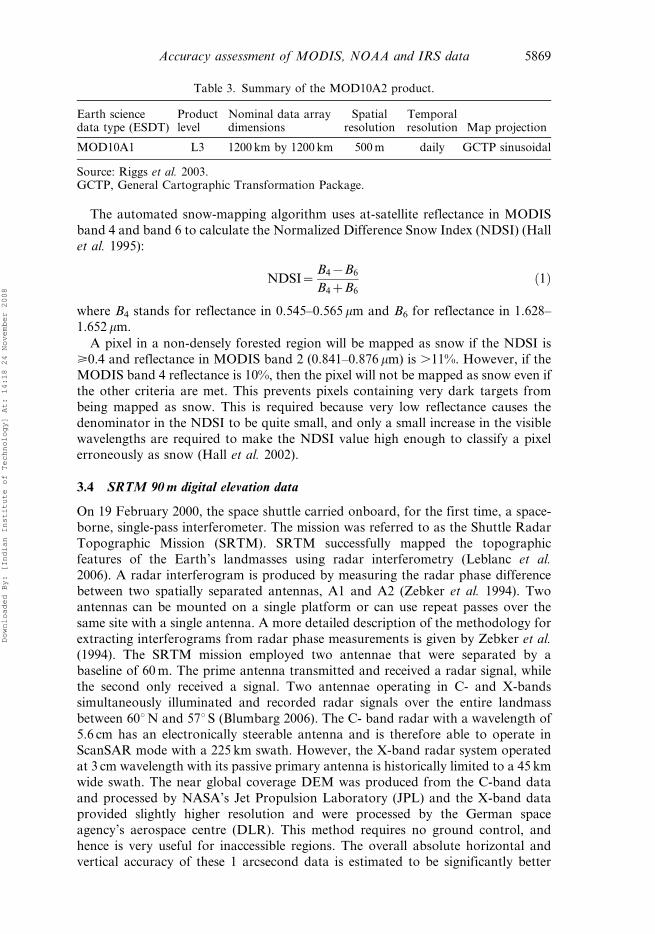
Table 3. Summary of the MOD10A2 product.
Earth sciencedata type (ESDT)
Productlevel
Nominal data arraydimensions
Spatialresolution
Temporalresolution Map projection
MOD10A1 L3 1200 km by 1200 km 500 m daily GCTP sinusoidal
Source: Riggs et al. 2003.GCTP, General Cartographic Transformation Package.
Accuracy assessment of MODIS, NOAA and IRS data 5869
Downloaded By: [Indian Institute of Technology] At: 14:18 24 November 2008
than the original mission requirements of 20 and 16 m, respectively (Rosen et al.
2001, Sun et al. 2003). The spatial resolution of the SRTM DEM is 3 arcseconds
(approximately 90 m). A 1 arcsecond data product was also produced, but is not
available for all countries. Vertical reference of the SRTM DEMs is the WGS84
EGM96 geoid. These data are currently distributed free of charge by the US
Geological Survey (USGS) and is available for download from the National Map
Seamless Data Distribution System, or the USGS ftp site. The DEM files have been
mosaiced into a seamless global coverage, and are available for download as 5u65utiles, in geographic coordinate system – WGS84 datum. These files are available for
download in both Arc-Info ASCII format, and as GeoTiff, for easy use in most GIS
and remote sensing software applications.
3.5 Air temperature data
Air temperature data utilized in this study were collected by Bhakra Beas
Management Board (BBMB) from five ground stations, namely, Kaza, Raksham,
Namigia, Kalpa and Nangal, located within the Satluj river basin (figure 1). The daily
average air temperature data for the years 2000–2004 were utilized in the study.
4. Methodology
Snow maps derived from satellite sensor data are a pixel-based representation of a
snow-covered area. With spatial resolution of a few hundred metres up to 1 km, a
pixel, either classified as ‘snow’ or ‘no-snow’, often consists of snow-covered and
snow-free parts. In theory, the snow line defines the line separating snow-covered
from snow-free areas. However, because of the patchiness of the edge of the snow
cover, no distinct line can be drawn. Instead, a more or less narrow belt has to be
defined as the snow line, which represents a zone of approximately 50% snow
coverage (Seidel and Martinec 2004).
Snow cover mapping is a process that involves distinguishing snow pixels from
non-snow pixels. For snow cover mapping, three kinds of methods, such as training
sites supervised classification (SC), reflectance statistics and Normalized Difference
Snow Index (NDSI) and unsupervised classification have generally been used to
map snow cover distribution and then calculate SCA. As stated above, the satellite
remote sensing datasets from IRS-WiFS, MODIS and NOAA were utilized for
mapping snow cover. Before using all these three datasets for snow cover area
mapping, they were brought to a common projection system.
Using the Indian tile of the global SRTM-DEM, the DEM of the study area was
extracted. It was in geographic coordinate system and WGS 84 datum plane. All
the 15 IRS 1C/1D WiFS images, corresponding NOAA-AVHRR images and the
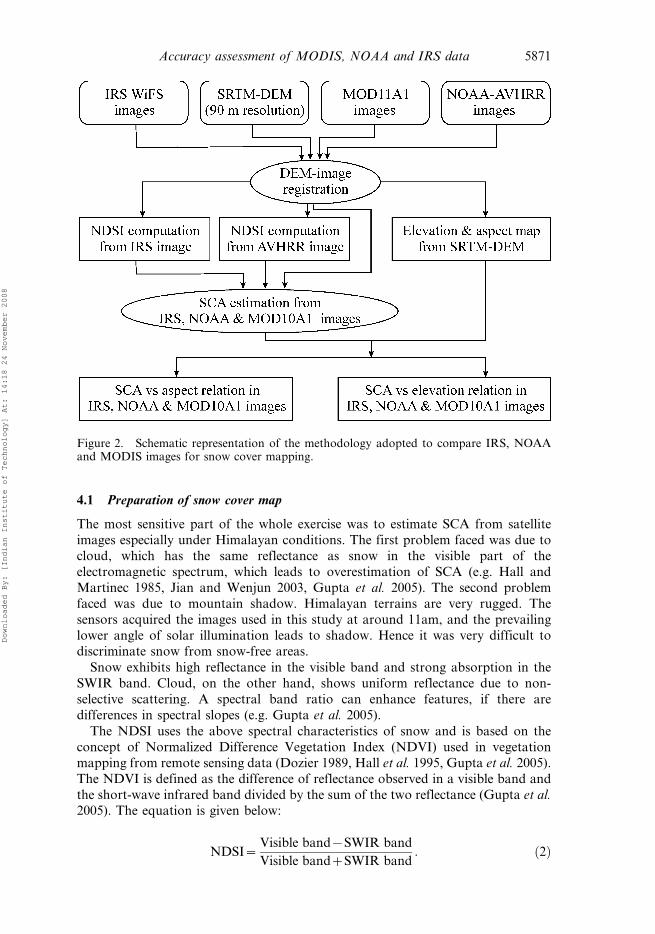
MOD10A1 data products were georeferenced (figure 2) by taking the DEM as the
master image and the rest of the images as slave images. More than 30 ground
control points were selected for each image in such a way that they were well spread
through out the study area to achieve higher accuracy in georeferencing. The
second-order transformation and nearest-neighbour re-sampling technique was
adopted. The root mean square error was within a pixel size.
One set of SRTM DEM was resampled to 188 m pixel size to match it with the
spatial resolution of the IRS WiFS data. Another set of SRTM DEM was resampled to
500 m pixel size to match with the MODIS data. The NOAA-AVHRR images were
also resampled to 500 m pixel size for better comparison with MODIS data products.
5870 S. K. Jain et al.
Downloaded By: [Indian Institute of Technology] At: 14:18 24 November 2008
4.1 Preparation of snow cover map
The most sensitive part of the whole exercise was to estimate SCA from satellite
images especially under Himalayan conditions. The first problem faced was due to
cloud, which has the same reflectance as snow in the visible part of the
electromagnetic spectrum, which leads to overestimation of SCA (e.g. Hall and
Martinec 1985, Jian and Wenjun 2003, Gupta et al. 2005). The second problem
faced was due to mountain shadow. Himalayan terrains are very rugged. The
sensors acquired the images used in this study at around 11am, and the prevailing
lower angle of solar illumination leads to shadow. Hence it was very difficult todiscriminate snow from snow-free areas.
Snow exhibits high reflectance in the visible band and strong absorption in the
SWIR band. Cloud, on the other hand, shows uniform reflectance due to non-
selective scattering. A spectral band ratio can enhance features, if there are
differences in spectral slopes (e.g. Gupta et al. 2005).
The NDSI uses the above spectral characteristics of snow and is based on the
concept of Normalized Difference Vegetation Index (NDVI) used in vegetation
mapping from remote sensing data (Dozier 1989, Hall et al. 1995, Gupta et al. 2005).
The NDVI is defined as the difference of reflectance observed in a visible band and
the short-wave infrared band divided by the sum of the two reflectance (Gupta et al.
2005). The equation is given below:
NDSI~Visible band{SWIR band
Visible bandzSWIR band: ð2Þ
Figure 2. Schematic representation of the methodology adopted to compare IRS, NOAAand MODIS images for snow cover mapping.
Accuracy assessment of MODIS, NOAA and IRS data 5871
Downloaded By: [Indian Institute of Technology] At: 14:18 24 November 2008
NDSI maps were prepared from NOAA-AVHRR images. The NDSI map wasfurther classified into two classes: (a) snow and (b) snow-free areas based on a
threshold value of 0.4 (Dozier 1989). This type of classification provided an
advantage of SCA estimation under mountain shadow condition and discrimination
between snow and cloud. For IRS WiFS data, unsupervised classification using the
Iterative Self-Organizing Data Analysis Techniques (ISODATA) has been applied
in ERDAS Imagine. The ISODATA uses the minimum spectral distance to assign a
cluster for each candidate pixel. The classified output has been categorized into two
classes, i.e. snow and non-snow.The MODIS snow cover product is a classified image. The images were further
classified by combining snow and lake ice into the snow category and the rest of the
classes into the non-snow category. Thus, all the images, namely, MODIS, NOAA
and WiFS images were classified into snow and non-snow categories.
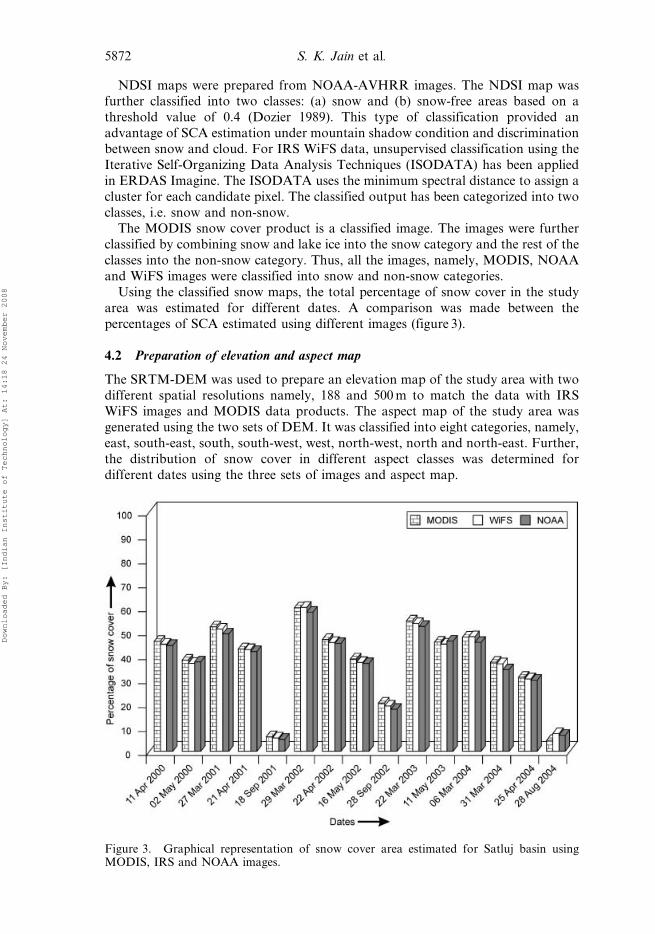
Using the classified snow maps, the total percentage of snow cover in the study
area was estimated for different dates. A comparison was made between the
percentages of SCA estimated using different images (figure 3).
4.2 Preparation of elevation and aspect map
The SRTM-DEM was used to prepare an elevation map of the study area with two
different spatial resolutions namely, 188 and 500 m to match the data with IRSWiFS images and MODIS data products. The aspect map of the study area was
generated using the two sets of DEM. It was classified into eight categories, namely,
east, south-east, south, south-west, west, north-west, north and north-east. Further,
the distribution of snow cover in different aspect classes was determined for
different dates using the three sets of images and aspect map.
Figure 3. Graphical representation of snow cover area estimated for Satluj basin usingMODIS, IRS and NOAA images.
5872 S. K. Jain et al.
Downloaded By: [Indian Institute of Technology] At: 14:18 24 November 2008
5. SCA estimation using ground data
The accuracy of satellite-based estimation of SCA was compared with ground data.
Since field data of SCA was not available for the present study, an indirect approach
was used to estimate snow cover using temperature lapse rate method. Air
temperature data was collected from BBMB for five ground stations as mentioned in
previous paragraphs. Using the maximum and minimum air temperature data
average air temperature was calculated. To make the data smooth, air temperature
data of two pre- and post-date were added with the data of that same date for which
satellite images were available and an average air temperature was calculated. Using
this air temperature data and temperature lapse rate method, the altitude
corresponding to 0uC was computed. The area above this altitude was considered
to be covered with snow (Gupta et al. 2005). The temperature lapse rate value of
0.65uC/100 m (Singh and Jain 2002) was used for estimating SCA. The SCA was
estimated for all the dates for which satellite images were available. The result shows
(table 4) that ground-based estimation of SCA are in very close agreement with the
satellite-based estimation.
6. Results and discussion
It was observed that the total SCA estimated using three different sets of data were
in good agreement. Overall, MODIS mapped slightly higher snow than WiFS
images and NOAA-AVHRR images mapped slightly less compared to the other two
(figure 3). The standard deviation of the three results was calculated and it was
observed that the minimum standard deviation is 0.57 for 21 April 2001 and
maximum standard deviation is 1.51 for 27 March 2001. This indicates that the three
datasets are mutually in good agreement and have nearly equal ability to map total
SCA.
To better examine the datasets, distribution of snow with respect to different
aspect classes were examined. It was observed that in all the images, snow cover is
Table 4. Comparison of SCA estimated from NOAA, MODIS, IRS data and fieldtemperature lapse rate method.
Dates MODIS (%) WiFS (%) NOAA (%)Temperature lapserate method (%)
Standarddeviation
11 April 2000 45.91 44.70 44.21 45.60 0.792 May 2000 38.12 36.76 37.36 37.70 0.5827 March 2001 51.96 51.03 49.01 51.70 1.3321 April 2001 42.78 42.47 41.68 42.31 0.4618 September
20016.09 5.58 5.02 5.56 0.44
29 March 2002 59.89 60.10 58.08 59.60 0.9122 April 2002 46.67 45.41 45.02 46.40 0.7916 May 2002 38.59 37.10 36.68 38.20 0.9028 September
200220.15 18.91 17.56 19.80 1.15
22 March 2003 54.42 53.33 52.12 54.20 1.0411 May 2003 45.56 44.77 45.98 45.44 0.506 March 2004 47.66 47.83 45.46 47.40 1.1031 March 2004 37.23 36.55 34.12 37.10 1.4525 April 2004 30.96 30.25 29.68 31.10 0.6628 August 2004 4.56 7.43 6.68 5.70 1.24
Accuracy assessment of MODIS, NOAA and IRS data 5873
Downloaded By: [Indian Institute of Technology] At: 14:18 24 November 2008
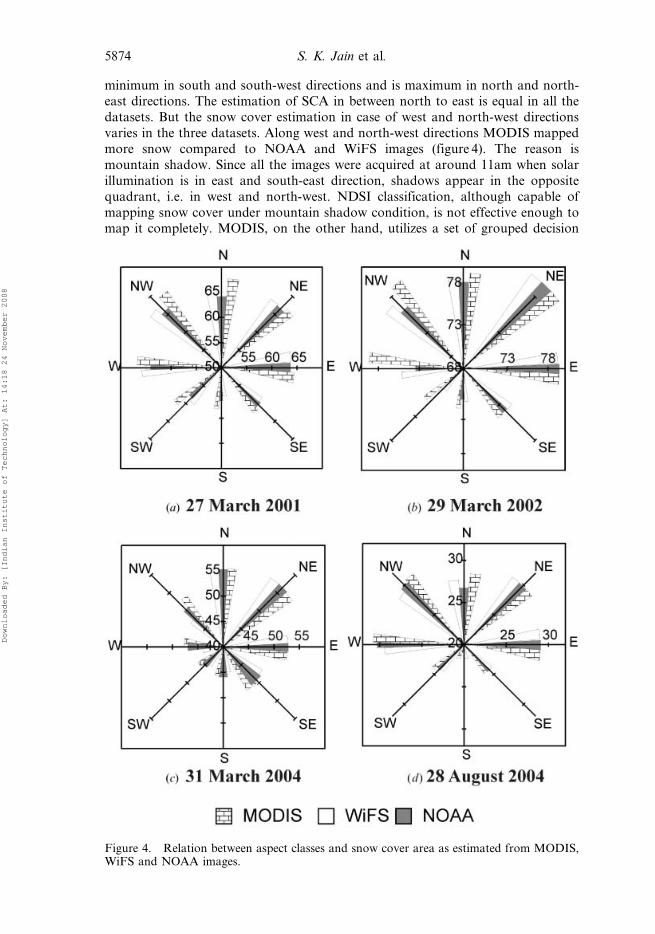
minimum in south and south-west directions and is maximum in north and north-east directions. The estimation of SCA in between north to east is equal in all the
datasets. But the snow cover estimation in case of west and north-west directions
varies in the three datasets. Along west and north-west directions MODIS mapped
more snow compared to NOAA and WiFS images (figure 4). The reason is
mountain shadow. Since all the images were acquired at around 11am when solar
illumination is in east and south-east direction, shadows appear in the opposite
quadrant, i.e. in west and north-west. NDSI classification, although capable of
mapping snow cover under mountain shadow condition, is not effective enough tomap it completely. MODIS, on the other hand, utilizes a set of grouped decision
Figure 4. Relation between aspect classes and snow cover area as estimated from MODIS,WiFS and NOAA images.
5874 S. K. Jain et al.
Downloaded By: [Indian Institute of Technology] At: 14:18 24 November 2008
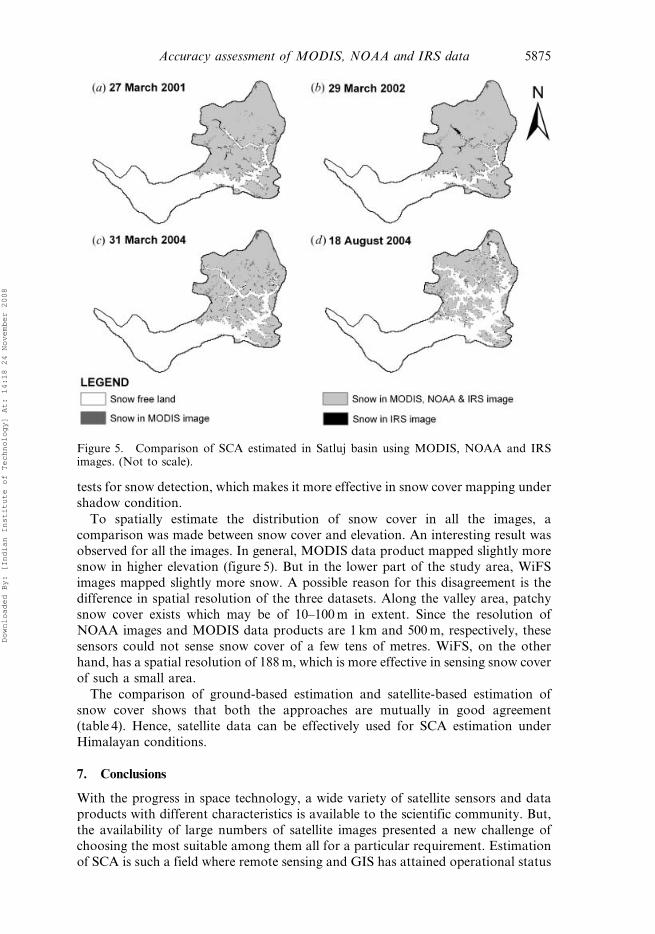
tests for snow detection, which makes it more effective in snow cover mapping under
shadow condition.
To spatially estimate the distribution of snow cover in all the images, a
comparison was made between snow cover and elevation. An interesting result was
observed for all the images. In general, MODIS data product mapped slightly moresnow in higher elevation (figure 5). But in the lower part of the study area, WiFS
images mapped slightly more snow. A possible reason for this disagreement is the
difference in spatial resolution of the three datasets. Along the valley area, patchy
snow cover exists which may be of 10–100 m in extent. Since the resolution of
NOAA images and MODIS data products are 1 km and 500 m, respectively, these
sensors could not sense snow cover of a few tens of metres. WiFS, on the other
hand, has a spatial resolution of 188 m, which is more effective in sensing snow cover
of such a small area.
The comparison of ground-based estimation and satellite-based estimation of
snow cover shows that both the approaches are mutually in good agreement
(table 4). Hence, satellite data can be effectively used for SCA estimation under
Himalayan conditions.
7. Conclusions
With the progress in space technology, a wide variety of satellite sensors and data
products with different characteristics is available to the scientific community. But,
the availability of large numbers of satellite images presented a new challenge ofchoosing the most suitable among them all for a particular requirement. Estimation
of SCA is such a field where remote sensing and GIS has attained operational status
Figure 5. Comparison of SCA estimated in Satluj basin using MODIS, NOAA and IRSimages. (Not to scale).
Accuracy assessment of MODIS, NOAA and IRS data 5875
Downloaded By: [Indian Institute of Technology] At: 14:18 24 November 2008
in many parts of the world. The present study was conducted for Satluj basin to
compare and select the suitable image among MODIS, IRS WiFS and NOAA for
snow cover mapping. All the three images estimated almost equal amounts of snow
in between the north-east to west direction of slope. But in the west, north-west and
north direction, MODIS is more effective at estimating snow cover.
When elevation was considered as a criterion, MODIS proved more effective in
estimating snow cover in higher elevation. But in lower elevation where snow cover
is patchy and thin, IRS images gave better results because of its better spatial
resolution.
Due to high temporal resolution, the chance of getting cloud-free images is more
likely in the cases of MODIS and NOAA images compared to IRS. Considering all
these criteria it was observed that MODIS images are more suitable for use in snow
cover mapping.
NOAA and IRS data have previously been used successfully for SCA estimation
under Himalayan conditions, which was used for snowmelt runoff estimation.
Previous to this study, there was no record of using MODIS snow cover product for
SCA estimation. The present study clearly shows that MODIS snow cover product
can provide better results under certain conditions. Hence it can be effectively used
for SCA estimation and snowmelt runoff generation under Himalayan conditions.
Acknowledgements
Ajanta Goswami was supported by the Council of Scientific and Industrial
Research, India under the CSIR-JRF Fellowship Grant No 9/143 (495)/04-EMR-I.
The authors are thankful to Bhakra Beas Management Board (BBMB), Nangal,
India for providing the air temperature data used in this study. Thanks are due to
Santosh Panda, research scholar, IIT Roorkee for providing timely help and
information related to this work.
ReferencesAGARWAL, K.C., KUMAR, V. and DAS, T., 1983, Snowmelt runoff for a catchment of Beas
basin. In Proceedings of the First National Symposium on Seasonal Snowcover, 28–30
April 1983, Snow & Avalanche Study Establishment (SASE), Manali, Vol II, pp.
43–63.
BBMB, 2006, Formation of BBMB. Available online at: http://bhakra.nic.in/english/
menu1.asp (accessed on 18 August 2006).
BLUMBERG, D.G., 2006, Analysis of large aeolian (wind-blown) bedforms using the Shuttle
Radar Topography Mission (SRTM) digital elevation data. Remote Sensing of
Environment, 100, pp. 179–189.
DEY, B. and GOSWAMI, D.C., 1983, Application of Remote Sensing for seasonal runoff
prediction in the Indus basin, Pakistan. In Hydrological Applications of Remote
Sensing and Remote Data Transmission (Proceedings of the Hamburg Symposium,
August 1983), IAHS Publication No. 145, pp. 637–645.
DEY, B., SHARMA, V.K., GOSWAMI, D.C. and SUBBA RAO, P., 1988, Snow cover, snowmelt
and runoff in the Himalayan river basins. Final technical report, National Aeronotics
and Space Administration, NASA-CR-182434.
DOZIER, J., 1989, Spectral signature of alpine snow cover from the Landsat Thematic
Mapper. Remote Sensing of Environment, 28, pp. 9–22.
EUROMAP, 2006, IRS-1C, IRS-1D. Available online at: http://www.euromap.de/site/index.
html (accessed on 18 August 2006).
5876 S. K. Jain et al.
Downloaded By: [Indian Institute of Technology] At: 14:18 24 November 2008
GUPTA, R.P., HARITASHYA, U.K. and SINGH, P., 2005, Mapping dry/wet snow cover in the
Indian Himalayas using IRS multispectral images. Remote Sensing of Environment,
97, pp. 458–469.
GUPTA, R.P., DUGGAL, A.J., RAO, S.N., SHANKAR, G. and SINGHAL, B.B.S., 1982, Snowcover
area in snowmelt runoff relation and its dependence on geomorphology – a study
from Beas catchment (Himalaya, India). Journal of Hydrology, 58, pp. 325–339.
HALL, D.K. and MARTINEC, J., 1985, Remote Sensing of Ice and Snow, p. 189 (London:
Chapman and Hall).
HALL, D.K., RIGGS, G.A. and SALOMONSON, V.V., 1995, Development of methods for
mapping global snow cover using moderate resolution imaging spectroradiometer
data. Remote Sensing of Environment, 54, pp. 127–140.
HALL, D.K., RIGGS, G.A., SALOMONSON, V.V., DIGIROLAMO, N.E. and BAYR, K.J., 2002,
MODIS snow cover products. Remote Sensing of Environment, 83, pp. 181–194.
JAIN, S.K., 2001, Snowmelt runoff modeling and sedimentation studies in Satluj basin using
remote sensing and GIS. PhD thesis, University of Roorkee.
JIAN, W. and WENJUN, L., 2003, Comparison of methods of snow cover mapping by
analyzing solar spectrum of satellite remote sensing data in China. International
Journal of Remote Sensing, 24, pp. 4129–4136.
JUSTICE, C., VERMOTE, E., TOWNSHEND, J.R.G., DEFRIES, R., ROY, D.P., HALL, D.K.,
SALOMONSON, V.V., PRIVETTE, J., RIGGS, G., STRAHLER, A., LUCHT, W., MYNENI, R.,
KNJAZIHHIN, Y., RUNNING, S., NEMANI, R., WAN, Z., HUETE, A., VAN LEEUWEN, W.,
WOLFE, R., GIGLIO, L., MULLER, J.-P., LEWIS, P. and BARNSLEY, M., 1998, The
Moderate Resolution Imaging Spectroradiometer (MODIS): land remote sensing
for global change research. IEEE Transactions on Geoscience and Remote Sensing, 36,
pp. 1228–1249.
KLEIN, A.G. and BARNETT, A.G., 2003, Validation of daily MODIS snow cover maps of the
Upper Rio Grande River Basin for the 2000–2001 snow year. Remote Sensing of
Environment, 86, pp. 162–176.
KLEIN, A.G., HALL, D.K. and RIGGS, G.A., 1998, Improving snow-cover mapping in
forests through the use of a canopy reflectance model. Hydrological Processes, 12,
pp. 1723–1744.
LEBLANC, M., FAVREAU, G., MALEY, J., NAZOUMOU, Y., LEDUC, C., STAGNITTI, F.,
OEVELEN, P.J., DELCLAUX, F. and LEMOALLE, J., 2006, Reconstruction of Megalake
Chad using Shuttle Radar Topographic Mission data. Palaeogeography,
Palaeoclimatology, Palaeoecology, 239, pp. 16–27.
MARKHAM, B.L. and BARKER, J.L., 1987, Thematic Mapper band-pass solar exoatmospheric
irradiances. International Journal of Remote Sensing, 8, pp. 517–523.
MATSON, M., ROEPLEWSKI, C.F. and VARNADORE, M.S., 1986, An Atlas of Satellite-derived
Northern Hemisphere Snow Cover Frequency (Washington, DC: National Weather
Service).
NESDIS, 2006, Comprehensive large array-data stewardship system. Available online at:
http://www.class.noaa.gov (accessed on 18 August 2006).
NRSA, 2006, Indian remote sensing satellites. Available online at: www.nrsa.gov.in (accessed
on 18 August 2006).
PANDYA, M.R., SINGH, R.P., MURALI, K.R., BABU, P.N., KIRAN KUMAR, A.S. and
DADHWAL, V.K., 2002, Bandpass solar exo-atmospheric irradiance and Rayleigh
optical thickness of sensors onboard Indian Remote Sensing Satellites-1B, 1C, 1D,
and P4. IEEE Transactions on Geoscience and Remote Sensing, 40, pp. 714–718.
RAMAMOORTHI, A.S., 1987, Snow cover area (SCA) is the main factor in forecasting snowmelt
runoff from major river basins. In Large Scale Effects of Seasonal Snow Cover
(Proceedings of the Vancouver Symposium, August, 1987), IAHS Publication No. 166,
pp. 187–198.
RANGO, A., 1996, Spaceborne remote sensing for snow hydrology applications. Hydrological
Sciences – Journal des Sciences Hydrologiques, 41, pp. 477–494.
Accuracy assessment of MODIS, NOAA and IRS data 5877
Downloaded By: [Indian Institute of Technology] At: 14:18 24 November 2008
RIGGS, G.A., HALL, D.K. and SALOMONSON, V.V., 2003, MODIS snow products users’ guide.
Available online at: http://www.modis-snow-ice.gsfc.nasa.gov/sug.pdf (accessed on 18
August 2006).
ROSEN, P.A., HENSLEY, S., GURROLA, E., ROGEZ, F., CHAN, S., MARTIN, J. and
RODRIGUEZ, E., 2001, SRTM C-band topographic data: quality assessments and
calibration activities. In Geoscience and Remote Sensing Symposium, July 2001.
International Geoscience and Remote Sensing Symposium (IGARSS’01). IEEE 2001
International, Sydney, Australia, pp. 739–741.
SARAF, A.K., FOSTER, J.L., SINGH, P. and TARAFDAR, S., 1999, Passive microwave data for
snow-depth and snow-extent estimations in the Himalayan Mountains. International
Journal of Remote Sensing, 20, pp. 83–95.
SARAF, A.K. and CHOUDHURY, S., 2006, NOAA-HRPT and FY-CHRPT Satellite Earth
Station at IITR. GIS Development, 9, No. 12, pp. 44–46.
SEIDEL, K. and MARTINEC, J., 2004, Remote Sensing in Snow Hydrology; Runoff Modeling,
Effect of Climate Change (Berlin: Springer).
SINGER, F.S. and POPHAM, R.W., 1963, Non-meteorological observations from satellites.
Astronautics and Aerospace Engineering, 1, pp. 89–92.
SINGH, P. and JAIN, S.K., 2002, Snow and glacier melt in the Satluj River at Bhakra Dam in
the Western Himalayan region. Hydrological Sciences Journal, 47, pp. 93–109.
SINGH, P. and JAIN, S.K., 2003, Modelling of stream flow and its components for a large
Himalayan basin with predominant snowmelt yields. Journal of Hydrological
Sciences, 48, pp. 257–276.
SUN, G., RANSON, K.J., KHARUK, V.I. and KOVACS, K., 2003, Validation of surface height
from shuttle radar topography mission using shuttle laser altimeter. Remote Sensing
of Environment, 88, pp. 401–411.
THAPA, K.B., 1993, Estimation of snowmelt runoff in Himalayan catchments incorporating
remote sensing data. In Snow and Glacier Hydrology, International Symposium,
Kathmandu, Nepal, 16–21 November 1992, Proceedings International Association of
Hydrological Sciences, G.J. Young (Ed). IAHS/AISH Publication, no. 218,
pp. 69–74.
UPADHYAY, D.S., MISHRA, D.K., JOHRI, A.P., MISHRA, D.K. and SRIVASTAVA, A.K., 1991,
Use of satellite based information in snowmelt run-off studies. Mausam, 42,
pp. 187–194.
WIKIPEDIA, 2006, Chenab River. Available online at: http://en.wikipedia.org/wiki/
Chenab_River (accessed on 18 August 2006).
ZEBKER, H.A., FARR, T.G., SALAZAR, R.P. and DIXON, T.H., 1994, Mapping the world’s
topography using RADAR interferometry – the Topsat Mission. Proceedings of the
IEEE, 82, pp. 1774–1786.
5878 Accuracy assessment of MODIS, NOAA and IRS data
Downloaded By: [Indian Institute of Technology] At: 14:18 24 November 2008
Related Documents