Accumulation Distribution Indicator – 4 Entry Triggers and Trade Examples What is the Accumul Distribution Indicator The accumulation distribution indicator (A/D) provides information regarding the money flow in a stock. The word “accumulation” refers to the level of buying and “distribution” the level of selling. Therefore, the A/D is a volume-based indicator and is also part of the oscillator family. The indicator fluctuates above and below the zero line. This is an image of an accumulation distribution oscillator.

Welcome message from author
This document is posted to help you gain knowledge. Please leave a comment to let me know what you think about it! Share it to your friends and learn new things together.
Transcript

Accumulation DistributionIndicator – 4 Entry Triggersand Trade Examples
What is the AccumulationDistribution IndicatorThe accumulation distribution indicator (A/D) providesinformation regarding the money flow in a stock. The word“accumulation” refers to the level of buying and“distribution” the level of selling.
Therefore, the A/D is a volume-based indicator and is alsopart of the oscillator family. The indicator fluctuates aboveand below the zero line.
This is an image of an accumulation distribution oscillator.

Accumulation Distribution
Furthermore, notice how the indicator rises above and belowthe zero line. On first glance, it may appear the indicatorjust mirrors the price action, but there is much more going onbeneath the hood which we will now explain.
Accumulation DistributionComponentsThe calculation of the accumulation distribution indicatorconsists of three components- money flow multiplier (MFM),money flow volume (MFV), and accumulation distribution line(ADL).

Money Flow Multiplier (MFM)MFM = ((Close – Low) – (High – Close)) / (High – Low)
Money Flow Volume (MFV)MFV = MFM x Volume on the Period
Accumulation Distribution Line (ADL)ADL = Previous Period ADL + Current MFV
Accumulation Distribution – How toCalculateNext, we will walk through how to calculate the indicator withthe necessary inputs.
Close = $650.00
Low = $648.00
High = $651.00
Volume on Period = 9,500
Previous Period ADL = 180,000
Let’s now add the values to the formulas:
MFM = ((650 – 648) – (651 – 650)) / 3
MFM = 0.3333
MFV = 0.3333 x 9500
MFV = 3,166.35

ADL = 180,000 + 3,166.35
ADL = 183,166.35
Let’s now visualize it:
ADL Value
So, in other words, when you apply the parameters used in thisexample, this is how the ADL prints on the chart. Now see whathappens if we add 10 more values to our calculation.
These are the values:
184328185123186000179000175000181000183500189000194000186000
Finally, let’s visualize it!
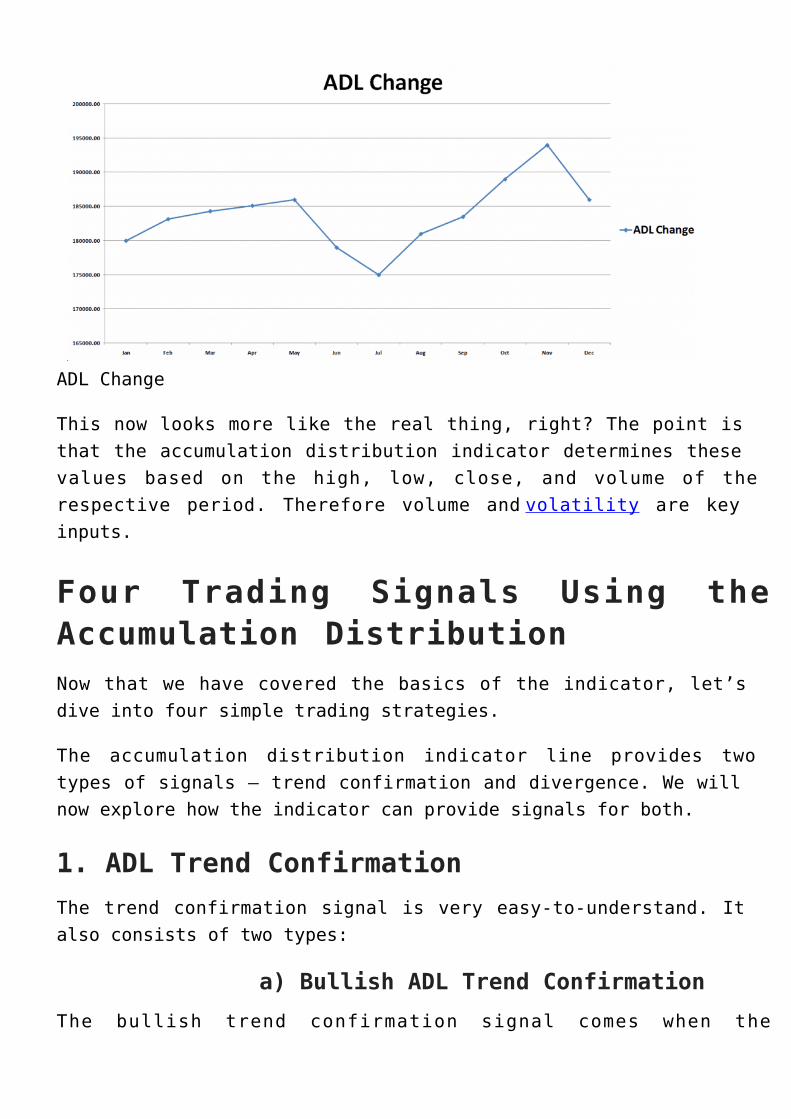
ADL Change
This now looks more like the real thing, right? The point isthat the accumulation distribution indicator determines thesevalues based on the high, low, close, and volume of therespective period. Therefore volume and volatility are keyinputs.
Four Trading Signals Using theAccumulation DistributionNow that we have covered the basics of the indicator, let’sdive into four simple trading strategies.
The accumulation distribution indicator line provides twotypes of signals – trend confirmation and divergence. We willnow explore how the indicator can provide signals for both.
1. ADL Trend ConfirmationThe trend confirmation signal is very easy-to-understand. Italso consists of two types:
a) Bullish ADL Trend ConfirmationThe bullish trend confirmation signal comes when the
accumulation distribution indicator line increases duringtimes of high volume. This means accumulation is underway,which will likely lead to an increase in the price of thesecurity.
b) Bearish ADL Trend ConfirmationThe bearish trend confirmation signal comes when theaccumulation distribution indicator line decreases duringtimes of high volume. This signal occurs when price is likelyon the decline.
These two signals are crucial for the success of theaccumulation distribution indicator oscillator. Traders usethem to set entry and exit points on the chart in order to hopinto emerging trends and to exit in the right moment.
2. ADL DivergenceThe ADL divergence is another important feature of theaccumulation/distribution indicator. There are two types ofADL divergence based on their potential:
a) Bullish ADL DivergenceTo get a bullish ADL divergence we need to identify a couplethings on the chart. The first thing you need is bearish priceaction. The second is an increasing ADL. These create a strongbullish signal on the chart.
b) Bearish ADL DivergenceTo get a bearish ADL divergence we need to identify exactlythe opposite setup. We want to identify bullish price actionwith a decreasing ADL. These create a strong bearish signal onthe chart.

3. On Balance Volume and AccumulationDistributionBefore we discuss the trade signals provided by the OBV, letme first explain the differences between the indicators.
Similarly, the OBV pretty much looks the same way as theaccumulation distribution indicator and the signals it givesare interpreted the same way.
However, the two indicators could sometimes diverge. The ADLcould move upwards, while the OBV could move downwards.
So, why would the two indicators diverge if they are bothvolume based?
The answer to this question is due to the differences in theformulas of these indicators. The ADL compares the currentclose with the current high and current low. The OBV comparesthe current close with the previous close.
But, the real question is what direction will the stock goafter the divergence emerges?
First, see if the stock is trending. Next, validate the trendis high if there is high volume to support the move.
Here we have a classic divergence between the OBV and ADL. Thetwo lines cross creating a divergence. Fortunately, the trendis bearish and is confirmed with relatively high tradingvolumes. Therefore, we get a bearish signal on the chart.
a) Accumulation Distribution TradingSystem with the OBVLet’s now discuss the trading rules involved when trading withthe ADL and on balance volume:
ADL & OBV Trade EntryEnter a trade when you get a matching signal between the twoindicators, accompanied by higher trading volumes.
When this happens you enter the trade in the direction of thetrend.
ADL & OBV Stop LossMake sure you always protect your trades with a stop lossorder.
To determine the right place for your S/L order, you shoulduse standard price action rules.
If you are entering a long trade, you should find supportprior to the trade signal. Then you place your stop lossunderneath. If you are going short, you do the exact opposite;find a resistance level established prior to the signal andplace your stop order above this level.
Profit Targets using the ADL and OBVIf the ADL and the OBV are increasing on high volumes, youshould hold your long trade.
Conversely, if the ADL and the OBV are decreasing you shouldstay short. However, once the indicators shift in the opposite
direction, it’s now time to take your profits and exit thetrade.
Accumulation Distribution Strategy ExampleNow let’s approach a strategy which will combine these rulesinto a complete trading system.
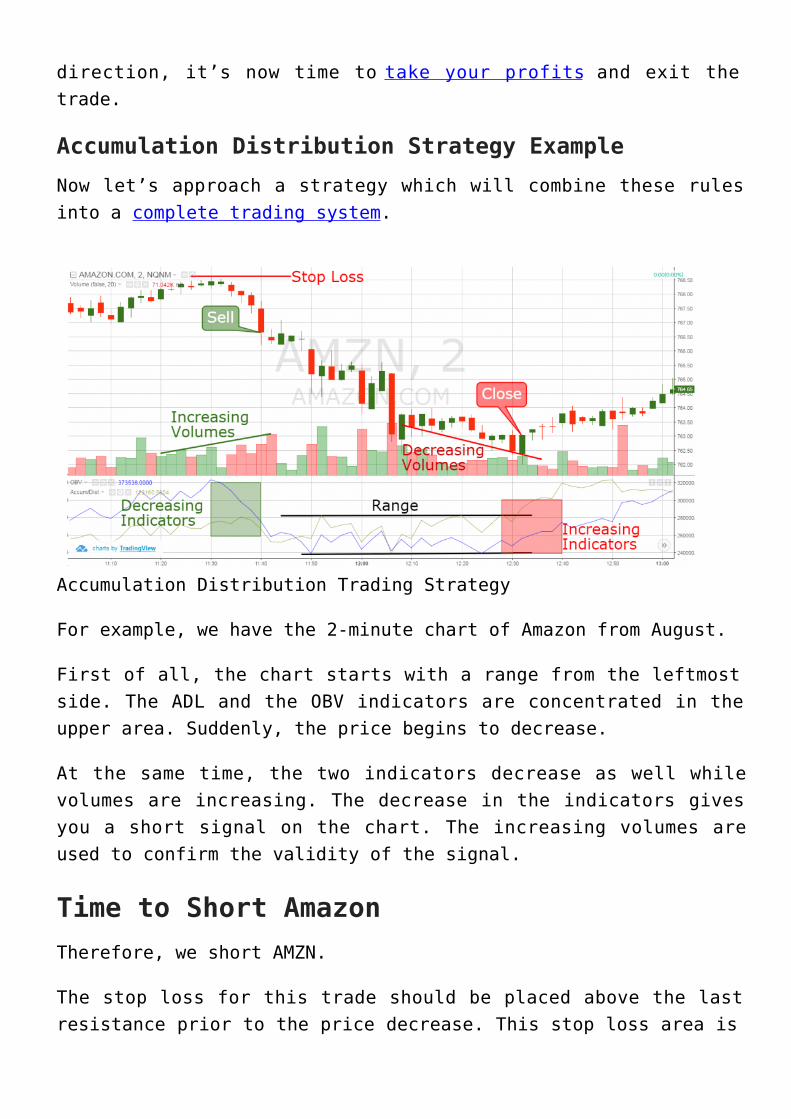
Accumulation Distribution Trading Strategy
For example, we have the 2-minute chart of Amazon from August.
First of all, the chart starts with a range from the leftmostside. The ADL and the OBV indicators are concentrated in theupper area. Suddenly, the price begins to decrease.
At the same time, the two indicators decrease as well whilevolumes are increasing. The decrease in the indicators givesyou a short signal on the chart. The increasing volumes areused to confirm the validity of the signal.
Time to Short AmazonTherefore, we short AMZN.
The stop loss for this trade should be placed above the lastresistance prior to the price decrease. This stop loss area is

highlighted with the red horizontal line on the chart.
After we sell AMZN, the price begins to decrease. The drop isso strong that the stock even gaps down 4 periods after weenter the market.
In fact, in the middle of the bearish trend, the twoindicators enter a range phase. We outline the levels of therange with the two black lines in the area where theindicators are plotted.
At the same time, the volumes are decreasing as well. Then thetwo indicators start increasing and the stock accumulationdistribution indicator line breaks the upper level of therange. At the same moment, the price action creates a biggerbullish candle. We can use this candle to exit our shorttrade. See that the price switches directions afterward.
Let’s now review a trading example of a divergence between theADL and OBV indicators:
Above you see the 2-minute chart of Oracle.
As a result of the drop, the price attempts to enter a bullishtrend. The two indicators have been moving toward each otheruntil they cross.

The interaction (green circle) is represented by the red andthe green lines in the indicator area. At the same time, thetrading volumes have been increasing.
Since the price is attempting to enter a bullish trend, wetrade in this direction. We open a long trade right after thecrossover of the two indicators.
Stop on the TradeThus, the stop of this trade should be placed below the bottomcreated at the beginning of the trend reversal. Therefore,location of the stop is shown with the red horizontal line.
The price increase continues afterward with increasingvolumes.
Suddenly, Oracle explodes in a bullish direction. The increaseis rapid and is contained by only two candles. At the sametime, the two indicators also increase and reach relativelyhigh values. Then the ADL and the OBV start dropping, which isshown in the red square.
While the indicators are beginning to fall, the volume alsohas a dramatic drop. This is the signal we were waiting on forconfirmation to exit our trade.
ConclusionThe accumulation distribution indicator is a volume1.based oscillator.It consists of a single line, which fluctuates above and2.below a zero level.The accumulation distribution calculation consists of3.three formulas:
MFM = ((Close – Low) – (High – Close)) / (High – Low)MFV = MFM x Volume on the PeriodADL = Previous Period ADL + Current MFV

The 4 tips on how to use the Accumulation Distribution4.Indicator to trade signals are:
Bullish Trend ConfirmationBearish Trend ConfirmationBullish DivergenceBearish Divergence
Trading RulesThe three important rules to trade with the ADL and the5.OBV are:
Open a trade when you find matching signals. Open atrade in the direction of the trend if the twoindicators contradict (diverge, cross) during high orincreasing volumes.Place a stop above/beyond a support/resistance levelcreated prior to the signal.Stay in the trade as long as the two indicators aresupporting your trading decision.
Lastly, to learn more about how to use the accumulationdistribution indicator, check out this video on YouTube. Thevideo goes into great detail about how to interpret signalsfrom the indicator.
Related Documents