Accreditation Council for Continuing Medical Education (ACCME ® ) 2014 Annual Report ADDENDUM The main 2014 ACCME Annual Report presents combined data from all accredited providers in the ACCME System. It includes Tables 1-11 and Figures 1-11 and is available here on the ACCME website. This addendum provides information broken out by ACCME-accredited providers and by state- accredited providers, offering an overview of the CME system at both the national and state levels. ACCME-accredited providers offer CME primarily to national or international audiences of physicians and other healthcare professionals. State-accredited providers, which are accredited by a state/ territory medical society that is recognized by the ACCME as an accreditor, offer CME primarily to learners from their state or contiguous states. ©2015 by the Accreditation Council for Continuing Medical Education All Rights Reserved 515 N. State Street, Suite 1801 | Chicago, IL 60654 | Phone: 312/527-9200 | www.accme.org

Welcome message from author
This document is posted to help you gain knowledge. Please leave a comment to let me know what you think about it! Share it to your friends and learn new things together.
Transcript

Accreditation Council for Continuing Medical Education (ACCME®)
2014 Annual Report
ADDENDUM
The main 2014 ACCME Annual Report presents combined data from all accredited providers in the ACCME System. It includes Tables 1-11 and Figures 1-11 and is available here on the ACCME website.
This addendum provides information broken out by ACCME-accredited providers and by state-accredited providers, offering an overview of the CME system at both the national and state levels. ACCME-accredited providers offer CME primarily to national or international audiences of physicians and other healthcare professionals. State-accredited providers, which are accredited by a state/territory medical society that is recognized by the ACCME as an accreditor, offer CME primarily to learners from their state or contiguous states.
©2015 by the Accreditation Council for Continuing Medical Education All Rights Reserved515 N. State Street, Suite 1801 | Chicago, IL 60654 | Phone: 312/527-9200 | www.accme.org

Table of ContentsCME Presented by ACCME-Accredited Providers Only
Table 12 Size of the CME Enterprise ..................................................................................... 1
Table 13 Activities by Organization and Activity Type ............................................................ 2
Table 14 Hours of Instruction by Organization and Activity Type ........................................... 3
Table 15 Physician Interactions by Organization and Activity Type ........................................ 4
Table 16 Other Learner Interactions by Organization and Activity Type ................................. 5
Table 17 Income and Expense .............................................................................................. 6
Table 18 Income and Expense by Organization Type ............................................................ 7
Table 19 Providers by Organization Type, 1998-2014 ........................................................... 8
Figure 12 Percentages Designed/Analyzed for Change in Competence, Performance, or Patient Outcomes ............................................................................................... 9
Figure 13 Physician Interactions by Activity Types, 2005-2014 .............................................. 10
Figure 14 Other Learner Interactions by Activity Types, 2005-2014 ....................................... 11
Figure 15 Distribution of Monetary Commercial Support ........................................................ 12
Table 20 Total Numbers of Activities, Hours, and Interactions .............................................. 13
Table 21 Numbers of Activities, Hours, and Interactions without Commercials Support ................................................................................ 13
Table 22 Numbers of Activities, Hours, and Interactions with Commercial Support ....................................................................................... 13
CME Presented by State-Accredited Providers Only
Table 23 Size of the CME Enterprise .................................................................................... 14
Table 24 Activities by Organization and Activity Type ........................................................... 15
Table 25 Hours of Instruction by Organization and Activity Type .......................................... 16
Table 26 Physician Interactions by Organization and Activity Type ....................................... 17
Table 27 Other Learner Interactions by Organization and Activity Type ................................ 18
Table 28 Income and Expense ............................................................................................. 19
Table 29 Income and Expense by Organization Type ........................................................... 20
Figure 16 Percentages Designed/Analyzed for Change in Competence, Performance, or Patient Outcomes .............................................................................................. 21
Figure 17 Physician Interactions by Activity Types, 2005-2014 .............................................. 22
Figure 18 Other Learner Interactions by Activity Types, 2005-2014 ....................................... 23
Figure 19 Distribution of Monetary Commercial Support ........................................................ 24
Table 30 Total Numbers of Activities, Hours, and Interactions .............................................. 25
Table 31 Numbers of Activities, Hours, and Interactions without Commercial Support .................................................................................. 25
Table 32 Numbers of Activities, Hours, and Interactions with Commercial Support ....................................................................................... 25
ACCME Annual Report Glossary .................................................................................................... 26
2014 ACCME® Annual Report Addendum706_2014_Annual_Report_Addendum_20150723.pdf
© 2015 by the ACCME®
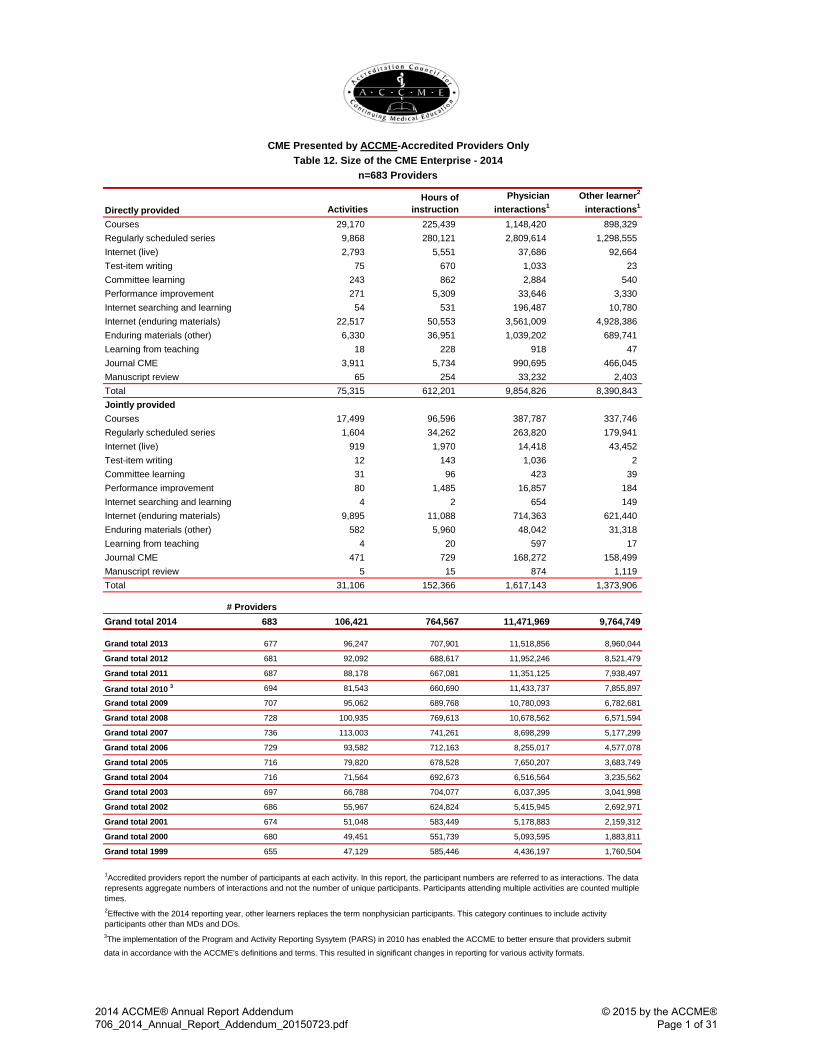
Directly provided ActivitiesHours of
instructionPhysician
interactions1Other learner2
interactions1
29,170 225,439 1,148,420 898,329 9,868 280,121 2,809,614 1,298,555 2,793 5,551 37,686 92,664
75 670 1,033 23 243 862 2,884 540 271 5,309 33,646 3,330 54 531 196,487 10,780
22,517 50,553 3,561,009 4,928,386 6,330 36,951 1,039,202 689,741
18 228 918 47 3,911 5,734 990,695 466,045
65 254 33,232 2,403 Total 75,315 612,201 9,854,826 8,390,843 Jointly provided
17,499 96,596 387,787 337,746 1,604 34,262 263,820 179,941
919 1,970 14,418 43,452 12 143 1,036 2 31 96 423 39 80 1,485 16,857 184 4 2 654 149
9,895 11,088 714,363 621,440 582 5,960 48,042 31,318
4 20 597 17 471 729 168,272 158,499
5 15 874 1,119 Total 31,106 152,366 1,617,143 1,373,906
# ProvidersGrand total 2014 683 106,421 764,567 11,471,969 9,764,749
Grand total 2013 677 96,247 707,901 11,518,856 8,960,044
Grand total 2012 681 92,092 688,617 11,952,246 8,521,479
Grand total 2011 687 88,178 667,081 11,351,125 7,938,497
Grand total 2010 3 694 81,543 660,690 11,433,737 7,855,897
Grand total 2009 707 95,062 689,768 10,780,093 6,782,681
Grand total 2008 728 100,935 769,613 10,678,562 6,571,594
Grand total 2007 736 113,003 741,261 8,698,299 5,177,299
Grand total 2006 729 93,582 712,163 8,255,017 4,577,078
Grand total 2005 716 79,820 678,528 7,650,207 3,683,749
Grand total 2004 716 71,564 692,673 6,516,564 3,235,562
Grand total 2003 697 66,788 704,077 6,037,395 3,041,998
Grand total 2002 686 55,967 624,824 5,415,945 2,692,971
Grand total 2001 674 51,048 583,449 5,178,883 2,159,312
Grand total 2000 680 49,451 551,739 5,093,595 1,883,811
Grand total 1999 655 47,129 585,446 4,436,197 1,760,504
Committee learningPerformance improvementInternet searching and learningInternet (enduring materials)Enduring materials (other)Learning from teachingJournal CMEManuscript review
1Accredited providers report the number of participants at each activity. In this report, the participant numbers are referred to as interactions. The data represents aggregate numbers of interactions and not the number of unique participants. Participants attending multiple activities are counted multiple times. 2Effective with the 2014 reporting year, other learners replaces the term nonphysician participants. This category continues to include activity participants other than MDs and DOs.3The implementation of the Program and Activity Reporting Sysytem (PARS) in 2010 has enabled the ACCME to better ensure that providers submit
data in accordance with the ACCME’s definitions and terms. This resulted in significant changes in reporting for various activity formats.
Test-item writing
Committee learningPerformance improvementInternet searching and learningInternet (enduring materials)Enduring materials (other)Learning from teachingJournal CMEManuscript review
CoursesRegularly scheduled seriesInternet (live)
Test-item writing
CME Presented by ACCME-Accredited Providers OnlyTable 12. Size of the CME Enterprise - 2014
CoursesRegularly scheduled seriesInternet (live)
n=683 Providers
2014 ACCME® Annual Report Addendum 706_2014_Annual_Report_Addendum_20150723.pdf
© 2015 by the ACCME® Page 1 of 31

CME Presented by ACCME-Accredited Providers Only
Table 13. Activities by Organization and Activity Type - 2014
Organization typeGovernment or
military
Hospital / health care
delivery system
Insurance company /
managed-care company
Nonprofit (other)
Nonprofit (physician
membership organization) Other
Publishing / education company
School of medicine Grand total
# of Providers 13 83 14 35 252 24 134 128 683Directly provided
Courses 4,732 6,180 1,843 665 4,945 805 2,886 7,114 29,170Regularly scheduled series 172 2,860 0 77 15 61 37 6,646 9,868Internet (live) 1,526 211 55 112 433 70 276 110 2,793Test-item writing 0 0 0 0 74 0 0 1 75Committee learning 7 17 213 0 6 0 0 0 243Performance improvement 0 58 6 0 109 0 26 72 271Internet searching and learning 0 6 0 3 5 0 33 7 54Internet (enduring materials) 331 1,953 277 687 4,778 763 11,373 2,355 22,517Enduring materials (other) 325 218 81 55 1,225 1 3,971 454 6,330Learning from teaching 1 2 0 0 3 0 1 11 18Journal CME 56 88 6 89 3,113 70 440 49 3,911Manuscript review 0 2 0 0 63 0 0 0 65Total 7,150 11,595 2,481 1,688 14,769 1,770 19,043 16,819 75,315
Jointly providedCourses 405 754 43 917 9,673 51 1,805 3,851 17,499Regularly scheduled series 157 185 0 42 61 1 27 1,131 1,604Internet (live) 32 97 18 116 189 2 217 248 919Test-item writing 0 0 0 0 11 0 0 1 12Committee learning 0 0 17 0 2 0 0 12 31Performance improvement 0 4 0 1 28 0 11 36 80Internet searching and learning 0 1 1 0 0 0 0 2 4Internet (enduring materials) 87 221 1 272 684 19 2,384 6,227 9,895Enduring materials (other) 8 16 0 24 60 7 232 235 582Learning from teaching 0 2 0 1 1 0 0 0 4Journal CME 0 1 0 0 200 1 224 45 471Manuscript review 1 1 0 0 2 0 0 1 5Total 690 1,282 80 1,373 10,911 81 4,900 11,789 31,106
Grand total 7,840 12,877 2,561 3,061 25,680 1,851 23,943 28,608 106,421
2014 ACCME® Annual Report Addendum 706_2014_Annual_Report_Addendum_20150723.pdf
© 2015 by the ACCME® Page 2 of 31

CME Presented by ACCME-Accredited Providers Only
Table 14. Hours of Instruction by Organization and Activity Type - 2014
Organization typeGovernment or
military
Hospital / health care
delivery system
Insurance company /
managed-care company
Nonprofit (other)
Nonprofit (physician
membership organization) Other
Publishing / education company
School of medicine Grand total
# of Providers 13 83 14 35 252 24 134 128 683Directly provided
Courses 37,189 33,946 3,830 7,373 57,995 4,582 19,564 60,959 225,439Regularly scheduled series 3,167 69,403 0 945 706 2,157 1,027 202,717 280,121Internet (live) 2,314 480 59 201 870 99 1,022 507 5,551Test-item writing 0 0 0 0 660 0 0 10 670Committee learning 84 189 537 0 52 0 0 0 862Performance improvement 0 1,160 100 0 2,314 0 520 1,215 5,309Internet searching and learning 0 8 0 2 3 0 497 23 531Internet (enduring materials) 675 2,327 345 601 20,006 1,277 19,893 5,431 50,553Enduring materials (other) 521 937 135 117 10,477 1 18,500 6,264 36,951Learning from teaching 8 6 0 0 62 0 3 149 228Journal CME 56 151 6 104 4,470 82 771 95 5,734Manuscript review 0 6 0 0 248 0 0 0 254Total 44,012 108,612 5,011 9,342 97,861 8,198 61,796 277,369 612,201
Jointly providedCourses 4,384 7,315 339 5,154 33,394 464 14,235 31,310 96,596Regularly scheduled series 4,634 4,619 0 729 1,167 2 544 22,568 34,262Internet (live) 115 114 18 177 339 3 698 507 1,970Test-item writing 0 0 0 0 133 0 0 10 143Committee learning 0 0 60 0 18 0 0 18 96Performance improvement 0 90 0 20 560 0 130 685 1,485Internet searching and learning 0 1 1 0 0 0 0 1 2Internet (enduring materials) 301 298 3 554 2,905 62 2,418 4,547 11,088Enduring materials (other) 45 80 0 94 546 78 3,231 1,887 5,960Learning from teaching 0 5 0 10 5 0 0 0 20Journal CME 0 3 0 0 294 3 269 161 729Manuscript review 3 3 0 0 6 0 0 3 15Total 9,482 12,527 420 6,737 39,366 611 21,525 61,696 152,366
Grand total 53,494 121,139 5,431 16,079 137,227 8,810 83,321 339,065 764,567
Note: Totals may be off due to rounding.
2014 ACCME® Annual Report Addendum 706_2014_Annual_Report_Addendum_20150723.pdf
© 2015 by the ACCME® Page 3 of 31

CME Presented by ACCME-Accredited Providers Only
Table 15. Physician Interactions by Organization and Activity Type - 2014
Organization typeGovernment or
military
Hospital / health care
delivery system
Insurance company /
managed-care company
Nonprofit (other)
Nonprofit (physician
membership organization) Other
Publishing / education company
School of medicine Grand total
# of Providers 13 83 14 35 252 24 134 128 683Directly provided
Courses 19,019 100,225 27,845 28,385 608,952 8,338 119,884 235,772 1,148,420Regularly scheduled series 28,726 775,491 0 15,915 4,784 19,496 7,435 1,957,767 2,809,614Internet (live) 5,493 2,997 855 4,691 18,297 121 2,728 2,504 37,686Test-item writing 0 0 0 0 926 0 0 107 1,033Committee learning 70 408 2,333 0 73 0 0 0 2,884Performance improvement 0 1,389 146 0 29,284 0 1,595 1,232 33,646Internet searching and learning 0 49,974 0 64 9,338 0 136,927 184 196,487Internet (enduring materials) 15,247 148,774 49,622 92,841 857,682 53,105 2,230,745 112,993 3,561,009Enduring materials (other) 40,932 10,908 11,060 2,268 215,253 1 729,647 29,133 1,039,202Learning from teaching 137 125 0 0 149 0 94 413 918Journal CME 1,134 42,443 618 4,468 879,535 461 61,214 822 990,695Manuscript review 0 850 0 0 32,382 0 0 0 33,232Total 110,758 1,133,584 92,479 148,632 2,656,655 81,522 3,290,269 2,340,927 9,854,826
Jointly providedCourses 3,992 27,477 766 18,598 149,459 1,489 61,669 124,337 387,787Regularly scheduled series 40,649 20,428 0 6,350 9,569 4 12,324 174,496 263,820Internet (live) 38 756 219 175 2,852 33 1,793 8,552 14,418Test-item writing 0 0 0 0 685 0 0 351 1,036Committee learning 0 0 246 0 38 0 0 139 423Performance improvement 0 282 0 3 7,378 0 55 9,139 16,857Internet searching and learning 0 77 11 0 0 0 0 566 654Internet (enduring materials) 383 15,077 1 12,477 100,473 5,473 169,146 411,333 714,363Enduring materials (other) 8 4,537 0 122 6,955 331 24,781 11,308 48,042Learning from teaching 0 155 0 424 18 0 0 0 597Journal CME 0 6 0 0 11,549 85 154,825 1,807 168,272Manuscript review 21 520 0 0 48 0 0 285 874Total 45,091 69,315 1,243 38,149 289,024 7,415 424,593 742,313 1,617,143
Grand total 155,849 1,202,899 93,722 186,781 2,945,679 88,937 3,714,862 3,083,240 11,471,969
2014 ACCME® Annual Report Addendum 706_2014_Annual_Report_Addendum_20150723.pdf
© 2015 by the ACCME® Page 4 of 31
CME Presented by ACCME-Accredited Providers Only
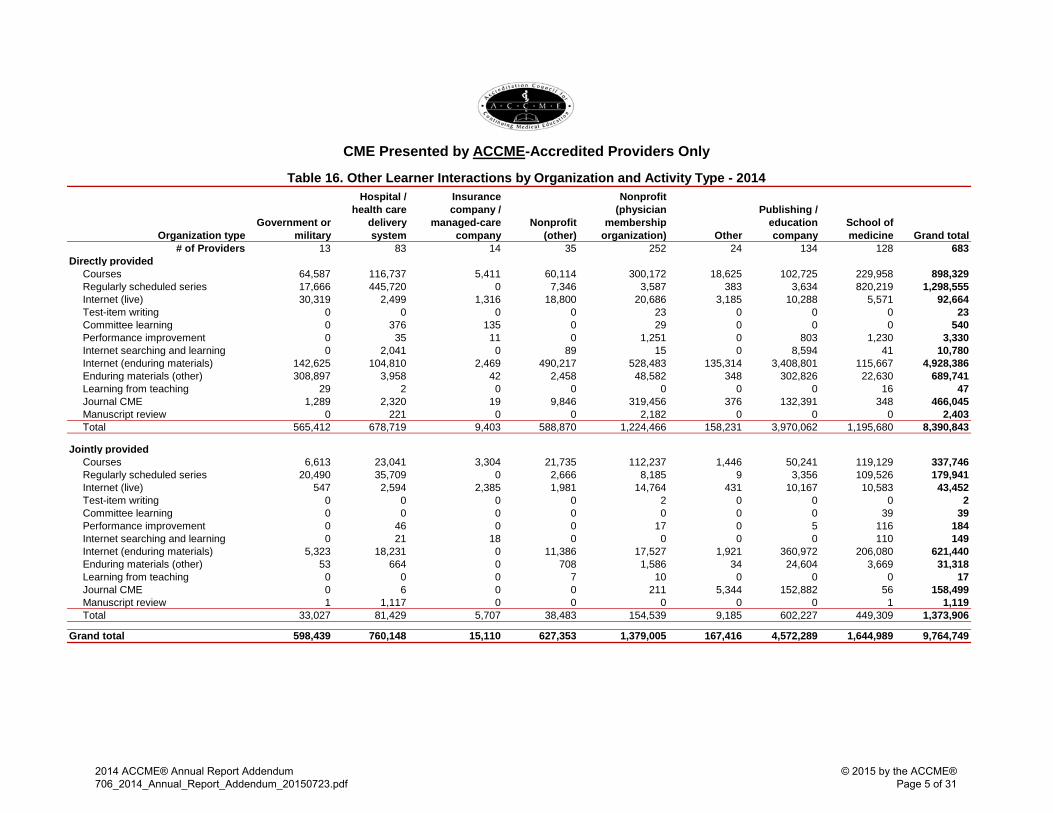
Table 16. Other Learner Interactions by Organization and Activity Type - 2014
Organization typeGovernment or
military
Hospital / health care
delivery system
Insurance company /
managed-care company
Nonprofit (other)
Nonprofit (physician
membership organization) Other
Publishing / education company
School of medicine Grand total
# of Providers 13 83 14 35 252 24 134 128 683Directly provided
Courses 64,587 116,737 5,411 60,114 300,172 18,625 102,725 229,958 898,329Regularly scheduled series 17,666 445,720 0 7,346 3,587 383 3,634 820,219 1,298,555Internet (live) 30,319 2,499 1,316 18,800 20,686 3,185 10,288 5,571 92,664Test-item writing 0 0 0 0 23 0 0 0 23Committee learning 0 376 135 0 29 0 0 0 540Performance improvement 0 35 11 0 1,251 0 803 1,230 3,330Internet searching and learning 0 2,041 0 89 15 0 8,594 41 10,780Internet (enduring materials) 142,625 104,810 2,469 490,217 528,483 135,314 3,408,801 115,667 4,928,386Enduring materials (other) 308,897 3,958 42 2,458 48,582 348 302,826 22,630 689,741Learning from teaching 29 2 0 0 0 0 0 16 47Journal CME 1,289 2,320 19 9,846 319,456 376 132,391 348 466,045Manuscript review 0 221 0 0 2,182 0 0 0 2,403Total 565,412 678,719 9,403 588,870 1,224,466 158,231 3,970,062 1,195,680 8,390,843
Jointly providedCourses 6,613 23,041 3,304 21,735 112,237 1,446 50,241 119,129 337,746Regularly scheduled series 20,490 35,709 0 2,666 8,185 9 3,356 109,526 179,941Internet (live) 547 2,594 2,385 1,981 14,764 431 10,167 10,583 43,452Test-item writing 0 0 0 0 2 0 0 0 2Committee learning 0 0 0 0 0 0 0 39 39Performance improvement 0 46 0 0 17 0 5 116 184Internet searching and learning 0 21 18 0 0 0 0 110 149Internet (enduring materials) 5,323 18,231 0 11,386 17,527 1,921 360,972 206,080 621,440Enduring materials (other) 53 664 0 708 1,586 34 24,604 3,669 31,318Learning from teaching 0 0 0 7 10 0 0 0 17Journal CME 0 6 0 0 211 5,344 152,882 56 158,499Manuscript review 1 1,117 0 0 0 0 0 1 1,119Total 33,027 81,429 5,707 38,483 154,539 9,185 602,227 449,309 1,373,906
Grand total 598,439 760,148 15,110 627,353 1,379,005 167,416 4,572,289 1,644,989 9,764,749
2014 ACCME® Annual Report Addendum 706_2014_Annual_Report_Addendum_20150723.pdf
© 2015 by the ACCME® Page 5 of 31
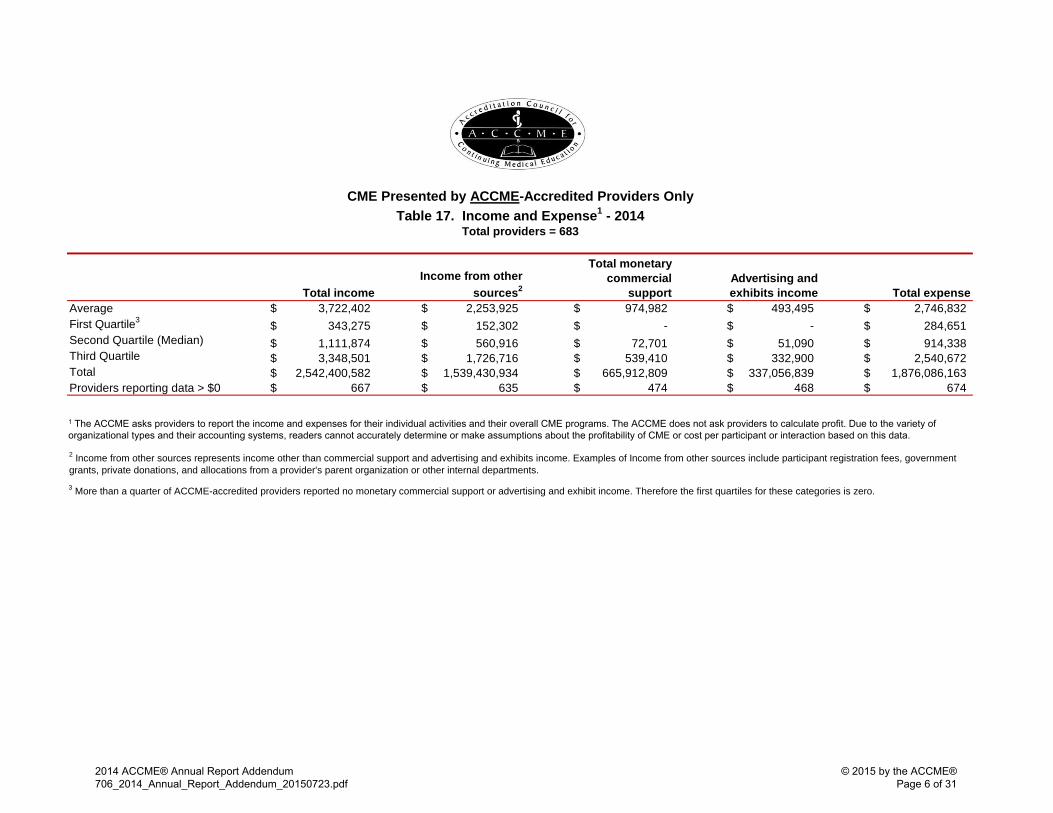
Total incomeIncome from other
sources2
Total monetary commercial
supportAdvertising and exhibits income Total expense
3,722,402$ 2,253,925$ 974,982$ 493,495$ 2,746,832$ 343,275$ 152,302$ -$ -$ 284,651$
1,111,874$ 560,916$ 72,701$ 51,090$ 914,338$ 3,348,501$ 1,726,716$ 539,410$ 332,900$ 2,540,672$
2,542,400,582$ 1,539,430,934$ 665,912,809$ 337,056,839$ 1,876,086,163$
AverageFirst Quartile3
Second Quartile (Median)
Third QuartileTotalProviders reporting data > $0 667$ 635$ 474$ 468$ 674$
3 More than a quarter of ACCME-accredited providers reported no monetary commercial support or advertising and exhibit income. Therefore the first quartiles for these categories is zero.
CME Presented by ACCME-Accredited Providers OnlyTable 17. Income and Expense1 - 2014
Total providers = 683
2 Income from other sources represents income other than commercial support and advertising and exhibits income. Examples of Income from other sources include participant registration fees, government grants, private donations, and allocations from a provider's parent organization or other internal departments.
1 The ACCME asks providers to report the income and expenses for their individual activities and their overall CME programs. The ACCME does not ask providers to calculate profit. Due to the variety of organizational types and their accounting systems, readers cannot accurately determine or make assumptions about the profitability of CME or cost per participant or interaction based on this data.
2014 ACCME® Annual Report Addendum 706_2014_Annual_Report_Addendum_20150723.pdf
© 2015 by the ACCME® Page 6 of 31
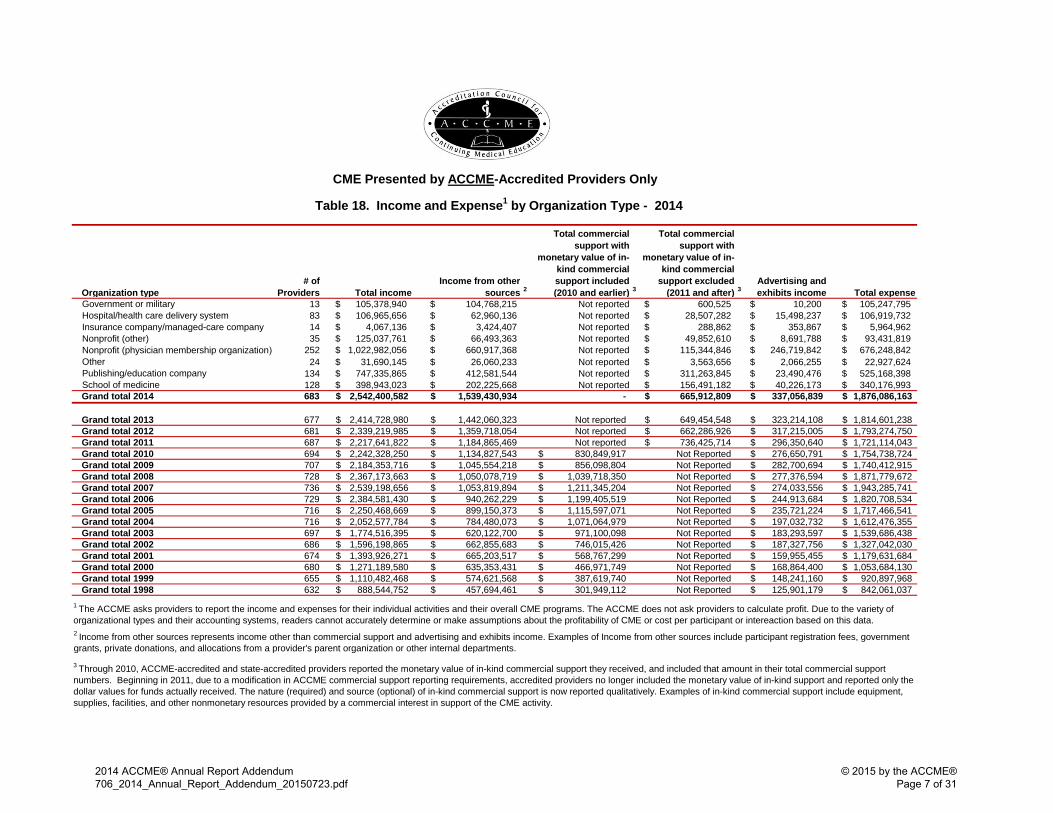
Table 18. Income and Expense1 by Organization Type - 2014
Organization type# of
Providers Total income Income from other
sources 2
Total commercial support with
monetary value of in-kind commercial support included (2010 and earlier) 3
Total commercial support with
monetary value of in-kind commercial
support excluded (2011 and after) 3
Advertising and exhibits income Total expense
13 $ 105,378,940 $ 104,768,215 Not reported $ 600,525 $ 10,200 $ 105,247,795 83 $ 106,965,656 $ 62,960,136 Not reported $ 28,507,282 $ 15,498,237 $ 106,919,732 14 $ 4,067,136 $ 3,424,407 Not reported $ 288,862 $ 353,867 $ 5,964,962 35 $ 125,037,761 $ 66,493,363 Not reported $ 49,852,610 $ 8,691,788 $ 93,431,819
252 $ 1,022,982,056 $ 660,917,368 Not reported $ 115,344,846 $ 246,719,842 $ 676,248,842 24 $ 31,690,145 $ 26,060,233 Not reported $ 3,563,656 $ 2,066,255 $ 22,927,624
134 $ 747,335,865 $ 412,581,544 Not reported $ 311,263,845 $ 23,490,476 $ 525,168,398
Government or militaryHospital/health care delivery systemInsurance company/managed-care company Nonprofit (other)Nonprofit (physician membership organization) OtherPublishing/education companySchool of medicine 128 $ 398,943,023 $ 202,225,668 Not reported $ 156,491,182 $ 40,226,173 $ 340,176,993 Grand total 2014 683 2,542,400,582$ 1,539,430,934$ - 665,912,809$ 337,056,839$ 1,876,086,163$
Grand total 2013 677 2,414,728,980$ 1,442,060,323$ Not reported 649,454,548$ 323,214,108$ 1,814,601,238$ Grand total 2012 681 2,339,219,985$ 1,359,718,054$ Not reported 662,286,926$ 317,215,005$ 1,793,274,750$ Grand total 2011 687 2,217,641,822$ 1,184,865,469$ Not reported 736,425,714$ 296,350,640$ 1,721,114,043$ Grand total 2010 694 2,242,328,250$ 1,134,827,543$ 830,849,917$ Not Reported 276,650,791$ 1,754,738,724$ Grand total 2009 707 2,184,353,716$ 1,045,554,218$ 856,098,804$ Not Reported 282,700,694$ 1,740,412,915$ Grand total 2008 728 2,367,173,663$ 1,050,078,719$ 1,039,718,350$ Not Reported 277,376,594$ 1,871,779,672$ Grand total 2007 736 2,539,198,656$ 1,053,819,894$ 1,211,345,204$ Not Reported 274,033,556$ 1,943,285,741$ Grand total 2006 729 2,384,581,430$ 940,262,229$ 1,199,405,519$ Not Reported 244,913,684$ 1,820,708,534$ Grand total 2005 716 2,250,468,669$ 899,150,373$ 1,115,597,071$ Not Reported 235,721,224$ 1,717,466,541$ Grand total 2004 716 2,052,577,784$ 784,480,073$ 1,071,064,979$ Not Reported 197,032,732$ 1,612,476,355$ Grand total 2003 697 1,774,516,395$ 620,122,700$ 971,100,098$ Not Reported 183,293,597$ 1,539,686,438$ Grand total 2002 686 1,596,198,865$ 662,855,683$ 746,015,426$ Not Reported 187,327,756$ 1,327,042,030$ Grand total 2001 674 1,393,926,271$ 665,203,517$ 568,767,299$ Not Reported 159,955,455$ 1,179,631,684$ Grand total 2000 680 1,271,189,580$ 635,353,431$ 466,971,749$ Not Reported 168,864,400$ 1,053,684,130$ Grand total 1999 655 1,110,482,468$ 574,621,568$ 387,619,740$ Not Reported 148,241,160$ 920,897,968$ Grand total 1998 632 888,544,752$ 457,694,461$ 301,949,112$ Not Reported 125,901,179$ 842,061,037$
3 Through 2010, ACCME-accredited and state-accredited providers reported the monetary value of in-kind commercial support they received, and included that amount in their total commercial support numbers. Beginning in 2011, due to a modification in ACCME commercial support reporting requirements, accredited providers no longer included the monetary value of in-kind support and reported only the dollar values for funds actually received. The nature (required) and source (optional) of in-kind commercial support is now reported qualitatively. Examples of in-kind commercial support include equipment, supplies, facilities, and other nonmonetary resources provided by a commercial interest in support of the CME activity.
CME Presented by ACCME-Accredited Providers Only
1 The ACCME asks providers to report the income and expenses for their individual activities and their overall CME programs. The ACCME does not ask providers to calculate profit. Due to the variety of organizational types and their accounting systems, readers cannot accurately determine or make assumptions about the profitability of CME or cost per participant or intereaction based on this data.2 Income from other sources represents income other than commercial support and advertising and exhibits income. Examples of Income from other sources include participant registration fees, government grants, private donations, and allocations from a provider's parent organization or other internal departments.
2014 ACCME® Annual Report Addendum706_2014_Annual_Report_Addendum_20150723.pdf
© 2015 by the ACCME®Page 7 of 31
Organization Type 1998 1999 2000 2001 2002 2003 2004 2005 2006 2007 2008 2009 2010 2011 2012 2013 2014Government or military 12 15 15 15 16 15 16 16 16 15 14 14 14 15 15 13 13
Hospital / health care delivery system 72 77 76 77 77 77 90 91 93 93 90 88 85 83 82 84 83
Insurance company / managed-care company 1 9 11 11 7 9 13 11 14 14 15 15 14 14 13 13 14
Nonprofit (other) 56 67 69 63 60 60 30 31 34 38 38 35 35 33 36 35 35
Nonprofit (physician membership organization) 221 222 228 227 230 232 273 270 267 270 270 265 258 254 253 251 252
Other 114 58 61 61 61 60 26 25 29 33 32 31 35 37 18 1 23 24
Publishing / education company 41 90 102 104 118 126 146 148 154 150 144 135 130 127 138 132 134
School of medicine 115 117 118 116 117 118 122 124 122 123 125 124 123 124 126 126 128Total 632 655 680 674 686 697 716 716 729 736 728 707 694 687 681 677 683
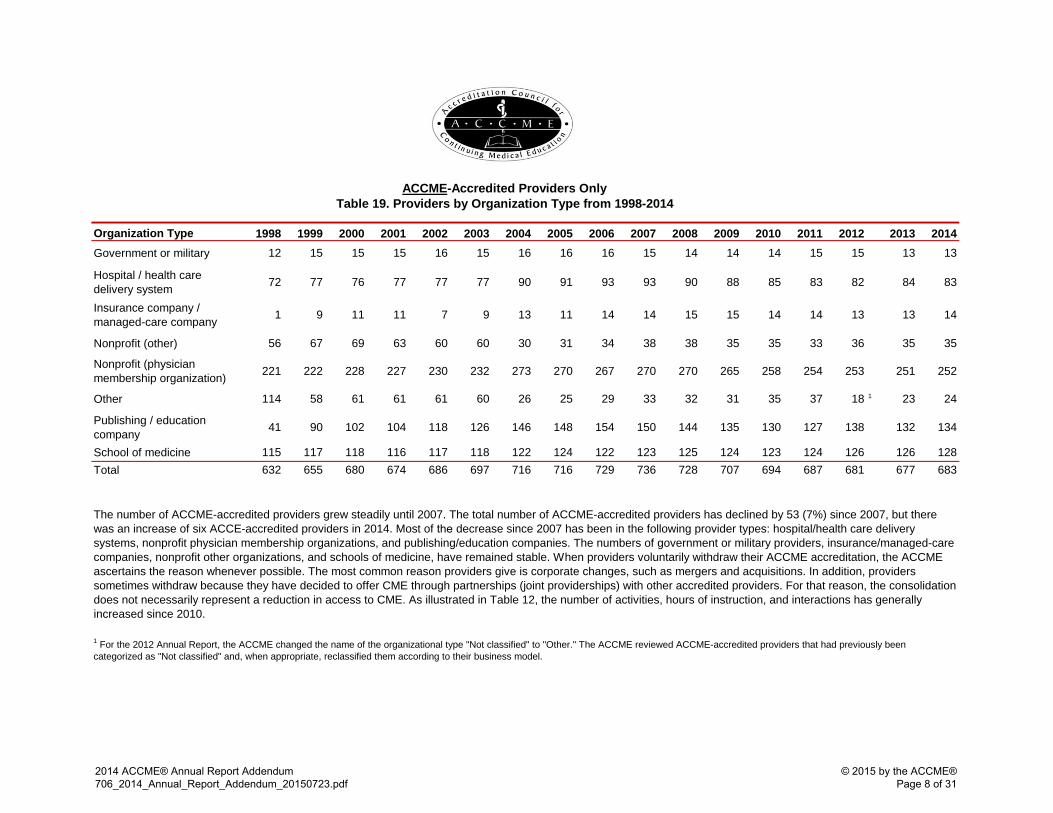
ACCME-Accredited Providers OnlyTable 19. Providers by Organization Type from 1998-2014
The number of ACCME-accredited providers grew steadily until 2007. The total number of ACCME-accredited providers has declined by 53 (7%) since 2007, but there was an increase of six ACCE-accredited providers in 2014. Most of the decrease since 2007 has been in the following provider types: hospital/health care delivery systems, nonprofit physician membership organizations, and publishing/education companies. The numbers of government or military providers, insurance/managed-care companies, nonprofit other organizations, and schools of medicine, have remained stable. When providers voluntarily withdraw their ACCME accreditation, the ACCME ascertains the reason whenever possible. The most common reason providers give is corporate changes, such as mergers and acquisitions. In addition, providers sometimes withdraw because they have decided to offer CME through partnerships (joint providerships) with other accredited providers. For that reason, the consolidation does not necessarily represent a reduction in access to CME. As illustrated in Table 12, the number of activities, hours of instruction, and interactions has generally increased since 2010.
1 For the 2012 Annual Report, the ACCME changed the name of the organizational type "Not classified" to "Other." The ACCME reviewed ACCME-accredited providers that had previously been categorized as "Not classified" and, when appropriate, reclassified them according to their business model.
2014 ACCME® Annual Report Addendum 706_2014_Annual_Report_Addendum_20150723.pdf
© 2015 by the ACCME® Page 8 of 31

The ACCME's Accreditation Criteria require providers to produce educational activities that are designed to change competence, performance, or patient outcomes. Providers are then required to analyze the changes that were achieved as a result of the activities.
Figure 12 illustrates the percentage of CME provided in 2014 that was designed and/or analyzed for changes in competence, performance, and/or patient outcomes.
97%
58%
23%
93%
43%
9% 0%
10%
20%
30%
40%
50%
60%
70%
80%
90%
100%
Competence Performance Patientoutcomes
Activities
CME Presented by ACCME-Accredited Providers Only Figure 12. Percentages Designed/ Analyzed for Change in Competence, Performance, or Patient Outcomes - 2014
97%
62%
35%
92%
45%
12% 0%
10%
20%
30%
40%
50%
60%
70%
80%
90%
100%
Competence Performance Patientoutcomes
Hours of Instruction
97%
52%
23%
90%
40%
8% 0%
10%
20%
30%
40%
50%
60%
70%
80%
90%
100%
Competence Performance Patientoutcomes
Physician Interactions
98%
49%
24%
95%
36%
7% 0%
10%
20%
30%
40%
50%
60%
70%
80%
90%
100%
Competence Performance Patientoutcomes
Other Learner Interactions
Designed to change Analyzed for change
2014 ACCME® Annual Report Addendum706_2014_Annual_Report_Addendum_20150723.pdf
© 2015 by the ACCME®Page 9 of 31
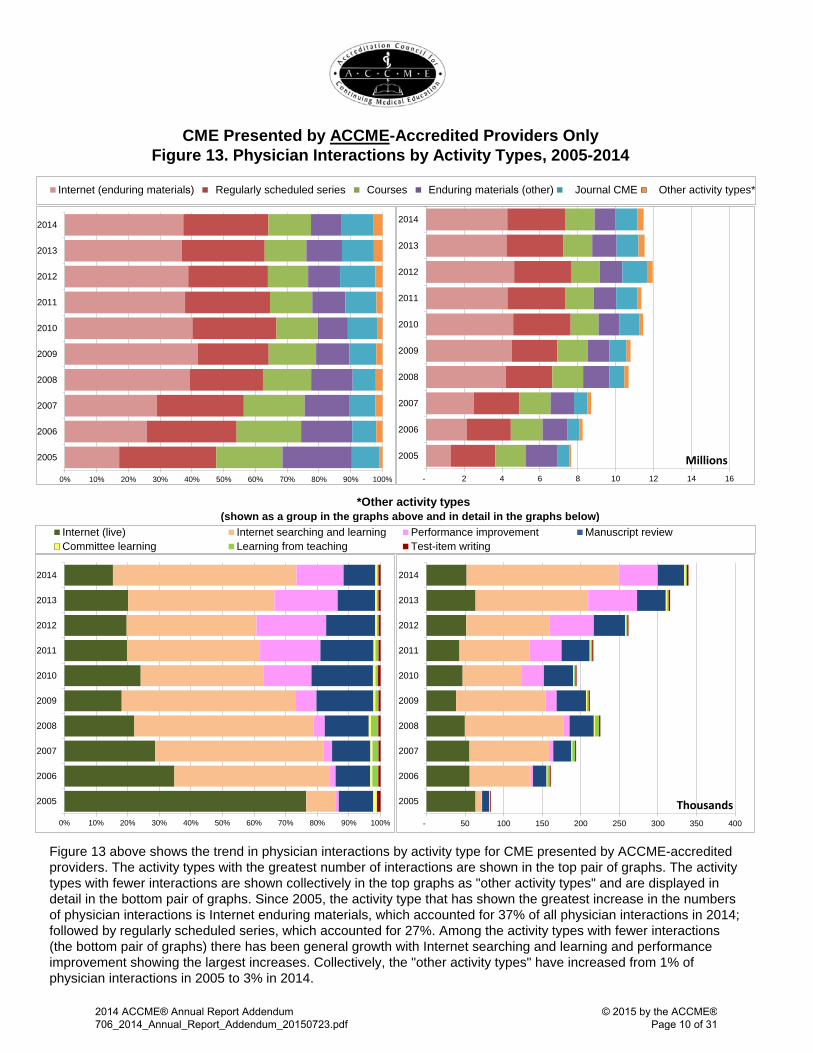
Figure 13. Physician Interactions by Activity Types, 2005-2014
*Other activity types (shown as a group in the graphs above and in detail in the graphs below)
CME Presented by ACCME-Accredited Providers Only
Figure 13 above shows the trend in physician interactions by activity type for CME presented by ACCME-accredited providers. The activity types with the greatest number of interactions are shown in the top pair of graphs. The activity types with fewer interactions are shown collectively in the top graphs as "other activity types" and are displayed in detail in the bottom pair of graphs. Since 2005, the activity type that has shown the greatest increase in the numbers of physician interactions is Internet enduring materials, which accounted for 37% of all physician interactions in 2014; followed by regularly scheduled series, which accounted for 27%. Among the activity types with fewer interactions (the bottom pair of graphs) there has been general growth with Internet searching and learning and performance improvement showing the largest increases. Collectively, the "other activity types" have increased from 1% of physician interactions in 2005 to 3% in 2014.
0% 10% 20% 30% 40% 50% 60% 70% 80% 90% 100%
2005
2006
2007
2008
2009
2010
2011
2012
2013
2014
0% 10% 20% 30% 40% 50% 60% 70% 80% 90% 100%
2005
2006
2007
2008
2009
2010
2011
2012
2013
2014
0%100%2005
Internet (enduring materials) Regularly scheduled series Courses Enduring materials (other) Journal CME Other activity types*
- 2 4 6 8 10 12 14 16
2005
2006
2007
2008
2009
2010
2011
2012
2013
2014
Millions
- 50 100 150 200 250 300 350 400
2005
2006
2007
2008
2009
2010
2011
2012
2013
2014
Thousands
0%100%1Internet (live) Internet searching and learning Performance improvement Manuscript review
Committee learning Learning from teaching Test-item writing
2014 ACCME® Annual Report Addendum 706_2014_Annual_Report_Addendum_20150723.pdf
© 2015 by the ACCME® Page 10 of 31

CME Presented by ACCME-Accredited Providers OnlyFigure 14. Other Learner Interactions by Activity Types, 2005-2014
*Other activity types (shown as a group in the graphs above and in detail in the graphs below)
Figure 14 above shows the trend in other learner interactions by activity type for CME presented by ACCME-accredited providers. The activity types with the greatest number of interactions are shown in the top pair of graphs. The activity types with fewer interactions are shown collectively in the top graphs as "other activity types" and are displayed in detail in the bottom pair of graphs. Since 2005, the activity type that has shown the greatest increase in the numbers of other learner interactions is Internet enduring materials. Among the activity types with fewer interactions (the bottom pair of graphs), Internet live activities remain the dominant format for other learners.
0% 10% 20% 30% 40% 50% 60% 70% 80% 90% 100%
2005
2006
2007
2008
2009
2010
2011
2012
2013
2014
70% 80% 90% 100%
2005
2006
2007
2008
2009
2010
2011
2012
2013
2014
0%100%2005
Internet (enduring materials) Regularly scheduled series Courses Enduring materials (other) Journal CME Other activity types*
- 2 4 6 8 10 12 14 16
2005
2006
2007
2008
2009
2010
2011
2012
2013
2014
Millions
- 50 100 150 200 250 300 350 400
2005
2006
2007
2008
2009
2010
2011
2012
2013
2014
Thousands
0%100%1Internet (live) Internet searching and learning Performance improvement Manuscript review
Committee learning Learning from teaching Test-item writing
2014 ACCME® Annual Report Addendum706_2014_Annual_Report_Addendum_20150723.pdf
© 2015 by the ACCME®Page 11 of 31
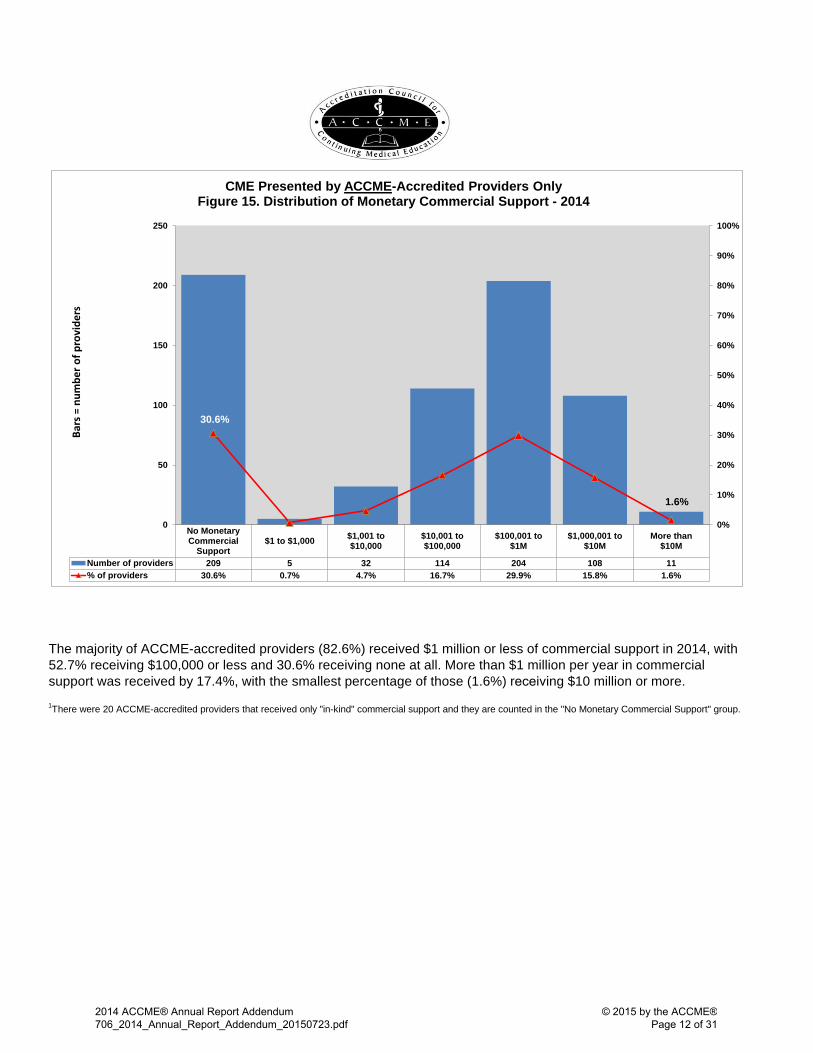
The majority of ACCME-accredited providers (82.6%) received $1 million or less of commercial support in 2014, with 52.7% receiving $100,000 or less and 30.6% receiving none at all. More than $1 million per year in commercial support was received by 17.4%, with the smallest percentage of those (1.6%) receiving $10 million or more. 1There were 20 ACCME-accredited providers that received only "in-kind" commercial support and they are counted in the "No Monetary Commercial Support" group.
No MonetaryCommercial
Support$1 to $1,000 $1,001 to
$10,000$10,001 to$100,000
$100,001 to$1M
$1,000,001 to$10M
More than$10M
Number of providers 209 5 32 114 204 108 11% of providers 30.6% 0.7% 4.7% 16.7% 29.9% 15.8% 1.6%
30.6%
1.6%
0%
10%
20%
30%
40%
50%
60%
70%
80%
90%
100%
0
50
100
150
200
250
Bars
= n
umbe
r of p
rovi
ders
CME Presented by ACCME-Accredited Providers Only Figure 15. Distribution of Monetary Commercial Support - 2014
2014 ACCME® Annual Report Addendum706_2014_Annual_Report_Addendum_20150723.pdf
© 2015 by the ACCME®Page 12 of 31

ActivitiesHours of
instructionPhysician
InteractionsOther learners
InteractionsCourses 46,669 322,035 1,536,207 1,236,075Regularly scheduled series 11,472 314,383 3,073,434 1,478,496Internet (live) 3,712 7,522 52,104 136,116Test-item writing 87 812 2,069 25Committee learning 274 958 3,307 579Performance improvement 351 6,794 50,503 3,514Internet searching and learning 58 533 197,141 10,929Internet (enduring materials) 32,412 61,641 4,275,372 5,549,826Enduring materials (other) 6,912 42,911 1,087,244 721,059Learning from teaching 22 248 1,515 64Journal CME 4,382 6,463 1,158,967 624,544Manuscript review 70 269 34,106 3,522Total 106,421 764,567 11,471,969 9,764,749
ActivitiesHours of
instructionPhysician
participantsOther
learnersCourses 38,449 257,400 817,075 748,006Regularly scheduled series 11,273 308,877 2,975,723 1,430,296Internet (live) 3,112 6,673 33,835 98,606Test-item writing 86 796 2,058 25Committee learning 274 958 3,307 579Performance improvement 305 6,049 46,516 2,369Internet searching and learning 52 526 194,592 9,883Internet (enduring materials) 26,853 55,256 3,020,227 4,148,397Enduring materials (other) 6,410 41,574 1,008,680 683,099Learning from teaching 21 243 1,497 54Journal CME 3,866 5,896 962,131 320,319Manuscript review 70 269 34,106 3,522Total 90,771 684,516 9,099,747 7,445,155
ActivitiesHours of
instructionPhysician
participantsOther
learnersCourses 8,220 64,634 719,132 488,069Regularly scheduled series 199 5,506 97,711 48,200Internet (live) 600 849 18,269 37,510Test-item writing 1 17 11 0Committee learning 0 0 0 0Performance improvement 46 745 3,987 1,145Internet searching and learning 6 7 2,549 1,046Internet (enduring materials) 5,559 6,385 1,255,145 1,401,429Enduring materials (other) 502 1,336 78,564 37,960Learning from teaching 1 5 18 10Journal CME 516 567 196,836 304,225Manuscript review 0 0 0 0Total 15,650 80,050 2,372,222 2,319,594
CME Presented by ACCME-Accredited Providers OnlyTable 20. Total Numbers of Activities, Hours, and Interactions - 2014
CME Presented by ACCME-Accredited Providers OnlyTable 22. Numbers of Activities, Hours, and Interactions with Commercial Support - 2014
CME Presented by ACCME-Accredited Providers OnlyTable 21. Numbers of Activities, Hours, and Interactions without Commercial Support - 2014
2014 ACCME® Annual Report Addendum 706_2014_Annual_Report_Addendum_20150723.pdf
© 2015 by the ACCME® Page 13 of 31

Directly provided ActivitiesHours of
instructionPhysician
interactions1Other learner2
interactions1
21,383 70,027 418,913 368,362 11,210 161,239 1,426,007 910,205
290 508 7,875 11,351 - - - - 298 677 4,801 2,288 112 1,399 2,514 1,787 24 98 549 25
1,521 3,083 54,367 347,740 1,472 2,878 38,205 20,883
114 379 1,378 973 197 452 2,941 2,239 - - - -
Total 36,621 240,738 1,957,550 1,665,853 Jointly provided
2,995 14,679 62,203 77,015 745 12,609 93,378 72,249 61 106 705 2,656
- - - - 3 8 112 6 7 92 48 116
- - - - 73 454 8,603 2,789 68 239 4,546 1,651 13 44 162 314 17 81 411 120
- - - - Total 3,982 28,310 170,168 156,916
# ProvidersGrand total 20143 1,225 40,603 269,049 2,127,718 1,822,769
Grand total 20133 1,273 41,949 302,400 2,246,040 1,969,173
Grand total 20123 1,319 41,528 299,591 2,367,442 1,685,758
Grand total 2011 1,392 44,590 285,655 2,390,496 1,620,292
Grand total 2010 1,450 46,337 293,514 2,380,631 1,608,998
Grand total 2009 1,518 48,212 299,845 2,483,827 1,569,361
Grand total 2008 1,601 49,435 322,238 2,551,540 1,601,348
Grand total 20074 1,663 49,866 344,306 2,679,753 1,627,279
Grand total 2006 1,684 56,302 349,696 3,136,610 1,682,420
Grand total 2005 1,606 54,901 358,402 2,704,253 1,637,699
4The grand total number of activities decreased significantly from 2006 to 2007 due to clarification of ACCME’s definitions related to regularly scheduled series (RSS). Prior to 2007 providers reported each session within the series as an activity; since then they have reported each series (comprising multiple, ongoing sessions) as an activity. Please see the glossary at the end of this report for more information.
Committee learningPerformance improvementInternet searching and learningInternet (enduring materials)Enduring materials (other)Learning from teachingJournal CMEManuscript review
1Accredited providers report the number of participants at each activity. In this report, the participant numbers are referred to as interactions. The data represents aggregate numbers of interactions and not the number of unique participants. Participants attending multiple activities are counted multiple times.
2Effective with the 2014 reporting year, other learners replaces the term nonphysician participants. This category continues to include activity participants other than MDs and DOs.
3In 2012, 21 of the 43 state medical societies recognized as accreditors by the ACCME chose to use the Program and Activity Reporting System (PARS) for collecting data from their accredited providers, representing 576 of the 1,319 state-accredited providers. In 2013 PARS use increased to 29 of 43 accreditors representing 764 of the 1,273 state-accredited providers. In 2014 all 42 accreditors used PARS. The implementation of PARS enabled the accreditors to better ensure that providers submit data in accordance with the ACCME’s definitions and terms. This resulted in significant changes in reporting for various activity formats.
Test-item writing
Committee learningPerformance improvementInternet searching and learningInternet (enduring materials)Enduring materials (other)Learning from teachingJournal CMEManuscript review
CoursesRegularly scheduled seriesInternet (live)
Test-item writing
CME Presented by State-Accredited Providers Only Table 23. Size of the CME Enterprise - 2014
n=1,225 Providers
CoursesRegularly scheduled seriesInternet (live)
2014 ACCME® Annual Report Addendum706_2014_Annual_Report_Addendum_20150723.pdf
© 2015 by the ACCME®Page 14 of 31

CME Presented by State-Accredited Providers Only
Table 24. Activities by Organization and Activity Type - 2014
Organization typeGovernment or
military
Hospital / health care
delivery system
Insurance company /
managed-care company
Nonprofit (other)
Nonprofit (physician
membership organization) Other
Publishing / education company
School of medicine Grand total
# of Providers 23 999 13 62 90 33 4 1 1,225Directly provided
Courses 357 18,908 226 616 416 745 87 28 21,383Regularly scheduled series 104 10,773 0 197 58 29 37 12 11,210Internet (live) 10 231 1 2 20 25 0 1 290Test-item writing 0 0 0 0 0 0 0 0 0Committee learning 1 296 0 0 1 0 0 0 298Performance improvement 0 107 0 5 0 0 0 0 112Internet searching and learning 0 23 0 1 0 0 0 0 24Internet (enduring materials) 100 1,014 50 236 66 55 0 0 1,521Enduring materials (other) 10 1,296 31 10 1 123 1 0 1,472Learning from teaching 0 102 0 0 1 11 0 0 114Journal CME 0 195 0 0 0 2 0 0 197Manuscript review 0 0 0 0 0 0 0 0 0Total 582 32,945 308 1,067 563 990 125 41 36,621
Jointly providedCourses 55 2,009 35 380 342 169 2 3 2,995Regularly scheduled series 0 543 0 93 84 5 0 20 745Internet (live) 0 30 6 21 2 2 0 0 61Test-item writing 0 0 0 0 0 0 0 0 0Committee learning 0 3 0 0 0 0 0 0 3Performance improvement 0 5 0 2 0 0 0 0 7Internet searching and learning 0 0 0 0 0 0 0 0 0Internet (enduring materials) 4 39 0 25 1 4 0 0 73Enduring materials (other) 0 39 0 20 1 8 0 0 68Learning from teaching 0 8 0 0 0 5 0 0 13Journal CME 0 16 0 1 0 0 0 0 17Manuscript review 0 0 0 0 0 0 0 0 0Total 59 2,692 41 542 430 193 2 23 3,982
Grand total 641 35,637 349 1,609 993 1,183 127 64 40,603
2014 ACCME® Annual Report Addendum706_2014_Annual_Report_Addendum_20150722.pdf
© 2015 by the ACCME®
Page 15 of 31
2014 ACCME® Annual Report Addendum 706_2014_Annual_Report_Addendum_20150723.pdf
© 2015 by the ACCME® Page 15 of 31
CME Presented by State-Accredited Providers Only
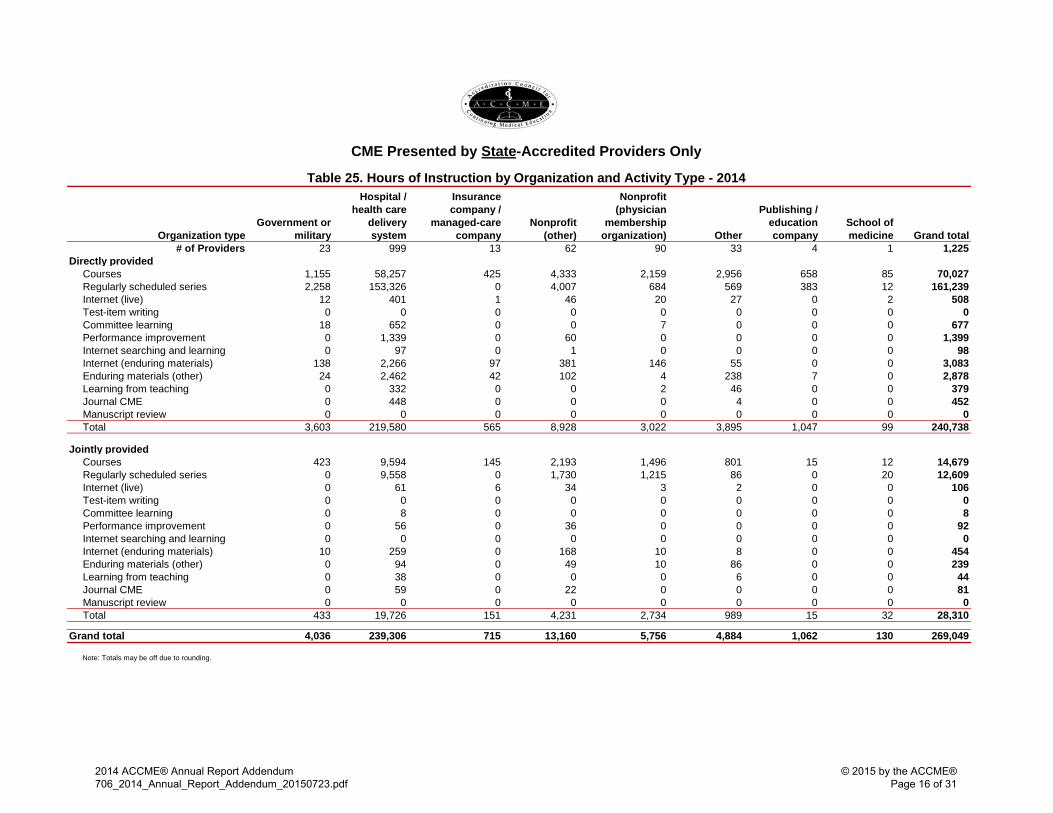
Table 25. Hours of Instruction by Organization and Activity Type - 2014
Organization typeGovernment or
military
Hospital / health care
delivery system
Insurance company /
managed-care company
Nonprofit (other)
Nonprofit (physician
membership organization) Other
Publishing / education company
School of medicine Grand total
# of Providers 23 999 13 62 90 33 4 1 1,225Directly provided
Courses 1,155 58,257 425 4,333 2,159 2,956 658 85 70,027Regularly scheduled series 2,258 153,326 0 4,007 684 569 383 12 161,239Internet (live) 12 401 1 46 20 27 0 2 508Test-item writing 0 0 0 0 0 0 0 0 0Committee learning 18 652 0 0 7 0 0 0 677Performance improvement 0 1,339 0 60 0 0 0 0 1,399Internet searching and learning 0 97 0 1 0 0 0 0 98Internet (enduring materials) 138 2,266 97 381 146 55 0 0 3,083Enduring materials (other) 24 2,462 42 102 4 238 7 0 2,878Learning from teaching 0 332 0 0 2 46 0 0 379Journal CME 0 448 0 0 0 4 0 0 452Manuscript review 0 0 0 0 0 0 0 0 0Total 3,603 219,580 565 8,928 3,022 3,895 1,047 99 240,738
Jointly providedCourses 423 9,594 145 2,193 1,496 801 15 12 14,679Regularly scheduled series 0 9,558 0 1,730 1,215 86 0 20 12,609Internet (live) 0 61 6 34 3 2 0 0 106Test-item writing 0 0 0 0 0 0 0 0 0Committee learning 0 8 0 0 0 0 0 0 8Performance improvement 0 56 0 36 0 0 0 0 92Internet searching and learning 0 0 0 0 0 0 0 0 0Internet (enduring materials) 10 259 0 168 10 8 0 0 454Enduring materials (other) 0 94 0 49 10 86 0 0 239Learning from teaching 0 38 0 0 0 6 0 0 44Journal CME 0 59 0 22 0 0 0 0 81Manuscript review 0 0 0 0 0 0 0 0 0Total 433 19,726 151 4,231 2,734 989 15 32 28,310
Grand total 4,036 239,306 715 13,160 5,756 4,884 1,062 130 269,049
Note: Totals may be off due to rounding.
2014 ACCME® Annual Report Addendum706_2014_Annual_Report_Addendum_20150723.pdf
© 2015 by the ACCME®Page 16 of 31

CME Presented by State-Accredited Providers Only
Table 26. Physician Interactions by Organization and Activity Type - 2014
Organization typeGovernment or
military
Hospital / health care
delivery system
Insurance company /
managed-care company
Nonprofit (other)
Nonprofit (physician
membership organization) Other
Publishing / education company
School of medicine Grand total
# of Providers 23 999 13 62 90 33 4 1 1,225Directly provided
Courses 4,482 355,309 7,274 14,666 28,169 8,117 463 433 418,913Regularly scheduled series 6,201 1,379,323 0 34,276 2,648 1,449 1,982 128 1,426,007Internet (live) 1,937 2,699 116 659 531 1,928 0 5 7,875Test-item writing 0 0 0 0 0 0 0 0 0Committee learning 97 4,584 0 0 120 0 0 0 4,801Performance improvement 0 1,968 0 546 0 0 0 0 2,514Internet searching and learning 0 514 0 35 0 0 0 0 549Internet (enduring materials) 3,474 21,197 8,173 5,346 707 15,470 0 0 54,367Enduring materials (other) 35 32,241 1,366 774 0 3,604 185 0 38,205Learning from teaching 0 1,356 0 0 2 20 0 0 1,378Journal CME 0 2,922 0 0 0 19 0 0 2,941Manuscript review 0 0 0 0 0 0 0 0 0Total 16,226 1,802,113 16,929 56,302 32,177 30,607 2,630 566 1,957,550
Jointly providedCourses 511 36,219 1,140 10,200 10,685 3,419 15 14 62,203Regularly scheduled series 0 71,917 0 7,120 13,434 433 0 474 93,378Internet (live) 0 342 138 205 13 7 0 0 705Test-item writing 0 0 0 0 0 0 0 0 0Committee learning 0 112 0 0 0 0 0 0 112Performance improvement 0 47 0 1 0 0 0 0 48Internet searching and learning 0 0 0 0 0 0 0 0 0Internet (enduring materials) 14 8,186 0 313 48 42 0 0 8,603Enduring materials (other) 0 3,367 0 737 26 416 0 0 4,546Learning from teaching 0 159 0 0 0 3 0 0 162Journal CME 0 346 0 65 0 0 0 0 411Manuscript review 0 0 0 0 0 0 0 0 0Total 525 120,695 1,278 18,641 24,206 4,320 15 488 170,168
Grand total 16,751 1,922,808 18,207 74,943 56,383 34,927 2,645 1,054 2,127,718
2014 ACCME® Annual Report Addendum 706_2014_Annual_Report_Addendum_20150723.pdf
© 2015 by the ACCME® Page 17 of 31

CME Presented by State-Accredited Providers Only
Table 27. Other Learner Interactions by Organization and Activity Type - 2014
Organization typeGovernment or
military
Hospital / health care
delivery system
Insurance company /
managed-care company
Nonprofit (other)
Nonprofit (physician
membership organization) Other
Publishing / education company
School of medicine Grand total
# of Providers 23 999 13 62 90 33 4 1 1,225Directly provided
Courses 12,659 309,659 1,461 19,908 8,095 12,235 2,814 1,531 368,362Regularly scheduled series 5,820 878,893 0 16,366 3,590 1,453 1,612 2,471 910,205Internet (live) 1,998 4,971 0 265 717 3,388 0 12 11,351Test-item writing 0 0 0 0 0 0 0 0 0Committee learning 0 2,168 0 0 120 0 0 0 2,288Performance improvement 0 1,241 0 546 0 0 0 0 1,787Internet searching and learning 0 25 0 0 0 0 0 0 25Internet (enduring materials) 40,976 25,661 674 261,821 152 18,456 0 0 347,740Enduring materials (other) 505 17,731 111 219 1 2,230 86 0 20,883Learning from teaching 0 957 0 0 0 16 0 0 973Journal CME 0 2,239 0 0 0 0 0 0 2,239Manuscript review 0 0 0 0 0 0 0 0 0Total 61,958 1,243,545 2,246 299,125 12,675 37,778 4,512 4,014 1,665,853
Jointly providedCourses 3,187 53,427 610 10,165 6,779 2,769 11 67 77,015Regularly scheduled series 0 58,999 0 5,554 7,549 134 0 13 72,249Internet (live) 0 545 790 1,307 5 9 0 0 2,656Test-item writing 0 0 0 0 0 0 0 0 0Committee learning 0 6 0 0 0 0 0 0 6Performance improvement 0 115 0 1 0 0 0 0 116Internet searching and learning 0 0 0 0 0 0 0 0 0Internet (enduring materials) 463 1,214 0 642 15 455 0 0 2,789Enduring materials (other) 0 1,128 0 378 37 108 0 0 1,651Learning from teaching 0 310 0 0 0 4 0 0 314Journal CME 0 120 0 0 0 0 0 0 120Manuscript review 0 0 0 0 0 0 0 0 0Total 3,650 115,864 1,400 18,047 14,385 3,479 11 80 156,916
Grand total 65,608 1,359,409 3,646 317,172 27,060 41,257 4,523 4,094 1,822,769
2014 ACCME® Annual Report Addendum 706_2014_Annual_Report_Addendum_20150723.pdf
© 2015 by the ACCME® Page 18 of 31

Total incomeIncome from other
sources2
Total monetary commercial
supportAdvertising and exhibits income Total expense
Average 102,631$ 80,345$ 8,163$ 14,123$ 113,168$ First Quartile3 4,450$ 1,825$ -$ -$ 14,571$ Second Quartile (Median)3 38,461$ 28,142$ -$ -$ 48,031$ Third Quartile 107,105$ 86,047$ 800$ 5,280$ 118,917$ Total 125,723,146$ 98,422,211$ 10,000,029$ 17,300,906$ 138,630,521$ Providers reporting data > $0 1,005$ 967$ 316$ 396$ 1,164$
3More than half of state-accredited providers reported no monetary commercial support or advertising and exhibit income. Therefore the first and second quartiles for these categories is zero.
CME Presented by State-Accredited Providers Only Table 28. Income and Expense1 - 2014
Total providers = 1,225
1Accreditors ask providers to report the income and expenses for their individual activities and their overall CME programs. Accreditors do not ask providers to calculate profit. Due to the variety of organizational types and their accounting systems, readers cannot accurately determine or make assumptions about the profitability of CME or cost per participant or interaction based on this data.
2Income from other sources represents income other than commercial support and advertising and exhibits income. Examples of Income from other sources include participant registration fees, government grants, private donations, and allocations from a provider's parent organization or other internal departments.
2014 ACCME® Annual Report Addendum706_2014_Annual_Report_Addendum_20150723.pdf
© 2015 by the ACCME®Page 19 of 31
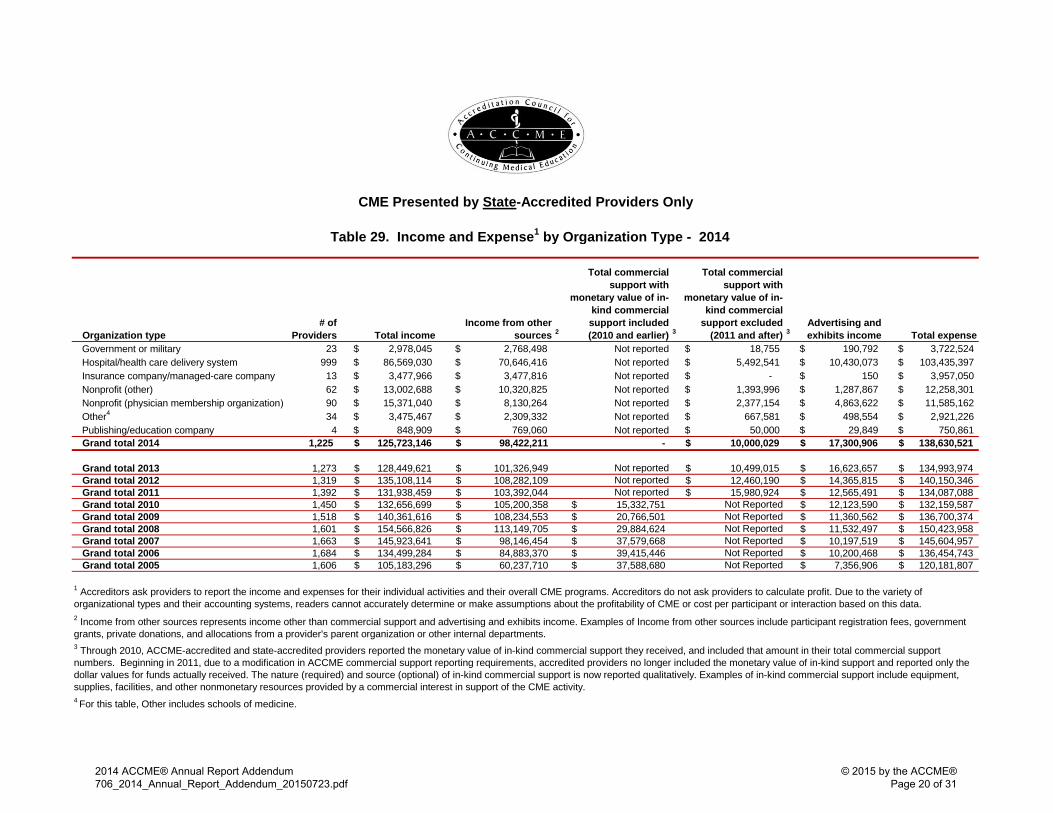
Table 29. Income and Expense1 by Organization Type - 2014
Organization type# of
Providers Total income Income from other
sources 2
Total commercial support with
monetary value of in-kind commercial support included (2010 and earlier) 3
Total commercial support with
monetary value of in-kind commercial
support excluded (2011 and after) 3
Advertising and exhibits income Total expense
23 $ 2,978,045 $ 2,768,498 Not reported $ 18,755 $ 190,792 $ 3,722,524 999 $ 86,569,030 $ 70,646,416 Not reported $ 5,492,541 $ 10,430,073 $ 103,435,397 13 $ 3,477,966 $ 3,477,816 Not reported $ - $ 150 $ 3,957,050 62 $ 13,002,688 $ 10,320,825 Not reported $ 1,393,996 $ 1,287,867 $ 12,258,301 90 $ 15,371,040 $ 8,130,264 Not reported $ 2,377,154 $ 4,863,622 $ 11,585,162 34 $ 3,475,467 $ 2,309,332 Not reported $ 667,581 $ 498,554 $ 2,921,226
Government or militaryHospital/health care delivery systemInsurance company/managed-care company Nonprofit (other)Nonprofit (physician membership organization) Other4
Publishing/education company 4 $ 848,909 $ 769,060 Not reported $ 50,000 $ 29,849 $ 750,861 Grand total 2014 1,225 125,723,146$ 98,422,211$ - 10,000,029$ 17,300,906$ 138,630,521$
Grand total 2013 1,273 128,449,621$ 101,326,949$ Not reported 10,499,015$ 16,623,657$ 134,993,974$ Grand total 2012 1,319 135,108,114$ 108,282,109$ Not reported 12,460,190$ 14,365,815$ 140,150,346$ Grand total 2011 1,392 131,938,459$ 103,392,044$ Not reported 15,980,924$ 12,565,491$ 134,087,088$ Grand total 2010 1,450 132,656,699$ 105,200,358$ 15,332,751$ Not Reported 12,123,590$ 132,159,587$ Grand total 2009 1,518 140,361,616$ 108,234,553$ 20,766,501$ Not Reported 11,360,562$ 136,700,374$ Grand total 2008 1,601 154,566,826$ 113,149,705$ 29,884,624$ Not Reported 11,532,497$ 150,423,958$ Grand total 2007 1,663 145,923,641$ 98,146,454$ 37,579,668$ Not Reported 10,197,519$ 145,604,957$ Grand total 2006 1,684 134,499,284$ 84,883,370$ 39,415,446$ Not Reported 10,200,468$ 136,454,743$ Grand total 2005 1,606 105,183,296$ 60,237,710$ 37,588,680$ Not Reported 7,356,906$ 120,181,807$
CME Presented by State-Accredited Providers Only
1 Accreditors ask providers to report the income and expenses for their individual activities and their overall CME programs. Accreditors do not ask providers to calculate profit. Due to the variety of organizational types and their accounting systems, readers cannot accurately determine or make assumptions about the profitability of CME or cost per participant or interaction based on this data. 2 Income from other sources represents income other than commercial support and advertising and exhibits income. Examples of Income from other sources include participant registration fees, government grants, private donations, and allocations from a provider's parent organization or other internal departments.3 Through 2010, ACCME-accredited and state-accredited providers reported the monetary value of in-kind commercial support they received, and included that amount in their total commercial support numbers. Beginning in 2011, due to a modification in ACCME commercial support reporting requirements, accredited providers no longer included the monetary value of in-kind support and reported only the dollar values for funds actually received. The nature (required) and source (optional) of in-kind commercial support is now reported qualitatively. Examples of in-kind commercial support include equipment, supplies, facilities, and other nonmonetary resources provided by a commercial interest in support of the CME activity. 4 For this table, Other includes schools of medicine.
2014 ACCME® Annual Report Addendum706_2014_Annual_Report_Addendum_20150723.pdf
© 2015 by the ACCME®Page 20 of 31
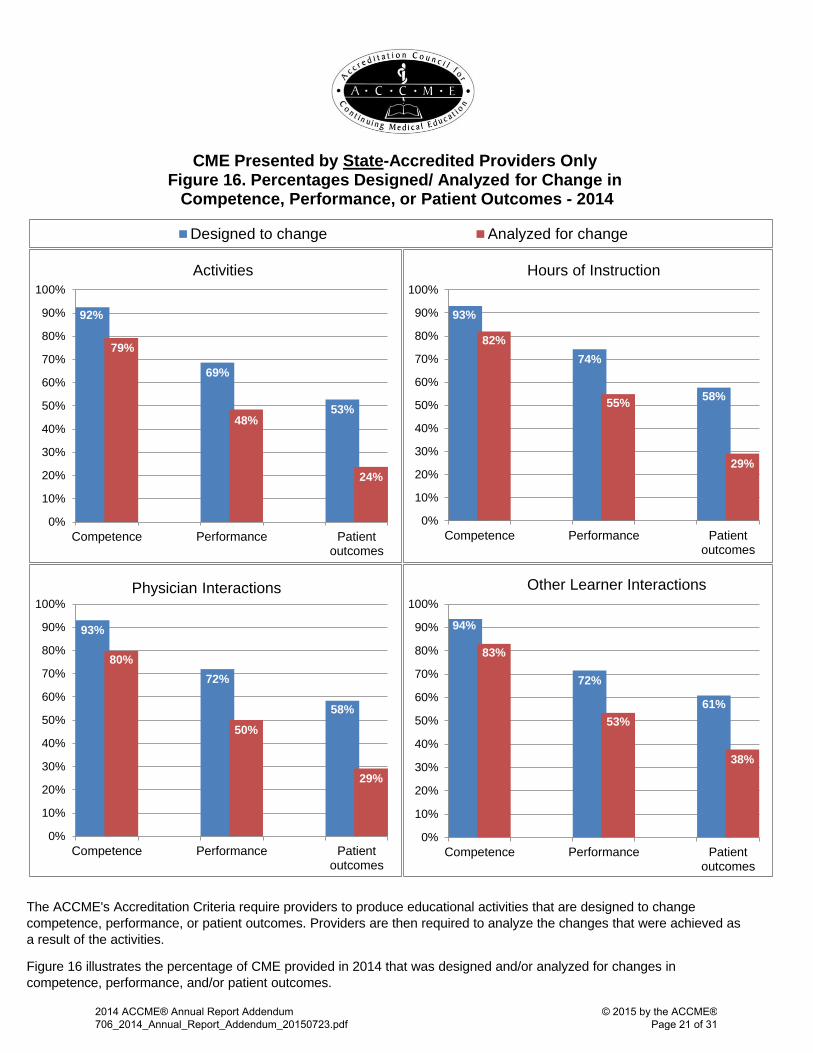
The ACCME's Accreditation Criteria require providers to produce educational activities that are designed to change competence, performance, or patient outcomes. Providers are then required to analyze the changes that were achieved as a result of the activities.
Figure 16 illustrates the percentage of CME provided in 2014 that was designed and/or analyzed for changes in competence, performance, and/or patient outcomes.
92%
69%
53%
79%
48%
24%
0%
10%
20%
30%
40%
50%
60%
70%
80%
90%
100%
Competence Performance Patientoutcomes
Activities
CME Presented by State-Accredited Providers Only Figure 16. Percentages Designed/ Analyzed for Change in Competence, Performance, or Patient Outcomes - 2014
93%
74%
58%
82%
55%
29%
0%
10%
20%
30%
40%
50%
60%
70%
80%
90%
100%
Competence Performance Patientoutcomes
Hours of Instruction
93%
72%
58%
80%
50%
29%
0%
10%
20%
30%
40%
50%
60%
70%
80%
90%
100%
Competence Performance Patientoutcomes
Physician Interactions
94%
72%
61%
83%
53%
38%
0%
10%
20%
30%
40%
50%
60%
70%
80%
90%
100%
Competence Performance Patientoutcomes
Other Learner Interactions
Designed to change Analyzed for change
2014 ACCME® Annual Report Addendum 706_2014_Annual_Report_Addendum_20150723.pdf
© 2015 by the ACCME® Page 21 of 31

Figure 17. Physician Interactions by Activity Types, 2005-2014
*Other activity types (shown as a group in the graphs above and in detail in the graphs below)
CME Presented by State-Accredited Providers Only
Figure 17 above shows the trend in physician interactions by activity type for CME presented by state-accredited providers. The activity types with the greatest number of interactions are shown in the top pair of graphs. The activity types with fewer interactions are shown collectively in the top graphs as "other activity types" and are displayed in detail in the bottom pair of graphs. Since 2005, the activity type that has consistently had the greatest number of physician interactions is regularly scheduled series which accounted for over 71% of all physician interactions presented by state-accredited providers in 2014, followed by courses with nearly 23%. Among the activity types with fewer interactions (the bottom pair of graphs) Internet live activities have the most physician interactions, followed by performance improvement.
0% 10% 20% 30% 40% 50% 60% 70% 80% 90% 100%
2005
2006
2007
2008
2009
2010
2011
2012
2013
2014
0% 10% 20% 30% 40% 50% 60% 70% 80% 90% 100%
2005
2006
2007
2008
2009
2010
2011
2012
2013
2014
0%100%2005
Internet (enduring materials) Regularly scheduled series Courses Enduring materials (other) Journal CME Other activity types*
- 2 4 6 8 10 12 14 16
2005
2006
2007
2008
2009
2010
2011
2012
2013
2014
Millions
- 50 100 150 200 250 300 350 400
2005
2006
2007
2008
2009
2010
2011
2012
2013
2014
Thousands
0%100%1Internet (live) Internet searching and learning Performance improvement Manuscript review
Committee learning Learning from teaching Test-item writing
2014 ACCME® Annual Report Addendum 706_2014_Annual_Report_Addendum_20150723.pdf
© 2015 by the ACCME® Page 22 of 31

CME Presented by State-Accredited Providers OnlyFigure 18. Other Learner Interactions by Activity Types, 2005-2014
*Other activity types (shown as a group in the graphs above and in detail in the graphs below)
Figure 18 above shows the trend in other learner interactions by activity type for CME presented by state-accredited providers. The activity types with the greatest number of interactions are shown in the top pair of graphs. The activity types with fewer interactions are shown collectively in the top graphs as "other activity types" and are displayed in detail in the bottom pair of graphs. Since 2005, the activity type that has consistently had the greatest number of other learner interactions is regularly scheduled series which accounted for about 54% of all other learner interactions presented by state-accredited providers in 2014. This is followed by courses with about 24%, and Internet enduring materials with about 19%. Among the activity types with fewer interactions (the bottom pair of graphs) Internet live activities have the most other learner interactions.
0% 10% 20% 30% 40% 50% 60% 70% 80% 90% 100%
2005
2006
2007
2008
2009
2010
2011
2012
2013
2014
0% 10% 20% 30% 40% 50% 60% 70% 80% 90% 100%
2005
2006
2007
2008
2009
2010
2011
2012
2013
2014
0%100%2005
Internet (enduring materials) Regularly scheduled series Courses Enduring materials (other) Journal CME Other activity types*
- 2 4 6 8 10 12 14 16
2005
2006
2007
2008
2009
2010
2011
2012
2013
2014
Millions
- 50 100 150 200 250 300 350 400
2005
2006
2007
2008
2009
2010
2011
2012
2013
2014
Thousands
0%100%1Internet (live) Internet searching and learning Performance improvement Manuscript review
Committee learning Learning from teaching Test-item writing
2014 ACCME® Annual Report Addendum 706_2014_Annual_Report_Addendum_20150723.pdf
© 2015 by the ACCME® Page 23 of 31
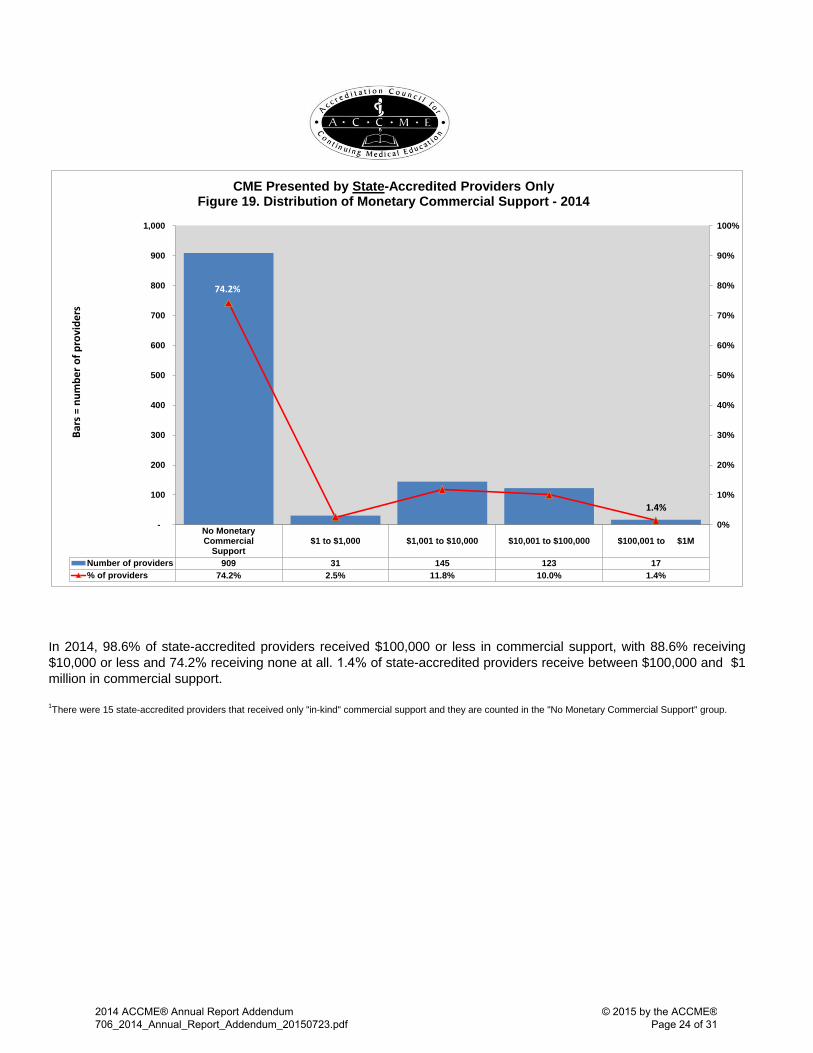
In 2014, 98.6% of state-accredited providers received $100,000 or less in commercial support, with 88.6% receiving $10,000 or less and 74.2% receiving none at all. 1.4% of state-accredited providers receive between $100,000 and $1 million in commercial support.
1There were 15 state-accredited providers that received only "in-kind" commercial support and they are counted in the "No Monetary Commercial Support" group.
No MonetaryCommercial
Support$1 to $1,000 $1,001 to $10,000 $10,001 to $100,000 $100,001 to $1M
Number of providers 909 31 145 123 17% of providers 74.2% 2.5% 11.8% 10.0% 1.4%
74.2%
1.4%
0%
10%
20%
30%
40%
50%
60%
70%
80%
90%
100%
-
100
200
300
400
500
600
700
800
900
1,000
Bars
= n
umbe
r of p
rovi
ders
CME Presented by State-Accredited Providers Only Figure 19. Distribution of Monetary Commercial Support - 2014
2014 ACCME® Annual Report Addendum 706_2014_Annual_Report_Addendum_20150723.pdf
© 2015 by the ACCME® Page 24 of 31
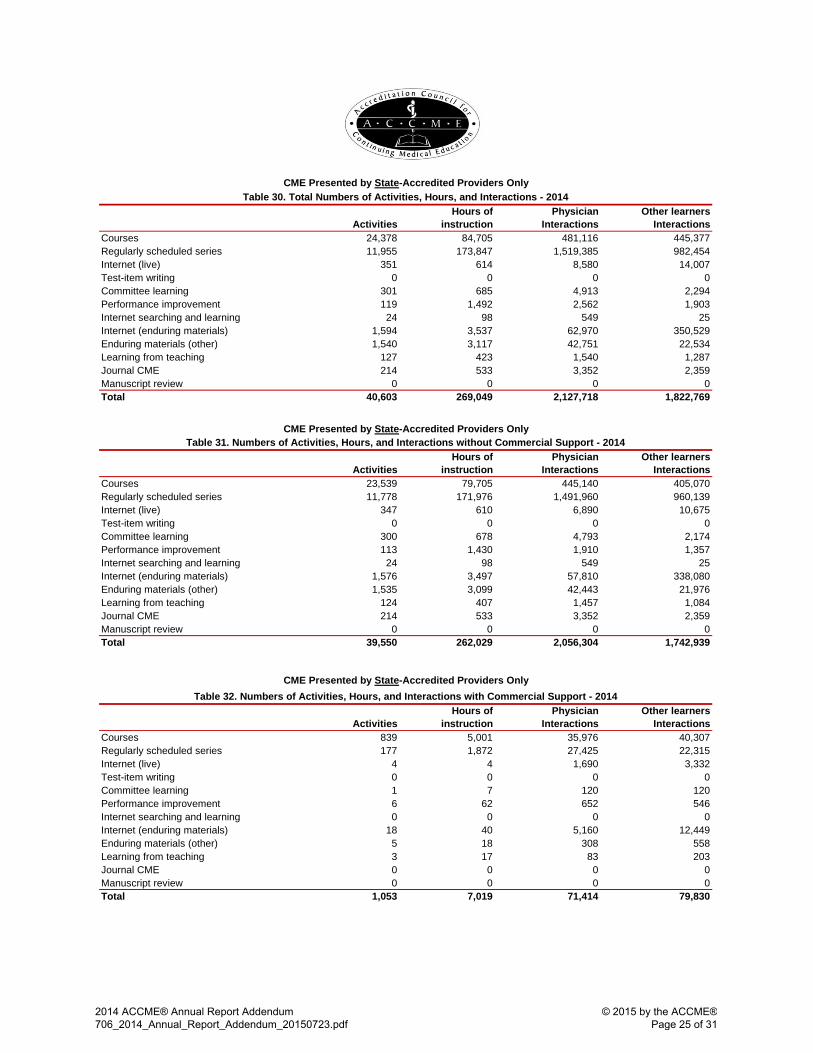
ActivitiesHours of
instructionPhysician
InteractionsOther learners
InteractionsCourses 24,378 84,705 481,116 445,377Regularly scheduled series 11,955 173,847 1,519,385 982,454Internet (live) 351 614 8,580 14,007Test-item writing 0 0 0 0Committee learning 301 685 4,913 2,294Performance improvement 119 1,492 2,562 1,903Internet searching and learning 24 98 549 25Internet (enduring materials) 1,594 3,537 62,970 350,529Enduring materials (other) 1,540 3,117 42,751 22,534Learning from teaching 127 423 1,540 1,287Journal CME 214 533 3,352 2,359Manuscript review 0 0 0 0Total 40,603 269,049 2,127,718 1,822,769
ActivitiesHours of
instructionPhysician
InteractionsOther learners
InteractionsCourses 23,539 79,705 445,140 405,070Regularly scheduled series 11,778 171,976 1,491,960 960,139Internet (live) 347 610 6,890 10,675Test-item writing 0 0 0 0Committee learning 300 678 4,793 2,174Performance improvement 113 1,430 1,910 1,357Internet searching and learning 24 98 549 25Internet (enduring materials) 1,576 3,497 57,810 338,080Enduring materials (other) 1,535 3,099 42,443 21,976Learning from teaching 124 407 1,457 1,084Journal CME 214 533 3,352 2,359Manuscript review 0 0 0 0Total 39,550 262,029 2,056,304 1,742,939
ActivitiesHours of
instructionPhysician
InteractionsOther learners
InteractionsCourses 839 5,001 35,976 40,307Regularly scheduled series 177 1,872 27,425 22,315Internet (live) 4 4 1,690 3,332Test-item writing 0 0 0 0Committee learning 1 7 120 120Performance improvement 6 62 652 546Internet searching and learning 0 0 0 0Internet (enduring materials) 18 40 5,160 12,449Enduring materials (other) 5 18 308 558Learning from teaching 3 17 83 203Journal CME 0 0 0 0Manuscript review 0 0 0 0Total 1,053 7,019 71,414 79,830
CME Presented by State-Accredited Providers OnlyTable 30. Total Numbers of Activities, Hours, and Interactions - 2014
CME Presented by State-Accredited Providers OnlyTable 32. Numbers of Activities, Hours, and Interactions with Commercial Support - 2014
CME Presented by State-Accredited Providers OnlyTable 31. Numbers of Activities, Hours, and Interactions without Commercial Support - 2014
2014 ACCME® Annual Report Addendum 706_2014_Annual_Report_Addendum_20150723.pdf
© 2015 by the ACCME® Page 25 of 31
ACCME® ANNUAL REPORT GLOSSARY
The terms and descriptions below only refer to organizations, programs, and activities within the ACCME Accreditation System. For more information, visit www.accme.org.
ACCME-accredited provider An organization accredited by the ACCME as a provider of continuing medical edu-
cation. ACCME-accredited providers represent a range of organizational types and offer CME primarily to national or international audiences of physicians and other health care professionals. See also state-accredited providers.
Advertising and exhibits income Advertising and exhibits are promotional activities and not continuing medical educa-
tion. Therefore, monies paid by commercial interests to providers for these promotional activities are not considered to be commercial support.
CME activity A CME activity is an educational offering that is planned, implemented, and evaluated in accordance with the ACCME Accreditation Criteria, Standards for Commercial Support, and policies.
Commercial interest A commercial interest, as defined by the ACCME, is any entity producing, marketing,re-selling, or distributing health care goods or services consumed by, or used on, pa-tients. The ACCME does not consider providers of clinical service directly to patients to be commercial interests. A commercial interest is not eligible for ACCME accreditation.
Commercial support Commercial support for a CME activity is monetary or in-kind contributions given by acommercial interest that is used to pay all or part of the costs of a CME activity. The re-quirements for receiving and managing commercial support are explained in the AC-CME Standards for Commercial SupportSM. Advertising and exhibit income is not con-sidered commercial support.
Committee learning Committee learning is a CME activity that involves a learner’s participation in a commit-tee process addressing a subject that would meet the ACCME definition of CME if it were taught or learned in another format.
Course A course is a live CME activity where the learner participates in person. A course is planned as an individual event. Examples: annual meeting, conference, seminar. For events with multiple sessions, such as annual meetings, accredited providers report one activity and calculate the hours of instruction by totaling the hours of all educa-tional sessions offered for CME credit. To calculate the numbers of learners, accredited providers report the number of learners registered for the overall event. Accredited pro-viders are not required to calculate participant totals from the individual sessions. If a course is held multiple times for multiple audiences, then each instance is reported as a separate activity.
Directly provided A directly provided activity is one that is planned, implemented, and evaluated by the accredited provider. This definition includes co-provided activities (offered by 2 accred-ited providers) reported by the accredited provider that awards the credit.
2014 ACCME® Annual Report Addendum 706_2014_Annual_Report_Addendum_20150723.pdf
© 2015 by the ACCME® Page 26 of 31

Enduring material (other) An enduring material is an activity that is printed or recorded and does not have a spe-
cific time or location designated for participation. Rather, the participant determines where and when to complete the activity. Sometimes providers will create an enduring material from a live CME activity. When this occurs, ACCME considers the provider to have created 2 separate activities—1 live ac-tivity and 1 enduring material activity. Both activities must comply with all ACCME re-quirements. Enduring materials can be available for less than a year, a year, or multiple years. Each enduring material is counted as 1 activity for each year it is available, whether it is ac-tive for the entire year or part of the year. The accredited provider reports the number of learners who participated during the year, as well as the required financial infor-mation related to the activity for that year. Accredited providers do not report cumula-tive data for an enduring material activity spanning multiple years. When reporting the number of participants for an enduring material activity, the accredited provider should count all learners who completed all or a portion of the activity and whose participa-tion can be verified in some manner. ACCME would not consider individuals that only received the enduring material activity but did not actually complete all or a portion of it to be participants.
Expenses Expenses are the total cost of goods, services, and facilities allocated to support the accredited provider’s CME program. Examples: amounts spent for CME staff salaries, faculty honoraria, and meeting space. Effective with the 2015 reporting year, the ACCME will no longer collect information about CME program expenses.
Hours of instruction Hours of instruction represents the total hours of educational instruction provided. For example, if a 1-day course lasts 8 hours (not including breaks or meals), then the total hours of instruction reported for that course is 8. Hours of instruction may or may not correspond to the number of credits designated for the American Medical Association Physician's Recognition Award. For activities taking place through the 2014 reporting year, accredited providers have the option to report the number of AMA PRA CATEGORY 1 CREDITS™ designated for activities. Effective with the 2015 reporting year, providers are required to report the number of credits, if AMA PRA Category 1 Credit is offered.
In-kind commercial support In-kind contributions are nonmonetary resources provided by a commercial interest in
support of a CME activity. Examples of in-kind support include equipment, supplies, and facilities.
Internet (enduring materials) An Internet enduring material activity is an "on demand activity," meaning that there is
no specific time designated for participation. Rather, the participant determines when to complete the activity. Examples: online interactive educational module, recorded presentation, podcast. Internet enduring materials can be available for less than a year, a year, or multiple years. Each Internet enduring material is counted as 1 activity for each year it is availa-ble, whether it is active for the entire year or part of the year. The accredited provider reports the number of learners who participated during the year, as well as the required financial information related to the activity for that year. Accredited providers do not report cumulative data for an Internet enduring material activity spanning multiple years. When reporting the number of participants for an Internet enduring material ac-tivity, the accredited provider should count all learners who completed all or a portion of the activity and whose participation can be verified in some manner. ACCME would not consider individuals that only downloaded or accessed the activity but did not ac-tually complete all or a portion of it to be participants.
2014 ACCME® Annual Report Addendum 706_2014_Annual_Report_Addendum_20150723.pdf
© 2015 by the ACCME® Page 27 of 31
Internet (live) An Internet live activity is an online course available via the Internet at a certain time on a certain date and is only available in real-time, just as if it were a course held in an au-ditorium. Once the event has taken place, learners may no longer participate in that activity unless it is again presented on a specific date and time and is only available in real-time. If an Internet live activity is presented on multiple occasions, each event is counted as one activity. Example: webcast.
Internet searching and learning Internet searching and learning CME is based on a learner identifying a problem in
practice and then researching the answer online using sources that are facilitated by an accredited provider. For the purposes of ACCME data collection, the ACCME in-cludes Internet point-of-care learning, as defined by the American Medical Association, in the category Internet searching and learning. Providers that offer Internet searching and learning CME aggregate their data from all learners and report it as a single activity. For hours of instruction, accredited providers specify the amount of time they believe a learner would take to complete the Internet searching and learning CME activity. The number of participants equals the total num-ber of persons who participated in Internet searching and learning as a CME activity. Each participant is counted once, regardless of how many times they participated or how many pages they viewed. For example, a provider offers Internet searching and learning CME and 50 physicians participate. Each physician spent 30 minutes participating in this activity. The accredit-ed provider reports this as 1 Internet searching and learning CME activity with 50 physi-cian participants and .5 hours of instruction.
Jointly provided A jointly-provided activity is planned, implemented, and evaluated by the accredited provider and a nonaccredited entity.
Joint Accreditation for Interprofessional Continuing Educa-tion™
Joint Accreditation offers organizations the opportunity to be simultaneously accredited to provide medicine, pharmacy, and nursing continuing education activities through a single, unified application process, fee structure, and set of accreditation standards. Joint Accreditation is a collaboration of the ACCME, the Accreditation Council for Pharmacy Education (ACPE), and the American Nurses Credentialing Center (ANCC).
Journal-based CME A journal-based CME activity includes the reading of an article (or adapted formats for special needs), a provider stipulated/learner directed phase (that may include reflec-tion, discussion, or debate about the material contained in the article(s), and a re-quirement for the completion by the learner of a pre-determined set of questions or tasks relating to the content of the material as part of the learning process. The ACCME does not consider a journal-based CME activity to have been completed until the learner documents participation in that activity to the provider. Each article is counted as one activity. To calculate hours of instruction, the accredited provider specifies the amount of time required to complete the activity. The number of participants reported by the accredited provider equals the total number of individuals who completed the activity. Each participant is counted once, regardless of how many times they worked on the activity. For example, an accredited provider produces a journal that contains an article that is designated as a journal-based CME activity. In total, 20 physicians read the article, re-flect on the content, and complete questions related to the content of the article. The physicians spend 1 hour on this activity. The provider would report this as one journal-based CME activity with 20 physician participants and 1 hour of instruction.
2014 ACCME® Annual Report Addendum 706_2014_Annual_Report_Addendum_20150723.pdf
© 2015 by the ACCME® Page 28 of 31

Learning from teaching Learning from teaching activities are personal learning projects designed and imple-
mented by the learner with facilitation from the accredited provider. The ACCME does not have special requirements for this activity type. The ACCME developed the learning from teaching label as a corollary to the AMA PRA CATEGORY 1 CREDITS™ awarded direct-ly to physicians for "Teaching at a live activity." To report learning from teaching CME, accredited providers aggregate the data from all learners and count it as a single activity. For hours of instruction, accredited providers specify the amount of time they believe a learner would take to complete the learning from teaching CME activity. The number of participants equals the number of individu-als who participated in this CME activity. Each participant is counted once, regardless of how many times they worked on the activity. For example, an accredited provider created a learning from teaching activity for 10 physicians. Each physician completed the CME activity in 2 hours. The accredited pro-vider reports this as 1 learning from teaching CME activity with 10 physician participants and 2 hours of instruction.
Manuscript review Manuscript review CME is based on a learner’s participation in a manuscript’s pre-publication review process. When calculating the number of manuscript review CME activities, accredited provid-ers report each journal for which the manuscript(s) is being reviewed as 1 activity re-gardless of the number of manuscripts or reviewers. For hours of instruction, accredited providers specify the amount of time they believe a learner would take to complete the manuscript review CME activity. The number of participants equals the total number of learners engaged in reviewing manuscripts as CME. Each participant is counted once regardless of how many manuscripts they reviewed. For example, an accredited provider publishes 1 journal. During the course of the year, 25 physicians reviewed manuscripts for this journal. Each physician spent 2 hours on the review. The accredited provider reports this as 1 manuscript review CME activity with 25 physician participants and 2 hours of instruction.
Nonphysician participants Please see other learners.
Other income Other income includes all income the accredited provider received for its CME activi-ties and CME program that does not fall under commercial support or advertising and exhibit income. The most common examples of other income include activity registra-tion fees, grants from government agencies or independent nonprofit foundations, and allocations from the accredited provider’s parent organization or other internal de-partments to pay for the CME unit’s expenses.
Other learners Beginning with the 2014 ACCME Annual Report, other learners replaces the term non-physician participants. This category continues to include activity participants other than MDs and DOs. Residents are included in this category.
2014 ACCME® Annual Report Addendum 706_2014_Annual_Report_Addendum_20150723.pdf
© 2015 by the ACCME® Page 29 of 31

Performance improvement Performance improvement CME is based on a learner’s participation in a project estab-
lished and/or guided by a CME provider. A physician identifies an educational need through a measure of his/her performance in practice, engages in educational experi-ences to meet the need, integrates the education into patient care, and then re-evaluates his/her performance. To report performance improvement CME, accredited providers count each learning project as 1 performance improvement CME activity, regardless of whether it is created for an individual physician or a group of physicians. For hours of instruction, accredited providers specify the amount of time they believe a learner would take to complete the performance improvement CME activity. The number of participants equals the total number of learners who participated in the learning project. Each participant is count-ed once, regardless of how many times they worked on the activity. For example, an accredited provider established a performance improvement learning project. Three physicians participated; each completed the learning project in 20 hours. The accredited provider reports this as 1 performance improvement CME activity with 3 physician participants and 20 hours of instruction.
Physician participants Physician participants are activity participants who are MDs or DOs. Residents are not
included in this category. They are included as other learners. Regularly scheduled series The ACCME defines a regularly scheduled series (RSS) as a course that is planned as a
series with multiple, ongoing sessions, e.g., offered weekly, monthly, or quarterly; and is primarily planned by and presented to the accredited organization’s professional staff. Examples include grand rounds, tumor boards, and morbidity and mortality confer-ences. Accredited providers report each RSS as 1 activity. In addition, accredited providers follow the following guidelines:
The cumulative number of hours for all sessions within a series equals the number of hours for that activity, and
Each learner is counted as a participant for each session he/she attends in the series. For example: Internal Medicine Grand Rounds is planned for the entire year as 1 series. Participants meet weekly during the year for 1 hour each week. The accredited provid-er reports the series as 1 activity with 52 hours of instruction. If 20 physicians participated in each session, total physician participants would be 1,040 (20 physicians per session multiplied by 52 sessions) for that single activity.
State-accredited provider State-accredited providers are accredited by a state/territory medical society that is
recognized by the ACCME as an accreditor. State-accredited providers offer CME pri-marily to learners from their state or contiguous states as opposed to ACCME-accredited providers, which offer CME primarily to national or international audiences.
2014 ACCME® Annual Report Addendum 706_2014_Annual_Report_Addendum_20150723.pdf
© 2015 by the ACCME® Page 30 of 31
Test-item writing Test-item writing is a CME activity based on a learner’s participation in the pre-publication development and review of any type of test item. Examples: multiple choice questions, standardized patient cases. Test-item writing CME activities may consist of either of the following processes: When questions are written for an item pool and are later used to build a variety of tests, then building the questions for a single pool is counted as 1 activity. Examples: the Pediatric Item Writing Committee of the National Board of Medical Examiners, or the second-year clerkship exams at a medical school. When questions, items, or cases are created for 1 specific test, then each test is count-ed as a separate CME activity. Example: multiple choice questions for the 2012 clerkship exam in pediatrics. For hours of instruction, accredited providers specify the amount of time they believe a learner would take to complete the test-item writing CME activity. The number of partic-ipants should equal the total number of persons who engaged in the test-item writing CME activity. Each participant is counted once regardless of how many test items they write. For example, an accredited provider planned a CME activity where 5 physicians wrote test items for an American Board of Medical Specialties (ABMS) member board certifi-cation examination question pool. Each physician completed the test-item writing CME activity in 10 hours. The accredited provider reports this as a test-item writing CME activi-ty with 5 physician participants and 10 hours of instruction.
2014 ACCME® Annual Report Addendum 706_2014_Annual_Report_Addendum_20150723.pdf
© 2015 by the ACCME® Page 31 of 31
Related Documents