CHAPTER 4 ACCOUNTS BY BRANCH OF ACTIVITY AND THE ECONOMIC SUMMARY TABLE

Welcome message from author
This document is posted to help you gain knowledge. Please leave a comment to let me know what you think about it! Share it to your friends and learn new things together.
Transcript

CHAPTER 4 ACCOUNTS BY BRANCH OF ACTIVITY AND THE ECONOMIC
SUMMARY TABLE


Methodology of quarterly national accounts 109
4 - ACCOUNTS BY BRANCH OF ACTIVITY AND THE ECONOMIC SUMMARY TABLE
4.1. Accounts by branch of activity
The national economy can be divided into economically homogenous units, that is, units which produce goods (or provide services) which fall within the same category of activity as defined in the French classification of activities (NAF). Grouping together these homogenous economic units allows to create branches of activity. These branches are not the same as sectors of activity, which cover autonomous economic units that may produce goods or provide services involving entirely different activities, but which are nonetheless classified with reference to their primary activity.
The activity levels of these branches are reflected in the output account and operating account.
4.1.1. The output account
The output account reflects the relationship between output and the intermediate consumption required for the production process. The difference between the two is value added, a measure of the wealth generated by this production process.
output – intermediate consumption =
value added
The output, intermediate consumption and value added for each branch are estimated in the input-output table. The level of detail used in producing these quarterly accounts involves, as for the supply-use balance, 48 branches. However, the level retained for publication is A17 (cf. previous chapter). As the volume-price division is established for the output and intermediate consumption of each branch, the output statistics are compiled and published in value and chained volume series. They are given as raw, SA (seasonally adjusted) and WDA-SA (adjusted for seasonal and working-day variation) data.
4.1.2. The operating account
The operating account makes clear what proportion of value added goes to paying employees’ wages and the applicable taxes on production. The remaining balance is known as the gross operating surplus, a measure of the operating profit of each branch.
value added – wages and salaries– employers’ social contributions – other taxes on production + other subsidies on production
= gross operating surplus
The most simplistic way to define gross operating surplus would be to say that it represents what remains of the value added once all remunerations (including employers’ social contributions) have been paid.
Operating accounts give only value figures, calculated at current prices: aside from value added, there is no volume-price division for the other aggregates. They are given in raw, SA (seasonally adjusted) and WDA-SA (adjusted for seasonal and working-day variation) form. Nonetheless, for many operations including wages and employment figures, there is no working-day adjustment.

Insee Méthodes 110
The operating account is often linked with accounts tracking levels of employment and number of hours worked. Joint analysis of value added and the corresponding workforce levels (or total number of hours worked) for each branch allows to calculate the apparent rate of productivity per worker (or per hour worked). The figures for total wages and total number of employees (or hours worked) allow to deduce the mean per capita wage (or the average hourly wage). These aggregates help evaluate the short-term dynamics of the various branches.
4.2. The economic summary table: institutional sectors
The economic summary table (EST) combines the accounts for the various economic agents, or institutional sectors. The EST tracks exchanges in cash or in kind between these agents, grouped together into six institutional sectors (Table 10): non-financial corporations (NFCs), financial corporations (FCs), general government (GG), ‘pure’ households and self-employed entrepreneurs, non-profit institutions serving households (NPISH) and the rest of the world (ROW). These six sectors are clearly defined in the ESA 95 classification (codes S11 to S15 for ‘resident sectors’, code S2 for the rest of the world).
Furthermore, separate accounts are drawn up and published using slightly different definitions of these sectors: self-employed entrepreneurs are either counted in with NFCs, with the resulting aggregate sector named ‘non-financial enterprises’ (NFEs), or combined with financial corporations to form the aggregate sector ‘financial enterprises’ (FEs).
Table 10: Summary of the different institutional sectors
Note: Operations' codes are international codes defined in the ESA except when in italics. Source: European System of national and regional Accounts (ESA) 1995 and quarterly national accounts
The economic summary table is composed of value data (there is no volume-price separation), and given in raw, SA (seasonally adjusted) and SA-WDA (adjusted for seasonal and working-day variation) data as well. As with the input-output table, only the SA-WDA data are published in the economic summary table.
The economic summary table can in fact be broken down into a series of tables, or accounts, which each serve to measure a corresponding balance (gross operating surplus, savings, etc.). Details of these operations are given in Table 11 and Appendices 12 and 13. Each account is divided into uses (debit) and resources (credit). With the exception of the output account (where output is calculated as the sum of value added and intermediate consumption), the balances of the different accounts are calculated as the difference between their corresponding uses and resources.
As with the accounts for the various branches, the accounts for individual institutional sectors can be broken down into a series of accounting balances. While the first two may be identical to the branch-by-branch data, others provide more specific details of the performance of each sector.
S1 Total economy
S11 Non-financial corporationsS12 Financial corporationsS13 General governmentS14 Households
S14A Unincorporated entreprisesincluded S14ANF Non financial unincorporated entreprisesincluded S14AF Financial unincorporated entreprises
S14B Households excluding unincorporated entreprisesS15 Non-profit institutions serving households (NPISHs)
NFE = S11 +S14ANF Non financial entreprisesFE = S12 +S14AF Financial entreprises
S2 Rest of the world

Methodology of quarterly national accounts 111
4.2.1. Production accounts
The value added by each branch of activity is estimated in the input-output table using their respective output (or production) figures. To make this data useful in the context of the EST, it needs to be broken down by institutional sector.
output – intermediate consumption =
value added
4.2.1.1. Value added by institutional sector
In sectors where a certain proportion of value added is non-tradable (general government, NPISH, households), this non-tradable component is estimated as the sum of costs incurred by production. These costs are included in the operating account, and consist of the total wages and salaries, employers’ social contributions (effective and imputed), other taxes less subsidies on production, and consumption of fixed capital (CFC). The underlying assumption is that non-tradable activities do not produce profit margins, with the exception of surpluses allocated to future capital renewal: gross operating surplus (GOS) is thus equivalent to consumption of fixed capital. CFC’s quarterly values are obtained by smoothing the annual figures.
With the exception of non-financial corporations, the tradable portion of value added by an institutional sector is calculated by calibration and fitting. The indicators used are the weighted totals of value added per branch, with the respective weights corresponding to the share of the branch’s total value added created by each sector. Thus for financial corporations (FCs) the value added by financial services (FISIM and exc. FISIM), as well as insurance services in general is used. For ‘pure’ households, we use the ‘rent’ branch. For self-employed entrepreneurs the value added indicator is a weighted composite of the value added by the agricultural, construction, commercial and healthcare branches, among others.
Ultimately, value added by non-financial corporations is calculated as the balance between the total value added by the various branches and that added by other resident institutional sectors.
4.2.1.2. Intermediate consumption by institutional sector
With the exception of non-financial corporations and general government, the intermediate consumption of institutional sectors is obtained by calibration and fitting. The indicators used for this purpose are the weighted totals of intermediate consumption for the various branches, with the weights corresponding to the proportion of intermediate consumption for each branch which can be attributed to the sector in question for the reference year.
The raw intermediate consumption of general government is calculated by a process of calibration and fitting using an indicator provided by the General Directorate for Public Finances (DGFiP). However this indicator is highly volatile, and the seasonally-adjusted series is obtained by smoothing the annual figures. Finally, the intermediate consumption of non-financial corporations is calculated as the balance between the total intermediate consumption of these branches and that of the other resident institutional sectors.
4.2.1.3. Output by institutional sector
Finally, the output of each institutional sector is calculated as the sum total of value added and intermediate consumption.

Insee Méthodes 112
4.2.2. Operating accounts
The operating accounts compiled in the economic summary table are drawn up in the same way as those produced for individual branches. Thus the value added by those institutional sectors whose output includes a non-tradable component is estimated based on their total wages and salaries and employers’ social contributions, using specific indicators (cf. above). As for the tradable output, calibration and fitting is performed for each institutional sector, respecting their specific characteristics. Thus for financial corporations, the total wages of the ‘financial and insurance’ branch (as defined in A17) is used as the indicator. The same goes for the other institutional sectors, with by far the most important sector being ‘non-financial corporations’.
value added - wages – employers’ social contributions - other taxes on production + other subsidies on production
= gross operating surplus
In the accounts thus produced, there are no more parallel estimates of the figures by branch and by institutional sector.
4.2.3. Allocation of income account
Unlike the operating account, the ‘allocation of income’ account considers resident economic units and institutional sectors as the recipients of income, rather than producers whose activities generate income. This account combines the ‘allocation of primary income’ account, linked to production processes, and the ‘allocation of secondary income’ account, which demonstrates how the balance of primary income in a given institutional sector is affected by the mechanisms of redistribution: taxes on income and wealth, social security contributions and services (excluding social benefits in kind), other current transfers.
gross operating surplus+ wages received + employers’ social contributions + taxes (less subsidies) on products and output
+ income on property (received - paid) + taxes on income and wealth (received - paid) + social contributions (received - paid) + social services other than social benefits in kind + other current transfers
= gross disposable income
This calculation allows to determine the value of gross disposable income (GDI), information which is of great interest to forecasters, particularly when seeking to predict the growth in household purchasing power.
4.2.4. Use of disposable income
Within the ‘use of disposable income’ account, savings account for that portion of gross disposable income which is not allocated to final consumption expenditure. By defining adjusted gross disposable income as the sum total of GDI and social benefits in kind (equal by definition to individual consumption), savings represent that portion of adjusted GDI which is not allocated to the total effective consumption of households.
gross disposable income – consumption expenditure =
adjusted disposable income (gross + social benefits in kind) – effective consumption =
savings

Methodology of quarterly national accounts 113
4.2.5. Capital
In the capital figures, net lending – or, if negative, net borrowing – refers to that portion of savings which is not used to finance the acquisition of non-financial assets: these are financial savings. The total value of net lending for all institutional sectors (including the rest of the world) is zero.
savings –capital transfers - investment – changes in inventories – net acquisitions of valuables
– sales of non-produced assets =
net lending / net borrowing

Insee Méthodes 114
Table 11: Classification of operations in the economic summary table
Production account
P1 OutputP2 Intermediate consumption
B1 Value added (gross)
Operating accountB1 Value added (gross)
D11 Gross wages and salariesD121 Employers actual social contributionsD122 Employers imputed social contributionsD291 Taxes on payroll and workforceD292 Miscellaneous taxes on production-D39 Other subsidies on production
B2 Gross operating surplus (included B3 = mixed income)
Allocation of primary income accountB2 (included B3) Gross operating surplus and mixed income
Received (+) D11 Gross wages and salariesD121 Employers actual social contributionsD122 Employers imputed social contributionsD211 Value added type taxes (VAT)D212 Taxes and duties on imports excluding VATD214 Taxes on products, except VAT and import taxesD291 Taxes on payroll and workforceD292 Miscellaneous taxes on production-D319 Other subsidies on products-D39 Other subsidies on productionD41 InterestD42 Distributed income of corporationsD43 Reinvested earnings on direct foreign investmentD44 Property income attributed to insurance policy holdersD45 Rents
Paid (-)D41 InterestD42 Distributed income of corporationsD43 Reinvested earnings on direct foreign investmentD45 Rents
Allocation of secondary income account Received (+) D6111 Employers actual social contributionsD6112 Employees social contributionsD6113 Social contributions by self- and non-employed personsD612 Imputed social contributionsD621 Social security benefits in cashD622 Social insurance benefits of private plansD623 Direct employers social insurance benefitsD624 Social assistance benefits in cashD71 Net non-life insurance premiumsD72 Non-life insurance claimsD73 Current transfers within general governmentD74 Current international co-operationD75 Miscellaneous current transfers
Paid (-)D51 Taxes on incomeD59 Other current taxes D6111 Employers actual social contributionsD6112 Employees social contributionsD6113 Social contributions by self- and non-employed personsD612 Imputed social contributionsD621 Social security benefits in cashD622 Social insurance benefits of private plansD623 Direct employers social insurance benefitsD71 Net non-life insurance premiumsD72 Non-life insurance claimsD73 Current transfers within general governmentD74 Current international co-operationD75 Miscellaneous current transfers
B6 Gross disposable income

Methodology of quarterly national accounts 115
Source : European System of national and regional Accounts (ESA) 1995
Use account to incomeB6 Gross disposable income
P31 Final consumption expenditure individualP32 Final consumption expenditure collective
B8 Saving (gross)
Capital accountB8 Saving (gross)
Received (+) D91 Capital taxesD92 Investment grantsD99 Other capital transfers
Paid (-)D91 Capital taxesD92 Investment grantsD99 Other capital transfersP51 Gross Fixed Capital FormationP52 Changes in inventoriesP53 Acquisition less disposals of valuablesK2 Acquisitions less disposals of non-financial non-produced assets
B9A Non financial net lending/net borrowing
Redistribution account to income in kindB6 Gross disposable income
D631 Social benefits in kindD632 Transfers of individual non-market goods and services
B7 Gross adjusted disposable income
Insee Méthodes 116
4.3. Indicators used for individual accounts by branch of activity and by agent/institutional sector
As explained in the previous section, in the accounts produced for each branch of activity and economic agent/institutional sector, operations such as output, intermediate consumption and value added are taken primarily from the input-output table: the indicators were explained in Chapter 3. This third section of Chapter 4 presents the different indicators used to process the accounts which are derived from these general figures: following the logic which informs the quarterly accounts, it begins by drawing up the employment accounts, which are then used to determine the total wages and salaries paid by branch and by sector. Wages operations then serve as the primary source of information allowing to produce operating accounts for each branch and institutional sector, and to calculate the corresponding gross operating surplus: as a general rule this is the most important component of value added.
The indicators required to produce other types of accounts for individual institutional sectors will then be described.
4.3.1. Classification for the employment accounts and the operating accounts by branch of activity
The classification system used for publication of the different branches (output accounts, operating accounts, employment and total hours worked accounts) is the same as that used at product level: in the 2005 base (in use since May 2011), the quarterly accounts are aggregated to level ‘A17’, the aggregated classification published in 2008 and composed of 17 branches/products (cf. Chapter 3, part 3.1.1 and Table 1).
The level of detail at which the operating accounts for the branches are compiled is much more aggregated than that used for the output accounts derived from the input-output table (IOT): the level of work is the level A17, with the exception of the 6 branches for which a distinction is made between tradable and non-tradable activities (Table 12). It is important to treat these non-tradable branches separately on account of the wide range of sources available. Generally speaking though, as the information at disposal when assessing the aggregates contained in the operating account is less precise and less detailed than the data used to compile the IOT, the level of work is at a more aggregated level.
The branches used here are those which make up the A17 classification, where purely tradable services are concerned. For the following branches, there is a distinction for non-tradable sub-branches:
• Services to businesses (item MN in classification A17): the non-tradable branch corresponds to non-tradable research and development activity.
• Non-tradable services (item OQ): this branch is largely non-tradable; a distinction is made between tradable branches, considered as a whole, and the four non-tradable branches identified in the F48 classification:
o Public administration and defence (OZ0)
o Non-tradable education services (PZ0)
o Non-tradable human healthcare services (QA0)
o Residential care and social work (QB0)
• Household services: the non-tradable branch corresponds to ‘arts, entertainment and recreation’ (item RZ0 in F48).

Methodology of quarterly national accounts 117
Table 12: The employment classification scheme used in the employment accounts and the operating accounts for each branch
Source: quarterly national accounts.
4.3.2. Employment and hours worked
4.3.2.1 Paid employment by branch of activity
The INSEE, in collaboration with DARES (the Directorate for the Coordination of Research, Studies and Statistics at the Ministry of Labour), publishes details of the total number of salaried employees in every field except agriculture, at the end of each quarter. This quarterly payroll headcount is based on two principal sources:
- the Survey of Economic Activity and Employment Conditions (ACEMO) compiled by DARES;
- the statistics published by URSSAF based on the responses of corporations paying social contributions (since Q4 1999).
The ACEMO report is published first, and is used to produce a ‘flash’ estimate of the total salaried workforce. This estimate is based on calibration models developed by the INSEE and DARES using observations from previous ACEMO publications. This modelling method allows to extrapolate the ACEMO results to cover all businesses and commercial sectors, the original figures only covering businesses with at least 10 employees.
The ‘flash’ estimate is published around 45 days after the end of the quarter. The total salaried workforce is then estimated, for the more detailed results, using data provided by URSSAF, the only source which covers all professional establishments, whereas the ACEMO report only considers corporations with at least 10 employees.
Item Description ItemItem F
(p) = part of the grade
Description
AZ Agriculture AZ
DE Energy, water and waste DE
C1 Food products C1
C2 Coke and refined petroleum C2
C3 Machinery and equipment goods C3
C4 Transport equipment C4
C5 Other industrial goods C5
FZ Construction FZ
GZ Trade GZ
HZ Transportation HZ
IZ Accommodation and food services IZ
JZ Information and communication JZ
KZ Financial services KZ
LZ Real estate services LZ
MNM Tradable servicesMNNM Non tradable services MB0 (p) Research and development (p)OQM Tradable services
OZ0 OZ0 Public administration and defense
PZ0NM PZ0 (p) Education
QA0NM QA0 (p) Human health
QB0NM QB0 (p)Residential care and social work activities without accommodation
RUM Tradable services
RUNM Non tradable services RZ0 (p) Arts, entertainment and recreationRU Household services
OQ Non tradable servicesNon tradable services
MN Business services
Level of publication (A17) Working classification
Insee Méthodes 118
This second, more detailed workforce estimate is published around 70 days after the end of the quarter and is likely to be further modified when the detailed results for the next quarter are published. The INSEE also surveys some of the major state-owned companies directly in order to keep track of their workforce: La Poste, France Télécom, EDF, GDF, SNCF and RATP.
As for temporary employment contracts, the indicator used consists of an average – for the last five working days in the quarter – of the number of temporary contracts in place each day. This indicator is compiled by DARES on the basis of the monthly declarations made by temporary employment agencies to Pôle Emploi.
The quarterly accounts use these series as indicators to calculate the workforce in the 15 primarily tradable non-farm branches of activity. To obtain a quarterly average employment indicator, the mid-quarter workforce is calculated as the average of total employee numbers at the end of the current quarter and at the end of the previous quarter, then calibrated and fitted using as indicator the annual data series for employment of natural persons.
In the context of the national accounts, employment covers a broader scope than this indicator, particularly since it takes into account those employees based in the overseas departments, as well as the balance of cross-border workers and undeclared workers. Furthermore, the employment data series are published by sector of activity, but then used to calibrate the figures for employment by branch of activity.
The indicators for employment (full-time equivalent) for each branch are constructed on the basis of an indicator calculated specifically for that branch, derived from the quarterly employment figures with an adjustment to allow for part-time work. This adjustment is based on the proportion of part-time workers as identified by the quarterly ACEMO and DARES surveys. The indicator is calibrated and fitted using as indicator the annual employment statistics (full-time equivalent). As no sub-annual data is available regarding the evolution of total hours worked by part-time employees, only a process of calibration allows to integrate this information based on observations derived from previous annual accounts.
For those branches not covered by the INSEE/DARES survey, i.e. agriculture (item AZ in the A17 classification) and primarily non-tradable services (OQ), the data series are generated by smoothing the corresponding annual account figures.
4.3.2.2. Paid employment by institutional sector
For general government, ‘pure’ households and NPISH (non-profit institutions serving households), salaried workforce figures are obtained by smoothing the corresponding annual numbers. Employment by financial corporations is calibrated, using as indicator the figures for the financial services branch.
Salaried employment for self-employed entrepreneurs is calibrated using as indicator the salaried workforce of the relevant branch. Salaried employment by non-financial corporations is calculated as the remaining balance when the total workforce for the four other institutional sectors is subtracted from the total workforce for all branches.
4.3.2.3. Agricultural work and non-salaried employment
As no short-term information is available for other forms of employment (agricultural work or non-salaried labour), figures are obtained by smoothing the annual series for each branch.
4.3.2.4. Hours worked
The quarterly estimate of number of hours worked provides with two distinct data series:
• Total hourly volume, i.e. the number of hours worked in a given quarter, including overtime and extra hours.
• The effective working hours of employees, i.e. the average number of hours worked by a worker in a given quarter: this represents the relationship between the hourly volume of labour and the total number of natural persons in employment.

Methodology of quarterly national accounts 119
These measures are taken for each of the fifteen primarily tradable branches of activity, excluding agriculture. Only the seasonally and working-day adjusted figures (WDA-SA) are published. For the agricultural and non-tradable services branches, no sub-annual data is available: the quarterly working hour totals are thus calculated by smoothing the annual accounts.
Indicators used to calculate hours worked
• Weekly working hours
The principal indicator used to calculate the hourly volume of salaried employment is the theoretical number of weekly working hours. This figure is made available 45 days after the end of the quarter, in the ACEMO report. The annual data for theoretical number of weekly working hours are calibrated, using this indicator for each branch. This results in one of the fundamental components of the volume of labour. Other components are estimated to take into account the various individual (sick leave, strikes, overtime) and collective (partial unemployment, natural disasters etc.) factors which may reduce or increase the effective number of hours worked.
• Annual leave
No quarterly information is available concerning the number of days off taken by employees. By default, this information is obtained by smoothing the annual data, which implicitly assumes that the quarterly variations in number of days off are entirely seasonal. To assess the total seasonally-adjusted hourly volume, this number of days off is assumed to be constant. Similarly, the figures for number of working days corrected for working day variation are assumed to be constant. It should be noted that when the transition to the 35-hour working week was enacted via an increase in the number of ‘supplementary leave days to reduce total working hours’ (RTT), it was the theoretical number of weekly working hours which decreased in employers’ declarations to ACEMO surveys, and there was thus no increase in the number of annual leave days.
• Public holidays
The number of public holidays varies from year to year (for example with the abolition of the Pentecost Monday bank holiday, or when certain holidays fall on a weekend), but after adjustment for seasonal variation, the annual figure is smoothed to give a quarterly average.
• Maternity leave, sick leave and occupational illnesses
The CNAMTS (National Health Insurance Fund) publishes monthly updates on the total number of days lost to maternity leave, sick leave and occupational illnesses. These days are not, however, assigned to specific branches of activity. The overall total is adjusted for seasonal and working-day variation, then used as an indicator for calibration and fitting of the individual branches. This is the only component of the employment accounts which is significantly affected by the number of working days.
• Partial unemployment, temporary unemployment due to bad weather
With no available indicator, the data are the result of smoothing performed on the annual components used to calculate the total number of hours worked in the annual accounts. The number of days lost to bad weather only applies to the construction sector.
• Strikes
The only sub-annual information available on strikes concerns the transport branch since 1990. These data are not calibrated, but nonetheless allow to break down the annual figures into quarterly data and make forecasts in the short term. For other branches the number of days lost to strikes is obtained by smoothing the annual series. Calibration residuals may be added for branches particularly affected by strikes, based on ad hoc calibrations.
• Overtime
Branch-specific indicators are provided by the Central Agency for Social Security Organisations (ACOSS); these indicators are relatively recent (since the end of 2007), as they have existed only since it became possible to claim tax exemption for overtime.
In the absence of more detailed information regarding the number of hours worked by non-salaried employees, the total hourly volume for all workers is based on calibration and fitting of the totally hourly volume of salaried labour (adjusted to reflect the ratio of total employment / salaried employment). The calibration ratio is then
Insee Méthodes 120
estimated between these two annual accounts. This ratio is then applied to the quarterly hourly volume of salaried labour, adjusted for seasonal and working-day variation.
The hourly volumes and effective number of hours worked are estimated and published for each branch (A17) but not for individual institutional sectors, due to a lack of sufficient information.
4.3.3. Gross wages and salaries (D11)
In the national accounts, gross wages and salaries correspond to the gross national wage bill, i.e. including all social contributions payable by employees (code ‘D11’ in the operations classification set out in ESA 95).
4.3.3.1. Basic monthly wage
The ACEMO survey identifies a basic monthly wage at the end of each quarter for all market sectors of activity excluding agriculture. The mid-quarter wage is estimated as average of the basic monthly wage at the end of the current quarter and at the end of the previous quarter. This information is available around 45 days after the end of a quarter. The data is thus first put to use to compile wage information which corresponds to the criteria of the quarterly national accounts, in order to satisfy the European requirement that wage statistics for each branch of activity be published within 70 days of the end of each quarter.
However, the ACEMO survey only covers businesses with at least ten employees. For the current period, the calibration of the total wages and salaries partly compensates for this problem of scale, when the general dynamic observed for wages in small businesses is broadly similar to the situation observed in businesses with at least ten employees. Nonetheless, the reduction of working hours between 1999 and 2003 saw a certain divergence emerge: small businesses were not subject to the same working-hour reduction deadlines as large companies, and so their reduction occurred later (and on a smaller scale). Employees of small firms were less affected – and not at the same time – by the wage moderation negotiated by the largest companies when the 35-hour week was introduced. As a result, mechanically applying the basic monthly wage to all employees in a given branch would lead to underestimate the repercussions of this moderation. The effects are partly balanced out by an independent grading process, calculated to reflect the different rates of transition to the 35-hour week.
For tradable activity branches, a total wages and salaries indicator is obtained by multiplying the quarterly employment figures (full-time equivalent) by the basic monthly wage. This indicator is then calibrated and fitted using as indicator gross wages and remuneration (i.e. the total wage bill, D11).
However, in addition to businesses with fewer than ten employees, the basic monthly wage only covers basic wages, and thus fails to account for the other types of remuneration included in the total wages and salaries in the national accounts: bonuses, overtime, etc. This measurement also fails to assess the impact on average wages of the asymmetrical structure of employment at different levels of qualification.
4.3.3.2. Average wage per capita
A second indicator is also used: the Central Agency for Social Security Organisations (ACOSS) provides data series for employment, total wages and salaries and average wage per capita, obtained thanks to the URSSAF declarations made by businesses when paying their social contributions. This data source, dubbed ‘Séquoia’, has the clear advantage of covering practically all forms of remuneration, including bonuses and overtime, for a broad field which includes small businesses. Nonetheless, this data is published later than the basic monthly wage figures (approx. 70 days after the end of each quarter) and is only available for 1997 onwards. The Séquoia figures are therefore only used when publishing the detailed results.
As with the basic monthly wage of the ACEMO surveys, the average wage per capita data series provided by ACOSS are used for all competitive sectors excluding agriculture at a highly aggregated level (classification A17), and for each sector of activity the total wages and salaries figures are calibrated using as an indicator, the product of the total workforce (persons) and the average wage per capita indicator (Table 13).
As with the ACEMO surveys, a certain degree of inaccuracy arises from applying sectoral indicators to branches, but this is corrected by calibration and fitting. Furthermore, the scope of salaried employment as covered by

Methodology of quarterly national accounts 121
ACOSS-Séquoia is slightly smaller than that covered by the total wages and salaries as defined in the national accounts: remuneration which is subject to CSG (general social contribution) but not to specific social contributions (performance bonuses, shares in company capital etc.) are left out of the ACOSS-Séquoia results. Here again, an econometric calibration and fitting across past annual accounts allows to correct the resulting bias.
The average wage per capita is estimated by dividing the total wages and salaries by the total number of natural persons in salaried employment. Discrepancies arise between the level of the average wage per capita calculated by ACOSS and that given in the national accounts, partly due to the use of different seasonal adjustment methods and partly due to the effects of calibration and fitting, which redress differences of scope, definition (branch vs. sector of activity) and forms of remuneration not covered by the ACOSS/Séquoia calculations (employee incentives, etc.).
4.3.3.3. Special cases in certain branches
For the agriculture branch, the wage indicator used is based on the average basic monthly wage calculated in the ACEMO survey (which only partially covers the agricultural sector).
As for wages in the financial and insurance branch, the indicator is shifted by a quarter in order to take account of the difference between remunerations covered by fiscal declarations on the one hand, and those subject to social declarations on the other. In this branch, bonuses are often declared in the fiscal declaration for Year Y, but are actually paid to employees (and declared to URSSAF) at the beginning of Y+1. Shifting the indicator by a quarter thus allows to include these bonuses in the figures for Q4 of Year Y.
As for the tradable component of primarily non-tradable activities (education, healthcare, social services and administration, item OQ in classification A17), wages are assumed to follow the same trend as the minimum wage. The same goes for the non-tradable part of services provided to households.
Total wages paid by the non-tradable sections of the ‘business services’, and ‘non-tradable services’ branches, are calibrated separately from the total wages paid by general government. Figures for the latter are obtained by calibration using several indicators published by the General Directorate for Public Finances, making a clear distinction between central government organisations, local authorities and hospitals. These indicators are adjusted for seasonal variation, yet they remain highly volatile, probably more on account of the challenges of collecting the data than as a result of any actual short-term fluctuations. The indicator is then smoothed using a centred moving average of five. The indicator used will depend on the type of sub-institutional sector concerned; ‘non-tradable services’ are treated in greater detail than other non-tradable branches: in the F48 classification system a distinction is made between general government, education, healthcare (hospitals) and social services, in order to reflect the diversity of sources of information. The education branch balances out this operation.
4.3.3.4. Wages by institutional sector
The calculation of the total sum of wages paid by different institutional sectors follows the same logic used to calculate value added by branch of activity. For financial corporations, calibration is performed based on the total wages and salariesof the ‘financial and insurance’ branch. For unincorporated enterprises, calibration is performed branch-by-branch. The indicator is derived from the basic monthly wage indicator and the total salaried workforce for the sector. For general government, the total wages and salaries is calibrated directly using indicators published by the DGFiP and used for the sub-items of non-tradable branches. Furthermore, the minimum wage is used as a wage indicator in the NPISH institutional sector, and for households. The ‘rest of the world’ sector also pays gross wages. They are calibrated and fitted using an indicator derived from the balance of payments.
The total wages and salaries of non-financial corporations is calculated as the remaining balance when the salary totals for other institutional sectors are subtracted from the total figures for all branches.
For institutional sectors, the total wages and salaries also appears in the ‘uses’ column of the operating account; this represents the total wages paid by all institutional sectors. This wage data reappears in the income account, in the column denoting the resources of households and the rest of the world. Wages paid to the rest of the world are calculated by a process of calibration using an indicator derived from the balance of payments; as with similar

Insee Méthodes 122
indicators used in the input-output table, in order to reduce the volatility of the data, the indicator is smoothed using moving averages. The wages received by households thus correspond to the difference between total wages and the wages paid to the ‘rest of the world’.
Table 13: Principal indicators of employment, wages and contributions by branch of activity
Source: quarterly national accounts.
Code Short titleGross wages and
salaries (D11)
Employers actual social contributions
(D121)
Average wage per capita (AWPC)
paid employment (persons)
AZ Agricultural goods AWPC*employment D11*ratio Acemo Smoothing
DEEnergy, water, waste
AWPC*employment Acoss/Séquoia Insee-Dares
C1 Food products AWPC*employment Acoss/Séquoia Insee-Dares
C2Coke and refined petroleum products
AWPC*employment Acoss/Séquoia Insee-Dares
C3 Equipment goods AWPC*employment Acoss/Séquoia Insee-Dares
C4 Transport equipment
AWPC*employment Acoss/Séquoia Insee-Dares
C5 Other industrial goods
AWPC*employment Acoss/Séquoia Insee-Dares
FZ Construction AWPC*employment Acoss/Séquoia Insee-Dares
GZ Trade AWPC*employment Acoss/Séquoia Insee-Dares
HZ Transportation AWPC*employment Acoss/Séquoia Insee-Dares
IZ Accommodation - food service
AWPC*employment Acoss/Séquoia Insee-Dares
JZ Information-communication
AWPC*employment Acoss/Séquoia Insee-Dares
KZ Financial services AWPC*employment Acoss/Séquoia Insee-Dares
LZ Real estate activities
AWPC*employment Acoss/Séquoia Insee-Dares
Tradable branches AWPC*employment Acoss/Séquoia Insee-Dares
DGFiP (central government)
DGFiP (central government)
Smoothing
+ DGFiP (local government)
+ DGFiP (local government)
Smoothing
Tradable branches Smic*employment D11*ratio Smoothing
DGFiP (central government)
DGFiP (central government)
+ DGFiP (local government)
+ DGFiP (local government)
+ (Smic *employment) D11*ratio
PZ0 Non tradable educationBalancing non tradable
branchesBalancing non
tradable branches
QA0 Human health DGFIP (hospitals) DGFIP (hospitals)
QB0Residential care and social work activities
Smoothing Smoothing
Tradable branches AWPC*employment Acoss-Urssaf Acoss/Séquoia Insee-Dares
Non tradable branches
AWPC*employment D11*ratio Smoothing
A17 Indicators
Smoothing
MN Business servicesNon tradable branches
Item of calibrating
RUHousehold services
Non tradable branches
OQNon tradable services
Central Agency for Social Security
Organisations (Acoss) - sums actually paid to
the Urssaf
OZ0 Public administration
Methodology of quarterly national accounts 123
4.3.4. Contributions and social security benefits
4.3.4.1. Employers’ social contributions (D12 and D61)
Employers’ social contributions (operation coded D12 in the ESA classification) are processed with reference to their origin: they are entered into the accounts for the period in which the work was done, and not the period when the corresponding contributions are actually paid. This is why, in the quarterly accounts, social security indicators are systematically delayed by a month or a quarter (depending on the frequency of the data series) in relation to the data provided by the different funds (for example, sums collected in the month of February will subsequently be used as an indicator to calculate payments for the month of January).
Employers’ social contributions (D121 and D6111)
Indicators
Employers’ social contributions appear twice in the economic summary table (EST). Firstly, in the national accounts they are treated as if paid by businesses to their employees. This first flow (D121) appears in the ‘uses’ column of the operating account for all sectors, and then in the ‘household resources’ section of the income accounts. The second flow (D6111) represents payments from households to the social security funds or, in a minority of cases, to the financial corporations which manage healthcare insurance programmes. This flow is also included in the income accounts.
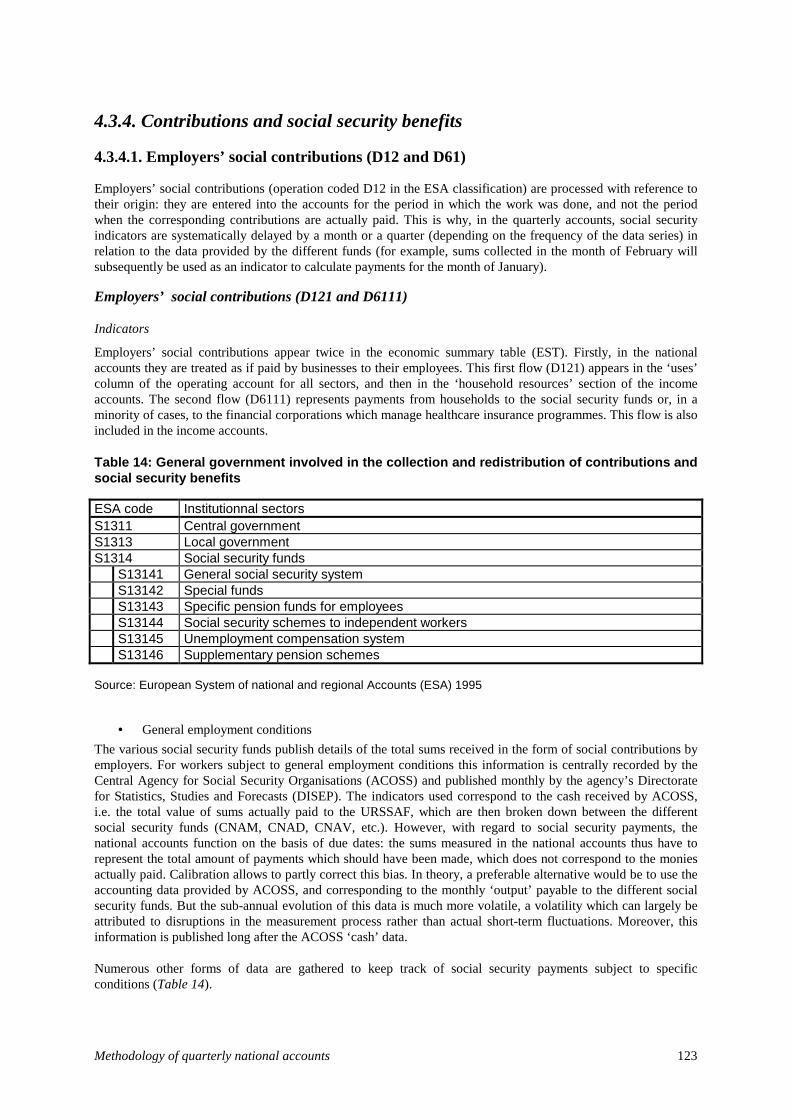
Table 14: General government involved in the collection and redistribution of contributions and social security benefits
ESA code Institutionnal sectors S1311 Central government S1313 Local government S1314 Social security funds S13141 General social security system S13142 Special funds S13143 Specific pension funds for employees S13144 Social security schemes to independent workers S13145 Unemployment compensation system S13146 Supplementary pension schemes Source: European System of national and regional Accounts (ESA) 1995
• General employment conditions
The various social security funds publish details of the total sums received in the form of social contributions by employers. For workers subject to general employment conditions this information is centrally recorded by the Central Agency for Social Security Organisations (ACOSS) and published monthly by the agency’s Directorate for Statistics, Studies and Forecasts (DISEP). The indicators used correspond to the cash received by ACOSS, i.e. the total value of sums actually paid to the URSSAF, which are then broken down between the different social security funds (CNAM, CNAD, CNAV, etc.). However, with regard to social security payments, the national accounts function on the basis of due dates: the sums measured in the national accounts thus have to represent the total amount of payments which should have been made, which does not correspond to the monies actually paid. Calibration allows to partly correct this bias. In theory, a preferable alternative would be to use the accounting data provided by ACOSS, and corresponding to the monthly ‘output’ payable to the different social security funds. But the sub-annual evolution of this data is much more volatile, a volatility which can largely be attributed to disruptions in the measurement process rather than actual short-term fluctuations. Moreover, this information is published long after the ACOSS ‘cash’ data.
Numerous other forms of data are gathered to keep track of social security payments subject to specific conditions (Table 14).
Insee Méthodes 124
• Special employment conditions
For other employment conditions (MSA, etc.) quarterly accounts are obtained by smoothing the corresponding annual data.
• Unemployment benefits
Up until 2010, Pôle Emploi published an indicator detailing total contributions to unemployment insurance mechanisms. As this indicator made no distinction between employers’ payments and employees’ contributions, the employers’ payment indicator is estimated based on the ratio of employers’ contributions to the sum of employers’ and employees’ contributions. Since 2011, the URSSAF network has been responsible for recovering social contributions, and it is therefore ACOSS, the national coordinating body for the URSSAF network, which provides this information.
• Supplementary pension contributions
As for supplementary pension funds (excluding the public sector), the indicators tracking employers’ contributions are calculated by aggregating the total contributions recorded by the organisations which manage these funds: AGIRC, ARRCO and IRCANTEC for all workers not employed by the state or local authorities. We distinguish between employers’ and employees’ contributions using theoretical payment rates. The quarterly figures for the civil service supplementary fund (RAFP) are estimated by smoothing the annual account.
All indicators of employers’ contributions are calibrated and fitted by the respective funds and then aggregated to obtain the total amount of employers’ actual social contributions (D6111). They are recorded as household uses and as resources controlled by the social security organisation. This total, which is equivalent to the total sums received by households from the initial flow (D121), is broken down both by institutional sector and by branch.
Seasonal adjustment for social security payments is often performed on data series constructed to reflect ‘constant legislation’. When the rates of these contributions are known, an average rate of payment falling within the state boundaries (80% of the tax base is held to be below the upper limit) is calculated. The ‘constant legislation’ series is obtained by dividing the raw data by the contribution rate. The effects of changes in rate thus have no impact on seasonal adjustment. The contribution rate is then applied once again to the seasonally-adjusted ‘constant legislation’ data to obtain a final indicator which is corrected for seasonal variation.
Figures by branch
The breakdown of social contributions by branch of activity is obtained using theoretical contribution indicators. These indicators are created by multiplying the total quarterly wages and salaries by the average rate of social contributions (derived from the different rates applied by the funds). A theoretical rate of contribution is thus calculated for each branch, then calibrated and fitted. The overall total calculated by adding up the totals for each branch will differ from the total revenue received by the various social security funds. The distribution of the total across the different branches of activity is performed pro rata, based on the relative weight of each branch’s share of total contributions in the base year.
Figures by institutional sector
Social contributions paid by households and NPISH (non-profit institutions serving households) are calculated by a process of calibration and fitting using the theoretical contribution rates. The sums paid by financial corporations are calibrated using as indicator the contributions derived from the ‘financial services’ branch. For contributions made by public sector employers, an indicator is published by the General Directorate for Public Finances (the same source which gives the total wages and salaries). As with the total wages and salaries, this indicator is smoothed using a centred moving average of 5, in order to limit its volatility.
The actual contributions paid by employers also appear in the ‘rest of the world’ account, in both the uses and resources columns. The indicators used are taken from the balance of payments. Finally, social contributions from non-financial corporations are calculated as the balance which remains when total figures for other institutional sectors are deducted from the total for all branches.
Methodology of quarterly national accounts 125
Employees social contributions and social contributions by self and non-employed persons (D6112 and D6113)
In the operating account, social contributions paid by employees are not distinguished from the total gross wages and salaries data, and are thus not broken down branch-by-branch. On the other hand, social contributions paid by salaried employees and self-employed workers appear in the income account, in parallel with the secondary flow of employers’ contributions (D6111). These data are obtained using the same principles used to calculate employers’ contributions, based on cash received. These contributions are paid directly by households; on the other hand, they constitute a resource for three institutional sectors: general government, financial corporations and non-financial corporations (in return for services provided directly by employers).
For employees’ social contributions, exactly the same information sources are used to calculate employers’ contributions.
For contributions by non-employees, the only annual information used comes from the statistics department at ACOSS and concerns those contributions owed to the CNAF. Other contributions by non-salaried persons are calculated by smoothing the annual accounts. For non-salaried persons working outside the agricultural sector (primarily tradespersons and independent professionals), other contributions owed to the Independent Workers’ Social Scheme (RSI) may be used if the available data goes back far enough. Since 2008 this information has been gathered by the URSSAF network, and analysed by the statistics department at ACOSS.
Actual contributions by employees also appear in the resources and uses columns of the ‘rest of the world’ account; they are subjected to calibration using indicators taken from the balance of payments.
Imputed contributions (D122 and D612)
Imputed contributions represent an artificial item, included in the operating account (D122) in parallel with employers’ actual social contributions (D121). They appear in the uses column for financial corporations, non-financial corporations or general government in the operating account, and as household resources in the income column. They are then transferred into the income column, moving from households to employers (D612).
Imputed contributions are the main counterpart to benefits provided directly by employers (D623), which include all services provided directly by employers managing their own social security systems without developing capital reserves; this primarily involves civil pensions paid by general government organisations or state-owned businesses. Other counterparts to these services provided directly by employers are cash transfers and actual employees’ contributions.
Distribution by branch of activity
In the operating account, imputed contributions are broken down by branch. This breakdown is achieved by calibration and fitting of the total wages and salaries for each branch. The only exception is the transport branch, where the available information on large corporations paying employers’ contributions directly is taken into account: the annual figures provided by the rail operator RATP are smoothed, and the corresponding services for the rest of the transport branch are calculated by a process of calibration and fitting on the total wages and salaries.
Distribution by institutional sector
Imputed contributions made by financial corporations are measured as the counterpart to transfers and services provided directly by employers, for which no short-term information is available and for which smoothing is therefore necessary. Imputed contributions paid by general government are measured as the counterpart to services provided directly by employers, corresponding to pensions paid to retired civil servants, transfers evaluated by smoothing and actual employees’ contributions collected by the government, which are estimated via a process of calibration using an indicator published by the General Directorate for Public Finances. Finally, contributions by non-financial corporations correspond to the remaining balance when the sum of contributions from other sectors is subtracted from the total for all branches.
Insee Méthodes 126
4.3.4.2. Social benefits other than social transfers in kind (D62)
Social benefits in cash or any other social benefits other than social transfers in kind are assigned the code D62 in the ESA 95 classification of operations. This covers social security payments in cash (reimbursement for sick days, pensions paid by the central fund, unemployment benefits, certain family allowances, etc.), social security services provided by private funds (primarily the reimbursement of medical expenses by health insurers), social security services provided directly by employers (particularly state pensions to retired civil servants) or other social security services in cash (various forms of income support: active solidarity income (RMI/RSA), special solidarity allowance (ASS)).
These services are measured primarily as uses, paid out by government agencies and financial corporations (particularly private health insurance firms). A marginal quantity of certain services is paid and received by the ‘rest of the world’, and this is calibrated using indicators from the balance of payments. The institutional sector ‘households’ is the only other sector receiving social benefits in cash.
Social insurance benefits in cash (D621)
Social benefits in cash are the counterpart to social security contributions paid to prepare for certain risks (unemployment, illness, old age, family circumstances etc.), paid out when people are actually affected by these circumstances.
General government (specifically the social security administrations) and the rest of the world are the only two sectors to make such payments. The majority of social security funds publish details of the total value of services they provide. This includes the various funds which together make up the general social security system, and which each publish quarterly details of their payments. This includes sick leave payments (CNAM), pensions paid out by the central fund (CNAV) and certain family benefits (CNAF). Other social security funds dealing with the unemployed (MSA, RSI) or workers subject to specific employment conditions (CNRACL, MSA) provide details of their specific fields.
Pôle Emploi also publishes details of unemployment benefits paid out, and supplementary pension payments are handled by AGIRC, ARRCO and IRCANTEC.
These indicators are calibrated and fitted at a detailed level (values for each individual fund) then aggregated. For special funds (Old Age Solidarity Fund etc.) no sub-annual information is available so the quarterly series are generated by smoothing the annual data.
Social insurance benefits from private plans (D622)
These are benefits provided exclusively by financial corporations, in cash or in kind, managed by private insurance providers (particularly health insurance firms). No direct sub-annual information is available. The indicator used is the total value of individualised expenditure by general government on medicines and tradable healthcare services. Calibration is based on the correlation between sums reimbursed by health insurance firms and those paid out by general government.
Social insurance benefits paid directly by employers (D623)
This item covers those benefits paid by employers managing their own social security systems without developing capital reserves. The three sectors involved are non-financial corporations, financial corporations and general government. This latter sector is the only one for which an indicator is available, provided by the Accounts Department of the Treasury and giving details of pensions paid to retired civil servants. The benefits paid directly by financial corporations are calibrated using as indicator the total wages and salaries of the corresponding sector. Benefits paid by non-financial corporations are deducted from the imputed contributions for this sector.
Social assistance benefits in cash (D624)
These benefits are paid directly by general government and NPISH to households, to support their income. As a result they do not directly correspond to any contributions. For NPISH, quarterly data are obtained by smoothing the annual figures. For general government, the indicators are provided by the CNAF and Pôle Emploi, the

Methodology of quarterly national accounts 127
government agencies responsible for managing these benefits and publishing quarterly details of the amounts paid out in the form of different types of benefit (RSA, ASS, disabled adults allowance - AAH, back to school allowance, Christmas bonus for RSA and ASS etc.). As regards the Christmas bonus and ‘back to school’ allowance, the annual totals are smoothed and, as with income tax, when the sums involved are substantially different from the previous year (higher or lower), the effects of this change are entirely attributed to the quarter or quarters in which payments were made.
Given the great diversity of benefits paid out and the number of organisations involved (Pôle Emploi, CNAF, local authorities, various general government bodies), the overall annual totals are only partly covered by indicators: around 50% in 2010. Calculating the econometric relationship allows to correct a systematic bias affecting the accuracy of the indicator. Furthermore, ad hoc adjustment (using residuals) is sometimes required to respond to extraordinary events such as short-term spikes in partial unemployment (for which no indicator is available) or special pay-outs as part of short-term response measures (e.g. the economic stimulus plan launched in Q2 2009).
4.3.4.3. Social benefits in kind (D63)
In accounting terms, social benefits in kind (D63) correspond to the sum total of individual consumption expenditure by general government (P31G) and NPISH (P3P).
Social benefits in kind (D631)
• Tradable services (D631A)
This covers all of item D6311 (social benefits in kind), for which payments are made only by social security organisations and consist mostly of reimbursements for medicines and tradable medical services.
This item also covers the tradable component of D6312 (other social benefits in kind) i.e. a certain portion of housing allowance (ALF) and certain forms of healthcare and social expenditure (particularly childcare).
It also includes the tradable component of D6313 (social services in kind), for which payments are made by the state, general government agencies and local authorities (this item includes the APL and ALS housing benefits).
D631A is calibrated using as indicator the total value of individual expenditure by general government on pharmaceutical products, tradable healthcare services, housing allowances, social services and social housing.
• Non-market services (D631B)
This covers the non-market component of D6312 (healthcare and social services provided by public hospitals) and D6313 (healthcare-related and social-work activities conducted by the state, general government agencies and local authorities).
It is calibrated using as indicator the total value of individual expenditure by general government on non-tradable healthcare and non-tradable social work and housing.
Transfers of property and individual non-market services (D632)
These transfers correspond to the operating expenditure of certain government bodies. For the most part this expenditure concerns education. This series represents the difference between total individual consumption expenditure by general government on the one hand, and social benefits in kind (D631) on the other. The transfers attributed to NPISH represent their consumption expenditure.
Insee Méthodes 128
4.3.5. Taxes on production (D29)
Taxes on production (D29) can be divided into taxes on payroll and workforce (D291) and miscellaneous taxes on production (D292). This item covers ‘all taxes paid out by businesses as a direct result of their production activities, irrespective of the quantity or value of the goods and services produced or sold’ (ESA 95).
4.3.5.1. Taxes on payroll and workforce (D291)
Taxes on payroll and workforce (D291) include wage taxes, transport taxes, specific contributions to the National Fund for Housing Assistance (FNAL) and, since 2004, the solidarity for independent living contribution of 0.3% levied on wages and remunerations and paid to the National Solidarity Fund for Independent Living (CNSA). Contributions to the wage guarantee insurance (AGS) programme are also counted. The apprenticeship tax and the contributions made by employers to the funding of ongoing vocational training, as well as the social tax (since 2009), are included as well.
The statistics on revenue generated by taxes on wages are provided by the General Directorate for Public Finances (DGFiP). For the majority of the other taxes included here (transport taxes, FNAL contributions, the social tax, contingency taxes) information is provided by the statistics department at ACOSS. No indicator is available regarding employers’ contributions to building work.
Distribution by institutional sector
Taxes paid by financial corporations and general government are calculated as the sum of several individual calibration models, with social contributions and taxes treated separately. Taxes paid by households (not including self-employed entrepreneurs), involving relatively insignificant sums, are calibrated purely using taxes on wages and the solidarity contribution. As for those taxes paid by NPISH (non-profit institutions serving households), they are also relatively insignificant and as such the quarterly figures are calculated by smoothing the annual totals. Finally, taxes paid by non-financial corporations are calculated as the difference between taxes received by the government and total taxes paid by other sectors.
Distribution by branch
Taxes on wages in non-market branches are calibrated using as indicator taxes paid by government employers. Taxes from the financial activities branch are calibrated using the tax revenue from financial businesses. The taxes from other market branches are then deduced based on taxes paid by non-financial businesses, weighted to reflect the contribution of the wages and salaries of each branch to the overall total. The indicator for wage taxes from a given market branch is thus equivalent to the quarterly wage tax paid by non-financial corporations, multiplied by the weighting coefficient of the branch’s wages and salaries. After calibration, the total value of taxes for all branches may not necessarily correspond to the total taxes received by the government; the discrepancy is split proportionally between all branches.
4.3.5.2. Miscellaneous taxes on production (D292)
Miscellaneous taxes on production (D292) collected by general government are directly calibrated using an indicator which is largely composed of local taxes such as the professional tax (and, since 2010, the various taxes which have replaced this former system: taxes charged on value added, the business property tax and the flat charge on extended enterprises), the property tax on buildings and part of the property tax on undeveloped land. The social solidarity charge (C3S) is also included, part of the vehicle registration tax, the special road tax levied on certain vehicles, the tax on company passenger vehicles, taxes on financial institutions and contributions made by industrial firms to the national employment fund (FNE).
For the majority of taxes, quarterly information is provided by the DGFiP. Not all of this information takes the form of sub-annual indicators: for certain taxes, smoothed annual figures are used (this is the case for the company car tax, for example).
Tax indicators often fluctuate wildly, even after seasonal adjustment: this is particularly true of taxes paid at a specific date in the year (e.g. the property tax), taxes for which the collection methods have been revised (e.g. the

Methodology of quarterly national accounts 129
professional tax in 2002), monthly-distributed taxes (council tax, etc.) and taxes for which the available time series is small. These indicators are therefore often used only on raw data series, while SA series are generated by smoothing. Nonetheless, the information provided by these indicators allows to refine the values for the current year, which will be used in the smoothing operation. This is particularly pertinent for the C3S.
Distribution by institutional sector
Other taxes on production paid by financial corporations are calibrated using local taxes (property tax, tax on value added, business property tax and the extended enterprise tax). Taxes paid by government bodies, households excluding self-employed entrepreneurs and NPISH are simply calibrated using as indicator the property tax on buildings. Finally, taxes paid by non-financial corporations (including self-employed entrepreneurs) are calculated as the difference between taxes collected by the government and taxes paid by all sectors except non-financial corporations.
Distribution by branch of activity
Taxes for the financial services branch are calibrated using the taxes paid by financial corporations. Taxes paid by other market branches are calibrated using as indicator the property tax on buildings. After calibration, the sum total of taxes for all branches will not necessarily be equal to the total tax revenue collected by the government: the discrepancy is split proportionally between all branches.
4.3.6. Subsidies on production (D39)
Subsidies on production (D39) are current transfers with no counterpart, paid by general government or agencies of the European Union to resident producers with a view to influencing their output levels, prices (indirectly) or the rate of remuneration of their production factors. In order to achieve quarterly details of such subsidies for each branch and institutional sector, the annual data are smoothed.
4.3.7. Taxes on income and wealth (D5)
Current taxes on income and wealth (D5) include ‘all compulsory payments without counterpart, in cash or in kind, periodically collected by general government and the ‘rest of the world’ on the income and wealth of institutional units, as well as certain periodic taxes which are not based on either income or wealth’ (ESA 95). Current taxes on income and wealth can be separated into taxes on income (D51) and other current taxes (D59).
Taxes on income and wealth are recorded in the ‘uses’ section of the income accounts for institutional sectors, and as ‘resources’ for general government. They thus have an effect on gross disposable income, particularly household income.
For personal taxes (income tax and local taxes), the principle of recording taxes as and when they are due means that all taxes payable are recorded, subtracting all rebates and exemptions. Furthermore, income tax is not recorded at the same time that the income subject to this tax is generated, as income tax on Year Y is actually paid in Year Y+1. The income tax due on this income is thus recorded at the moment it falls due, i.e. when the tax bill is issued, and the sums due are expressed in a written document (the ‘avis d’imposition’) which formalises the obligation of the taxpayer to pay these sums. This method ensures that the annual figures are consistent with the national budget. The totals are not predicted before household data is available, as the aim is to accurately calculate the actual total taxable income. Data collected by the tax authorities may be used as direct sources of information when compiling such estimates (for further discussion of these choices, cf. Reynaud M. [19]).

Insee Méthodes 130
4.3.7.1. Taxes on income
Taxes on income (D51) are those taxes for which the taxable base comprises income, profits and capital gains. They are paid by all institutional sectors except NPISH. This category includes direct income tax, the generalised social contribution (CSG) and corporation tax.
• Income tax paid by households
The total income tax paid by households is obtained by a process of calibration using a composite indicator. This indicator is the sum of different income sources:
- the generalised social contribution (CSG) and the social debt repayment contribution (CRDS) levied on different types of income (earned income on the one hand, and unearned income from investments, assets and gambling on the other);
- the social levy (PS, charged at 3.4% in 2012) on capital as well as the ‘RSA’ charge (1.1% since late 2008) which goes to fund the income support programme;
- an additional contribution to solidarity for independent living, levied at 0.3% on assets and investment products in favour of the CNSA since 2004, helping to fund independent living schemes;
- income tax minus rebates and exemptions (the tax cap, the employment bonus, etc.); - a fixed proportion of taxes levied on the unearned income of households.
Tracking the major social contributions (CSG, CRDS, the social levy) is a complex affair due to the broad variety of information sources involved, and the heterogeneous scope of these indicators. There are, for example, several different CSG indicators covering different methods of collection. It is possible collate such indicators to create aggregated indicators for different tax bases, distinguishing between earned and unearned income. The data is adjusted for seasonal variation at this level, allowing to analyse separately the seasonal rhythms specific to each income source. Due to the progressive implementation of the CSG, and the changes in the tax base and rate which have occurred in recent years, seasonally-adjusting the CSG figures for capital taxes is particularly challenging.
For the CRDS, as the tax base is more or less the same as that of the CSG, the corresponding CSG indicators are used to calculate indicators for both earned and unearned income.
Furthermore, the 3.4% social levy and the RSA charge are tracked using indicators provided by the DGFiP. Given the difficulty of seasonally-adjusting the former, and the relatively recent creation of the latter, the SA values are obtained by smoothing the annual results (with the exception of periods where the rates were raised).
Raw income tax totals are obtained via a specially-constructed calibration method, using an indicator provided by the DGFiP.
Income tax also has its own specific seasonal adjustment model. These data series have their own, fairly unique statistical properties: the trends change every year, as a result of changes to the tax rate and the size of the tax base. The seasonal adjustment method has no way of anticipating these changes, particularly those caused by changes in the rate of taxation. In order to avoid the need for substantial retrospective revisions, seasonal adjustment is performed by predicting the total annual change and quarterly variations for each tax at the beginning of each tax year. These predicted quarterly values are then revised after each quarter, in order to reflect the actual values observed and adjust the annual forecast accordingly.
The principle of recording tax revenue when it becomes payable also means that a specific seasonal adjustment process is required for new regulations (for example, reductions in income tax). These new regulations are recorded in the quarter when they become applicable to households. When these reforms become permanent, or at least when they can be anticipated with a sufficient degree of certainty, the sums involved are integrated into the seasonal adjustment calculations for the data series.

Methodology of quarterly national accounts 131
For income tax rebates and exemptions (the employment bonus, the tax cap, etc.), quarterly values are calculated by smoothing the annual accounts.
• Income taxes paid by the ‘rest of the world’
Income taxes paid by the ‘rest of the world’ are calculated by calibration using a composite indicator, the sum of taxes on non-commercial profits and a fixed proportion of taxes levied on income from investments (PRCM). Both indicators are provided by the DGFiP.
• Taxes on the revenue of general government
Income tax paid by general government is predominantly composed of the corporation tax paid by central government agencies (ODAC) and PRCM paid by the social security administration. The annual totals involved are relatively small, and are smoothed to give the quarterly figures.
• Taxes on the income of financial corporations and non-financial corporations
Taxes on the income generated by companies is calibrated using an indicator composed primarily of corporation tax totals, along with other less substantial tax revenues such as the social contribution levied on profits (CSB) and the annual fixed rate charge (IFA).
Taxes paid by financial corporations (banks, financial service providers and insurance firms) are calculated by a process of calibration using an indicator which includes corporation and other taxes specific to this type of company: the contribution to the Caisse des Dépôts et Consignations (CDC) and the portion of PRCM not covered by the ‘rest of the world’ sector.
The total taxes paid on the income of non-financial corporations are calculated by subtracting taxes paid by financial businesses from the total sum of taxes paid by all businesses.
It should be noted that for corporation tax, given the considerable volatility involved, the same seasonal-adjustment principles used to correct taxes on income are applied.
4.3.7.2. Other current taxes
Other current taxes (D59) include taxes on capital, i.e. taxes on the ownership or use of land and buildings which must be paid periodically by their owners, residency taxes levied at fixed rates on every adult or household irrespective of income and wealth, and taxes paid by households on the ownership or use of certain vehicles and licences (gun ownership, hunting and fishing permits, etc.).
Such taxes are now only paid by households, directly to the government. The most prominent of these taxes are the wealth tax (ISF), the council tax, and to a certain extent property taxes on undeveloped land and taxes relating to vehicle registrations.
The quarterly cost of these taxes to households is calculated by calibrating the figures using an indicator which combines several related but separate sub-indicators. An indicator tracking council tax revenue is issued by the DGFiP. The wealth tax (ISF) nonetheless has its own unique conditions, since over 80% of the revenue raised is paid in the second quarter. Furthermore this tax is highly dependent on the economic cycle: revenue grows more quickly in periods of strong economic growth. For these reasons, the quarterly ISF data are obtained by smoothing the annual figures.
4.3.7.3. Capital taxes
Capital taxes (D91) are ‘those taxes based on the value of assets held by institutional units or exchanged between them’ (ESA 95).
Households are the only institutional sector to pay these taxes. In terms of taxable income, capital taxes principally apply to non-transactional transfers of ownership (inheritances, donations, gifts). Capital taxes are included in the capital assets account, and thus have an effect on the lending capacities and requirements of the institutional sectors paying and receiving these taxes.

Insee Méthodes 132
An indicator is published by the DGFiP covering revenue generated by such transfers of ownership, used to calibrate the figures for capital taxes paid by households.
4.3.8. Property income, other current transfers and capital transactions
In the absence of quarterly financial statistics, property income (D4), other current transfers (D7) and capital transactions (D9) are calculated by smoothing the annual results, with the exception of interest (D41) paid by general government and a certain proportion of the distributed income of companies (D42) paid to the government, for which the DGFiP publishes a quarterly indicator. The remaining balance of all interest paid and received is made up of interest received by financial corporations, which accounts for the majority of such transactions (almost 80% of interest received).
Methodology of quarterly national accounts 133
Appendix 12: Classification of the economic summary table
Uses and fluctuations of assets are given in the left-hand column of the economic summary table; opposite them on the right-hand side are resources and variations in liabilities. The lines marked in bold correspond to the accounting balances of the economic summary table. The figures in bold italics relate to the input-output table. Unincorporated businesses (individual entrepreneurs - sector S14A) are grouped in with households, and no distinction is made beyond the operating accounts.
The operations covered by the economic summary table are only estimated using current data, i.e. values.
In each box, the information given refers both to the operation (the line) and the institutional sector involved (the column). For a given operation, the letter ‘U’ (for ‘uses’) signifies that the institutional sector ‘pays’, the letter ‘R’ (for ‘resources’) indicates that it ‘receives’.
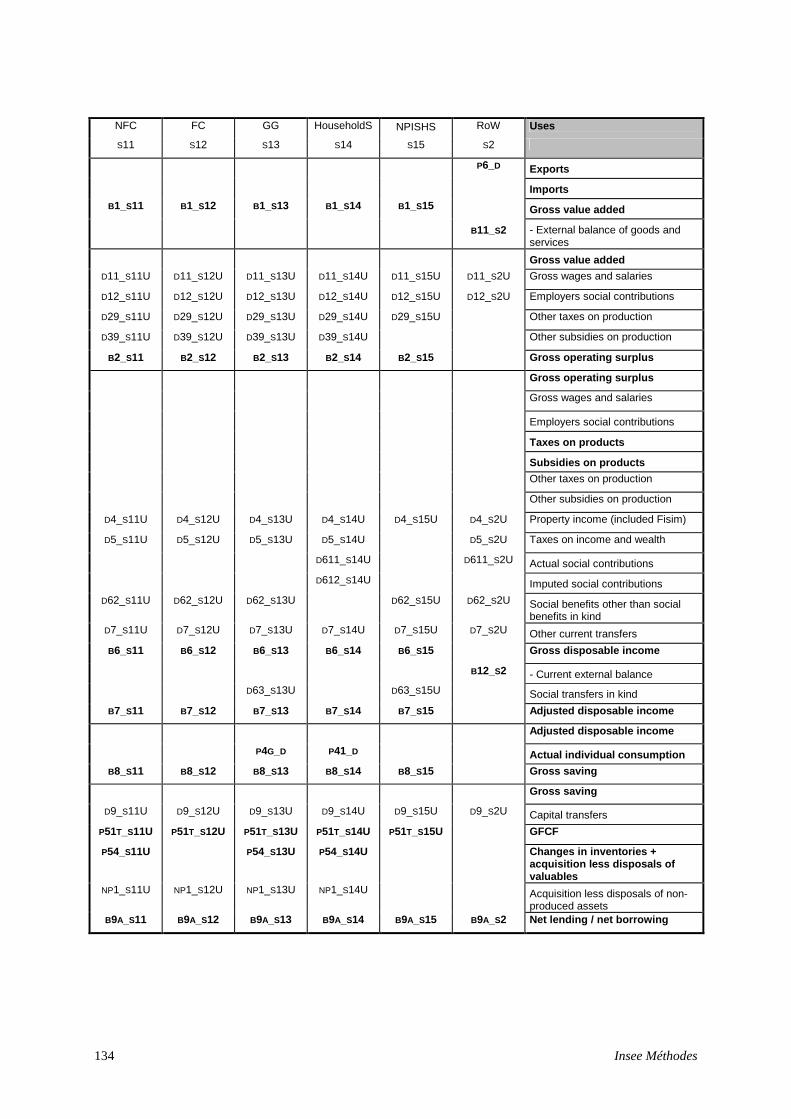
Insee Méthodes 134
NFC FC GG HouseholdS NPISHS RoW Uses
S11 S12 S13 S14 S15 S2
P6_D Exports
Imports
B1_S11 B1_S12 B1_S13 B1_S14 B1_S15 Gross value added
B11_S2 - External balance of goods and services
Gross value added
D11_S11U D11_S12U D11_S13U D11_S14U D11_S15U D11_S2U Gross wages and salaries
D12_S11U D12_S12U D12_S13U D12_S14U D12_S15U D12_S2U Employers social contributions
D29_S11U D29_S12U D29_S13U D29_S14U D29_S15U Other taxes on production
D39_S11U D39_S12U D39_S13U D39_S14U Other subsidies on production
B2_S11 B2_S12 B2_S13 B2_S14 B2_S15 Gross operating surplus
Gross operating surplus
Gross wages and salaries
Employers social contributions
Taxes on products
Subsidies on products
Other taxes on production
Other subsidies on production
D4_S11U D4_S12U D4_S13U D4_S14U D4_S15U D4_S2U Property income (included Fisim)
D5_S11U D5_S12U D5_S13U D5_S14U D5_S2U Taxes on income and wealth
D611_S14U D611_S2U Actual social contributions
D612_S14U Imputed social contributions
D62_S11U D62_S12U D62_S13U D62_S15U D62_S2U Social benefits other than social benefits in kind
D7_S11U D7_S12U D7_S13U D7_S14U D7_S15U D7_S2U Other current transfers
B6_S11 B6_S12 B6_S13 B6_S14 B6_S15 Gross disposable income
B12_S2 - Current external balance
D63_S13U D63_S15U Social transfers in kind
B7_S11 B7_S12 B7_S13 B7_S14 B7_S15 Adjusted disposable income
Adjusted disposable income
P4G_D P41_D Actual individual consumption
B8_S11 B8_S12 B8_S13 B8_S14 B8_S15 Gross saving
Gross saving
D9_S11U D9_S12U D9_S13U D9_S14U D9_S15U D9_S2U Capital transfers
P51T_S11U P51T_S12U P51T_S13U P51T_S14U P51T_S15U GFCF
P54_S11U P54_S13U P54_S14U Changes in inventories + acquisition less disposals of valuables
NP1_S11U NP1_S12U NP1_S13U NP1_S14U Acquisition less disposals of non-produced assets
B9A_S11 B9A_S12 B9A_S13 B9A_S14 B9A_S15 B9A_S2 Net lending / net borrowing
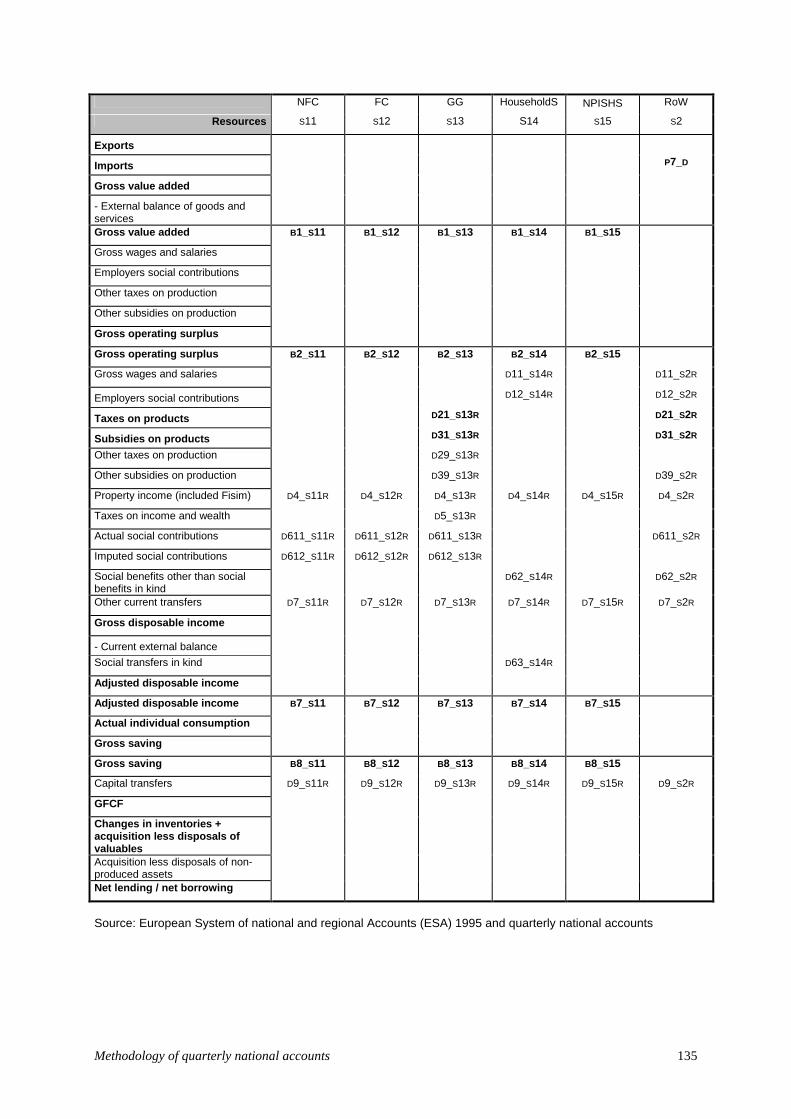
Methodology of quarterly national accounts 135
NFC FC GG HouseholdS NPISHS RoW
Resources S11 S12 S13 S14 S15 S2
Exports
Imports P7_D
Gross value added
- External balance of goods and services
Gross value added B1_S11 B1_S12 B1_S13 B1_S14 B1_S15
Gross wages and salaries
Employers social contributions
Other taxes on production
Other subsidies on production
Gross operating surplus
Gross operating surplus B2_S11 B2_S12 B2_S13 B2_S14 B2_S15
Gross wages and salaries D11_S14R D11_S2R
Employers social contributions D12_S14R D12_S2R
Taxes on products D21_S13R D21_S2R
Subsidies on products D31_S13R D31_S2R
Other taxes on production D29_S13R
Other subsidies on production D39_S13R D39_S2R
Property income (included Fisim) D4_S11R D4_S12R D4_S13R D4_S14R D4_S15R D4_S2R
Taxes on income and wealth D5_S13R
Actual social contributions D611_S11R D611_S12R D611_S13R D611_S2R
Imputed social contributions D612_S11R D612_S12R D612_S13R
Social benefits other than social benefits in kind
D62_S14R D62_S2R
Other current transfers D7_S11R D7_S12R D7_S13R D7_S14R D7_S15R D7_S2R
Gross disposable income
- Current external balance
Social transfers in kind D63_S14R
Adjusted disposable income
Adjusted disposable income B7_S11 B7_S12 B7_S13 B7_S14 B7_S15
Actual individual consumption
Gross saving
Gross saving B8_S11 B8_S12 B8_S13 B8_S14 B8_S15
Capital transfers D9_S11R D9_S12R D9_S13R D9_S14R D9_S15R D9_S2R
GFCF
Changes in inventories + acquisition less disposals of valuables
Acquisition less disposals of non-produced assets
Net lending / net borrowing
Source: European System of national and regional Accounts (ESA) 1995 and quarterly national accounts
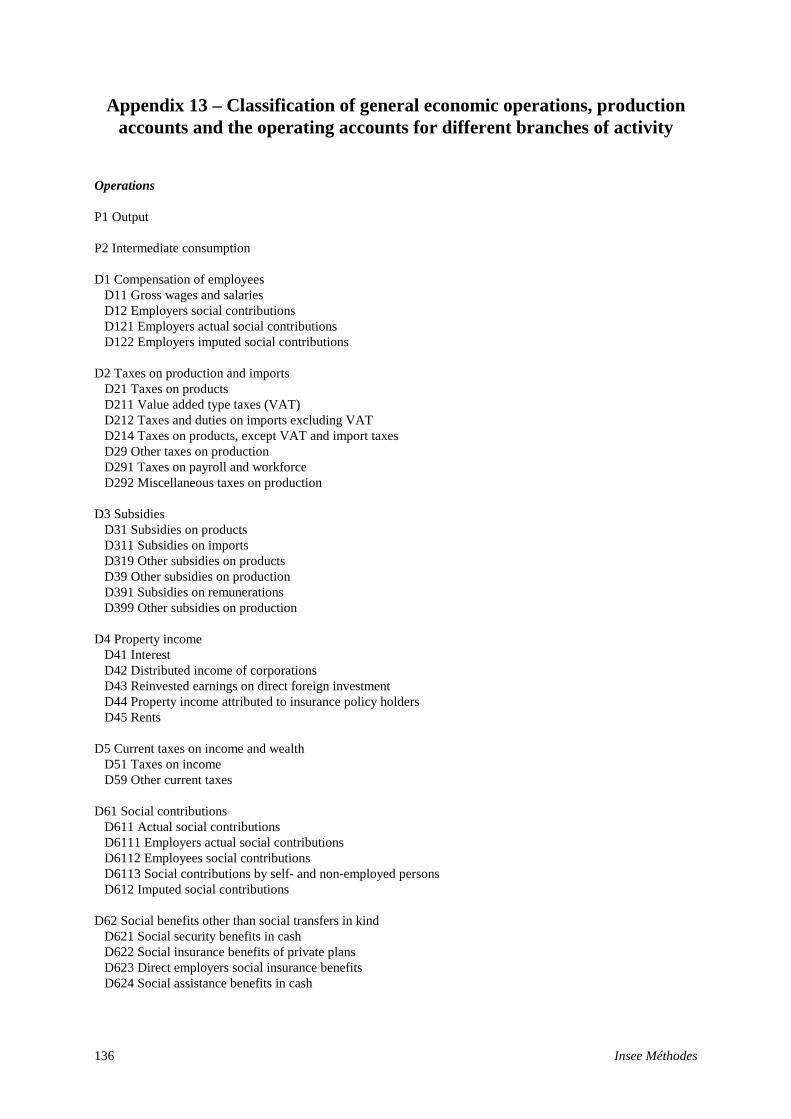
Insee Méthodes 136
Appendix 13 – Classification of general economic operations, production accounts and the operating accounts for different branches of activity
Operations
P1 Output P2 Intermediate consumption D1 Compensation of employees D11 Gross wages and salaries D12 Employers social contributions D121 Employers actual social contributions D122 Employers imputed social contributions D2 Taxes on production and imports D21 Taxes on products D211 Value added type taxes (VAT) D212 Taxes and duties on imports excluding VAT D214 Taxes on products, except VAT and import taxes D29 Other taxes on production D291 Taxes on payroll and workforce D292 Miscellaneous taxes on production D3 Subsidies D31 Subsidies on products D311 Subsidies on imports D319 Other subsidies on products D39 Other subsidies on production D391 Subsidies on remunerations D399 Other subsidies on production D4 Property income D41 Interest D42 Distributed income of corporations D43 Reinvested earnings on direct foreign investment D44 Property income attributed to insurance policy holders D45 Rents D5 Current taxes on income and wealth D51 Taxes on income D59 Other current taxes D61 Social contributions D611 Actual social contributions D6111 Employers actual social contributions D6112 Employees social contributions D6113 Social contributions by self- and non-employed persons D612 Imputed social contributions D62 Social benefits other than social transfers in kind D621 Social security benefits in cash D622 Social insurance benefits of private plans D623 Direct employers social insurance benefits D624 Social assistance benefits in cash
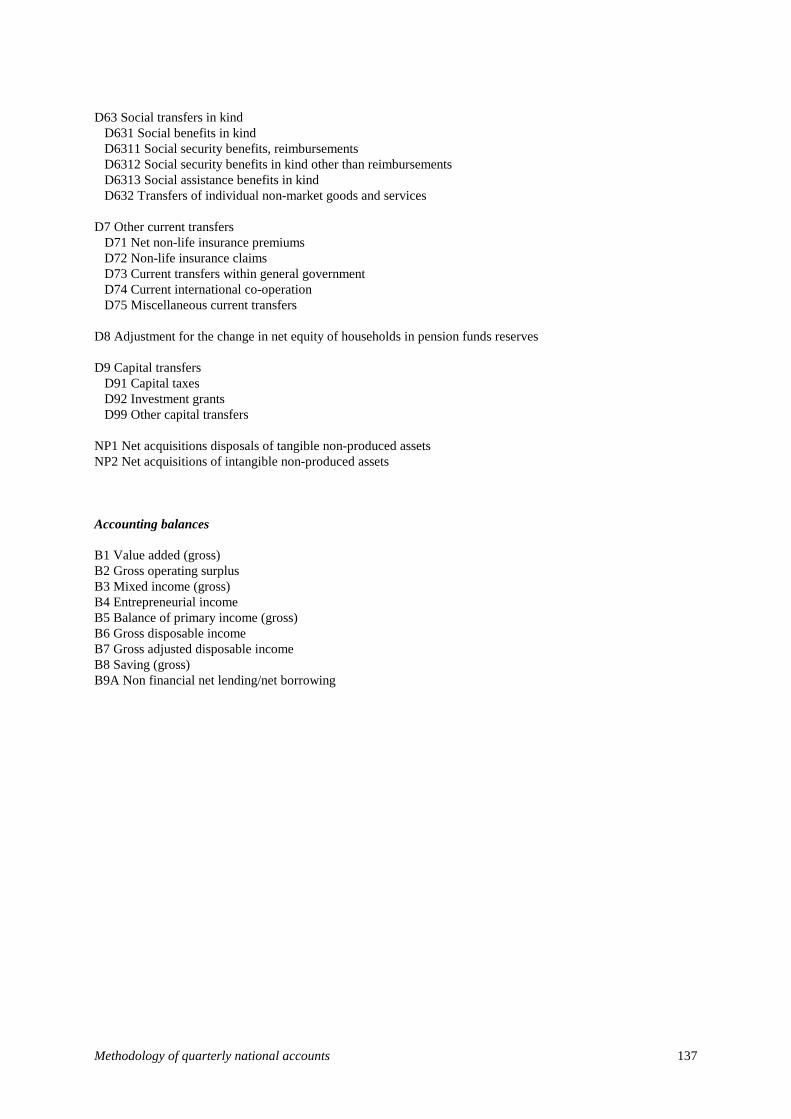
Methodology of quarterly national accounts 137
D63 Social transfers in kind D631 Social benefits in kind D6311 Social security benefits, reimbursements D6312 Social security benefits in kind other than reimbursements D6313 Social assistance benefits in kind D632 Transfers of individual non-market goods and services D7 Other current transfers D71 Net non-life insurance premiums D72 Non-life insurance claims D73 Current transfers within general government D74 Current international co-operation D75 Miscellaneous current transfers D8 Adjustment for the change in net equity of households in pension funds reserves D9 Capital transfers D91 Capital taxes D92 Investment grants D99 Other capital transfers NP1 Net acquisitions disposals of tangible non-produced assets NP2 Net acquisitions of intangible non-produced assets Accounting balances B1 Value added (gross) B2 Gross operating surplus B3 Mixed income (gross) B4 Entrepreneurial income B5 Balance of primary income (gross) B6 Gross disposable income B7 Gross adjusted disposable income B8 Saving (gross) B9A Non financial net lending/net borrowing

Related Documents