Capital Investment Decisions Chapter 26 26-1 Copyright © 2014 Pearson Education, Inc. Publishing as Prentice Hall

Welcome message from author
This document is posted to help you gain knowledge. Please leave a comment to let me know what you think about it! Share it to your friends and learn new things together.
Transcript

Capital Investment Decisions
Chapter 26
26-1Copyright © 2014 Pearson Education, Inc. Publishing as Prentice Hall
Learning Objectives
1. Describe the importance of capital investments and the capital budgeting process
2. Use the payback and the accounting rate of return methods to make capital investment decisions
26-2Copyright © 2014 Pearson Education, Inc. Publishing as Prentice Hall
Learning Objectives
3. Use the time value of money to compute the present values of lump sums and annuities
4. Use discounted cash flow methods to make capital investment decisions
26-3Copyright © 2014 Pearson Education, Inc. Publishing as Prentice Hall
Learning Objective 1
Describe the Describe the importance of capital importance of capital investments and the investments and the
capital budgeting capital budgeting processprocess
26-4Copyright © 2014 Pearson Education, Inc. Publishing as Prentice Hall
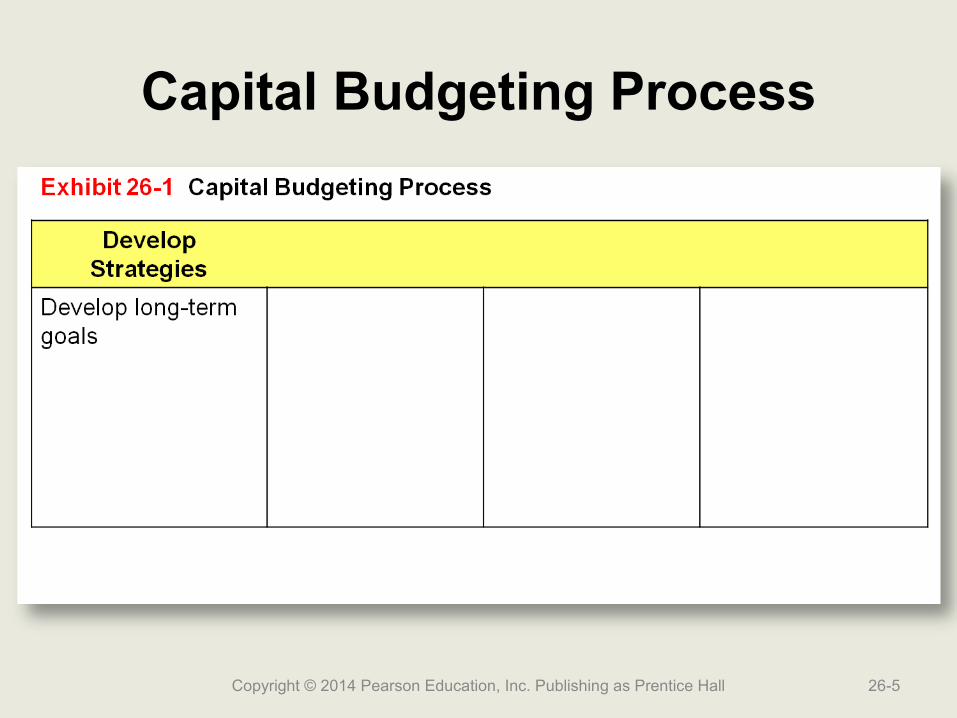
Capital Budgeting Process
Copyright © 2014 Pearson Education, Inc. Publishing as Prentice Hall 26-5

Capital Budgeting Process
Copyright © 2014 Pearson Education, Inc. Publishing as Prentice Hall 26-6
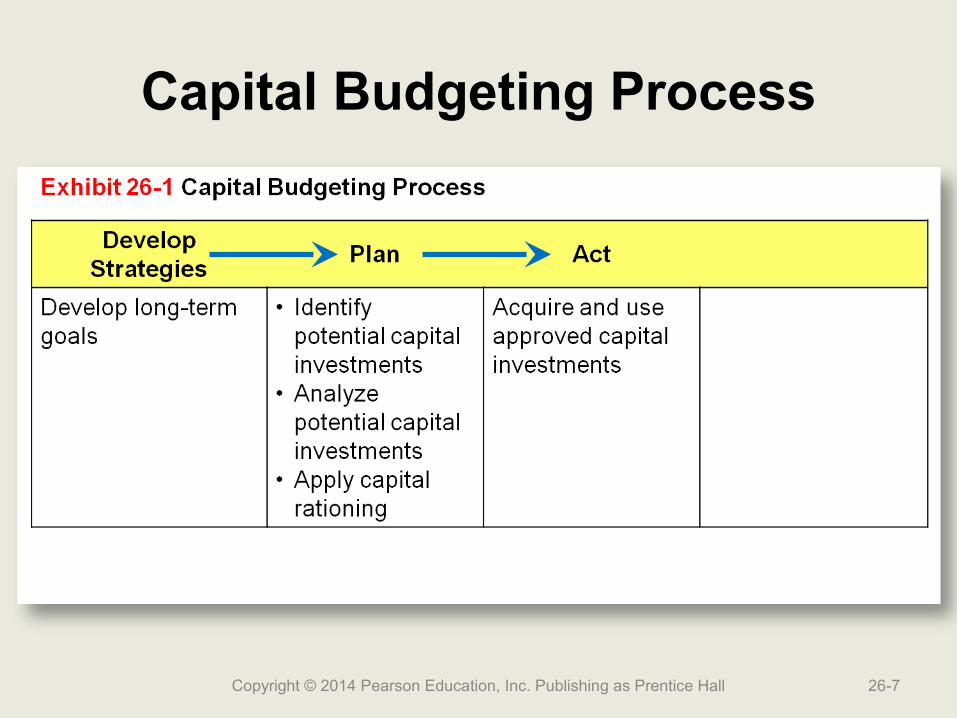
Capital Budgeting Process
Copyright © 2014 Pearson Education, Inc. Publishing as Prentice Hall 26-7
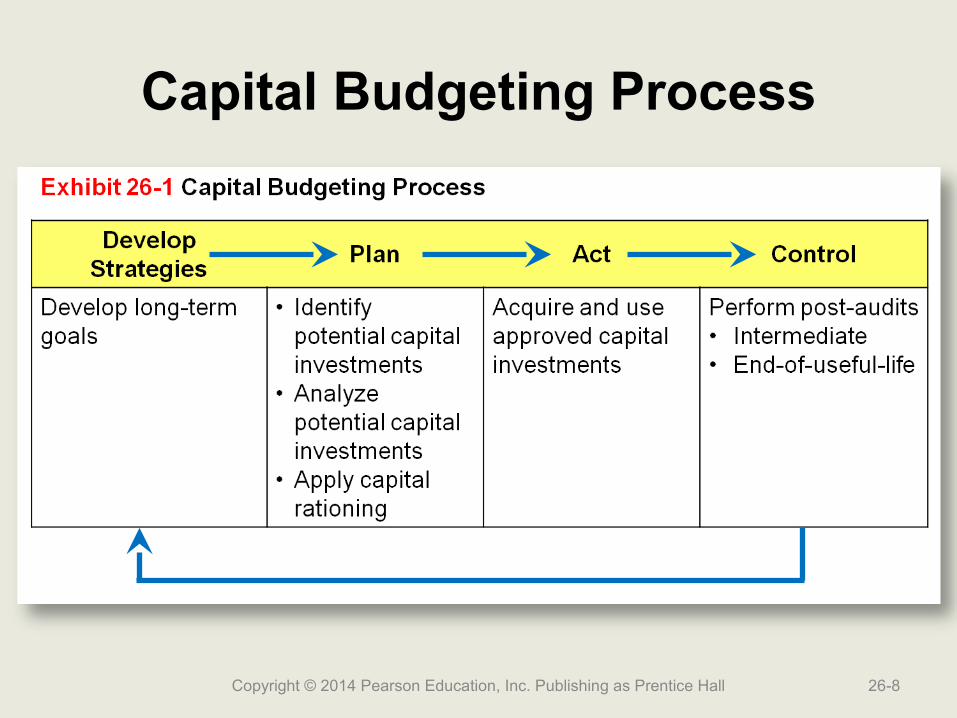
Capital Budgeting Process
Copyright © 2014 Pearson Education, Inc. Publishing as Prentice Hall 26-8
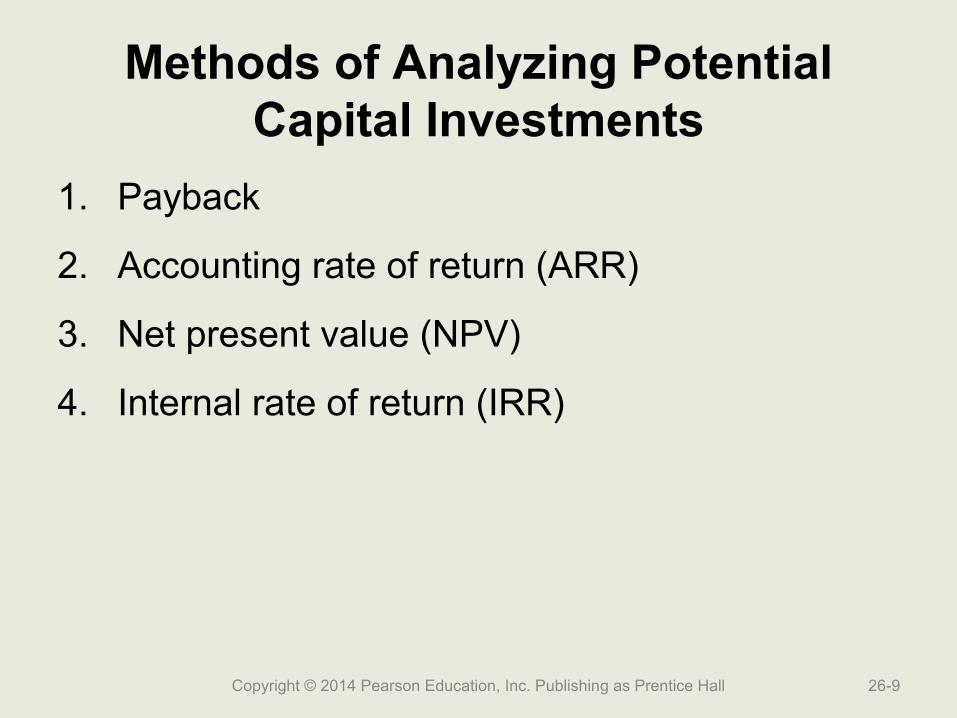
Methods of Analyzing Potential Capital Investments
1. Payback
2. Accounting rate of return (ARR)
3. Net present value (NPV)
4. Internal rate of return (IRR)
Copyright © 2014 Pearson Education, Inc. Publishing as Prentice Hall 26-9
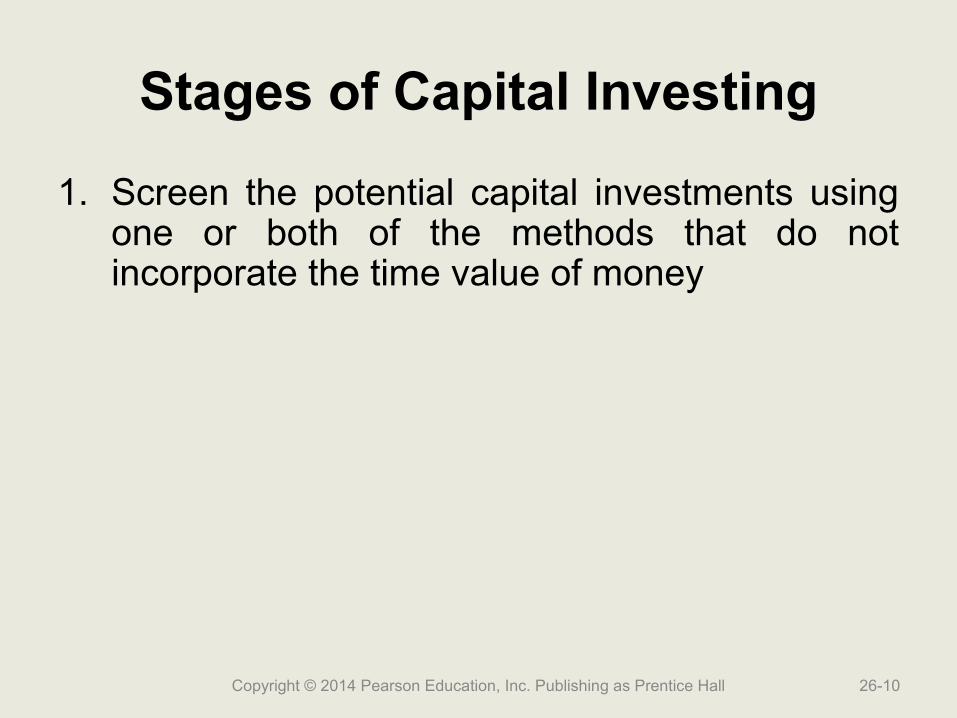
Stages of Capital Investing
1. Screen the potential capital investments using one or both of the methods that do not incorporate the time value of money
Copyright © 2014 Pearson Education, Inc. Publishing as Prentice Hall 26-10
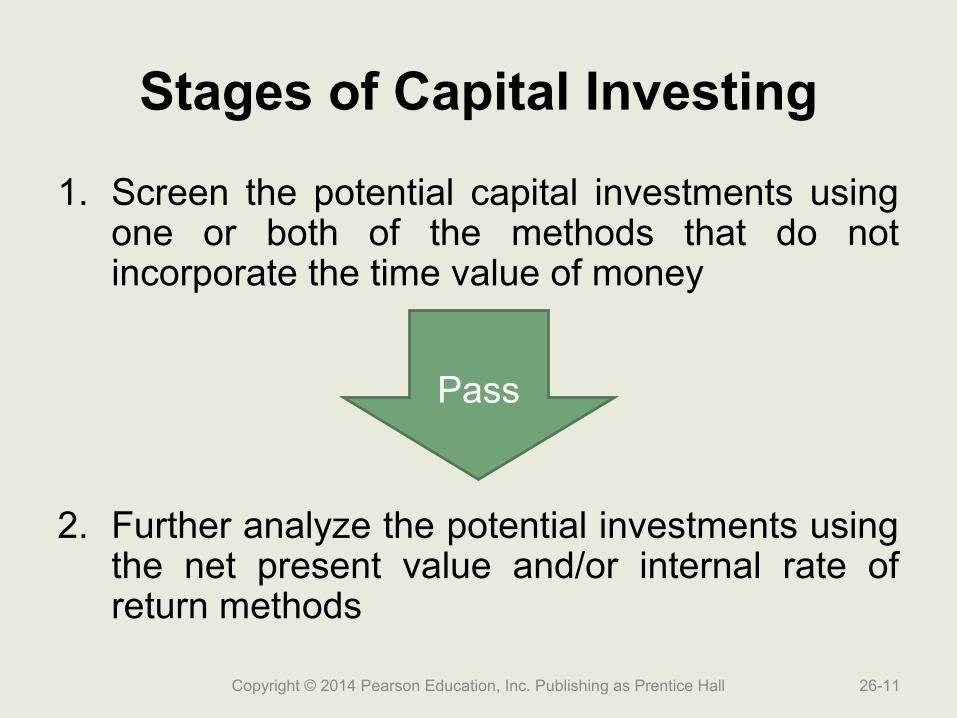
Stages of Capital Investing
1. Screen the potential capital investments using one or both of the methods that do not incorporate the time value of money
2. Further analyze the potential investments using the net present value and/or internal rate of return methods
Copyright © 2014 Pearson Education, Inc. Publishing as Prentice Hall 26-11
Pass
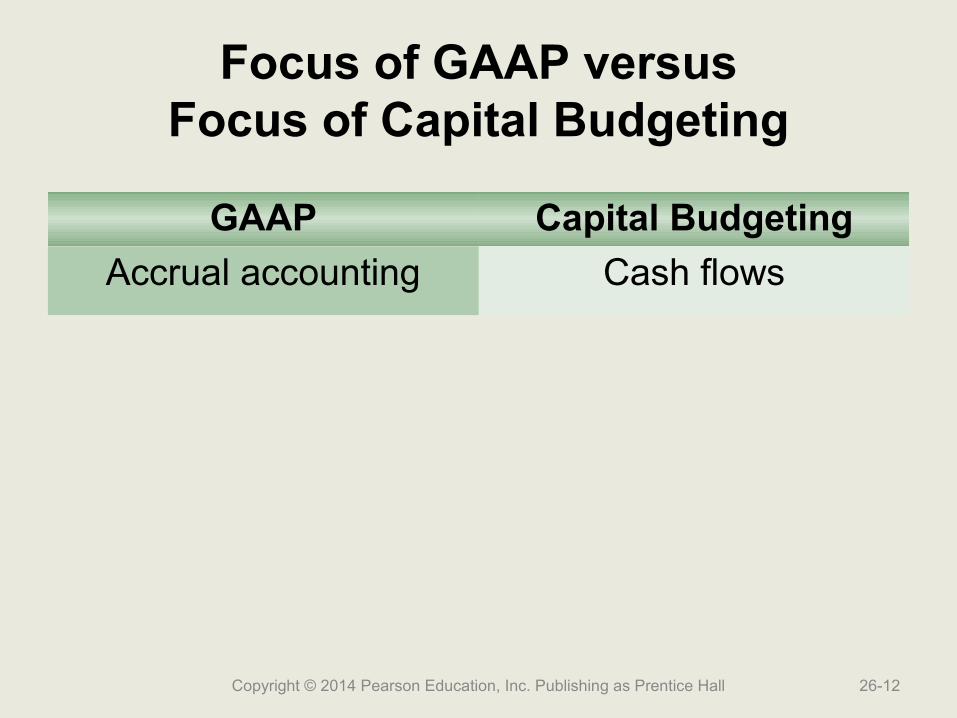
Focus of GAAP versusFocus of Capital Budgeting
GAAP Capital Budgeting
Accrual accounting Cash flows
Copyright © 2014 Pearson Education, Inc. Publishing as Prentice Hall 26-12
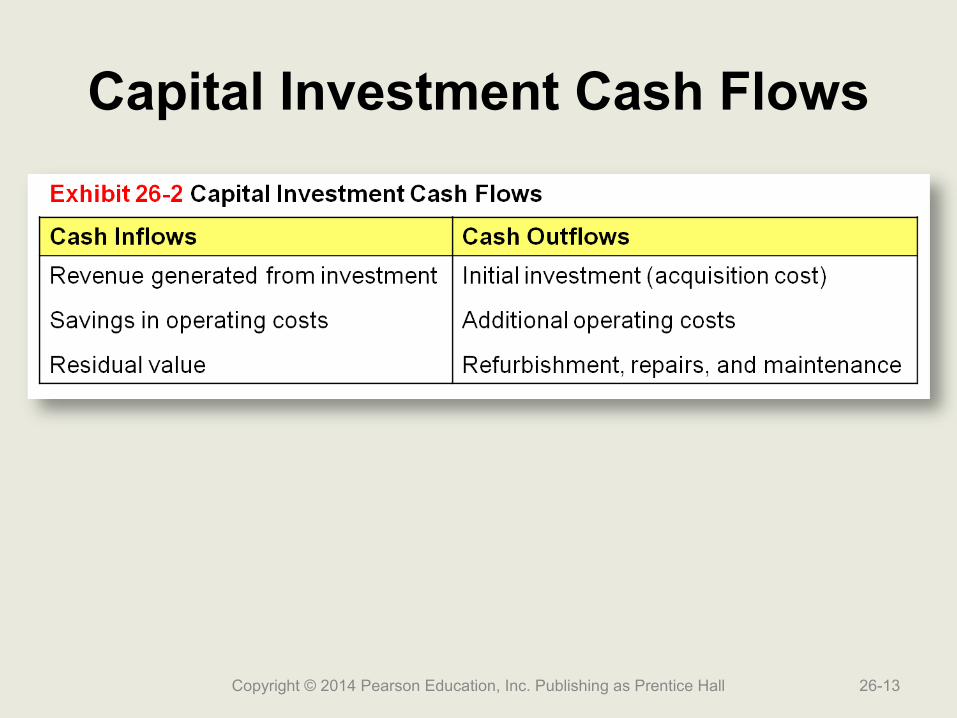
Capital Investment Cash Flows
Copyright © 2014 Pearson Education, Inc. Publishing as Prentice Hall 26-13

Life Cycle of Capital Investments
Copyright © 2014 Pearson Education, Inc. Publishing as Prentice Hall 26-14
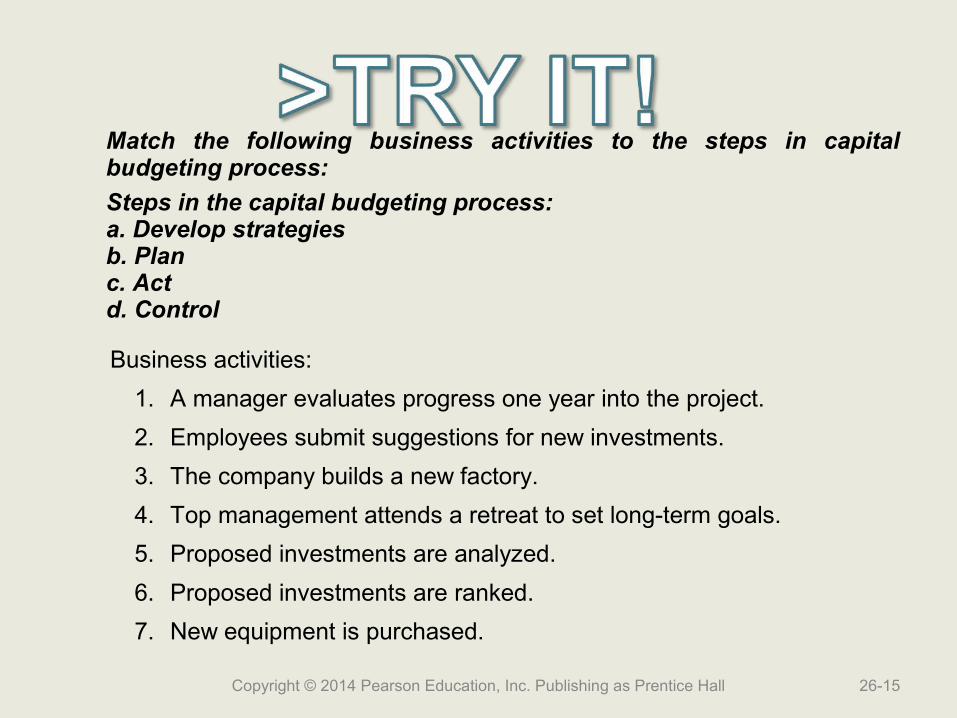
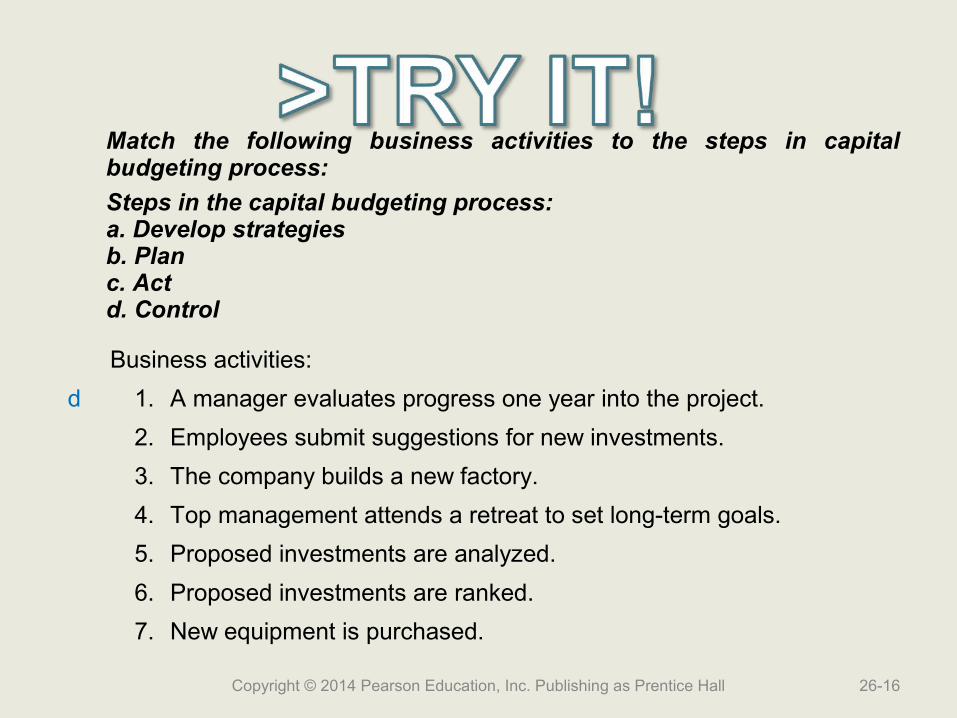
Match the following business activities to the steps in capital budgeting process:
Steps in the capital budgeting process:a. Develop strategiesb. Planc. Actd. Control
Business activities:
1. A manager evaluates progress one year into the project.
2. Employees submit suggestions for new investments.
3. The company builds a new factory.
4. Top management attends a retreat to set long-term goals.
5. Proposed investments are analyzed.
6. Proposed investments are ranked.
7. New equipment is purchased.
Copyright © 2014 Pearson Education, Inc. Publishing as Prentice Hall 26-15
Match the following business activities to the steps in capital budgeting process:
Steps in the capital budgeting process:a. Develop strategiesb. Planc. Actd. Control
Business activities:
d 1. A manager evaluates progress one year into the project.
2. Employees submit suggestions for new investments.
3. The company builds a new factory.
4. Top management attends a retreat to set long-term goals.
5. Proposed investments are analyzed.
6. Proposed investments are ranked.
7. New equipment is purchased.
Copyright © 2014 Pearson Education, Inc. Publishing as Prentice Hall 26-16

Match the following business activities to the steps in capital budgeting process:
Steps in the capital budgeting process:a. Develop strategiesb. Planc. Actd. Control
Business activities:
d 1. A manager evaluates progress one year into the project.
b 2. Employees submit suggestions for new investments.
3. The company builds a new factory.
4. Top management attends a retreat to set long-term goals.
5. Proposed investments are analyzed.
6. Proposed investments are ranked.
7. New equipment is purchased.
Copyright © 2014 Pearson Education, Inc. Publishing as Prentice Hall 26-17

Match the following business activities to the steps in capital budgeting process:
Steps in the capital budgeting process:a. Develop strategiesb. Planc. Actd. Control
Business activities:
d 1. A manager evaluates progress one year into the project.
b 2. Employees submit suggestions for new investments.
c 3. The company builds a new factory.
4. Top management attends a retreat to set long-term goals.
5. Proposed investments are analyzed.
6. Proposed investments are ranked.
7. New equipment is purchased.
Copyright © 2014 Pearson Education, Inc. Publishing as Prentice Hall 26-18

Match the following business activities to the steps in capital budgeting process:
Steps in the capital budgeting process:a. Develop strategiesb. Planc. Actd. Control
Business activities:
d 1. A manager evaluates progress one year into the project.
b 2. Employees submit suggestions for new investments.
c 3. The company builds a new factory.
a 4. Top management attends a retreat to set long-term goals.
5. Proposed investments are analyzed.
6. Proposed investments are ranked.
7. New equipment is purchased.
Copyright © 2014 Pearson Education, Inc. Publishing as Prentice Hall 26-19
Match the following business activities to the steps in capital budgeting process:
Steps in the capital budgeting process:a. Develop strategiesb. Planc. Actd. Control
Business activities:
d 1. A manager evaluates progress one year into the project.
b 2. Employees submit suggestions for new investments.
c 3. The company builds a new factory.
a 4. Top management attends a retreat to set long-term goals.
b 5. Proposed investments are analyzed.
6. Proposed investments are ranked.
7. New equipment is purchased.
Copyright © 2014 Pearson Education, Inc. Publishing as Prentice Hall 26-20
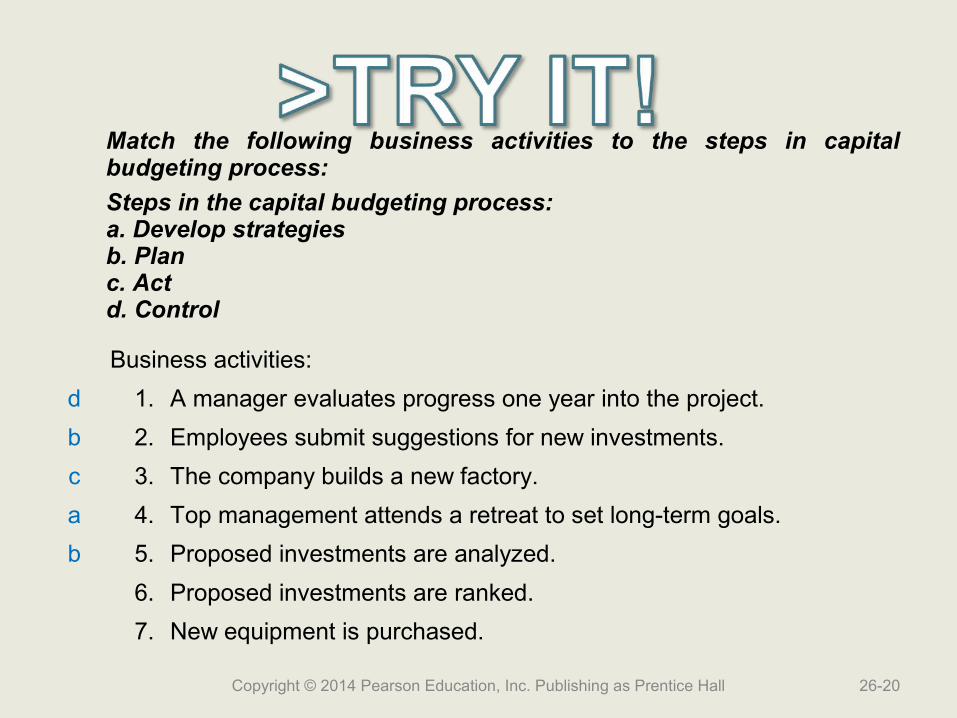
Match the following business activities to the steps in capital budgeting process:
Steps in the capital budgeting process:a. Develop strategiesb. Planc. Actd. Control
Business activities:
d 1. A manager evaluates progress one year into the project.
b 2. Employees submit suggestions for new investments.
c 3. The company builds a new factory.
a 4. Top management attends a retreat to set long-term goals.
b 5. Proposed investments are analyzed.
b 6. Proposed investments are ranked.
7. New equipment is purchased.
Copyright © 2014 Pearson Education, Inc. Publishing as Prentice Hall 26-21

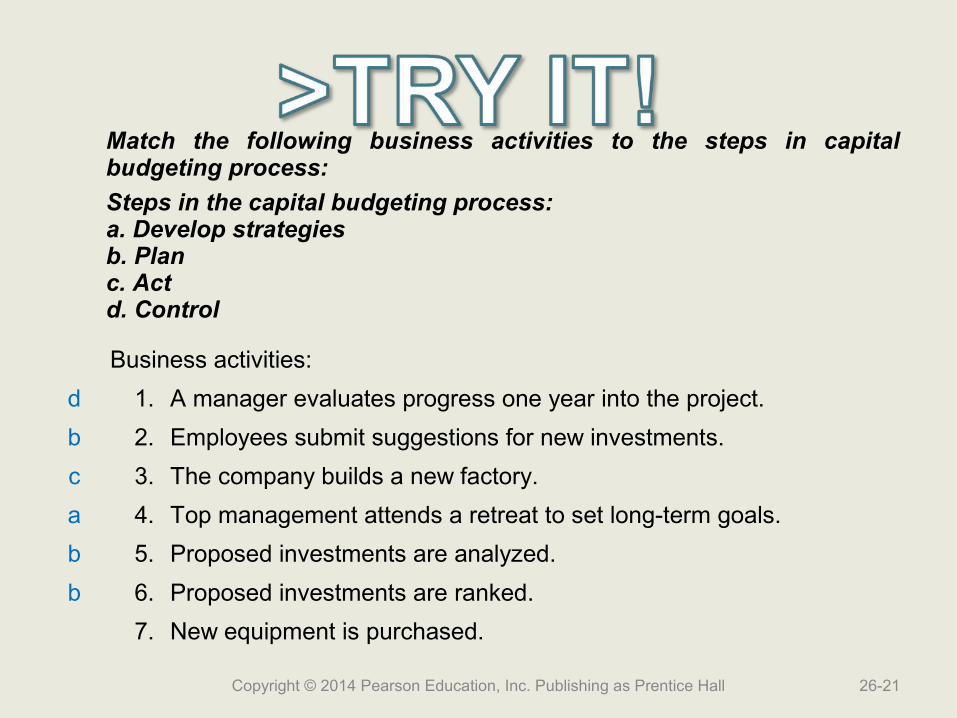
Match the following business activities to the steps in capital budgeting process:
Steps in the capital budgeting process:a. Develop strategiesb. Planc. Actd. Control
Business activities:
d 1. A manager evaluates progress one year into the project.
b 2. Employees submit suggestions for new investments.
c 3. The company builds a new factory.
a 4. Top management attends a retreat to set long-term goals.
b 5. Proposed investments are analyzed.
b 6. Proposed investments are ranked.
c 7. New equipment is purchased.
Copyright © 2014 Pearson Education, Inc. Publishing as Prentice Hall 26-22

Learning Objective 2
Use the payback and Use the payback and the accounting rate of the accounting rate of
return methods to make return methods to make capital investment capital investment
decisionsdecisions
26-23Copyright © 2014 Pearson Education, Inc. Publishing as Prentice Hall
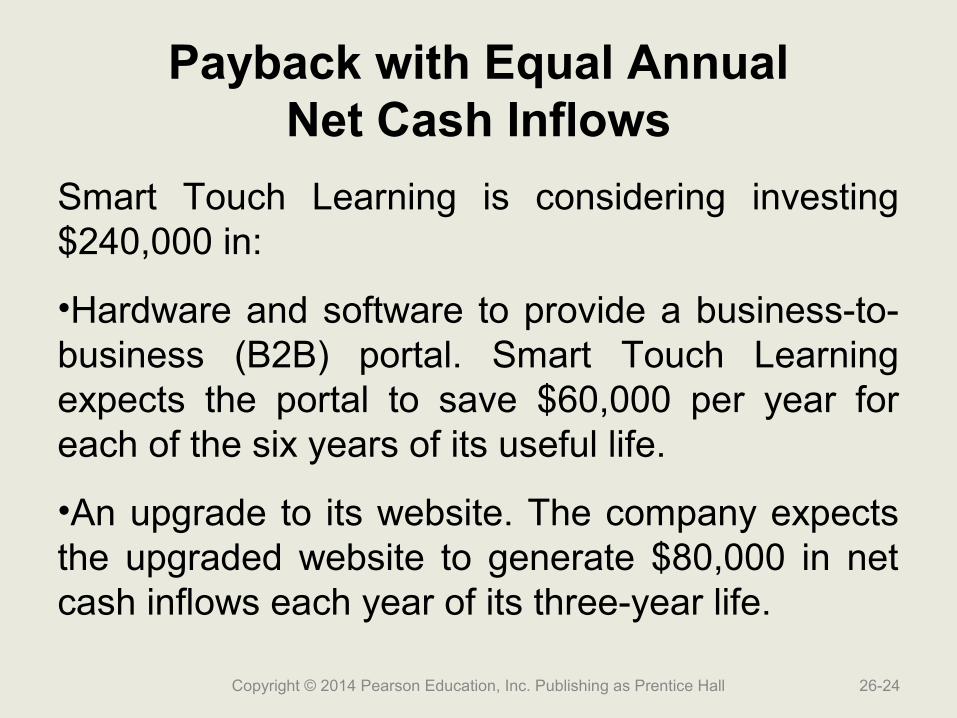
Payback with Equal AnnualNet Cash Inflows
Smart Touch Learning is considering investing $240,000 in:
•Hardware and software to provide a business-to-business (B2B) portal. Smart Touch Learning expects the portal to save $60,000 per year for each of the six years of its useful life.
•An upgrade to its website. The company expects the upgraded website to generate $80,000 in net cash inflows each year of its three-year life.
Copyright © 2014 Pearson Education, Inc. Publishing as Prentice Hall 26-24

Payback with Equal AnnualNet Cash Inflows
Payback =Amount invested
Expected annual net cash inflow
Copyright © 2014 Pearson Education, Inc. Publishing as Prentice Hall 26-25
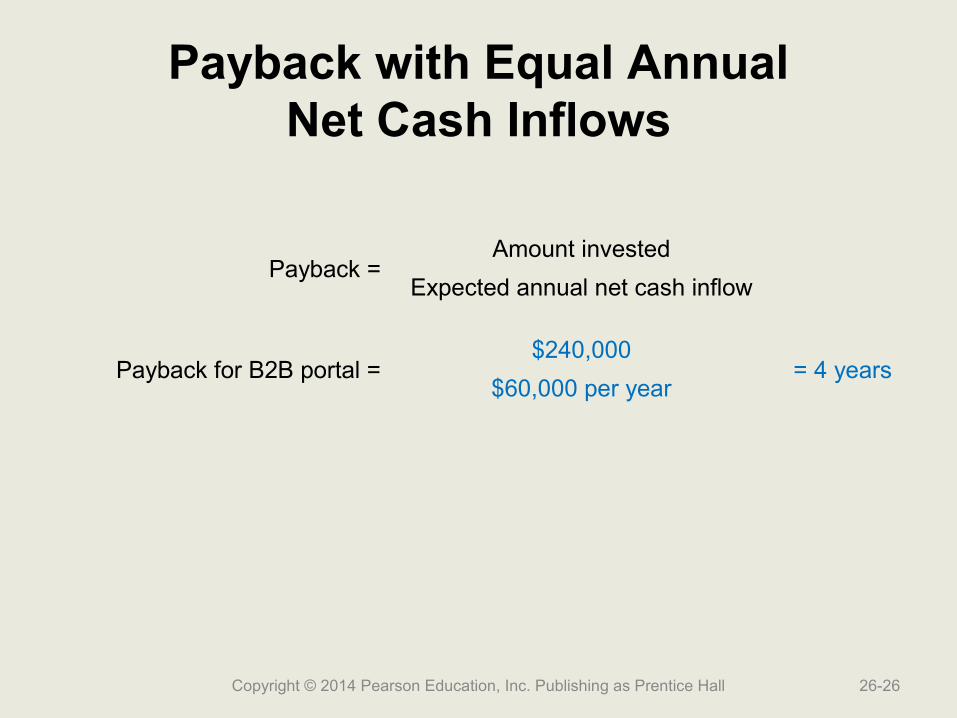
Payback with Equal AnnualNet Cash Inflows
Payback =Amount invested
Expected annual net cash inflow
Payback for B2B portal =$240,000
= 4 years$60,000 per year
Copyright © 2014 Pearson Education, Inc. Publishing as Prentice Hall 26-26
Payback with Equal AnnualNet Cash Inflows
Payback =Amount invested
Expected annual net cash inflow
Payback for B2B portal =$240,000
= 4 years$60,000 per year
Payback for website upgrade =$240,000
= 3 years$80,000 per year
Copyright © 2014 Pearson Education, Inc. Publishing as Prentice Hall 26-27
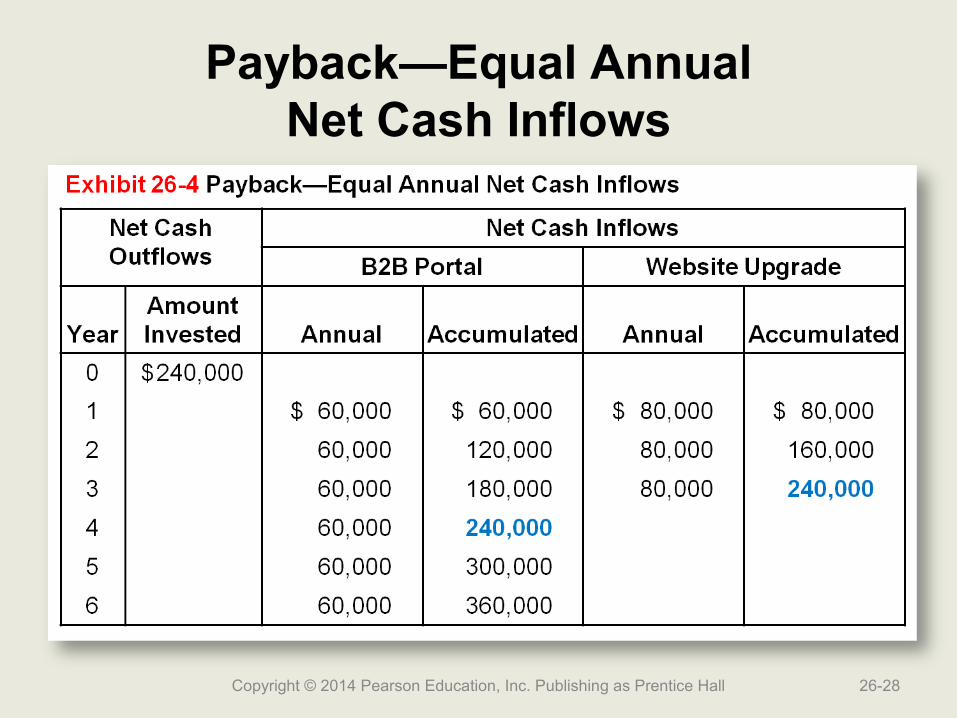
Payback—Equal AnnualNet Cash Inflows
Copyright © 2014 Pearson Education, Inc. Publishing as Prentice Hall 26-28

Payback—Unequal AnnualNet Cash Inflows
Copyright © 2014 Pearson Education, Inc. Publishing as Prentice Hall 26-29
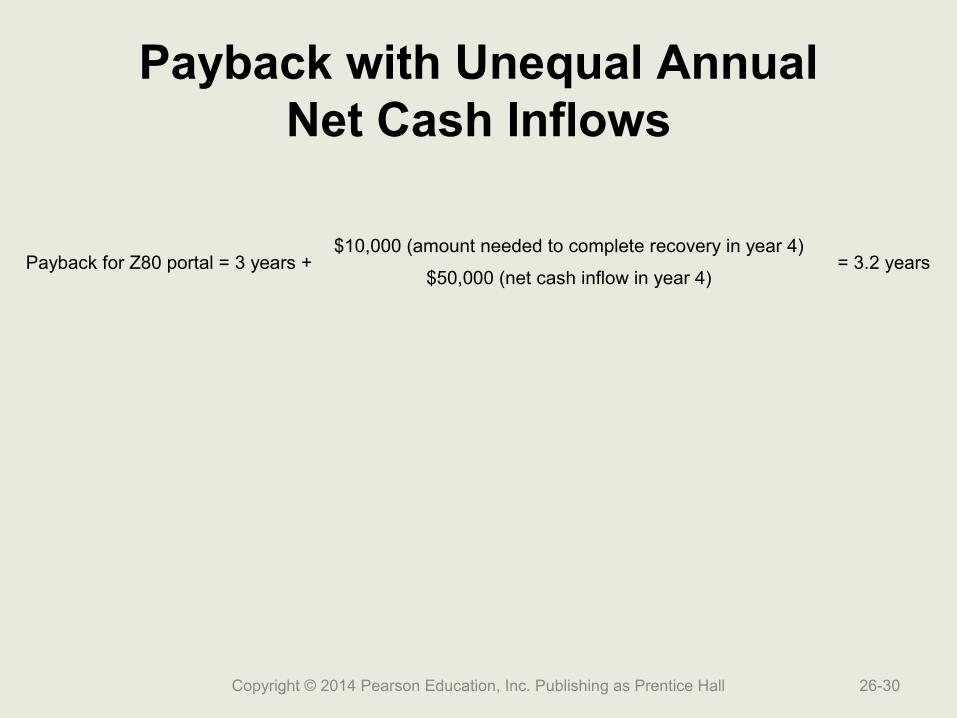
Payback with Unequal AnnualNet Cash Inflows
Payback for Z80 portal = 3 years +$10,000 (amount needed to complete recovery in year 4)
= 3.2 years$50,000 (net cash inflow in year 4)
Copyright © 2014 Pearson Education, Inc. Publishing as Prentice Hall 26-30

Ranking by the Payback Method
Rank Project Payback Period
1 Website upgrade 3.0 years
2 Z80 portal 3.2 years
3 B2B portal 4.0 years
Copyright © 2014 Pearson Education, Inc. Publishing as Prentice Hall 26-31
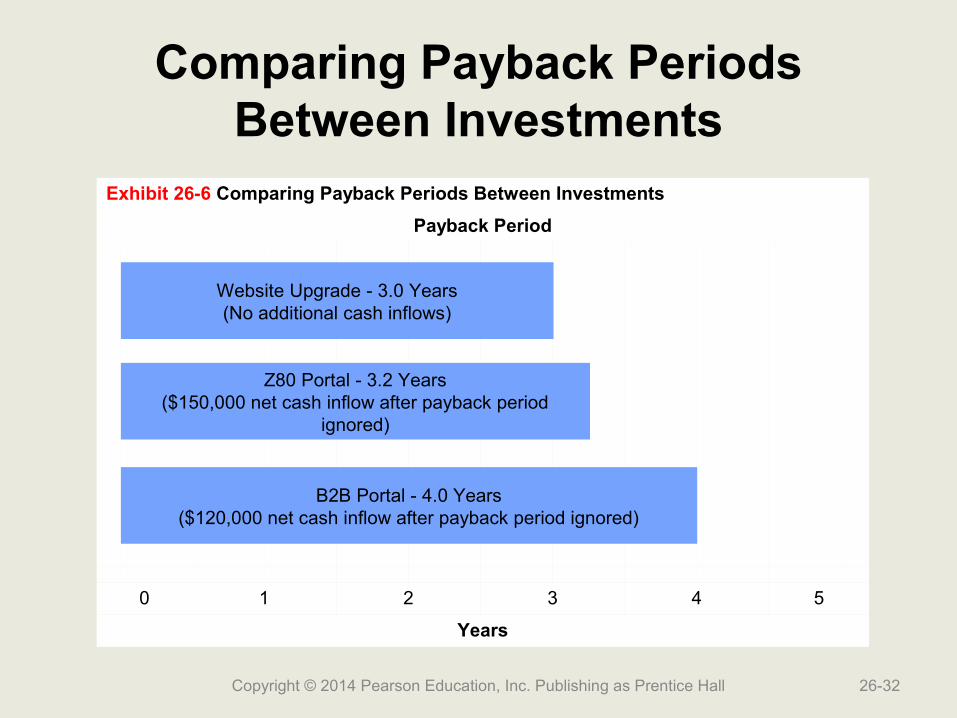
Comparing Payback Periods Between Investments
Exhibit 26-6 Comparing Payback Periods Between Investments
Payback Period
0 1 2 3 4 5
Years
Copyright © 2014 Pearson Education, Inc. Publishing as Prentice Hall 26-32
B2B Portal - 4.0 Years($120,000 net cash inflow after payback period ignored)
Z80 Portal - 3.2 Years($150,000 net cash inflow after payback period
ignored)
Website Upgrade - 3.0 Years(No additional cash inflows)
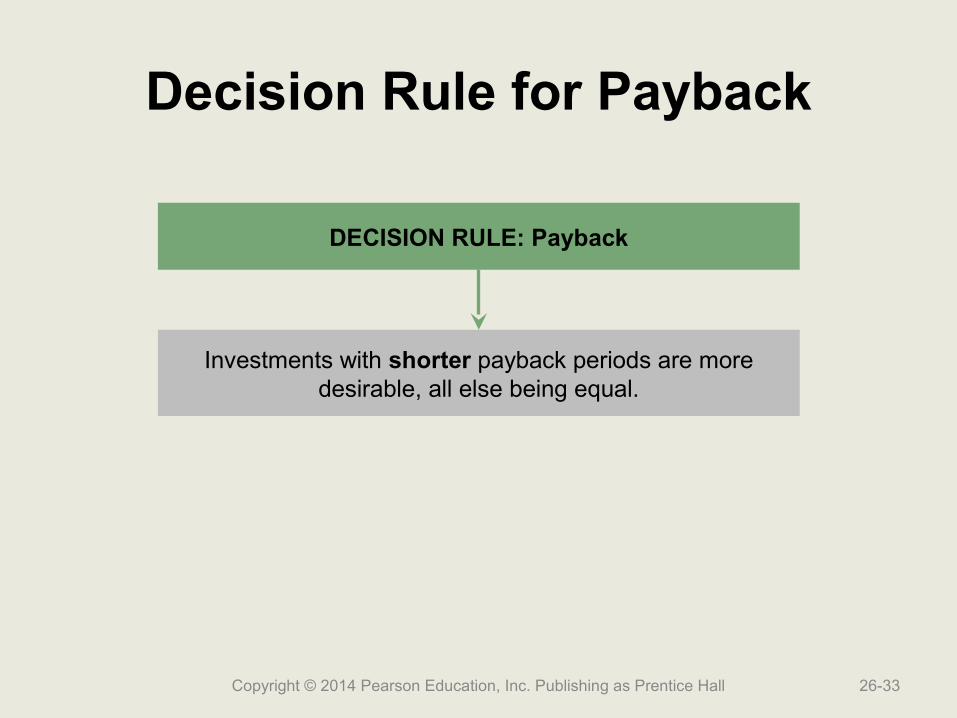
Decision Rule for Payback
Copyright © 2014 Pearson Education, Inc. Publishing as Prentice Hall 26-33
DECISION RULE: Payback
Investments with shorter payback periods are moredesirable, all else being equal.
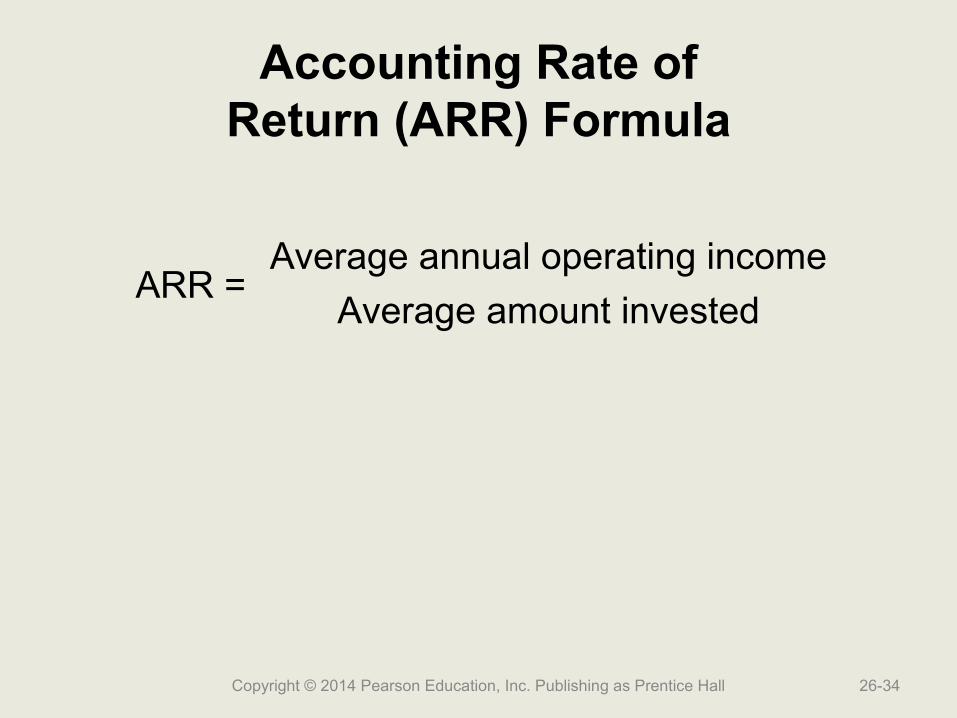
Accounting Rate ofReturn (ARR) Formula
Copyright © 2014 Pearson Education, Inc. Publishing as Prentice Hall 26-34
ARR =Average annual operating income
Average amount invested
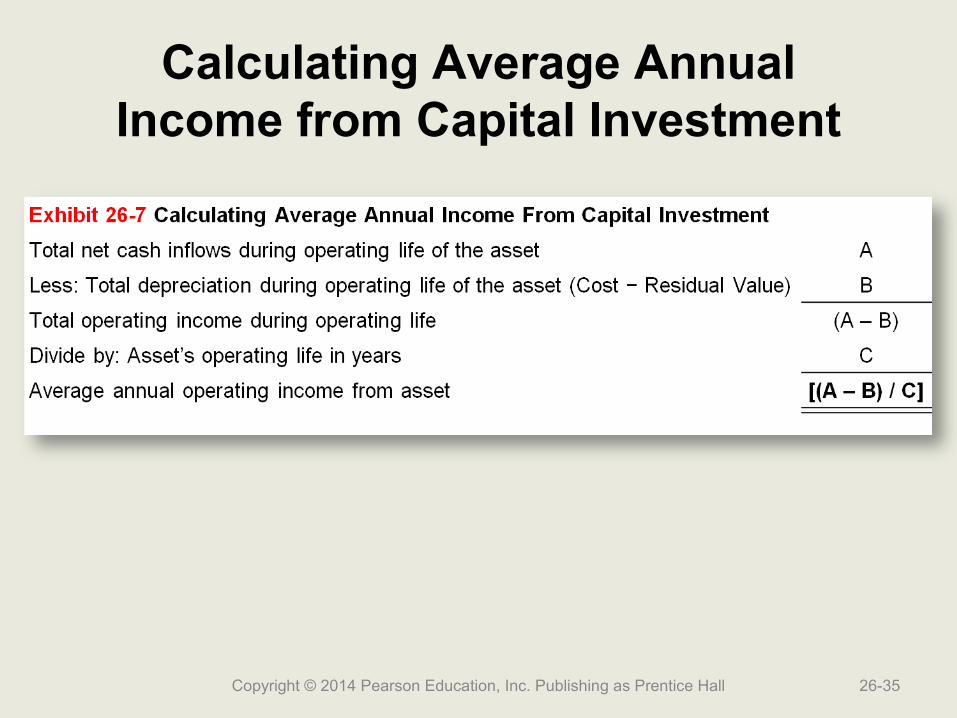
Calculating Average AnnualIncome from Capital Investment
Copyright © 2014 Pearson Education, Inc. Publishing as Prentice Hall 26-35
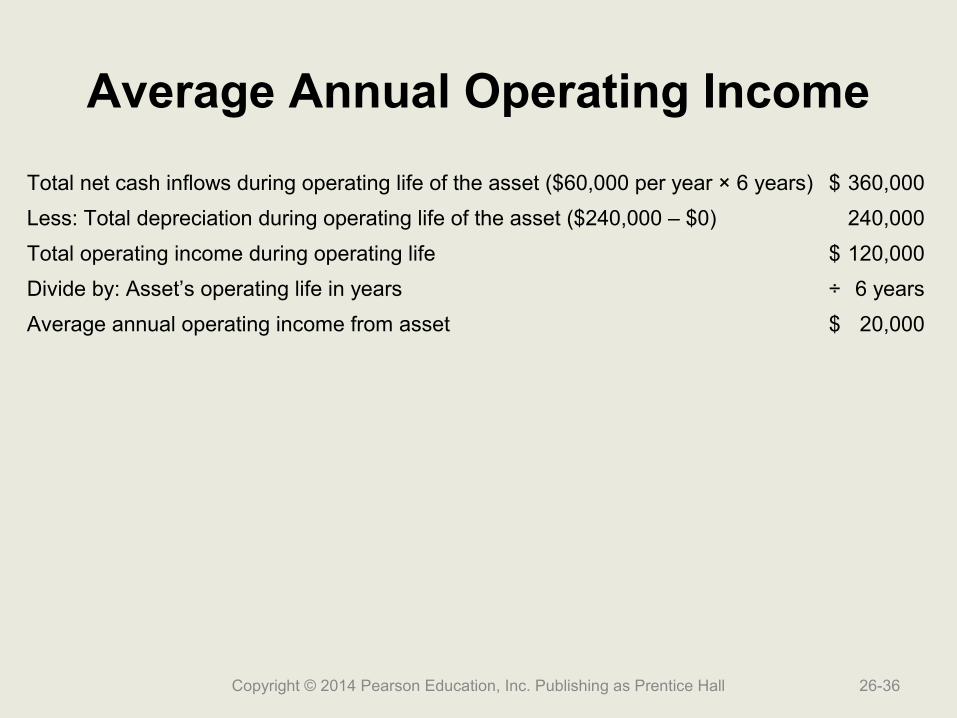
Average Annual Operating Income
Total net cash inflows during operating life of the asset ($60,000 per year × 6 years) $ 360,000
Less: Total depreciation during operating life of the asset ($240,000 – $0) 240,000
Total operating income during operating life $ 120,000
Divide by: Asset’s operating life in years ÷ 6 years
Average annual operating income from asset $ 20,000
Copyright © 2014 Pearson Education, Inc. Publishing as Prentice Hall 26-36

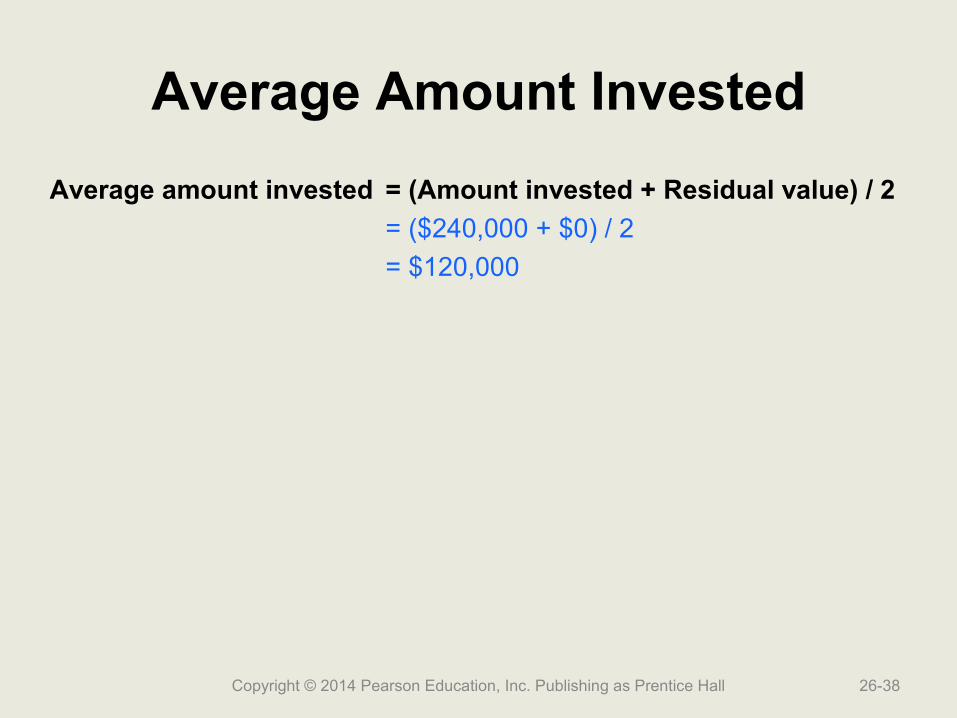
Average Amount Invested
Average amount invested = (Amount invested + Residual value) / 2
Copyright © 2014 Pearson Education, Inc. Publishing as Prentice Hall 26-37
Average Amount Invested
Average amount invested = (Amount invested + Residual value) / 2
= ($240,000 + $0) / 2
= $120,000
Copyright © 2014 Pearson Education, Inc. Publishing as Prentice Hall 26-38

ARR of B2B
Copyright © 2014 Pearson Education, Inc. Publishing as Prentice Hall 26-39
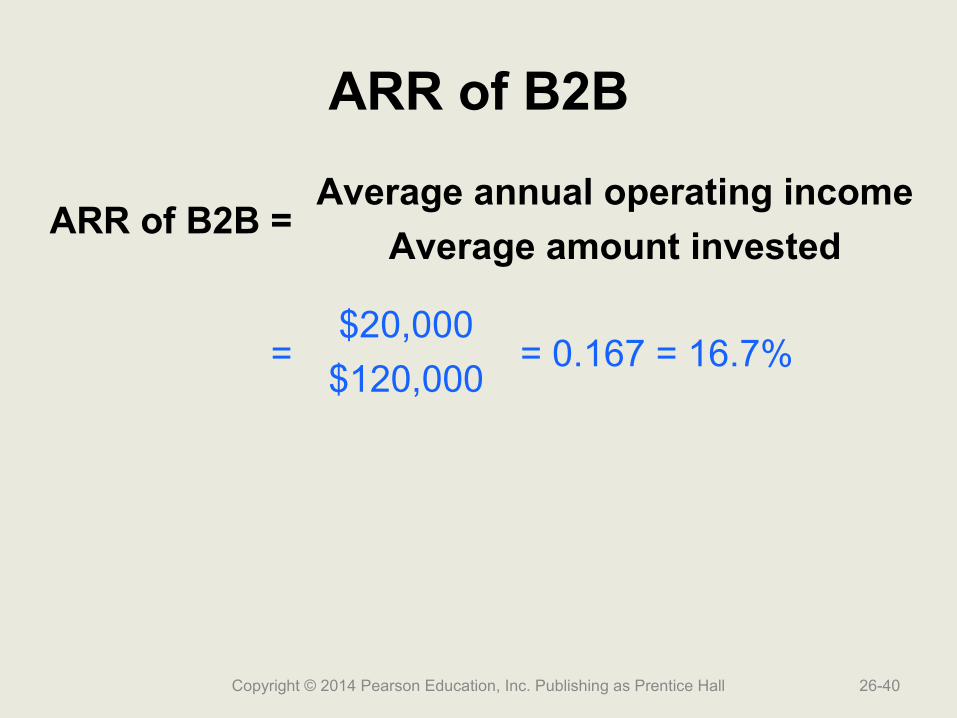
ARR of B2B =Average annual operating income
Average amount invested
ARR of B2B
Copyright © 2014 Pearson Education, Inc. Publishing as Prentice Hall 26-40
ARR of B2B =Average annual operating income
Average amount invested
=$20,000
= 0.167 = 16.7%$120,000
Average Annual Operating Income
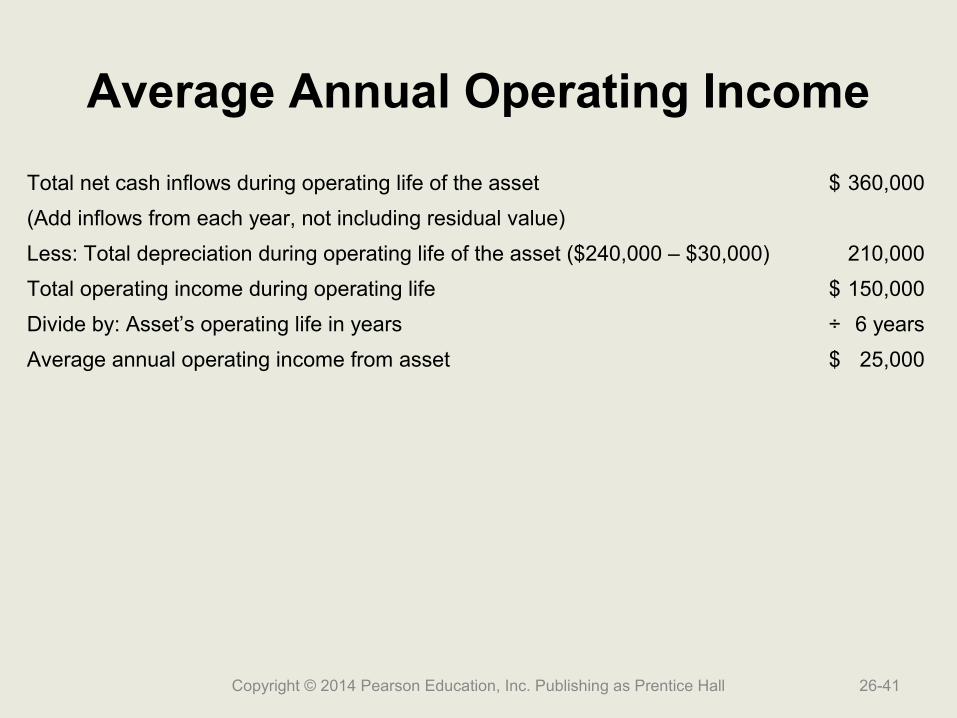
Total net cash inflows during operating life of the asset $ 360,000
(Add inflows from each year, not including residual value)
Less: Total depreciation during operating life of the asset ($240,000 – $30,000) 210,000
Total operating income during operating life $ 150,000
Divide by: Asset’s operating life in years ÷ 6 years
Average annual operating income from asset $ 25,000
Copyright © 2014 Pearson Education, Inc. Publishing as Prentice Hall 26-41
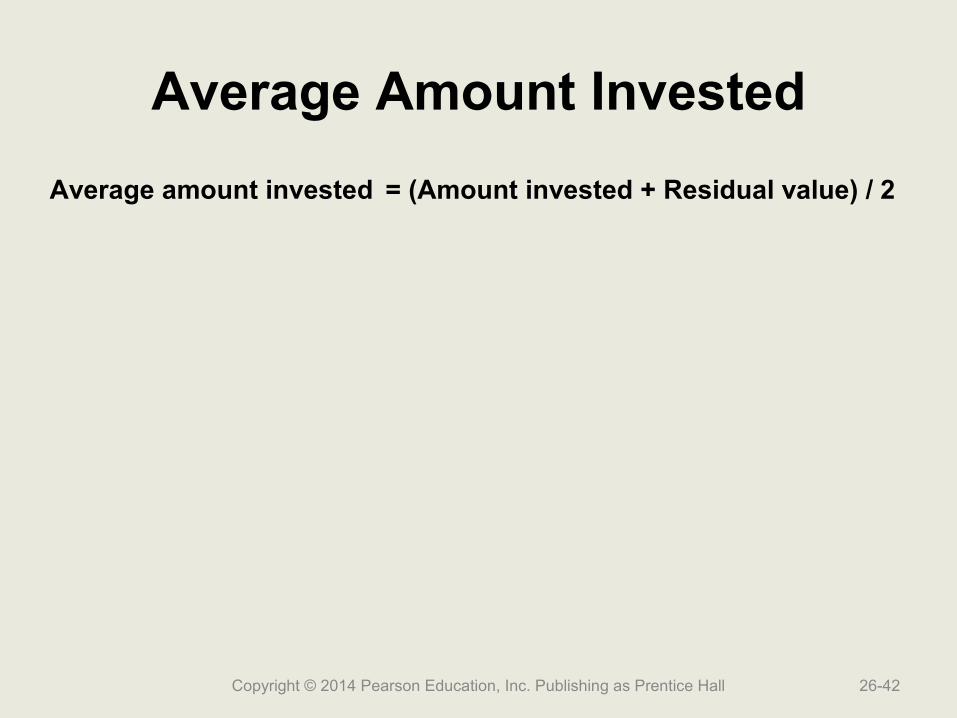
Average Amount Invested
Average amount invested = (Amount invested + Residual value) / 2
Copyright © 2014 Pearson Education, Inc. Publishing as Prentice Hall 26-42
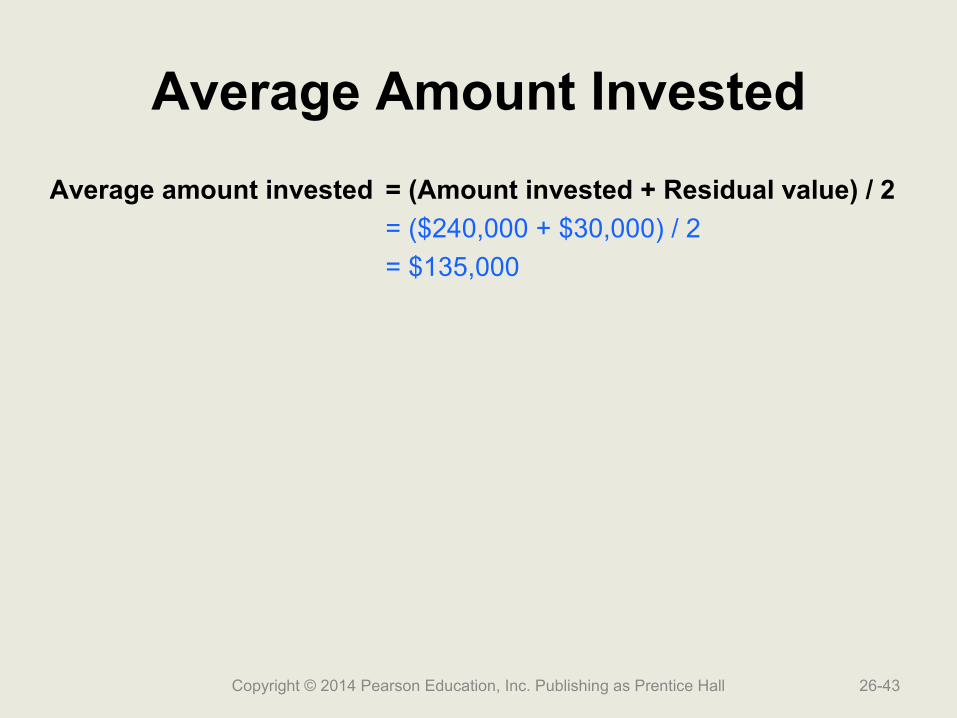
Average Amount Invested
Average amount invested = (Amount invested + Residual value) / 2
= ($240,000 + $30,000) / 2
= $135,000
Copyright © 2014 Pearson Education, Inc. Publishing as Prentice Hall 26-43
ARR of Z80
Copyright © 2014 Pearson Education, Inc. Publishing as Prentice Hall 26-44
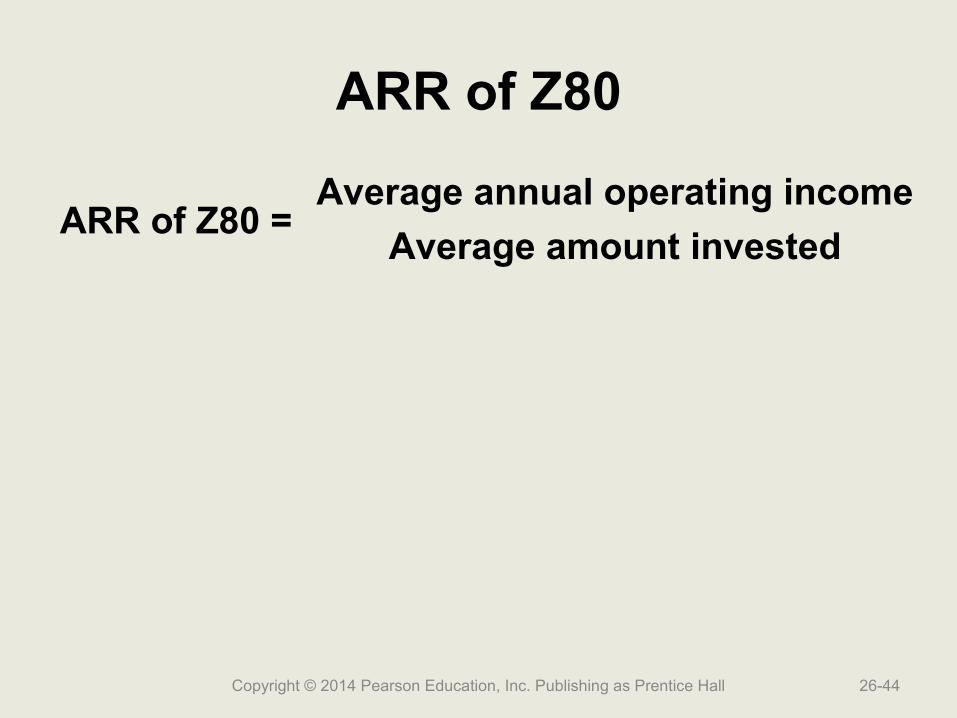
ARR of Z80 =Average annual operating income
Average amount invested
ARR of Z80
Copyright © 2014 Pearson Education, Inc. Publishing as Prentice Hall 26-45
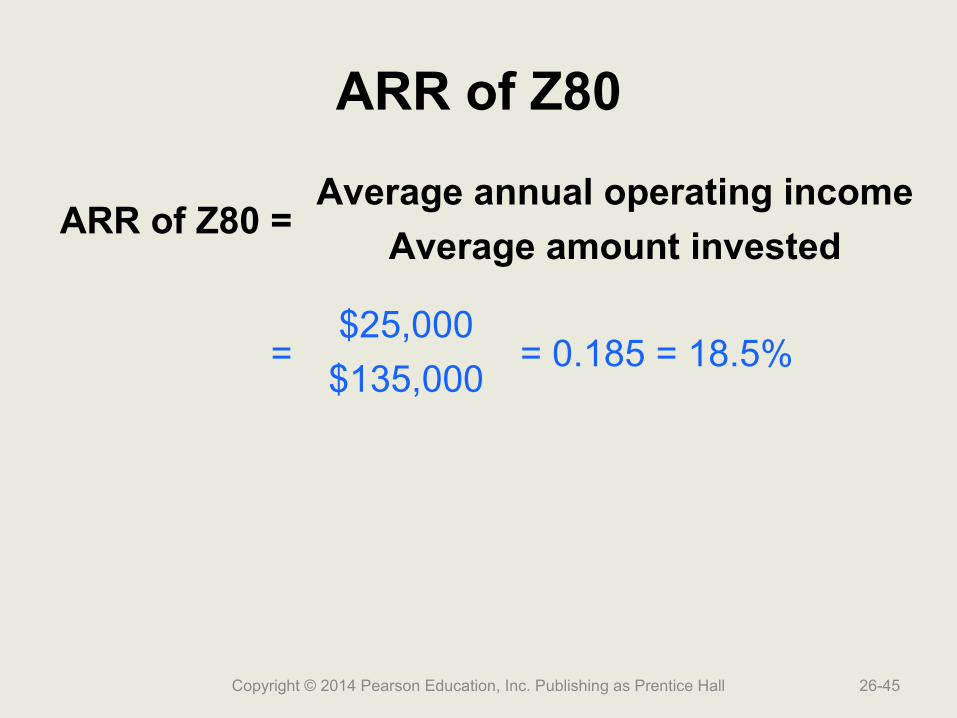
ARR of Z80 =Average annual operating income
Average amount invested
=$25,000
= 0.185 = 18.5%$135,000
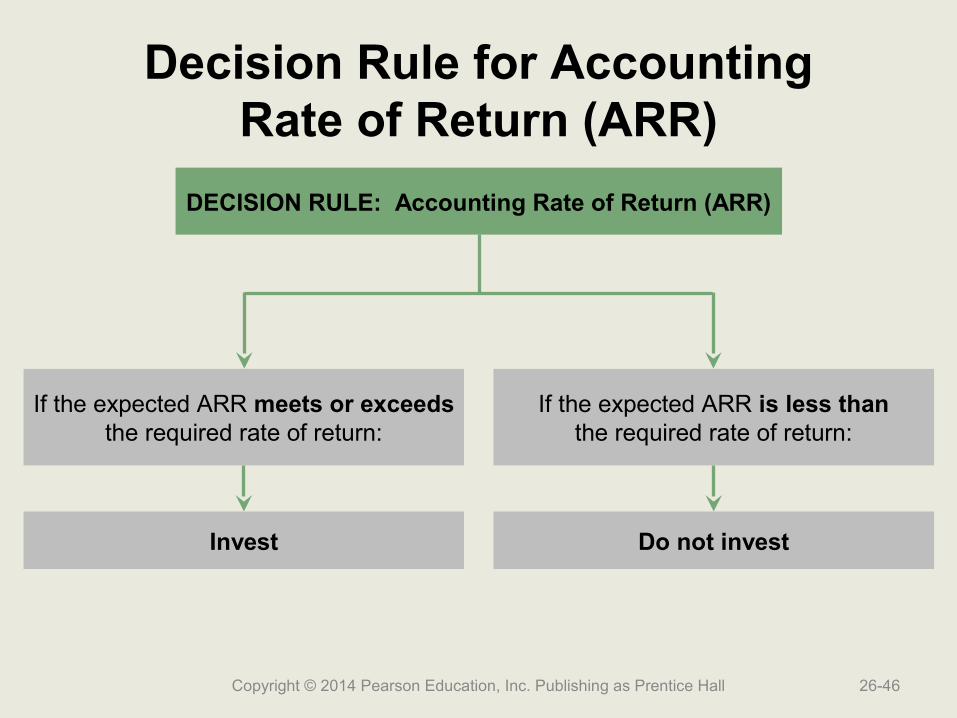
Decision Rule for AccountingRate of Return (ARR)
Copyright © 2014 Pearson Education, Inc. Publishing as Prentice Hall 26-46
DECISION RULE: Accounting Rate of Return (ARR)
If the expected ARR meets or exceedsthe required rate of return:
If the expected ARR is less thanthe required rate of return:
Invest Do not invest
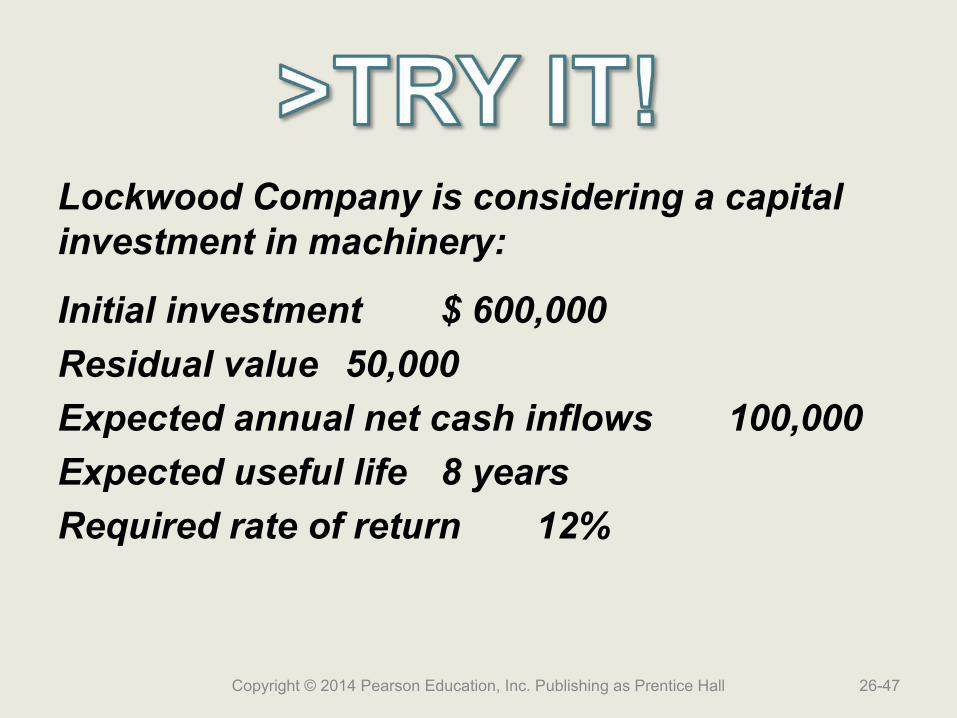
Lockwood Company is considering a capital investment in machinery:
Initial investment $ 600,000
Residual value 50,000
Expected annual net cash inflows 100,000
Expected useful life 8 years
Required rate of return 12%
Copyright © 2014 Pearson Education, Inc. Publishing as Prentice Hall 26-47
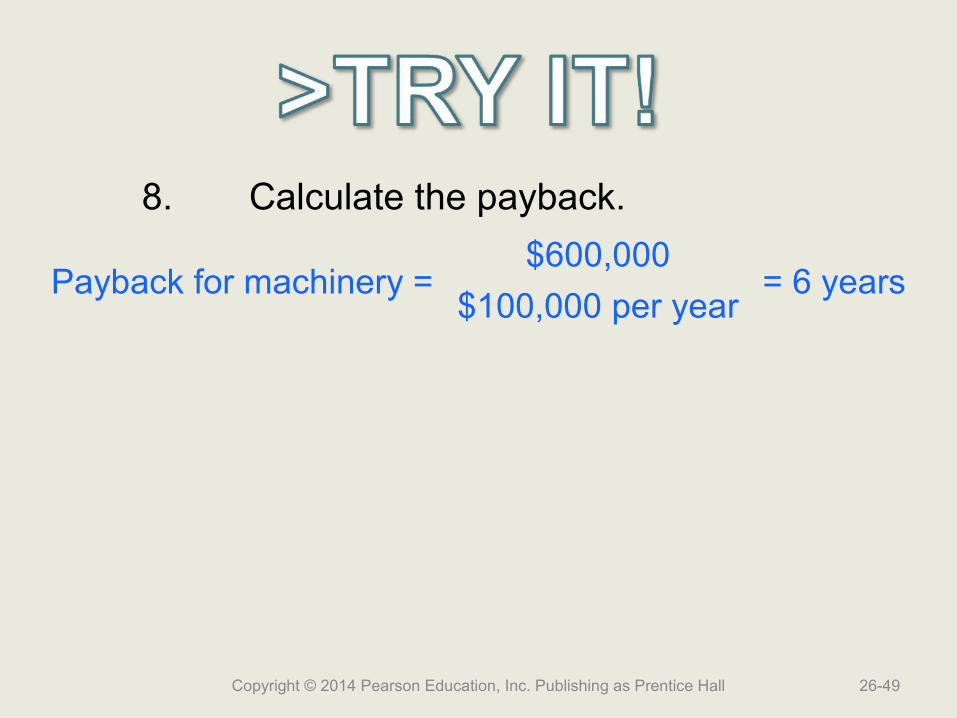
8. Calculate the payback.
Copyright © 2014 Pearson Education, Inc. Publishing as Prentice Hall 26-48
8. Calculate the payback.
Copyright © 2014 Pearson Education, Inc. Publishing as Prentice Hall 26-49
Payback for machinery =$600,000
= 6 years$100,000 per year
Copyright © 2014 Pearson Education, Inc. Publishing as Prentice Hall 26-50
9. Calculate the ARR. Round the percentage to two decimal places.
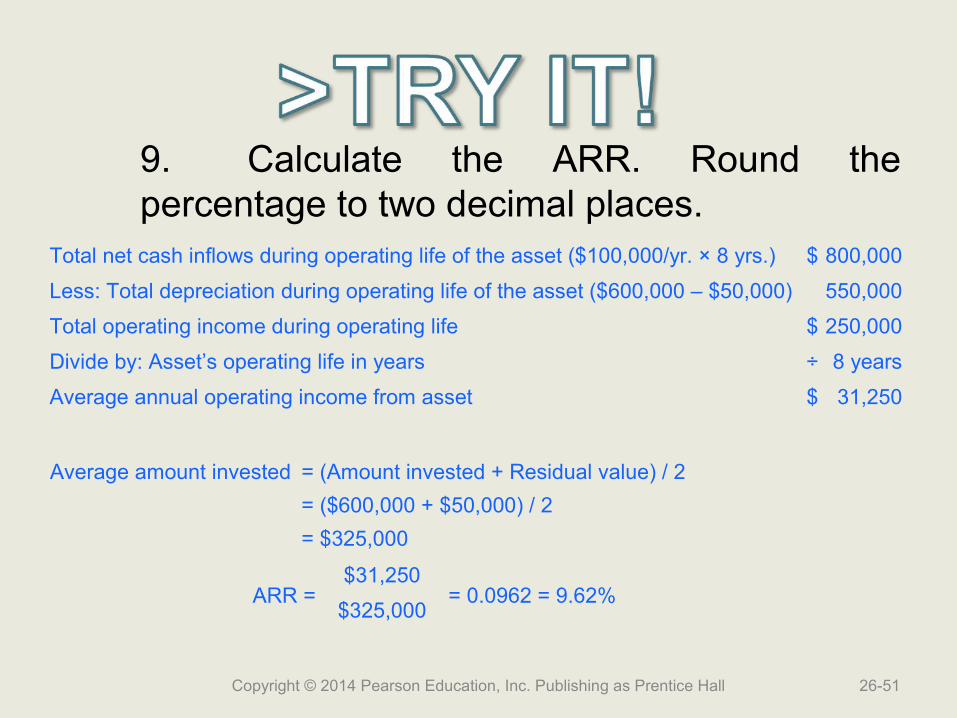
Total net cash inflows during operating life of the asset ($100,000/yr. × 8 yrs.) $ 800,000
Less: Total depreciation during operating life of the asset ($600,000 – $50,000) 550,000
Total operating income during operating life $ 250,000
Divide by: Asset’s operating life in years ÷ 8 years
Average annual operating income from asset $ 31,250
Copyright © 2014 Pearson Education, Inc. Publishing as Prentice Hall 26-51
Average amount invested = (Amount invested + Residual value) / 2
= ($600,000 + $50,000) / 2
= $325,000
ARR =$31,250
= 0.0962 = 9.62%$325,000
9. Calculate the ARR. Round the percentage to two decimal places.

10. Based on your answers to the above questions, should Lockwood invest in the machinery?
Copyright © 2014 Pearson Education, Inc. Publishing as Prentice Hall 26-52
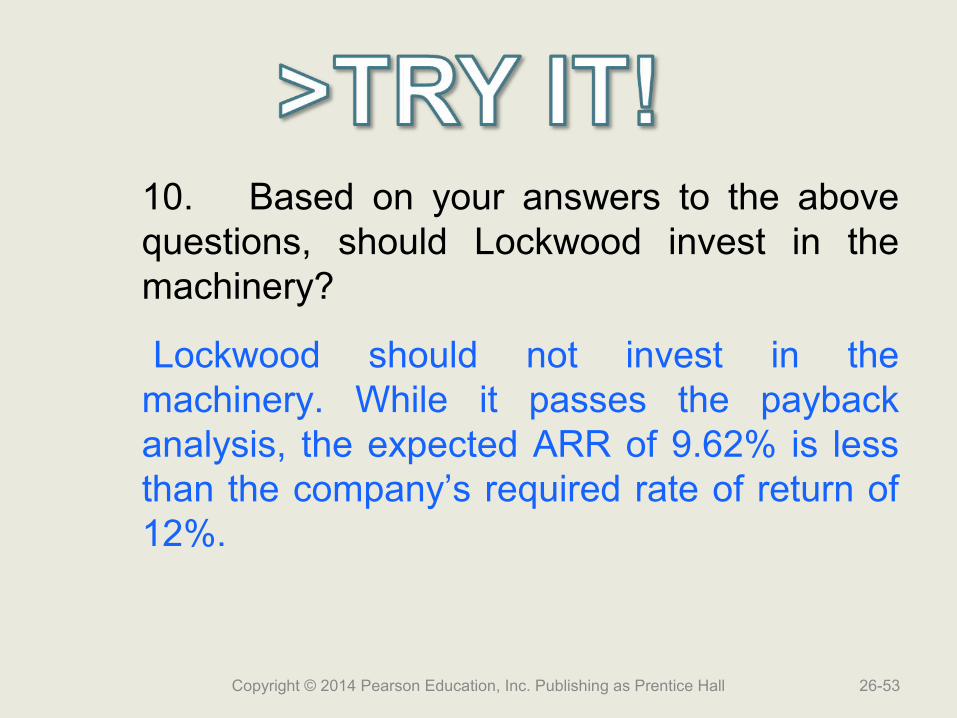
10. Based on your answers to the above questions, should Lockwood invest in the machinery?
Lockwood should not invest in the machinery. While it passes the payback analysis, the expected ARR of 9.62% is less than the company’s required rate of return of 12%.
Copyright © 2014 Pearson Education, Inc. Publishing as Prentice Hall 26-53
Learning Objective 3
Use the time value of Use the time value of money to compute the money to compute the present values of lump present values of lump
sums and annuitiessums and annuities
26-54Copyright © 2014 Pearson Education, Inc. Publishing as Prentice Hall
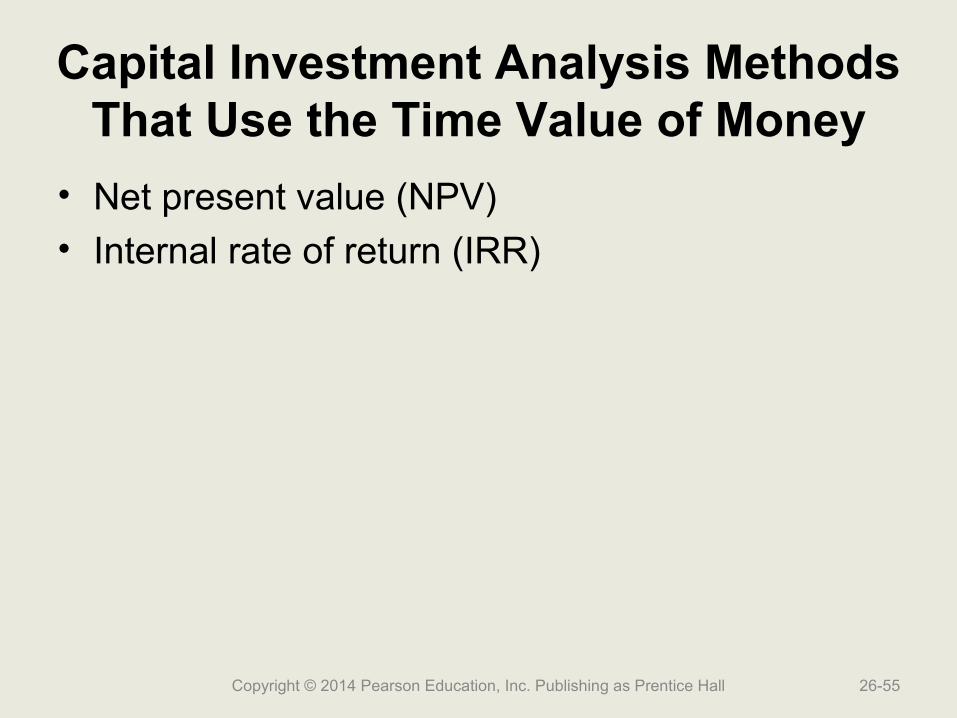
Capital Investment Analysis Methods That Use the Time Value of Money
• Net present value (NPV)• Internal rate of return (IRR)
Copyright © 2014 Pearson Education, Inc. Publishing as Prentice Hall 26-55
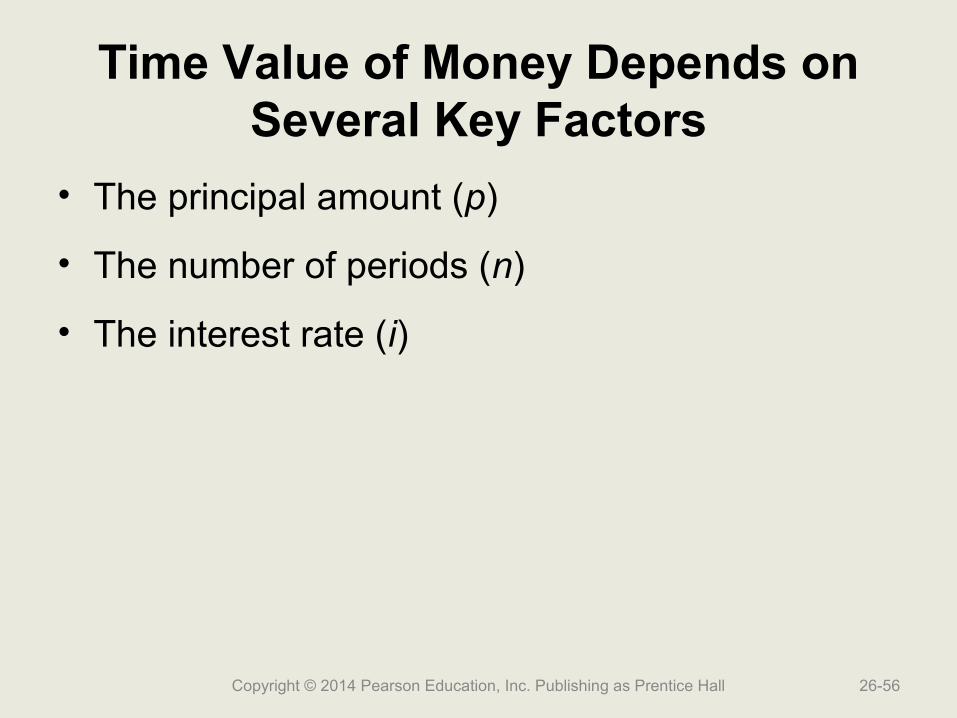
Time Value of Money Depends on Several Key Factors
• The principal amount (p)
• The number of periods (n)
• The interest rate (i)
Copyright © 2014 Pearson Education, Inc. Publishing as Prentice Hall 26-56
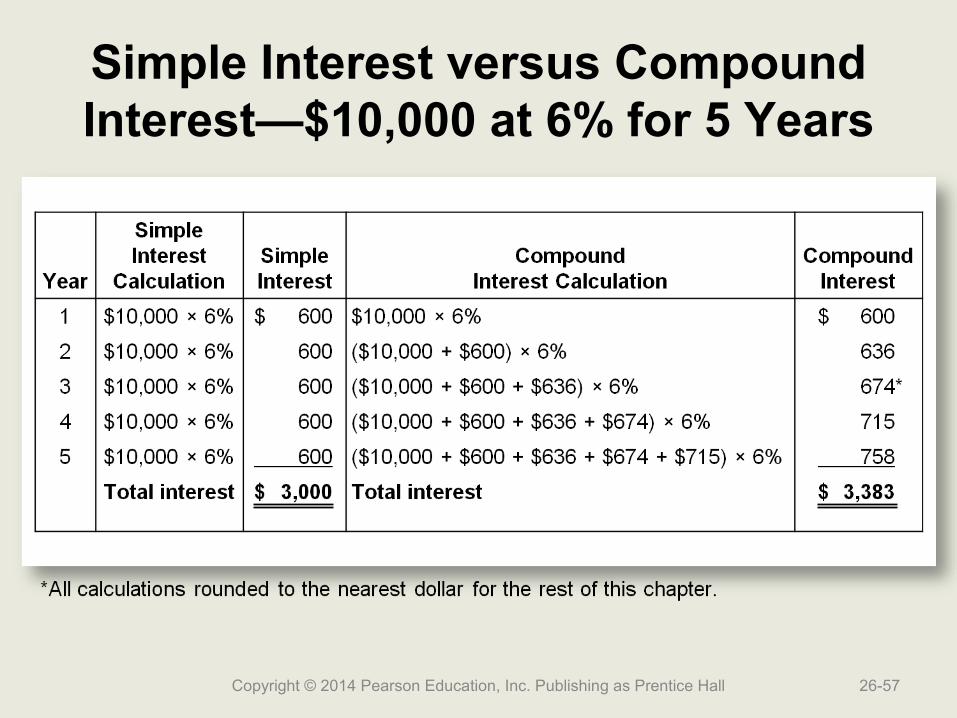
Simple Interest versus Compound Interest—$10,000 at 6% for 5 Years
Copyright © 2014 Pearson Education, Inc. Publishing as Prentice Hall 26-57
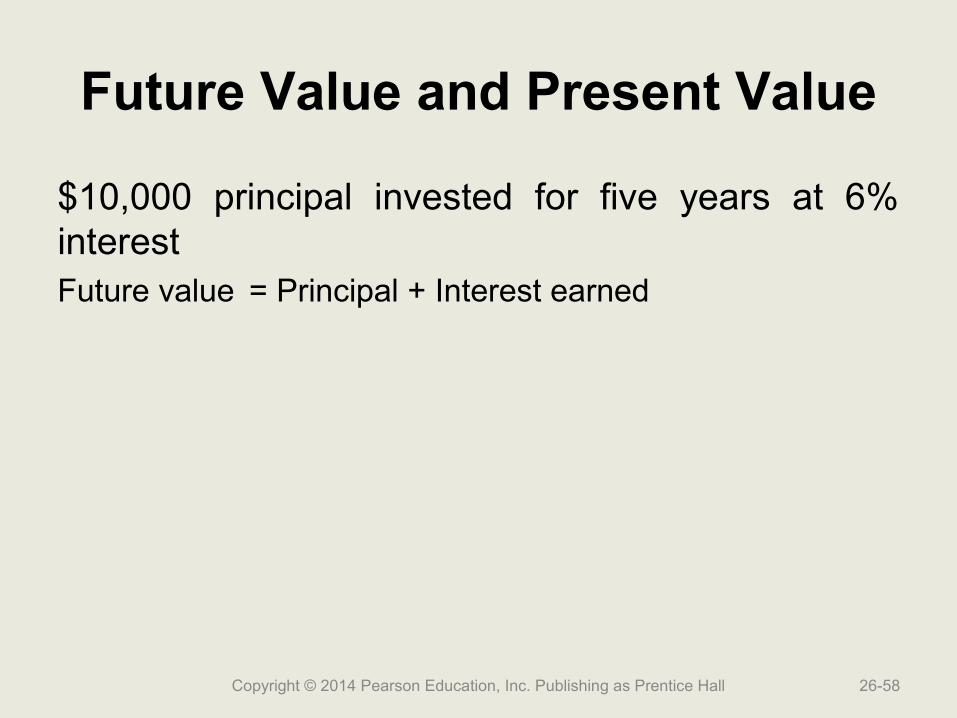
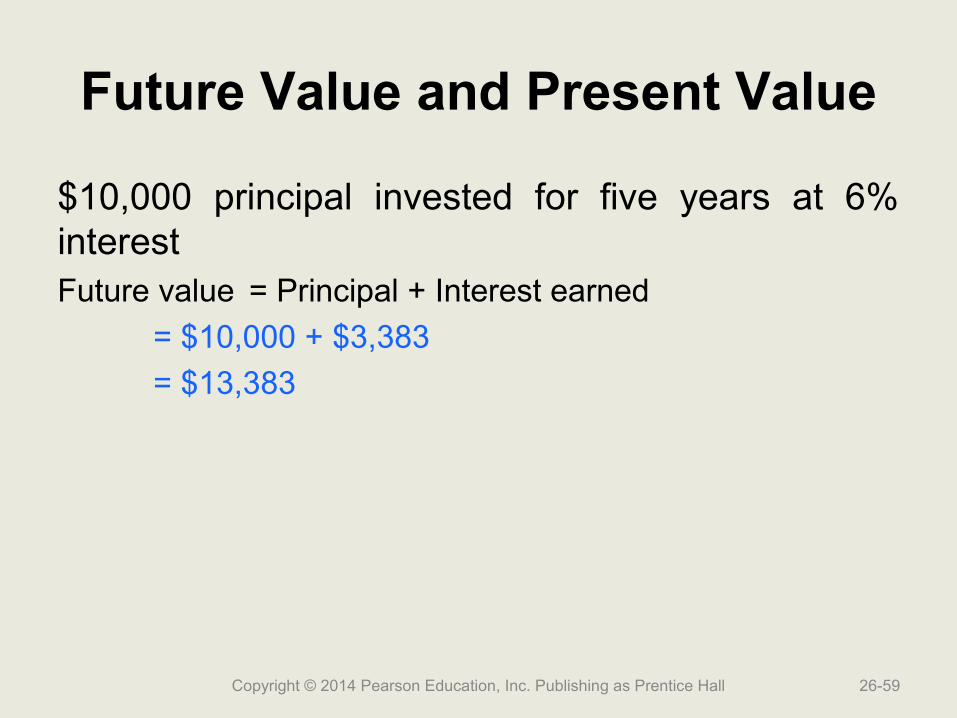
Future Value and Present Value
$10,000 principal invested for five years at 6% interestFuture value = Principal + Interest earned
Copyright © 2014 Pearson Education, Inc. Publishing as Prentice Hall 26-58
Future Value and Present Value
$10,000 principal invested for five years at 6% interestFuture value = Principal + Interest earned
= $10,000 + $3,383
= $13,383
Copyright © 2014 Pearson Education, Inc. Publishing as Prentice Hall 26-59
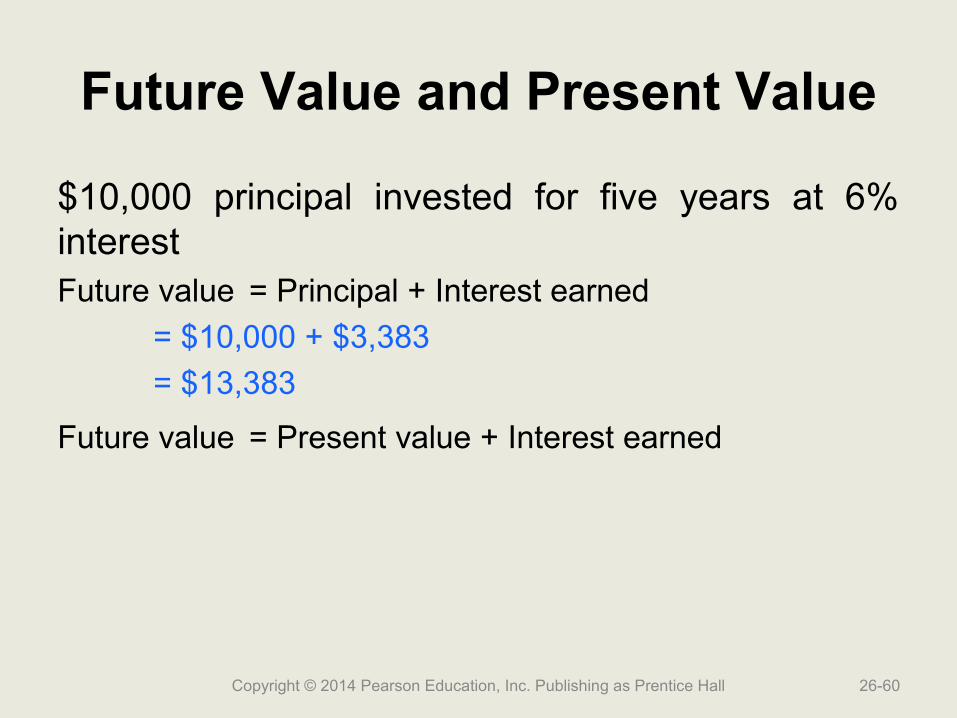
Future Value and Present Value
$10,000 principal invested for five years at 6% interestFuture value = Principal + Interest earned
= $10,000 + $3,383
= $13,383
Future value = Present value + Interest earned
Copyright © 2014 Pearson Education, Inc. Publishing as Prentice Hall 26-60

Future Value and Present Value
$10,000 principal invested for five years at 6% interestFuture value = Principal + Interest earned
= $10,000 + $3,383
= $13,383
Future value = Present value + Interest earned
We can rearrange the equation as follows:
Present value = Future Value – Interest earned
Copyright © 2014 Pearson Education, Inc. Publishing as Prentice Hall 26-61
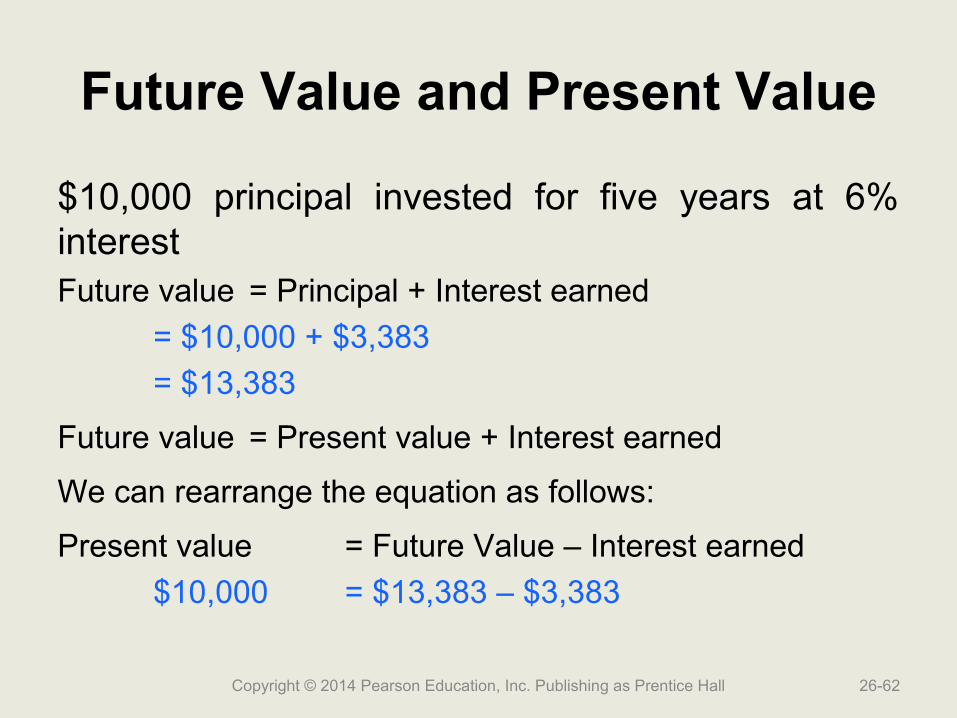
Future Value and Present Value
$10,000 principal invested for five years at 6% interestFuture value = Principal + Interest earned
= $10,000 + $3,383
= $13,383
Future value = Present value + Interest earned
We can rearrange the equation as follows:
Present value = Future Value – Interest earned
$10,000 = $13,383 – $3,383
Copyright © 2014 Pearson Education, Inc. Publishing as Prentice Hall 26-62
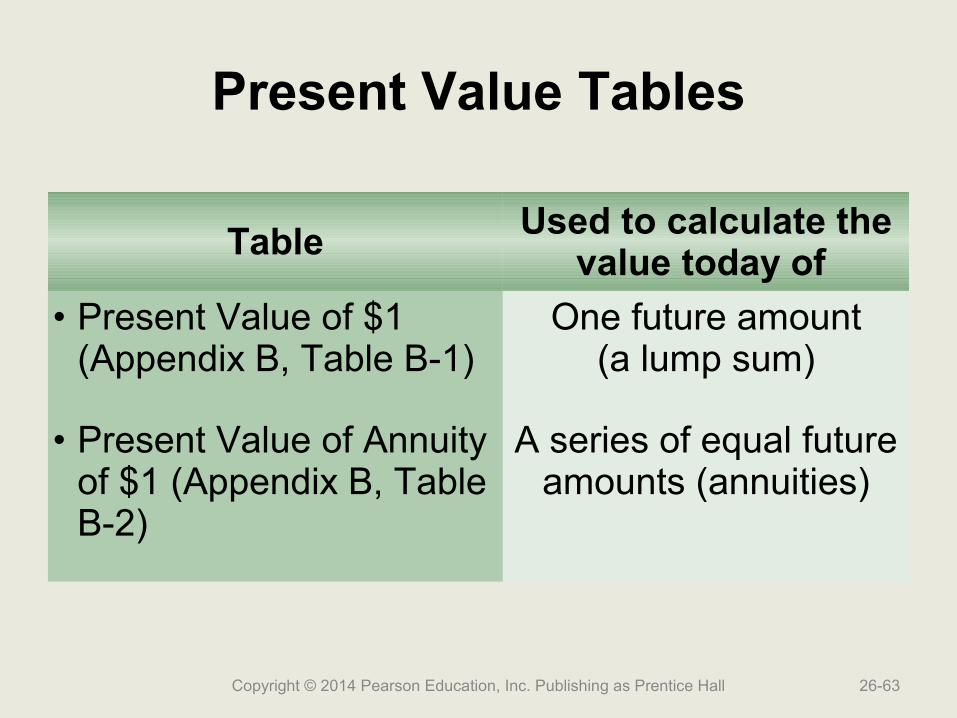
Present Value Tables
Copyright © 2014 Pearson Education, Inc. Publishing as Prentice Hall 26-63
Table Used to calculate the value today of
• Present Value of $1 (Appendix B, Table B-1)
One future amount(a lump sum)
• Present Value of Annuity of $1 (Appendix B, Table B-2)
A series of equal future amounts (annuities)
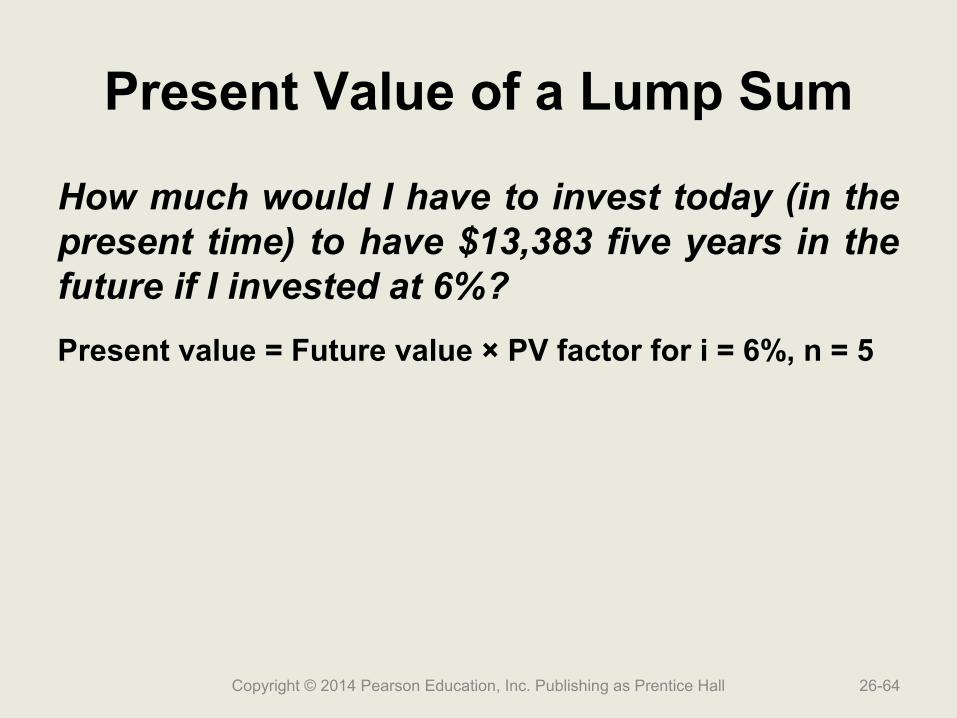
Present Value of a Lump Sum
How much would I have to invest today (in the present time) to have $13,383 five years in the future if I invested at 6%?
Present value = Future value × PV factor for i = 6%, n = 5
Copyright © 2014 Pearson Education, Inc. Publishing as Prentice Hall 26-64

Present Value of a Lump Sum
How much would I have to invest today (in the present time) to have $13,383 five years in the future if I invested at 6%?
Present value = Future value × PV factor for i = 6%, n = 5
= $13,383 × 0.747
= $9,997
Copyright © 2014 Pearson Education, Inc. Publishing as Prentice Hall 26-65

Present Value of an Annuity
How much would I have to invest today (in the present time) to receive $2,000 at the end of each year for five years if I invested at 6%?
Present value = Amount of each cash inflow × Annuity PV factor for i = 6%, n = 5
Copyright © 2014 Pearson Education, Inc. Publishing as Prentice Hall 26-66
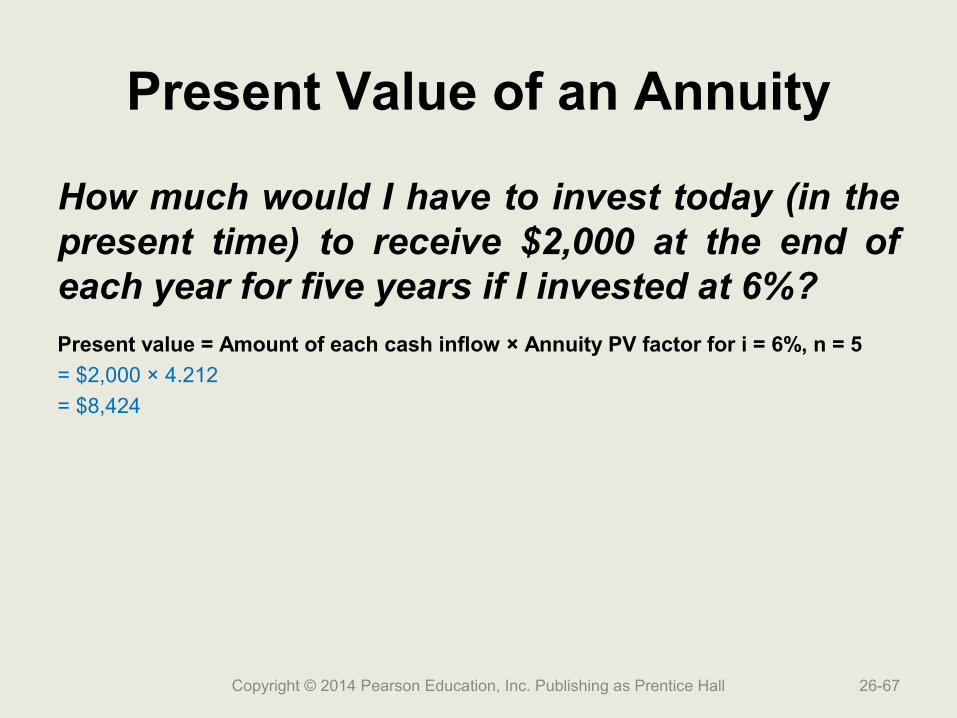
Present Value of an Annuity
How much would I have to invest today (in the present time) to receive $2,000 at the end of each year for five years if I invested at 6%?
Present value = Amount of each cash inflow × Annuity PV factor for i = 6%, n = 5
= $2,000 × 4.212
= $8,424
Copyright © 2014 Pearson Education, Inc. Publishing as Prentice Hall 26-67

Verification of Present Value of an Annuity Calculation
Copyright © 2014 Pearson Education, Inc. Publishing as Prentice Hall 26-68

Present Value Summary—Lotto Example
Let’s assume you have just won the lottery after purchasing one $5 lottery ticket. The state offers you the following three payout options for your after-tax prize money:Option 1: $1,000,000 nowOption 2: $150,000 at the end of each year for the next 10 years ($1,500,000 total)Option 3: $2,000,000 at the end of 10 years
Which alternative should you take?
(Assume an 8% interest rate.)
Copyright © 2014 Pearson Education, Inc. Publishing as Prentice Hall 26-69
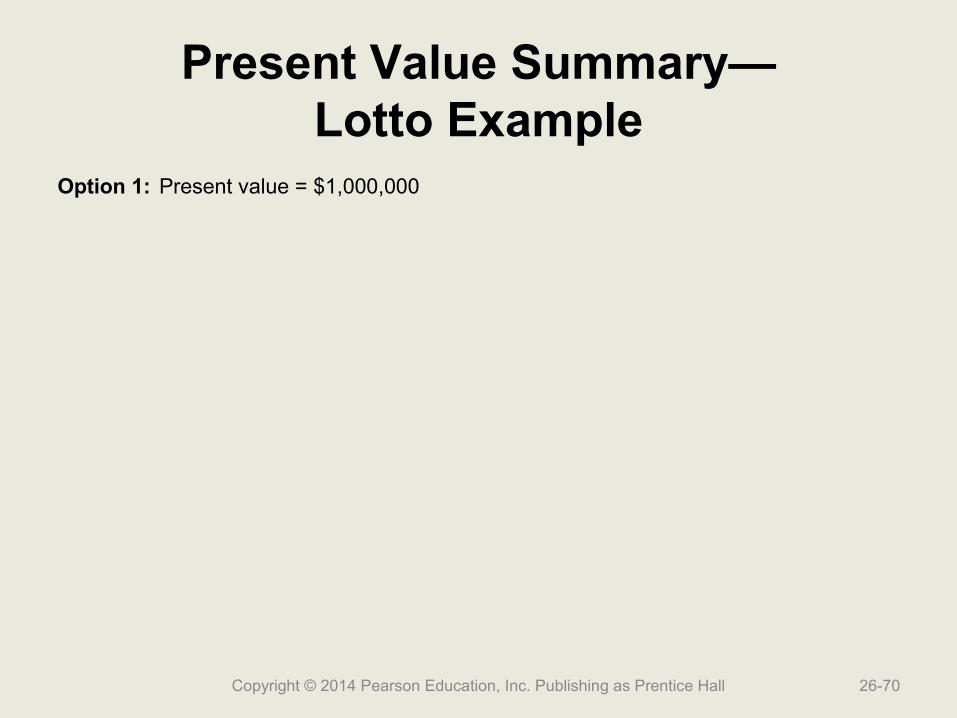
Present Value Summary—Lotto Example
Option 1: Present value = $1,000,000
Copyright © 2014 Pearson Education, Inc. Publishing as Prentice Hall 26-70

Present Value Summary—Lotto Example
Option 1: Present value = $1,000,000
Option 2:
Present value = Amount of each cash inflow × Annuity PV factor for i = 8%, n = 10
Copyright © 2014 Pearson Education, Inc. Publishing as Prentice Hall 26-71
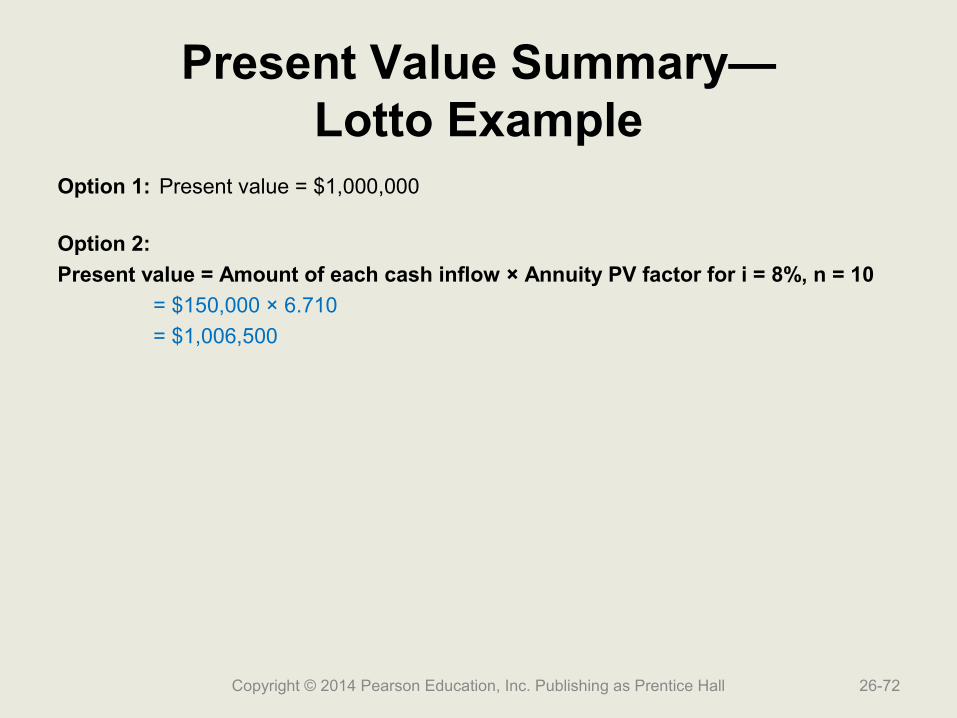
Present Value Summary—Lotto Example
Option 1: Present value = $1,000,000
Option 2:
Present value = Amount of each cash inflow × Annuity PV factor for i = 8%, n = 10
= $150,000 × 6.710
= $1,006,500
Copyright © 2014 Pearson Education, Inc. Publishing as Prentice Hall 26-72
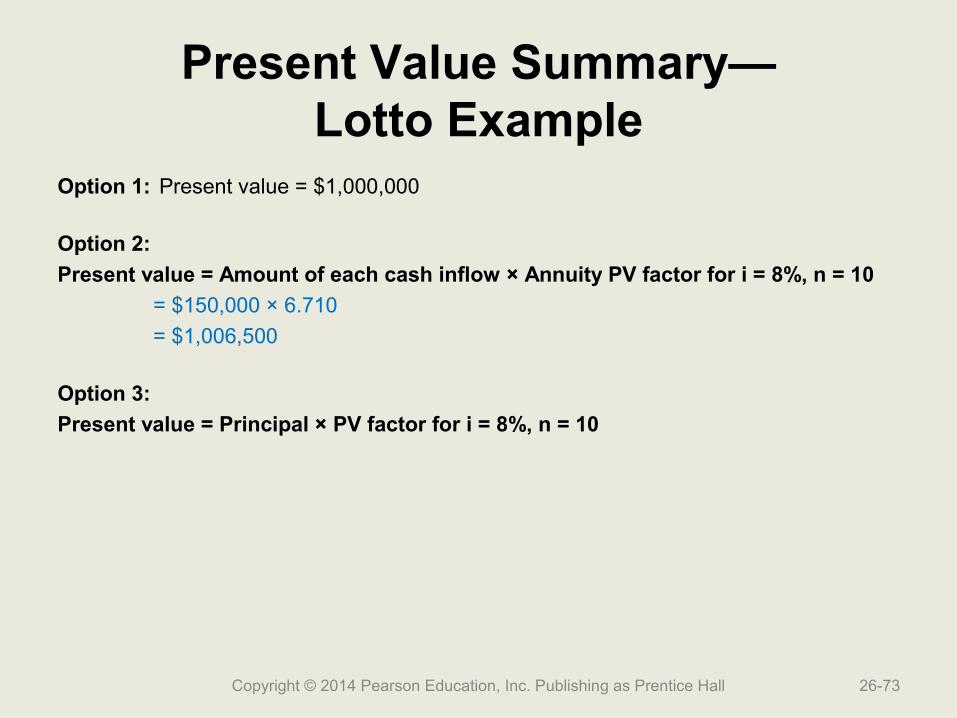
Present Value Summary—Lotto Example
Option 1: Present value = $1,000,000
Option 2:
Present value = Amount of each cash inflow × Annuity PV factor for i = 8%, n = 10
= $150,000 × 6.710
= $1,006,500
Option 3:
Present value = Principal × PV factor for i = 8%, n = 10
Copyright © 2014 Pearson Education, Inc. Publishing as Prentice Hall 26-73
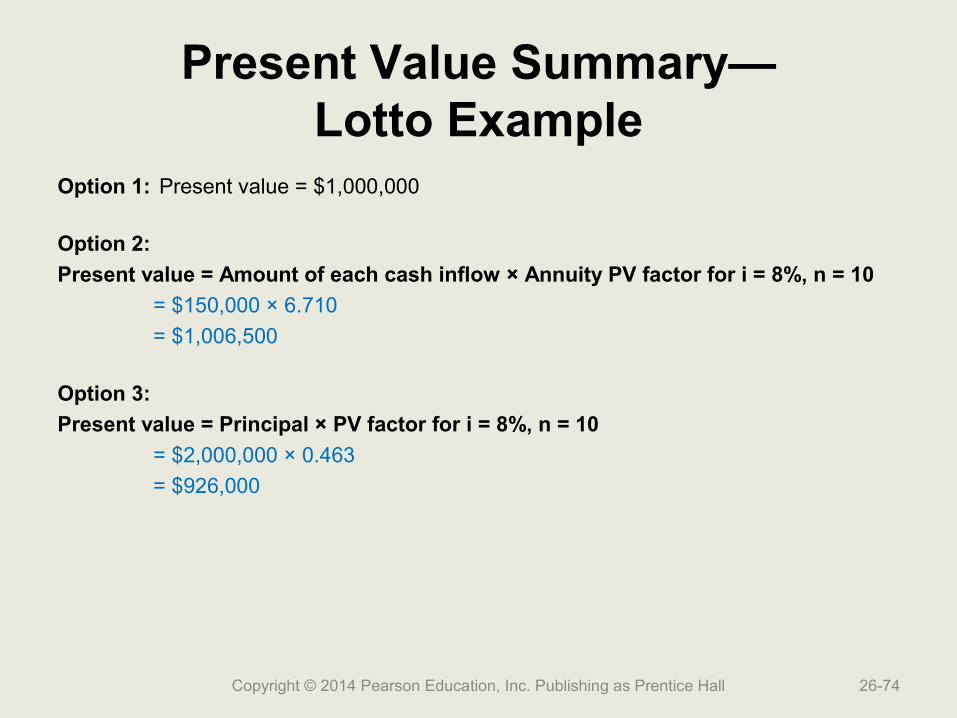
Present Value Summary—Lotto Example
Option 1: Present value = $1,000,000
Option 2:
Present value = Amount of each cash inflow × Annuity PV factor for i = 8%, n = 10
= $150,000 × 6.710
= $1,006,500
Option 3:
Present value = Principal × PV factor for i = 8%, n = 10
= $2,000,000 × 0.463
= $926,000
Copyright © 2014 Pearson Education, Inc. Publishing as Prentice Hall 26-74
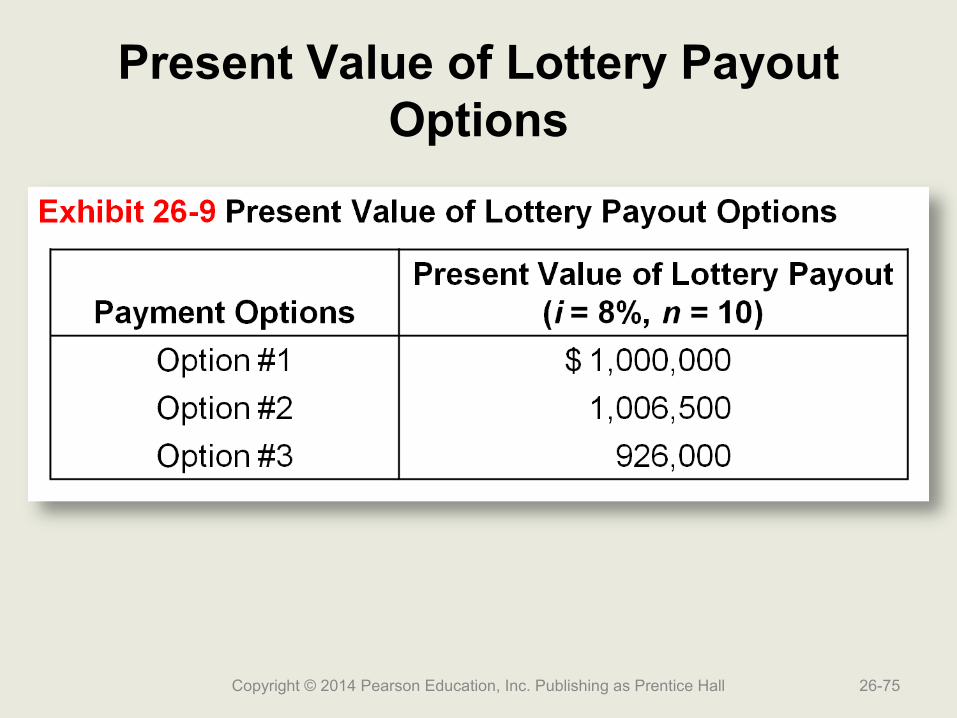
Present Value of Lottery Payout Options
Copyright © 2014 Pearson Education, Inc. Publishing as Prentice Hall 26-75
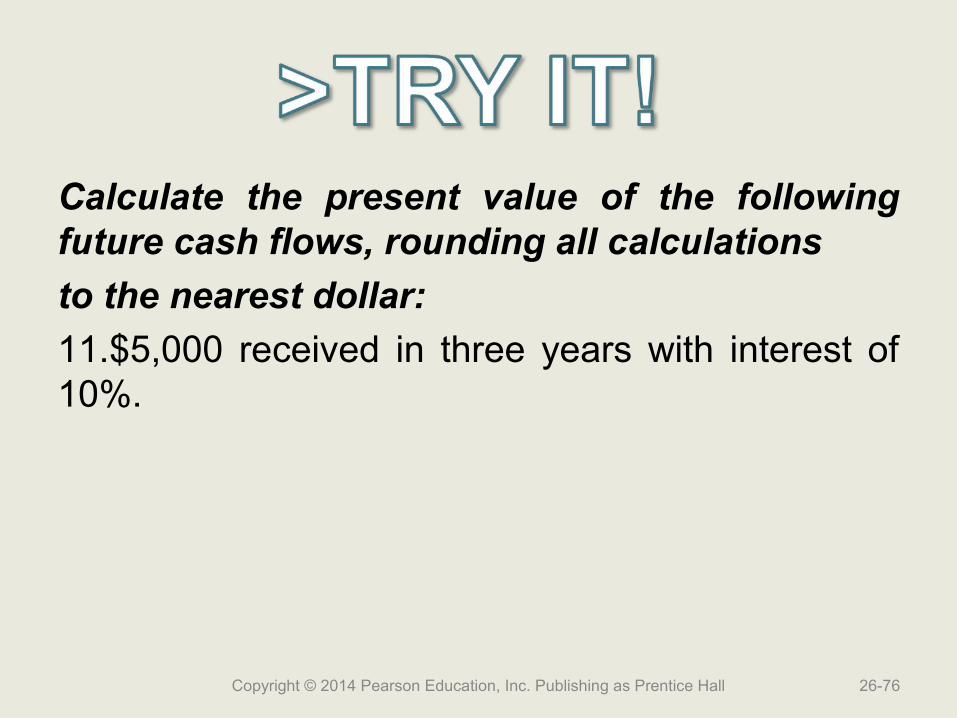
Calculate the present value of the following future cash flows, rounding all calculations
to the nearest dollar:
11.$5,000 received in three years with interest of 10%.
Copyright © 2014 Pearson Education, Inc. Publishing as Prentice Hall 26-76

Calculate the present value of the following future cash flows, rounding all calculations
to the nearest dollar:
11.$5,000 received in three years with interest of 10%.
This is an example of a lump sum payment:
Present value = Principal × PV factor for i = 10%, n = 3
= $5,000 × 0.751
= $3,755
Copyright © 2014 Pearson Education, Inc. Publishing as Prentice Hall 26-77
Calculate the present value of the following future cash flows, rounding all calculations
to the nearest dollar:
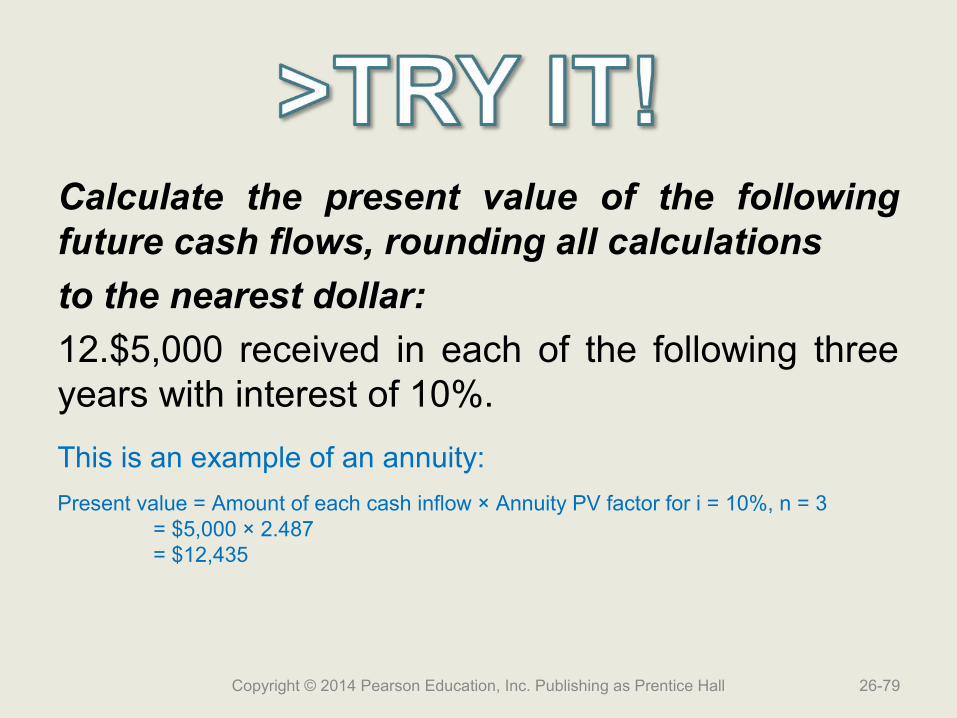
12.$5,000 received in each of the following three years with interest of 10%.
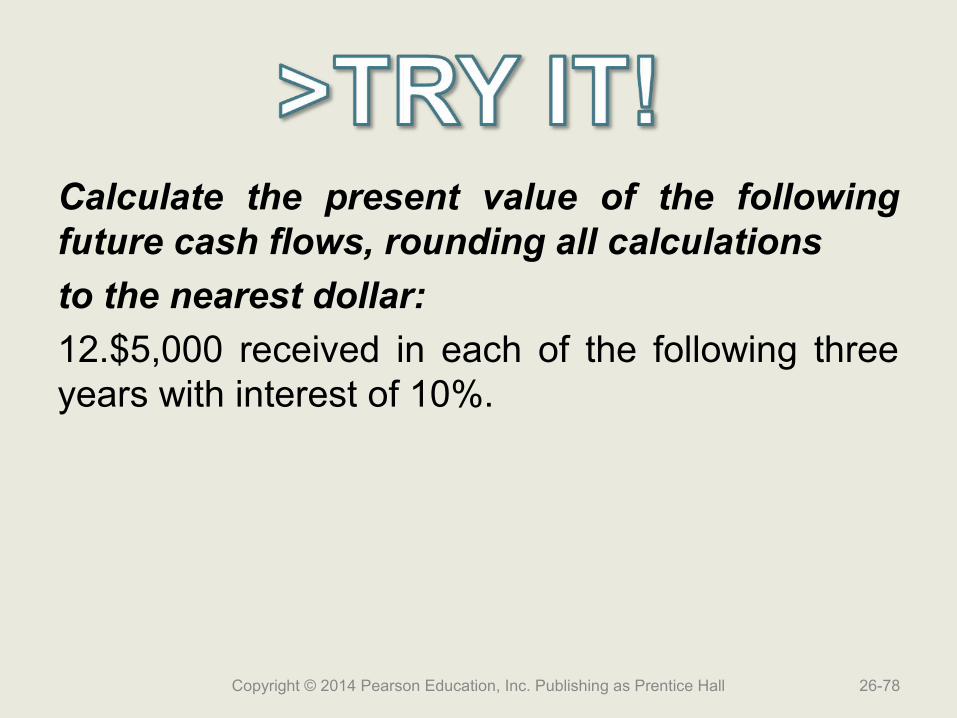
Copyright © 2014 Pearson Education, Inc. Publishing as Prentice Hall 26-78
Calculate the present value of the following future cash flows, rounding all calculations
to the nearest dollar:
12.$5,000 received in each of the following three years with interest of 10%.
This is an example of an annuity:
Present value = Amount of each cash inflow × Annuity PV factor for i = 10%, n = 3= $5,000 × 2.487= $12,435
Copyright © 2014 Pearson Education, Inc. Publishing as Prentice Hall 26-79
Calculate the present value of the following future cash flows, rounding all calculations
to the nearest dollar:
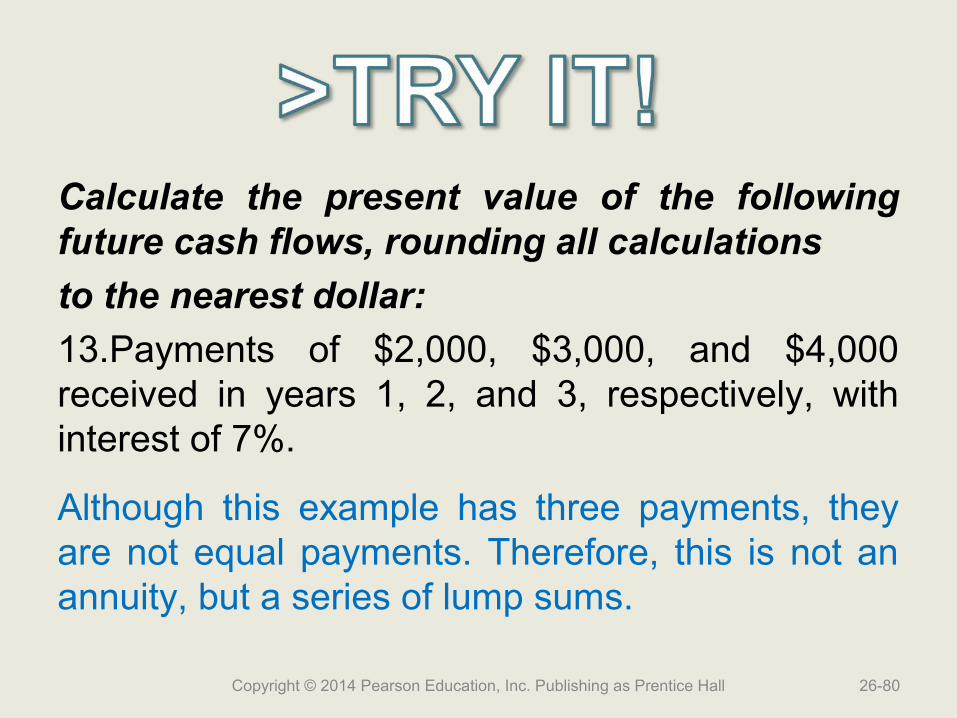
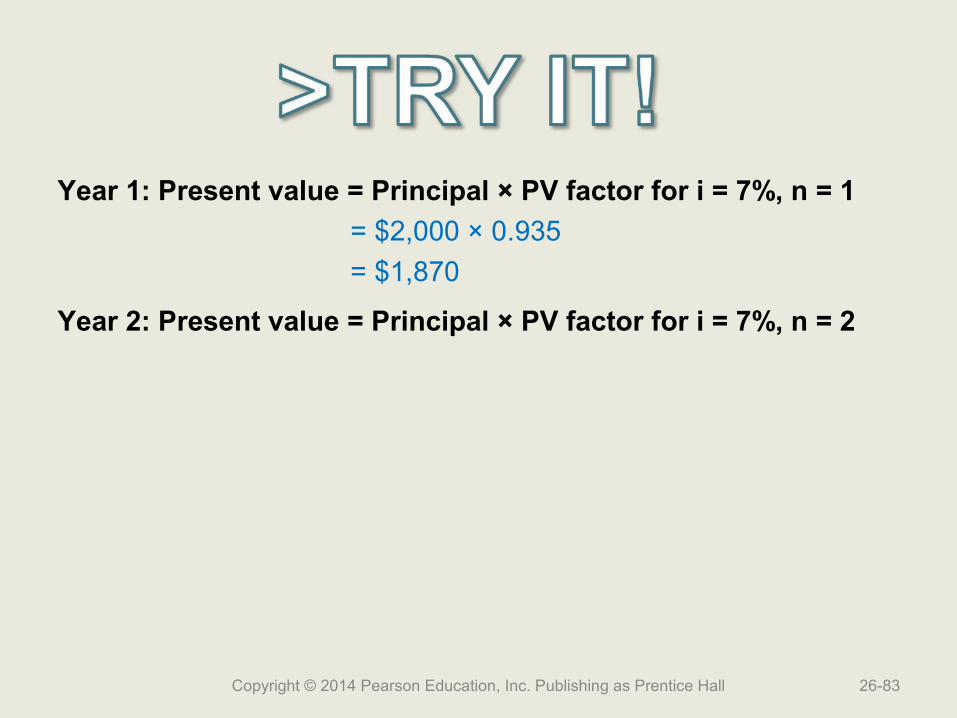
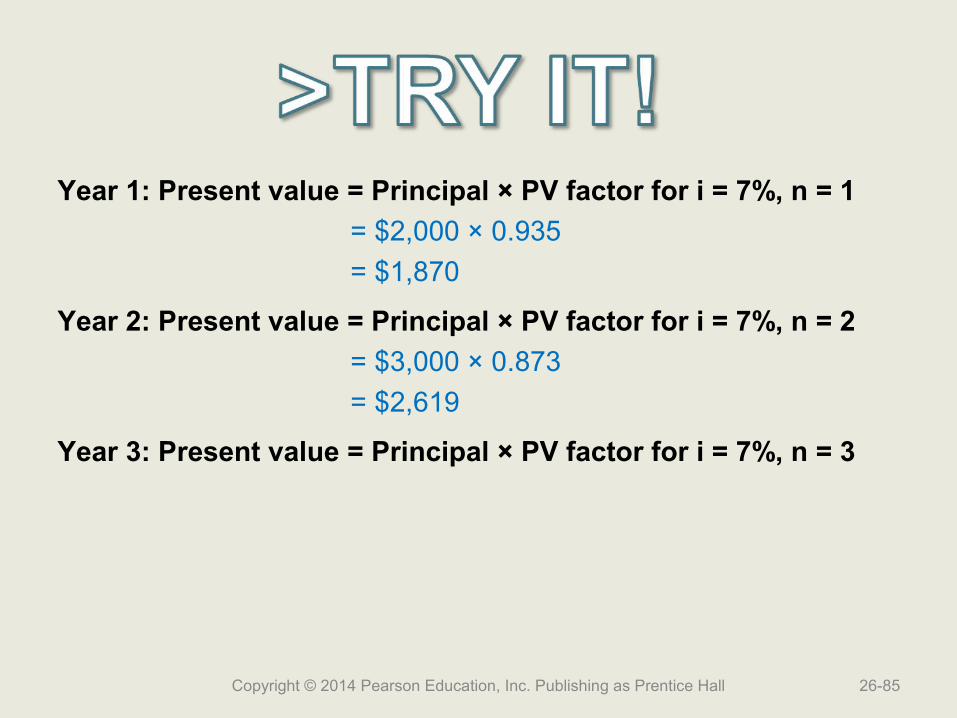
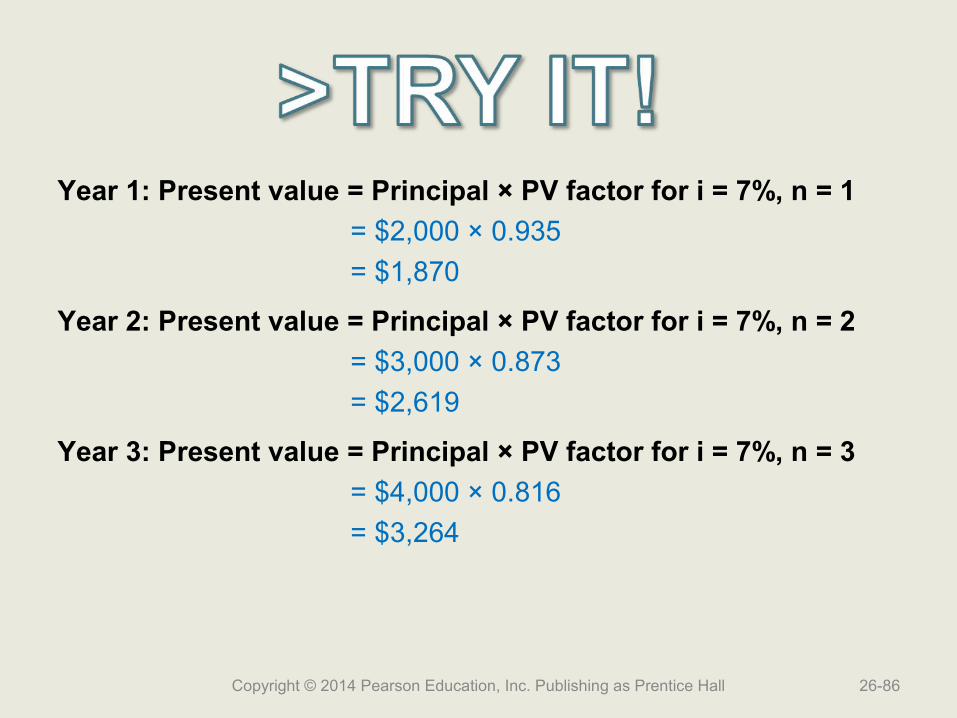
13.Payments of $2,000, $3,000, and $4,000 received in years 1, 2, and 3, respectively, with interest of 7%.
Although this example has three payments, they are not equal payments. Therefore, this is not an annuity, but a series of lump sums.
Copyright © 2014 Pearson Education, Inc. Publishing as Prentice Hall 26-80

Year 1: Present value = Principal × PV factor for i = 7%, n = 1
Copyright © 2014 Pearson Education, Inc. Publishing as Prentice Hall 26-81
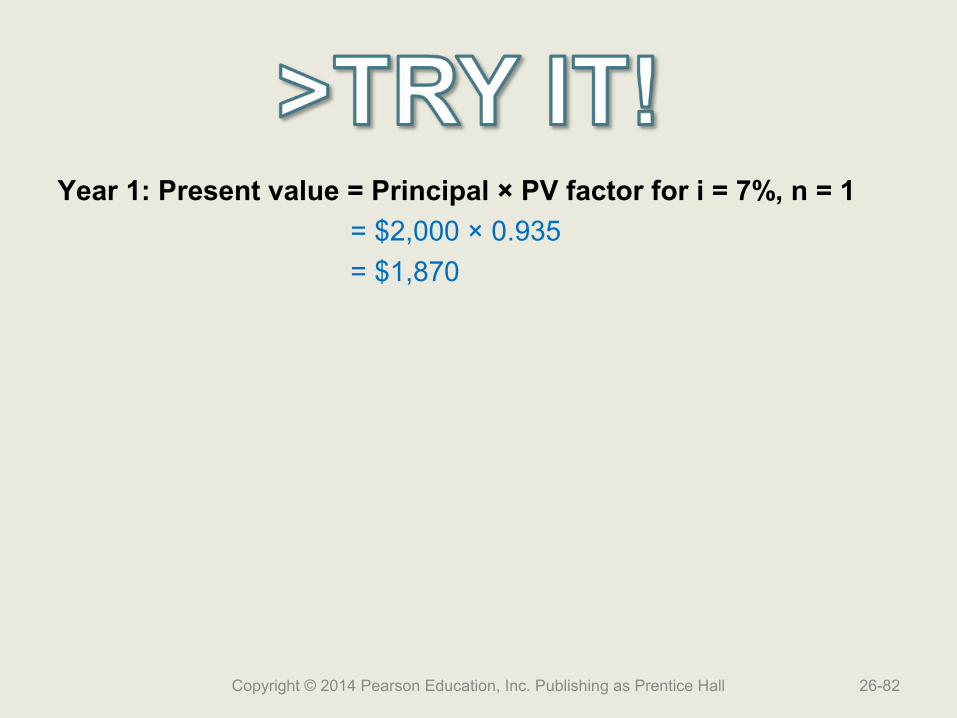
Year 1: Present value = Principal × PV factor for i = 7%, n = 1
= $2,000 × 0.935
= $1,870
Copyright © 2014 Pearson Education, Inc. Publishing as Prentice Hall 26-82
Year 1: Present value = Principal × PV factor for i = 7%, n = 1
= $2,000 × 0.935
= $1,870
Year 2: Present value = Principal × PV factor for i = 7%, n = 2
Copyright © 2014 Pearson Education, Inc. Publishing as Prentice Hall 26-83
Year 1: Present value = Principal × PV factor for i = 7%, n = 1
= $2,000 × 0.935
= $1,870
Year 2: Present value = Principal × PV factor for i = 7%, n = 2
= $3,000 × 0.873
= $2,619
Copyright © 2014 Pearson Education, Inc. Publishing as Prentice Hall 26-84
Year 1: Present value = Principal × PV factor for i = 7%, n = 1
= $2,000 × 0.935
= $1,870
Year 2: Present value = Principal × PV factor for i = 7%, n = 2
= $3,000 × 0.873
= $2,619
Year 3: Present value = Principal × PV factor for i = 7%, n = 3
Copyright © 2014 Pearson Education, Inc. Publishing as Prentice Hall 26-85
Year 1: Present value = Principal × PV factor for i = 7%, n = 1
= $2,000 × 0.935
= $1,870
Year 2: Present value = Principal × PV factor for i = 7%, n = 2
= $3,000 × 0.873
= $2,619
Year 3: Present value = Principal × PV factor for i = 7%, n = 3
= $4,000 × 0.816
= $3,264
Copyright © 2014 Pearson Education, Inc. Publishing as Prentice Hall 26-86

Year 1: Present value = Principal × PV factor for i = 7%, n = 1
= $2,000 × 0.935
= $1,870
Year 2: Present value = Principal × PV factor for i = 7%, n = 2
= $3,000 × 0.873
= $2,619
Year 3: Present value = Principal × PV factor for i = 7%, n = 3
= $4,000 × 0.816
= $3,264
The total present value is $7,753 ($1,870 + $2,619 + $3,264).
Copyright © 2014 Pearson Education, Inc. Publishing as Prentice Hall 26-87
Learning Objective 4
Use discounted cash Use discounted cash flow methods to make flow methods to make
capital investment capital investment decisionsdecisions
26-88Copyright © 2014 Pearson Education, Inc. Publishing as Prentice Hall

Expected Cash Inflowsfor Two Projects
Copyright © 2014 Pearson Education, Inc. Publishing as Prentice Hall 26-89
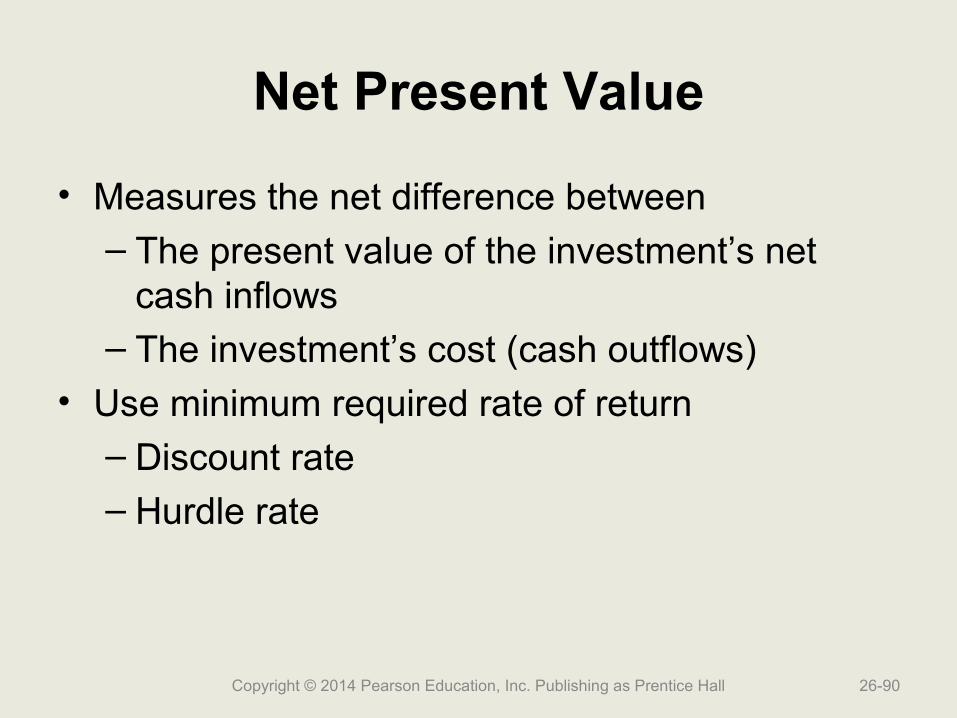
Net Present Value
• Measures the net difference between– The present value of the investment’s net
cash inflows– The investment’s cost (cash outflows)
• Use minimum required rate of return– Discount rate– Hurdle rate
Copyright © 2014 Pearson Education, Inc. Publishing as Prentice Hall 26-90
NPV with Equal Periodic Net Cash Inflows—Laptop Project
Copyright © 2014 Pearson Education, Inc. Publishing as Prentice Hall 26-91
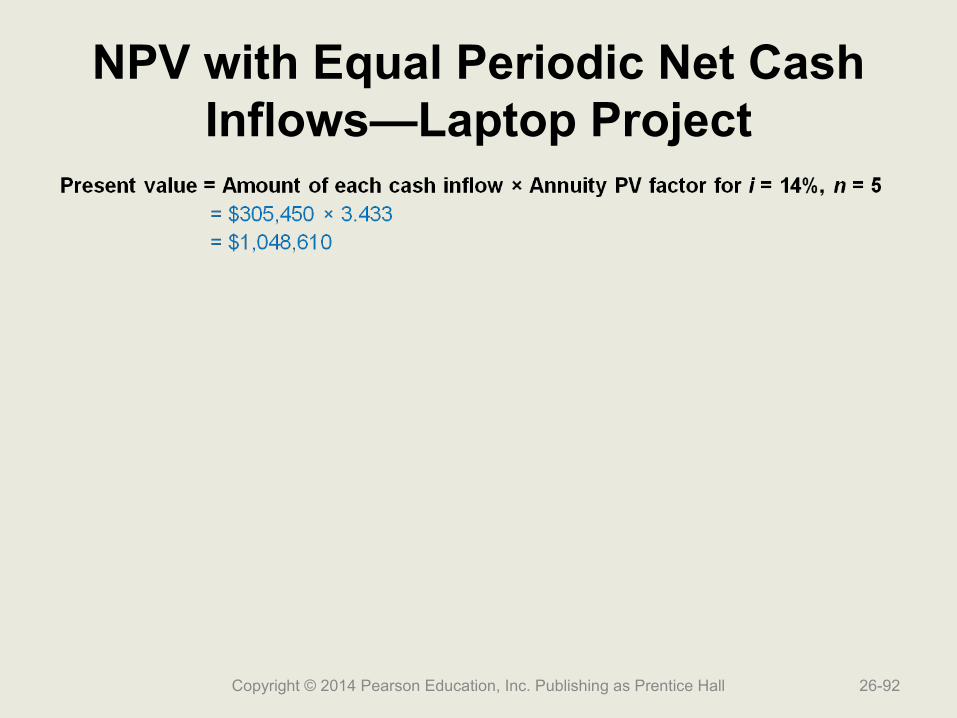
NPV with Equal Periodic Net Cash Inflows—Laptop Project
Copyright © 2014 Pearson Education, Inc. Publishing as Prentice Hall 26-92

NPV with Equal Periodic Net Cash Inflows—Laptop Project
Copyright © 2014 Pearson Education, Inc. Publishing as Prentice Hall 26-93
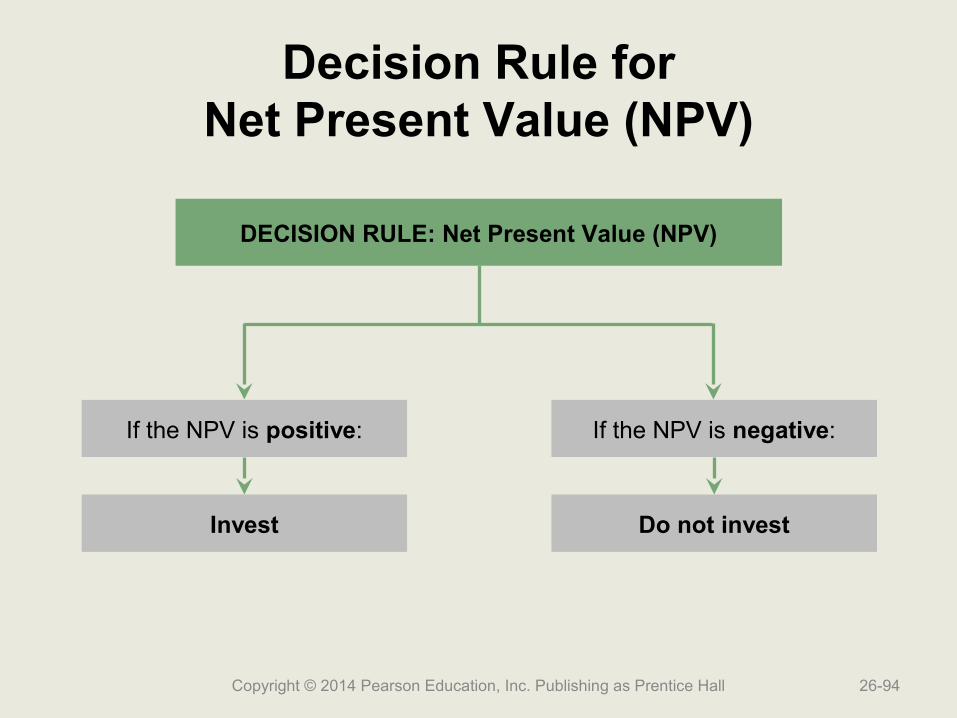
Decision Rule forNet Present Value (NPV)
Copyright © 2014 Pearson Education, Inc. Publishing as Prentice Hall 26-94
DECISION RULE: Net Present Value (NPV)
If the NPV is positive: If the NPV is negative:
Invest Do not invest
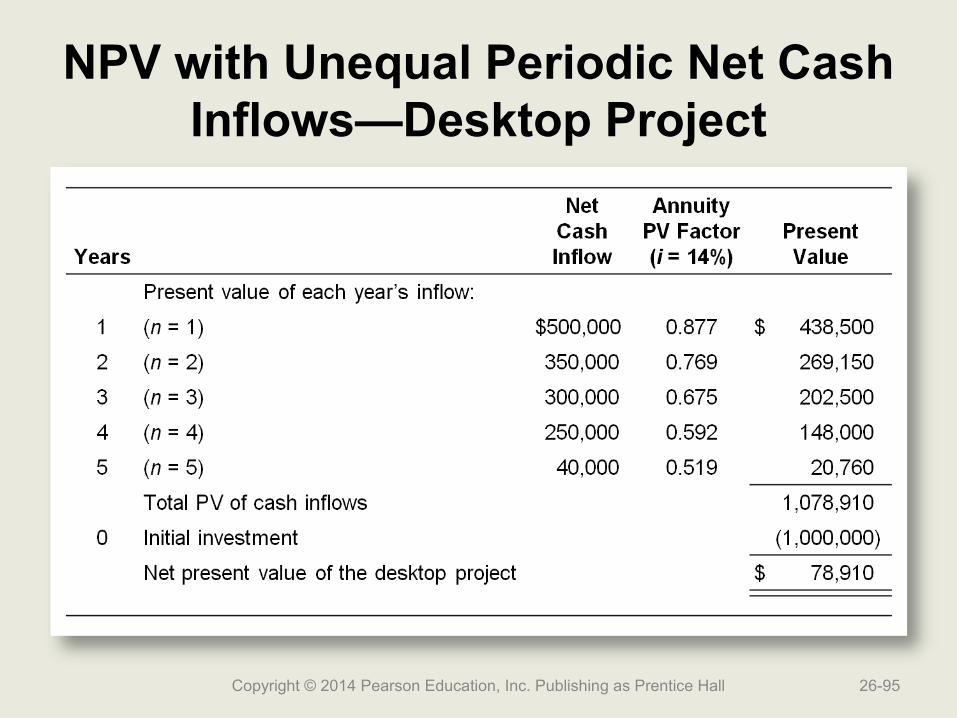
NPV with Unequal Periodic Net Cash Inflows—Desktop Project
Copyright © 2014 Pearson Education, Inc. Publishing as Prentice Hall 26-95
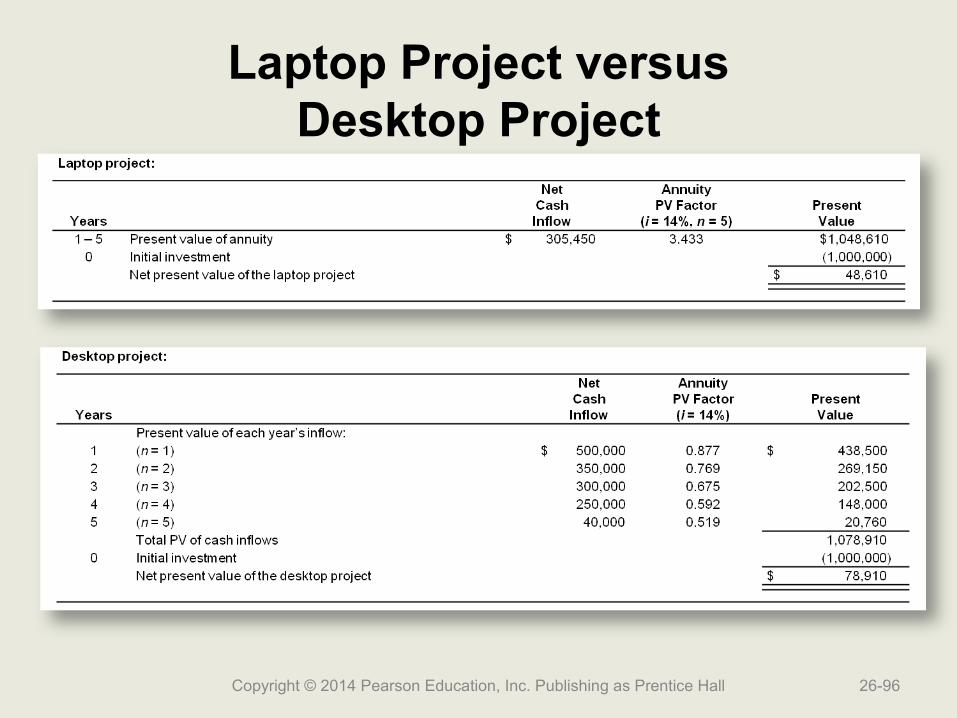
Laptop Project versusDesktop Project
Copyright © 2014 Pearson Education, Inc. Publishing as Prentice Hall 26-96
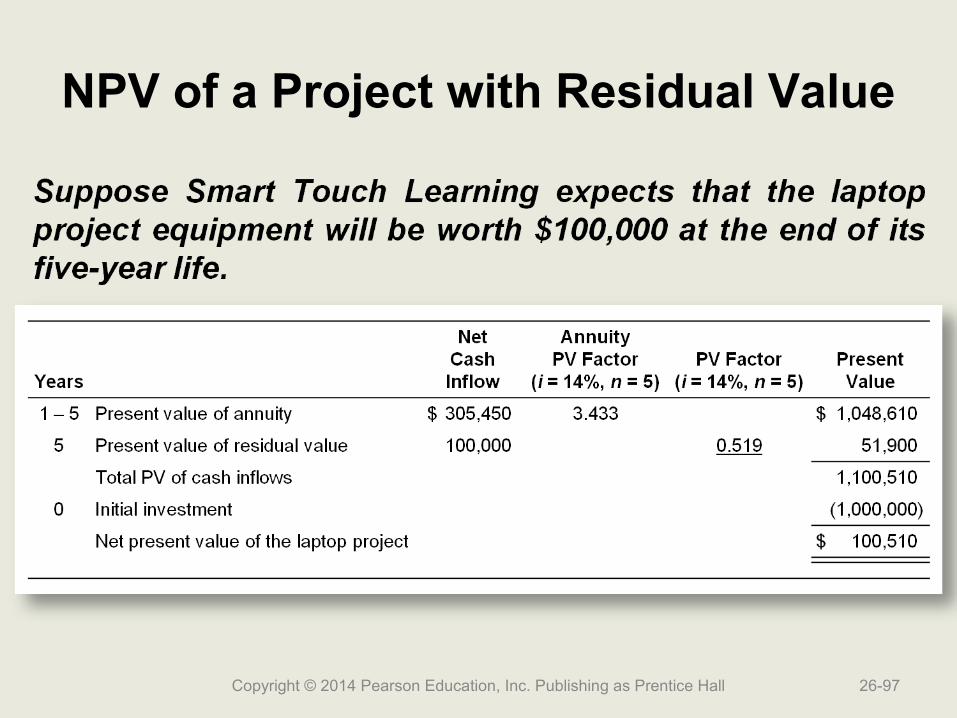
NPV of a Project with Residual Value
Copyright © 2014 Pearson Education, Inc. Publishing as Prentice Hall 26-97

Smart Touch LearningCapital Investment Options
Copyright © 2014 Pearson Education, Inc. Publishing as Prentice Hall 26-98

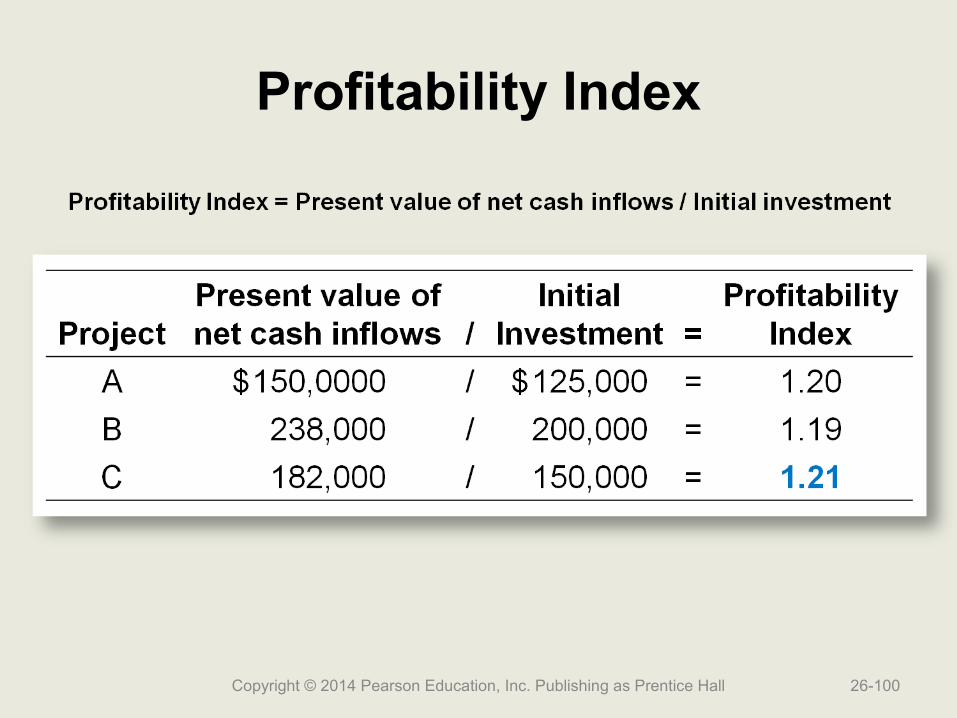
Profitability Index
Copyright © 2014 Pearson Education, Inc. Publishing as Prentice Hall 26-99
Profitability Index
Copyright © 2014 Pearson Education, Inc. Publishing as Prentice Hall 26-100
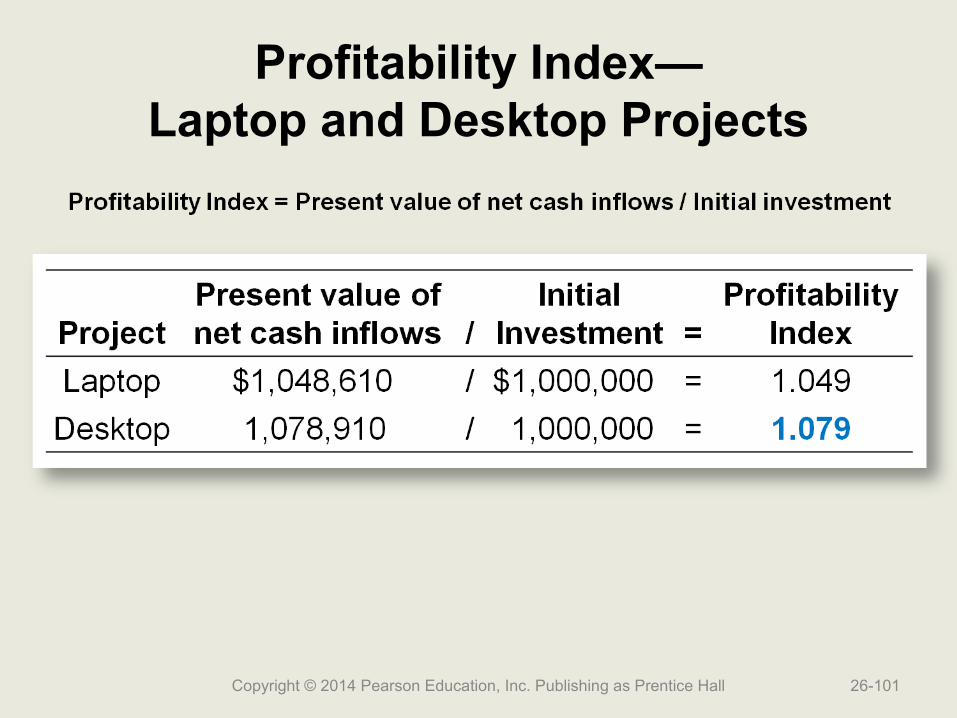
Profitability Index—Laptop and Desktop Projects
Copyright © 2014 Pearson Education, Inc. Publishing as Prentice Hall 26-101
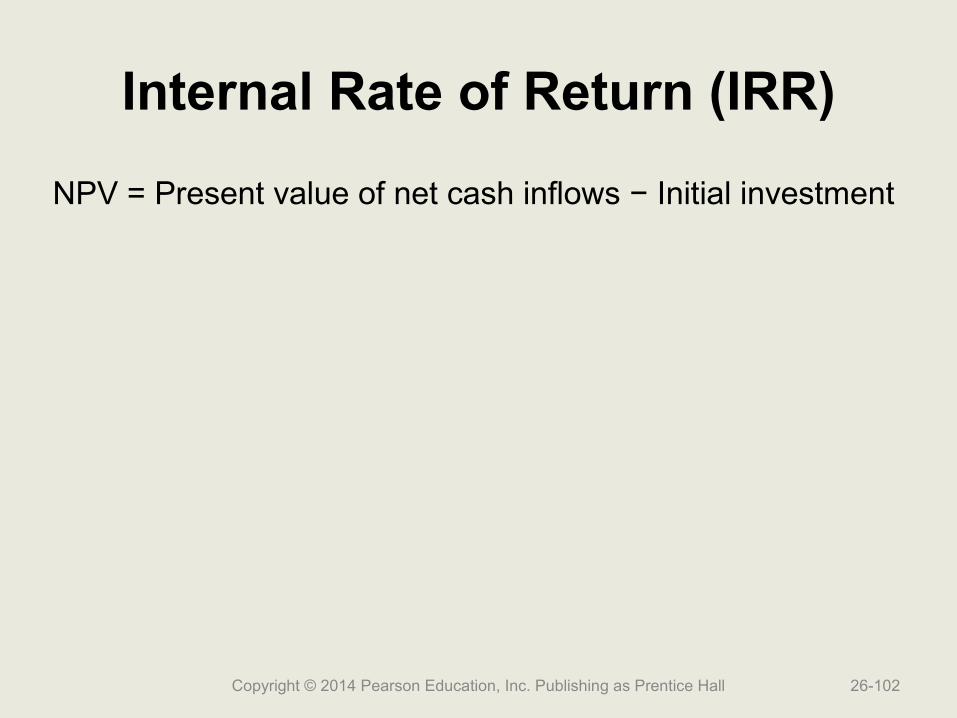
Internal Rate of Return (IRR)
NPV = Present value of net cash inflows − Initial investment
Copyright © 2014 Pearson Education, Inc. Publishing as Prentice Hall 26-102

Internal Rate of Return (IRR)
NPV = Present value of net cash inflows − Initial investment
If:
NPV = 0
then:
Initial investment = Present value of net cash inflows
Copyright © 2014 Pearson Education, Inc. Publishing as Prentice Hall 26-103
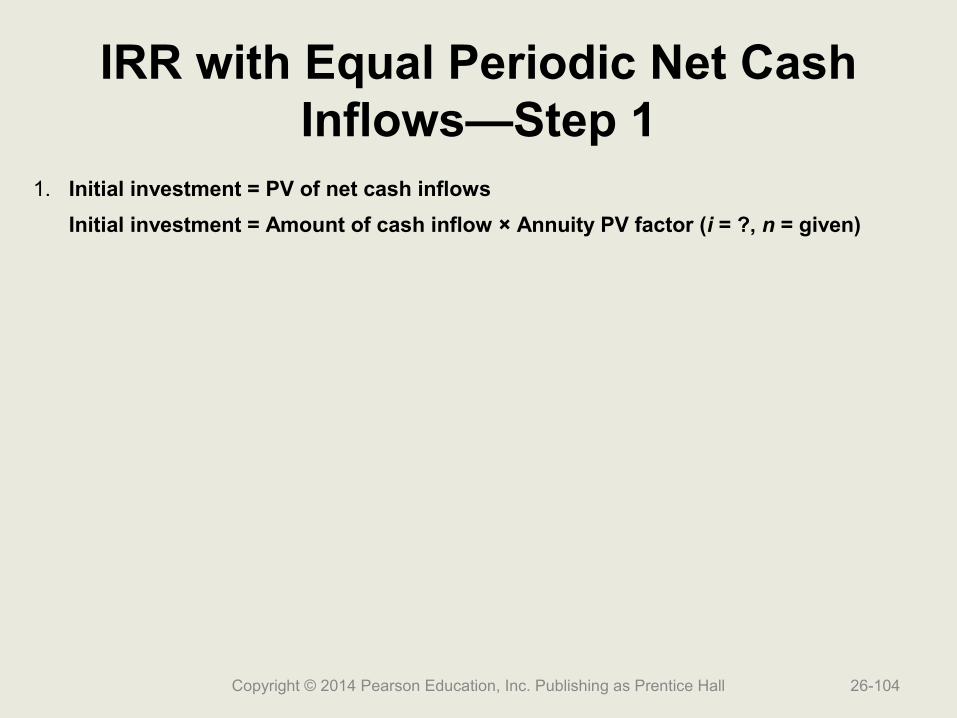
IRR with Equal Periodic Net Cash Inflows—Step 1
1. Initial investment = PV of net cash inflows
Initial investment = Amount of cash inflow × Annuity PV factor (i = ?, n = given)
Copyright © 2014 Pearson Education, Inc. Publishing as Prentice Hall 26-104
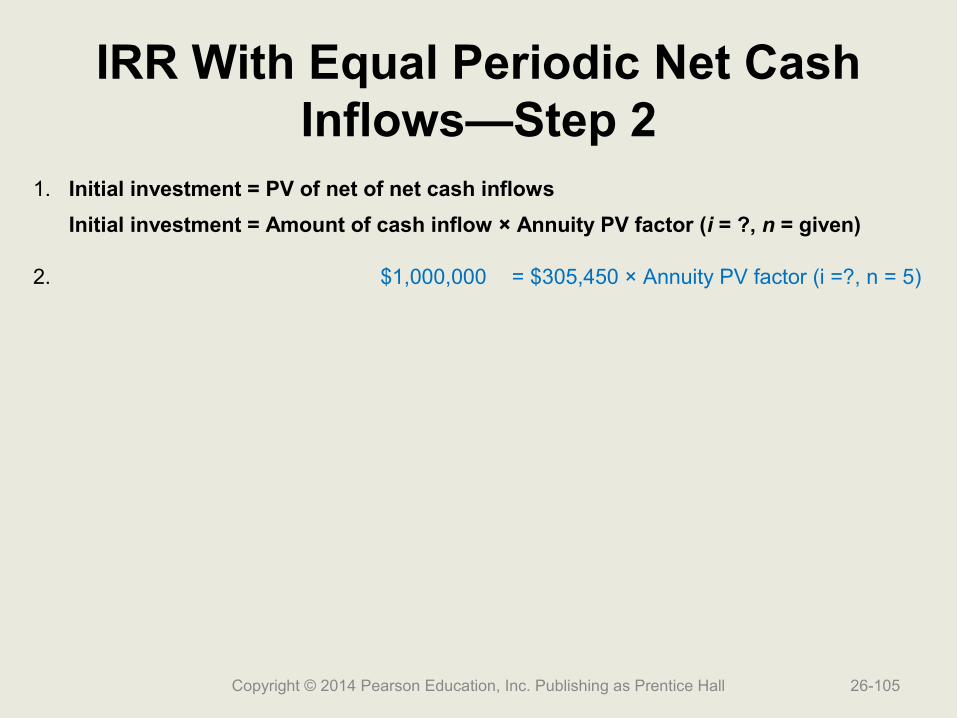
IRR With Equal Periodic Net Cash Inflows—Step 2
1. Initial investment = PV of net of net cash inflows
Initial investment = Amount of cash inflow × Annuity PV factor (i = ?, n = given)
2. $1,000,000 = $305,450 × Annuity PV factor (i =?, n = 5)
Copyright © 2014 Pearson Education, Inc. Publishing as Prentice Hall 26-105
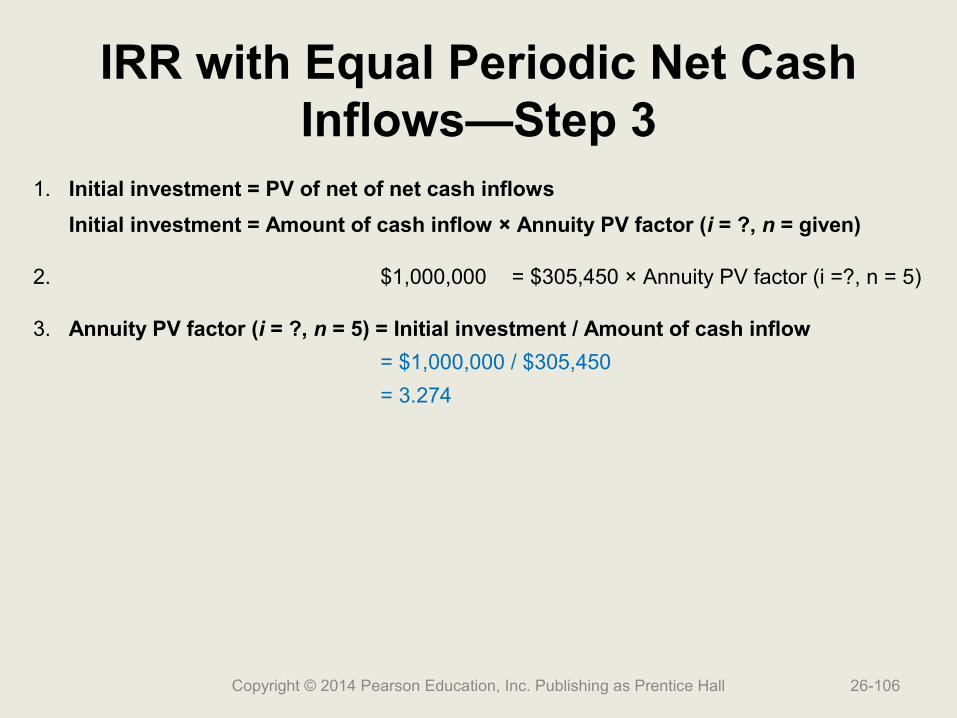
IRR with Equal Periodic Net Cash Inflows—Step 3
1. Initial investment = PV of net of net cash inflows
Initial investment = Amount of cash inflow × Annuity PV factor (i = ?, n = given)
2. $1,000,000 = $305,450 × Annuity PV factor (i =?, n = 5)
3. Annuity PV factor (i = ?, n = 5) = Initial investment / Amount of cash inflow
= $1,000,000 / $305,450
= 3.274
Copyright © 2014 Pearson Education, Inc. Publishing as Prentice Hall 26-106
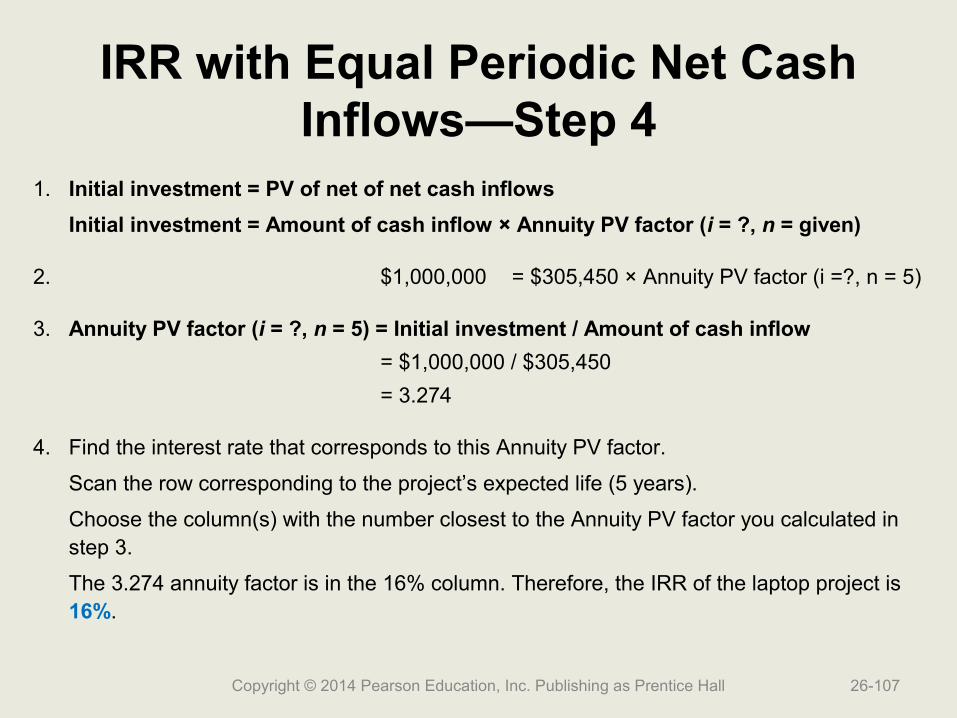
IRR with Equal Periodic Net Cash Inflows—Step 4
1. Initial investment = PV of net of net cash inflows
Initial investment = Amount of cash inflow × Annuity PV factor (i = ?, n = given)
2. $1,000,000 = $305,450 × Annuity PV factor (i =?, n = 5)
3. Annuity PV factor (i = ?, n = 5) = Initial investment / Amount of cash inflow
= $1,000,000 / $305,450
= 3.274
4. Find the interest rate that corresponds to this Annuity PV factor.
Scan the row corresponding to the project’s expected life (5 years).
Choose the column(s) with the number closest to the Annuity PV factor you calculated in step 3.
The 3.274 annuity factor is in the 16% column. Therefore, the IRR of the laptop project is 16%.
Copyright © 2014 Pearson Education, Inc. Publishing as Prentice Hall 26-107
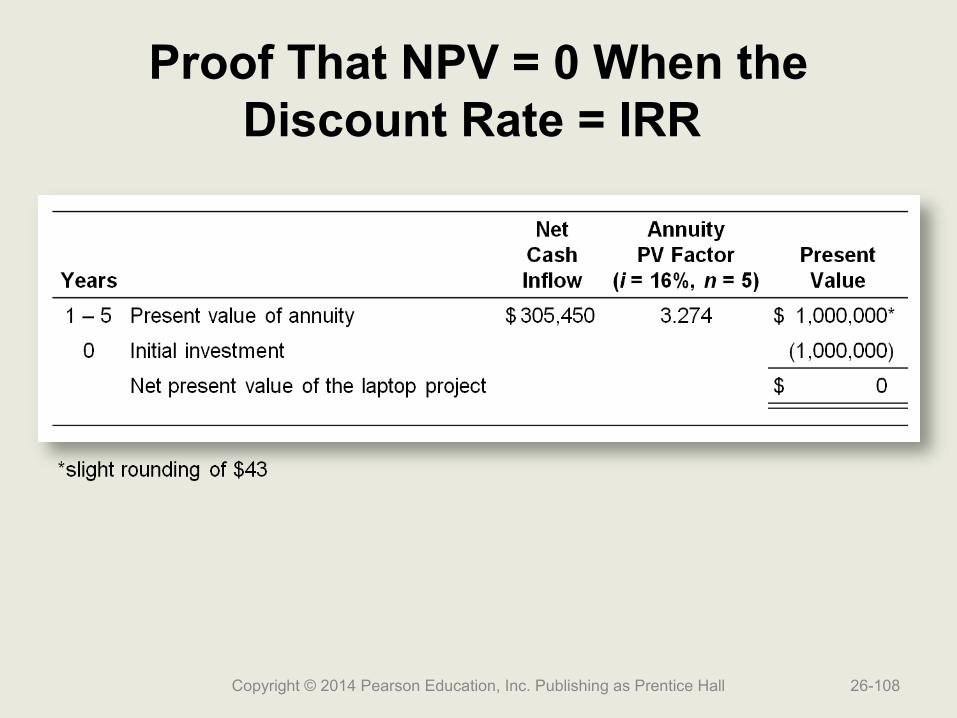
Proof That NPV = 0 When the Discount Rate = IRR
Copyright © 2014 Pearson Education, Inc. Publishing as Prentice Hall 26-108
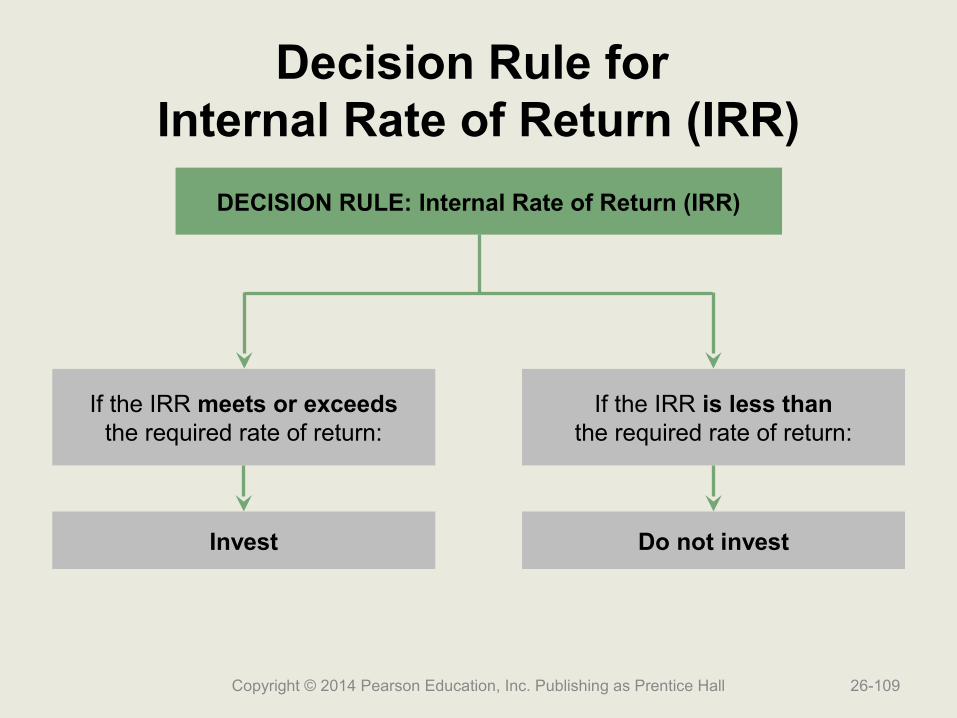
Decision Rule for Internal Rate of Return (IRR)
Copyright © 2014 Pearson Education, Inc. Publishing as Prentice Hall 26-109
DECISION RULE: Internal Rate of Return (IRR)
If the IRR meets or exceedsthe required rate of return:
If the IRR is less thanthe required rate of return:
Invest Do not invest

IRR for Smart TouchLearning’s B2B Portal
Annuity PV factor (i = ?, n = 6) = Initial investment / Amount of cash inflow
= $240,000 / $60,000
= 4.000
Find the interest rate that corresponds to this Annuity PV factor.
Scan the row corresponding to the project’s expected life (6 years).
Choose the column(s) with the number closest to the Annuity PV factor you calculated.
The IRR is between 12% and 14%.
Copyright © 2014 Pearson Education, Inc. Publishing as Prentice Hall 26-110
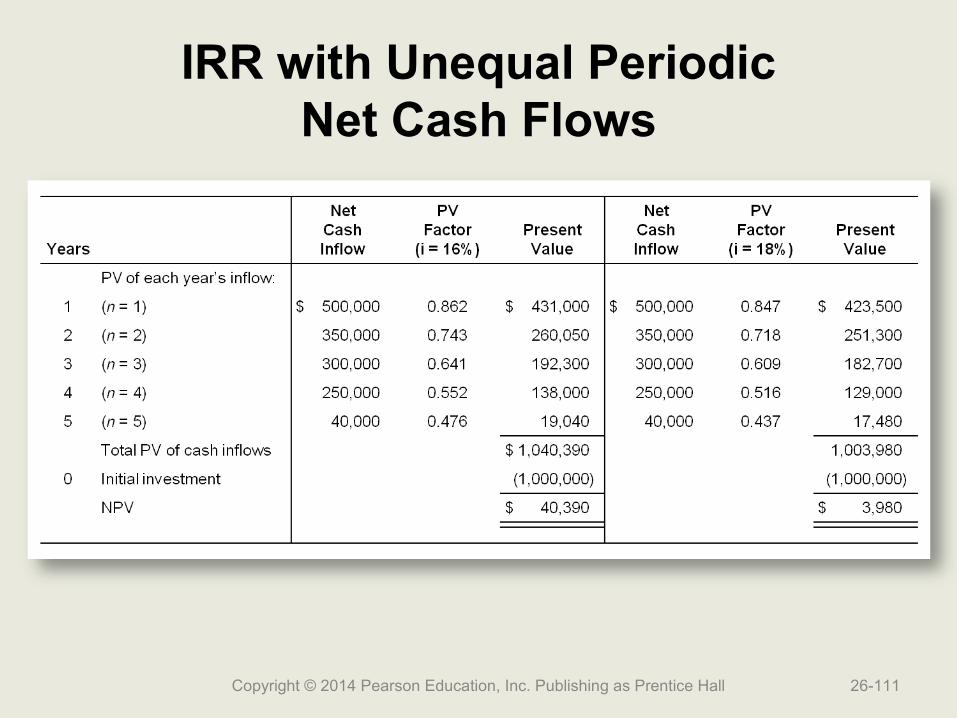
IRR with Unequal PeriodicNet Cash Flows
Copyright © 2014 Pearson Education, Inc. Publishing as Prentice Hall 26-111

Comparison of Capital Investment Analysis Methods
Copyright © 2014 Pearson Education, Inc. Publishing as Prentice Hall 26-112

Laptop Computer Project and Desktop Computer Project
Copyright © 2014 Pearson Education, Inc. Publishing as Prentice Hall 26-113
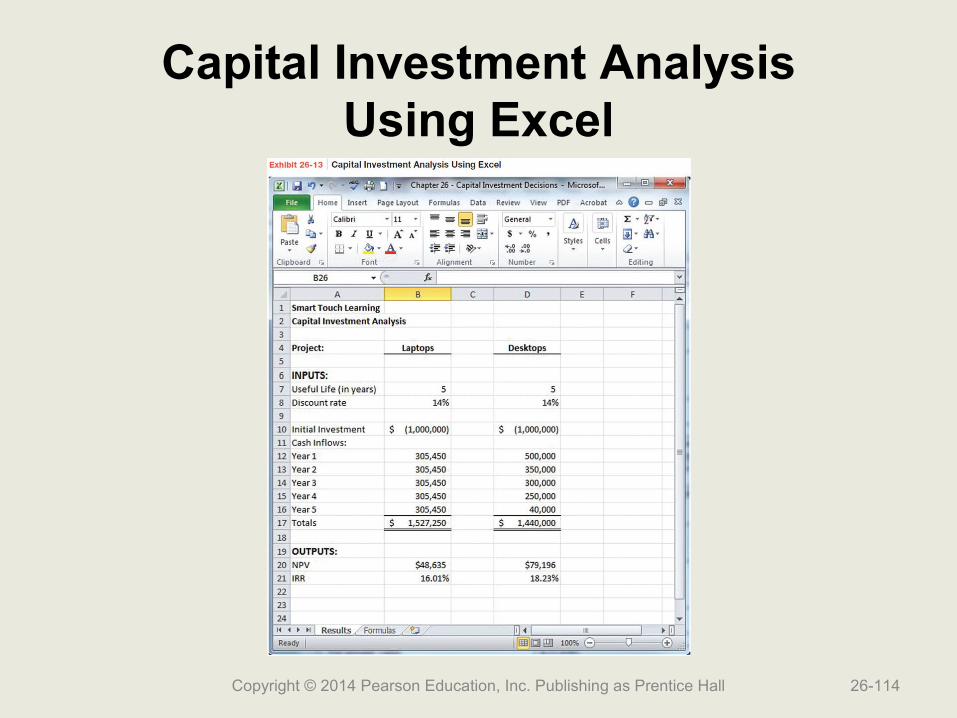
Capital Investment AnalysisUsing Excel
Copyright © 2014 Pearson Education, Inc. Publishing as Prentice Hall 26-114
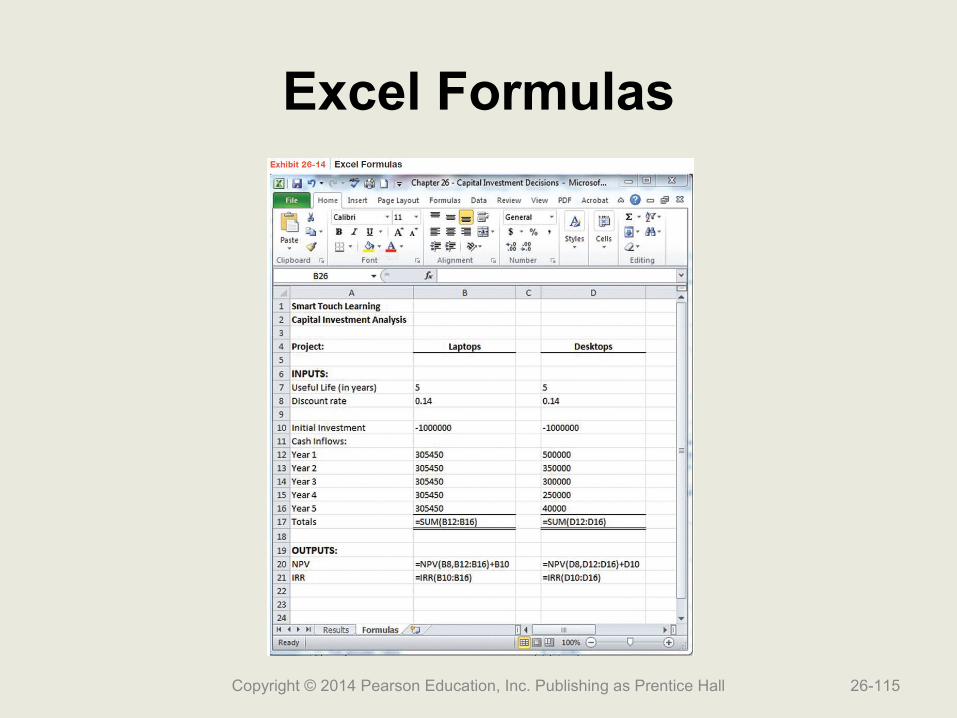
Excel Formulas
Copyright © 2014 Pearson Education, Inc. Publishing as Prentice Hall 26-115

Decision Tree for Capital Rationing
Copyright © 2014 Pearson Education, Inc. Publishing as Prentice Hall 26-116
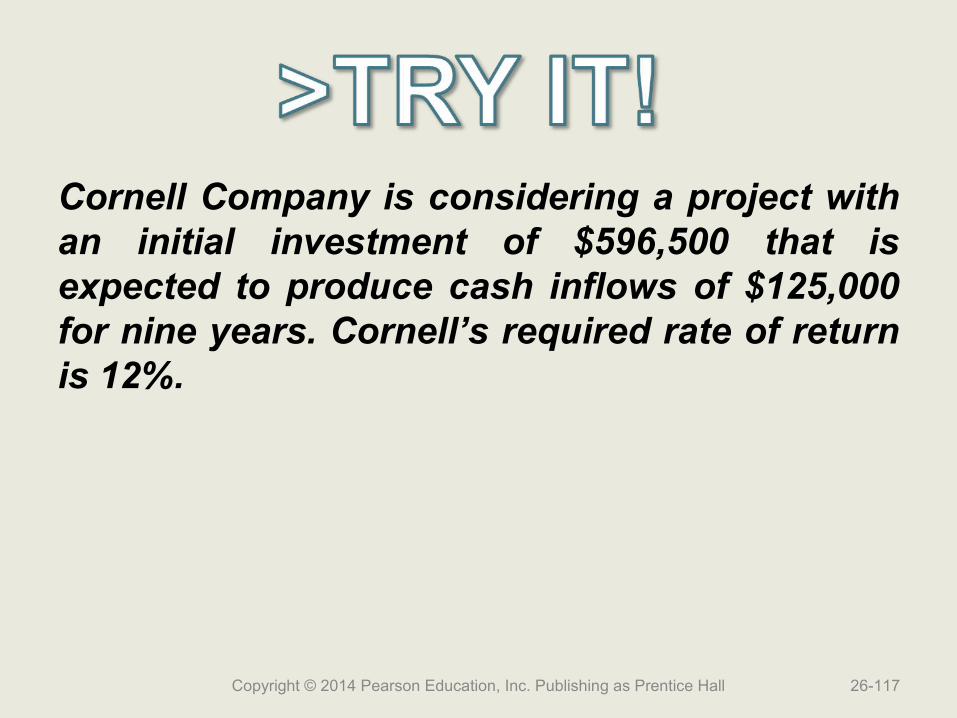
Cornell Company is considering a project with an initial investment of $596,500 that is expected to produce cash inflows of $125,000 for nine years. Cornell’s required rate of return is 12%.
Copyright © 2014 Pearson Education, Inc. Publishing as Prentice Hall 26-117

Copyright © 2014 Pearson Education, Inc. Publishing as Prentice Hall 26-118
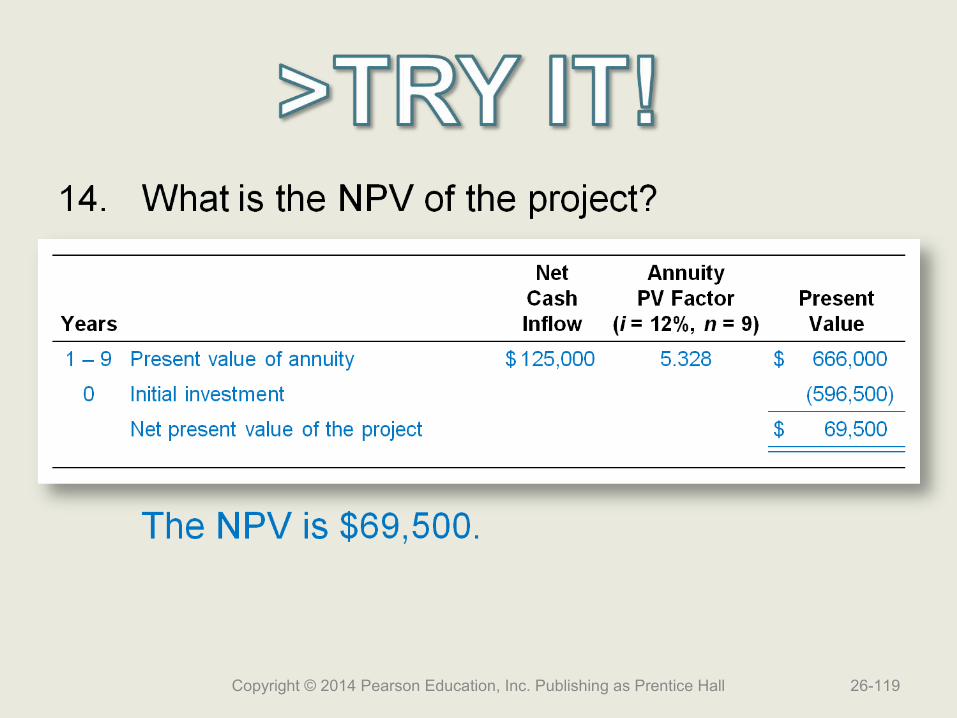
Copyright © 2014 Pearson Education, Inc. Publishing as Prentice Hall 26-119
15. What is the IRR of the project?
Copyright © 2014 Pearson Education, Inc. Publishing as Prentice Hall 26-120

15. What is the IRR of the project?
Annuity PV factor (i = ?, n = 9) = Initial investment / Amount of cash inflow
= $596,500 / $125,000
= 4.772
The IRR is 15%, which is the factor determined below in the n = 9 row of Table B-2.
Copyright © 2014 Pearson Education, Inc. Publishing as Prentice Hall 26-121

16. Is this an acceptable project for Cornell?
Copyright © 2014 Pearson Education, Inc. Publishing as Prentice Hall 26-122
16. Is this an acceptable project for Cornell?
Unless negative qualitative factors exist, Cornell should accept the project because the IRR of 15% is more than the required rate of 12%. Also, the net present value is positive; $69,500.
Copyright © 2014 Pearson Education, Inc. Publishing as Prentice Hall 26-123
End of Chapter 26
26-124Copyright © 2014 Pearson Education, Inc. Publishing as Prentice Hall
Related Documents