Cost Allocation and Responsibility Accounting Chapter 24 24-1 Copyright © 2014 Pearson Education, Inc. Publishing as Prentice Hall

Welcome message from author
This document is posted to help you gain knowledge. Please leave a comment to let me know what you think about it! Share it to your friends and learn new things together.
Transcript
Cost Allocation and
Responsibility Accounting
Chapter 24
24-1Copyright © 2014 Pearson Education, Inc. Publishing as Prentice Hall
Learning Objectives
1. Assign direct costs and allocate indirect costs using predetermined overhead allocation rates with single and multiple allocation bases
2. Explain why companies decentralize and use responsibility accounting
24-2Copyright © 2014 Pearson Education, Inc. Publishing as Prentice Hall

Learning Objectives
3. Describe the purpose of performance evaluation systems and how the balanced scorecard helps companies evaluate performance
4. Use responsibility reports to evaluate cost, revenue, and profit centers
24-3Copyright © 2014 Pearson Education, Inc. Publishing as Prentice Hall
Learning Objectives
5. Use return on investment (ROI) and residual income (RI) to evaluate investment centers
6. Determine how transfer pricing affects decentralized companies (Appendix 24A)
24-4Copyright © 2014 Pearson Education, Inc. Publishing as Prentice Hall

Learning Objective 1
Assign direct costs and Assign direct costs and allocate indirect costs allocate indirect costs using predetermined using predetermined overhead allocation overhead allocation rates with single and rates with single and
multiple allocation multiple allocation basesbases
24-5Copyright © 2014 Pearson Education, Inc. Publishing as Prentice Hall
Ways to Allocate Indirect Costs
• Plantwide rate
• Multiple department rates
• Activity-based costing
Copyright © 2014 Pearson Education, Inc. Publishing as Prentice Hall 24-6
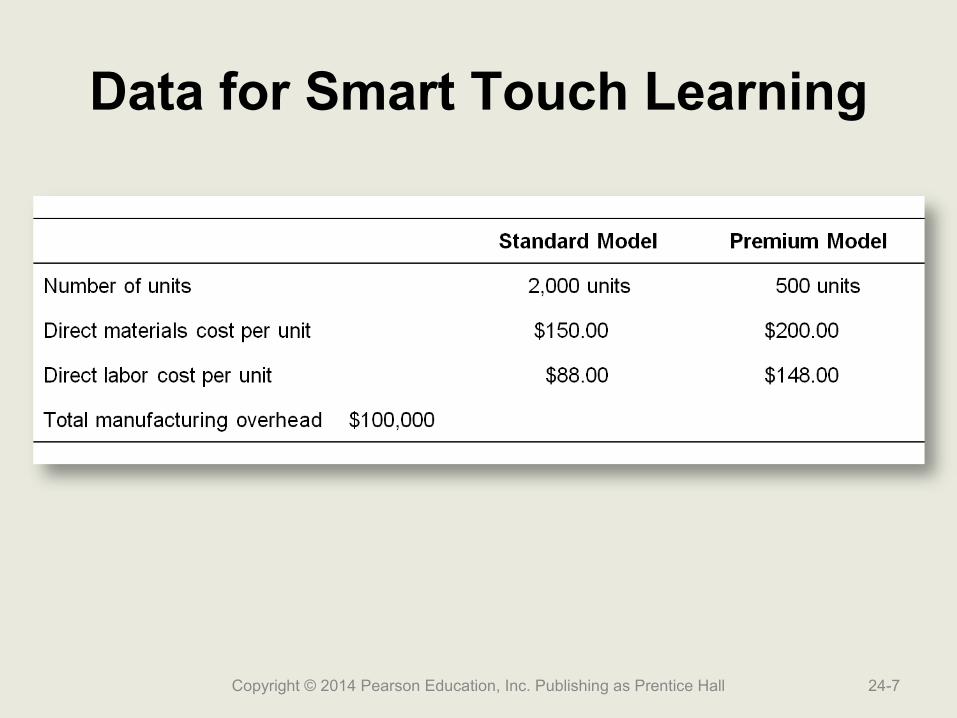
Data for Smart Touch Learning
Copyright © 2014 Pearson Education, Inc. Publishing as Prentice Hall 24-7
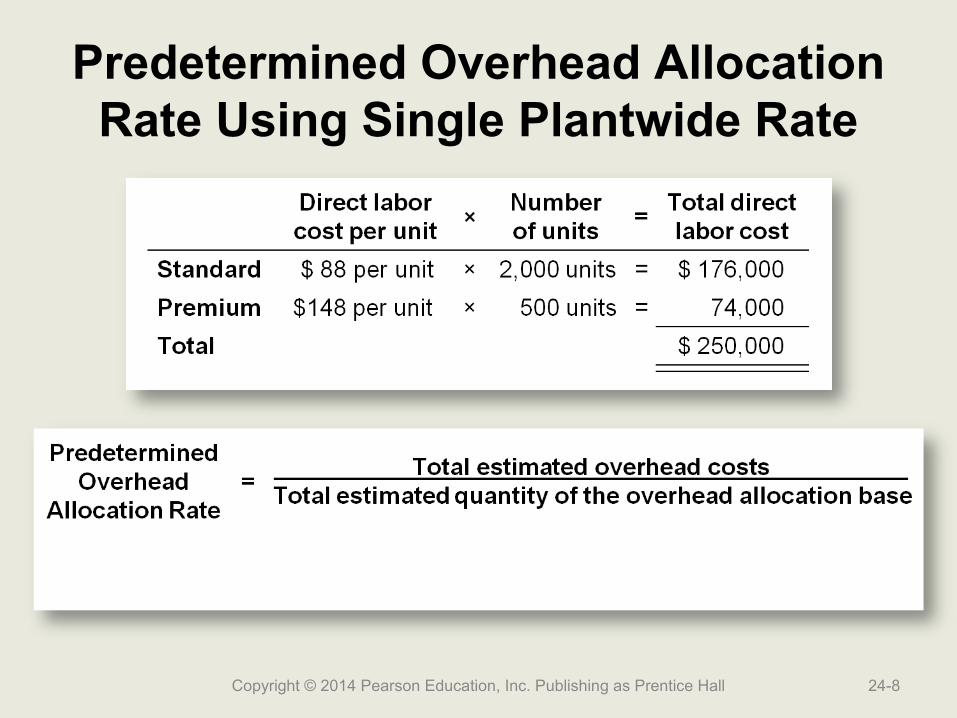
Predetermined Overhead Allocation Rate Using Single Plantwide Rate
Copyright © 2014 Pearson Education, Inc. Publishing as Prentice Hall 24-8
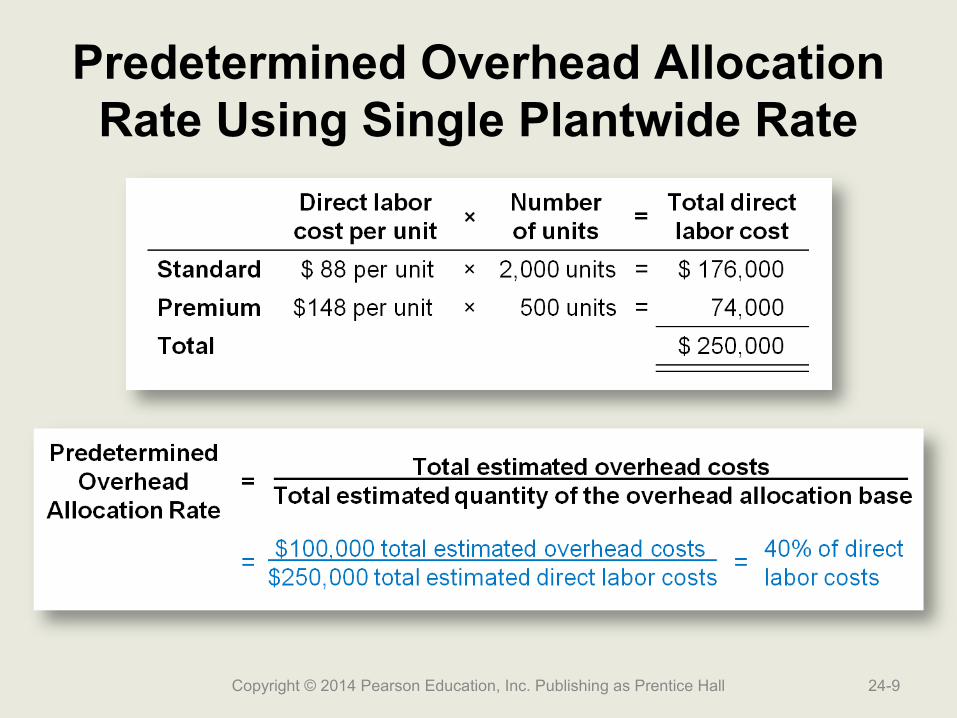
Predetermined Overhead Allocation Rate Using Single Plantwide Rate
Copyright © 2014 Pearson Education, Inc. Publishing as Prentice Hall 24-9
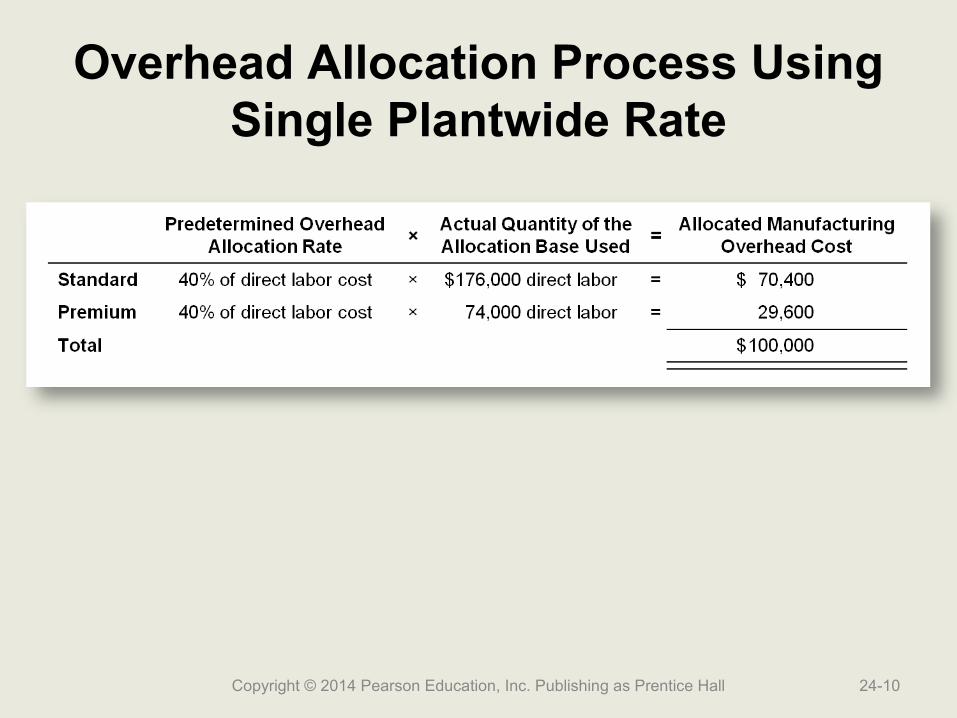
Overhead Allocation Process UsingSingle Plantwide Rate
Copyright © 2014 Pearson Education, Inc. Publishing as Prentice Hall 24-10

Total Cost per Unit UsingSingle Plantwide Rate
Copyright © 2014 Pearson Education, Inc. Publishing as Prentice Hall 24-11
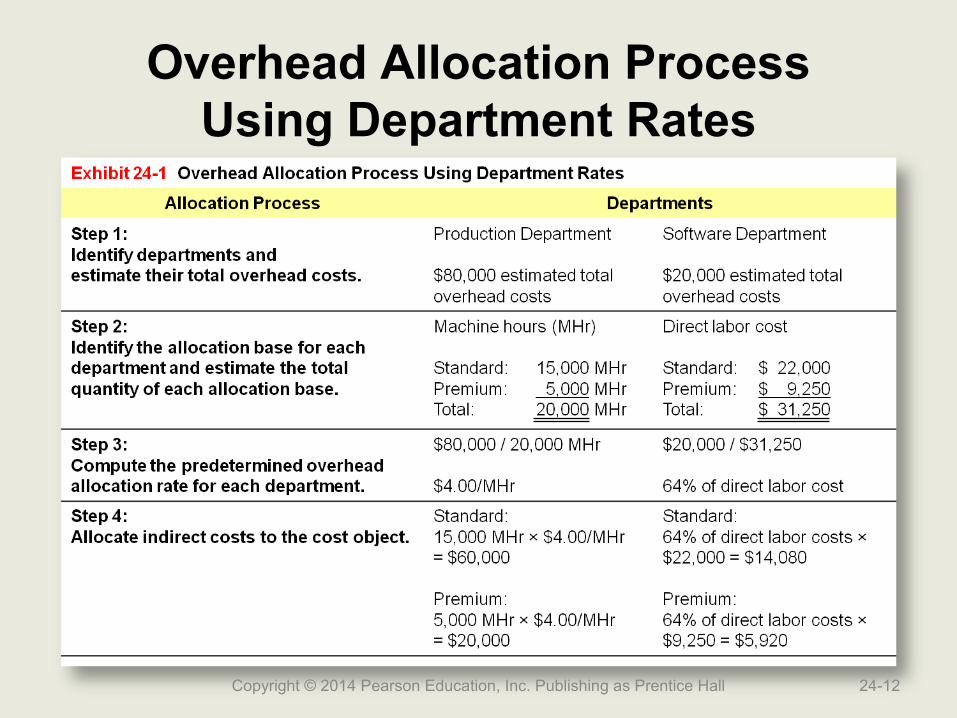
Overhead Allocation ProcessUsing Department Rates
Copyright © 2014 Pearson Education, Inc. Publishing as Prentice Hall 24-12
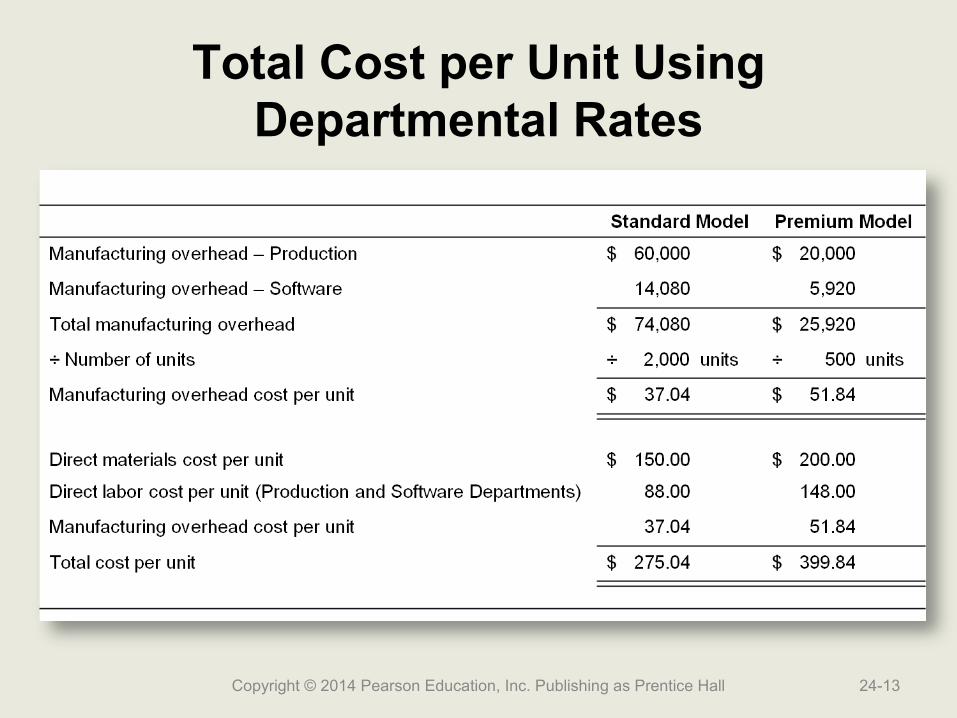
Total Cost per Unit Using Departmental Rates
Copyright © 2014 Pearson Education, Inc. Publishing as Prentice Hall 24-13

Summary
Copyright © 2014 Pearson Education, Inc. Publishing as Prentice Hall 24-14
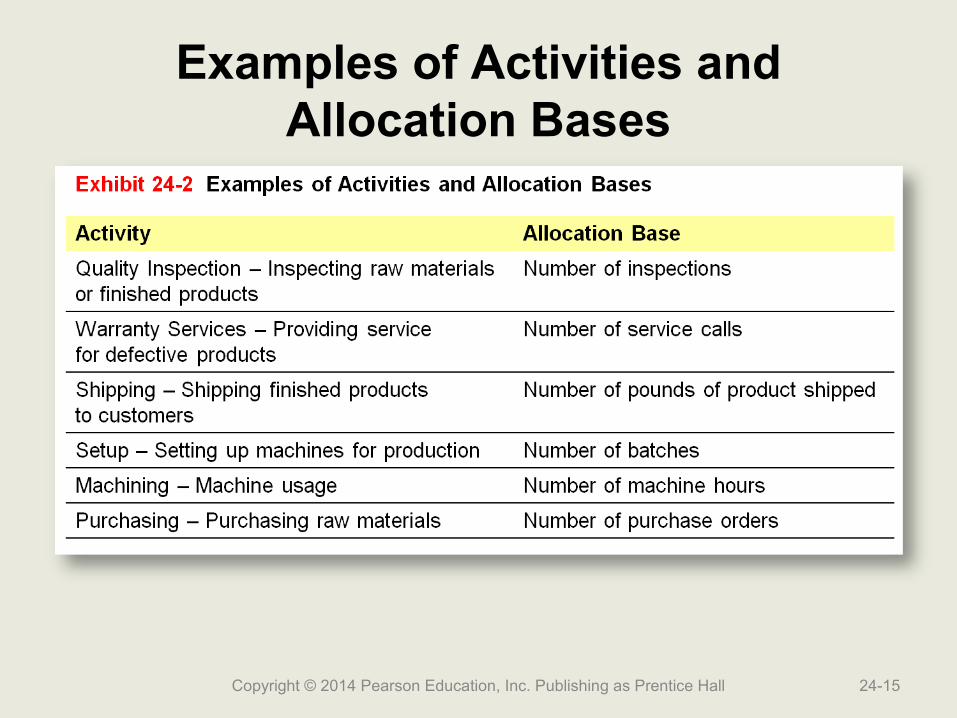
Examples of Activities and Allocation Bases
Copyright © 2014 Pearson Education, Inc. Publishing as Prentice Hall 24-15
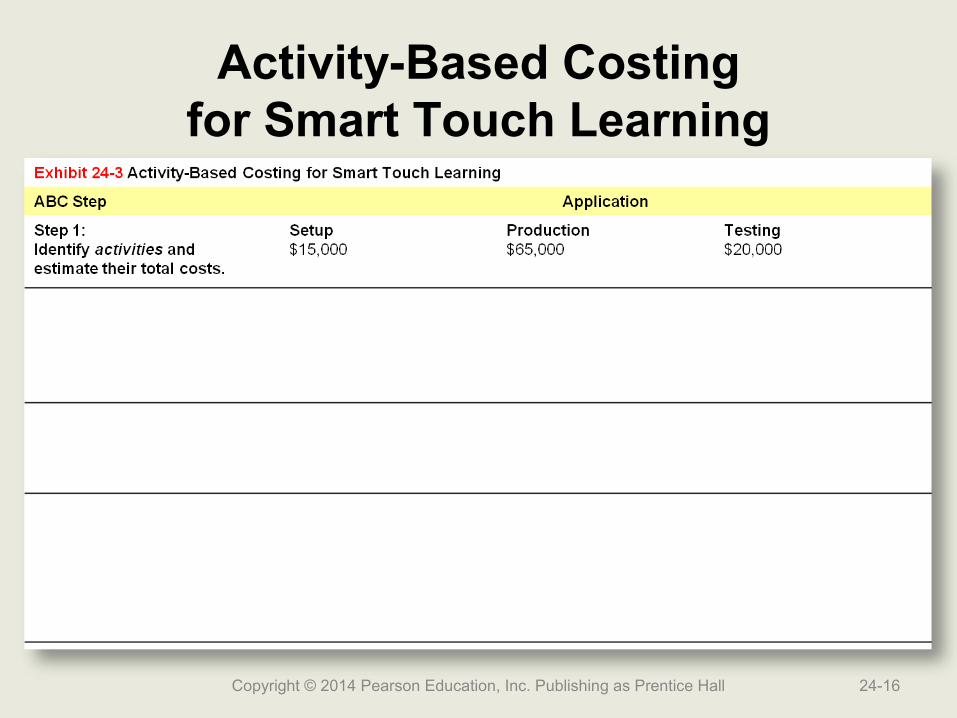
Activity-Based Costingfor Smart Touch Learning
Copyright © 2014 Pearson Education, Inc. Publishing as Prentice Hall 24-16
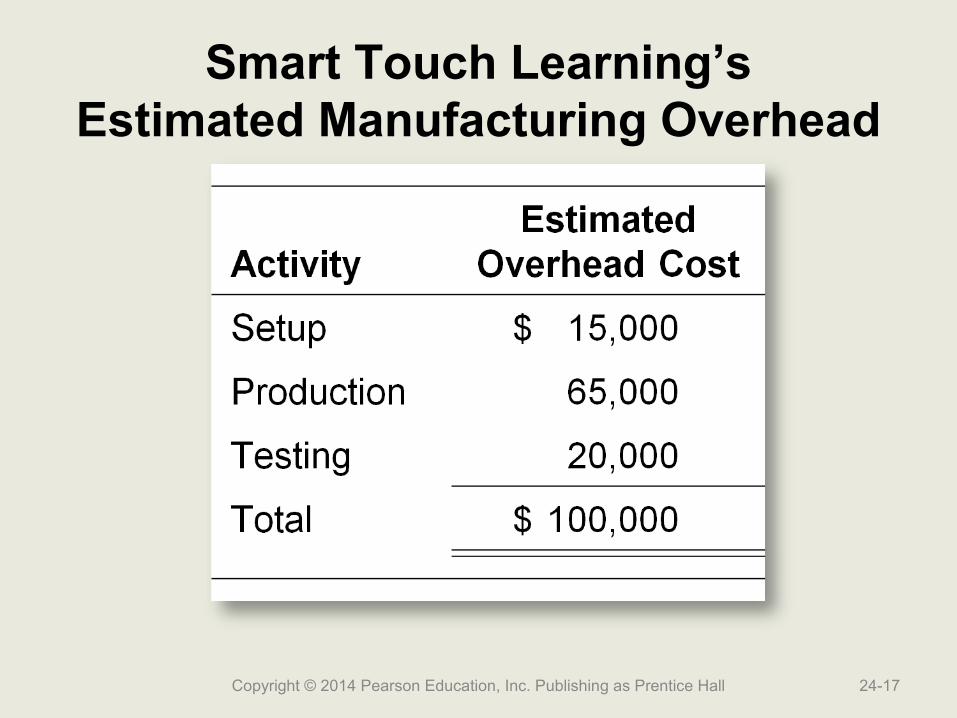
Smart Touch Learning’sEstimated Manufacturing Overhead
Copyright © 2014 Pearson Education, Inc. Publishing as Prentice Hall 24-17
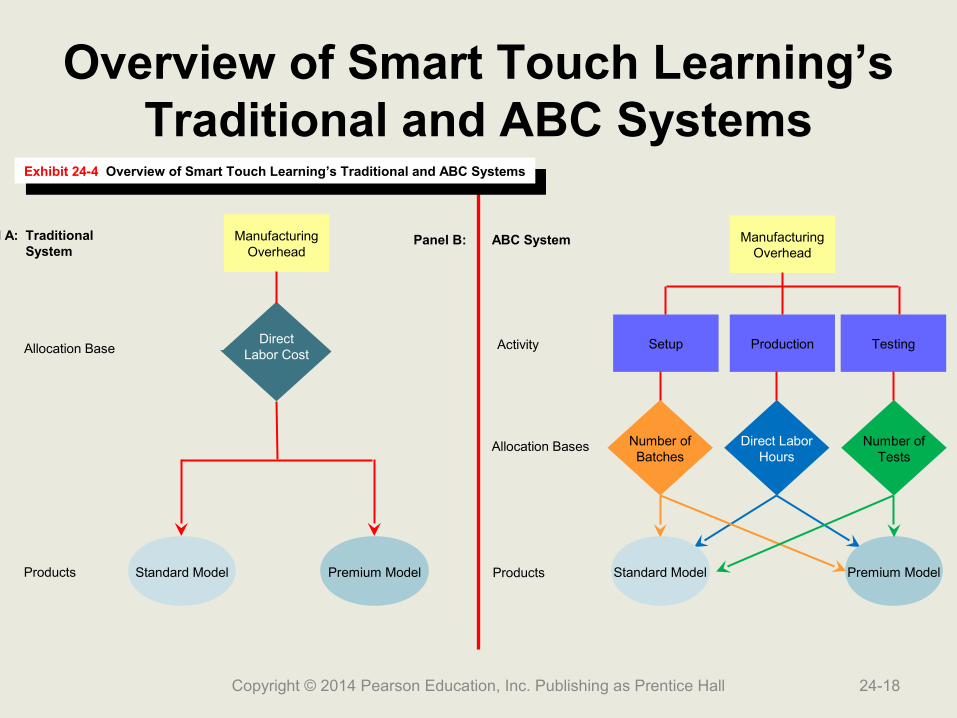
Overview of Smart Touch Learning’s Traditional and ABC Systems
Copyright © 2014 Pearson Education, Inc. Publishing as Prentice Hall 24-18
ManufacturingOverhead
Panel A: TraditionalSystem
DirectLabor CostAllocation Base
ManufacturingOverhead
ProductionSetup
Panel B: ABC System
Activity Testing
Number ofBatches
Direct LaborHours
Number ofTests
Standard Model Premium ModelStandard Model Premium Model
Allocation Bases
ProductsProducts
Exhibit 24-4 Overview of Smart Touch Learning’s Traditional and ABC SystemsExhibit 24-4 Overview of Smart Touch Learning’s Traditional and ABC Systems
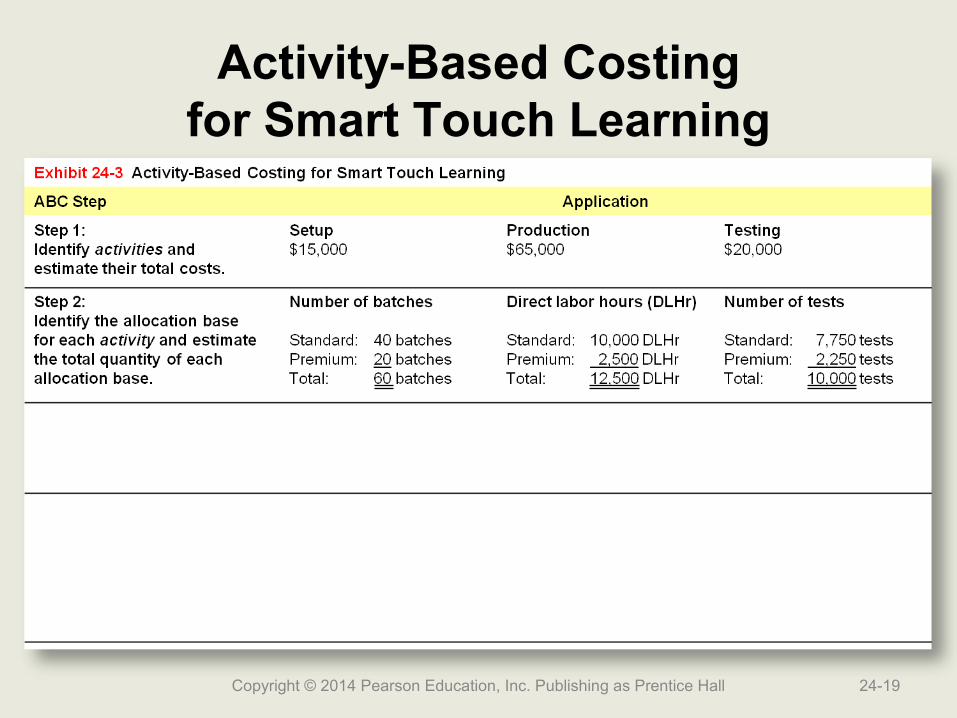
Activity-Based Costingfor Smart Touch Learning
Copyright © 2014 Pearson Education, Inc. Publishing as Prentice Hall 24-19
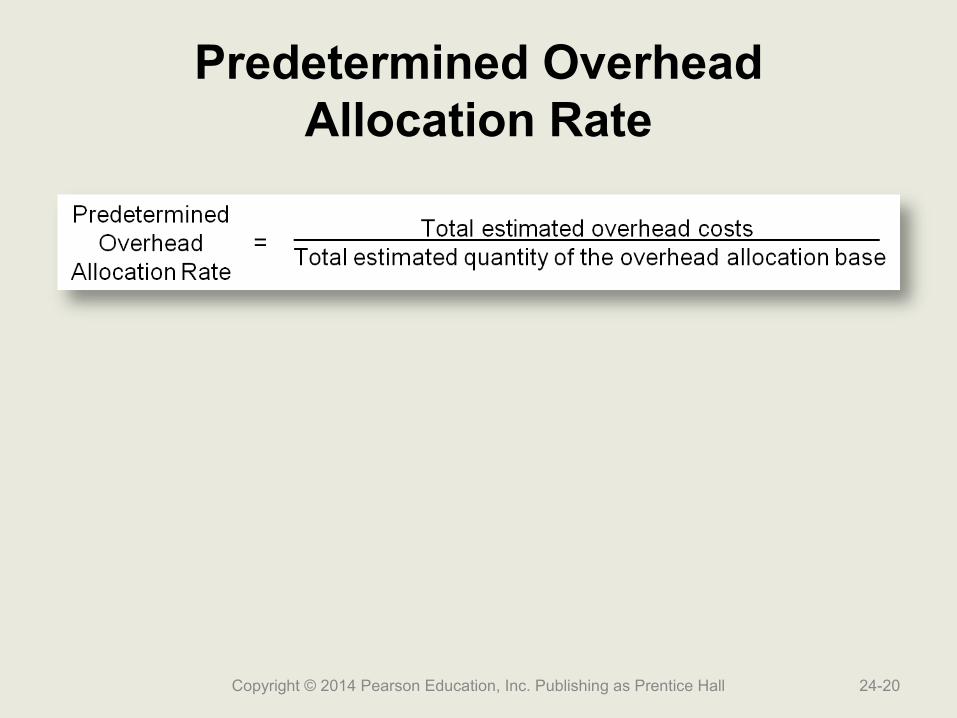
Predetermined OverheadAllocation Rate
Copyright © 2014 Pearson Education, Inc. Publishing as Prentice Hall 24-20
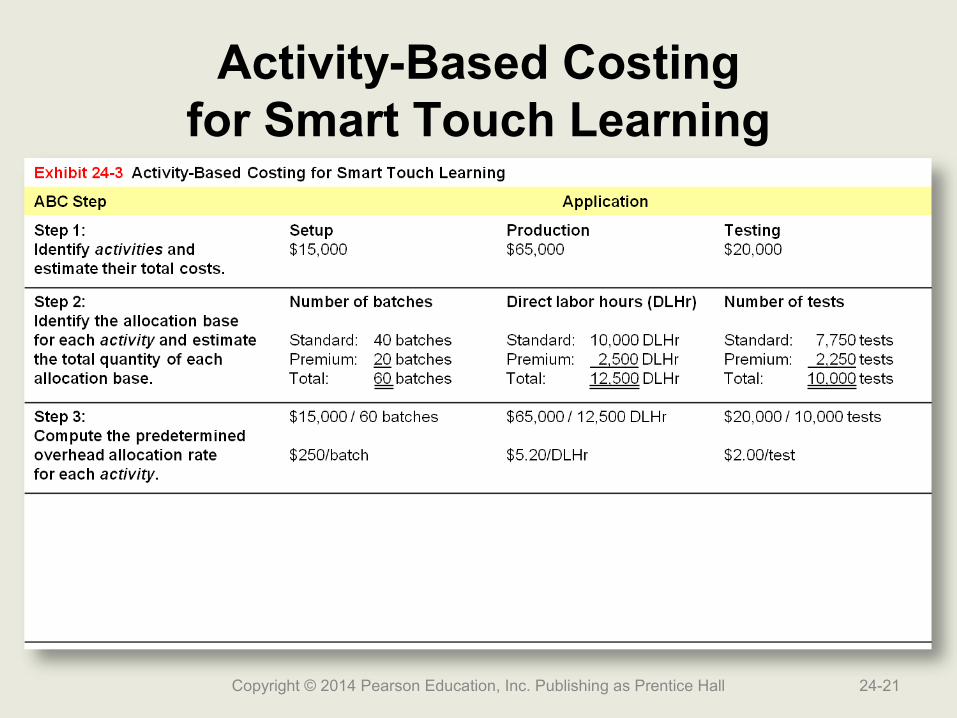
Activity-Based Costingfor Smart Touch Learning
Copyright © 2014 Pearson Education, Inc. Publishing as Prentice Hall 24-21

Activity-Based Costingfor Smart Touch Learning
Copyright © 2014 Pearson Education, Inc. Publishing as Prentice Hall 24-22
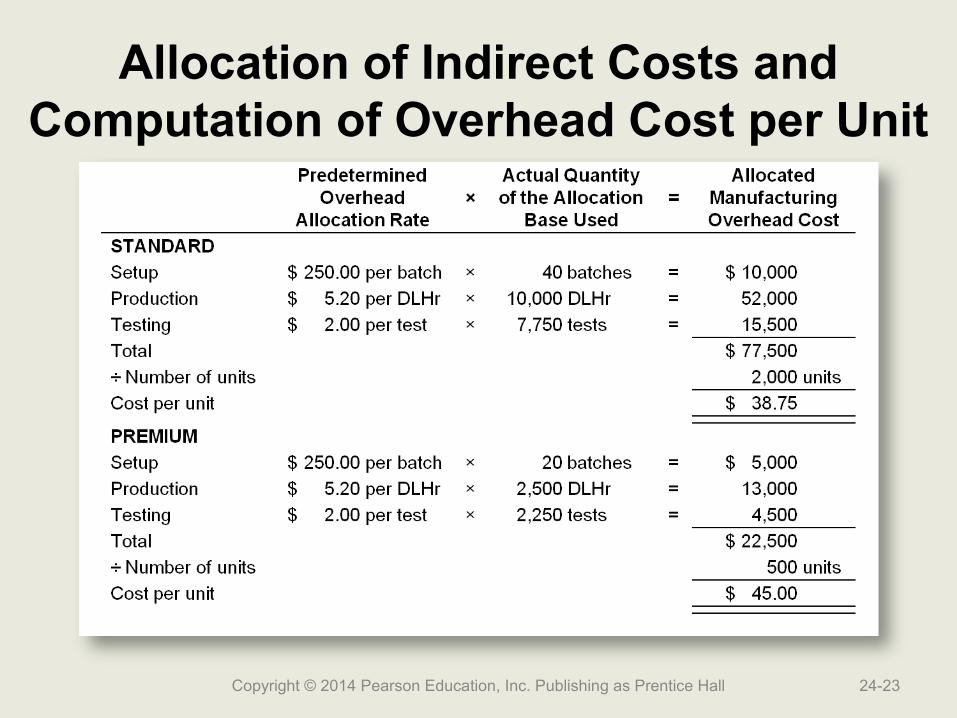
Allocation of Indirect Costs and Computation of Overhead Cost per Unit
Copyright © 2014 Pearson Education, Inc. Publishing as Prentice Hall 24-23

Total Cost per Unit
Copyright © 2014 Pearson Education, Inc. Publishing as Prentice Hall 24-24
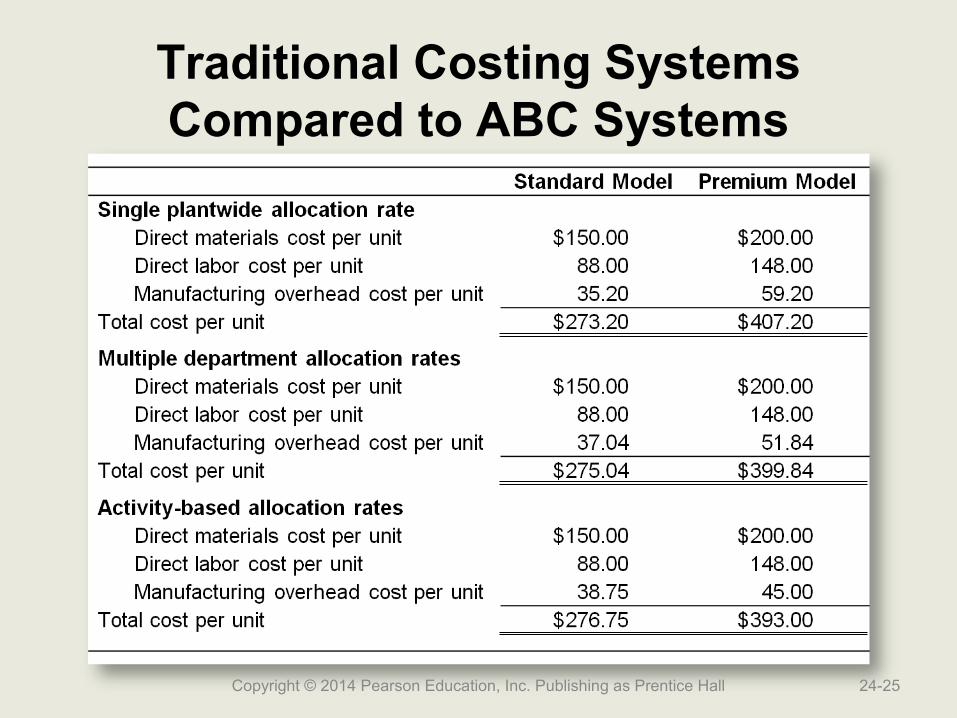
Traditional Costing Systems Compared to ABC Systems
Copyright © 2014 Pearson Education, Inc. Publishing as Prentice Hall 24-25
Copyright © 2014 Pearson Education, Inc. Publishing as Prentice Hall 24-26
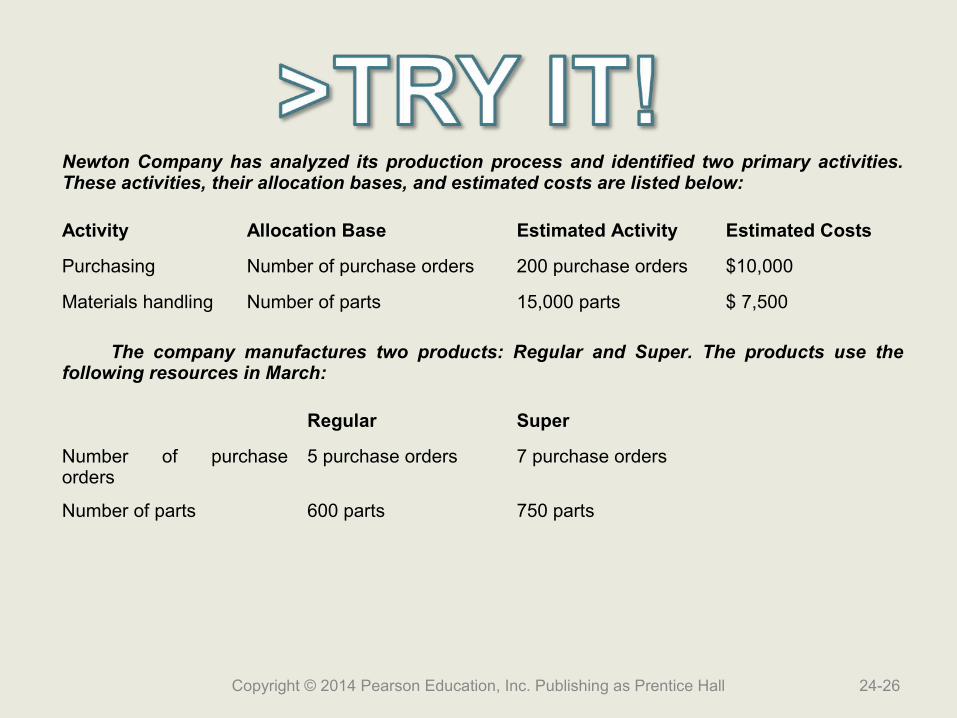
Newton Company has analyzed its production process and identified two primary activities. These activities, their allocation bases, and estimated costs are listed below:
Activity Allocation Base Estimated Activity Estimated Costs
Purchasing Number of purchase orders 200 purchase orders $10,000
Materials handling Number of parts 15,000 parts $ 7,500
The company manufactures two products: Regular and Super. The products use the following resources in March:
Regular Super
Number of purchase orders
5 purchase orders 7 purchase orders
Number of parts 600 parts 750 parts

1. Compute the predetermined overhead allocation rates using activity-based costing.
Copyright © 2014 Pearson Education, Inc. Publishing as Prentice Hall 24-27
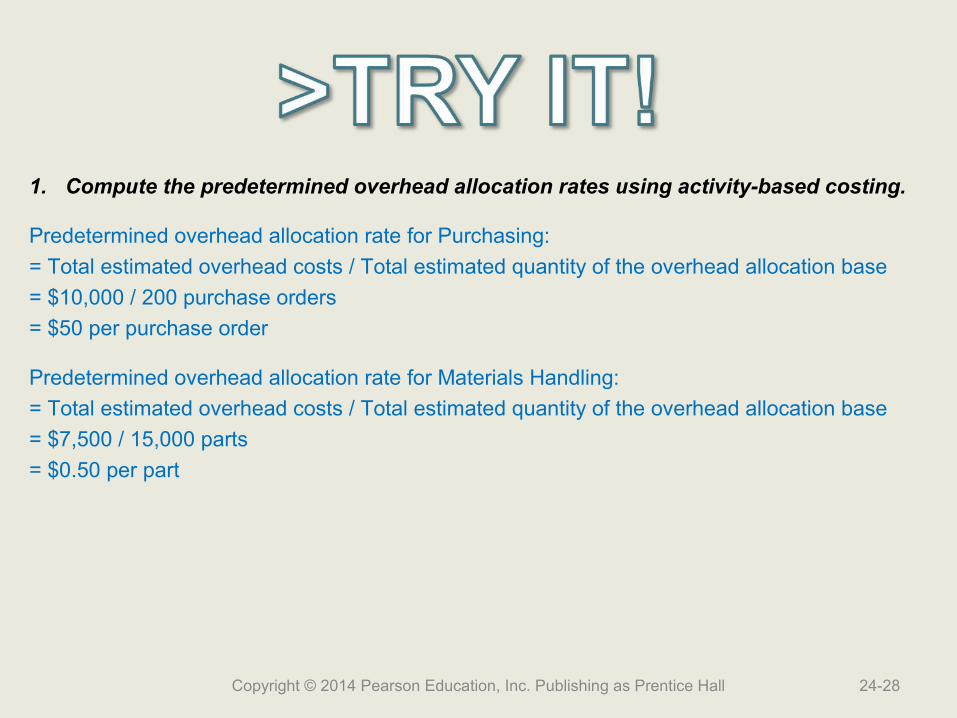
1. Compute the predetermined overhead allocation rates using activity-based costing.
Predetermined overhead allocation rate for Purchasing:
= Total estimated overhead costs / Total estimated quantity of the overhead allocation base
= $10,000 / 200 purchase orders
= $50 per purchase order
Predetermined overhead allocation rate for Materials Handling:
= Total estimated overhead costs / Total estimated quantity of the overhead allocation base
= $7,500 / 15,000 parts
= $0.50 per part
Copyright © 2014 Pearson Education, Inc. Publishing as Prentice Hall 24-28

2. Determine the amount of overhead allocated to Regular in March.
Copyright © 2014 Pearson Education, Inc. Publishing as Prentice Hall 24-29

2. Determine the amount of overhead allocated to Regular in March.
Allocated Manufacturing Overhead Cost for Regular for Purchasing:
= Predetermined overhead allocation rate × Actual quantity of the allocation base used
= $50 per purchase order × 5 purchase orders
= $250
Allocated Manufacturing Overhead Cost for Regular for Materials Handling:
= Predetermined overhead allocation rate × Actual quantity of the allocation base used
= $0.50 per part × 600 parts
= $300
Total overhead allocated to Regular
= $250 + $300
= $550
Copyright © 2014 Pearson Education, Inc. Publishing as Prentice Hall 24-30

3. Determine the amount of overhead allocated to Super in March.
Copyright © 2014 Pearson Education, Inc. Publishing as Prentice Hall 24-31
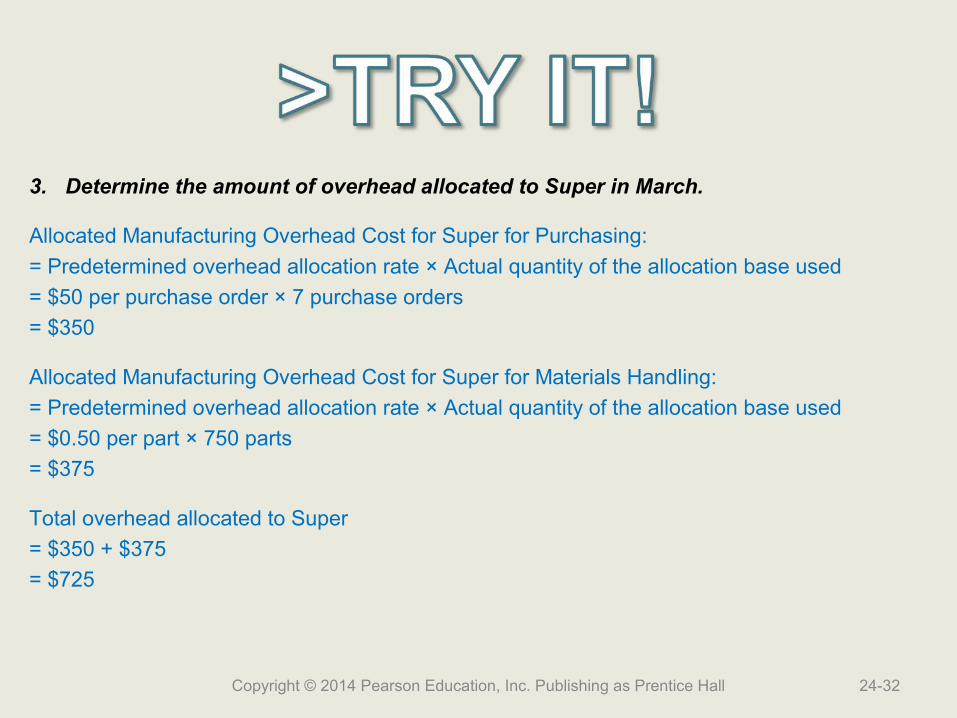
3. Determine the amount of overhead allocated to Super in March.
Allocated Manufacturing Overhead Cost for Super for Purchasing:
= Predetermined overhead allocation rate × Actual quantity of the allocation base used
= $50 per purchase order × 7 purchase orders
= $350
Allocated Manufacturing Overhead Cost for Super for Materials Handling:
= Predetermined overhead allocation rate × Actual quantity of the allocation base used
= $0.50 per part × 750 parts
= $375
Total overhead allocated to Super
= $350 + $375
= $725
Copyright © 2014 Pearson Education, Inc. Publishing as Prentice Hall 24-32
Learning Objective 2
Explain why Explain why companies companies
decentralize and use decentralize and use responsibility responsibility
accountingaccounting
24-33Copyright © 2014 Pearson Education, Inc. Publishing as Prentice Hall
Organization of a Business
• Centralized
• Decentralized
Copyright © 2014 Pearson Education, Inc. Publishing as Prentice Hall 24-34
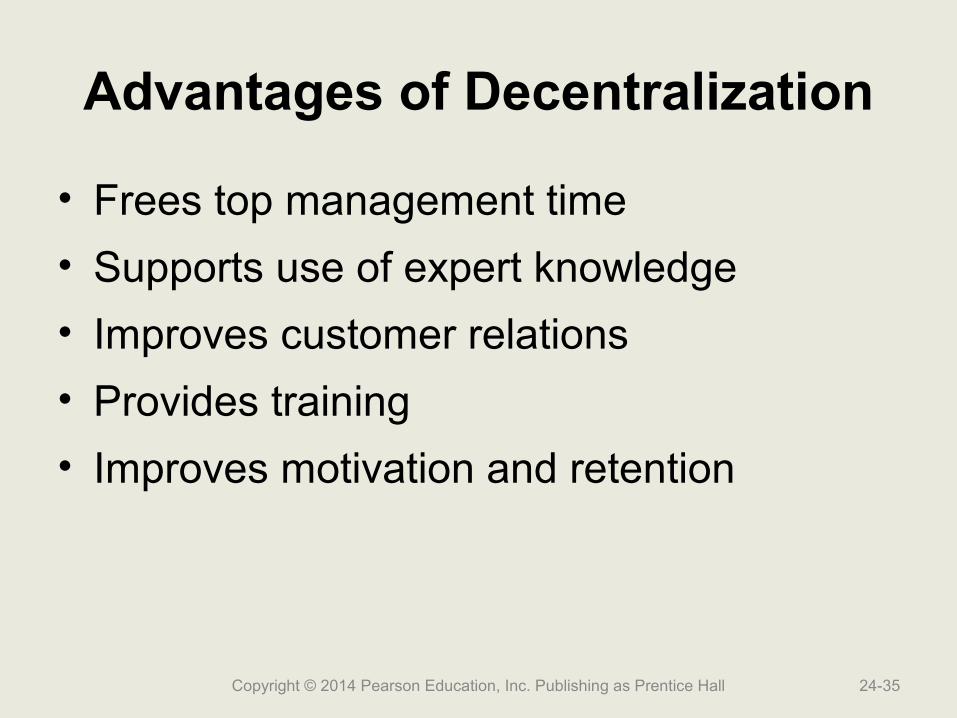
Advantages of Decentralization
• Frees top management time
• Supports use of expert knowledge
• Improves customer relations
• Provides training
• Improves motivation and retention
Copyright © 2014 Pearson Education, Inc. Publishing as Prentice Hall 24-35

Disadvantages of Decentralization
• Duplication of costs
• Problems achieving goal congruence
Copyright © 2014 Pearson Education, Inc. Publishing as Prentice Hall 24-36

Responsibility Centers
Copyright © 2014 Pearson Education, Inc. Publishing as Prentice Hall 24-37

Smart Touch LearningOrganization Chart (Partial)
Copyright © 2014 Pearson Education, Inc. Publishing as Prentice Hall 24-38
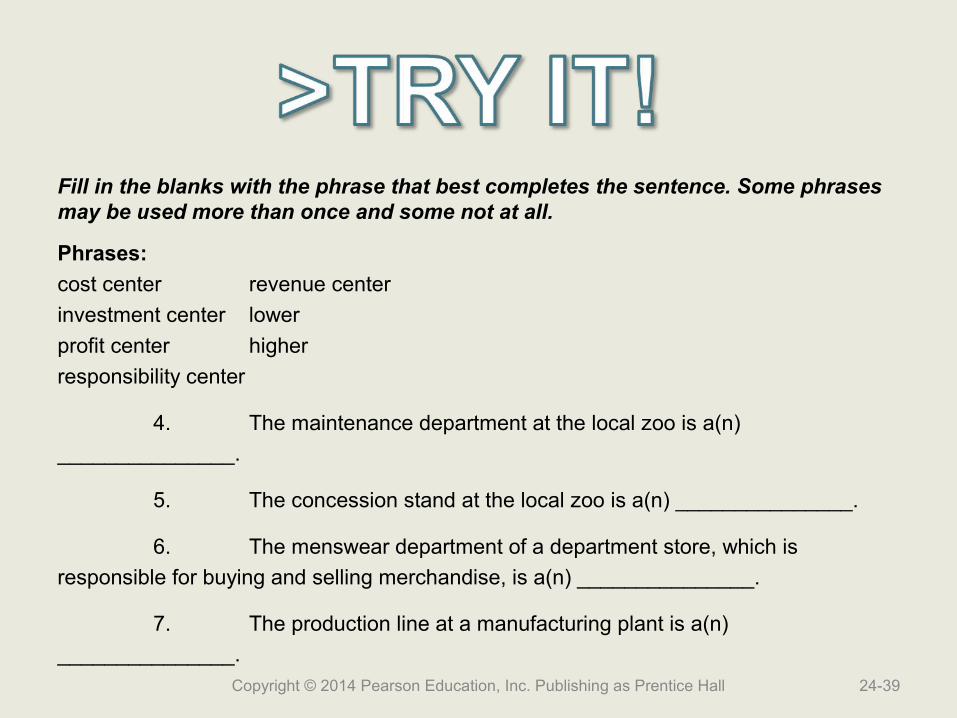
Fill in the blanks with the phrase that best completes the sentence. Some phrases may be used more than once and some not at all.
Phrases:
cost center revenue center
investment center lower
profit center higher
responsibility center
4. The maintenance department at the local zoo is a(n)
_______________.
5. The concession stand at the local zoo is a(n) _______________.
6. The menswear department of a department store, which is
responsible for buying and selling merchandise, is a(n) _______________.
7. The production line at a manufacturing plant is a(n)
_______________.Copyright © 2014 Pearson Education, Inc. Publishing as Prentice Hall 24-39
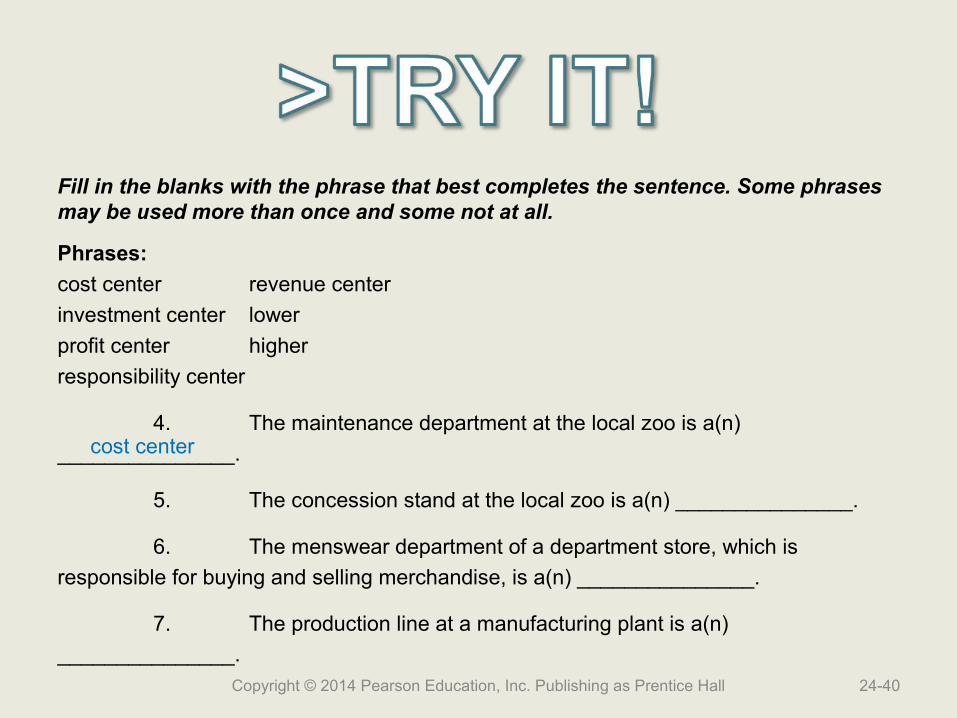
Fill in the blanks with the phrase that best completes the sentence. Some phrases may be used more than once and some not at all.
Phrases:
cost center revenue center
investment center lower
profit center higher
responsibility center
4. The maintenance department at the local zoo is a(n)
_______________.
5. The concession stand at the local zoo is a(n) _______________.
6. The menswear department of a department store, which is
responsible for buying and selling merchandise, is a(n) _______________.
7. The production line at a manufacturing plant is a(n)
_______________.Copyright © 2014 Pearson Education, Inc. Publishing as Prentice Hall 24-40
cost center
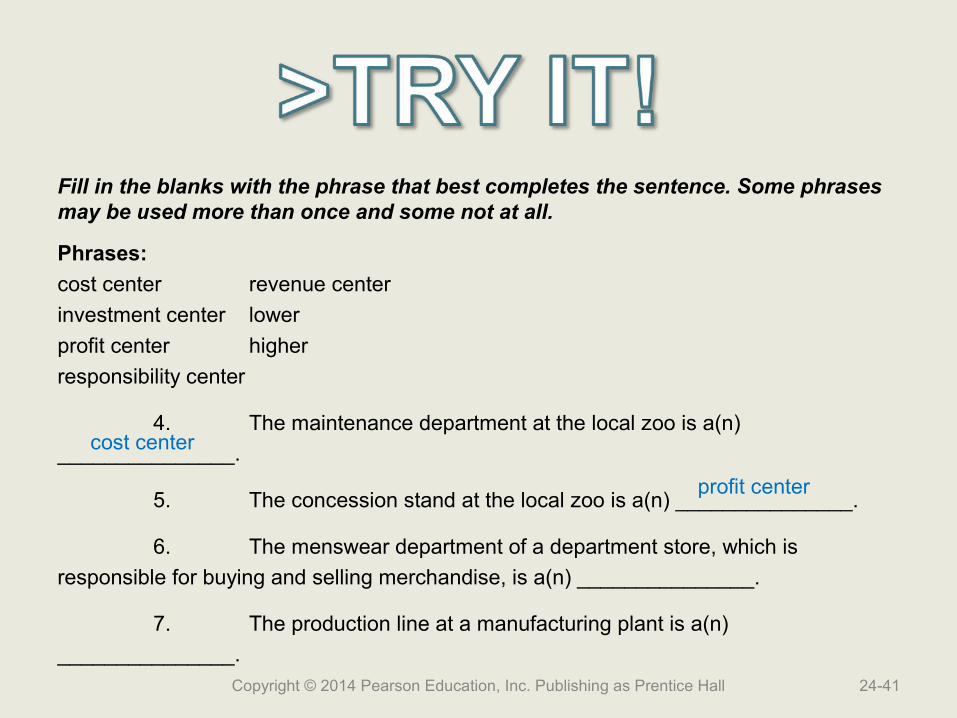
Fill in the blanks with the phrase that best completes the sentence. Some phrases may be used more than once and some not at all.
Phrases:
cost center revenue center
investment center lower
profit center higher
responsibility center
4. The maintenance department at the local zoo is a(n)
_______________.
5. The concession stand at the local zoo is a(n) _______________.
6. The menswear department of a department store, which is
responsible for buying and selling merchandise, is a(n) _______________.
7. The production line at a manufacturing plant is a(n)
_______________.Copyright © 2014 Pearson Education, Inc. Publishing as Prentice Hall 24-41
cost center
profit center
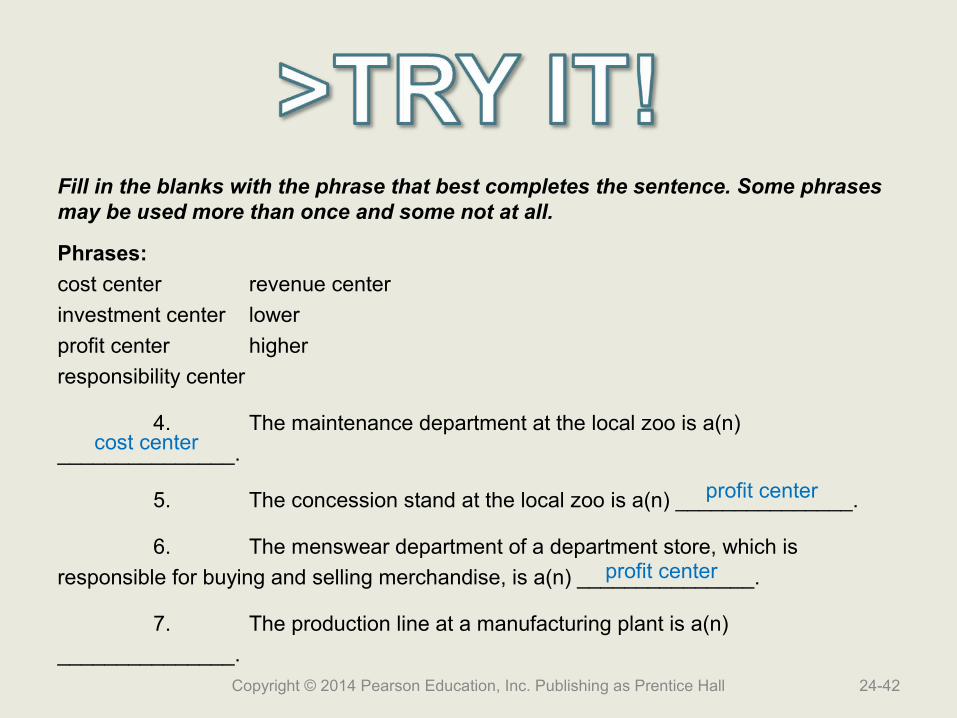
Fill in the blanks with the phrase that best completes the sentence. Some phrases may be used more than once and some not at all.
Phrases:
cost center revenue center
investment center lower
profit center higher
responsibility center
4. The maintenance department at the local zoo is a(n)
_______________.
5. The concession stand at the local zoo is a(n) _______________.
6. The menswear department of a department store, which is
responsible for buying and selling merchandise, is a(n) _______________.
7. The production line at a manufacturing plant is a(n)
_______________.Copyright © 2014 Pearson Education, Inc. Publishing as Prentice Hall 24-42
cost center
profit center
profit center
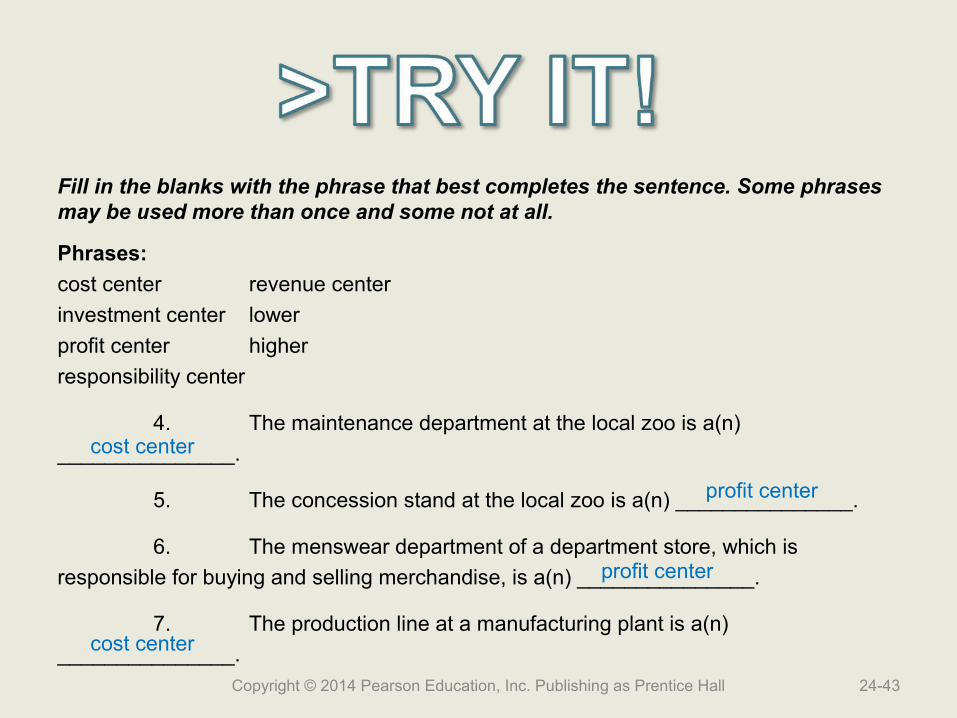
Fill in the blanks with the phrase that best completes the sentence. Some phrases may be used more than once and some not at all.
Phrases:
cost center revenue center
investment center lower
profit center higher
responsibility center
4. The maintenance department at the local zoo is a(n)
_______________.
5. The concession stand at the local zoo is a(n) _______________.
6. The menswear department of a department store, which is
responsible for buying and selling merchandise, is a(n) _______________.
7. The production line at a manufacturing plant is a(n)
_______________.Copyright © 2014 Pearson Education, Inc. Publishing as Prentice Hall 24-43
cost center
profit center
profit center
cost center
Fill in the blanks with the phrase that best completes the sentence. Some phrases may be used more than once and some not at all.
Phrases:
cost center revenue center
investment center lower
profit center higher
responsibility center
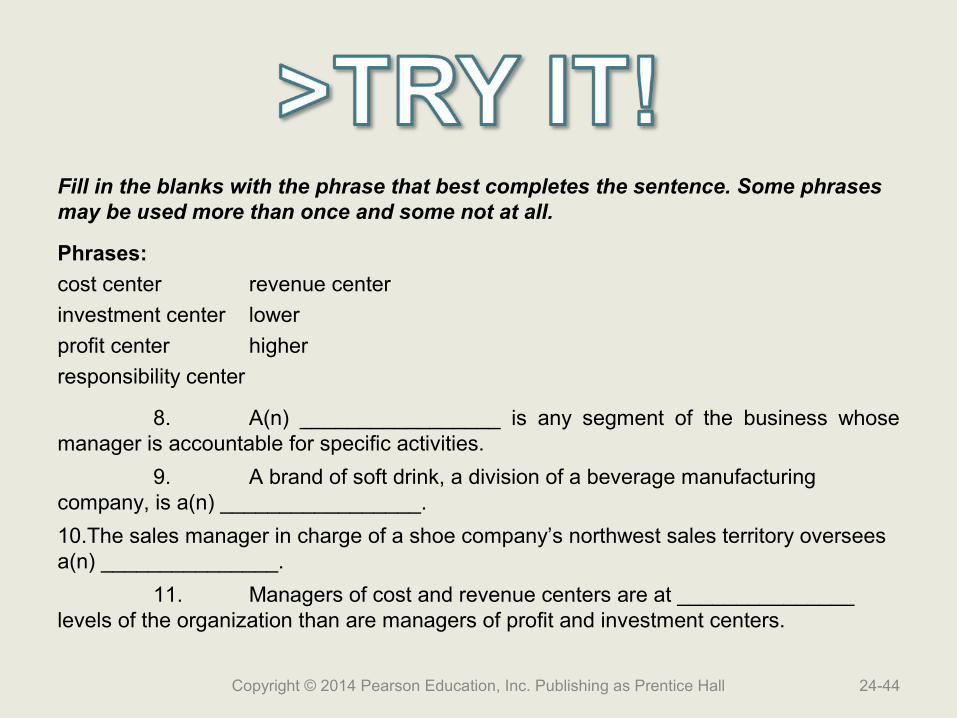
8. A(n) _________________ is any segment of the business whose manager is accountable for specific activities.
9. A brand of soft drink, a division of a beverage manufacturing company, is a(n) _________________.
10.The sales manager in charge of a shoe company’s northwest sales territory oversees a(n) _______________.
11. Managers of cost and revenue centers are at _______________ levels of the organization than are managers of profit and investment centers.
Copyright © 2014 Pearson Education, Inc. Publishing as Prentice Hall 24-44
Try It!
Fill in the blanks with the phrase that best completes the sentence. Some phrases may be used more than once and some not at all.
Phrases:
cost center revenue center
investment center lower
profit center higher
responsibility center
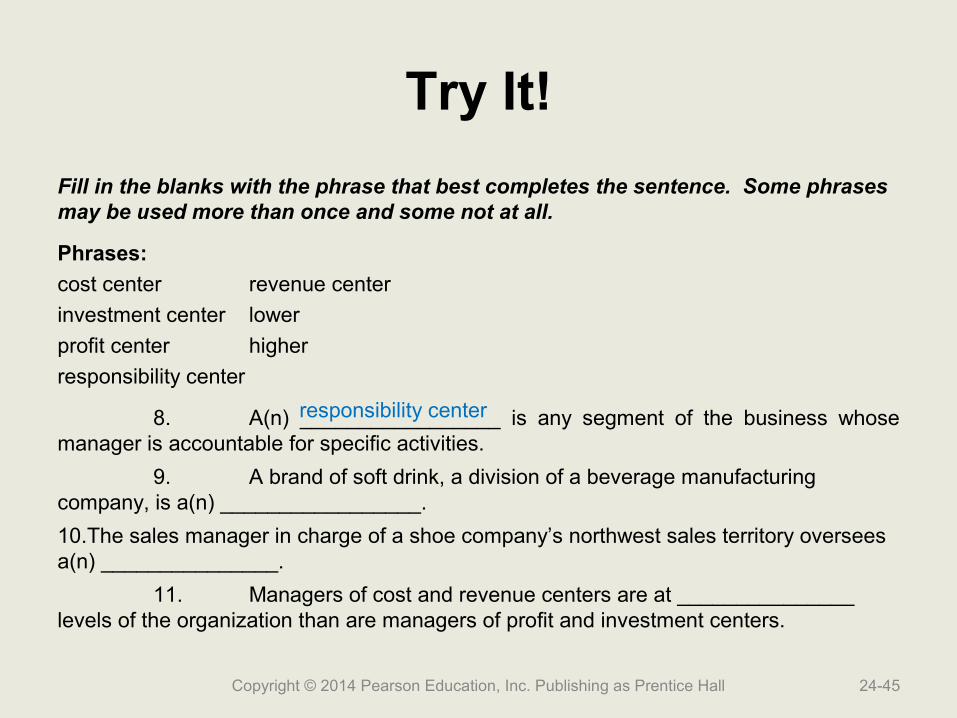
8. A(n) _________________ is any segment of the business whose manager is accountable for specific activities.
9. A brand of soft drink, a division of a beverage manufacturing company, is a(n) _________________.
10.The sales manager in charge of a shoe company’s northwest sales territory oversees a(n) _______________.
11. Managers of cost and revenue centers are at _______________ levels of the organization than are managers of profit and investment centers.
Copyright © 2014 Pearson Education, Inc. Publishing as Prentice Hall 24-45
responsibility center
Fill in the blanks with the phrase that best completes the sentence. Some phrases may be used more than once and some not at all.
Phrases:
cost center revenue center
investment center lower
profit center higher
responsibility center
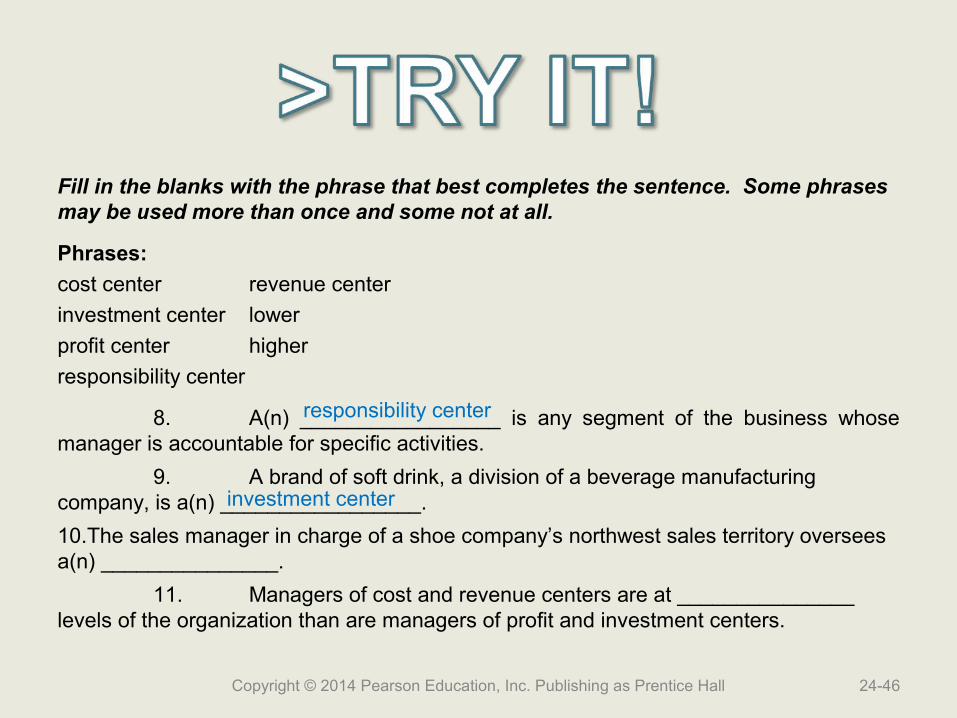
8. A(n) _________________ is any segment of the business whose manager is accountable for specific activities.
9. A brand of soft drink, a division of a beverage manufacturing company, is a(n) _________________.
10.The sales manager in charge of a shoe company’s northwest sales territory oversees a(n) _______________.
11. Managers of cost and revenue centers are at _______________ levels of the organization than are managers of profit and investment centers.
Copyright © 2014 Pearson Education, Inc. Publishing as Prentice Hall 24-46
responsibility center
investment center
Fill in the blanks with the phrase that best completes the sentence. Some phrases may be used more than once and some not at all.
Phrases:
cost center revenue center
investment center lower
profit center higher
responsibility center
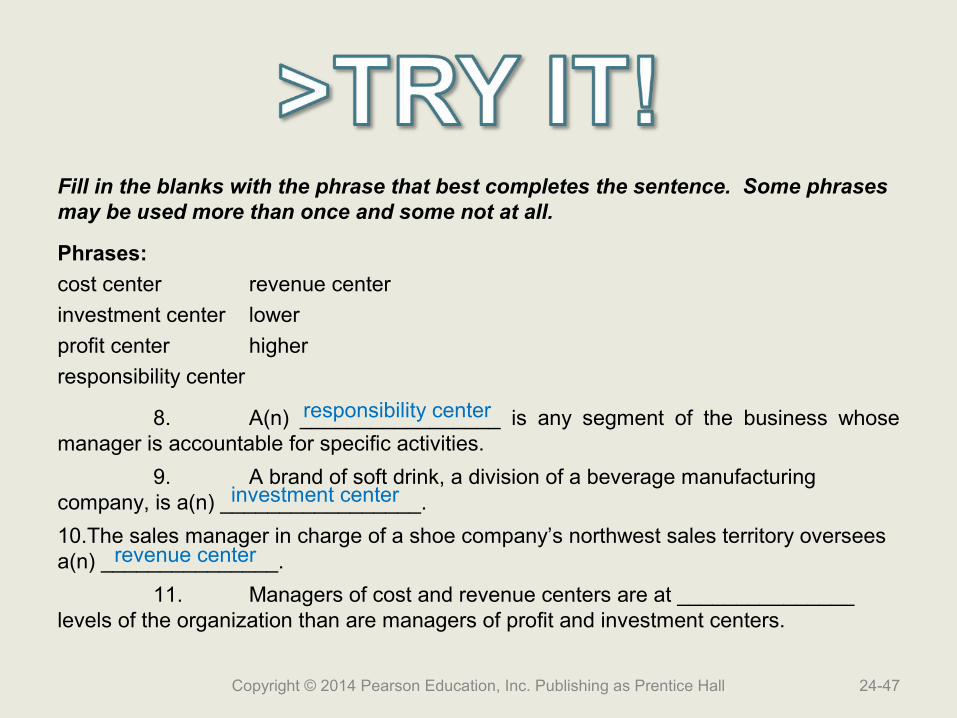
8. A(n) _________________ is any segment of the business whose manager is accountable for specific activities.
9. A brand of soft drink, a division of a beverage manufacturing company, is a(n) _________________.
10.The sales manager in charge of a shoe company’s northwest sales territory oversees a(n) _______________.
11. Managers of cost and revenue centers are at _______________ levels of the organization than are managers of profit and investment centers.
Copyright © 2014 Pearson Education, Inc. Publishing as Prentice Hall 24-47
responsibility center
investment center
revenue center
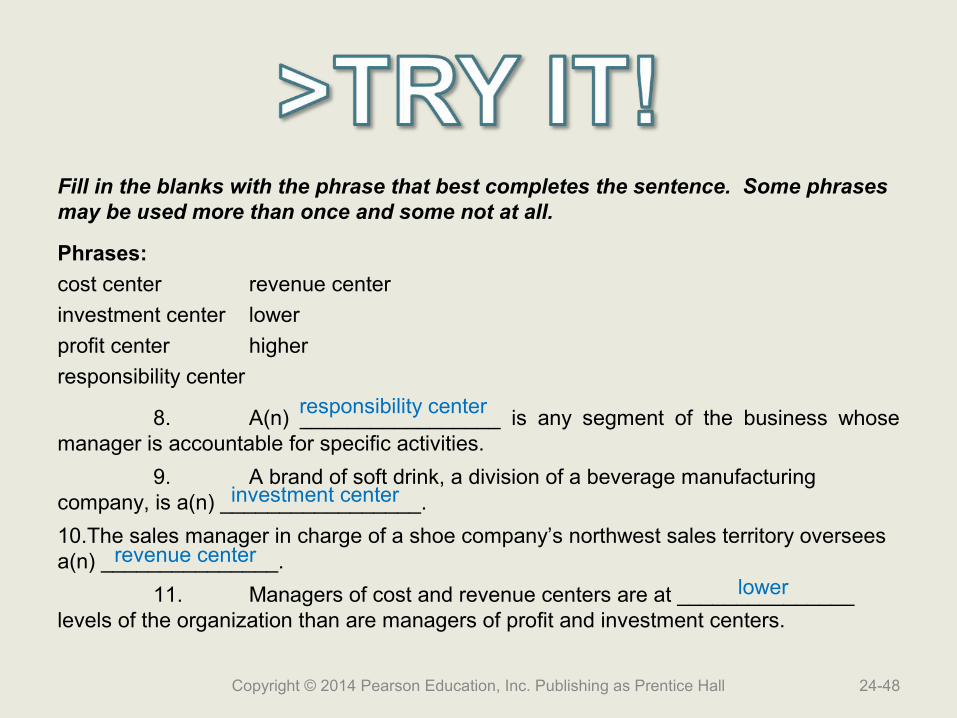
Fill in the blanks with the phrase that best completes the sentence. Some phrases may be used more than once and some not at all.
Phrases:
cost center revenue center
investment center lower
profit center higher
responsibility center
8. A(n) _________________ is any segment of the business whose manager is accountable for specific activities.
9. A brand of soft drink, a division of a beverage manufacturing company, is a(n) _________________.
10.The sales manager in charge of a shoe company’s northwest sales territory oversees a(n) _______________.
11. Managers of cost and revenue centers are at _______________ levels of the organization than are managers of profit and investment centers.
Copyright © 2014 Pearson Education, Inc. Publishing as Prentice Hall 24-48
responsibility center
investment center
revenue center
lower
Learning Objective 3
Describe the purpose Describe the purpose of performance of performance
evaluation systems evaluation systems and how the balanced and how the balanced
scorecard helps scorecard helps companies evaluate companies evaluate
performanceperformance
24-49Copyright © 2014 Pearson Education, Inc. Publishing as Prentice Hall

Goals of PerformanceEvaluation Systems
• Promoting goal congruence and coordination
• Communicating expectations
• Motivating segment managers
• Providing feedback
• Benchmarking
Copyright © 2014 Pearson Education, Inc. Publishing as Prentice Hall 24-50
Limitations of FinancialPerformance Measures
• Lag indicators
• Focus on short-term achievements
Copyright © 2014 Pearson Education, Inc. Publishing as Prentice Hall 24-51
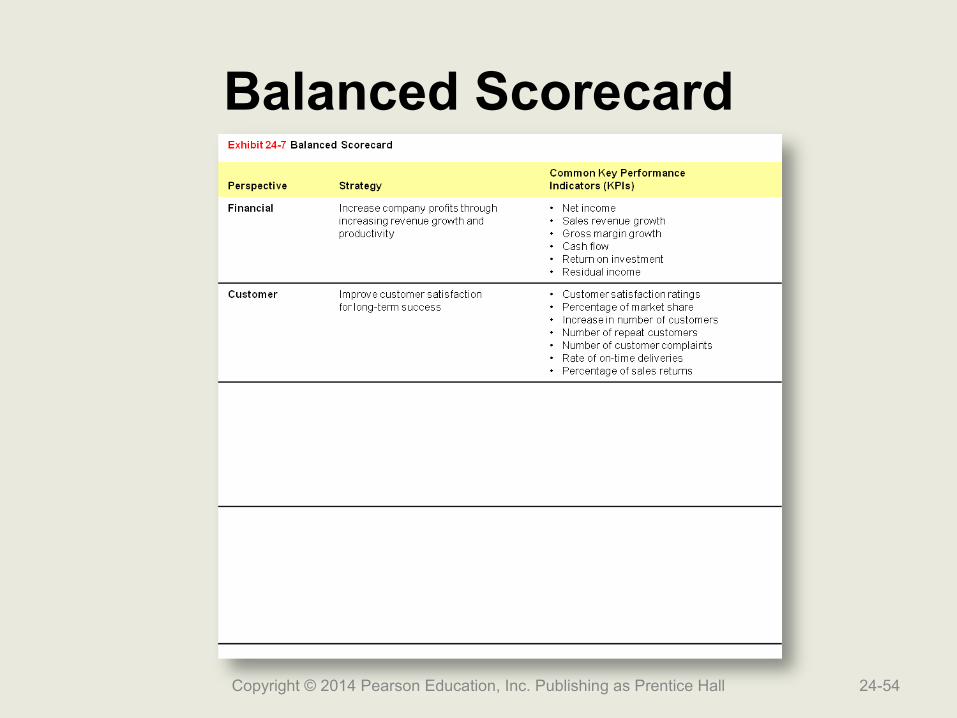
Balanced Scorecard
• Performance evaluation system that requires management to consider:– Financial performance measures (lag
indicators)– Operational performance measures (lead
indicators)• Should link these measures with the company’s:
– Goals– Strategy for achieving those goals
Copyright © 2014 Pearson Education, Inc. Publishing as Prentice Hall 24-52

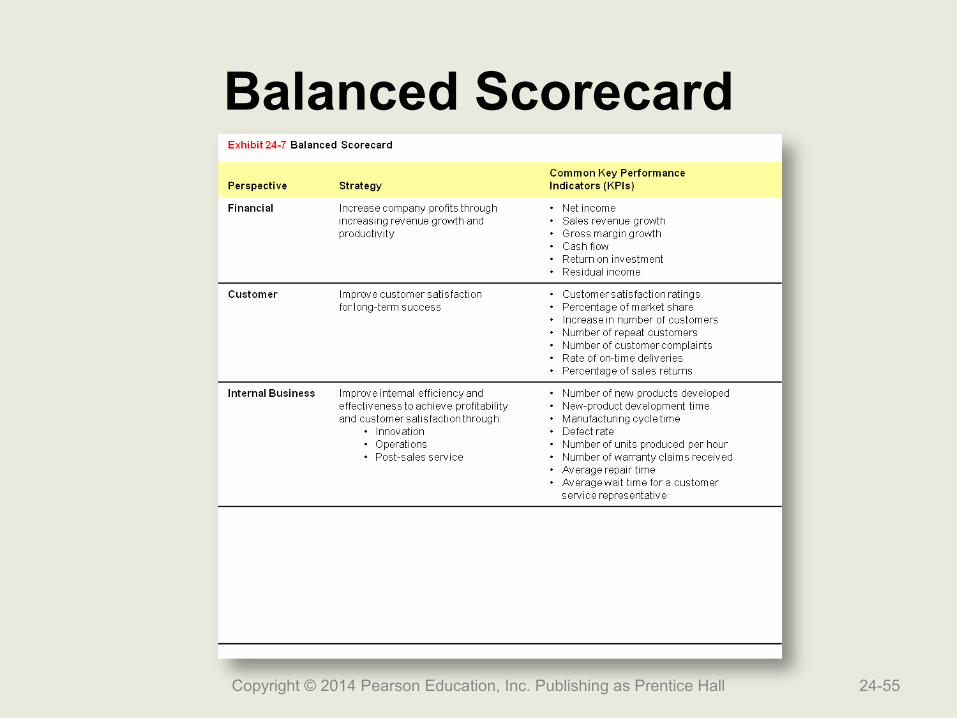
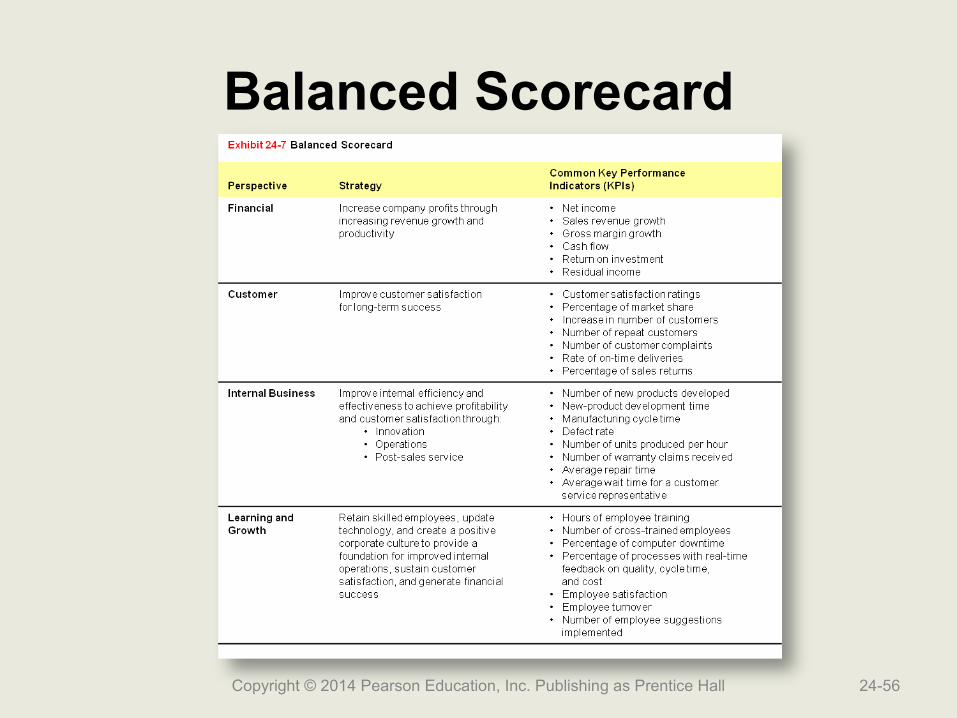
Balanced Scorecard
Copyright © 2014 Pearson Education, Inc. Publishing as Prentice Hall 24-53
Balanced Scorecard
Copyright © 2014 Pearson Education, Inc. Publishing as Prentice Hall 24-54
Balanced Scorecard
Copyright © 2014 Pearson Education, Inc. Publishing as Prentice Hall 24-55
Balanced Scorecard
Copyright © 2014 Pearson Education, Inc. Publishing as Prentice Hall 24-56
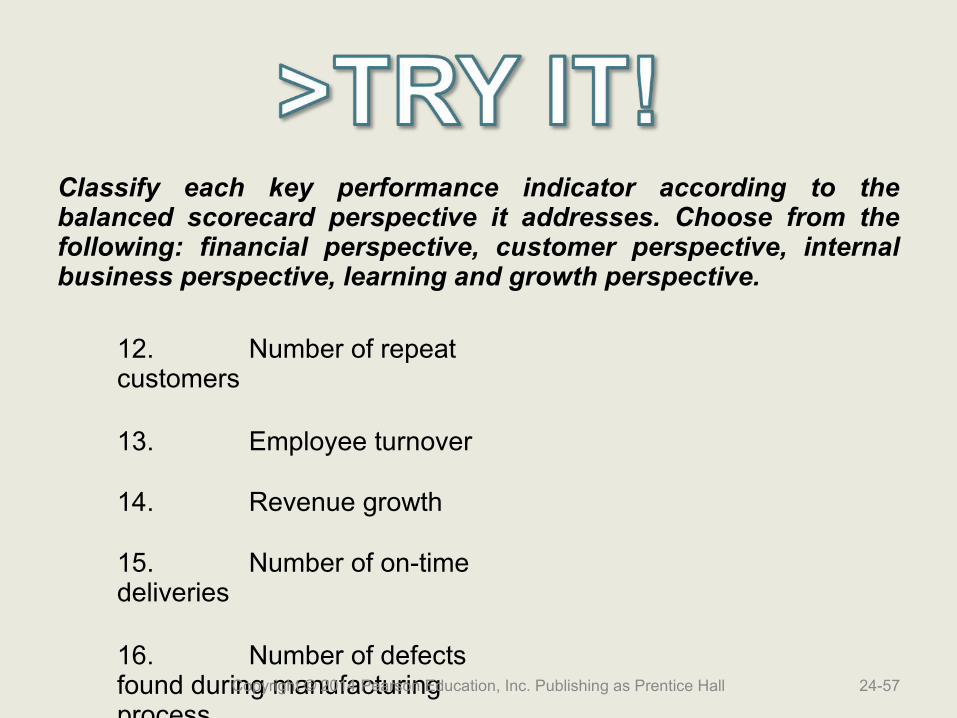
Classify each key performance indicator according to the balanced scorecard perspective it addresses. Choose from the following: financial perspective, customer perspective, internal business perspective, learning and growth perspective.
12. Number of repeat customers
13. Employee turnover
14. Revenue growth
15. Number of on-time deliveries
16. Number of defects found during manufacturing process
Copyright © 2014 Pearson Education, Inc. Publishing as Prentice Hall 24-57

Classify each key performance indicator according to the balanced scorecard perspective it addresses. Choose from the following: financial perspective, customer perspective, internal business perspective, learning and growth perspective.
12. Number of repeat customers
customer perspective
13. Employee turnover
14. Revenue growth
15. Number of on-time deliveries
16. Number of defects found during manufacturing process
Copyright © 2014 Pearson Education, Inc. Publishing as Prentice Hall 24-58
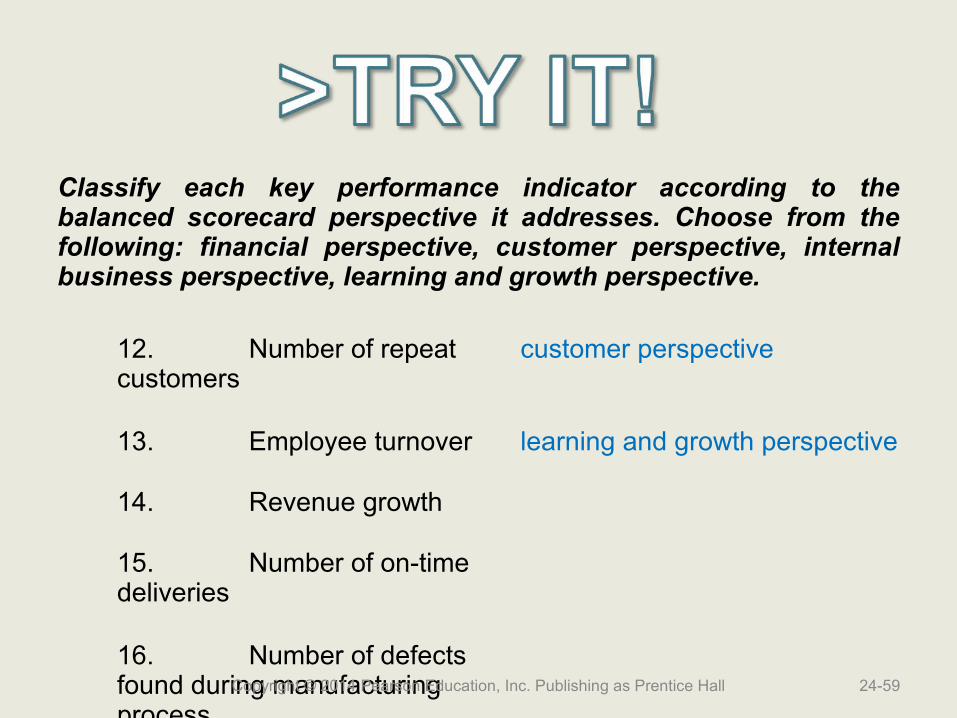
Classify each key performance indicator according to the balanced scorecard perspective it addresses. Choose from the following: financial perspective, customer perspective, internal business perspective, learning and growth perspective.
12. Number of repeat customers
customer perspective
13. Employee turnover learning and growth perspective
14. Revenue growth
15. Number of on-time deliveries
16. Number of defects found during manufacturing process
Copyright © 2014 Pearson Education, Inc. Publishing as Prentice Hall 24-59
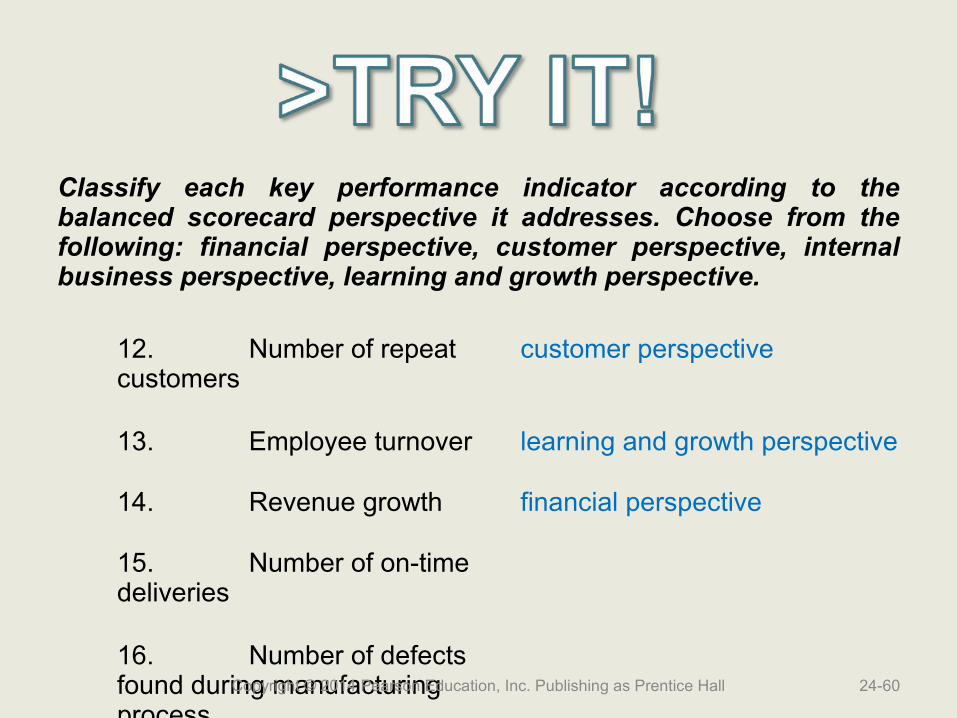
Classify each key performance indicator according to the balanced scorecard perspective it addresses. Choose from the following: financial perspective, customer perspective, internal business perspective, learning and growth perspective.
12. Number of repeat customers
customer perspective
13. Employee turnover learning and growth perspective
14. Revenue growth financial perspective
15. Number of on-time deliveries
16. Number of defects found during manufacturing process
Copyright © 2014 Pearson Education, Inc. Publishing as Prentice Hall 24-60

Classify each key performance indicator according to the balanced scorecard perspective it addresses. Choose from the following: financial perspective, customer perspective, internal business perspective, learning and growth perspective.
12. Number of repeat customers
customer perspective
13. Employee turnover learning and growth perspective
14. Revenue growth financial perspective
15. Number of on-time deliveries
customer perspective
16. Number of defects found during manufacturing process
Copyright © 2014 Pearson Education, Inc. Publishing as Prentice Hall 24-61

Classify each key performance indicator according to the balanced scorecard perspective it addresses. Choose from the following: financial perspective, customer perspective, internal business perspective, learning and growth perspective.
12. Number of repeat customers
customer perspective
13. Employee turnover learning and growth perspective
14. Revenue growth financial perspective
15. Number of on-time deliveries
customer perspective
16. Number of defects found during manufacturing process
internal business perspectiveCopyright © 2014 Pearson Education, Inc. Publishing as Prentice Hall 24-62
Learning Objective 4
Use responsibility Use responsibility reports to evaluate reports to evaluate cost, revenue, and cost, revenue, and
profit centersprofit centers
24-63Copyright © 2014 Pearson Education, Inc. Publishing as Prentice Hall
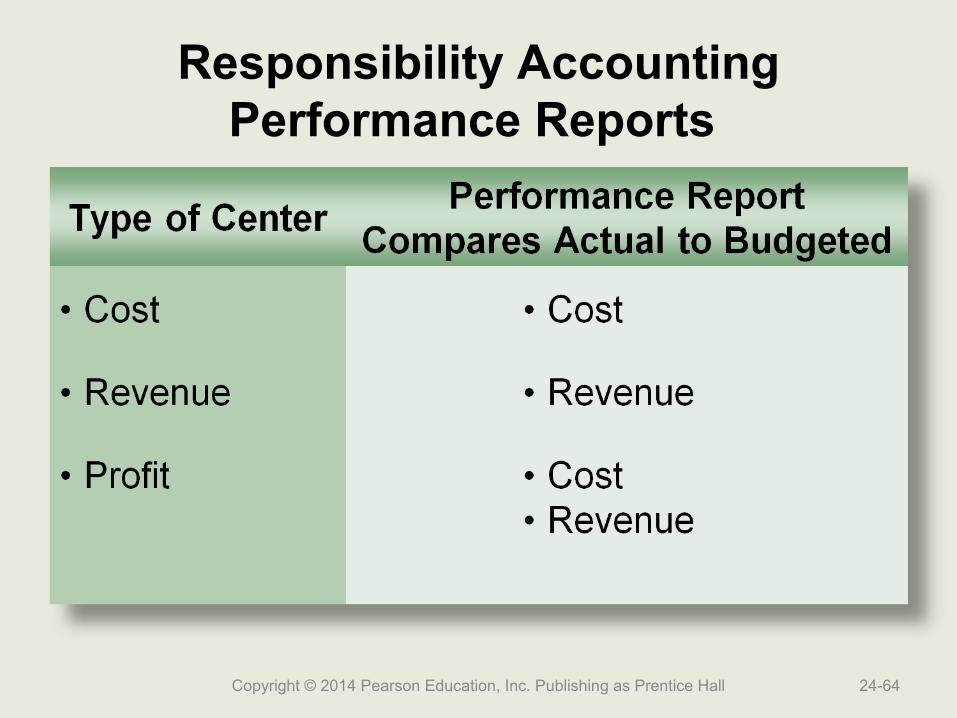
Responsibility Accounting Performance Reports
Copyright © 2014 Pearson Education, Inc. Publishing as Prentice Hall 24-64
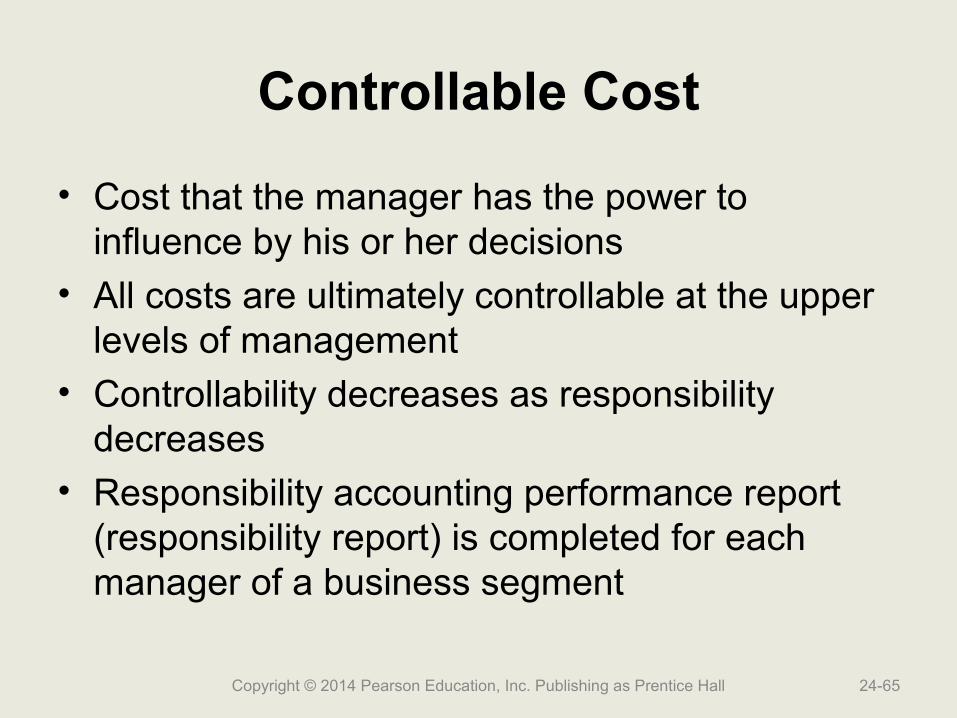
Controllable Cost
• Cost that the manager has the power to influence by his or her decisions
• All costs are ultimately controllable at the upper levels of management
• Controllability decreases as responsibility decreases
• Responsibility accounting performance report (responsibility report) is completed for each manager of a business segment
Copyright © 2014 Pearson Education, Inc. Publishing as Prentice Hall 24-65
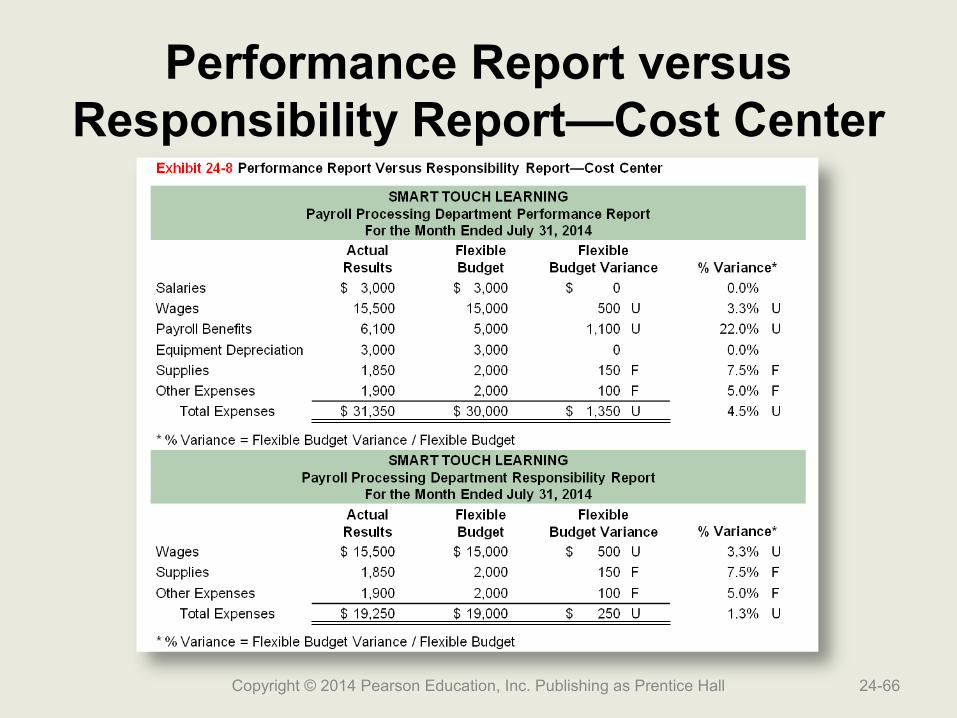
Performance Report versus Responsibility Report—Cost Center
Copyright © 2014 Pearson Education, Inc. Publishing as Prentice Hall 24-66
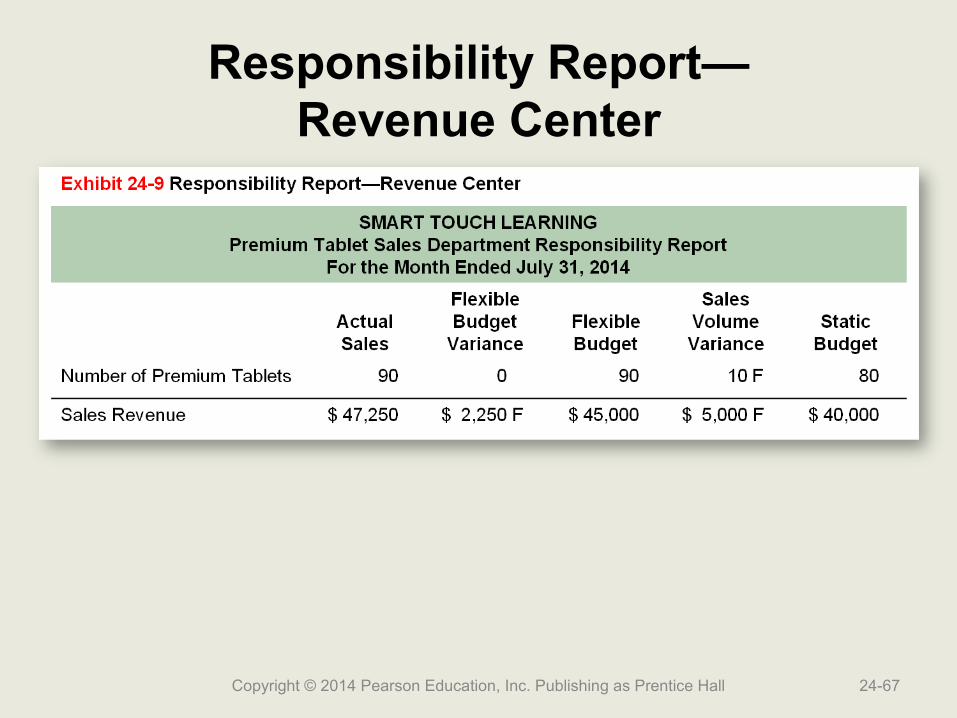
Responsibility Report—Revenue Center
Copyright © 2014 Pearson Education, Inc. Publishing as Prentice Hall 24-67

Performance Report—Profit Center
Copyright © 2014 Pearson Education, Inc. Publishing as Prentice Hall 24-68
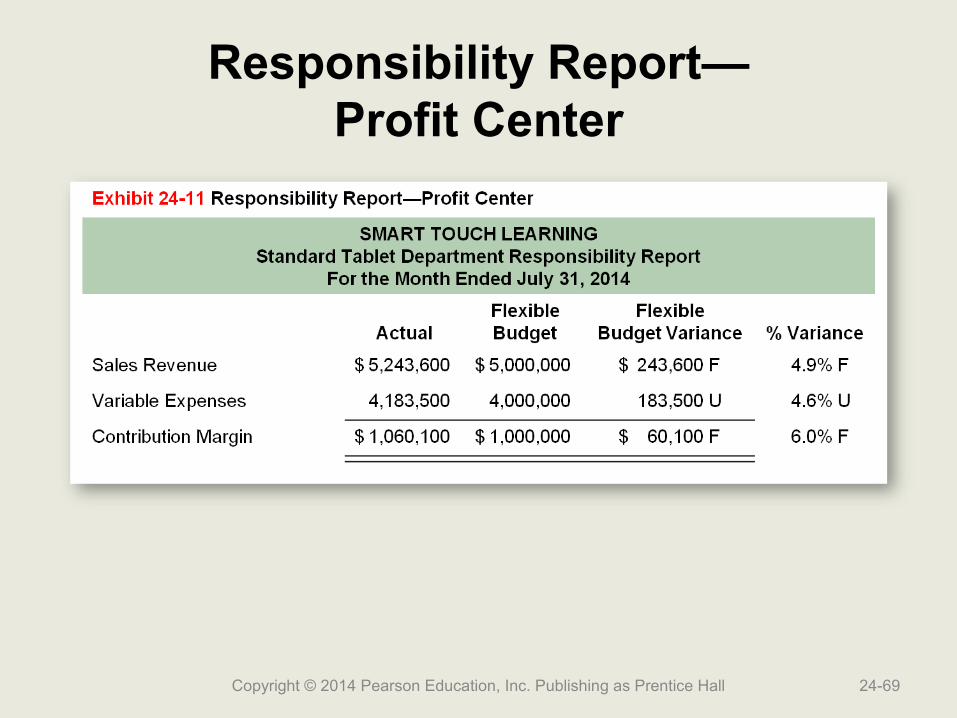
Responsibility Report—Profit Center
Copyright © 2014 Pearson Education, Inc. Publishing as Prentice Hall 24-69
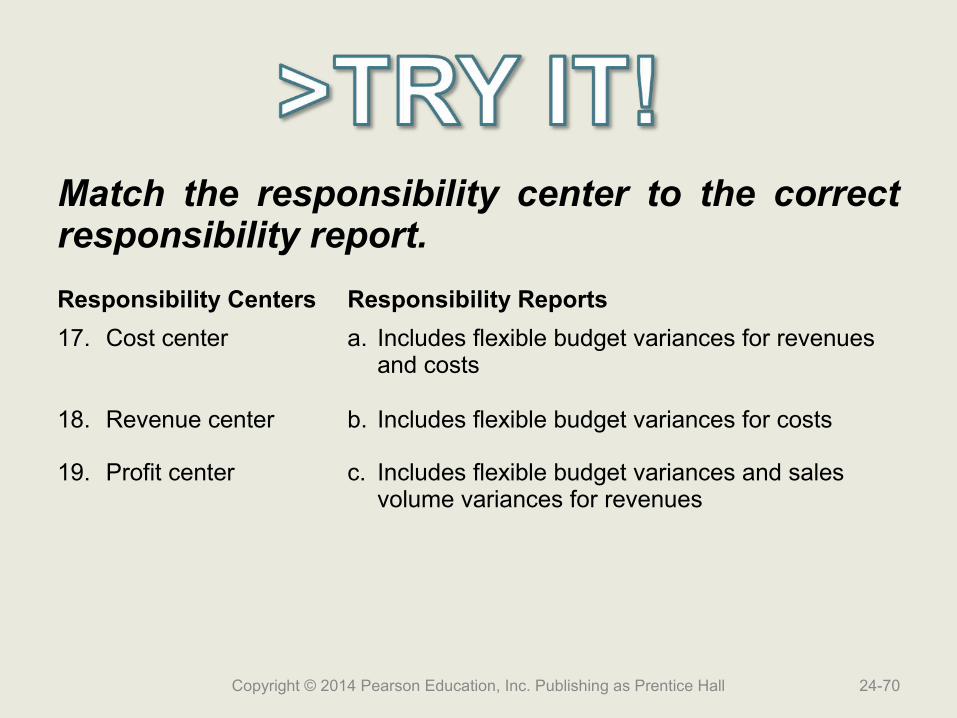
Match the responsibility center to the correct responsibility report.
Responsibility Centers Responsibility Reports
17. Cost center a. Includes flexible budget variances for revenues and costs
18. Revenue center b. Includes flexible budget variances for costs
19. Profit center c. Includes flexible budget variances and sales volume variances for revenues
Copyright © 2014 Pearson Education, Inc. Publishing as Prentice Hall 24-70
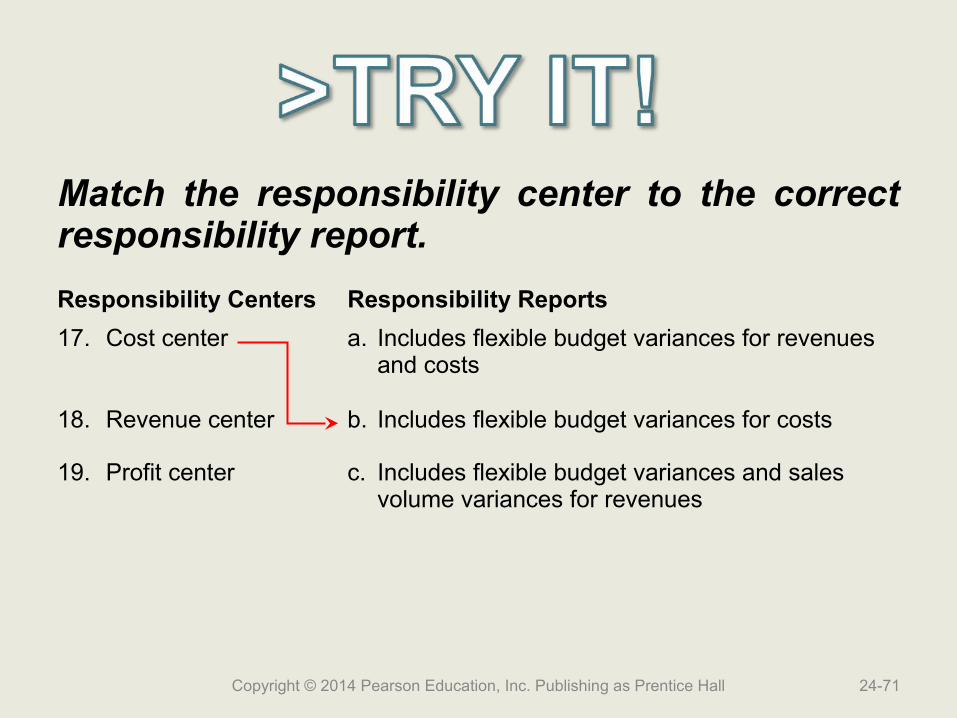
Match the responsibility center to the correct responsibility report.
Responsibility Centers Responsibility Reports
17. Cost center a. Includes flexible budget variances for revenues and costs
18. Revenue center b. Includes flexible budget variances for costs
19. Profit center c. Includes flexible budget variances and sales volume variances for revenues
Copyright © 2014 Pearson Education, Inc. Publishing as Prentice Hall 24-71
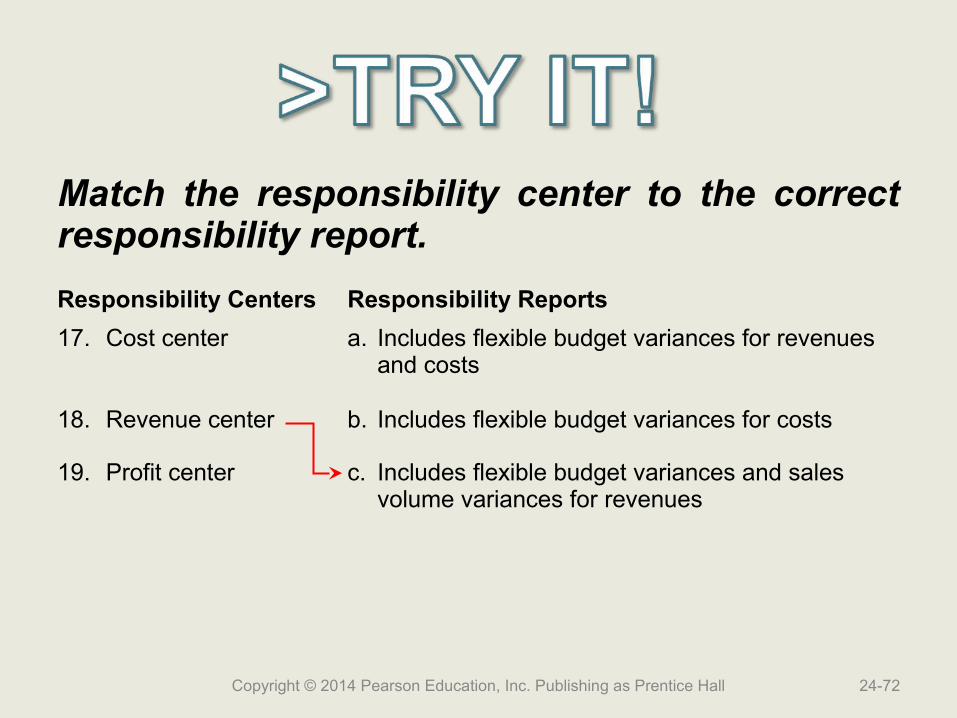
Match the responsibility center to the correct responsibility report.
Responsibility Centers Responsibility Reports
17. Cost center a. Includes flexible budget variances for revenues and costs
18. Revenue center b. Includes flexible budget variances for costs
19. Profit center c. Includes flexible budget variances and sales volume variances for revenues
Copyright © 2014 Pearson Education, Inc. Publishing as Prentice Hall 24-72
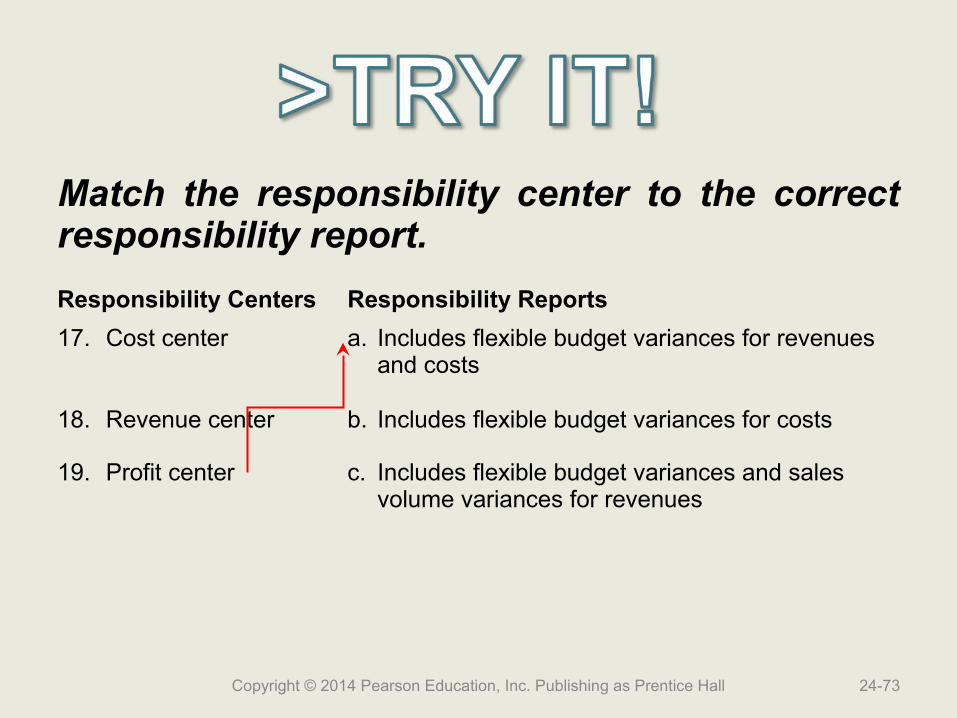
Match the responsibility center to the correct responsibility report.
Responsibility Centers Responsibility Reports
17. Cost center a. Includes flexible budget variances for revenues and costs
18. Revenue center b. Includes flexible budget variances for costs
19. Profit center c. Includes flexible budget variances and sales volume variances for revenues
Copyright © 2014 Pearson Education, Inc. Publishing as Prentice Hall 24-73

Learning Objective 5
Use return on Use return on investment (ROI) and investment (ROI) and
residual income (RI) to residual income (RI) to evaluate investment evaluate investment
centerscenters
24-74Copyright © 2014 Pearson Education, Inc. Publishing as Prentice Hall
Investment Centers
• Large divisions of a company• Manager’s duties are similar to those of a CEO
– Generate profit– Make the best use of the assets
Copyright © 2014 Pearson Education, Inc. Publishing as Prentice Hall 24-75
Financial Evaluation of Investment Centers Must Measure:
• How much operating income the segment is generating
• How efficiently the segment is using its assets
Copyright © 2014 Pearson Education, Inc. Publishing as Prentice Hall 24-76
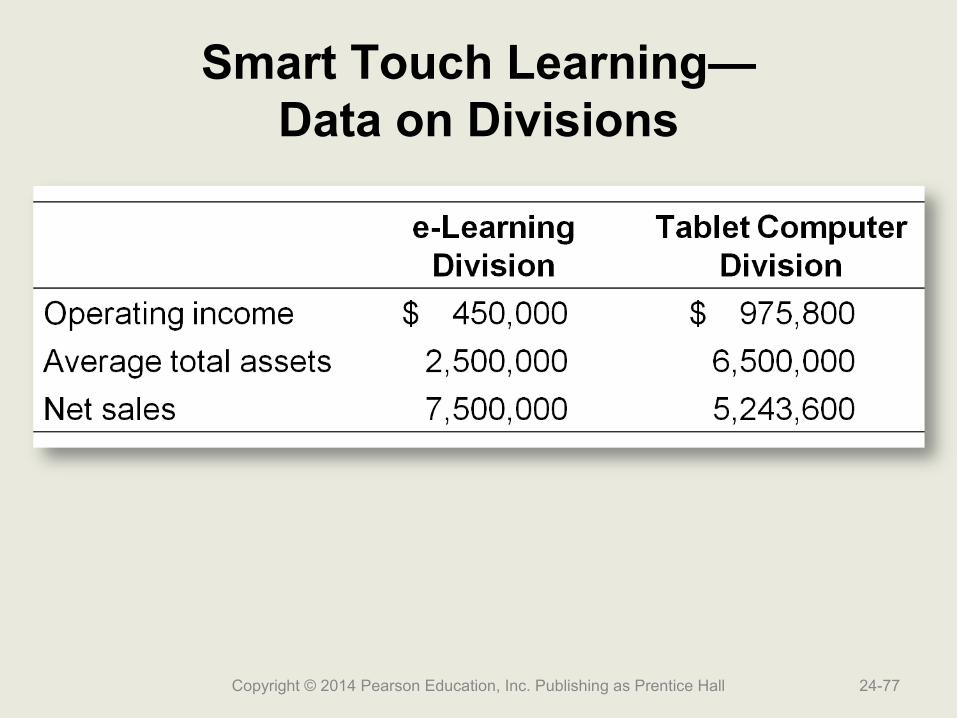
Smart Touch Learning—Data on Divisions
Copyright © 2014 Pearson Education, Inc. Publishing as Prentice Hall 24-77
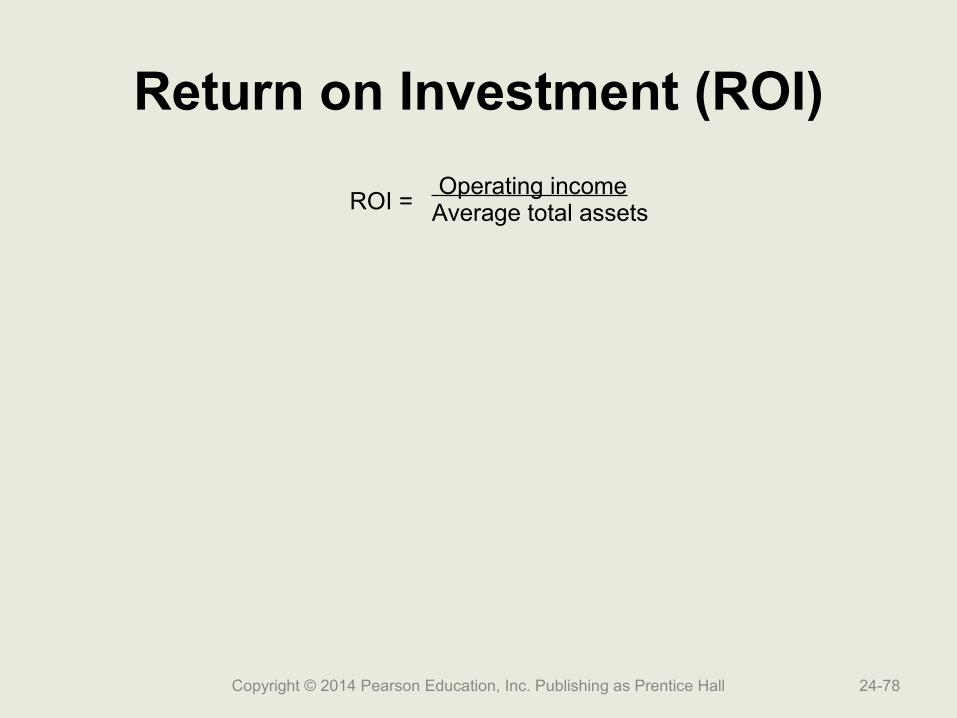
Return on Investment (ROI)
ROI = Operating incomeAverage total assets
Copyright © 2014 Pearson Education, Inc. Publishing as Prentice Hall 24-78
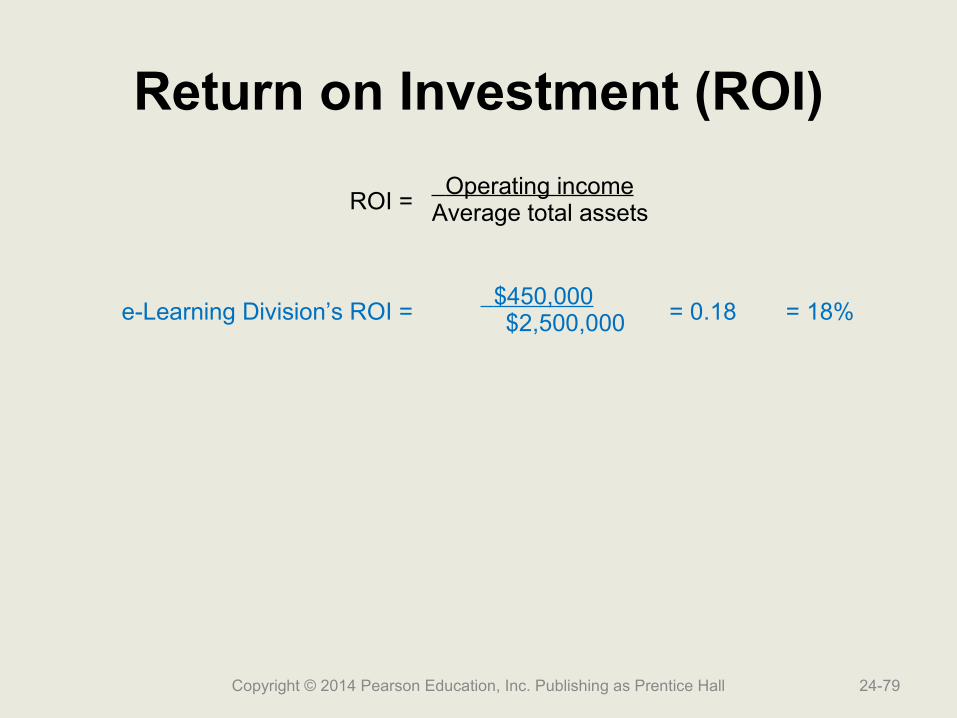
Return on Investment (ROI)
ROI = Operating incomeAverage total assets
e-Learning Division’s ROI = $450,000
$2,500,000 = 0.18 = 18%
Copyright © 2014 Pearson Education, Inc. Publishing as Prentice Hall 24-79
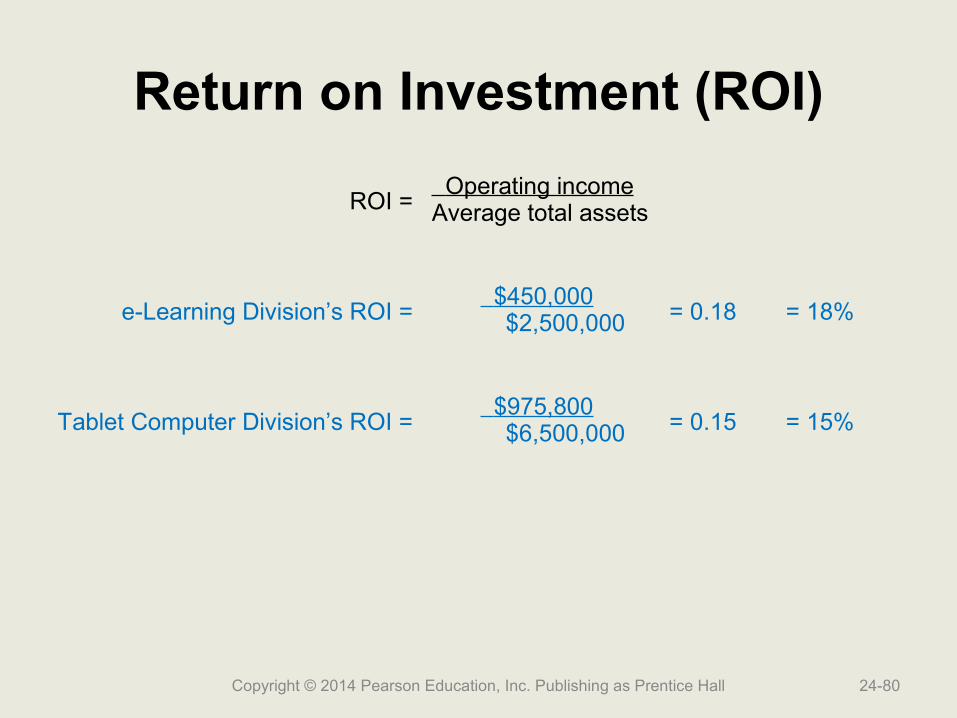
Return on Investment (ROI)
ROI = Operating incomeAverage total assets
e-Learning Division’s ROI = $450,000
$2,500,000 = 0.18 = 18%
Tablet Computer Division’s ROI = $975,800
$6,500,000 = 0.15 = 15%
Copyright © 2014 Pearson Education, Inc. Publishing as Prentice Hall 24-80
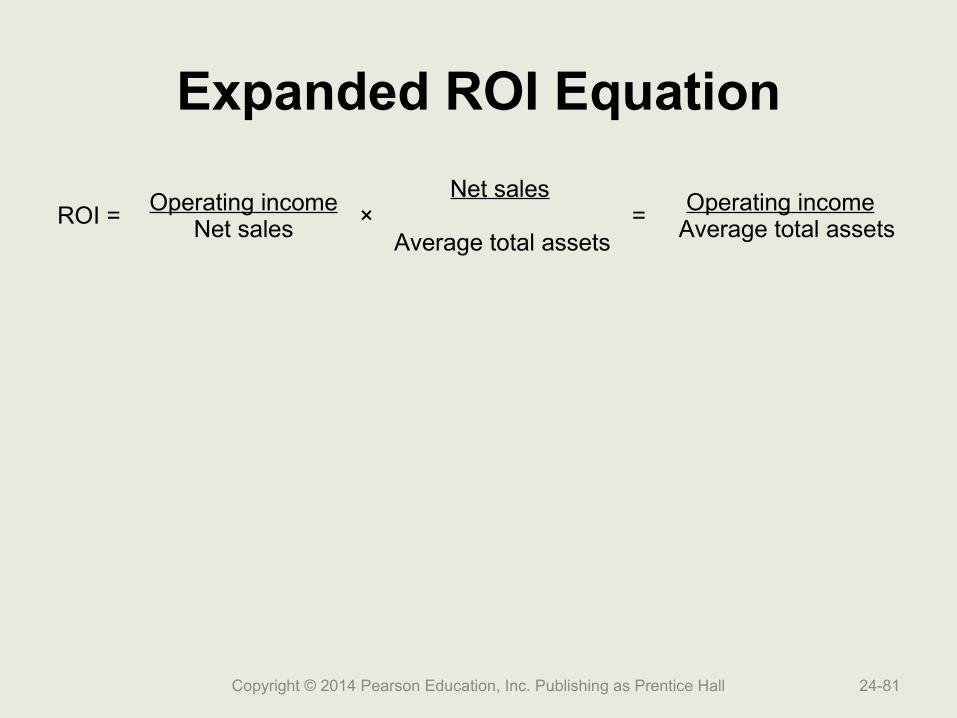
Expanded ROI Equation
ROI = Operating incomeNet sales
×Net sales
Average total assets= Operating income
Average total assets
Copyright © 2014 Pearson Education, Inc. Publishing as Prentice Hall 24-81

Profit Margin Ratio
Copyright © 2014 Pearson Education, Inc. Publishing as Prentice Hall 24-82
Profit margin ratio =Operating income
Net sales
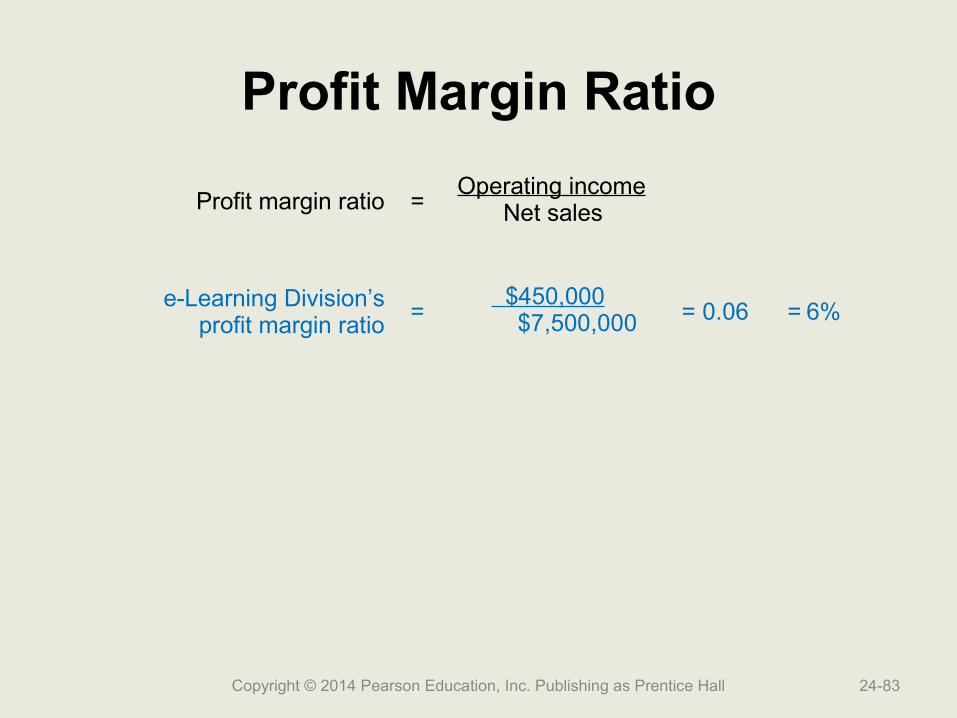
Profit Margin Ratio
Copyright © 2014 Pearson Education, Inc. Publishing as Prentice Hall 24-83
Profit margin ratio =Operating income
Net sales
e-Learning Division’sprofit margin ratio
= $450,000
$7,500,000 = 0.06 = 6%

Profit Margin Ratio
Copyright © 2014 Pearson Education, Inc. Publishing as Prentice Hall 24-84
Profit margin ratio =Operating income
Net sales
e-Learning Division’sprofit margin ratio
= $450,000
$7,500,000 = 0.06 = 6%
Tablet Computer Division’sprofit margin ratio
= $975,800
$5,243,600 = 0.19 =19%
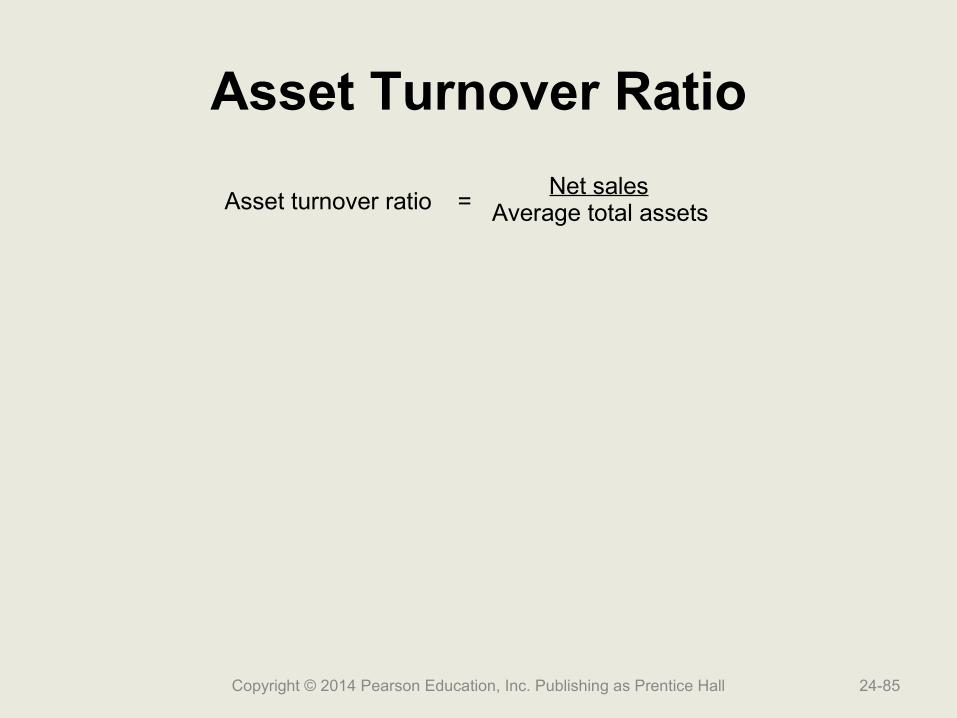
Asset Turnover Ratio
Copyright © 2014 Pearson Education, Inc. Publishing as Prentice Hall 24-85
Asset turnover ratio =Net sales
Average total assets
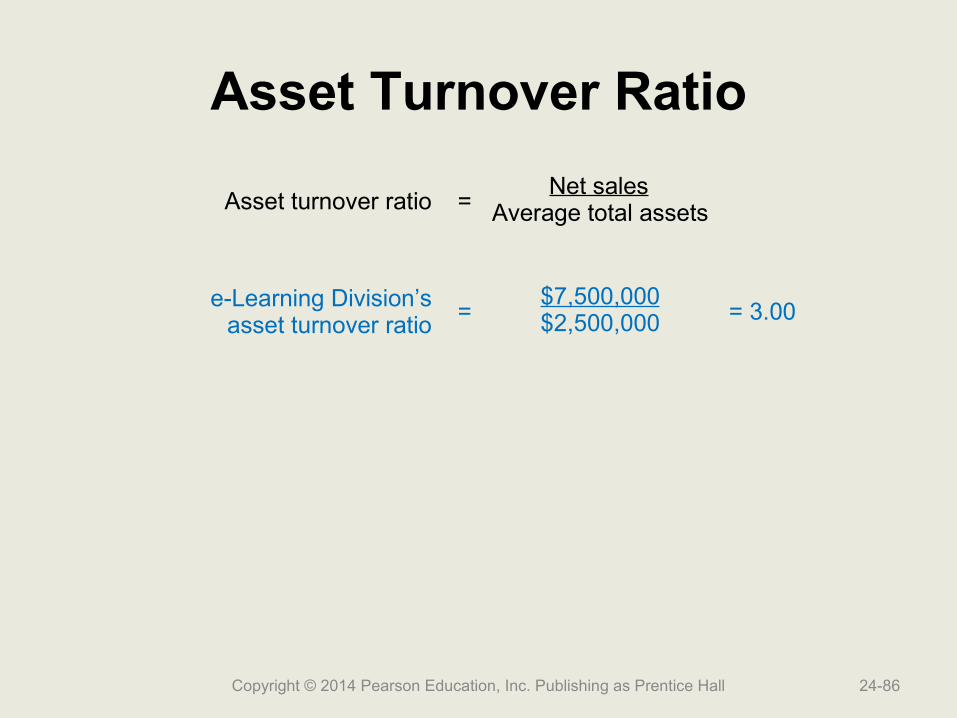
Asset Turnover Ratio
Copyright © 2014 Pearson Education, Inc. Publishing as Prentice Hall 24-86
Asset turnover ratio =Net sales
Average total assets
e-Learning Division’sasset turnover ratio
=$7,500,000$2,500,000 = 3.00

Asset Turnover Ratio
Copyright © 2014 Pearson Education, Inc. Publishing as Prentice Hall 24-87
Asset turnover ratio =Net sales
Average total assets
e-Learning Division’sasset turnover ratio
=$7,500,000$2,500,000 = 3.00
Tablet Computer Division’sasset turnover ratio
=$5,243,600$6,500,000 = 0.81

Expanded ROI Equation
Copyright © 2014 Pearson Education, Inc. Publishing as Prentice Hall 24-88
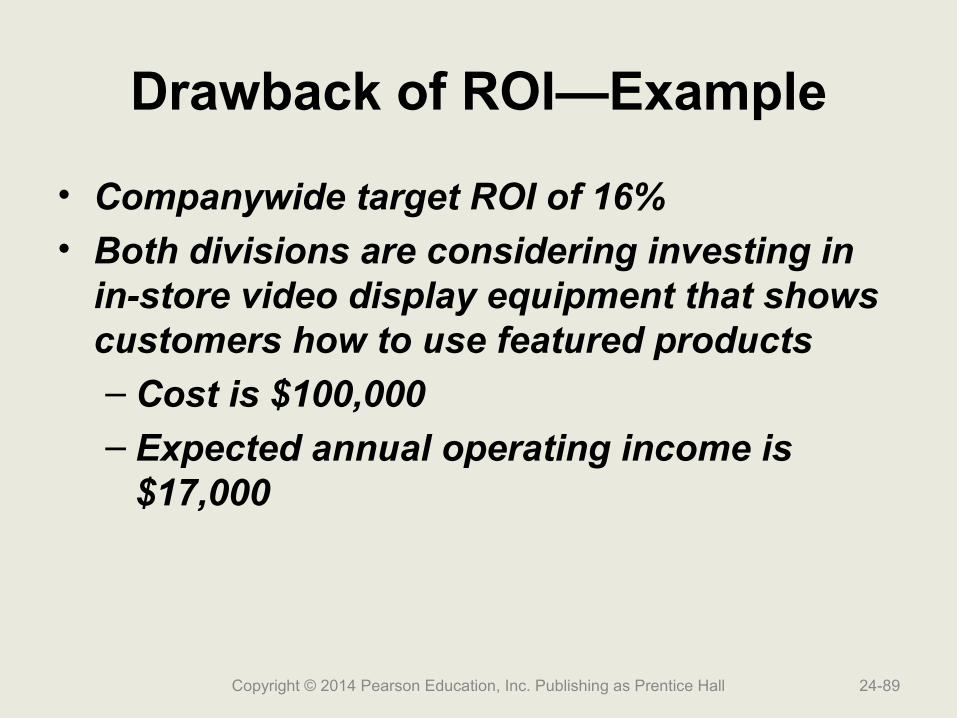
Drawback of ROI—Example
• Companywide target ROI of 16%• Both divisions are considering investing in
in-store video display equipment that shows customers how to use featured products– Cost is $100,000– Expected annual operating income is
$17,000
Copyright © 2014 Pearson Education, Inc. Publishing as Prentice Hall 24-89

Drawback of ROI—Example
Copyright © 2014 Pearson Education, Inc. Publishing as Prentice Hall 24-90
Equipment ROI = $17,000$100,000 = 0.17 = 17%
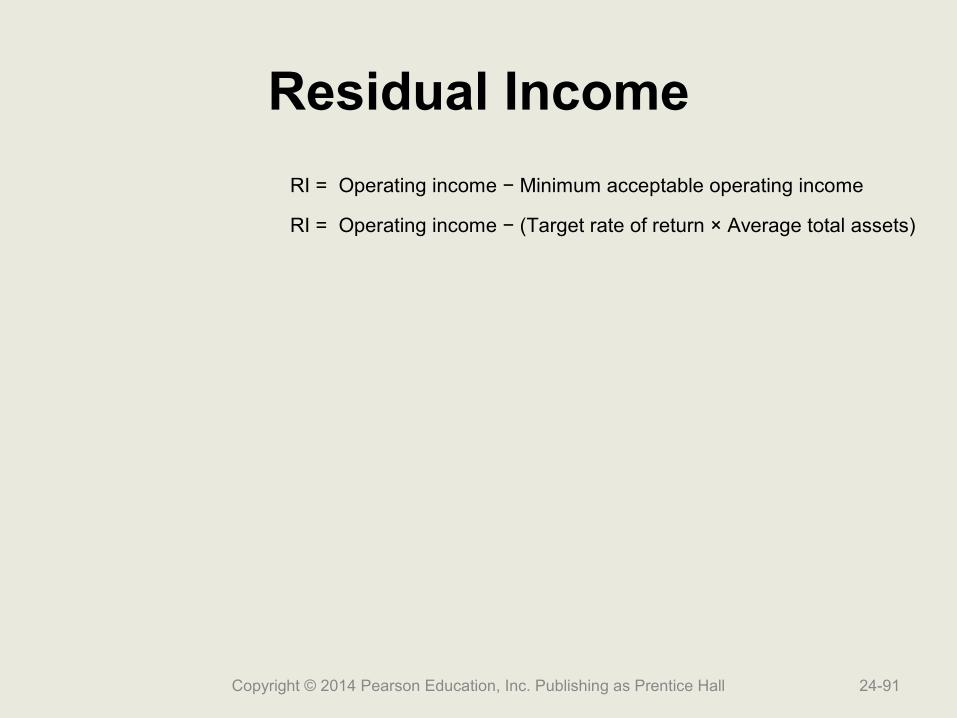
Residual Income
Copyright © 2014 Pearson Education, Inc. Publishing as Prentice Hall 24-91
RI = Operating income − Minimum acceptable operating income
RI = Operating income − (Target rate of return × Average total assets)
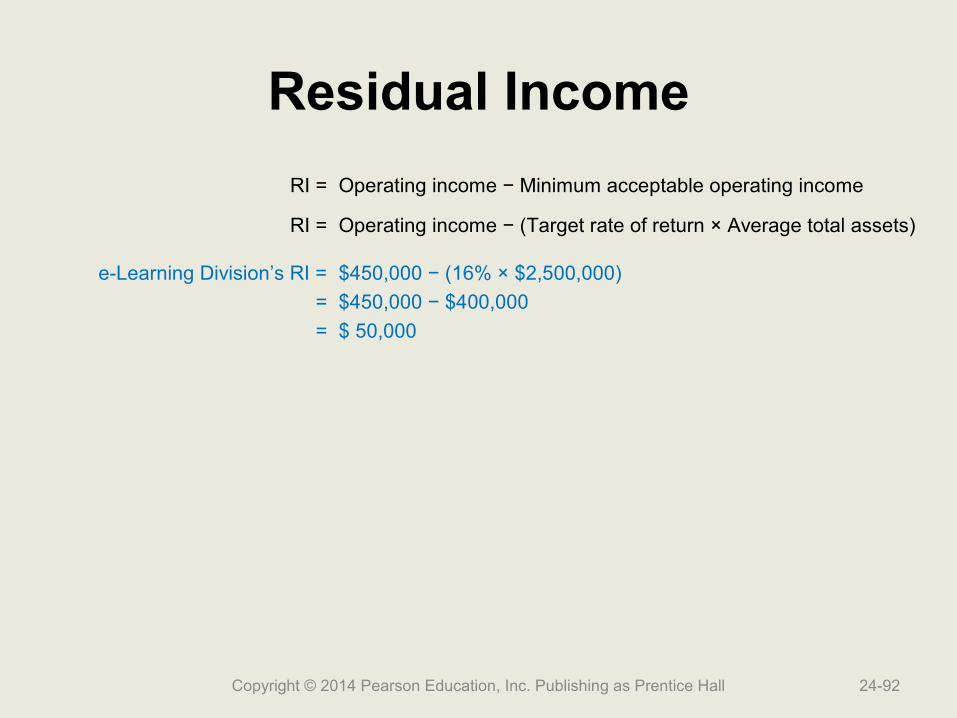
Residual Income
Copyright © 2014 Pearson Education, Inc. Publishing as Prentice Hall 24-92
RI = Operating income − Minimum acceptable operating income
RI = Operating income − (Target rate of return × Average total assets)
e-Learning Division’s RI = $450,000 − (16% × $2,500,000)
= $450,000 − $400,000
= $ 50,000
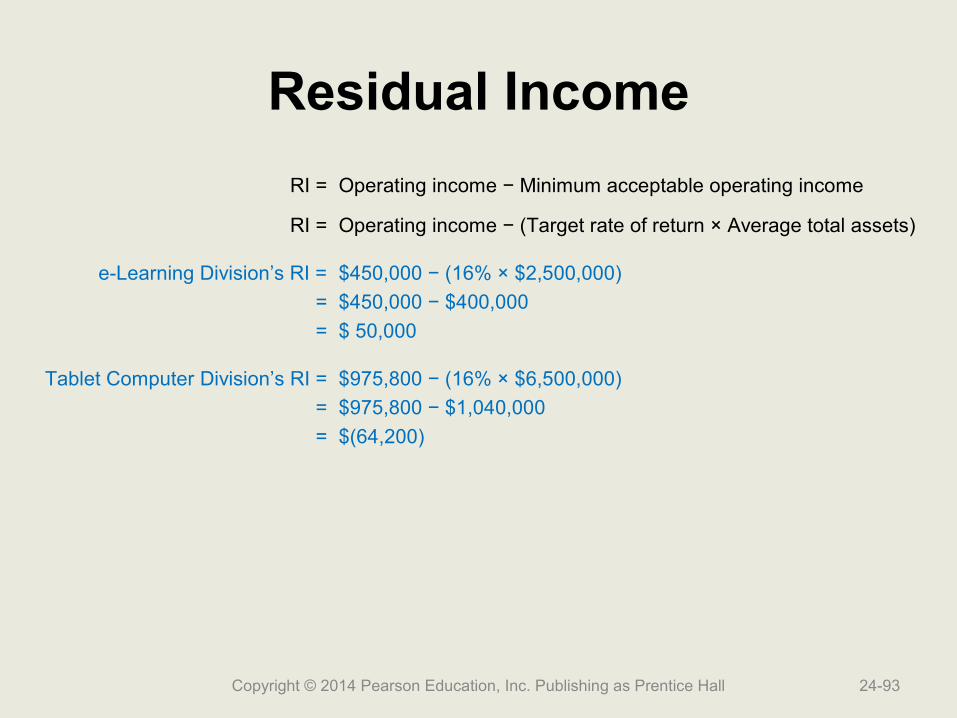
Residual Income
Copyright © 2014 Pearson Education, Inc. Publishing as Prentice Hall 24-93
RI = Operating income − Minimum acceptable operating income
RI = Operating income − (Target rate of return × Average total assets)
e-Learning Division’s RI = $450,000 − (16% × $2,500,000)
= $450,000 − $400,000
= $ 50,000
Tablet Computer Division’s RI = $975,800 − (16% × $6,500,000)
= $975,800 − $1,040,000
= $(64,200)

Residual Income
Copyright © 2014 Pearson Education, Inc. Publishing as Prentice Hall 24-94
RI = Operating income − Minimum acceptable operating income
RI = Operating income − (Target rate of return × Average total assets)
e-Learning Division’s RI = $450,000 − (16% × $2,500,000)
= $450,000 − $400,000
= $ 50,000
Tablet Computer Division’s RI = $975,800 − (16% × $6,500,000)
= $975,800 − $1,040,000
= $(64,200)
Equipment RI = $17,000 − (16% × $100,000)
= $17,000 − $16,000
= $ 1,000
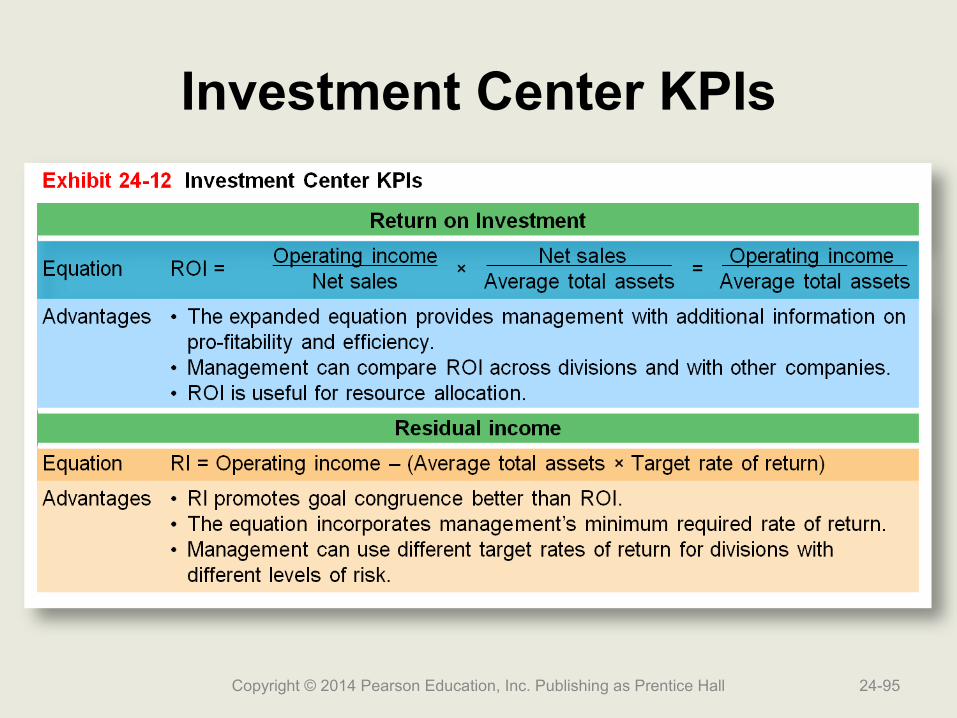
Investment Center KPIs
Copyright © 2014 Pearson Education, Inc. Publishing as Prentice Hall 24-95
Measurement Issues
• Average total assets• Do not include nonproductive assets• Gross book value of assets (the historical cost of
the assets) or net book value of assets (historical cost less accumulated depreciation)?
Copyright © 2014 Pearson Education, Inc. Publishing as Prentice Hall 24-96

Short-Term Focus of Financial Performance Measures
• Calculated over a one-year time frame or less• Incentive to take actions that will lead to an
immediate increase in measures, even if such actions may not be in the company’s long-term interest
• Some potentially positive actions considered by subunit managers may take longer than one year to generate income at the targeted level
Copyright © 2014 Pearson Education, Inc. Publishing as Prentice Hall 24-97
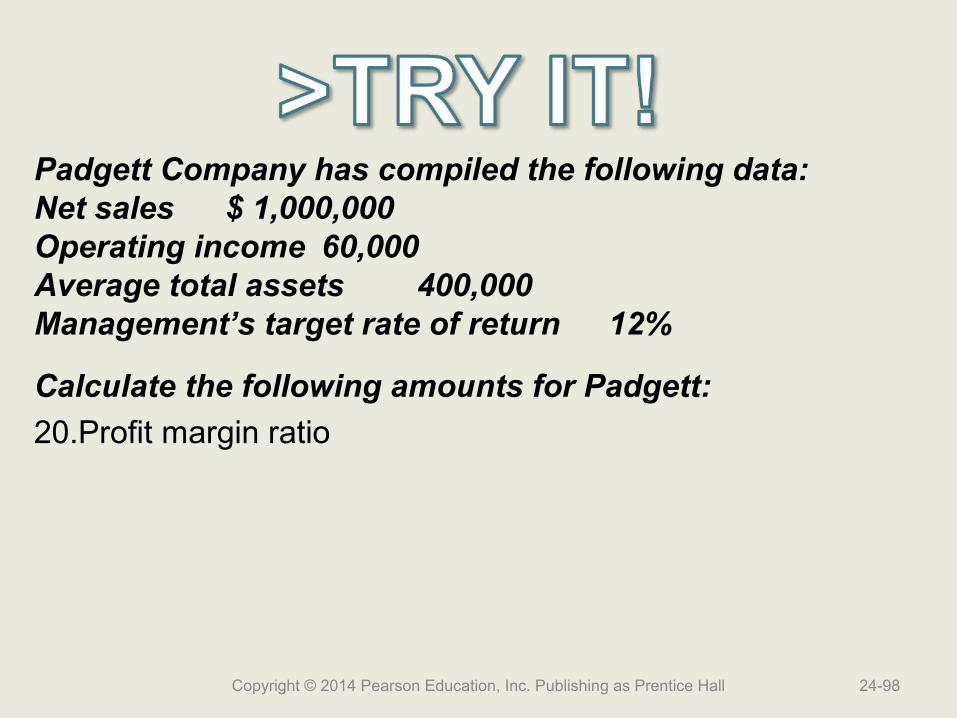
Padgett Company has compiled the following data:Net sales $ 1,000,000Operating income 60,000Average total assets 400,000Management’s target rate of return 12%
Calculate the following amounts for Padgett:
20.Profit margin ratio
Copyright © 2014 Pearson Education, Inc. Publishing as Prentice Hall 24-98

Padgett Company has compiled the following data:Net sales $ 1,000,000Operating income 60,000Average total assets 400,000Management’s target rate of return 12%
Calculate the following amounts for Padgett:
20.Profit margin ratio
Profit margin ratio = Operating income / Net sales
= $60,000 / $1,000,000
= 6%
Copyright © 2014 Pearson Education, Inc. Publishing as Prentice Hall 24-99
Padgett Company has compiled the following data:Net sales $ 1,000,000Operating income 60,000Average total assets 400,000Management’s target rate of return 12%
Calculate the following amounts for Padgett:
21.Asset turnover ratio
Copyright © 2014 Pearson Education, Inc. Publishing as Prentice Hall 24-100
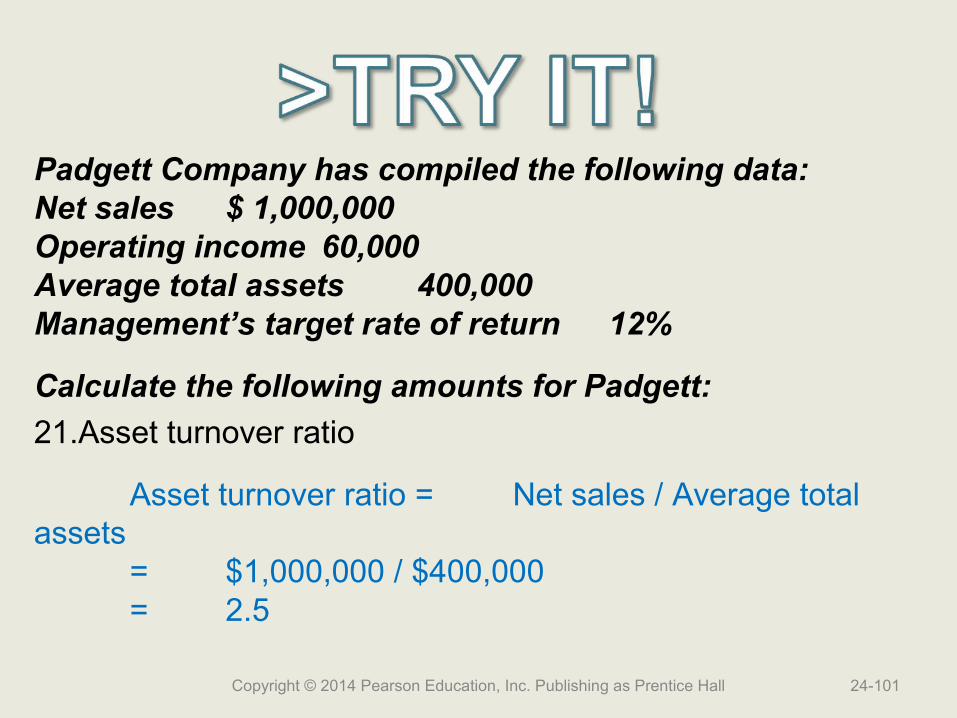
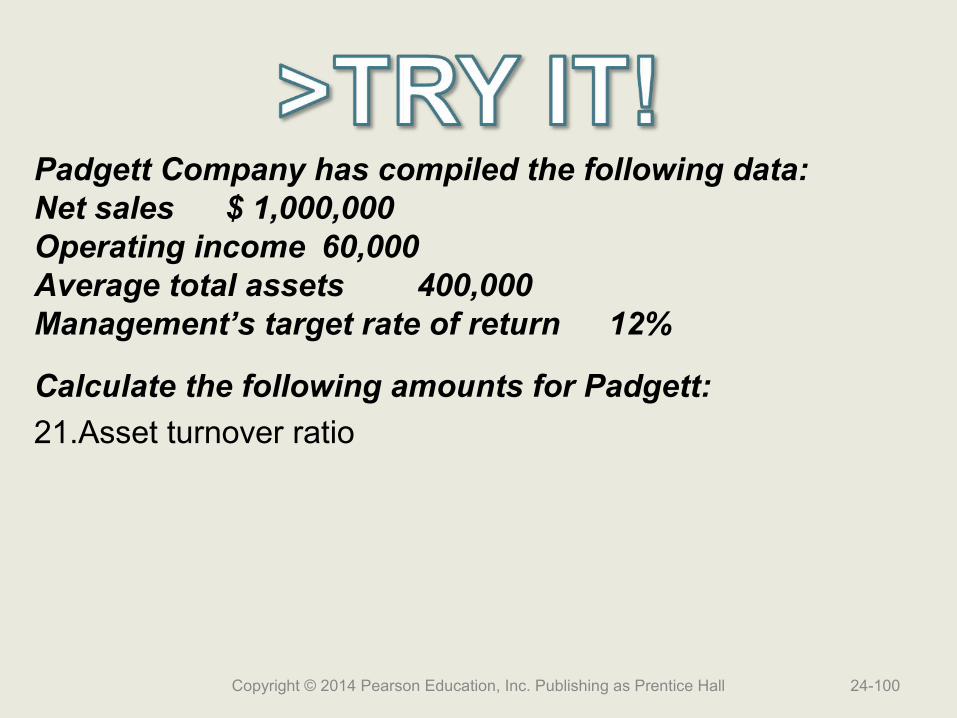
Padgett Company has compiled the following data:Net sales $ 1,000,000Operating income 60,000Average total assets 400,000Management’s target rate of return 12%
Calculate the following amounts for Padgett:
21.Asset turnover ratio
Asset turnover ratio = Net sales / Average total assets
= $1,000,000 / $400,000= 2.5
Copyright © 2014 Pearson Education, Inc. Publishing as Prentice Hall 24-101

Padgett Company has compiled the following data:Net sales $ 1,000,000Operating income 60,000Average total assets 400,000Management’s target rate of return 12%
Calculate the following amounts for Padgett:
22.Return on investment
Copyright © 2014 Pearson Education, Inc. Publishing as Prentice Hall 24-102
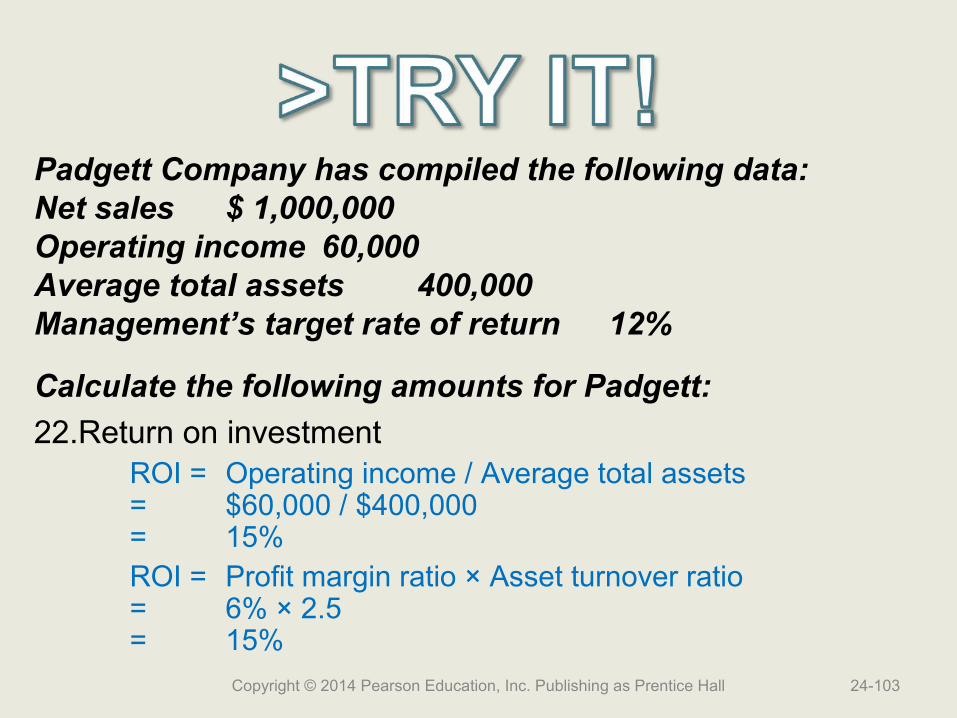
Padgett Company has compiled the following data:Net sales $ 1,000,000Operating income 60,000Average total assets 400,000Management’s target rate of return 12%
Calculate the following amounts for Padgett:
22.Return on investmentROI = Operating income / Average total assets= $60,000 / $400,000= 15%ROI = Profit margin ratio × Asset turnover ratio= 6% × 2.5= 15%
Copyright © 2014 Pearson Education, Inc. Publishing as Prentice Hall 24-103
Padgett Company has compiled the following data:Net sales $ 1,000,000Operating income 60,000Average total assets 400,000Management’s target rate of return 12%
Calculate the following amounts for Padgett:
23.Residual income
Copyright © 2014 Pearson Education, Inc. Publishing as Prentice Hall 24-104
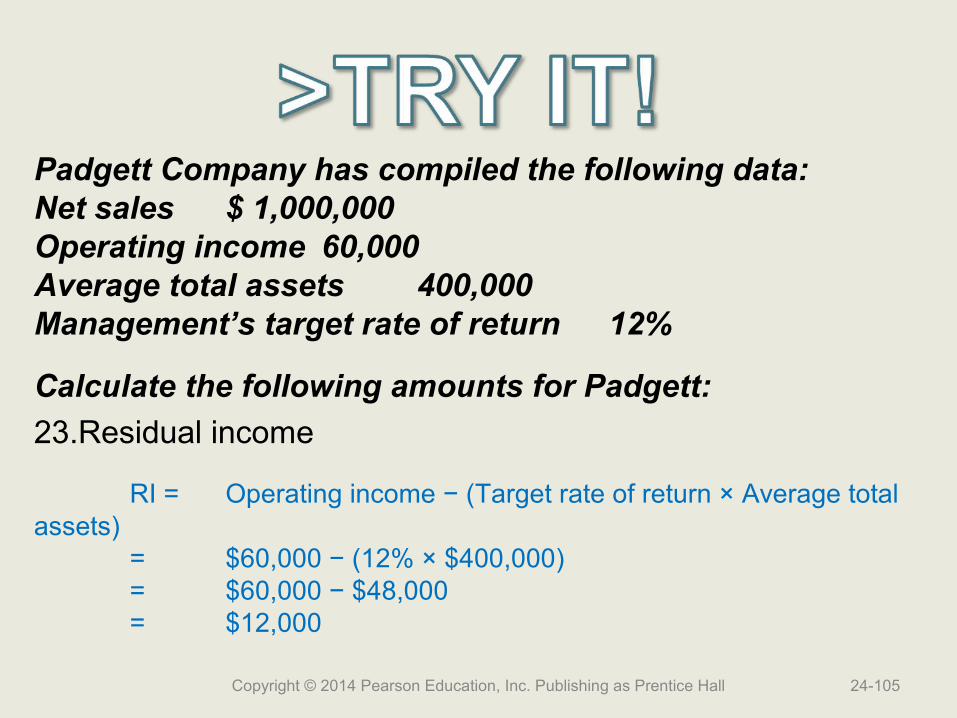
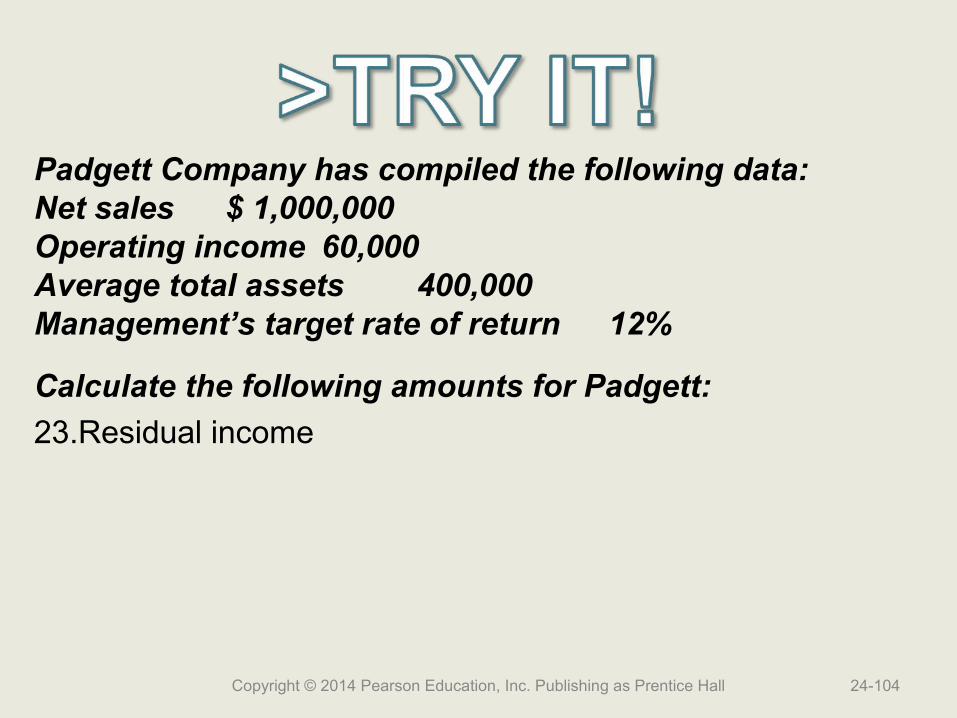
Padgett Company has compiled the following data:Net sales $ 1,000,000Operating income 60,000Average total assets 400,000Management’s target rate of return 12%
Calculate the following amounts for Padgett:
23.Residual income
RI = Operating income − (Target rate of return × Average total assets)
= $60,000 − (12% × $400,000)= $60,000 − $48,000= $12,000
Copyright © 2014 Pearson Education, Inc. Publishing as Prentice Hall 24-105
Learning Objective 6
Determine how transfer Determine how transfer pricing affects pricing affects decentralized decentralized
companiescompanies
(Appendix 24A)(Appendix 24A)
24-106Copyright © 2014 Pearson Education, Inc. Publishing as Prentice Hall
Objectives in Setting Transfer Prices
• To achieve goal congruence by selecting a price that will maximize overall company profits
• To evaluate the managers of the responsibility centers involved
Copyright © 2014 Pearson Education, Inc. Publishing as Prentice Hall 24-107
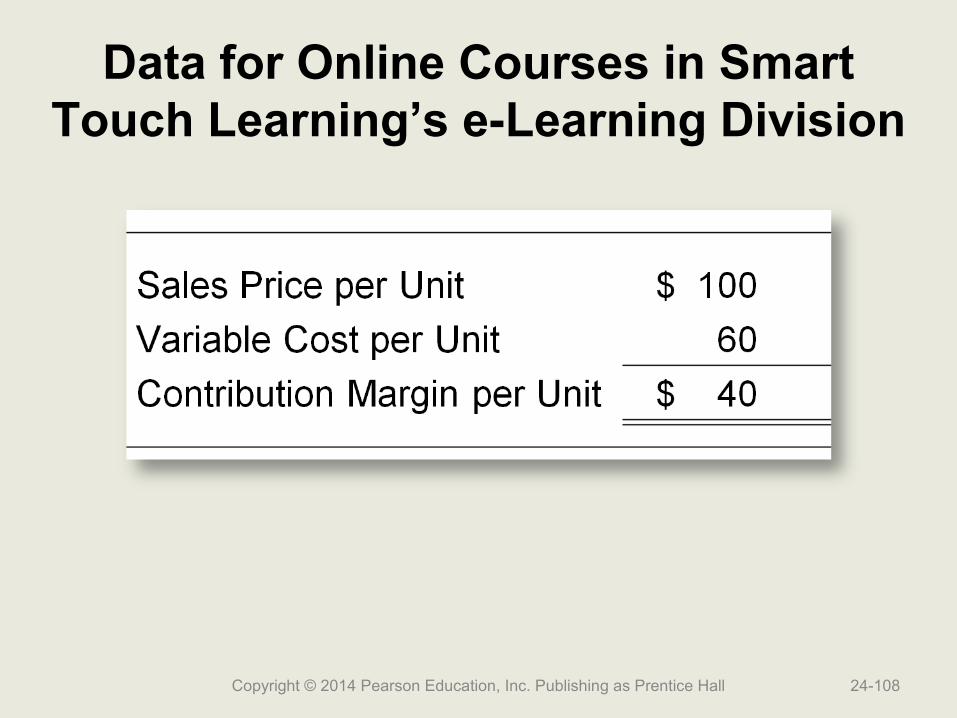
Data for Online Courses in Smart Touch Learning’s e-Learning Division
Copyright © 2014 Pearson Education, Inc. Publishing as Prentice Hall 24-108
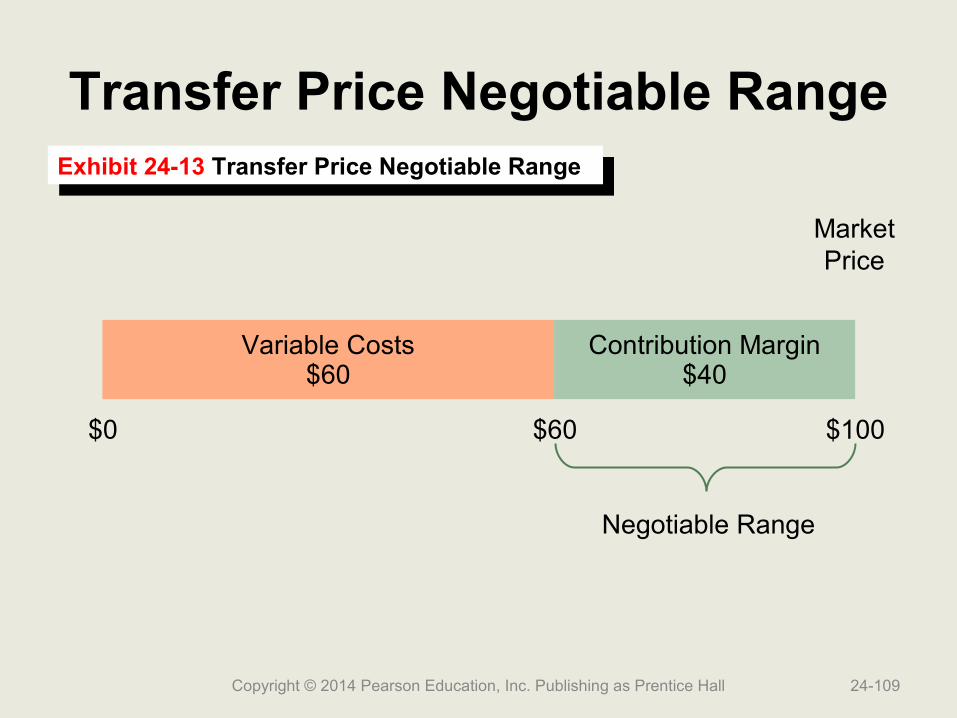
Transfer Price Negotiable Range
Variable Costs$60
Contribution Margin$40
Copyright © 2014 Pearson Education, Inc. Publishing as Prentice Hall 24-109
Exhibit 24-13 Transfer Price Negotiable RangeExhibit 24-13 Transfer Price Negotiable Range
$0 $60 $100
Negotiable Range
MarketPrice
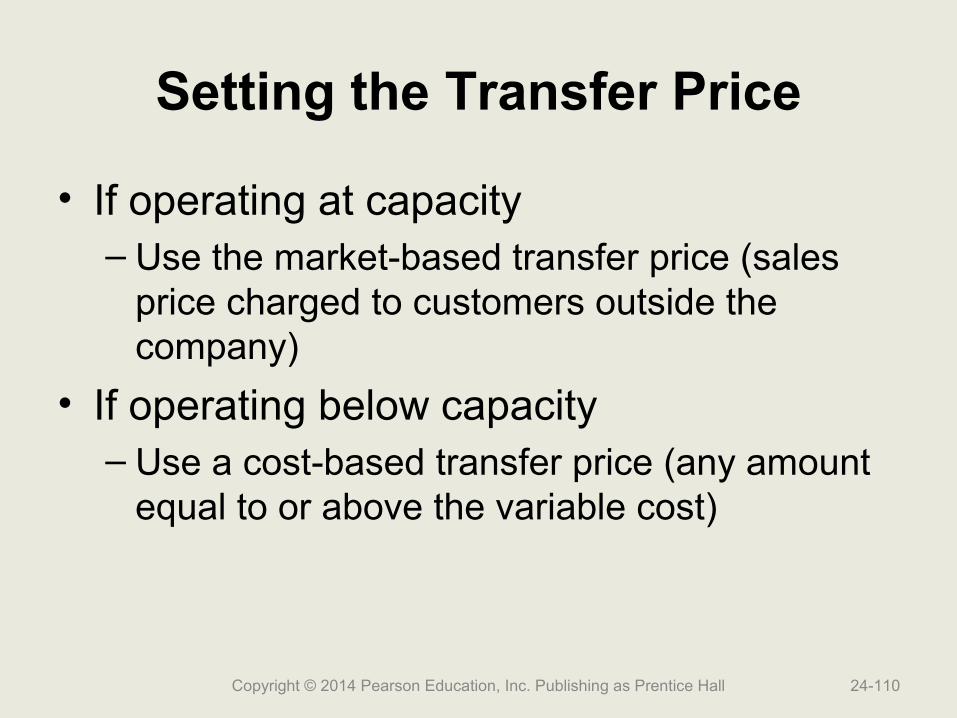
Setting the Transfer Price
• If operating at capacity– Use the market-based transfer price (sales
price charged to customers outside the company)
• If operating below capacity– Use a cost-based transfer price (any amount
equal to or above the variable cost)
Copyright © 2014 Pearson Education, Inc. Publishing as Prentice Hall 24-110
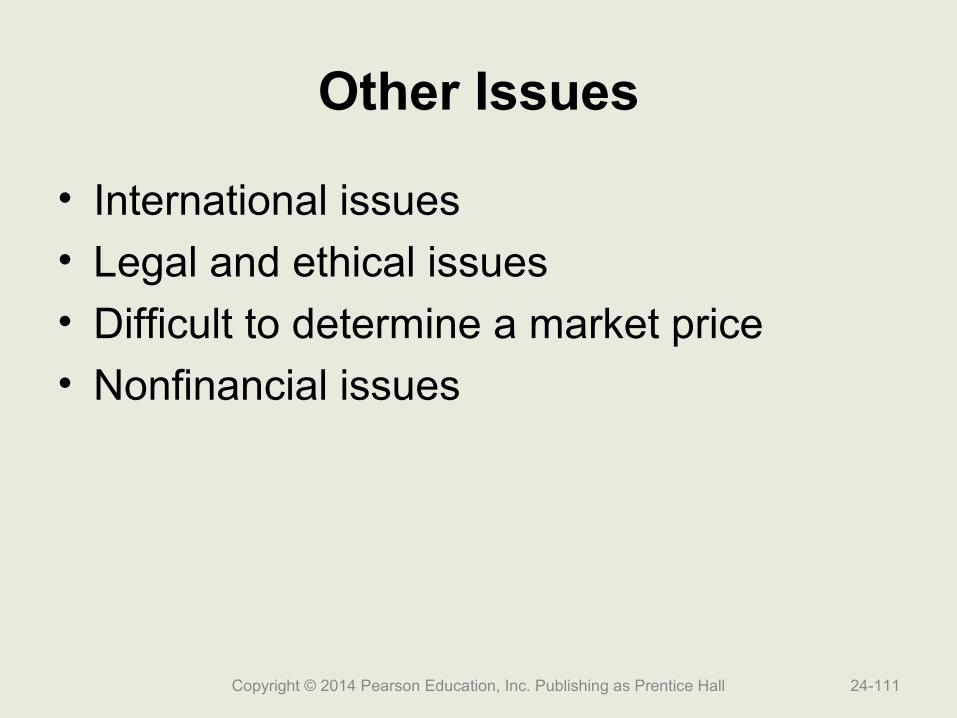
Other Issues
• International issues
• Legal and ethical issues
• Difficult to determine a market price
• Nonfinancial issues
Copyright © 2014 Pearson Education, Inc. Publishing as Prentice Hall 24-111
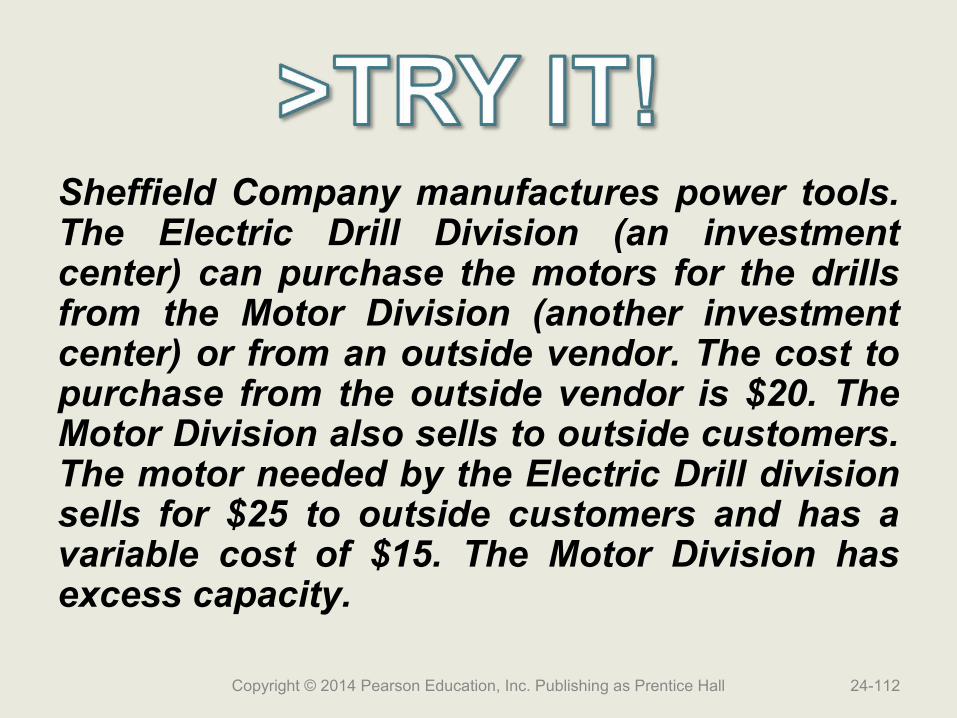
Sheffield Company manufactures power tools. The Electric Drill Division (an investment center) can purchase the motors for the drills from the Motor Division (another investment center) or from an outside vendor. The cost to purchase from the outside vendor is $20. The Motor Division also sells to outside customers. The motor needed by the Electric Drill division sells for $25 to outside customers and has a variable cost of $15. The Motor Division has excess capacity.
Copyright © 2014 Pearson Education, Inc. Publishing as Prentice Hall 24-112
24A. If Sheffield Company allows division managers to negotiate transfer prices, what is the minimum amount the manager of the Motor Division should consider?
25A. What is the maximum transfer price the manager of the Electric Drill Division should consider?
Copyright © 2014 Pearson Education, Inc. Publishing as Prentice Hall 24-113
24A. If Sheffield Company allows division managers to negotiate transfer prices, what is the minimum amount the manager of the Motor Division should consider?
The Motor Division has excess capacity, so the manager should consider the variable cost of $15 for the minimum transfer price.
25A. What is the maximum transfer price the manager of the Electric Drill Division should consider?
Copyright © 2014 Pearson Education, Inc. Publishing as Prentice Hall 24-114

24A. If Sheffield Company allows division managers to negotiate transfer prices, what is the minimum amount the manager of the Motor Division should consider?
The Motor Division has excess capacity, so the manager should consider the variable cost of $15 for the minimum transfer price.
25A. What is the maximum transfer price the manager of the Electric Drill Division should consider?
The Electric Drill Division can purchase the motors from an outside vendor for $20, so that is the maximum amount the manager should consider.
Copyright © 2014 Pearson Education, Inc. Publishing as Prentice Hall 24-115
Key Terms
• Decentralized Company• Goal Congruence• Investment Center• Key Performance Indicator (KPI)• Lag Indicator• Lead Indicator• Market-Based Transfer Price• Opportunity Cost
Copyright © 2014 Pearson Education, Inc. Publishing as Prentice Hall 24-116

End of Chapter 24
24-117Copyright © 2014 Pearson Education, Inc. Publishing as Prentice Hall
Related Documents