OGBU, OGBONNAYA B. PG/MBA/07/46834 EVALUATION OF USEFULNESS OF INVENTORY ANAGEMENT (A STUDY OF SOME SELECTED BEVERAGE COMPANIES) Accountancy A THESIS SUBMITTED TO THE DEPARTMENT OF ACCOUNTANCY, FACULTY OF BUSINESS ADMINISTRATION, UNIVERSITY OF NIGERIA ENUGU CAMPUS Webmaster Digitally Signed by Webmaster’s Name DN : CN = Webmaster’s name O= University of Nigeria, Nsukka OU = Innovation Centre 2008 UNIVERSITY OF NIGERIA

Welcome message from author
This document is posted to help you gain knowledge. Please leave a comment to let me know what you think about it! Share it to your friends and learn new things together.
Transcript

OGBU, OGBONNAYA B. PG/MBA/07/46834
EVALUATION OF USEFULNESS OF INVENTORY ANAGEMENT (A STUDY OF SOME SELECTED BEVERAGE COMPANIES)
Accountancy
A THESIS SUBMITTED TO THE DEPARTMENT OF ACCOUNTANCY, FACULTY OF
BUSINESS ADMINISTRATION, UNIVERSITY OF NIGERIA ENUGU CAMPUS
Webmaster
Digitally Signed by Webmaster’s Name
DN : CN = Webmaster’s name O= University of Nigeria, Nsukka
OU = Innovation Centre
2008
UNIVERSITY OF NIGERIA

TITLE PAGE
EVALUATION OF USEFULNESS OF INVENTORY MANAGEMENT (A STUDY OF SOME SELECTED BEVERAGE COMPANIES)
BY
OGBU, OGBONNAYA B. PG/MBA/07/46834
DEPARTMENT OF ACCOUNTANCY FACULTY OF BUSINESS ADMINISTRATION
UNIVERSITY OF NIGERIA ENUGU CAMPUS
DECEMBER 2008
CERTIFICATION
The work embodied in this project report is original and has not
been submitted in part or in full for any other diploma of this any other
university.
……………………………….
OGBU, OGBONNAYA B. LPG/MBA/07/46834
This is to certify that OGBU, OGBONNAYA B. a postgraduate
student in the Department of Accountancy and with Registration
Number PG/MBA/07/46834 has satisfactorily completed the
requirements for project research in partial fulfillment of the
requirements for the award of Masters of Business Administration
(MBA) in Accountancy.
..………………………. ……………………………. DR. MRS. R.G. OKAFOR DR. MRS. R.G. OKAFOR SUPERVISOR HEAD OF DEPARTMENT
DATE…………………. DATE……………………….
DEDICATION

I dedicate this work to my creator, God Almighty for His infinite
mercies and grace upon my life, and also to my beloved brothers who
made me to ascend this height.
ACKNOWLEDGEMENT

I am grateful to my supervisor, Dr. Regina Okafor, who at a
very short notice accepted the challenges to take over that
supervision of t his project work despite her numerous official and
domestic engagements.
I am also indebted to Mr. R.N. Ugwoke and other lecturers of
Accountancy Department and Mrs. J. N. Igwillo for their pieces
advices that made this research work and entire programme possible.
I acknowledge the assistance of staff of Nigeria Mineral Water
industries Limited, Enugu and Onitsha especially, Mrs. Ugwuaja and
Sunny Agam are the staff of pepsicola Nigeria Plc Enugu and those
of Coca-Cola Plc, Enugu. Again, I appreciate the kind assistance of
Mr. Uche Michael, the Treasurer of Ndufu Ikwo LGA who always
allows me the time whenever needed to run around for this work.
My appreciation goes to my parents and other relations who
understood my position during this time of work.
I extend my grace to my colleagues in the Department of
Accountancy, Esom Stanley, Angela, Betty, Ozotangbo Chris and
others for their personal materials and contributions which I found
quite useful for my research.
Finally, all the glory, honour and majesty should always go the
Almighty God for his gift of knowledge and protection during the
period of this programme and the research.
OGBU OGBONNAYA B. DECEMBER, 2008

ABSTRACT
It has been generally accepted that for any organization to produce and satisfy its stakeholders, such organization must have good management team that manages the resources of the organization using some laid down rules. In manufacturing concerns, inventories constitute a greater proportion of assets. The management of inventories usually involves a lot of problems which range from the right tome to place order to maximization of profits for the stakeholders. Thus, the research undertaken this research work entitled. Evaluation of usefulness of inventory management. A study of some selected Beverage Companies including: Coca-Cola Nigeria Plc, Pepsicola Nigeria Plc and Nigeria Mineral Water Industries Limited. The objective of this work includes: To determine whether profit is maximized and cost minimized due to the application of the efficient inventory management. To determine also whether manufacturing concerns in our country manage inventories effectively by using inventory management techniques e.g. Economic Lot Size, Just-in-Time etc. Data were collected using questionnaire method, and were analyzed using chi-square (X2) Pearson product moment, correlation co-efficient (r) and regression analysis. The result therefore shows that they place order at the right time and right quantity overcoming the setbacks of lead time. The companies also minimize costs of holding inventories and maximize their profits. The findings showed that manufacturing concerns in Nigeria meet the target requirement of their customers, stakeholders, and the society where they operate. The research recommends that: all staff of the manufacturing concerns should be made to have the thorough knowledge of inventory management as this will enable them to work towards their stock protection and cost minimization. The manufacturing concerns should get the recent developed software on inventory management and use to update their knowledge of inventory management on regular bases.
TABLE OF CONTENTS
Title page i
Certification ii
Dedication iii
Acknowledgement iv
Abstract vi
Table of contents viii
CHAPTER ONE
1.1 Introduction 1
1.2 Statement of Problem 5
1.3 Objectives of the Study 6
1.4 Research Questions 8
1.5 Statement of Hypotheses 9
1.6 Significance of Study 10
1.7 Scope of Study 11
1.8 Limitation of the Study 12
1.9 Definition of Terms 13
References 15
CHAPTER TWO
REVIEW OF RELATED LITERATURE
2.0 Introduction 16
2.1 Evaluation of kinds of inventories and methods of
checking inventories 20
2.2 Basic types of inventory management techniques in
manufacturing concerns 27
2.3 determination of economic order quantity (EOQ) or economic
Lot size (ELS) of inventories 36
Analysis of cost minimization by the use of efficient inventory
management 40
2.5 Profit maximization through efficient inventory management 43
2.6 Customer’s satisfaction due to the use of inventory
management 45
2.7 Possibility of Hitch free production due to application of
inventory management by manufacturing concerns 47
2.8 Liquidity control through efficient inventory management 49
References 51
CHAPTER THREE

3.0 Research methodology 53
3.1 Research Design 53
3.2 Sources of data 54
3.3 Method of data collection 54
3.4 Population and sample size 55
3.5 Techniques on data analysis 59
3.6 Chi-square distribution 60
References 62
CHAPTER FOUR
4.0 Presentation and analysis of data 63
4.1 Percentage determination of questionnaires responses in
tabular costs 64
4.2 Analysis of the ordering and holding cost as percentage of the
total costs 82
4.3 Analysis of economic lot size (ELS) ans Production level 83
4.4 Analysis of customer satisfaction through production and sales
levels 84
4.5 Analysis of cost minimization by the use of economic lot size
(Economic Order Quantity) 86
4.6 Test of hypothesis by Chi-square (X2) 87
4.7 Measurement of linear correlation 94
CHAPTER FIVE
5.1 Summary of findings 107
5.2 Conclusion 108
5.3 Recommendation 110
Bibliography 112
Appendix I 115
Appendix II 116
CHAPTER ONE
1.1 INTRODUCTION
Every Organization has to its own purpose of operation. The
level of actualizing the objectives or goals determines how efficient
and effective that organization is. But for the goals of any
organization to be achieved, such entity must observe some
stipulated or laid down principles for its effective performance. When
these rules are followed simultaneously, then the usefulness of such
principles or concepts will be achieved.
In general term, management has been recognized as that
which plans, direct and as well control the effective use of
organizational resources to achieve its objective.
Akpala (1987) as in Onuoha (1991:4-5) defines management
as the process of combining and utilizing or of allocation of
organization’s input (men, materials and money) by planning,
organizing, directing and controlling for the purpose of producing
output (goods and services) desired by the customers so that the
organizational objectives / goals are accomplished.
In evaluating a topic as this, one ma start by analyzing the key
words in it, such as usefulness, inventory, and management as they
relate to the manufacturing concerns.

Something is said to be useful when it is achieving the best
objective, purpose aim or goal of its wage. And also when using the
laid down rules and resources available, achieves the best desired
goals without wasting the available resources.
According to Ama (2001:470), inventory is the stock o goods a
firm is producing for sale and the component that make up the goods.
Again, Hilton (1994:13-14) defines inventory as: an itemized list
of goods or valuables with their estimated worth, specifically, the
annual accounting stock taken in any business.
Therefore, from the above definitions inventory is the totality of
all the stock, which includes: raw materials, work-i-progress and
finished goods that enable an organizational to produce. It could also
said to be the total amount of goods and or materials contained in a
store or factory at any given time.
But the question is: are there ways of handling these
inventories for the purpose of achieving the best thereof? The answer
is simply yes! The inventories must be managed and controlled in
order to achieve their usefulness.
In doing this, the production manager, purchases manager and
the sales manager of the organization always put heads together to
design suitable ways of handling the level of stock purchases,
production stock requirement and sales using some feedbacks to
exercise controls in order to synchronize result with the standard set.
According to Lucey (1989:29), inventory management is the
system used in a firm to control the firms’ investment in stock. The
system involves recording and monitoring of stock levels, forecasting
future demands and deciding when and how to order with overall
objective of minimizing in total, the cost associated with stock.
However, inventory management is the ability of an
organization to use all the techniques at its disposal to hold the
quantity of stock (inventory) that will be enough to produce its
required goods needed by the customers at the appropriate time and
at least cost to the organization with the view to maximize profit.
Thus, Ama (2001:475) states the following as the usefulness of
inventory management to the organization.
- Reduction in cost incurred due to inventory holding.
- Maintenance of certain level of customer services that are
excellent.

- Sustenance of a large size of inventory for efficient and smooth
production and sale operation.
- Maximization of profit.
- Sustenance of minimum investment level in inventories.
- Avoidance of risk of losses due to theft, frauds, waste or
carelessness due to large stock holding.
- Production of adequate and accurate information regarding
inventory to management of effective decision making about
the firm.
- Boost of customers holding.
Organizational resources ate always limited in supply ad the
resources are best utilized when wasteful organizational practice(s)
are avoided. It is therefore, the aim of this work to evaluate how
beverage companies as part of manufacturing concerns have been
avoiding wastages in inventory by using efficient inventory
management and control techniques like Economic Order Quantity
(EOQ), Just-In-Time (JIT), Quick Response Manufacture (QRM),
among others to render efficient services to their customers,
maximize their profits, a avoid production hold-ups in factories ad
eliminate risk of liquidity crunch, etcetera. To achieve the above
objectives, some beverage companies like Seven Up Bottling
Company, Limca Bottling Company (Eastern Bottlers LTD) and Coca-
Cola Nigeria Bottling Company were selected for this study.
1.2 STATEMENT OF PROBLEM
The main problem of this research work is that the inventory
management techniques that operate efficiently in other countries of t
eh world like Britain, Japan, United States of America; among others
do not do so in Nigeria local environmental factors through the needs
of the models to operated effectively. The specific problems are as
follows:
- Cost of obtaining and holding inventories is always high and
this affects the price of the finished products the concerns
thereby making it difficult for the common people to get or buy
them.
- That manufacturing concerns due to poor transportation system
and unreliable delivery services that hold well in Nigeria find it
difficult to determine or forecast workable lead time and
inventory levels that can enable them place order at the right
time and get replenishments.

- Due to production hitches suffered by the manufacturing
concerns, their customers who are the suppliers to the final
customers find it difficult to obtain their required orders
especially during festive periods like Christmas and New years,
among others, thereby causing scarcity of the products and
increase in price.
- It is difficult in Nigeria for the operators in the manufacturing
concerns to determine the quantity of inventory to order which
is economical due to variations in environmental factors such
as price changes or products due to constant petroleum price
fluctuations that affect other facets of economic production.
The above problems among others have made the researcher
to embark on this work to evaluate how efficient the inventory
management techniques are operating in the manufacturing concerns
in Nigeria.
1.3 OBJECTIVES OF THE STUDY
The general objective of this work is to evaluate the application
of inventory management in Nigeria manufacturing concerns, so as to
know whether they operate efficiently like in other countries of the
world such as Japan, United States of America and Britain among
others.
While the specific objectives are to:
(a) Determine if manufacturing concerns place orders at the right
time and obtain quantities of inventories that are economical
through the use of inventory management.
(b) Determine whether the companies do not have enough
inventory size or quantity that help them have hitch-free/smooth
production and sales to their customers.
(c) Ascertain whether the use of inventory management enables
the concerns to reduce the cost of inventories ad thereby
improve on their liquidity.
(d) Ascertain whether the companies maximize their profit for the
full benefits of their stakeholders.
(e) Assess if the organizations render efficient services to their
customers through prompt delivery of their orders at attractive
prices.
1.4 RESEARCH QUESTIONS
For a meaningful research work to be carried out on the
usefulness of inventory management in manufacturing concerns, a
number of questions must be asked and answered. The following are
therefore, some of the research questions:
(i) Do manufacturing concerns use efficient inventory
management techniques such as: economic order quantity
(economic lot size) and just-in-time, among others?
(ii) Does economic lot size technique in particular assist
manufacturing concerns to hold sustainable size of inventory,
for efficient and smooth production?
(iii) Has the inventory management and control techniques help
them to minimize their costs of inventories?
(iv) How have the manufacturing concerns contributed to the
economic growth of their host communities in particular and the
country, Nigeria at large?
(v) Does efficient inventory management help the manufacturing
companies to maximize their profits?
(vi) To what extent have the customers of manufacturing concerns
received satisfactory services from the manufacturing
companies?

These question will be structured in such a way that the
respondents will state whether they strongly agree, agree or are
neutral or disagree in their responses. The answers from these
questions will form the basis of the analysis.
1.5 STATEMENT OF HYPOTHESES
A research hypothesis is a generalized and verifiable statement
about a state of phenomena which may be true or false.
According to Onu (1996:13), the validity of a hypothetical
statement is subject to verification which must be based on adequate
information on which decisions could be objectively based for either
to accept or reject such a hypothesis. Thus, a research hypothesis is
defined further as a rule of accepting or rejecting the validity of a
statement on the basis of random samples from the chosen
population.
Therefore, these research null hypotheses will be empirically
tested in this research work.
1. Ho: Manufacturing concerns do not minimize costs of
inventories through the use of economic lot size (economic
order quantities).
2. Ho: Just-in-Time (JIT), Economic Lot Size and Quick Response
Manufacture (tools of inventory management) do not assist
manufacture concerns to hold sustainable size of inventories for
efficient and smooth production.
3. Ho: Economic Lot Size (ELS), Just-in-Time material
Requirement Planning (MRP) and Quick Response
Management (QRM) tools of inventory management do not
help manufacturing concerns to maximize profit.
1.6 SIGNIFICANCE OF THE STUDY
Having gone through the statement of the research problem,
the significance of this research work are as follows:
(i) It will enable manufacturing concern to discover and
maintain optimum level of investment in inventory.
(ii) It will enable the manufacturing concerns attend to their social
responsibilities as their hoist countries constitute part of their
stakeholders.
(iii) It will enable inventory managers to know the ideal quantity of
stocks to order that is economical to the organization and when
to order for it.
(iv) It will assist the organizations to maximize their profits and
reduce their risk of liquidity.
(v) It will enable the manufacturing companies obtain the right size
of inventories that will always support their smooth and hitch
free production and sales operations
(vi) It will assist the organizational managers know that level of
inventory that will be kept to cover errors in forecasting the lead
time or the demand during the lead time.
(vii) Customers goodwill towards the organization will be maintained
as it enables delivery committed to be met all the time.
(viii) It will provide a base for other research works that might be
carried out on stock management in any other sector.
(ix) Lastly, it will help reduce business failure in our society as
inventory constitutes one of the core pillars of business
operation.
1.7 SCOPE OF STUDY
This research work is intended to evaluate the usefulness of
inventory management in manufacturing concerns but the field of
manufacturing is very vast and for this reason the researcher based

this study on some selected beverage companies in Nigeria namely:
Coca-cola Nigeria PLC, Pepsi cola Nigeria Plc and Nigerian Mineral
Water Industries Limited.
The research also x-rayed how the usefulness of inventory
management has assisted manufacturing companies to reduce cost
of inventories obtained the size of inventory that is economical and
that supports hitch free production, maximize the profit for t he
stakeholders and render efficient services to their customers,
etcetera.
1.8 LIMITATION OF THE STUDY
In conducting this research work, the researcher encountered
some difficulties such as the following:
(a) Secrecy: Manufacturing concerns as a principle always held
tightly to their methods and data generated from their
operations. This is perhaps not to allow people know their
technical know-how, and their performances. They hold this
view because they argued that they operate in a competitive
industry. As a result of this, obtaining information from them.
However, were some of the data needed cannot be supplied for
security reasons; they were extrapolated from the supplied ones in
order to prove the concept of this research work.
(b) Finance: The researcher found it difficult to finance this work
because of the attitude of manufacturing companies which in a
bid to protect their information always use many strategies to
cause somebody seeking for information from the to repeat as
many times as possible in their office looking for a single item of
data. Again, putting the assembled materials n the accepted
standard cost much.

(c) Paucity of Relevant Literatures: The concept of inventory and
its management have been of old. But the way in which
manufacturing concerns treasure information on their
inventories has made it almost difficult for relevant literatures to
be seen easily on this area of study as compared in other fields.
Because of this, the researcher found it hard in obtaining
relevant literatures while conducting this research.
However, the researcher laid his hands on were enough to
evaluate and make conclusion on this topic.
Nevertheless, the researcher was able to surmount the above
hurdles and at the end put up a research work whose output is
reliable, testable and verifiable at any standard.
1.9 DEFINITION OF TERMS
MANAGEMENT: The term management is used in various ways. It
could refer to a group of people in an organization, or could also refer
to the process of accomplishing a given task. Various scholars define
management in various ways. However, management is the
coordination of an organization’s resources aimed at achieving a
predetermined goal or objective.
INVENTORY: Inventory is the total amount of good and/or materials
contained in a store or factory at any given time. The word inventory
can refer to both the total amount of goods and the act o counting
them. Many companies take an inventory of their supplies on a
regular basis in order to avid running out of popular items.
ECONOMIC ORDER QUANTITY (EOQ): A standard formula used to
arrive at a balance between holding too much so too little stock.
FIRST IN, FIRST OUT: A system to ensure that perishable stock is
used efficiently so that it doesn’t deteriorate. Stock is identified by
date received and moves on through each stage of production in
strict order.
JUST IN TIME (JIT): This aims to reduce costs by cutting stock to a
minimum.
STOCK REVIEW: This is a regular review of stock. At every review
you place an order to return stock to a predetermined level.

REFERENCES
Akpala, A. (1987), Management Search for Nigeria System (unpublished). In: Onuoha, B.C. (1991). Fundamental of Business Management In Nigeria. Aba: Unique Press Limited, P.322.
Ama, G.A.N. (2001), Management and Cost Accounting: Current Theory and Practice. Aba: Amasoa Publishers, P.758.
Asika, N. (1991), Research Methodology in the Behavioural Sciences. Lagos: Longman Nigeria, P.562
Horngren, T.C. and Sundem, G. (1990), Introduction to Management Accounting. Eight Edition, USA: Prentice Hall Inc., P.826.
Joseph, D. (2002), Just-in-Time Inventory: A
Financial Perspective, www.staresdemon.co.uk. Theory and Concepts / Beyond – Jit. Intm.

CHAPTER TWO
REVIEW OF RELATED LITERATURE
2.0 INTRODUCTION
The goal of every business organization is to operate
profitability, expand and attain the highest mark in the industry. In
order to achieve this, there as resources needed such as man,
machines and materials which must be effectively managed to avoid
waste in order to a attain the goals of such organization.
In manufacturing organizations, inventories form the most
proportionate asset in which large capital of the concerns is invested.
Thus, the careful attention always given to its management and
control.
Lucey (1989), states that inventory management is the system
used in a firm to control the firms’ investment in stock. The system
involves recording and monitoring of stock levels, forecasting future
demands and deciding when and how to order with the overall
objective of minimizing in total the costs associated with stock.
Also, inventory management is the practice of planning,
directing and controlling inventory so that it contributes to the

business profitability. Inventory management helps business to be
more profitable by lowering their cost of goods sold and increasing
sales. It is also the act of making sure that items of stock are
available when customers call for it, but not too much stock so that
inventory turnover goals are met.
According to Hilton (1994), inventory management is the art
and science of managing to have the right product at appropriate time
and place in exactly the right amount and at the best possible price.
From the above analysis of the meaning of inventory
management, it could be seen that managing inventory is
encumbered with problems of cost reduction, the right time to order
for inventory, the right quantity to order, how to maximize profits,
satisfy the customers and produce at maximum capacity, among
others.
In this review, the following sub-topics were considered.
(a). evaluation of the kinds of inventories and methods of
checking/supervising inventories for efficient inventory
operations.
(b). different types of inventory management techniques and their
operations in Nigeria.
(c). determination of the economic order quantity or lot size
through the use of both graphical and mathematical methods.
(d). analysis of cost minimization through the use of different types
of inventory management models.
(e). assessment of profit maximization of the manufacturing
concerns through inventory management for the benefits for
the stakeholders.
(f). evaluation of the free flow/smooth production process due
to assistance of inventory models that provide for holding enough
size of inventories at any time, among others.
(g). analysis of customers’ satisfaction through the assistance
of inventory management that enables cost of production and price of
the finished goods to be reduced.
In the course, of reviewing the literature, there was no much
departure of the operations of the inventory management and control
models from how they operate in the manufacturing concerns in
Nigeria. However, where the researcher does not agree in totality
with some of the model’s operation is in the area of not considering
the local environment of the manufacturing companies.

This is because there are some inventory management and
control models like Just-In-Time that requires efficient transportation
system, reliable delivery methods, short distance between the
manufacturing companies and their supplies, high level security that
would avoid external environmental disturbance such as the
September 11, 2001 terrorists attack in United States of America.
Again, Quick Response Manufacture (QRM) involves
application of computer to aid manufacture. In this case, computer is
used to re-engineer the whole production process, reduce the waiting
time, movement time, production process time, set-up time and
avoiding rework and inspection that will not add direct values to the
products produced.
So, in Nigeria where the above requirements of Just-In-Time
are still finding their grounds, its full utilization involves using the
concept (JIT) along side with other models like economic lot size. The
Quick Response Manufacture is a good inventory management and
control innovation but still requires more aggressive pursuits of the
development of Nigerian’s technology for its full maximization and this
is why the companies apply it jointly with other models to achieve
their desired goals.
Lastly, as Nigeria is trying to keep abreast of the other
developed countries of the world, the manufacturing concerns
operating in Nigeria are also following the pace set by their
counterparts in the industrialized countries of the world.
2.1 EVALUATION OF KINDS OF INVENTORIES AND METHODS
OF CHECKING INVENTORIES
In manufacturing concerns different kinds of inventory materials
are used in order to produce and sell to the customers the products
that they require. These material inventories are the raw materials,
Work-in-Progress and Finished goods.
According to Ama (2001), the forms of inventories in a
manufacturing firm include raw materials, work-in-progress and
finished goods. Raw materials are those basic input materials that are
converted into finished product through the manufacturing process.
Work –in-Progress (W.I.P) are those partly manufactured goods or
products that represent product that require further job before they
become finished goods.
Pandy (1988), states that finished goods inventories are those
completely manufactured products which are ready for sale. He also

added that they are those ones needed for easy marketing
operations.
Horngren and Sundem (1990), posit that the classes of
inventories include: Direct materials inventory which are materials on
hand awaiting use in the production process. Work-in-progress
inventories are goods that undergo the production process but
inventory are those fully completed but not yet sold.
According to Nweze (2000), stocks (otherwise known as
inventories) are items of value held for use or sale by an enterprise
and usually comprise: raw materials and supplies used in production,
Work-in-progress and finished goods.
Stocks from the above statements of the various authorities are of
three categories namely-the raw materials, the work-in-progress and
the finished goods. It is vital that manufacturing the level of
inventories they hold very carefully.
Some of these methods used to check inventories are the
perpetual inventory control, actual counting method look it over
method, re0order level and periodic review methods, among others.
Lucey (1989), states that the basic prerequisite is that stock
movements (issue and receipts) are accurately recorded, and the
most frequently used methods are BIN CARDS, Stock record cards
and perpetual inventory system.
According to Nweze(2000), the two systems of stock taking are
generally in use namely: Perpetual and Periodic. Perpetual
inventory checking method is that in which complete data recorder
kept on each item of inventory and additions and subtractions are
made with order or transaction. Here, there is an inventory balance
plus a receipt of sale minus the actual sale to reflect the quantity at
hand. Actual counting method is used to check inventories. It is used
to actually court inventory item by item. Looking it over method is
such in which the items of inventories are not properly and actually
counted from time to time and is always full of errors because it is
hard to pinpoint the inventory levels, the item that need to be ordered,
and that which the firm is overstocking.
2.1.1 Re-Order Level System
The recorder level system which is also called the two BIN
systems is such in which a predetermined re-orders level of stock is
set for each item of inventory. When the stock level falls to the re-
order level, a replenishment order is issued. The replenishment re-

order quantity is at times economic lot size (economic order quantity).
It should be noted that this method of checking inventory is also
called two BIN systems because the stock is segregated into two
bins. Stock initially drawn from the first bin and a replenishment order
issued when it becomes empty from the second bin. Most of the
organizations operate the re-order level which triggers off the
required replenishment order. The mathematical illustration bellows
can help to show how re-order level system is used.
An efficient organization uses the following data on a particular
inventory to check its inventory levels by using it, the maximum and
minimum levels of inventory, the re-order level are determined.
Normal usage - 220 units per day
Minimum anticipated usage - 100 units per day
Maximum usage - 280 units per day
Lead time 50-60 days
EOQ (Economic Order Quantity)
(Previously calculated) - 10,000 units
(i). Re-order level = maximum usage x maximum lead time
= 280 x 60 units
= 16,800 units

(ii). Minimum level = Re-order level – Average usage for lead time
= 16,800 –(220x(50+60/2)
= 16,800 –(220 x 55) units
= 16,800 -12,100 units
= 4,700 units
(iii). Maximum level = Re-order level + EOQ –(minimum anticipated
usage x minimum lead time)
= (16,800+10,000) –(100x50) units
= 26,800 - 5000 units
= 21,800 units
Source: Ama (2001)
The three levels: re-order, maximum and minimum are usually
entered on a record card and comparisons made between the actual
inventory and the control levels each time an entry is made on the
card. The re-order level shows when stock should be replenished, the
minimum level tells management on when demand is above average
and needs careful watching. Maximum level warns management that
demand is at minimum and that inventory level is likely to rise above
the desired maximum.

This method of checking inventory has its merit which is the
ability of being responsive to changes in demand and generates
automatically replenishment order at the appropriate time by
comparing inventory levels against re-order level.
However, where many different types of stock are used jointly
for production different items may reach re-order level at the same
time thereby overloading the re-order system.
2.1.2 Periodic Review System
Periodic inventory review system is just like physical courting
method in which stocks are cross-checked and updated from time to
time.
Ama (2001), states that periodic review system is such in which
stock level for all parts are reviewed at fixed intervals, for instance,
every week, month or year. Where necessary a replenishment order
quantity which is variable quantities ordered at fixed intervals and he
EOQ is not previously calculated but is based on demand, the
present inventory level and the lead-time.
Periodic inventory review system as a method of checking
inventories has the following merits;

All inventory items are reviewed periodically so that there is
more chance of outdated items to be eliminated
Economics in placing order may be gained by spreading the
purchasing firms load more evenly.
Because orders will always be in the same sequence, there
may be production economics due to more efficient production
planning being possible and lower set up cost.
Because orders will always be in the same sequence, there
may be production economics due to more efficient production
planning being possible and lower set up cost.
Large quantity discounts may be obtained when a range of
inventory items is ordered at the same time from a supplier.
Nevertheless, this method of checking inventory is less
responsive to change in consumption, if the rate of usage changes
shortly after review, stock out may occur before the next review.
Unless, demands are reasonably consistent, it is somewhat
difficult to set appropriate periods for review.
Lastly, manufacturing concerns use these methods to check
and supervise the levels of their stock in order to avoid over-stocking

or running out of stock as all these could tell much on the
performance of the organization.
2.2 BASIC TYPES OF INVENTORY MANAGEMENT
TECHNIQUES IN MANUFACTURING CONCERNS
The aim of a manufacturing concern to the manage its inventories are
as follows:
To establish and maintain an adequate inventory level at a
minimum cost
To reduce the cost of managing inventory
To ensure the production is not interrupted due to lack of
inventory and that inventories are not used through excess
stock by fixing re-order and stock levels.
To minimize overstocking and under-stocking.
Lucey (1989), defines inventory management or control as; the
system used in a firm to control the firms investment in stock. The
system typically involves the recording and monitoring off stock
levels, forecasting future demands and deciding when and how many
to order. The overall objective of inventory management is to
minimize, in total, the costs associated with stock.

In order to achieve the objective of inventory management, the
organizations determine the optimum level by
The ordering costs on the order hand are the cost of placing for
replenishment stocks or inventories. It is believed that when bulk
quantities of stock are ordered, the ordering cost will reduce but
holding cost will also increase.
According to Luecy (1989), ordering costs includes:
Transport costs
The set-ups and tooling costs associated with production run
The clerical and administrative costs associated with the
purchasing, accounting and goods received.
According to Hilton (1994), ordering costs are the following:
Receiving cost (e.g. unloading and inspection)
Clerical costs of preparing purchase orders
Transportation costs
Sum spent finding suppliers and expediting order
However, the holding costs include:
Deterioration, theft spoilage or obsolescence costs of storage
space (e.g. warehouse)
Forgone interest on working capital tied up in inventory
Security
Shortage costs includes:
Loss of quantity discounts on purchase
Disrupted production when raw materials are unavailable
Lost sales resulting from dissatisfied customers
Idle worker, extra machinery setups.
Ama (2001), enumerated inventory out-costs as follows:
(a). Labour frustration over stoppages
(b). extra costs associated with urgent and often small quantity
replenishment purchases.
(c). lost contribution through the lost sale.
(d). cost of production stoppages caused by inventory out of work-
in-progress of raw materials.
(e). loss of customers goodwill
(f). loss of future sales because of customers going elsewhere.
Therefore, when all the above cost elements are considered,
the question will be how will inventory management method minimize
them in order for the organization to thrive?
The answer is by using the order quantity of inventory that
minimizes the cost of procuring and holding inventory. This stock

order is called economic order quantity, EOQ or economic lot size
(ELS).
2.5 PROFIT MAXIMIZATION THROUGH EFFICIENT INVENTORY
MANAGEMENT
Organizations have limited resources and this always pose
problems to the extent of result normally achieved. According to
Copland and Dascher (1979) as cited in Nweze (2000) common
organizational goals include: maximization of profit or achieving
satisfactory levels of performance (profit satisfaction), achieving
contained growth or ensuring the survival of the organization among
others.
To maintain profitability, the most important requirements are
preventing wastage of time and raw materials, not leaving the
machine capacity idle and under utilization of labour force.
Specifically, the major asset in the enterprise which affects efficiency
of operations is inventory. Both excess of inventory and its shortage
affect the productive activity and the profitability of an organization.

In order to maximize profit, manufacturing concerns always try
to reduce both holding costs and ordering costs by using optimum
order quantities called economic order quantity or lot size.
According to Fe News Services (1998), the holding costs such
as interest on capital invested in inventories, insurance cost,
obsolescence, wastage resulting from storing inventories, and costs
attributed to not holding the inventories such as re-ordering cost, lost
sales cost, lost production cost, orders not executed, customers
dissatisfaction and threat to lose the market share, burden of fixed
costs and wage payment to idle workforce and underutilized machine
capacity have the capacity to reduce profit of a manufacturing
concern when not handled properly.
When inventory management is applied, costs are drastically
reduced and the rate of turnover is increased due to attention to
production and customers satisfaction.
This Fe News Service (1998), states thus: economic order
quantity or lot order size of inventories is suggested to reduced the
costs associated with acquiring and carrying the
inventories. The size of the order should be such which ensures the
desired level of inventory at minimum acquisition and carrying costs.

However, costs reduction due to application of sound inventory
management principles resulted in very significant increase in net
income (profit). This is achieved as stated earlier by using optimum
stock quantity that gives more turnover to keep sales on as
customers demand. Inventory management is also about balancing
the two opposing cost factors for optimum profitability.
2.6 CUSTOMERS’ SATISFACTION DUE TO THE USE OF
INVENTORY MANAGEMENT
Manufacturing concerns produce for the public who consumes
their products. These products are in some cases purchased directly
from them or through middlemen. However, what keeps the
manufacturing concerns in sound business base is the level of their
sales. The sales made are high when the customers needs are
attended to as and when due.
To achieve the above goal, manufacturing concerns do
everything possible to keep in stock the kinds of products needed by
their customers at all time. Therefore, the issue of out-of-stock is not
there and production stoppages do not come in.

Hence, the pillar behind the success and excellent services
cum satisfaction to the customers is the ability of the concerns to
apply the techniques of inventory management very well in their
organizations are always ordered and used at reduced cost, so as to
sell at affordable prices to the customers.
Lucey (1989), states that firms are integrating their
manufacturing activities more closely with purchasing and sales thus
dramatically reducing or even eliminating excessive stock-holdings. In
achieving all these, Just-In-Time (JIT), and Manufacturing
Requirement Planning (MRP) methods are used.
Microsoft Business Solution (2003), states that customers are
more important than ever, and they expect better services and more
competitive prices than ever before. To survive, manufacturing
concerns need to keep customers satisfied. Firms cannot afford to
miss an order because an item is no in stock. When customers know
that the organization is geared towards serving their needs, such
organization becomes more than just today’s supplier of goods but
becomes a long term partner. This is achieved by reduction in
excessive in excessive inventory and encouraging optimum
production.

Therefore, inventory management plays much role in
determining that manufacturing concerns produce at reduced costs
by helping them to reduce the holding costs and ordering costs so as
to sell to the customers at reduced prices and regularly as the
customers demand, due to hitch-free production.
2.7 POSSIBILITY OF HITCH-FREE PRODUCTION DUE TO APPLICATION OF INVENTORY MANAGEMENT BY MANUFACTURING CONCERNS
Production is the act off transforming raw materials and work in
progress into finished goods for the satisfaction of human wants.
Onuoha (1991), states that production is changing the form of
things, changing raw materials into finished goods, changing
substance by chemical actions, assembling many parts to make
something such as a watch or a motorcar and the distribution of the
products to the final consumers.
The above definition shows that raw materials, work-in-
progress, materials are used for the production of finished goods.
When these raw materials are not available, production is stopped or
disrupted. The disruption hinders not only production but the level of
sales that determines the profit of the organization.

Also, when production suffers, the customers are lost to the
competitors. When excessive inventories are stocked, capital is not
only tied the organization. And so, it is only through the process of
efficient inventory management can enable the economic order lot
sizes to be obtained that allows efficient production to be achieved.
Ama (2001), posits that inventory management is a veritable
key to hitch-free production in manufacturing concerns that ensures:
Uninterrupted supply to the customers.
Provides a buffer between production processes
Ensures production processes that flow smoothly and efficiently
Prevent loss of customers goodwill
Prevent loss of future sales
Prevents labour frustration over stoppages
2.8 LIQUIDITY CONTROL THROUGH EFFICIENT INVENTORY
MANAGEMENT
Organizations in the course of their business operations apply
all or some of their capital resources to acquire assets to be held for
either capital appreciation, income generation or production activities
to secure trading advantages geared towards profit.

Okafor (1983), states that investment refers to economic
activities designed to increase, improve or maintain the production
quality of the existing stock capital.
Some times, manufacturing concerns over invest in stock in
order to maintain production, avoid stock-outs and satisfy their
customers. But when this investment is done without regards to
efficient inventory management, a lot of capital resources of the
concerns are large holding costs. At that point, liquidity which is the
ability of an organization to meet its repayment demand as they fall
due will be affected.
According the BBP/CIB OAK publishers limited (1991), the
most liquid asset is cash, the most liquid assets are short term
investments (bills). Debtors are fairly liquid assets as they can pay
their bills in near future. Stocks are the least liquid current assets
because they must first be sold (perhaps on credit) and the
customers given credit period before they can be converted into cash.
Efficient inventory management directs the economic order
quality that should be ordered at any time to reduce the capital that is
tied down in stock.

Therefore, in as much as manufacturing firms cannot do without
investment that will avoid disrupted production, minimize costs,
increase customers satisfaction, high profit and balanced liquidity
position in order to maintain the integrity of the firms in the eyes of
their creditors.
Finally, the essence of liquidity control cannot be
overemphasized as pointed by Loyd and Rosenfield (1979) a
company may be high profitable, yet be on the verge of bankruptcy
because of shortage of liquid assets such as cash and accounts
receivables.

REFERENCES
Ama, G.A.N (2001), Management and Cost Accounting: Current Theory and Practice. Amsson publishers, Aba. Copeland, R.M and Dascher, P.E. (1979), Management Accounting. 2nd edn, In: Nweze (2000), Profit Planning: A Quantitative Approach. M’cal Communication International,
Enugu.
Hilton, R.W. (1994), Management Accounting. Mcgraw Hill Inc. USA Horgren, T.C. and Sundern, G. (1990). Introduction to Management Accounting. 8Ed, Prentice Hall Inc. USA ICAN Distance Learning (1999), Management Accounting (PEI) Study and Progress Text. Accountancy Training and Publication Ltd Lagos. Joseph, D. (2002), Just-In-Time Inventory: A Financial Perspective, www.stares.demon.co.uk/Theory and concepts/beyond Jit.htm. Lucey, T. (1989), Costing. DP Publications Ltd. London, Nweze, A.U (2000), Quantitative Approach to Management Accounting. Computer Edge Publishers, Enugu. Okafor, F.O. (1983), Investment Decisions: Evaluation of Project and
Securities. Cassel Ltd. London. Onuoha, B.C. (1991), Fundamentals of Business Management in
Nigeria. Unique Press Ltd. Aba.

Pandy, I.M. (1988), Financial Management. New Delhi: Vikas Publishing House Pvt ltd. Ranjan, K. (1976), A Manuel of Sampling Technique. Heinemann, London.
CHAPTER THREE
3.0 RESEARCH METHODOLOGY
Research is a systematic process of finding out acquiring and
using knowledge (Udo, 2004:2). Research methodology therefore
refers to the arrangement of conditions for the collections and
analysis in a manner that aims to combine relevance of the research
purpose with economy of procedure. It also considers the various
sources adopted in gathering information relevant to the study.
3.1 RESEARCH DESIGN
Research design means the structuring of investigation aimed
at identifying variables and their relationship to one another (Asika,
2001:27). Research design shows how data relating to a research
problem should be collected and analyzed. The process involves the
structuring of investigation to identify variables and their relationship
with one another as well as providing procedural outline for the
conduct of the investigation.
Anigbo (1997:56), posits that research design is the plan,
pattern, blue print, paradium that stipulates how the data for the
solution of research problem(s) will be colleted and analyzed.
Thus, in this research study, questionnaire was used to elicit
the views of the workers/operators of inventory management in
beverage companies which are subset of manufacturing concerns. A
study of the economic order quantities, production, costs and sales
made by some of the selected beverage firms were done to
understand better, the usefulness of inventory management
techniques.
3.2 SOURCES OF DATA
Because numerical data are the raw material of statistical
investigation, one of the first steps in any statistical study must be the
collection of suitable data (Freund and Williams, 1979:6). A corollary
to the above is the notion of the sacredness of data to any research
work, and the integrity of the collections process. This made the
researcher to show greath care in collecting relevant data for this
study, via primary and secondary sources.

3.3 METHOD OF DATA COLLECTION
The data used for this study are the primary and secondary
data. Structured questionnaire is used for collecting the primary data.
In the structured questions, the respondents were expected to tick
any option that applied to them between four options/responses of
strongly agree, agree, neutral and disagree.
Nineteen (19) questions were asked for the purpose of the
study. Out of the nineteen, five (5) were on personal data of the
respondents, while fourteen (14) questions were on the study proper.
In constructing the questionnaire, the objectives that were
expected to be accomplished were appropriately identified and put
into consideration. This is information on the usefulness of inventory
management and control in manufacturing concerns.
The secondary data were collected from textbooks and other
printed materials like financial magazines and journals.
3.4 POPULATION AND SAMPLE SIZE
A population consists of all conceivably or hypothetically possible
observations relating to a given phenomenon. While a sample is
simply a part of a population, Freund and Williams (1982:85). It is

important to determine the group of persons or things to study. The
target population for this study is some selected beverage
companies, accessible staff that dutifully record and manage daily
inventory orders, economic lot size quantities, production, sales and
costs associated with the organizational activities of the
manufacturing concerns.
However, since it will be cumbersome to asses the entire
population due to time and financial constraints, a sample size was
computed.
3.4.1 DETERMINATION OF SAMPLE SIZE
Table 3.1 Total Number of Staff in the accessible population
S/N Beverage Company No of Staff
1 Coca-Cola Nigeria Plc Enugu 45
2 Nigeria Mineral Water Industries Ltd
(Limca), Onitsha
40
3 Pepsicola Nigeria Plc Enugu 43
Total 128
Source: (Coca-Cola Nigeria Plc, Pepsicola Plc and Limca Ltd).

Sample Size
To determine the sample size, Taro Yamane’s formula was
used thus
n= N 1+N(e)2
Where N = Total Population = 128
E = Level of error of tolerance = 5%
1 = Constant
n = Total Sample Size
Source: Yamane (1964:280)
Substituting the various surveyed population in the above formula:
N = 128 1+128(0.05)2
= 128 1.32
n = 97 respondents In order to allocate the sample among the various beverage
companies nh1 to nh3, Bowley’s proportion formula was used thus:
nh = NH x n N Where nh = number of units/categories allocated to each
organization

N = Overall population of Study
NH = No of population in each organization of Study
n = Total sample size obtained
Source Ranjan (1976:137)
Substituting in the above expression
Nh1 = 45 x 97 128 1 = 34
Nh2 = 40 x 97 128 1 = 30 Nh3 = 43 x 97 128 1 = 33 The Sample Size: The computed sample size allocations as
shown above are tabulated below:
Table 3.2 Sample size
Beverage Company Population Sample
Coca-Cola Nigeria Plc Enugu 45 34
Nigeria Mineral Water Industries Ltd
(Limca), Onitsha
40 30
Pepsicola Nigeria Plc Enugu 43 43
Total 128 128
Sources: (Coca-Cola Nigeria Bottling Plc, Pepsicola Nigeria Plc and Limca Ltd).

Out of the ninety-seven (97) copies of questionnaire distributed,
twelve (12) copies were not returned. The researcher was left with
eighty five (85) valid questionnaire to work with the formed the basis
for the data analysis. The method entails dividing the population into
strata on the basis of variable significantly correlated with some
dependent variables. The strata got are as follows:
Table 3.3 Sample size
Beverage Company Population Sample
Coca-Cola Nigeria Plc Enugu 34 30
Nigeria Mineral Water Industries Ltd
(Limca), Onitsha
30 28
Pepsicola Nigeria Plc Enugu 33 27
Total 97 85
Sources: (Coca-Cola Nigeria Bottling Plc, Pepsi cola Nigeria Plc and Limca Ltd).
3.5 TECHNIQUES OF DATA ANALYSIS
Data collected in the course of this study will be presented and
analyzed using statistical tools. The data collected will be presented
in tabular form and analyzed using the Chi-square (X2) test,
correlation co-efficient and regression analysis.
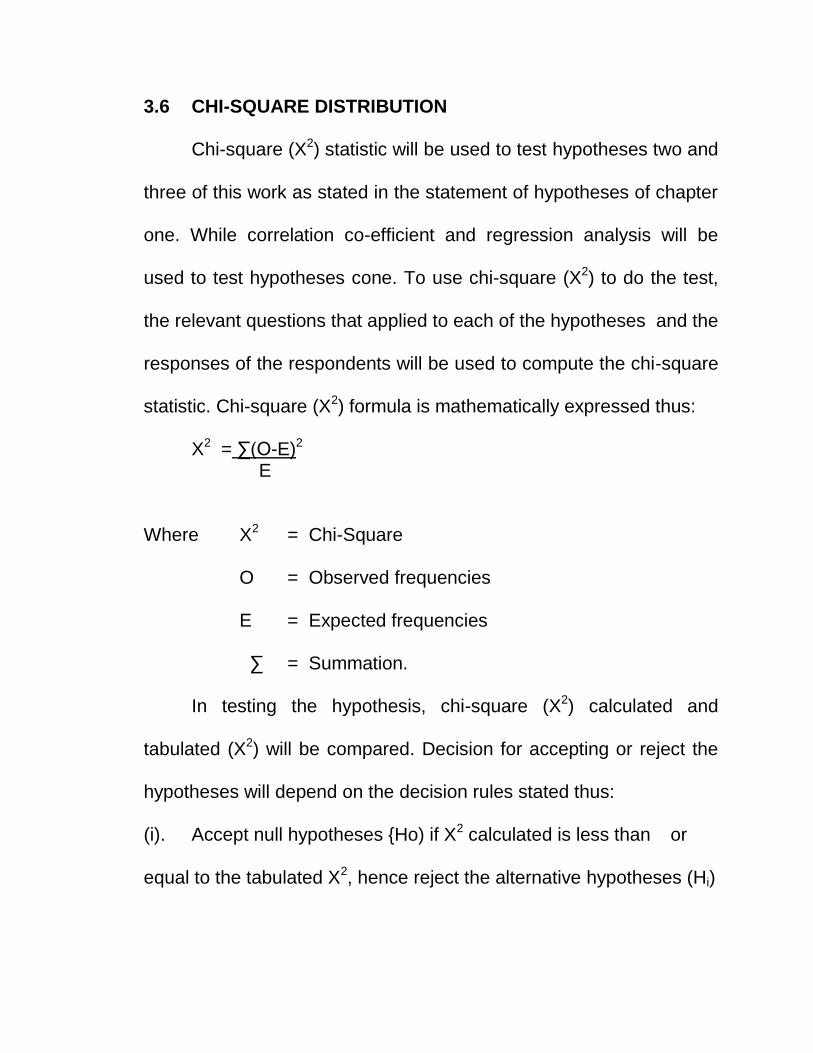
3.6 CHI-SQUARE DISTRIBUTION
Chi-square (X2) statistic will be used to test hypotheses two and
three of this work as stated in the statement of hypotheses of chapter
one. While correlation co-efficient and regression analysis will be
used to test hypotheses cone. To use chi-square (X2) to do the test,
the relevant questions that applied to each of the hypotheses and the
responses of the respondents will be used to compute the chi-square
statistic. Chi-square (X2) formula is mathematically expressed thus:
X2 = ∑(O-E)2 E
Where X2 = Chi-Square
O = Observed frequencies
E = Expected frequencies
∑ = Summation.
In testing the hypothesis, chi-square (X2) calculated and
tabulated (X2) will be compared. Decision for accepting or reject the
hypotheses will depend on the decision rules stated thus:
(i). Accept null hypotheses {Ho) if X2 calculated is less than or
equal to the tabulated X2, hence reject the alternative hypotheses (Hi)
(ii). Reject null hypotheses (Ho) if X2 calculated is greater than or
equal to the tabulated X2, hence accept alterative hypotheses (Hi)
The above two rules are mathematically express thus:
(i). Accept Ho, if X2 Cal < X2tab, hence reject Hi
(ii). Accept Ho, if X2 Cal > X2tab, hence accept Hi
REFERENCES
Anigbo, L. C. (1997), Research Desigh. In Eze, A.E., Umebe S.E.,
and Ezike, H.O. (Eds, 1997). Foundations of Research in Education. Rojoint Communication Ltd. Enugu.
Asika, N. (2001), “Research Methodology in the Behavioural Science”. Longman publishers Plc, Ikeja Lagos Freund John, and Williams Frank J. (1979), “Modern Business Statistics 2nd Ed. London Pitman Ltd. Nwabuokei, P.O. (1986), Fundamentals of Statistics. Koruna Books, Enugu. Taro, Y. (1964), Statistics: An Introductory Analysis. 3rd Ed. Harpers and Row Publishers, New York. Udo, G.O. (2004), A Guide to Modern Research Methods. Institute of Development Studies, University of Nigeria Enugu Campus.
CHAPTER FOUR
4.0 PRESENTATION AND ANALYSIS OF DATA
In this chapter, the research presented both the quantitative
and qualitative data collected during the field work. These data
include the responses from the interview conducted by the
researcher, the personal observations, the information elicited with
the questionnaire and other relevant data collected from the manuals
supplied by the beverage companies of study.
The analysis of the findings followed a systematic approach of
providing answers to each of the research questions. The results and
discussion of the findings in the study are presented to reflect the
general evaluation of the usefulness of inventory management in
manufacturing concerns. It is also aimed at establishing in particular
the efficacy or otherwise of the techniques in minimization of costs for
more productivity in the manufacturing sector.
4.1 PERCENTAGE DETERMINATION OF QUESTIONNAIRE
RESPONSES IN A TABULAR FORM
The responses of the respondents as elicited from the
questionnaires were presented in a tabular form as shown below and
at the end, the total scores for each class of the responses and their
percentages were determined.
4.1.1 ANALYSIS OF GENERAL CHARACTERISTICS OF THE
RESPONDENTS
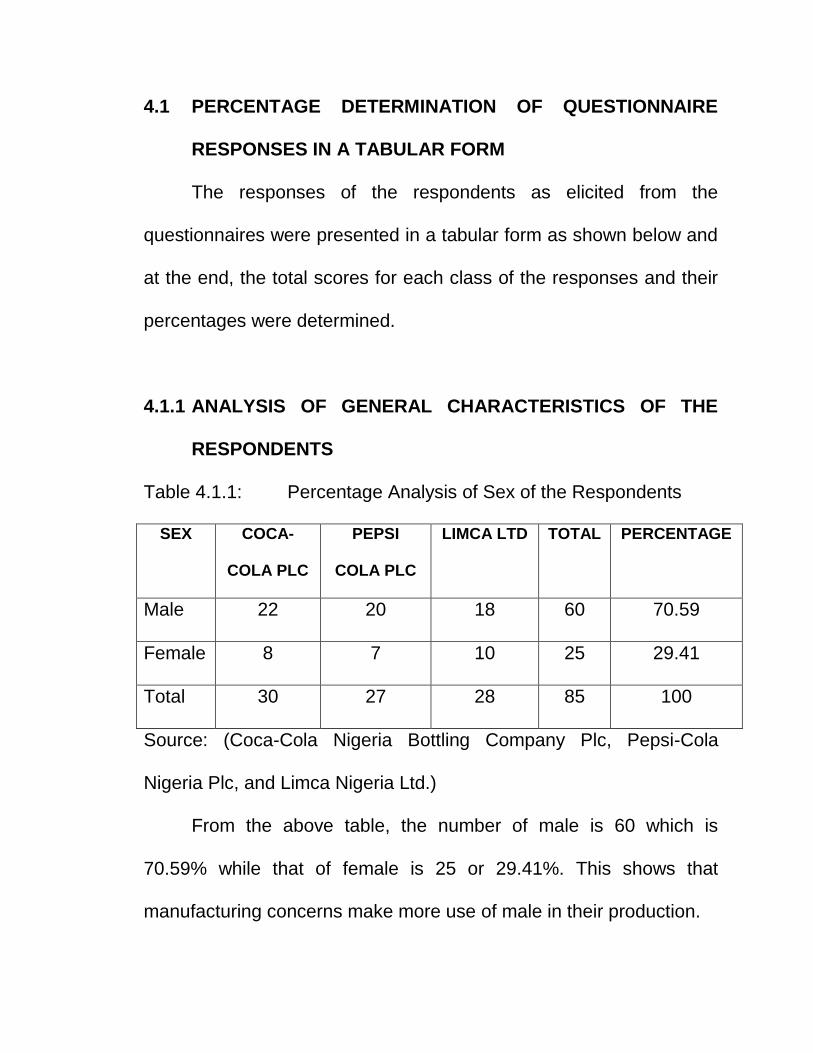
Table 4.1.1: Percentage Analysis of Sex of the Respondents
SEX COCA-
COLA PLC
PEPSI
COLA PLC
LIMCA LTD TOTAL PERCENTAGE
Male 22 20 18 60 70.59
Female 8 7 10 25 29.41
Total 30 27 28 85 100
Source: (Coca-Cola Nigeria Bottling Company Plc, Pepsi-Cola
Nigeria Plc, and Limca Nigeria Ltd.)
From the above table, the number of male is 60 which is
70.59% while that of female is 25 or 29.41%. This shows that
manufacturing concerns make more use of male in their production.

Table 4.1.2 Percentage Analysis of Ages of Respondents.
AGE COCA-
COLA
PEPSI-
COLA
LIMCA
LTD
TOTAL PERCENTAGE
20-30 14 11 12 37 43.53
31-40 8 7 6 21 24.71
41-50 3 5 4 12 14.11
51-60 3 2 3 8 9.41
60 and
above
2 2 3 7 8.24
Total 30 27 28 85 100
Source: (Coca-Cola Nigeria Bottling Company Plc, Pepsi-Cola
Nigeria Plc, and Limca Nigeria Ltd.)
The age distribution of respondents showed that 37 or 43.53%
was of the age bracket of 20-30 years. 21 or 24.71% was of the age
bracket of 31-40 years. 12 or 14.11% was of the age bracket of 41-50
years. 8 or 9.41% was of the age bracket of 51-60 years. 7 or 8.24%
was of the age bracket of 61 and above. This shows that the
concerns employ more of the able bodied employee who are
energetic.
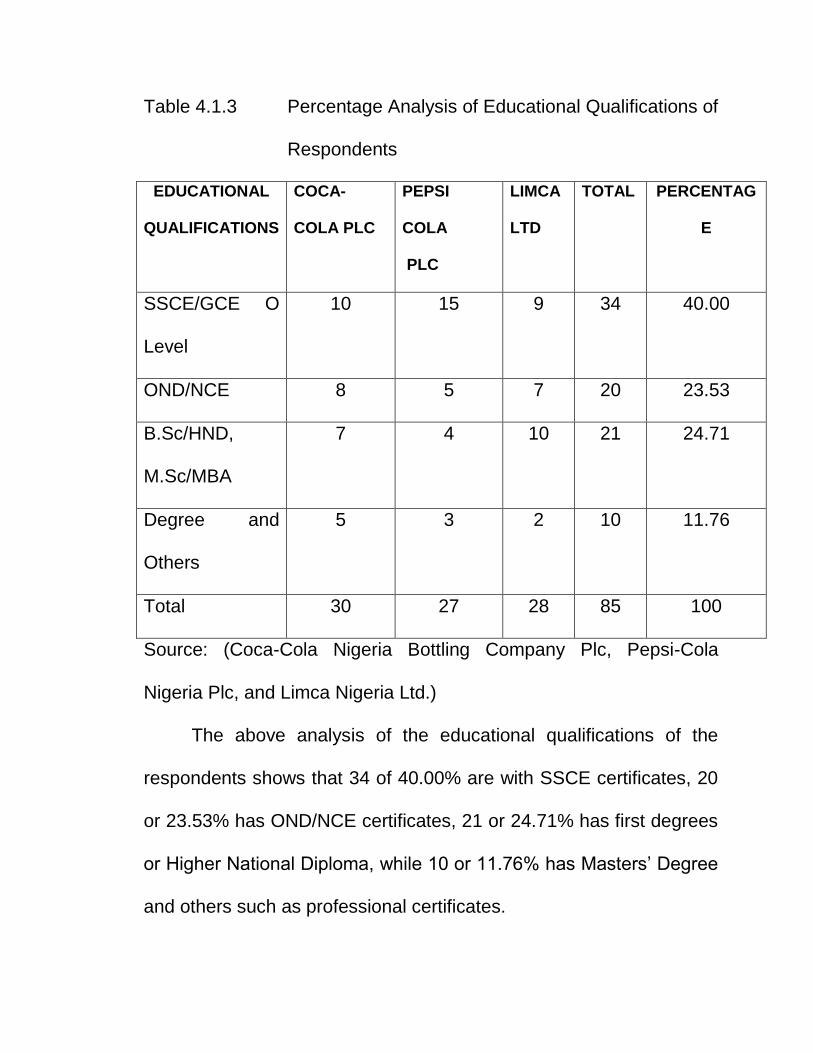
Table 4.1.3 Percentage Analysis of Educational Qualifications of
Respondents
EDUCATIONAL
QUALIFICATIONS
COCA-
COLA PLC
PEPSI
COLA
PLC
LIMCA
LTD
TOTAL PERCENTAG
E
SSCE/GCE O
Level
10 15 9 34 40.00
OND/NCE 8 5 7 20 23.53
B.Sc/HND,
M.Sc/MBA
7 4 10 21 24.71
Degree and
Others
5 3 2 10 11.76
Total 30 27 28 85 100
Source: (Coca-Cola Nigeria Bottling Company Plc, Pepsi-Cola
Nigeria Plc, and Limca Nigeria Ltd.)
The above analysis of the educational qualifications of the
respondents shows that 34 of 40.00% are with SSCE certificates, 20
or 23.53% has OND/NCE certificates, 21 or 24.71% has first degrees
or Higher National Diploma, while 10 or 11.76% has Masters’ Degree
and others such as professional certificates.

Table 4.1.4 Percentage Analysis of Job Schedule of the
Respondents
JOB
QUALIFICATION
COCA-
COLA PLC
PEPSI COLA
PLC
LIMCA
LTD
TOTAL PERCENTAGE
Personnel
official/staff
4 5 6 15 17.65
Production
officer/staff
8 7 9 24 28.24
Inventory
officer/staff
4 3 2 9 10.58
Sales
officer/staff
9 8 5 22 25.88
Accounts
officer/staff
5 4 6 15 17.65
TOTAL 30 27 28 85 100
Source: (Coca-Cola Nigeria Bottling Company Plc, Pepsi-Cola
Nigeria Plc, and Limca Nigeria Ltd.)
The analysis shows that the personnel staff of the concerns
was 15 or 17.65%, production official/staff 24 or 28.24%, inventory
official staff 9 or 10.58%, sales official/staff 22 or 25.88% and
accounts official/staff 15 or 17.65%.
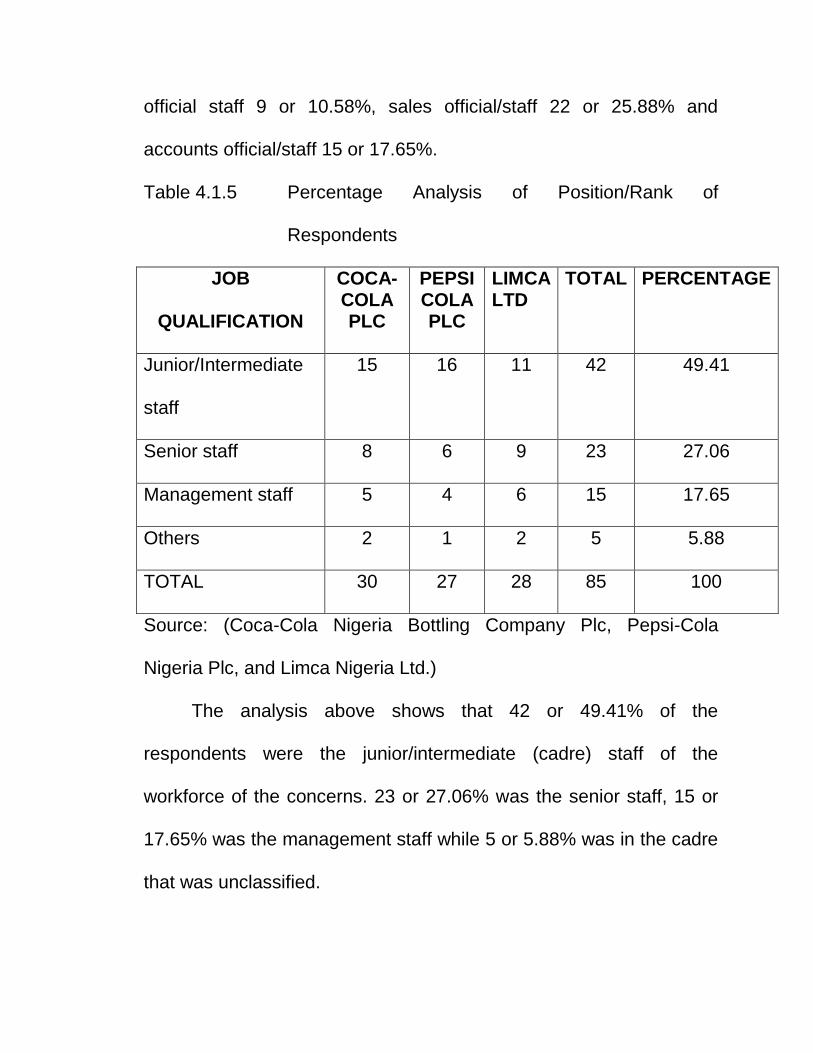
Table 4.1.5 Percentage Analysis of Position/Rank of
Respondents
JOB
QUALIFICATION
COCA-COLA PLC
PEPSI COLA PLC
LIMCA LTD
TOTAL PERCENTAGE
Junior/Intermediate
staff
15 16 11 42 49.41
Senior staff 8 6 9 23 27.06
Management staff 5 4 6 15 17.65
Others 2 1 2 5 5.88
TOTAL 30 27 28 85 100
Source: (Coca-Cola Nigeria Bottling Company Plc, Pepsi-Cola
Nigeria Plc, and Limca Nigeria Ltd.)
The analysis above shows that 42 or 49.41% of the
respondents were the junior/intermediate (cadre) staff of the
workforce of the concerns. 23 or 27.06% was the senior staff, 15 or
17.65% was the management staff while 5 or 5.88% was in the cadre
that was unclassified.

TABLE 4.1.2 FREQUENCY DISTRIBUTION AND
PERCENTAGE ANALYSIS OF MANUFACTURING
CONCERN RESPONDENTS ON THE
USEFULNESS OF INVENTORY MANAGEMENT.
Table 4.1.6 Percentage Analysis of Use of Inventory by
Manufacturing Concerns.
STATEMENTS CATEGORY OF
RESPONSES
OBSERVED FREQUENCY
OF RESPONSES
PERCENTAGE OF
RESPONSES%
PERCENTAGE OF
RESPONDENTS WHO
AGREE WITH THE ITEM %
PERCENTAGE OF
RESPONDENTS WHO
DISAGREED WITH THE
ITEM %
Manufacturing
organization
use stock or
inventory in
their
production
Strongly
Agree
55 73.33
Agree 20 26.67
Neutral 0 0.00 100 0.00
Disagree 0 0.00
Total 75 100.0
Source: (Coca-Cola Nigeria Bottling Company Plc, Pepsi-Cola
Nigeria Plc, and Limca Nigeria Ltd.)

The analysis shows that about 100.00% of the respondents
consented to the fact that manufacturing organization use inventory
for their production. While none of the respondents disagreed.
Table 4.1.7 Percentage Analysis of the Specific Raw Materials Used by the Beverage Companies for their Production.
STATEMENTS CATEGORY OF RESPONSES
OBSERVED FREQUENCY OF RESPONSES
PERCENTAGE OF RESPONSES%
PERCENTAGE OF RESPONDENTS WHO AGREE WITH THE ITEM %
PERCENTAGE OF RESPONDENTS WHO DISAGREED WITH THE ITEM %
Beverage
companies
use
concentrates
mea
solutions,
sugar, water
and other
raw
materials for
their
production
Strongly
Agree
60 73.17
Agree 18 21.95
Neutral 1 1.22 95.12 4.88
Disagree 3 3.66
TOTAL 82 100
Source: (Coca-Cola Nigeria Bottling Company Plc, Pepsi-Cola
Nigeria Plc, and Limca Nigeria Ltd.)

About 95.12% agreed that beverage companies use
concentrates, mea solution, sugar and water among others for their
production while 4.88% disagreed. This disagreement may be due to
their ignorance of the materials in use by the companies.
Table 4.1.8 Percentage Analysis of the Type of Products
Produced by Beverage Companies
STATEMENTS
CATEGORY OF
RESPONSES
OBSERVED FREQUENCY
OF RESPONSES
PERCENTAGE OF
RESPONSES%
PERCENTAGE OF
RESPONDENTS WHO AGREE
WITH THE ITEM %
PERCENTAGE OF
RESPONDENTS WHO
DISAGREED WITH THE ITEM
%
The products
manufactured
by beverage
companies
which you
work in and
around you
include Coca-
cola, 7up,
Limca, Gold
Spot, Fanta,
Pepsi etc
Strongly
Agree
65 81.25
Agree 15 18.75
Neutral 0 0.00 100.00 0.00
Disagree 0 0.00
Total 80 100
Source: (Coca-Cola Nigeria Bottling Company Plc, Pepsi-Cola
Nigeria Plc, and Limca Nigeria Ltd.)

From the analysis, the whole respondents (100%) agreed that
the beverage companies produce Coca-Cola, 7up, Limca, Gold Spot,
among others.
Table 4.1.9 Percentage Analysis of the Use of Inventory
Management Techniques by the Manufacturing
Concerns to Manage their Inventories.
STATEMENTS CATEGORY OF
RESPONSES
OBSERVED FREQUENCY
OF RESPONSES
PERCENTAGE OF
RESPONSES%
PERCENTAGE OF
RESPONDENTS WHO AGREE
WITH THE ITEM %
PERCENTAGE OF
RESPONDENTS WHO
DISAGREED WITH THE ITEM
%
Manufacturing
organizations
use inventory
in management
techniques to
manage their
inventory
levels.
Strongly
Agree
50 60.93
Agree 25 30.49
Neutral 5 60.09 91.47 8.53
Disagree 2
Total 82 100
Source: (Coca-Cola Nigeria Bottling Company Plc, Pepsi-Cola
Nigeria Plc, and Limca Nigeria Ltd.)
The analysis shows that 91.47% of the respondents agreed that
manufacturing concerns use inventory management to manage their
inventories. While about 8.53% disagreed perhaps, they believe that
management style is the same everywhere. The percentage that

agreed which is 91.47% is much and therefore proves to a great
extent that despite the harsh environmental factors that hinder
effective use of all the various kinds of inventory management
techniques such as JIT, QRM and MRP, that Nigerian manufacturing
concerns are tactically applying them with the workable ones. Such
as EOQ to achieve all their organizational goals such as cost
minimization, profit maximization and smooth production among
others just like the United States of America, Japan and Britain, etc
Table 4.1.10 Percentage Analysis of the Use of Economic Order
Quantity Model to Determine the Quantity of
Inventory to Order.
STATEMENT
CATEGORY OF
RESPONSES
OBSERVED FREQUENCY
OF RESPONSES
PERCENTAGE OF
RESPONSES%
PERCENTAGE OF
RESPONDENTS WHO AGREE
WITH THE ITEM %
PERCENTAGE OF
RESPONDENTS WHO
DISAGREED WITH THE ITEM
%
Beverage
companies
use the
technique of
Economic
Lot Size of
Economic
Order
Strongly
Agree
48 57.83
Agree 30 36.14
Neutral 2 2.41 93.97 6.03
Disagree 3 3.62

Quantity of
Inventory to
order and
when to do
so.
83 100
Source: (Coca-Cola Nigeria Bottling Company Plc, Pepsi-Cola
Nigeria Plc, and Limca Nigeria Ltd.)
The analysis of the responses shows that 93.97% of the
respondents agreed that Economic Order Quantity (EOQ) model is
used to produce the right order quantity of inventory and at the right
time, while 6.03 which disagreed may be hoping on other models
such as Just-In-Time, among others.
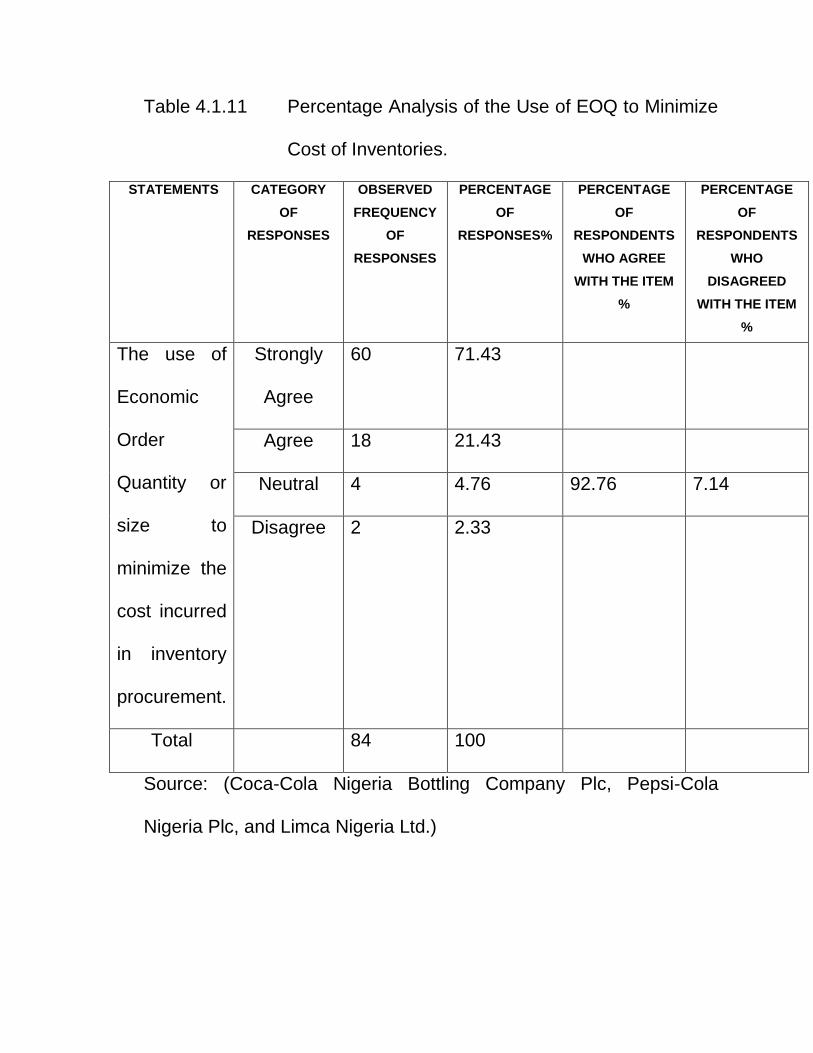
Table 4.1.11 Percentage Analysis of the Use of EOQ to Minimize
Cost of Inventories.
STATEMENTS CATEGORY
OF
RESPONSES
OBSERVED
FREQUENCY
OF
RESPONSES
PERCENTAGE
OF
RESPONSES%
PERCENTAGE
OF
RESPONDENTS
WHO AGREE
WITH THE ITEM
%
PERCENTAGE
OF
RESPONDENTS
WHO
DISAGREED
WITH THE ITEM
%
The use of
Economic
Order
Quantity or
size to
minimize the
cost incurred
in inventory
procurement.
Strongly
Agree
60 71.43
Agree 18 21.43
Neutral 4 4.76 92.76 7.14
Disagree 2 2.33
Total 84 100
Source: (Coca-Cola Nigeria Bottling Company Plc, Pepsi-Cola
Nigeria Plc, and Limca Nigeria Ltd.)
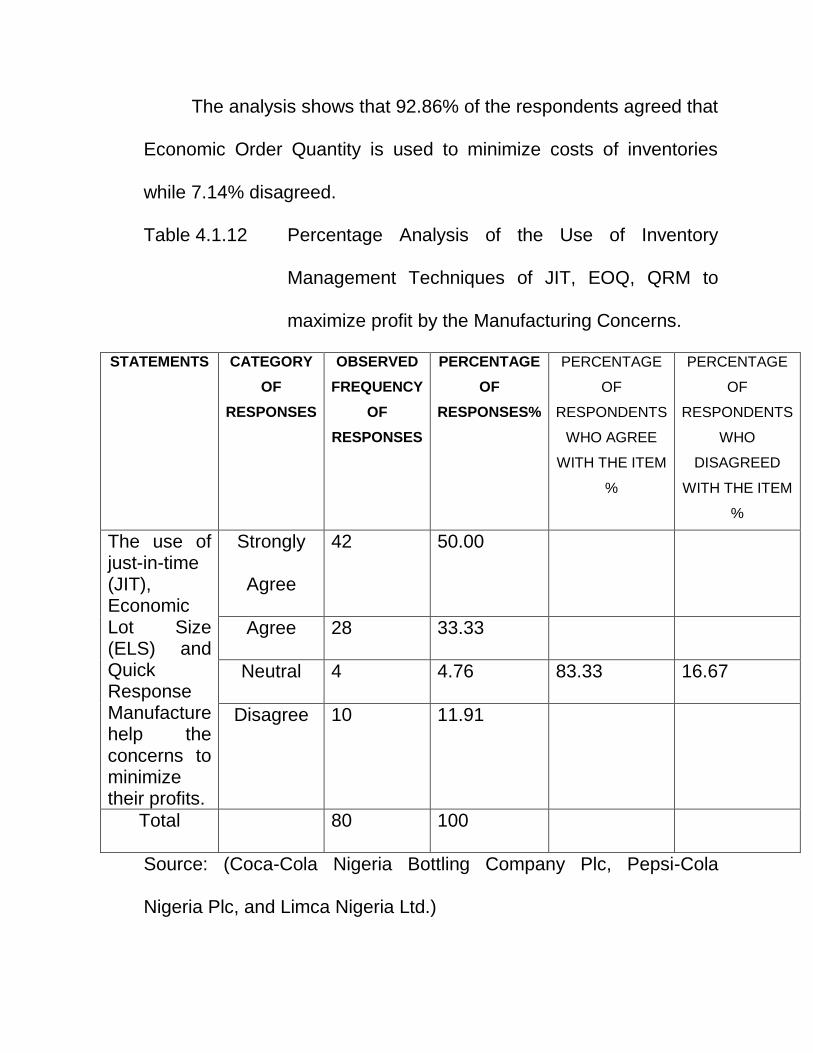
The analysis shows that 92.86% of the respondents agreed that
Economic Order Quantity is used to minimize costs of inventories
while 7.14% disagreed.
Table 4.1.12 Percentage Analysis of the Use of Inventory
Management Techniques of JIT, EOQ, QRM to
maximize profit by the Manufacturing Concerns.
STATEMENTS CATEGORY
OF
RESPONSES
OBSERVED
FREQUENCY
OF
RESPONSES
PERCENTAGE
OF
RESPONSES%
PERCENTAGE
OF
RESPONDENTS
WHO AGREE
WITH THE ITEM
%
PERCENTAGE
OF
RESPONDENTS
WHO
DISAGREED
WITH THE ITEM
%
The use of just-in-time (JIT), Economic Lot Size (ELS) and Quick Response Manufacture help the concerns to minimize their profits.
Strongly
Agree
42 50.00
Agree 28 33.33
Neutral 4 4.76 83.33 16.67
Disagree 10 11.91
Total 80 100
Source: (Coca-Cola Nigeria Bottling Company Plc, Pepsi-Cola
Nigeria Plc, and Limca Nigeria Ltd.)

The analysis shows that 83.33% agreed that inventory
management models of Just-In-Time (JIT), Economic Lot or Order
Size, Quick Response Manufacture are used by the manufacturing
concerns to maximize their profits while 16.67% was not of the same
view which may be because they believe that the maximization of
profit is just by chance.
Table 4.1.13 Percentage Analysis of the Use of Economic Order
Quantity, Just-In-Time and Material Requirement
Planning and Quick Response Manufacture to
obtain and Hold Enough Size of Inventories for
Smooth and Hitch Free Production.
STATEMENTS CATEGORY OF RESPONSES
OBSERVED FREQUENCY OF RESPONSES
PERCENTAGE OF RESPONSES%
PERCENTAGE OF RESPONDENTS WHO AGREE WITH THE ITEM %
PERCENTAGE OF RESPONDENTS WHO DISAGREED WITH THE ITEM %
Economic Lot Size, Just-In-Time (JIT), Material Requirement Planning (MPR) tools of inventory management assist manufacturing concerns to
Strongly
Agree
20 23.81
Agree 47 55.95
Neutral 9 10.71 79.76 20.24
Disagree 8 9.53
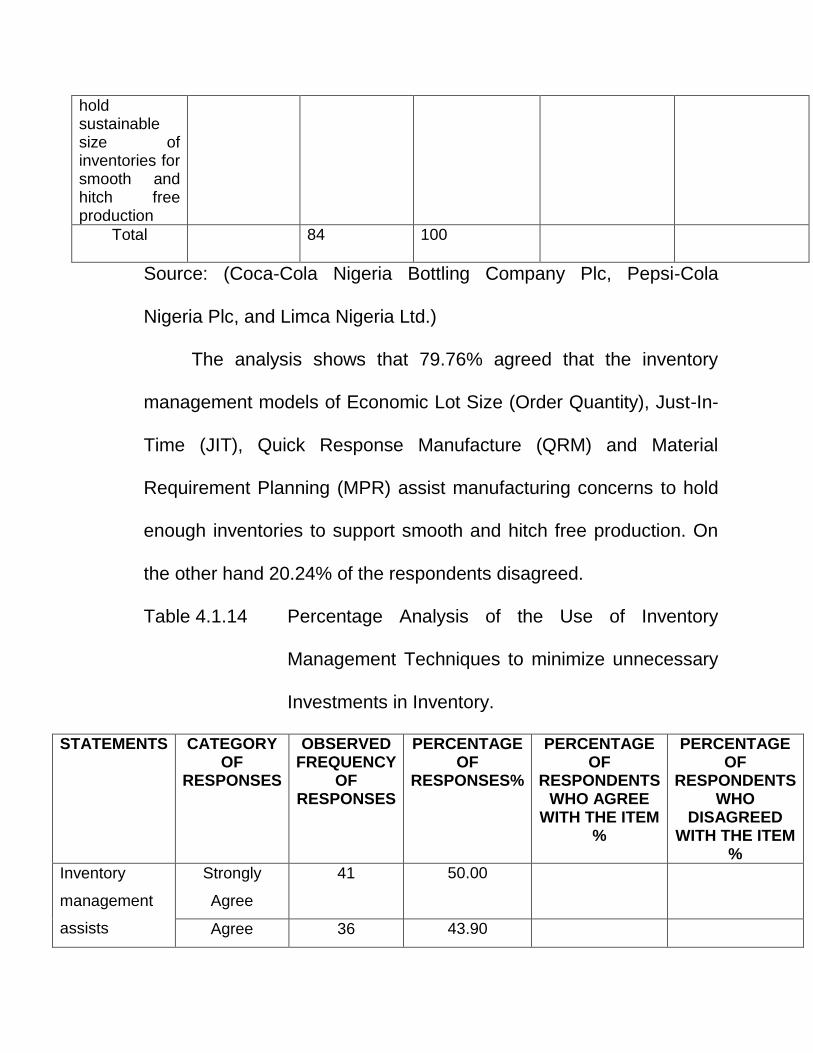
hold sustainable size of inventories for smooth and hitch free production
Total 84 100
Source: (Coca-Cola Nigeria Bottling Company Plc, Pepsi-Cola
Nigeria Plc, and Limca Nigeria Ltd.)
The analysis shows that 79.76% agreed that the inventory
management models of Economic Lot Size (Order Quantity), Just-In-
Time (JIT), Quick Response Manufacture (QRM) and Material
Requirement Planning (MPR) assist manufacturing concerns to hold
enough inventories to support smooth and hitch free production. On
the other hand 20.24% of the respondents disagreed.
Table 4.1.14 Percentage Analysis of the Use of Inventory
Management Techniques to minimize unnecessary
Investments in Inventory.
STATEMENTS CATEGORY OF
RESPONSES
OBSERVED FREQUENCY
OF RESPONSES
PERCENTAGE OF
RESPONSES%
PERCENTAGE OF
RESPONDENTS WHO AGREE
WITH THE ITEM %
PERCENTAGE OF
RESPONDENTS WHO
DISAGREED WITH THE ITEM
%
Inventory
management
assists
Strongly
Agree
41 50.00
Agree 36 43.90
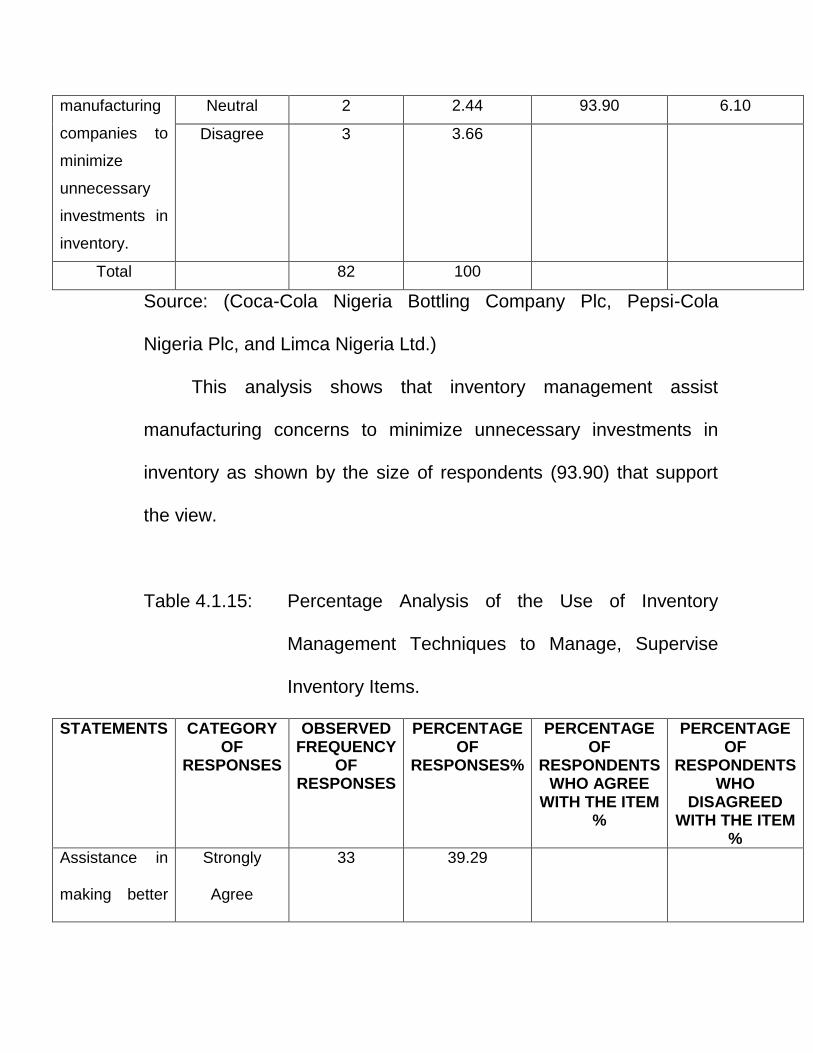
manufacturing
companies to
minimize
unnecessary
investments in
inventory.
Neutral 2 2.44 93.90 6.10
Disagree 3 3.66
Total 82 100
Source: (Coca-Cola Nigeria Bottling Company Plc, Pepsi-Cola
Nigeria Plc, and Limca Nigeria Ltd.)
This analysis shows that inventory management assist
manufacturing concerns to minimize unnecessary investments in
inventory as shown by the size of respondents (93.90) that support
the view.
Table 4.1.15: Percentage Analysis of the Use of Inventory
Management Techniques to Manage, Supervise
Inventory Items.
STATEMENTS CATEGORY OF
RESPONSES
OBSERVED FREQUENCY
OF RESPONSES
PERCENTAGE OF
RESPONSES%
PERCENTAGE OF
RESPONDENTS WHO AGREE
WITH THE ITEM %
PERCENTAGE OF
RESPONDENTS WHO
DISAGREED WITH THE ITEM
%
Assistance in
making better
Strongly
Agree
33 39.29
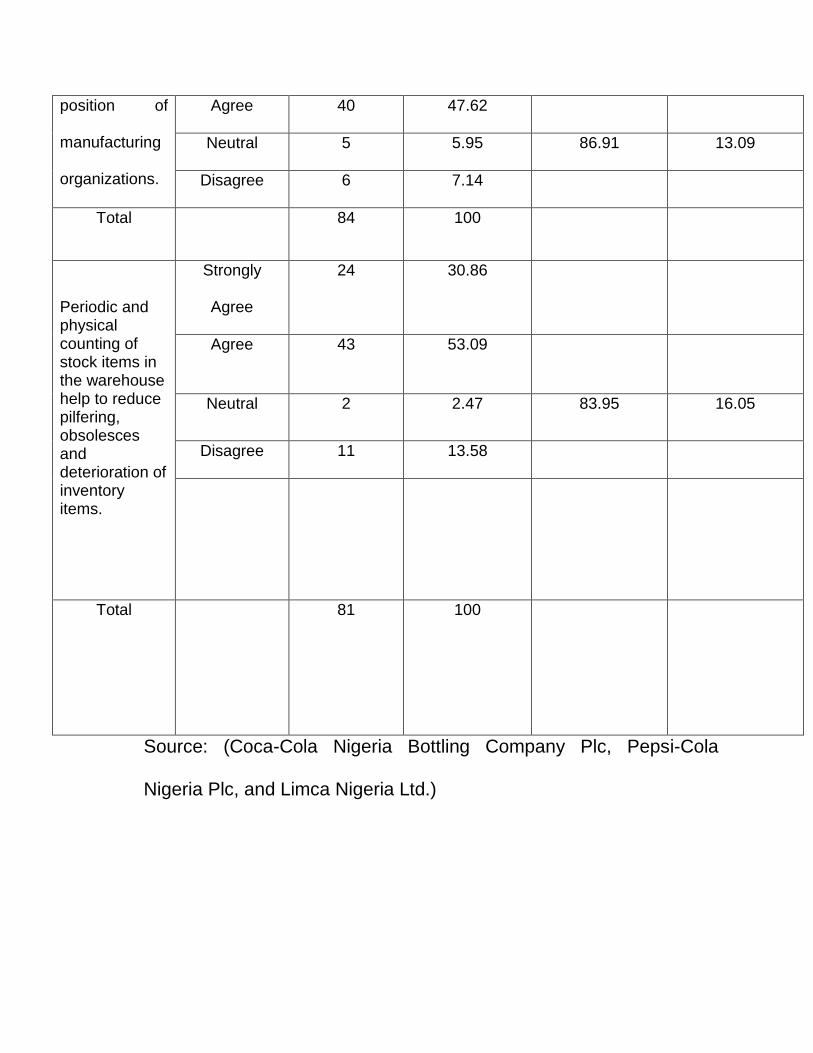
position of
manufacturing
organizations.
Agree 40 47.62
Neutral 5 5.95 86.91 13.09
Disagree 6 7.14
Total 84 100
Periodic and physical counting of stock items in the warehouse help to reduce pilfering, obsolesces and deterioration of inventory items.
Strongly
Agree
24 30.86
Agree 43 53.09
Neutral 2 2.47 83.95 16.05
Disagree 11 13.58
Total
81 100
Source: (Coca-Cola Nigeria Bottling Company Plc, Pepsi-Cola
Nigeria Plc, and Limca Nigeria Ltd.)

Table 4. 1.17
S/N STATEMENTS CATEGORY OF
RESPONSES
OBSERVED FREQUENCY
OF RESPONSES
PERCENTAGE OF
RESPONSES%
PERCENTAGE OF
RESPONDENTS WHO AGREE
WITH THE ITEM %
PERCENTAGE OF
RESPONDENTS WHO
DISAGREED WITH THE ITEM
%
17 Inventory management help to improve the sales of the manufacturing companies
Strongly
disagree
42 51.22
agree 30 36.58 87.80 12.20
Neutral 3 3.66
Disagree 7 8.54
Total 82 100
18 Consumers of manufacturing companies are always happy and satisfied when they are supplied what they needed at the right time
Strongly
disagree
48 57.83
agree 29 34.94 92.77 7.23
Neutral 0 0.00
Disagree 6 7.23

Total
83
19 Suppliers are always willing to supply the raw materials to manufacturing concerns.
Strongly
disagree
20 24.39 87.80 12.20
agree 52 63.41
Neutral 3 3.66
Disagree 7 8.54
Total 82 100
Source: (Coca-Cola Nigeria Bottling Company Plc, Pepsi-Cola
Nigeria Plc, and Limca Nigeria Ltd.)
Table 4.1.15 shows that about 86.91% of the respondents
agreed that inventory management assists to make better the liquidity
position of the manufacturing companies 87.80% also was of the
opinion that it improves the sales of the companies and 92.77%
agreed that it helps to render efficient services to the customers and
87.80% attested to the fact that suppliers of the raw materials do not
fail that the reliability needed of the servers by the clients [the
manufacturing concerns] for some of the models to function efficiently
obtains.

However, some of the respondents disagreed to the above views
e.g. 16.05% believed that inventory management prevent pilfering
and deterioration of inventories while 12.20% believe that sales do
not improve due to efficient inventory management.
4.2. ANALYSIS OF THE ORDERING AND HOLDING COST AS
PERCENTAGE OF THE TOTAL COST.
TABLE 4.2. Percentage Determination of the Ordering and
Holding costs to the Total costs.
YEAR TOTAL COST
ORDERING COST
PERCENTAGE OF TOTAL COST
HOLDING COST
PERCENTAGE TO TOTAL COST
1998 2,486,004 1,231,359 10.51 10.71
1999 1,939,793 907,336 7.74 932,454 7.96
2000 2,160,270 1,132,770 9.67 1,027,500 8.77
2001 2,436,900 1,196,077 10.21 1,240,823 10.58
2002 2,794,050 1,388,353 11.85 1,405,697 12.00
TOTAL 11,717,017 5,855,898 49.98 5,861,119 50.02
Source: (Coca-Cola Nigeria Bottling Company Plc, Pepsi-Cola
Nigeria Plc, and Limca Nigeria Ltd.)

The above percentage analysis of the ordering and holding
costs to the total cost shows that the beverage companies are using
inventory management to administer their inventories. Holding cost is
50.02% while ordering cost is 4949.98% with difference of only 0.04%
with which the holding cost is more. This could be attributed to
human factor in handling the machine set-ups that made the
inventories to linger in the warehouse.
However, the companies are managing their inventories well
and this resulted to reduction of the total cost which in turn helps in
the general performance of the organization as shown in the
responses of 85 respondents of the companies studied.
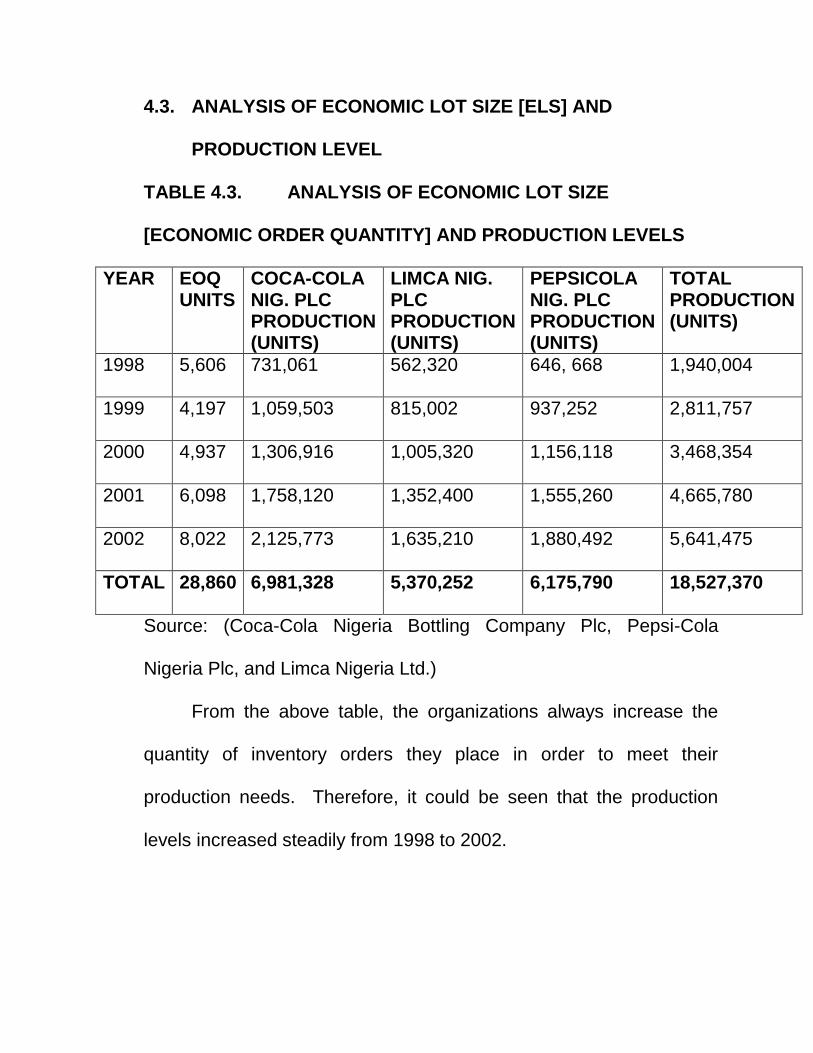
4.3. ANALYSIS OF ECONOMIC LOT SIZE [ELS] AND
PRODUCTION LEVEL
TABLE 4.3. ANALYSIS OF ECONOMIC LOT SIZE
[ECONOMIC ORDER QUANTITY] AND PRODUCTION LEVELS
YEAR EOQ UNITS
COCA-COLA NIG. PLC PRODUCTION (UNITS)
LIMCA NIG. PLC PRODUCTION (UNITS)
PEPSICOLA NIG. PLC PRODUCTION (UNITS)
TOTAL PRODUCTION (UNITS)
1998 5,606 731,061 562,320 646, 668 1,940,004
1999 4,197 1,059,503 815,002 937,252 2,811,757
2000 4,937 1,306,916 1,005,320 1,156,118 3,468,354
2001 6,098 1,758,120 1,352,400 1,555,260 4,665,780
2002 8,022 2,125,773 1,635,210 1,880,492 5,641,475
TOTAL 28,860 6,981,328 5,370,252 6,175,790 18,527,370
Source: (Coca-Cola Nigeria Bottling Company Plc, Pepsi-Cola
Nigeria Plc, and Limca Nigeria Ltd.)
From the above table, the organizations always increase the
quantity of inventory orders they place in order to meet their
production needs. Therefore, it could be seen that the production
levels increased steadily from 1998 to 2002.

This is because the organizations did not allow any production
stoppages resulting have helped them to retain their markets and
their customers’ goodwill’s.
Therefore, with efficient inventory management, production
interruptions and shortage costs resulting from unavailability of raw
materials, idle workers and under –utilization of machine capacities
are avoided.
4.4. ANALYSIS OF CUSTOMER SATISFACTION THORUGH
PRODUCTION AND SALES LEVELS
TABLE 4.4. PRODUCTION AND SALES LEVELS OF THE
ORGANIZATION OF STUDY
YEAR PRODUCTION (UNITS)
SALES (NAIRA)
1998 1,940,004 1,688,051
1999 2,811,757 3,330,340
2000 3,368,354 3,682,351
2001 4,665,780 3,904,684
2002 5,641,475 6,890,806
TOTAL 18,527,370 19,496,232
Source: (Coca-Cola Nigeria Bottling Company Plc, Pepsi-Cola
Nigeria Plc, and Limca Nigeria Ltd.)
The table above shows the levels of production and sales of the
beverage companies studied [Coca-Cola Plc, Pepsi Cola Plc, and
Limca Plc]. The outputs of production show that production has been

constantly on the increase since 1998 to 2002. This shows that the
demand of the customers had been taking seriously in order to render
excellent services to them.
The above observation is supported by the level of sales that
has also remained steady since 1998, for instance, in 1998, the total
sales was N1,688,051 while in 2002, total sales was N6,890,806
difference of N5,202,755.
Therefore, it could be concluded here that the customers
patronage of the companies product is a mark of satisfaction they
receive from the services rendered to them and also for the products
sold to them.

4.5. ANALYSIS OF CUSTOMER SATISFACTION THORUGH
PRODUCTION AND SALES LEVELS
TABLE 4.5 ANALYSIS OF COST MINIMIZATION BY THE USE OF
ECONOMIC LOT SIZE [ECONOMIC ORDER QUANTITY]
TABLE 4.5 EOQ AND INVENTORY COS TFOR THE FIVE YEARS
PERIOD
YEAR EOQ (UNITS)
ORDERING COST N
HOLDING COST N
TOTAL COST N
1998 5,606 5,606 1,254,645 2,486,004
1999 4,197 4,197 932,454 1,839,793
2000 4,947 4,947 1,027,500 2,160,270
2001 6,098 6,098 1,240,823 2,436,900
2002 8,022 8,022 1,405,697 2,794,050
TOTAL 28,860 28,860 5,861,119 11,717,017
Source: (Coca-Cola Nigeria Bottling Company Plc, Pepsi-Cola
Nigeria Plc, and Limca Nigeria Ltd.)
The table above shows the total cost of inventories of raw
materials incurred by the companies studied. This cost is divided into
ordering and holding cost. From the table above, using the Economic
Lot Size quantities of inventories had helped the companies much in
minimizing the costs incurred in procuring inventories.
If these organizations had used other levels of inventories
instead of the EOQ units above, the cost of inventories could have
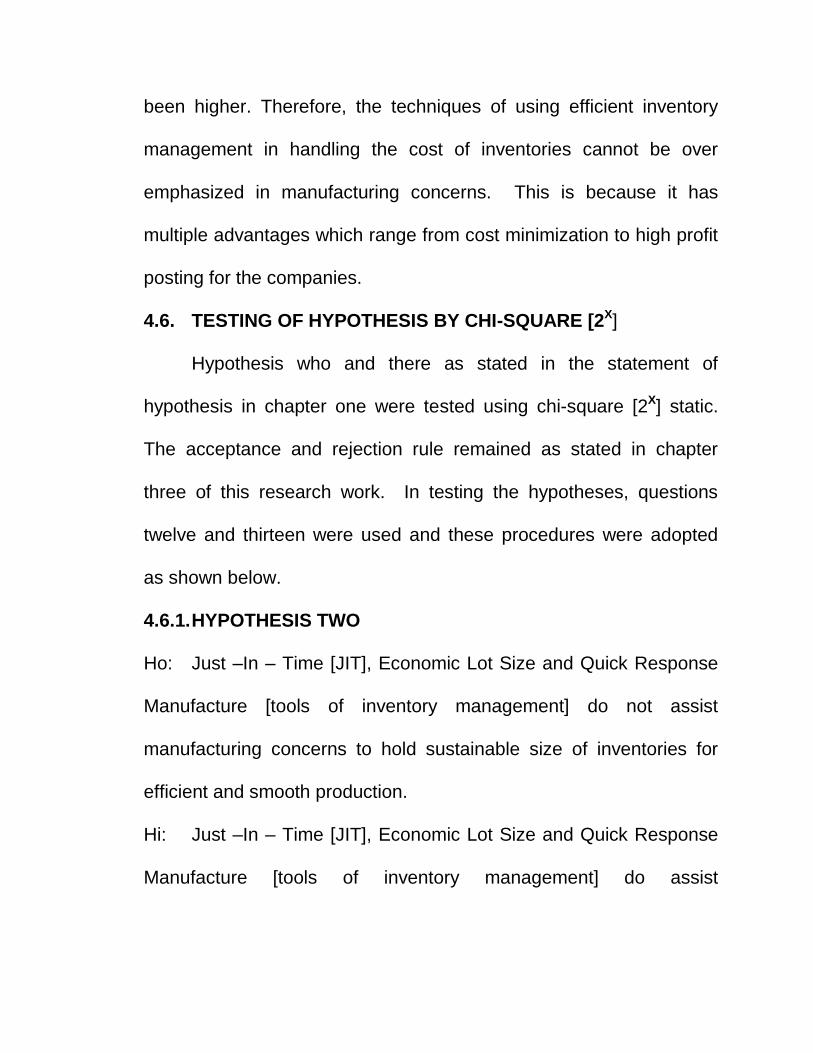
been higher. Therefore, the techniques of using efficient inventory
management in handling the cost of inventories cannot be over
emphasized in manufacturing concerns. This is because it has
multiple advantages which range from cost minimization to high profit
posting for the companies.
4.6. TESTING OF HYPOTHESIS BY CHI-SQUARE [2X]
Hypothesis who and there as stated in the statement of
hypothesis in chapter one were tested using chi-square [2X] static.
The acceptance and rejection rule remained as stated in chapter
three of this research work. In testing the hypotheses, questions
twelve and thirteen were used and these procedures were adopted
as shown below.
4.6.1. HYPOTHESIS TWO
Ho: Just –In – Time [JIT], Economic Lot Size and Quick Response
Manufacture [tools of inventory management] do not assist
manufacturing concerns to hold sustainable size of inventories for
efficient and smooth production.
Hi: Just –In – Time [JIT], Economic Lot Size and Quick Response
Manufacture [tools of inventory management] do assist
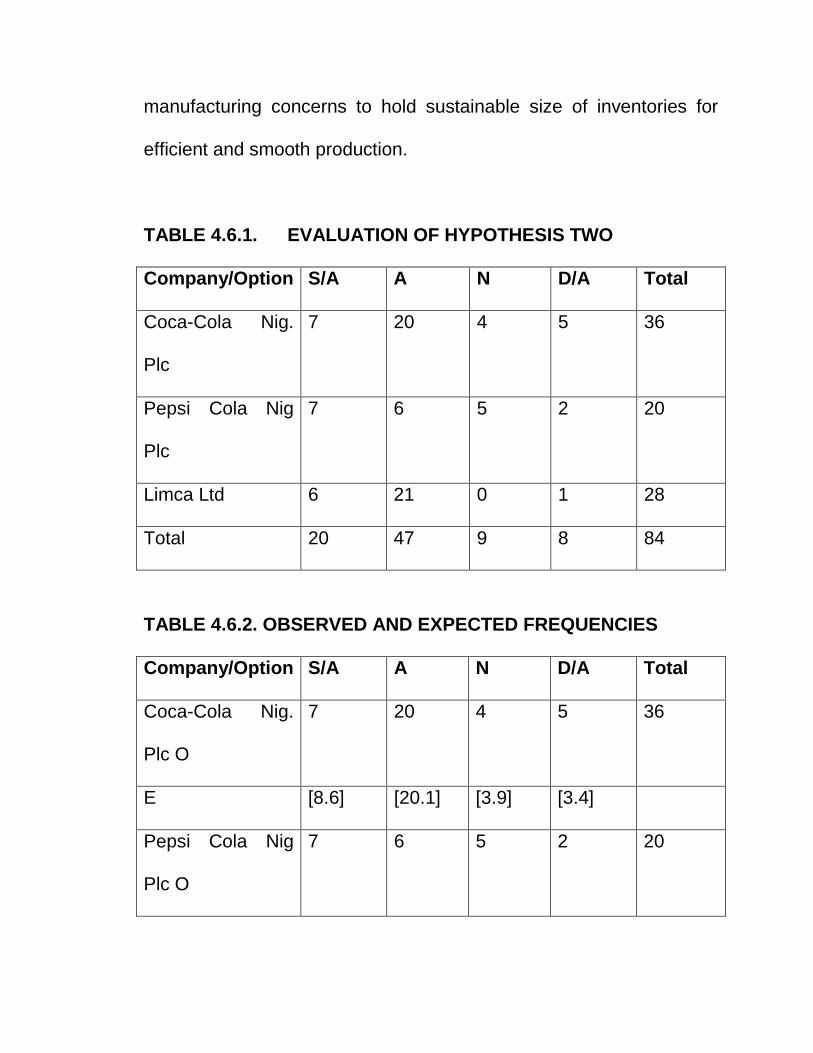
manufacturing concerns to hold sustainable size of inventories for
efficient and smooth production.
TABLE 4.6.1. EVALUATION OF HYPOTHESIS TWO
Company/Option S/A A N D/A Total
Coca-Cola Nig.
Plc
7 20 4 5 36
Pepsi Cola Nig
Plc
7 6 5 2 20
Limca Ltd 6 21 0 1 28
Total 20 47 9 8 84
TABLE 4.6.2. OBSERVED AND EXPECTED FREQUENCIES
Company/Option S/A A N D/A Total
Coca-Cola Nig.
Plc O
7 20 4 5 36
E [8.6] [20.1] [3.9] [3.4]
Pepsi Cola Nig
Plc O
7 6 5 2 20

E [4.8] [11.2] [2.1] [1.9]
Limca Ltd O 6 21 0 1 28
E [6.6] [15.7] [3.0] [2.7]
Total 20 47 6 8 84
Where S/A = Strongly agree, A = agree, N = Neutral, D/A = Disagree.
According to Nwabuokei [1986:272
Expected frequency [E] = Row total x column total Overall total
Therefore, the above expected frequencies were computed
using the above formula. The expected frequencies were enclosed in
bracket while the observed frequencies as in table 4.6.1 were also
shown.
In order to calculate the chi-square [X2] the formula:
X2 = Σ(O-E)2
E
Where O = Observed frequencies
E = Expected frequency
X2 = Chi- square
Σ = Summation
Substituting in X2 = Σ(O-E)2 table 4.6.3. was got. E

TABLE 4.6.3. X2 COMPUTATION
O E O-E (O-E)2 X2 = Σ(O-E)2
E
7 8.6 1.6 2.56 0.30
20 20.1 0.1 0.01 0.00
4 3.9 0.1 0.01 0.00
5 3.4 1.6 2.56 0.75
7 4.8 2.2 4.84 1.01
6 11.2 5.2 27.04 2.41
5 2.1 2.9 8.41 4.00
2 1.9 0.1 0.01 0.01
6 6.6 0.60 0.36 0.05
21 15.7 5.3 28.09 0.79
0 3.0 3.0 9.00 3.0
1 2.7 1.7 2.89 1.07
Total 84 X2 Cal. = 14.39
4.6.2. Determination of Tabulated Chi-square (X2)
The tabulated Chi-square (X2) is determined thus: Alpha [ ]
value = 5% or 0.05. According to Nwabuokei P.O.
[1986:273].
The number of degree of freedom in a contingency table is
determined by the formula [r-1][k-1].
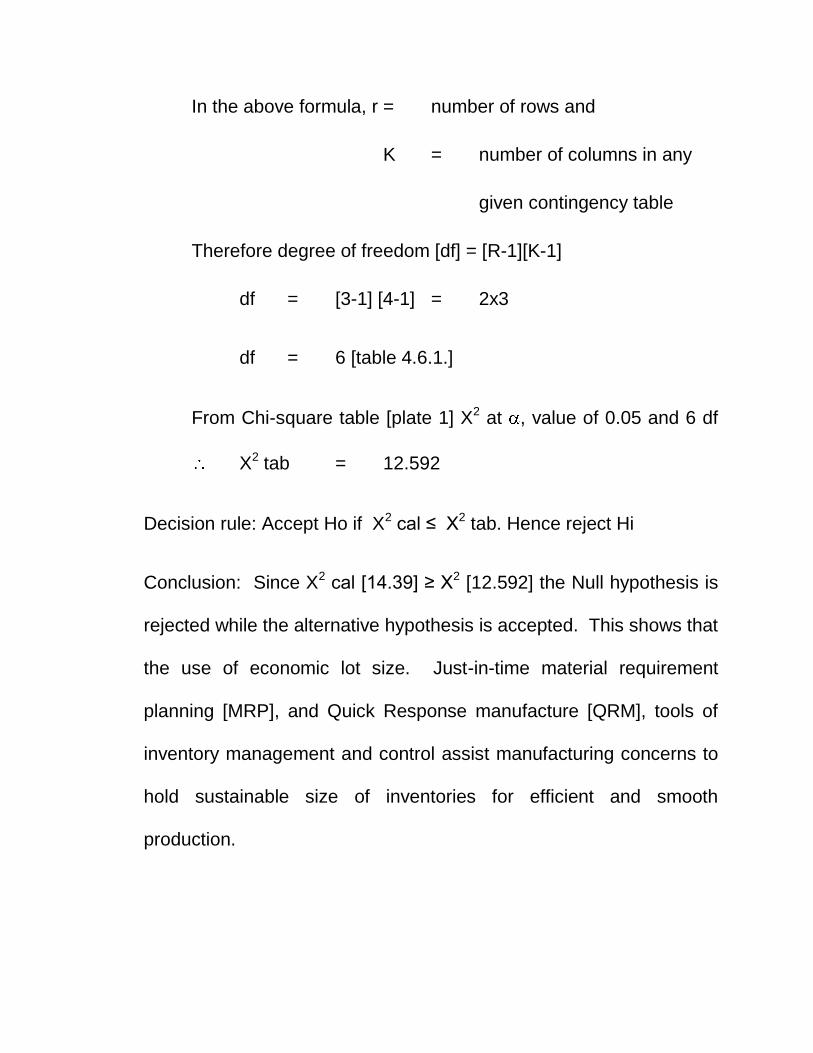
In the above formula, r = number of rows and
K = number of columns in any
given contingency table
Therefore degree of freedom [df] = [R-1][K-1]
df = [3-1] [4-1] = 2x3
df = 6 [table 4.6.1.]
From Chi-square table [plate 1] X2 at , value of 0.05 and 6 df
X2 tab = 12.592
Decision rule: Accept Ho if X2 cal ≤ X2 tab. Hence reject Hi
Conclusion: Since X2 cal [14.39] ≥ X2 [12.592] the Null hypothesis is
rejected while the alternative hypothesis is accepted. This shows that
the use of economic lot size. Just-in-time material requirement
planning [MRP], and Quick Response manufacture [QRM], tools of
inventory management and control assist manufacturing concerns to
hold sustainable size of inventories for efficient and smooth
production.

4.6.3. HYPOTHESIS THREE TESTING
Ho: Economic Lot Size [ELS], Just-In-Time [JOT], Material
Requirement Planning [MRP] and Quick Response
manufacture [QRM], tools of inventory management do not help
manufacturing concerns to maximize profit.
Hi: Economic Lot Size [ELS], Just-In-Time [JOT], Material
Requirement Planning [MRP] and Quick Response
manufacture [QRM], tools of inventory management do help
manufacturing concerns to maximize profit.
TABLE 4.6.4 EVALUATION OF HYPOTHESIS THREE
Company/Option S/A A N D/A Total
Coca-Cola Nig.
Plc O
16 9 0 4 29
Pepsi Cola Nig
Plc O
12 7 4 0 23
Limca Ltd O 14 12 0 6 32
Total 42 28 4 10 84

TABLE 4.6.5: OBSERVED AND EXPECTED FREQUENCIES
Company/Option S/A A N D/A Total
Coca-Cola Nig.
Plc O
16 9 0 4
E [14.50] [9.6] [1.4] [3.5] 29
Pepsi Cola Nig
Plc O
12 7 4 0
E [11.50] [7.7] [1.10] [2.7] 23
Limca Ltd O 14 12 0 6 32
E [16.00] [10.70] [1.50] [3.8] 32
Total 42 28 4 10 84
TABLE 4.6.3. X2 COMPUTATION
O E O-E (O-E)2 X2 = Σ(O-E)2
E
16 14.50 1.50 2.25 0.16
9 9.60 -0.40 0.16 0.02
0 1.40 -1.40 1.96 1.40
4 3.50 0.50 0.25 0.07
12 11.50 0.50 0.25 0.02
7 7.70 -0.70 0.49 0.07
4 1.10 2.90 8.41 7.65
0 2.70 -2.70 7.29 2.70
14 16.00 -2.00 4.00 0.25
12 10.70 1.30 1.69 0.16
0 1.50 -1.50 2.25 1.50
6 3.80 2.20 4.48 1.04
Total 84 X2 Cal. = 15.04

4.6.4. Determination of tabulated Chi-square [X2] using alpha level of
0.05 and 6 df, the tabulated X2 = 12.592 [Refer to plate 1 for
Chi-square table.
Decision rule: Accept Ho if X2 tab, hence reject Hi but X2 cal.
15.05 ≥ X2 tab 12.592
Conclusion: since, the X2 calculated is greater than X2 tabulated
[15.04 ≥ 12.592], the null hypothesis is rejected and the alternative
hypothesis is accepted. This confirms the assertion that the use of
Just-In-Time [JIT] Economic Lot Size [ELS] and Quick Response
manufacture [QRM] tools of inventory management help
manufacturing concerns to maximize their profits.
4.7. MEASUREMENT OF LINEAR CORRELATION
4.7.1. Correlation Co-efficient [r]
Correlation coefficient measures the degree of co-variability of
tow or more variables. It is this measurement of the degree of
correlation or relationship that is used to test the first hypothesis
stated in chapter one of this work. This correlation statistic is used to
test the relationship between economic lot sizes or economic order
quantities [X] and their associated costs [Y].

In carrying out this test, correlation co-efficient must be
explained further for easy assimilation. It assumes values that vary
from – 1 to +1. When correlation co-efficient [r] is positive X and Y
move in the same direction, that is they tend to increase or decrease
together. Correlation co-efficient when negative, X and Y change in
opposite directions, that X increase while Y decreases and vice
verse.
Therefore, if correlation co-efficient [r], after computation has
values between -1 and +1, the alternative hypothesis is accepted,
showing that manufacturing concerns maximize costs of inventories
by the use of economic lot size while the null hypothesis will be
rejected.
4.7.2. HYPOTHESIS ONE TESTING
Ho: Manufacturing concerns do not minimize cost of inventories
through the use of economic lot sizes. [Economic order quantities].
Hi: Manufacturing concerns do minimize cost of inventories
through the use of economic lot sizes. [Economic order quantities].

4.7.3. COMPUTATION OF CORRELATION CO-EFFICIENT [r]
In order to compute the value of correlation co-efficient [r], this
mathematical formula is used.
r = nΣxy- ΣxΣy √(nΣX2) – (ΣX)2 (nΣY2) – (ΣY)2 where n = the number of years X = the economic lot sizes Y = total cost of inventories for each year ΣXY = summation of the production X and Y ΣX = Summation of X ΣY = Correlation co-efficient TABLE 4.7.1. Below is used to determine the value of each of
the elements in the formula above
Year Economic
lot size
UNITS
Total cost
[Y] N
[000]
Xy X2 Y2
1998 5,606 2,486,004 13,936,516.00 31,427,236 6180196
1999 4,197 1,839.793 7,721598.63 17614809 3384827.24
2000 4,397 2,160.270 19,665,252.99 2437396.90 4666766.74
2001 6,098 2,436,900 14,860,216.20 37185604 5,938481.61
2002 8,022 2,794,050 22,413,869.10 64352484 780615.40
Total 28,860 11,717.01 69,597,452.92 174917529.90 27,976986.99

Substituting in the expression r = nΣxy- ΣxΣy √(nΣX2) – (ΣX)2 (nΣY2) – (ΣY)2
r= 5(69,597,452.92) – (28,860) (11,717.01)
√(5(174,917,592.90) – (288602) (5(27976986.99)– 11717.02)2
r = 347987,264.60 – 338152908.60
√(41,688,049.50) (2,596,611.70
r = 9834456
(6456.63) (1611.40)
r = 9,834356 10,404213.58 r = 0.95(2.d.p) The result of r = 0.95 shows that there is high
relationship between economic lot size (economic order quantity) and
costs of inventories. Hence, the result proves the alternative
hypothesis valid and is thus accepted. The acceptance shows that
manufacturing concerns use efficient inventory management
techniques to minimize the cost of their inventories.

4.7.4. CO-EFFICIENT OF DETERMINATION [R2]
Co-efficient oaf determination [R2] estimates the amount of
variance or change in dependent variable [Y] which is explained by
the change in the independent variable, [X] here it shows the
proportion of change in costs [Y] that can be explained by the
economic lot sizes [economic order quantity], [X].
4.7.5. COMPUTATION OF CO-EFFICIENT OF DETERMINATION [R2]
Table 4.7.3. was used for this computation the formula shown below is used. R2 aΣY+bΣXY – n(Y)2
(ΣY2) - n(Y)2
R2 958.12(11717.01)+0.24(69,597452.92)-5(2343.40)2 27976986.99 - 5(2,343.40)2
R2 = 11226301.62 16703388.70 – 2745615.80 27976986.99 – 27,457,617.80
R2 = 27929690.32 - 27457617.80 27976986.99 – 27457617.80
R2 = 472072.52 519369.19
R2 = 0.91 or 91%
The result of R2 = 91% shows that 91% of total variation of cost
of inventories [y] of the manufacturing concerns were explained by its
relationship with the use of economic lot size [X]. The remaining 9%
can be attributed to other factors [chance].
4.7.6. REGRESSION ANALYSIS
Regression analysis is designed to reveal the true relationship
connecting variables together. So, that the nature and extent of their
relationship can easily be seen. In this analysis, the researcher
seeks to find the relationship between Economic Lot Size [order
quantity], X which is the independent variable and the cost of
inventories (Y) which is the independent variable. Economic order
quantity or lot size is that quantity of inventory procured by
manufacturing concerns that minimizes the costs of ordering and
holding inventories. Costs of inventories and holding them in the
warehouse until such inventories are used in the production process.
The regression equation that comments the two variables, X
and Y is shown thus:

Y = a + bx
Where a = Y-intercept or constant
b = regression coefficient of Y on X [the
slope of Y on X]
y = cost of inventories
x = economic order quantities
4.7.7. REGRESSION EQUATION
This is a simple linear equation, as stated before, b represents
the regression co-efficient, which can be calculated with the formula:
Where b = nΣxy - ΣXΣY (nΣX2) - (ΣX)2
a = Y-bx
Where Y and X are the means of Y and X respectively
b = the slope of the line of[regression co-efficient
of Y on X]
a = constant [representing the Y intercept] n = number of years Σ = summation TABLE 4.7.3 REGRESSION ANALYSIS
Year Economic Total cost Xy X2 Y2
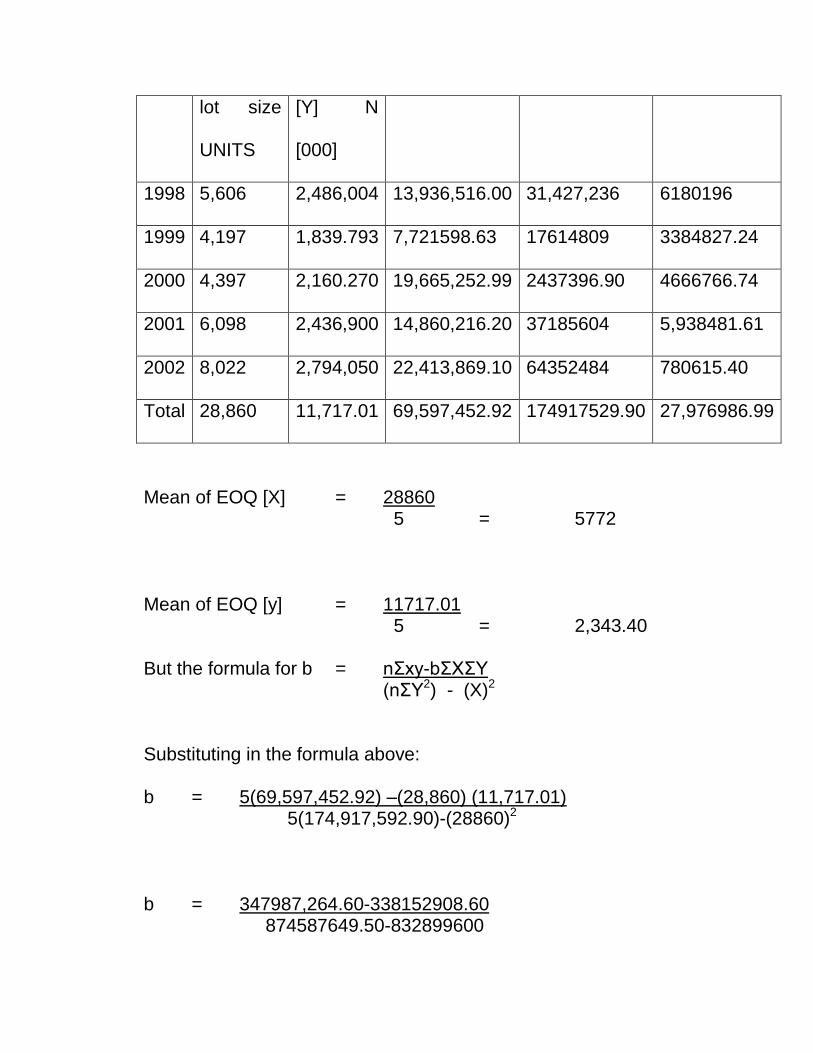
lot size
UNITS
[Y] N
[000]
1998 5,606 2,486,004 13,936,516.00 31,427,236 6180196
1999 4,197 1,839.793 7,721598.63 17614809 3384827.24
2000 4,397 2,160.270 19,665,252.99 2437396.90 4666766.74
2001 6,098 2,436,900 14,860,216.20 37185604 5,938481.61
2002 8,022 2,794,050 22,413,869.10 64352484 780615.40
Total 28,860 11,717.01 69,597,452.92 174917529.90 27,976986.99
Mean of EOQ [X] = 28860 5 = 5772
Mean of EOQ [y] = 11717.01 5 = 2,343.40 But the formula for b = nΣxy-bΣXΣY
(nΣY2) - (X)2
Substituting in the formula above:
b = 5(69,597,452.92) –(28,860) (11,717.01) 5(174,917,592.90)-(28860)2
b = 347987,264.60-338152908.60 874587649.50-832899600

b = 983456 41688049.50 = 0.24
The formula for obtaining [a] is thus a = y-bx substituting in the
above formula
a = 2,343.40 – 0.24(5,772)
a = 2343.40 – 1385.28
a = 958.12
Substituting in the regression analysis formula
y = a + bx
y = 958.12 + 0.24x
The equation, y = 958.12 + 0.24 x regresses y on x a(that is
cost on EOQ). The result shows that when there is no application of
efficient inventory management by the manufacturing concerns in
handling the cost of their inventories that total cost of inventory will
increase by N958.12 x 1,000 which isN958.120 per annum. The cost
value of N958.12 also shows that if the cost and EOQ are
represented on the graph, the curve will cut the y-axis at a point of
N958.12 above the origin.
Furthermore, the most essential thing is the minimization of
cost that is attributable to the use of inventory management, which is

0.24 [coefficient of regression]. This means that the total cost of
inventories of what it used to be when inventory management
techniques was not used. In other words, with an increase of 1000
units in inventory, cost will only increase by an average of N240.
Therefore, manufacturing organizations stand to gain more in
terms of profitability and expansion by minimization of cost invented
in inventories by the use of inventory management.
4.7.8. REGRESSION GRAPH
The regression graph shows the relationship between
economic lot size [economic order quantity] [X] and cost of
inventories [Y] on a graph. This is done by determining values of at
certain given value of X using the regression formula: Y = a+bx
assuming the value of Y is needed to be extrapolated at the following
values of X: 1500,2500,3500 units respectively. The above formula Y
= a+bx will be used thus”
Given that a = 958.12
b = 0.24 [from previous calculation]
Y1 = 958.12 + 0.24 [1500]
= 958.12 +360

= 1318.12
Y2 = 958.12 + 0.24 [2500]
= 958.12 + 600
= 1,558.12
Y3 = 958.12 + 0.24 [3500]
= 958.12 + 840
= 1,798.12
representing the above three levels of EOQ and their
extrapolated total costs on a graph, we would have:
Total
3500

3000
2500
2000
Cost (N) 1500
1000
500
0
1500 2500 3500
Figure 4.7.1: Regression graph of Total cost [Y] against economic order quantity [EOQ] [X]
Scale: 2cm = 500 units on x axis
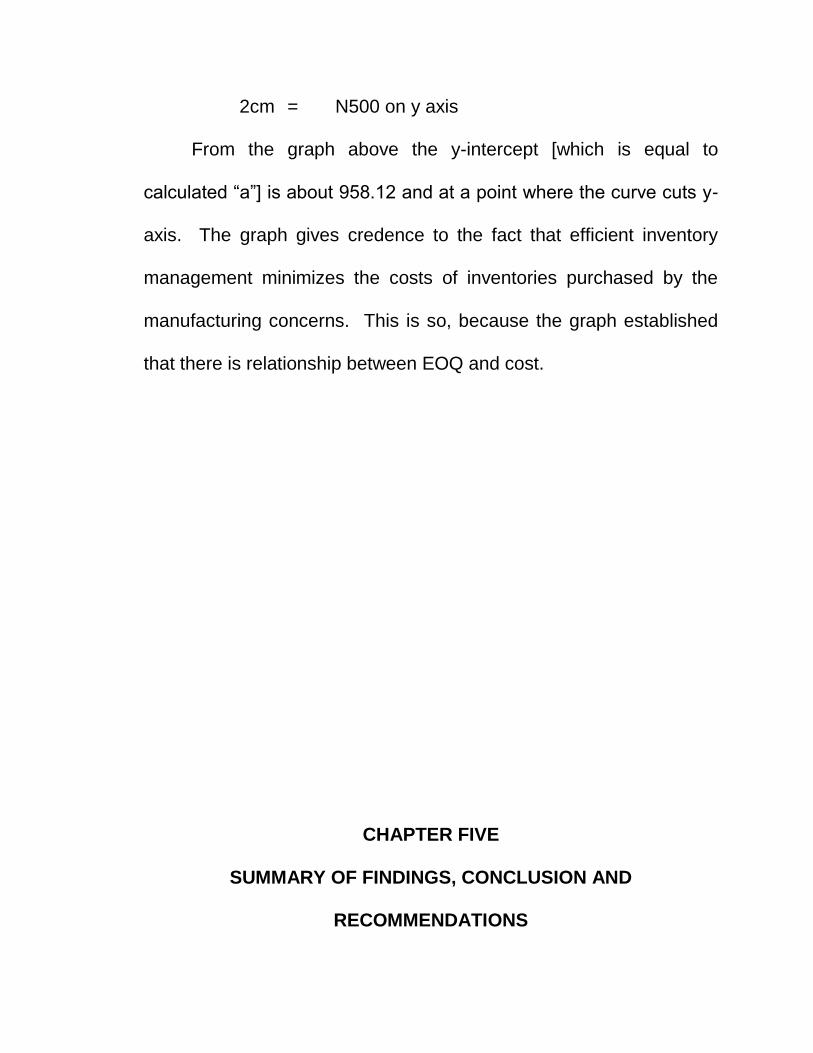
2cm = N500 on y axis
From the graph above the y-intercept [which is equal to
calculated “a”] is about 958.12 and at a point where the curve cuts y-
axis. The graph gives credence to the fact that efficient inventory
management minimizes the costs of inventories purchased by the
manufacturing concerns. This is so, because the graph established
that there is relationship between EOQ and cost.
CHAPTER FIVE
SUMMARY OF FINDINGS, CONCLUSION AND
RECOMMENDATIONS

5.1 SUMMARY OF FINDINGS
The research actually revealed the following findings:
(a) The companies maximized their profits through more sales and
cost reduction due to the use of efficient inventory management
techniques.
(b) The inventory models help the companies to maintain hitch-free
production and thereby remove all process wastes by making
inventories of raw materials to be available at all time.
(c) That inventory is one of the most essential assets of
manufacturing concerns and a lot of capital is invested in it.
(d) Inventory management models are used by manufacturing
concerns and they order for their raw materials inventories at
the right time, reduce costs of their inventories and improve on
the liquidity position of their establishments.
(e) A coefficient correlation of 95% or 0.95 indicates a strong
positive correlation between Economic Order Quantity (EOQ)
and cost of inventories. This shows that EOQ and other
inventory management models assists the concerns reduce
their cost of investment in inventories.
(f) The customers of the organizations patronize them very well
due to the nature of service rendered to them as there was no
report of out of stock syndrome.
(g) The employees always receive high salaries and promotions,
shareholders receive high dividends and increase in their share
prices due to efficient management of using the inventory
management tool.
5.2 CONCLUSION
Inventory management has really assisted manufacturing
concerns in coordinating their inventories and their overall
performance.
The organizations have put on record reduction of cost of their
inventories and that of production thereby increasing their total
revenues and general profitability. As a result of this, the
organizations pay high dividends to their shareholders and cause
imperative prices of their shares at the stock exchange market,
thereby attracting more potential investors to themselves.
The establishments have built strong customer patronage due
to the nature of services they provide to them because production is
always smooth and hitch free. This results to high contribution margin
to the establishments and no cases of losing the customers to fellow
competitors.
Thorough supervision of the inventories in the warehouse has
been achieved and cases of pilfering of stock items and lack of
accurate date for forecast are things of the past. This has made for
safety of the stock items and removal of obsolescence.
Also, it is established that there is strong relationship between
inventory model of economic order quantity and cost reduction. And
manufacturing concerns have used it to minimize their costs and
maximize their profits.
Again, efficient inventory management has enabled the
concerns to know when to order for the replenishment of their stocks
and the right quantity to order. This has helped them to overcome the
issue of over-stocking or under-stocking of inventories in their
warehouses with its attendants costs implications.
The organization have done well in the area of social
responsibilities as they support sports competitions, award
scholarships and educational endowments and construct roads in the
areas of operation. They also provide employment opportunities to

citizens of Nigeria. All these are due to the use of effective tools of
inventory management to manage their key asset inventories of their
organizations.
5.3 RECOMMENDATIONS
This research work has revealed that a lot of gains accrue from
efficient inventory management by the manufacturing companies in
Nigeria. However, the manufacturing concerns will perform better and
compete effectively with their foreign counterparts in this era of
globalization and internationalization if the following
recommendations are put into consideration:
(a) Manufacturing companies in Nigeria should map out fund for
research works both in the areas of manufacture and other
sectors of the economy.
(b) All staff of the manufacturing concerns should be made to have
the thorough knowledge of inventory management as this will
enable them to work towards their stock protection and cost
minimization.

(c) There should be adequate study and understanding of the
holding cost by all the staff of manufacturing companies
handling inventories so, as to keep watch over it all the times.
(d) The organizations on their own should stop being too secretive
in releasing their information that would support meaningful
research works in manufacturing industry.
(e) Manufacturing concerns should get the recent developed
software on inventory management so as to update their
knowledge of inventory management on a regular basis.

BIBLIOGRAPHY
JOURNALS Loyd, C.H and Rosenfield, P. (1979). Solvency, the Forgetter: Half of
Financial Reporting, American Journal of Accountancy 10, 48 – 54.
NEWSPAPERS/NEWS MAGAZINES
India Express Newspaper (Bombay) Ltd. Maintaining Profitability
Through Controlled Inventories. www.expressindia.com/fe/daily/i9980828/39555504.8 Feb.
1998. P.3 Microsoft Business Solution. Can Customers be Satisfied Using
Efficient Inventory Management? www.google.com/search?Q=cache:4dhrmbi.13 March, 2003 P. 2
TEXTBOOKS Akpala, A. (1987), Management Search for Nigeria Ama, G.A.N. (2001), Management and Cost Accounting: Current Theory and Practice. Amsson Publishers, Aba Ama, G.A.N. (2001), Management and Cost Accounting Anigbo, L.C. (1997), Research Design. In Eze, A.E., Umebe S.E.,
And Ezike, H.O. (Eds, 1997). Foundations of Research in Education. Rojoint Communications Ltd. Enugu.
Asika. N. (1991). “Research Methodology in the Behavioral Science”.
Longman Publishers Plc. Ikeja Lagos. Behavioral Sciences. Longman. Lagos.
Copelan, R.M and Dascher, P.E. (1979), Management Accounting.
2nd ed., In: Nweze (2000), Profit Planning: A Quantitative Approach. M’cal Communication International, Enugu.
Current Theory and Practice, Aba: Amasoa Financial Perspective, www.stares.demon.co.uk/TheoryandConcepts/Beyound-jit.htm.
Freund John, and Williams Frank J. (1979), “Modern Business
Statistics 2nd Ed. Pitman Ltd, London. Hilton, R.W. (1994), Management Accounting: McGraw Hill Inc. USA Horgren, T.C and Sundren, G. (1990). Introduction to Management
Accounting. 8 Ed. Prentice Hall Inc. USA. Horgren, T.C and Sundren, G. (1990). Introduction to Management
Accounting. 8 Edition.
CAN Distance Learning (1999), Management Accounting (PEI) Study and Progress Text. Accountancy Training and Publication Ltd. Lagos. In Nigeria. Unique Press Limited, Aba.
Joseph, D. (2002), Just-In-Time Inventory: A Financial Perspective, www.stares.demon.co.uk/Theroyandconcepts/beyoundjit.htm Lucey, T. (1989), Costing. DP Publication Ltd. London. Nwabuokei, P.O. (1986), Fundamentals of Statistics, Koruna Books
Enugu. Nweze, A.U (2001), Quantitative Approach to Management
Accounting. Computrer Edge Publishers, Enugu. Okafor, F.O (1983), Investment Decisions: Evaluation of Project and
Securities. Cassel Ltd. London. Onuoha, B.C. (1991), Fundamentals of Business Management in Nigeria. Unique Press Ltd. Aba. Pandy, I.M. (1988), Financial Management. Vikas Publishing House
Pvt. Ltd. New Delhi. Ranjan. K. (1976), A manual of Sampling Technique. Heinemann,
London System (unpublished). In: Onuoha, B.C.
Taro, Y. (1964), Statistics: An Introductory Analysis. 3rd Edition.
Harper and Row Publishers, New York. Udo, G.O. (2004), A Guide to Modern Research Methods. Institute of
Development Studies, University of Nigeria, Enugu Campus. Prentice Hall Inc. USA.

School of Post Graduate Studies Department of Accountancy,
University of Nigeria, Enugu Campus.
Dear Sir/Madam,
RESEARCH QUESTIONNAIRES
I am a Masters Degree Student of Accountancy in the above
university. This questionnaire is meant to help me complete a
research I am conducting on the topic: “Evaluation of the
Usefulness of Inventory Management in Manufacturing
Concerns”: A study of some selected beverage companies in
Nigeria.
This research is in partial fulfillment of the requirements for the
award of Master’s Degree (MBA) in Accounting. The choice of your
organization is in recognition of its large inventory usage, which is
purely the area of this research work.
This research does not have any espionage undertone but
purely for academic purpose. I promise that any information obtained
in this questionnaire will be treated with utmost confidentiality.
Thanks for your cooperation.
Yours faithfully,
Ogbu Ogbonnaya B.
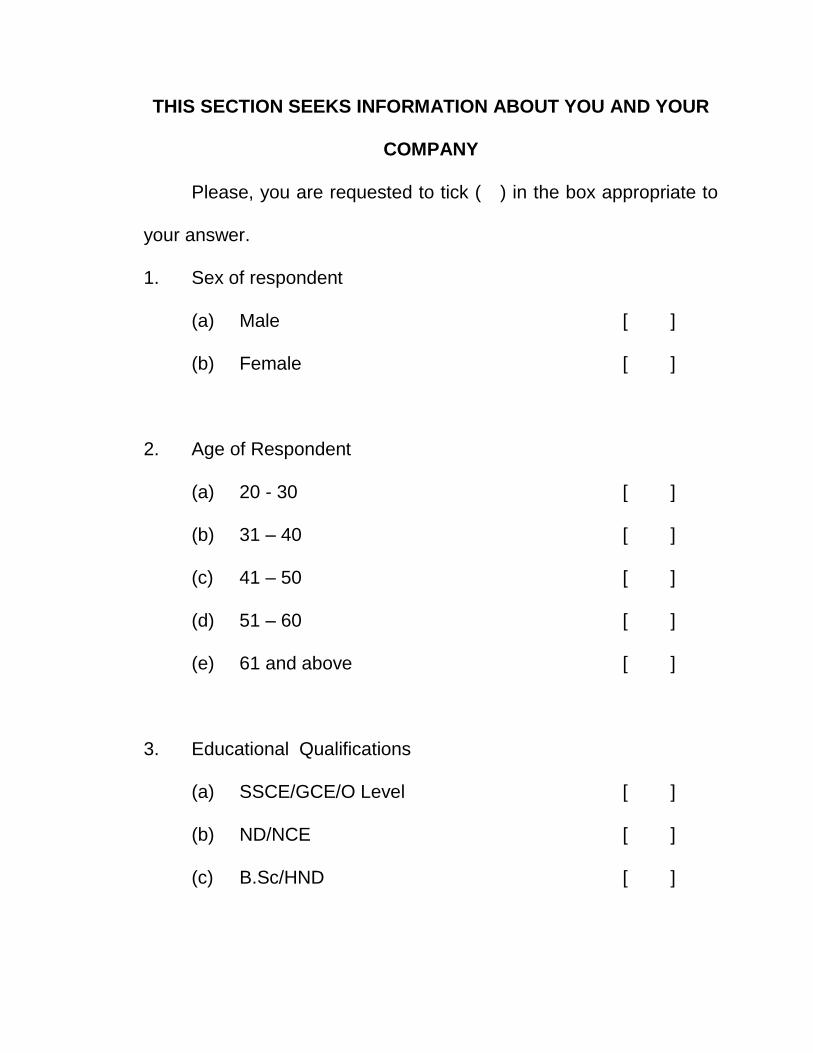
THIS SECTION SEEKS INFORMATION ABOUT YOU AND YOUR
COMPANY
Please, you are requested to tick ( ) in the box appropriate to
your answer.
1. Sex of respondent
(a) Male [ ]
(b) Female [ ]
2. Age of Respondent
(a) 20 - 30 [ ]
(b) 31 – 40 [ ]
(c) 41 – 50 [ ]
(d) 51 – 60 [ ]
(e) 61 and above [ ]
3. Educational Qualifications
(a) SSCE/GCE/O Level [ ]
(b) ND/NCE [ ]
(c) B.Sc/HND [ ]

(d) Masters Degree and Above [ ]
5. Which of the following do you belong?
(a) Personnel Official/Staff [ ]
(b) Production Official/Staff [ ]
(c) Sales Official/Staff [ ]
(d) Accounts Official/Staff [ ]
6. Position:
(a) Junior/Intermediate Staff [ ]
(b) Management Staff [ ]
(c) Senior Staff [ ]
(d) Others [ ]
QUESTION STRONGLY
AGREED
AGREED NEUTRAL DISAGREED
Manufacturing
organization
use stock or
inventory in
their
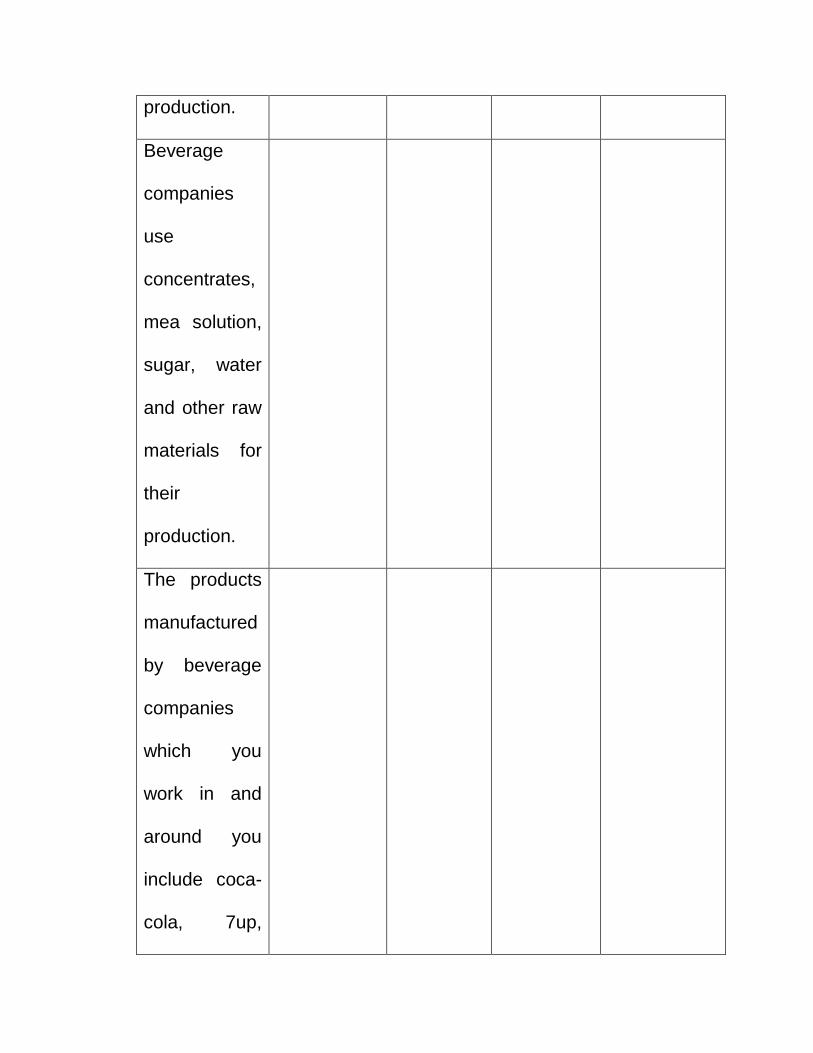
production.
Beverage
companies
use
concentrates,
mea solution,
sugar, water
and other raw
materials for
their
production.
The products
manufactured
by beverage
companies
which you
work in and
around you
include coca-
cola, 7up,
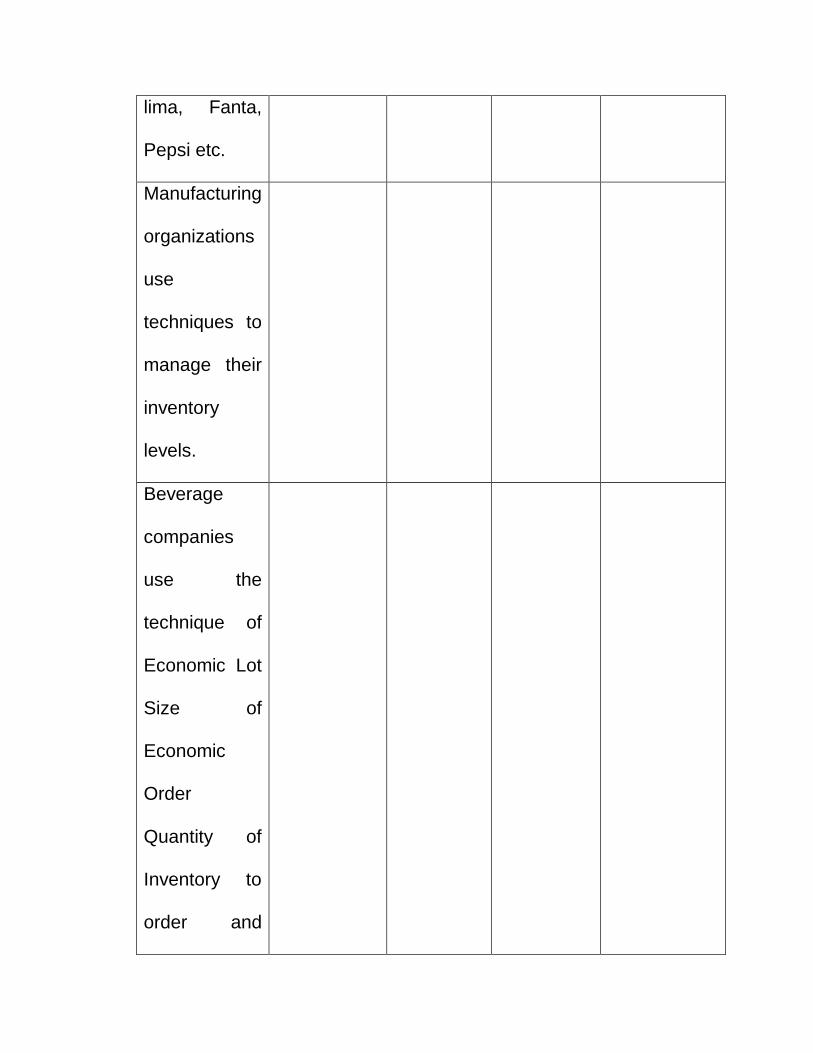
lima, Fanta,
Pepsi etc.
Manufacturing
organizations
use
techniques to
manage their
inventory
levels.
Beverage
companies
use the
technique of
Economic Lot
Size of
Economic
Order
Quantity of
Inventory to
order and

when to do
so.
The use of
Economic Lot
Size
(Economic
Order
Quantities)
minimizes the
cost income.
The use of
just-in-time
(JIT),
Economic Lot
Size (ELS)
and Quick
Response
Manufacture
(QRM) tools
of inventory
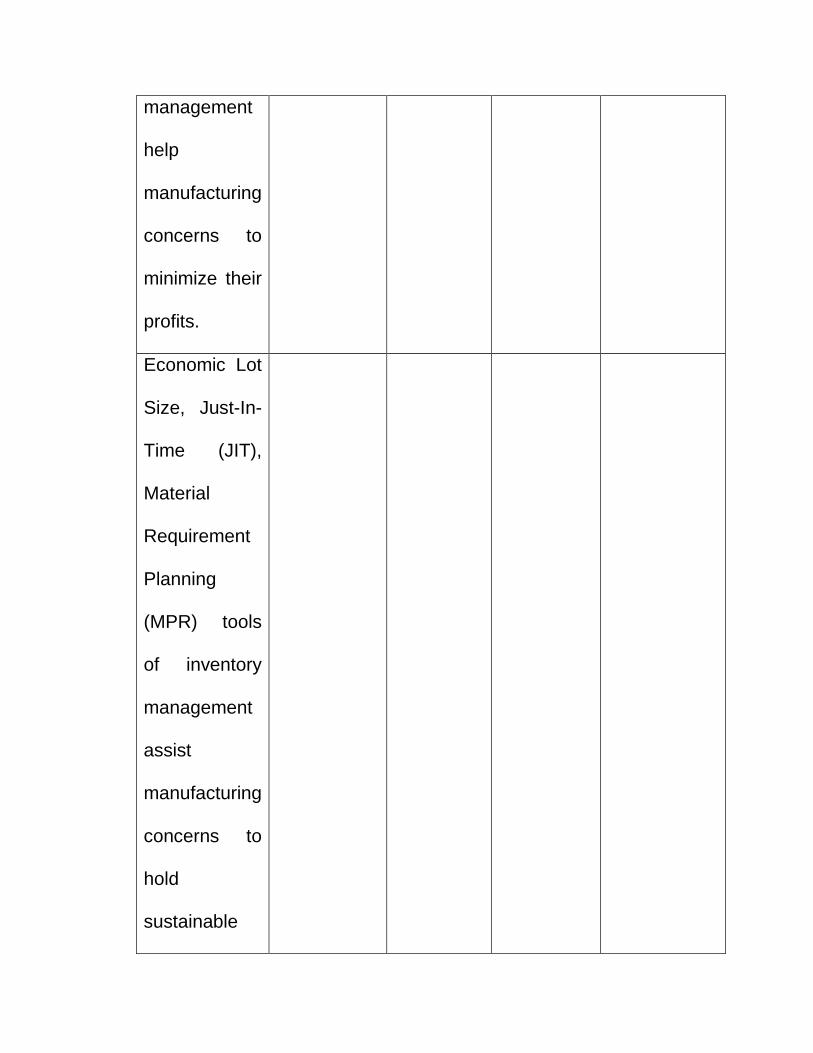
management
help
manufacturing
concerns to
minimize their
profits.
Economic Lot
Size, Just-In-
Time (JIT),
Material
Requirement
Planning
(MPR) tools
of inventory
management
assist
manufacturing
concerns to
hold
sustainable
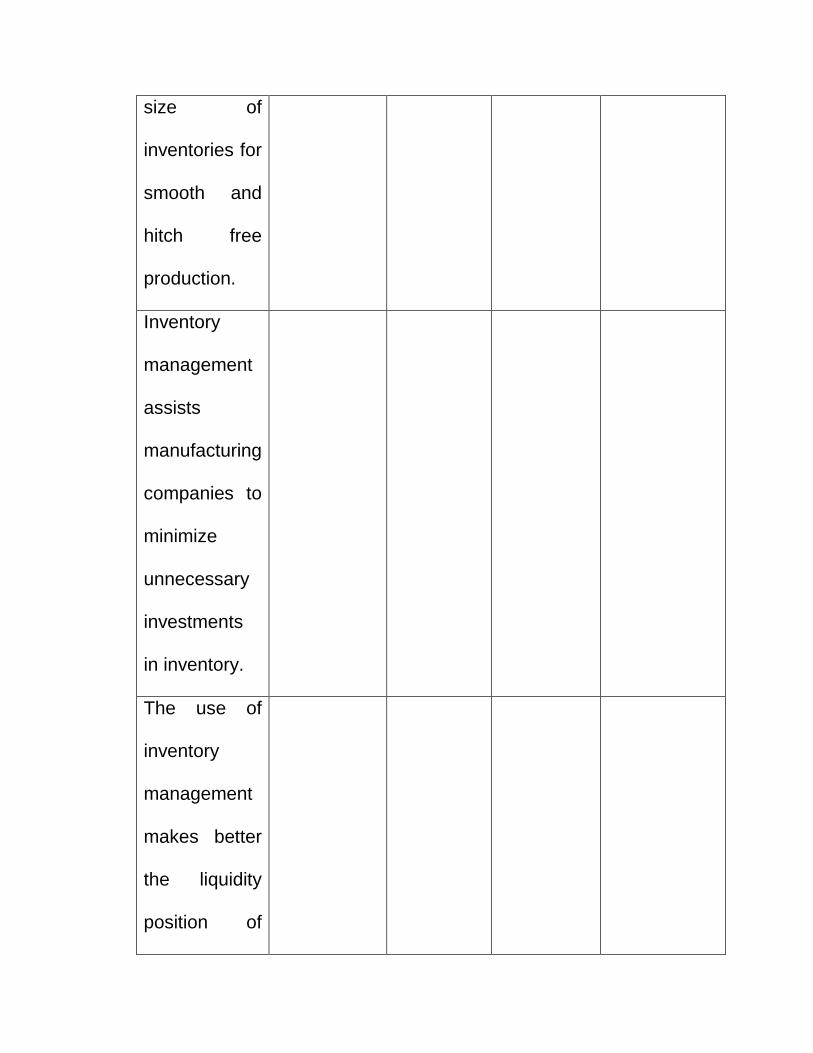
size of
inventories for
smooth and
hitch free
production.
Inventory
management
assists
manufacturing
companies to
minimize
unnecessary
investments
in inventory.
The use of
inventory
management
makes better
the liquidity
position of

manufacturing
organizations.
Periodic and
physical
counting of
stock items in
the
warehouse
help to reduce
pilfering,
obsolesces
and
deterioration
of inventory
items.
Inventory
management
helps to
improve sales
of the
manufacturing
companies.
Customers of
manufacturing
companies
are always
happy and
satisfied when
they are
supplied what
they needed
at the right
time.
Suppliers are
always willing
to supply to
the
manufacturing
companies
the raw

materials they
use for
production at
the right time.

Related Documents