Accountability Reporting for the Community Colleges, 2012 Report Riverside Community College District Teaching & Learning Committee October 2, 2012 David Torres, Dean Institutional Research

Accountability Reporting for the Community Colleges, 2012 Report Riverside Community College District Riverside Community College District Teaching & Learning.
Dec 30, 2015
Welcome message from author
This document is posted to help you gain knowledge. Please leave a comment to let me know what you think about it! Share it to your friends and learn new things together.
Transcript
Accountability Reporting for the
Community Colleges,2012 Report
Riverside Community College District Teaching & Learning Committee
October 2, 2012
David Torres, DeanInstitutional Research
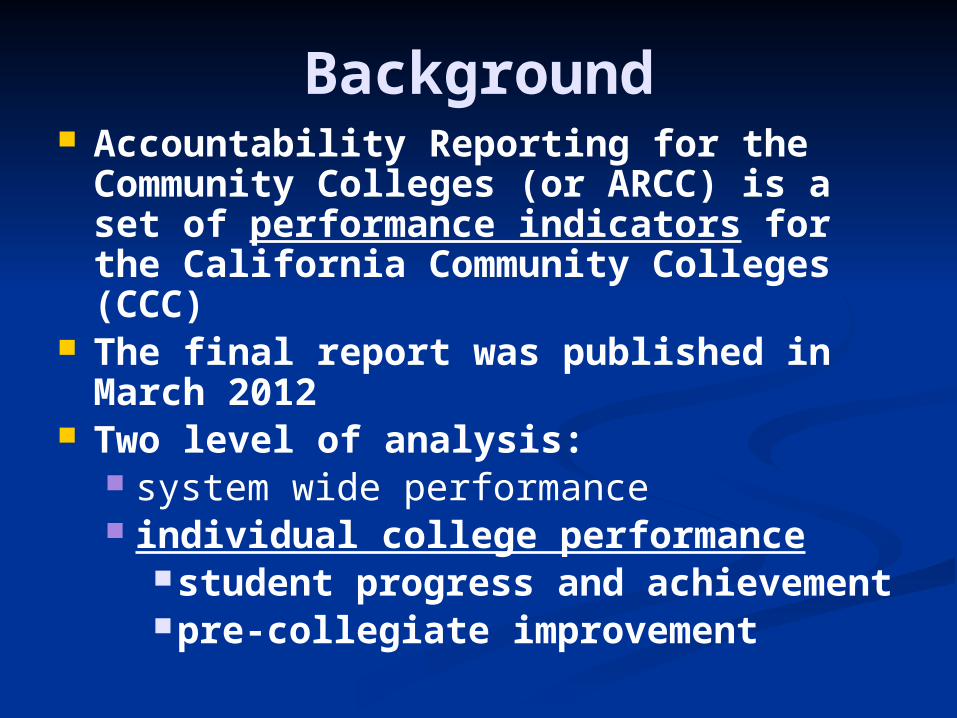
Background Accountability Reporting for the
Community Colleges (or ARCC) is a set of performance indicators for the California Community Colleges (CCC)
The final report was published in March 2012
Two level of analysis: system wide performance individual college performance
student progress and achievementpre-collegiate improvement
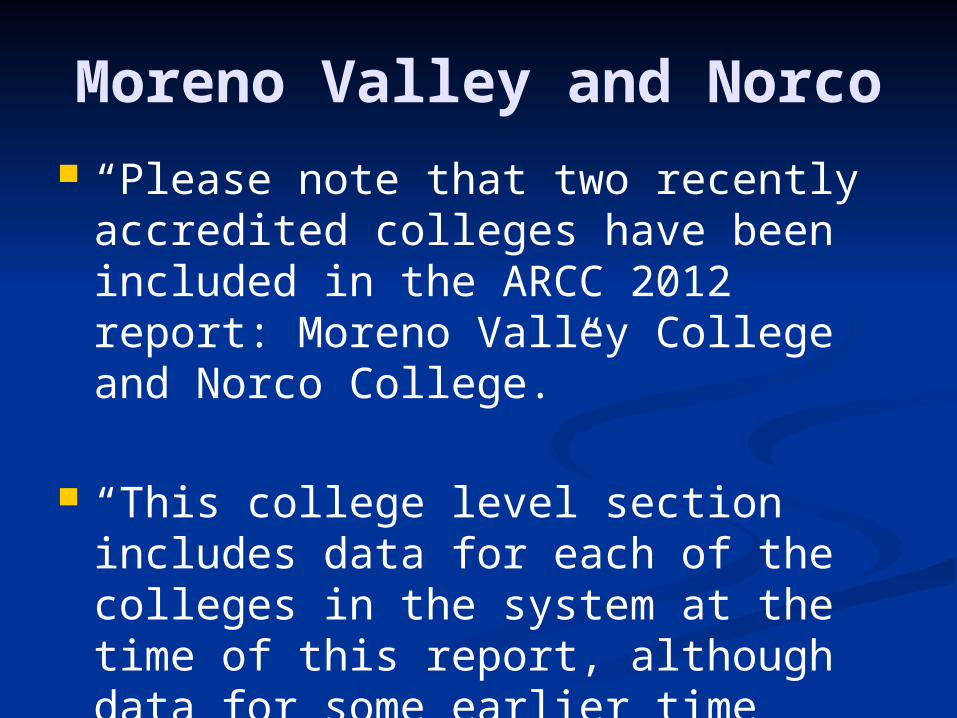
Moreno Valley and Norco “Please note that two recently
accredited colleges have been included in the ARCC 2012 report: Moreno Valley College and Norco College.”
“This college level section includes data for each of the colleges in the system at the time of this report, although data for some earlier time periods may be missing for the newer colleges.”
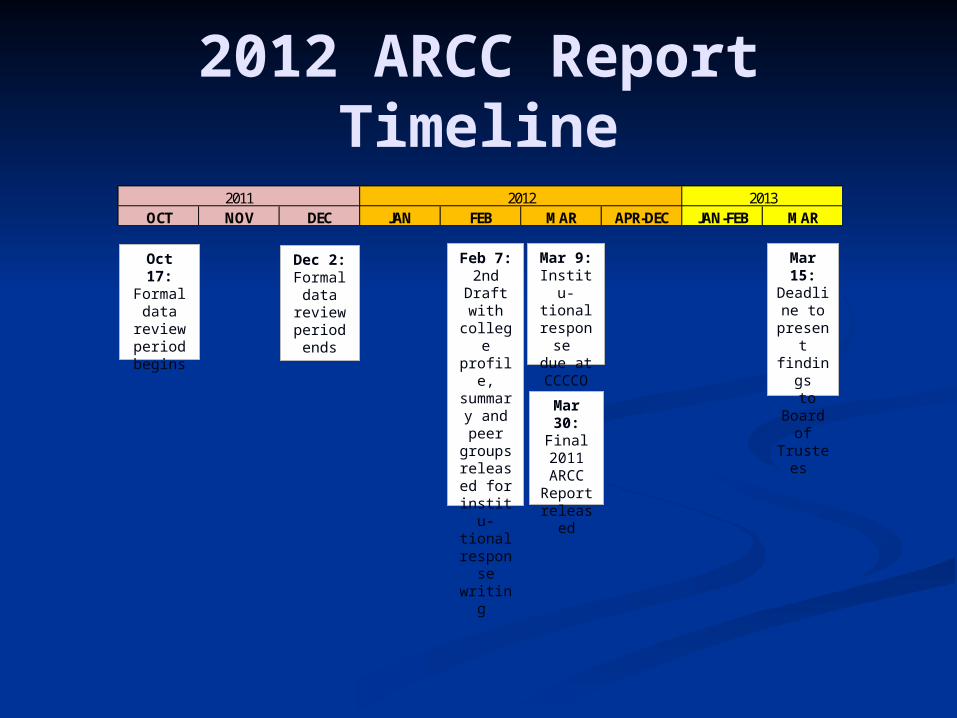
2012 ARCC Report Timeline
Oct 17:Formal
data review period begins
Dec 2:Formal
data review period ends
Feb 7:2nd
Draft with
college profile,summary and peer
groups released for
institu-tional respon
se writing
Mar 9:Institu-tional respon
se due at
CCCCO
Mar 30:
Final 2011 ARCC Report release
d
Mar 15:
Deadline to
present
findings
to Board
of Truste
es
OCT NOV DEC JAN FEB MAR APR-DEC JAN-FEB MAR2011 2012 2013
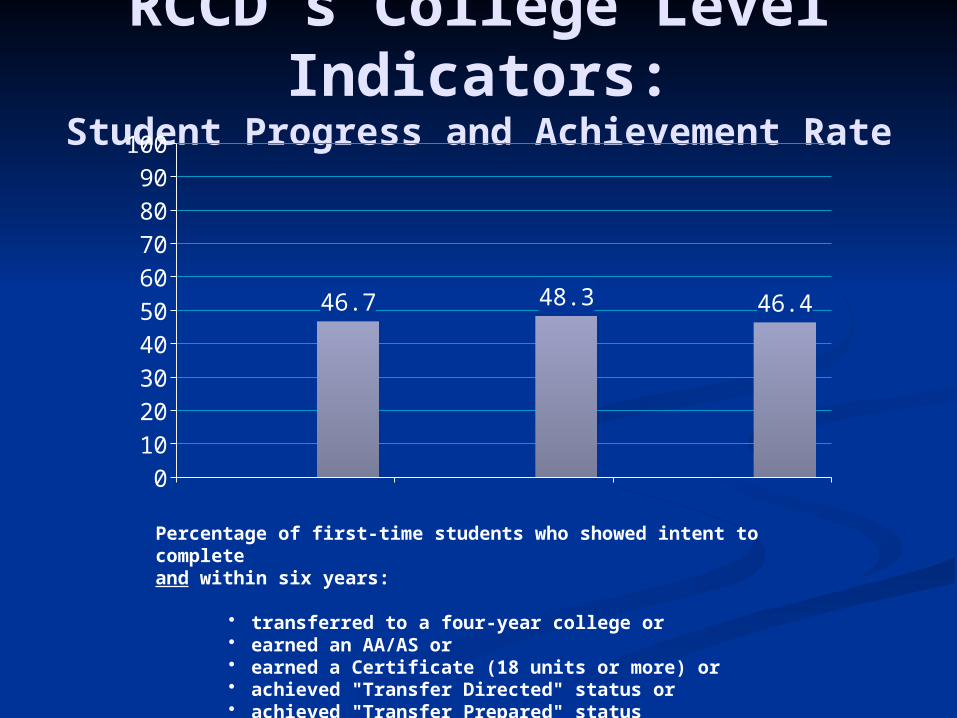
RCCD’s College Level Indicators:
Student Progress and Achievement Rate
Percentage of first-time students who showed intent to complete and within six years:
• transferred to a four-year college or • earned an AA/AS or • earned a Certificate (18 units or more) or • achieved "Transfer Directed" status or • achieved "Transfer Prepared" status
2003 2004 20050
102030405060708090
100
46.7 48.3 46.4
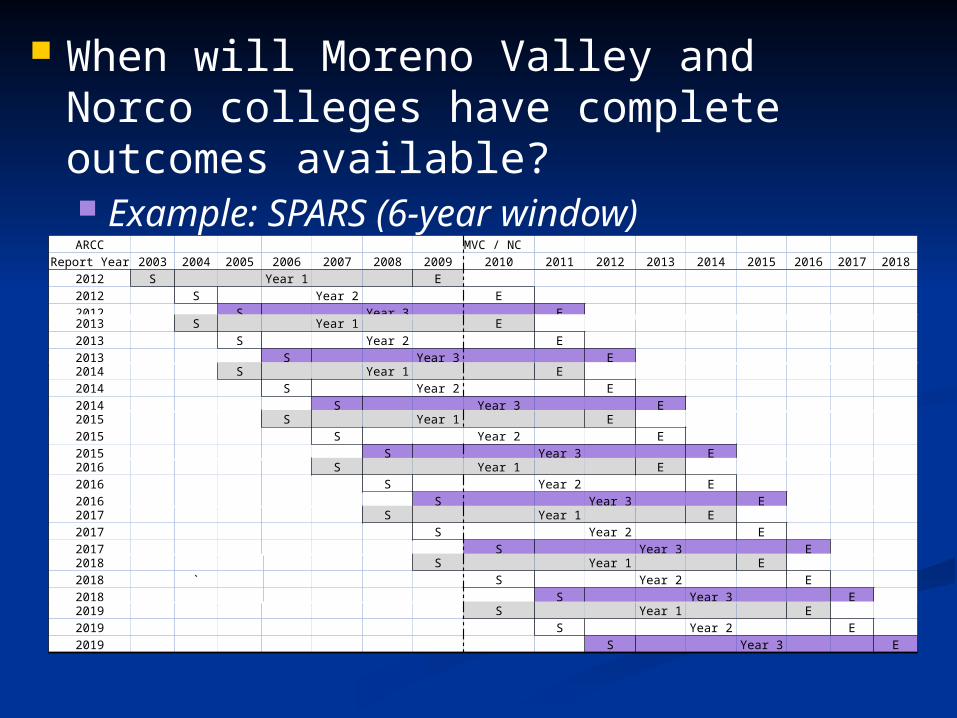
When will Moreno Valley and Norco colleges have complete outcomes available? Example: SPARS (6-year window)ARCC MVC / NC
Report Year 2003 2004 2005 2006 2007 2008 2009 2010 2011 2012 2013 2014 2015 2016 2017 20182012 S Year 1 E 2012 S Year 2 E 2012 S Year 3 E 2013 S Year 1 E 2013 S Year 2 E 2013 S Year 3 E 2014 S Year 1 E 2014 S Year 2 E 2014 S Year 3 E 2015 S Year 1 E 2015 S Year 2 E 2015 S Year 3 E 2016 S Year 1 E 2016 S Year 2 E 2016 S Year 3 E 2017 S Year 1 E 2017 S Year 2 E 2017 S Year 3 E 2018 S Year 1 E 2018 ` S Year 2 E 2018 S Year 3 E 2019 S Year 1 E 2019 S Year 2 E 2019 S Year 3 E
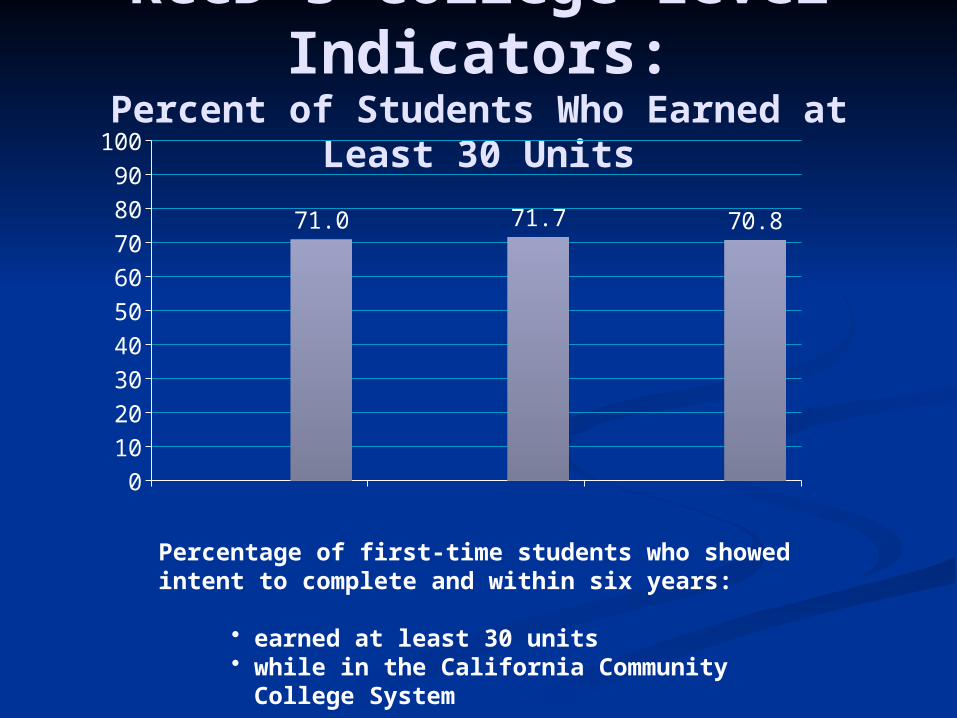
RCCD’s College Level Indicators:
Percent of Students Who Earned at Least 30 Units
Percentage of first-time students who showed intent to complete and within six years:
• earned at least 30 units • while in the California Community College
System
2003 2004 20050
102030405060708090
100
71.0 71.7 70.8
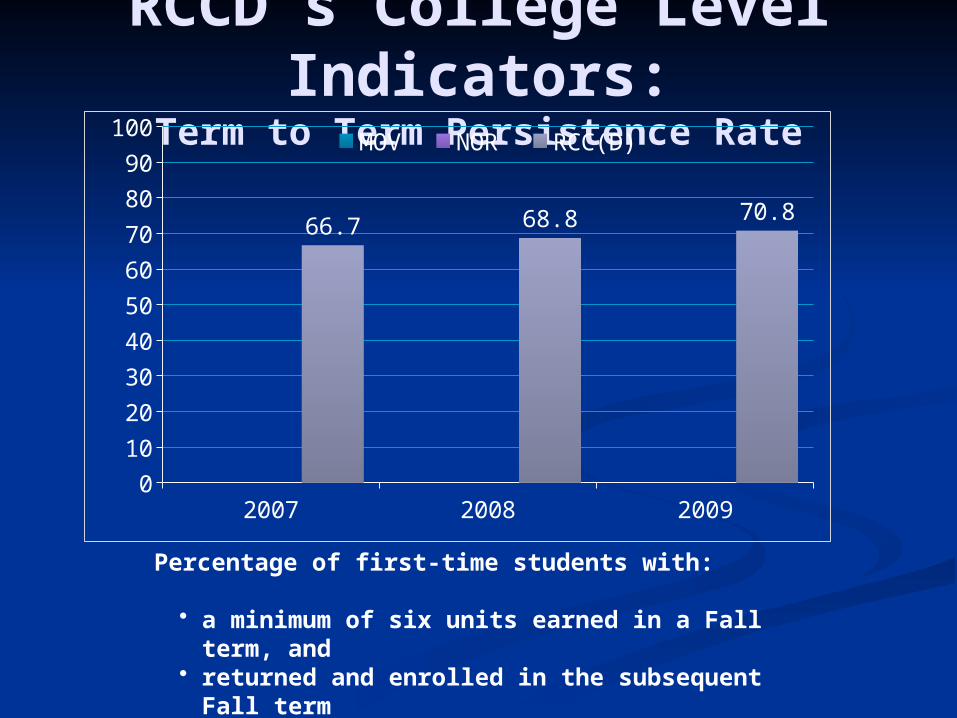
RCCD’s College Level Indicators:
Term to Term Persistence Rate
Percentage of first-time students with:
• a minimum of six units earned in a Fall term, and
• returned and enrolled in the subsequent Fall term
• anywhere in the system.
2007 2008 20090
10
20
30
40
50
60
70
80
90
100
66.7 68.8 70.8
MOV NOR RCC(D)
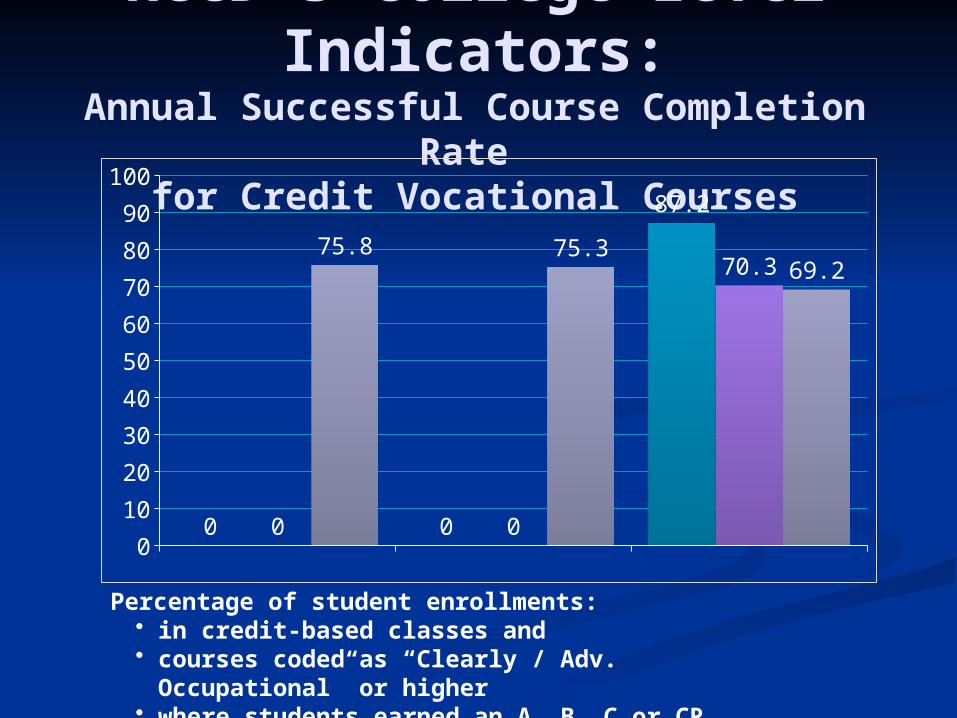
RCCD’s College Level Indicators:
Annual Successful Course Completion Rate
for Credit Vocational Courses
Percentage of student enrollments:• in credit-based classes and • courses coded as “Clearly / Adv.
Occupational” or higher• where students earned an A, B, C or CR grade
2008 2009 20100
10
20
30
40
50
60
70
80
90
100
0 0
87.2
0 0
70.375.8 75.3
69.2
MOV NOR RCC(D)
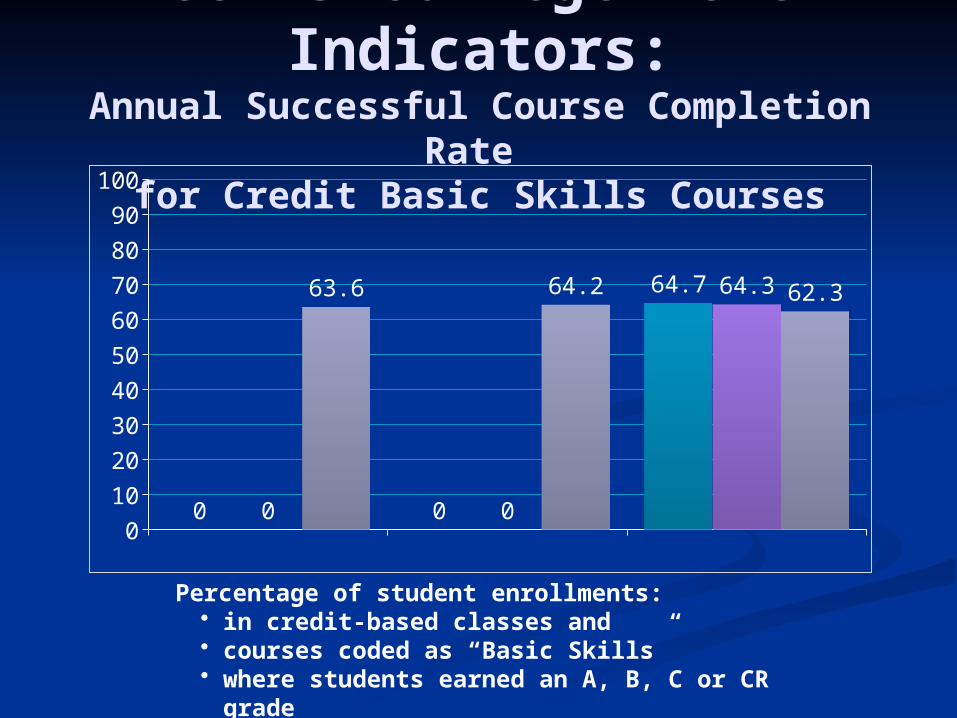
RCCD’s College Level Indicators:
Annual Successful Course Completion Rate
for Credit Basic Skills Courses
Percentage of student enrollments:• in credit-based classes and • courses coded as “Basic Skills”• where students earned an A, B, C or CR grade
2008 2009 20100
10
20
30
40
50
60
70
80
90
100
0 0
64.7
0 0
64.363.6 64.2 62.3
MOV NOR RCC(D)
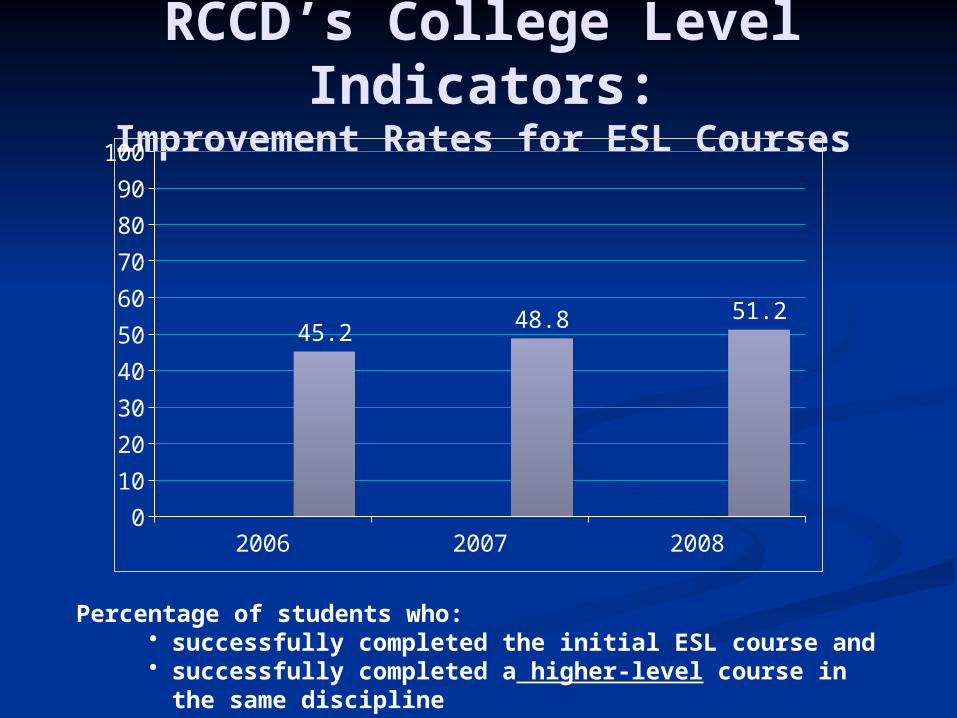
RCCD’s College Level Indicators:
Improvement Rates for ESL Courses
Percentage of students who:• successfully completed the initial ESL course and • successfully completed a higher-level course in the
same discipline • within three academic years
2006 2007 20080
10
20
30
40
50
60
70
80
90
100
45.2 48.8 51.2
MOV NOR RCC(D)
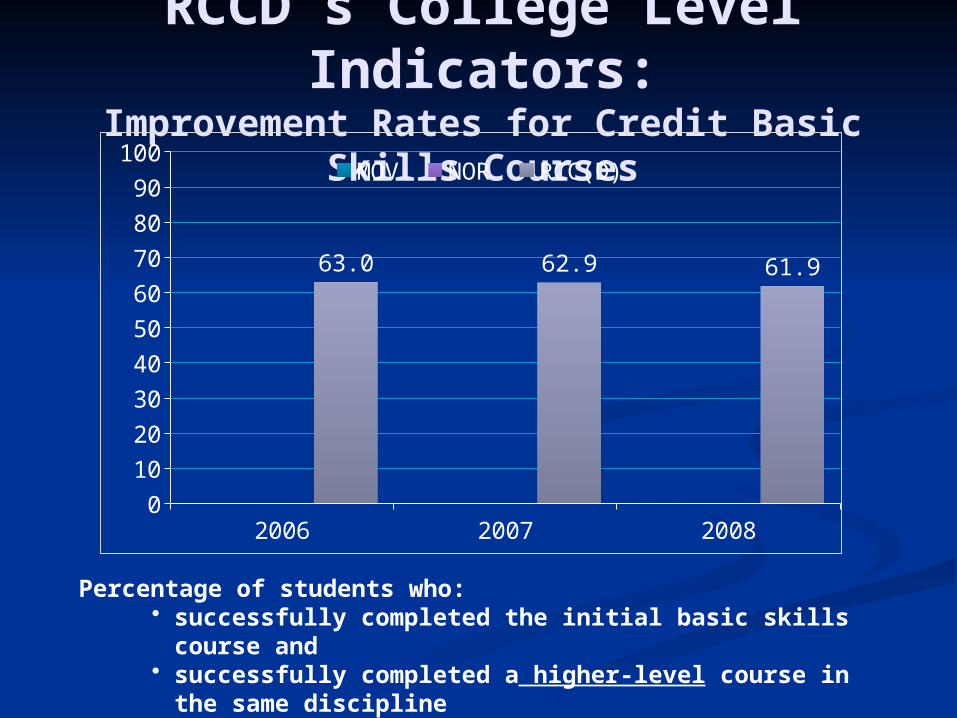
RCCD’s College Level Indicators:
Improvement Rates for Credit Basic Skills Courses
Percentage of students who:• successfully completed the initial basic skills course
and • successfully completed a higher-level course in the
same discipline • within three academic years
2006 2007 20080
10
20
30
40
50
60
70
80
90
100
63.0 62.9 61.9
MOV NOR RCC(D)
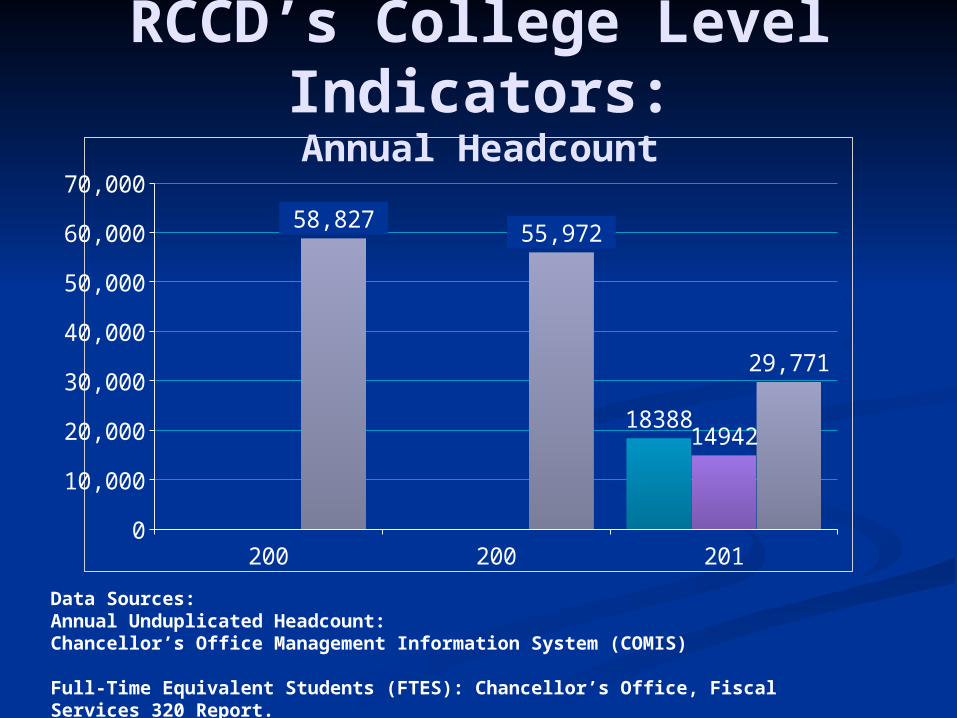
RCCD’s College Level Indicators:
Annual Headcount
Data Sources:Annual Unduplicated Headcount: Chancellor’s Office Management Information System (COMIS)
Full-Time Equivalent Students (FTES): Chancellor’s Office, Fiscal Services 320 Report.
2008-09 2009-10 2010-110
10,000
20,000
30,000
40,000
50,000
60,000
70,000
58,827 55,972
29,771
1838814942
MOV NOR RCC(D)
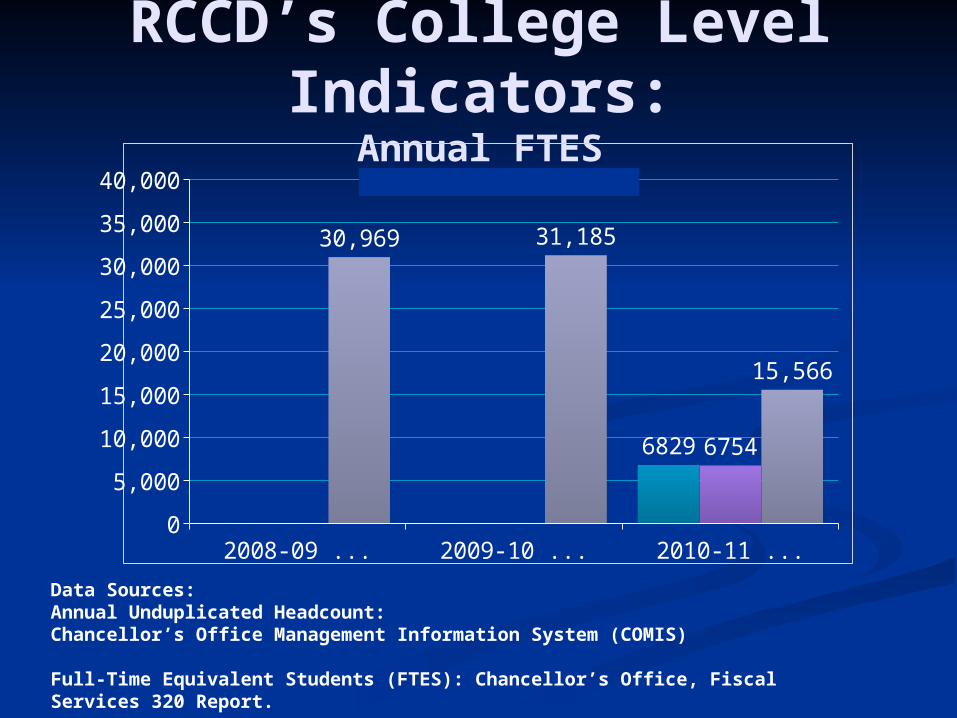
RCCD’s College Level Indicators:
Annual FTES
Data Sources:Annual Unduplicated Headcount: Chancellor’s Office Management Information System (COMIS)
Full-Time Equivalent Students (FTES): Chancellor’s Office, Fiscal Services 320 Report.
2008-09 FTES 2009-10 FTES 2010-11 FTES0
5,000
10,000
15,000
20,000
25,000
30,000
35,000
40,000
30,969 31,185
15,566
68296754
MOV NOR RCC(D)
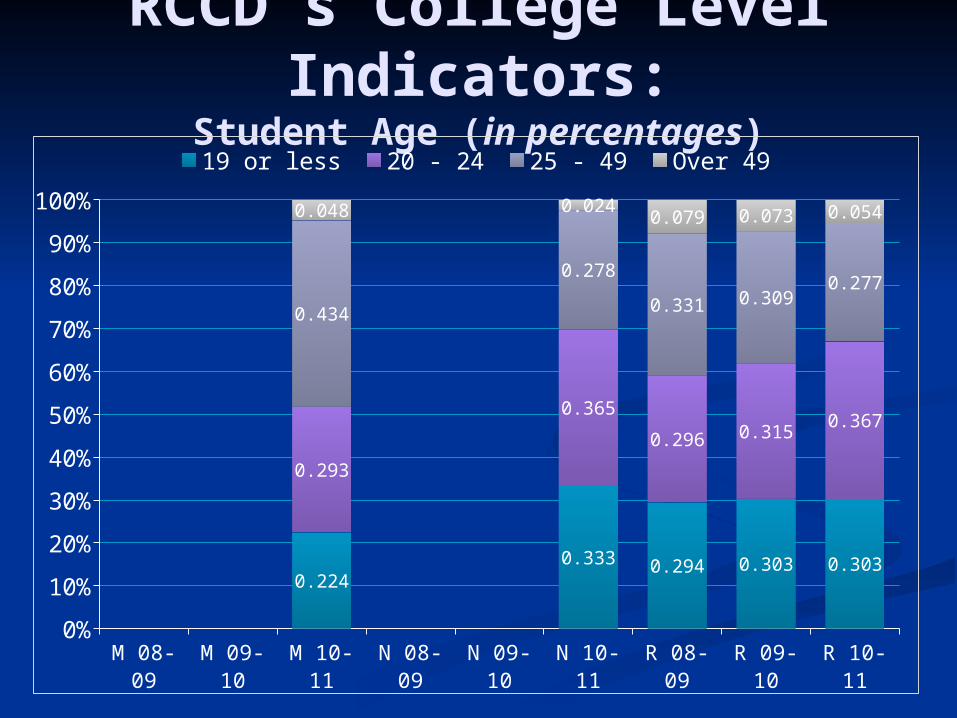
RCCD’s College Level Indicators:
Student Age (in percentages)
M 08-09
M 09-10
M 10-11
N 08-09 N 09-10 N 10-11 R 08-09 R 09-10 R 10-110%
10%
20%
30%
40%
50%
60%
70%
80%
90%
100%
0.2240.333 0.294 0.303 0.303
0.293
0.365
0.296 0.3150.367
0.434
0.278
0.331 0.3090.277
0.048 0.0240.079 0.073 0.054
19 or less 20 - 24 25 - 49 Over 49
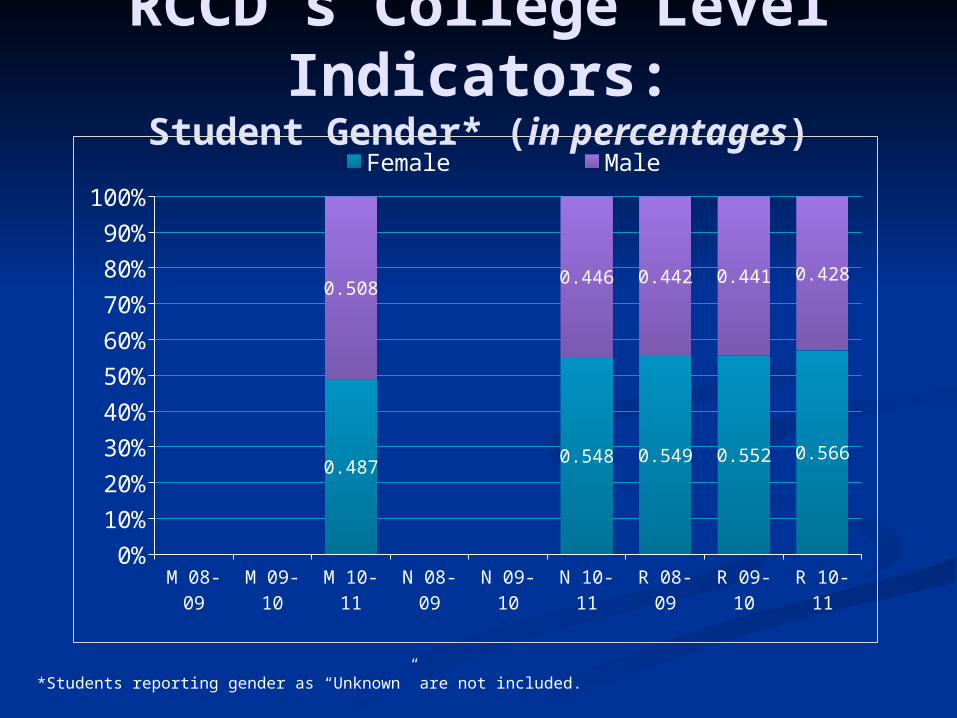
RCCD’s College Level Indicators:
Student Gender* (in percentages)
*Students reporting gender as “Unknown” are not included.
M 08-09
M 09-10
M 10-11
N 08-09
N 09-10
N 10-11
R 08-09
R 09-10
R 10-11
0%
10%
20%
30%
40%
50%
60%
70%
80%
90%
100%
0.4870.548 0.549 0.552 0.566
0.5080.446 0.442 0.441 0.428
Female Male
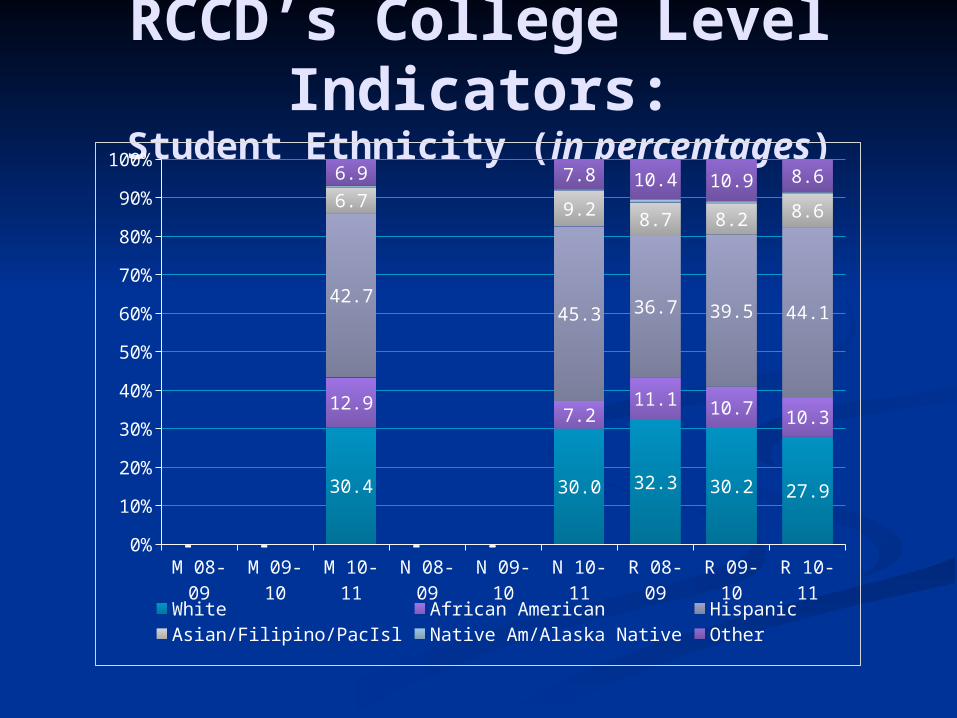
RCCD’s College Level Indicators:
Student Ethnicity (in percentages)
M 08-09
M 09-10
M 10-11
N 08-09
N 09-10
N 10-11
R 08-09
R 09-10
R 10-11
0%
10%
20%
30%
40%
50%
60%
70%
80%
90%
100%
- -
30.4
- -
30.0 32.3 30.2 27.9
- -
12.9
- -
7.2 11.1 10.7 10.3
- -
42.7
- -
45.3 36.7 39.5 44.1
- -
6.7
- -
9.2 8.7 8.2 8.6
- -
6.9
- -
7.8 10.4 10.9 8.6
White African American HispanicAsian/Filipino/PacIsl Native Am/Alaska Native Other
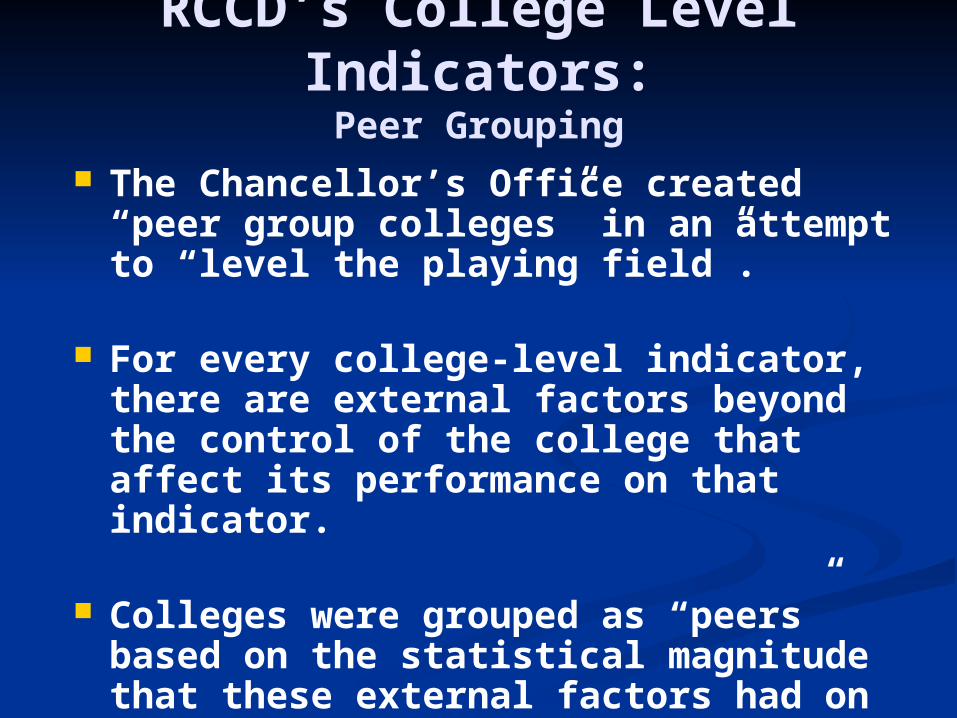
The Chancellor’s Office created “peer group colleges” in an attempt to “level the playing field”.
For every college-level indicator, there are external factors beyond the control of the college that affect its performance on that indicator.
Colleges were grouped as “peers” based on the statistical magnitude that these external factors had on each college-level indicator.
RCCD’s College Level Indicators:Peer Grouping
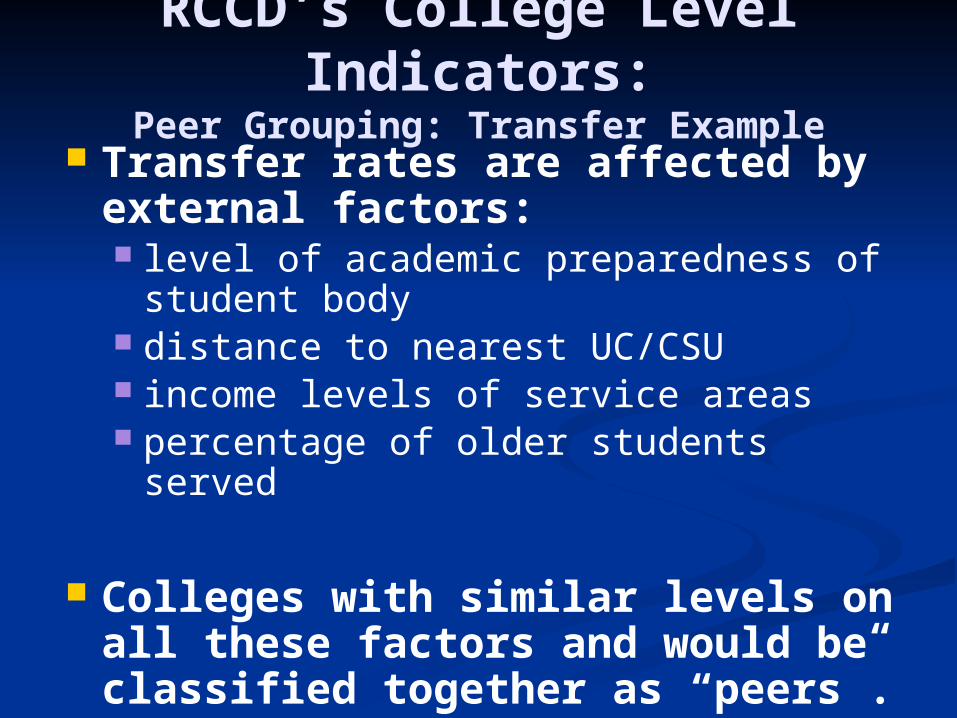
Transfer rates are affected by external factors: level of academic preparedness of
student body distance to nearest UC/CSU income levels of service areas percentage of older students served
Colleges with similar levels on all these factors and would be classified together as “peers”.
RCCD’s College Level Indicators:
Peer Grouping: Transfer Example
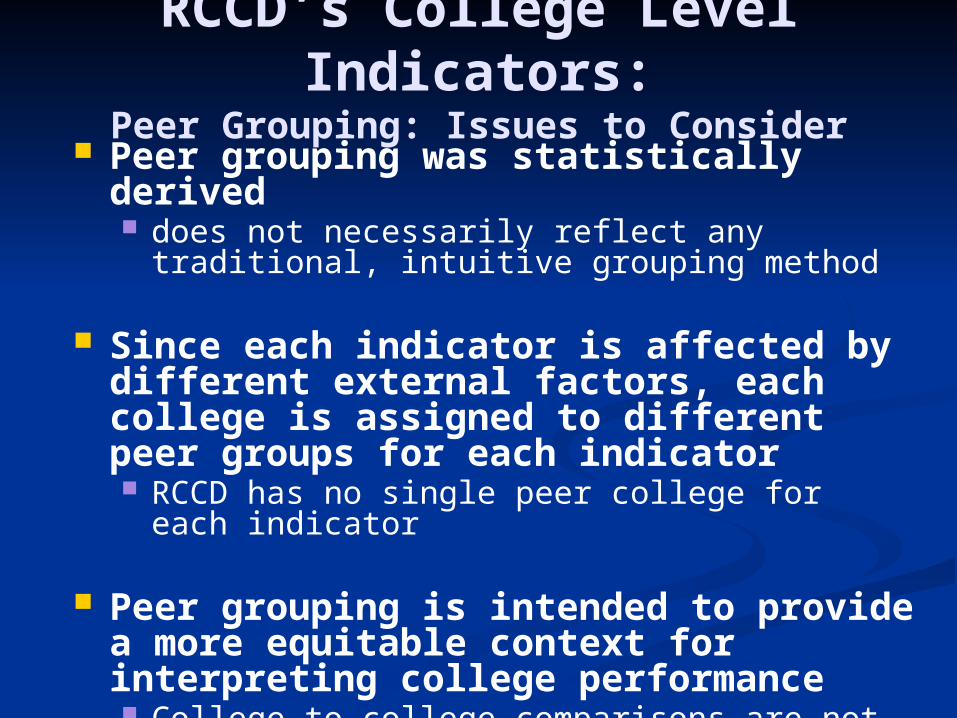
Peer grouping was statistically derived does not necessarily reflect any traditional,
intuitive grouping method
Since each indicator is affected by different external factors, each college is assigned to different peer groups for each indicator RCCD has no single peer college for each
indicator
Peer grouping is intended to provide a more equitable context for interpreting college performance College to college comparisons are not
encouraged
RCCD’s College Level Indicators:
Peer Grouping: Issues to Consider
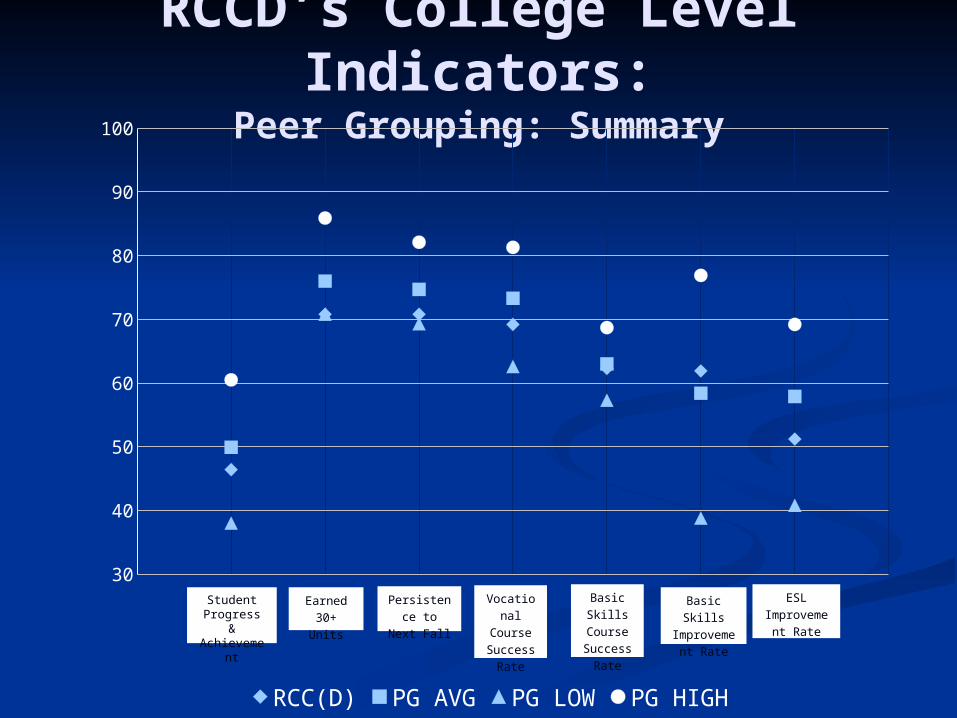
RCCD’s College Level Indicators:
Peer Grouping: Summary
30
40
50
60
70
80
90
100
RCC(D) PG AVG PG LOW PG HIGH
Basic Skills Im-
provement Rate
Basic Skills
Course Success
Rate
Voca-tional
Course Success
Rate
Persis-tence to Next Fall
Earned 30+ Units
ESL Im-provement
Rate
Student Progress & Achieveme
nt
Sharing the draft ARCC findings various district and college groups
Institutional Response Inform and encourage feedback Each college created their own
response
ARCC: Institutional Response
On each of the seven ARCC performance measures, RCCD has either maintained or increased its score for the most recent three cohorts of data.
ARCC: In 25 Words or Less…
End of slide show
Accountability Reporting for the
Community Colleges,2012 Report
Related Documents