Implementation of DRBC’s Water Loss Accountability Rule David Sayers Supervisor, IT and Water Use Section Delaware River Basin Commission December 8, 2011

Welcome message from author
This document is posted to help you gain knowledge. Please leave a comment to let me know what you think about it! Share it to your friends and learn new things together.
Transcript

Implementation of DRBC’s Water Loss Accountability Rule
David Sayers Supervisor, IT and Water Use Section
Delaware River Basin Commission
December 8, 2011

Water Service area in the Delaware River Basin
• Approx. 21% of Basin covered by service area
• 80% of basin residents (6.7 million customers)
• Approx. 750 systems
• 2nd largest water use sector in the Basin
• Total PWS withdrawals:
875 MGD (plus exports)

• Tocks Island Dam Project deauthorized (1975)
• Need to look at managing supply AND demand: - Good Faith Agreement (1983)
• Ground Water Advisory Committee
• Southeastern PA Groundwater Protected Area (GWPA)
• Water Conservation Advisory Committee
• Water Conservation Regulations adopted late 1980’s and early 90’s…
Water Conservation in the Delaware River Basin
History of DRBC Water Conservation Regs
1986: Source & Service Metering
1987: Leak Detection & Repair (UFW)
1988: Conservation Plumbing Standards
1992: Water Conservation Pricing
2006-9: Water Loss Accountability (WMAC)
2009-11: Outreach / Voluntary Implementation
2012: First year for new audit format
2013: First reports due

0
1
2
3
4
5
6
7
8
9
0
5,000
10,000
15,000
20,000
25,000
30,000
35,000
90 91 92 93 94 95 96 97 98 99 00 01 02 03 04 05 06 07
Mill
ion
s
Mill
ion
Gal
lon
s /
Mo
nth
Aggregated Withdrawals of 40 Public Water Supply
Systems in the DRB (Million Gallons / Month)
Withdrawals DRB Population
Trendlines 1990 - 2007: Approximately 15% decline in withdrawals Approximately 13% increase in population
0
50
100
150
200
0
200
400
600
800
1000
1200
1400
1600
18001
97
9
19
80
19
81
19
82
19
83
19
84
19
85
19
86
19
87
19
88
19
89
19
90
19
91
19
92
19
93
19
94
19
95
19
96
19
97
19
98
19
99
20
00
20
01
20
02
20
03
20
04
20
05
20
06
20
07
20
08
20
09
Pe
r C
apit
a
Mill
ion
Gal
lon
s p
er
Day
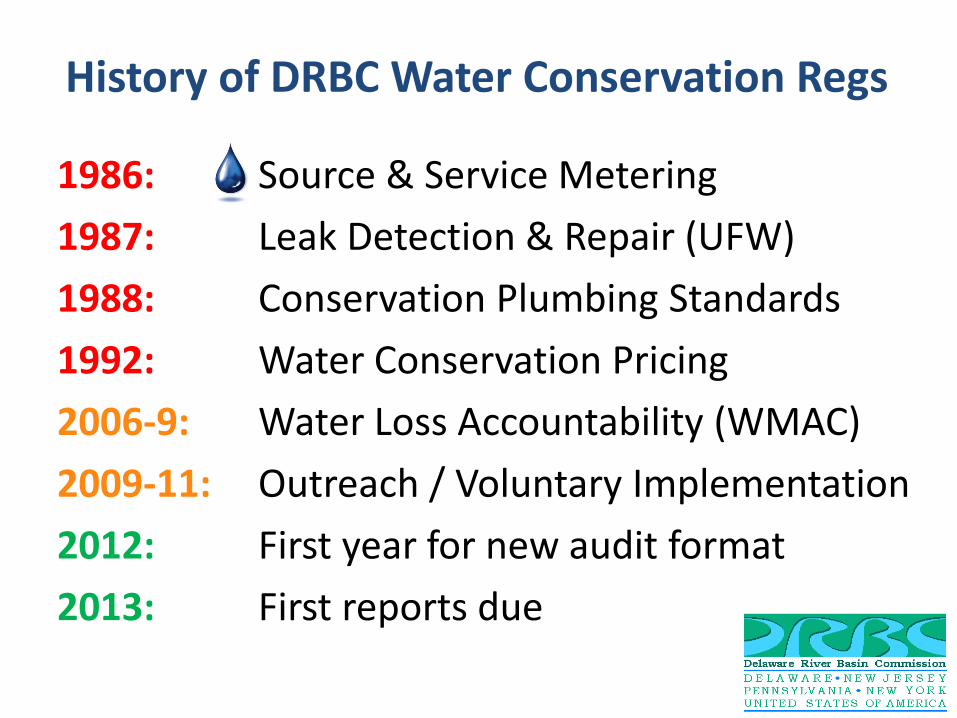
New York City Water Use Trends
Non-DRB water DRB water Per Capita (Gallons per person per day)
Data from NYCDEP website: http://www.nyc.gov/html/dep/html/drinking_water/droughthist.shtml
So, what’s next?
Water Loss Accountability
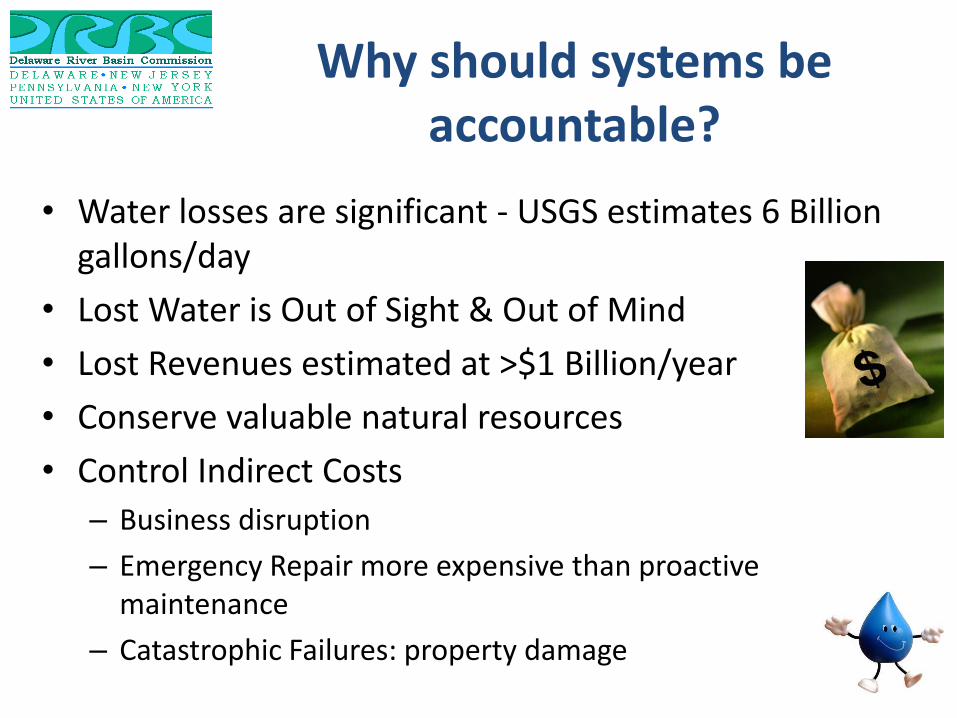
• Water losses are significant - USGS estimates 6 Billion gallons/day
• Lost Water is Out of Sight & Out of Mind
• Lost Revenues estimated at >$1 Billion/year
• Conserve valuable natural resources
• Control Indirect Costs
– Business disruption
– Emergency Repair more expensive than proactive maintenance
– Catastrophic Failures: property damage
Why should systems be accountable?

Catastrophic System Failure

• Water taken that doesn’t reach the customer is better left at the source.
• An estimated 150 million gallons per day is physically lost from public water supply distribution systems in the Delaware River Basin
• Water purveyors need to operate an efficient system, cost savings
• Public Perception: water suppliers need to be good stewards of the resource
Why We Need to Manage Water System Losses
What prompted DRBC rule change?
• Reporting inconsistencies
• Range of reported “Unaccounted for Water”:
High: 51%
Low: -12% (yes, that’s a negative)
• UFW = vague / inadequate definition
• Inadequate metric: UFW as % of distribution input is a poor indicator
• Time to update regulations (20+ yrs)
Unaccounted for Water
DRBC Rule change
IWA/AWWA Water Audit
Methodology
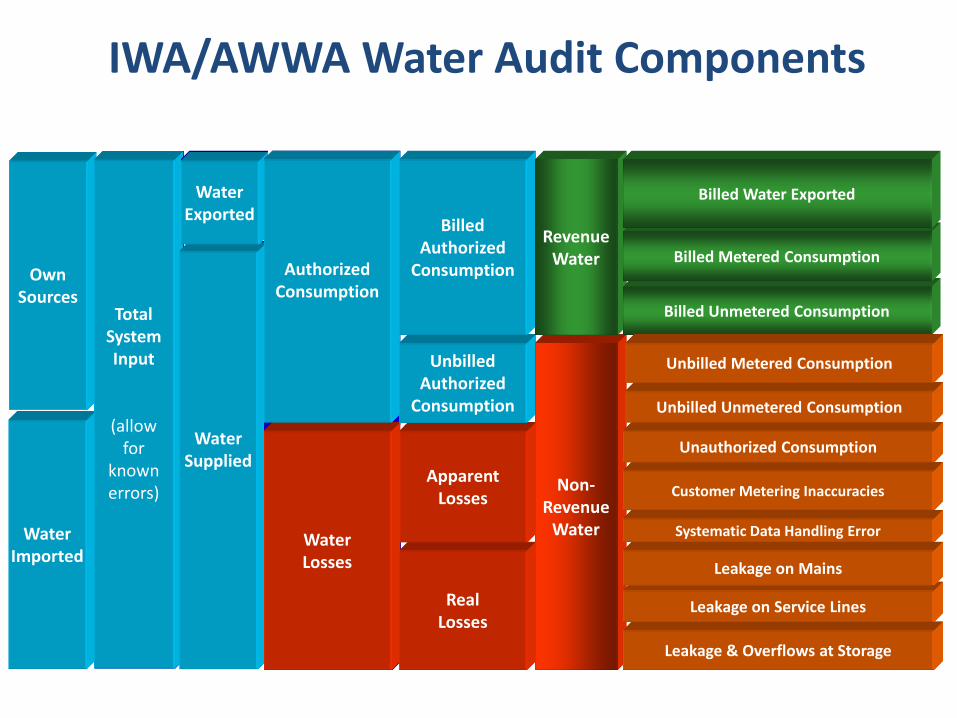
IWA/AWWA Water Audit Components
Water Imported
Own Sources
Total System Input
( allow for
known errors )
Total System Input
(allow for
known errors)
Water Supplied
Water Exported
Water Supplied
Water Exported
Water Losses
Authorized Consumption
Water Losses
Authorized Consumption
Real Losses
Apparent Losses
Unbilled Authorized
Consumption
Billed Authorized
Consumption
Non- Revenue
Water
Revenue Water
Leakage & Overflows at Storage
Billed Unmetered Consumption
Billed Metered Consumption
Billed Water Exported
Leakage on Service Lines
Leakage on Mains
Customer Metering Inaccuracies
Unauthorized Consumption
Unbilled Unmetered Consumption
Unbilled Metered Consumption
Systematic Data Handling Error
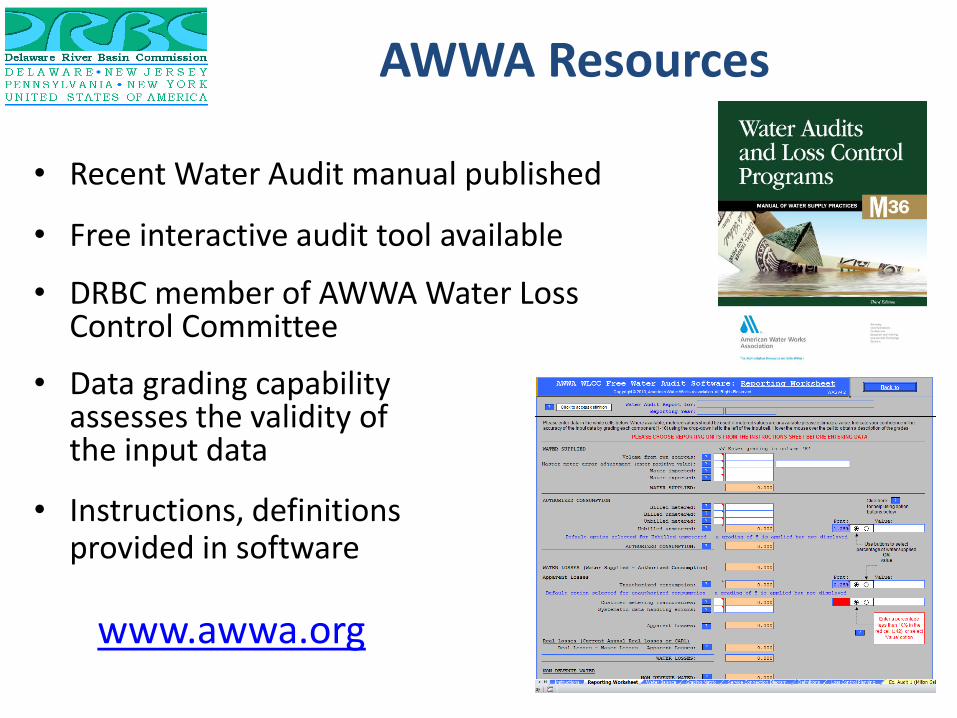
AWWA Resources
• Recent Water Audit manual published
• Free interactive audit tool available
• DRBC member of AWWA Water Loss Control Committee
• Data grading capability assesses the validity of the input data
• Instructions, definitions provided in software
www.awwa.org

• Industry standardized definitions and
terminology
• Software outputs meaningful indicators:
- gpd / mile mains
- gpd / connection
- ILI (infrastructure leakage index)
• Better indicators lead to better water
management decisions
Benefits of the IWA/AWWA Water Audit Methodology

Leaders in Water Loss Accountability:
States / Agencies Advancing AWWA Water Audit Approach
• DRBC • Texas • New Mexico • Virginia • Georgia
• California • North Carolina • Tennessee • Pennsylvania PUC • Calgari, Alberta, Canada
July 2010 AWWA Opflow Article
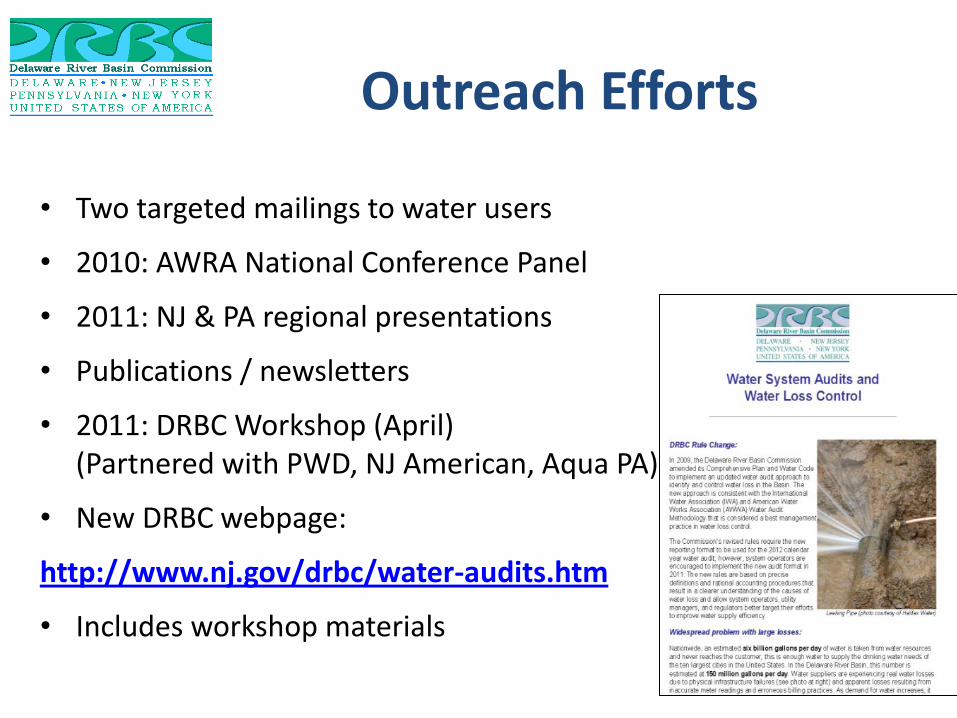
• Two targeted mailings to water users
• 2010: AWRA National Conference Panel
• 2011: NJ & PA regional presentations
• Publications / newsletters
• 2011: DRBC Workshop (April) (Partnered with PWD, NJ American, Aqua PA)
• New DRBC webpage:
http://www.nj.gov/drbc/water-audits.htm
• Includes workshop materials
Outreach Efforts

• 2012: First mandatory audit; annual thereafter
• DRBC will have primacy for reporting, until States
adopt similar programs
• Electronic reporting required (AWWA audit
format)
• Tools already developed for audit data
management
Implementation Summary

• DRBC has been a leader in water conservation programs that
show proven results
• DRBC Rule change will help meet goals of minimizing water
withdrawals and increasing system efficiency
• New audit method outputs more meaningful indicators:
- targeting real losses
- identifying financial costs of losses
• New approach will enable better water management decisions
• Water Loss Accountability Program continues DRBC leadership in
water conservation
Conclusion
Related Documents