http://jtlu.org Aic i P [Scheduled for JTLU 9.3 (2016)] pp. 1–20 Abstract: Although a large body of literature has been produced on the theoretical definitions and measurements of accessibility, the extent to which such indicators are used in planning practice is less clear. This research explores the gap between theory and application by seeking to understand what the new wave of accessibility instruments (AIs) prepared for spatial and transport planning practice purports to offer the users of AIs. Starting from the question of how urban and transport planners are designing AIs, the article analyzes and describes the AIs developed over the last decade (mainly in Europe), offering a structured overview and a clear categorization of how accessibility measures can be applied. The paper identifies AI characteristics, and considers their usability, based on AI developer perceptions. 1 Introduction Accessibility instruments (AIs) are a type of planning support system (PSS) designed to support inte- grated land-use transport analysis and planning through providing explicit knowledge on the accessibil- ity of land uses by different modes of transport at various geographical scales. ey measure, interpret and/or model accessibility and are developed to support the many research tasks involved in planning practice (analysis, design support, evaluation, monitoring, etc.). Although there exists an extensive lit- erature on the analysis and the classification of accessibility measures and indicators incorporated in these AIs (Geurs and van Eck 2001; Geurs and van Wee 2004), less attention has been paid to the planning issues that they seek to support or to their usability and employability for the various planning goals in actual practice. is research aims to fill this gap and provide insights on the two following research questions: How has the new wave of accessibility instruments (AIs) prepared for spatial and transport-planning practice been designed? What is the usability of these planning instruments as per- ceived by their developers? To provide an answer to these questions, the paper draws on the outcomes of Accessibility instruments for planning practice: A review of European experiences Enrica Papa Cecilia Silva Ghent University University of Porto [email protected] [email protected] Marco te Brömmelstroet Angela Hull University of Amsterdam Heriot-Watt University [email protected] [email protected] Article History: Received: November 29, 2013 Accepted: December 14, 2014 Available online: July 1, 2015 Copyright 2015 Enrica Papa, Cecilia Silva, Marco te BrÖmmelstroet, & Angela Hull. http://dx.doi.org/10.5198/jtlu.2015.585 ISSN: 1938-7849 | Licensed under the Creative Commons Attribution – Noncommercial License 3.0 e Journal of Transport and Land Use is the official journal of the World Society for Transport and Land Use (WSTLUR) and is published and sponsored by the University of Minnesota Center for Transportation Studies. is paper is also published with sponsorship from WSTLUR and the Institutes of Transportation Studies at University of California, Davis and University of California, Berkeley.

Welcome message from author
This document is posted to help you gain knowledge. Please leave a comment to let me know what you think about it! Share it to your friends and learn new things together.
Transcript

http://jtlu.orgAic i P [Scheduled for JTLU 9.3 (2016)] pp. 1–20
Abstract: Although a large body of literature has been produced on the theoretical definitions and measurements of accessibility, the extent to which such indicators are used in planning practice is less clear. This research explores the gap between theory and application by seeking to understand what the new wave of accessibility instruments (AIs) prepared for spatial and transport planning practice purports to offer the users of AIs. Starting from the question of how urban and transport planners are designing AIs, the article analyzes and describes the AIs developed over the last decade (mainly in Europe), offering a structured overview and a clear categorization of how accessibility measures can be applied. The paper identifies AI characteristics, and considers their usability, based on AI developer perceptions.
1 Introduction
Accessibility instruments (AIs) are a type of planning support system (PSS) designed to support inte-grated land-use transport analysis and planning through providing explicit knowledge on the accessibil-ity of land uses by different modes of transport at various geographical scales. They measure, interpret and/or model accessibility and are developed to support the many research tasks involved in planning practice (analysis, design support, evaluation, monitoring, etc.). Although there exists an extensive lit-erature on the analysis and the classification of accessibility measures and indicators incorporated in these AIs (Geurs and van Eck 2001; Geurs and van Wee 2004), less attention has been paid to the planning issues that they seek to support or to their usability and employability for the various planning goals in actual practice. This research aims to fill this gap and provide insights on the two following research questions: How has the new wave of accessibility instruments (AIs) prepared for spatial and transport-planning practice been designed? What is the usability of these planning instruments as per-ceived by their developers? To provide an answer to these questions, the paper draws on the outcomes of
Accessibility instruments for planning practice: A review of European experiences
Enrica Papa Cecilia Silva Ghent University University of Porto [email protected] [email protected]
Marco te Brömmelstroet Angela Hull University of Amsterdam Heriot-Watt University [email protected] [email protected]
Article History:Received: November 29, 2013Accepted: December 14, 2014Available online: July 1, 2015
Copyright 2015 Enrica Papa, Cecilia Silva, Marco te BrÖmmelstroet, & Angela Hull.http://dx.doi.org/10.5198/jtlu.2015.585ISSN: 1938-7849 | Licensed under the Creative Commons Attribution – Noncommercial License 3.0
The Journal of Transport and Land Use is the official journal of the World Society for Transport and Land Use (WSTLUR) and is published and sponsored by the University of Minnesota Center for Transportation Studies. This paper is also published with sponsorship from WSTLUR and the Institutes of Transportation Studies at University of California, Davis and University of California, Berkeley.

2 JOURNAL OF TRANSPORT AND LAND USE: ARTICLE IN PRESS
a database of 21 AIs collected for the COST1 Action TU1002, “Accessibility Instruments for Planning Practice in Europe” (Hull, Silva, and Bertolini 2012), whose first phase examines the state of the art with regard to AIs in Europe.
This focus on AIs and their use in land-use and transport planning is valuable for two main reasons. The first reason is that, as many researchers have observed (Bertolini 2012; Ferreira, Beukers, and te Brömmelstroet 2012; Halden 2003; Handy 2002; Handy and Niemeier 1997; Makrí 2001; Nuzzolo, Coppola, and Papa 2014; Silva and Pinho 2010), accessibility analysis and instruments offer a highly suitable framework to support the development of combined land-use and transport strategies, so as to achieve the coordination and synergy required to attain city sustainability goals (Holden 2012; Stead, Geerlings, and Meijers 2004). Indeed, a focus on accessibility makes the overall goal of the land-use and transport system explicit and offers a direct link between the characteristics of flows (i.e., speeds and travel time) and the characteristic of places (i.e., the number of relevant activities in a given area). Because of these features, it represents a potentially powerful approach that planning practitioners can employ to develop and test effective strategies for sustainable cities (Straatemeier 2008), and that could act as good accelerators for a better coordination between urban and transport planning.
The second reason for focusing on AIs, and in particular on their usability in planning practice, is that although both the concept of accessibility and its potential for urban planning practice have long been discussed, the translation of these concepts into usable planning instruments is still fairly limited (te Brömmelstroet 2010; te Brömmelstroet and Bertolini 2010). In planning practice the concept of acces-sibility is often misunderstood, and instruments developed to support practitioners are seen as complex, inflexible, incomprehensible, and rigid black boxes.
The motivation for this paper is to explore to what extent urban and transport planners are devel-oping accessibility planning tools. Accordingly, this paper has two specific goals. The first is to provide an updated framework on the tools for accessibility analysis and planning that have been developed in Europe in recent years. This targets primarily land use and transport planning researchers but also prac-titioners who wish to conduct an accessibility analysis and to choose the most suitable AI. The second is to analyze the perceived usability of AIs, from the perspectives of their developers, highlighting the performance and requirements of AIs on specific features influencing usability and the institutional bar-riers limiting their use in practice. It is important to stress once again that the aim is not to evaluate, but to collect developers’ preferences and concerns when putting together an AI and the developers’ percep-tion, attitudes, and views on the usability of their AIs.
The paper is structured in three sections. The next part describes the research design, discussing the choices made in data gathering and analysis. Sections 3 and 4 give an overview of the research findings; in Section 3 we describe the characteristics of the AIs analyzed, and in Section 4 we explore developers’ perceptions regarding their usability. The paper closes with some conclusions and by proposing new research directions.
2 Research design
The research discussed in this paper was conducted in the first phase of the COST Action “Accessibility Instruments for Planning Practice.” Initially we submitted a survey to AI developers who were interested in the research project and in a second stage we analyzed the survey results. The questionnaire was ad-vertised in COST member countries and attracted replies from a large number of AI developers working on accessibility PSSs who could meet in Europe on a regular basis. These were AI developers working in Europe who were most actively seeking to apply accessibility logic to daily planning practices. The back-ground of the AI designers was quite diverse and included architects, transport engineers, geographers, land-use planners and mobility planners. 1 COST is the European Cooperation in Science and Technology framework supporting cooperation among scientists and researchers across Europe www.cost.eu
3Accessibility intruments for planning practice: A review of European experiences
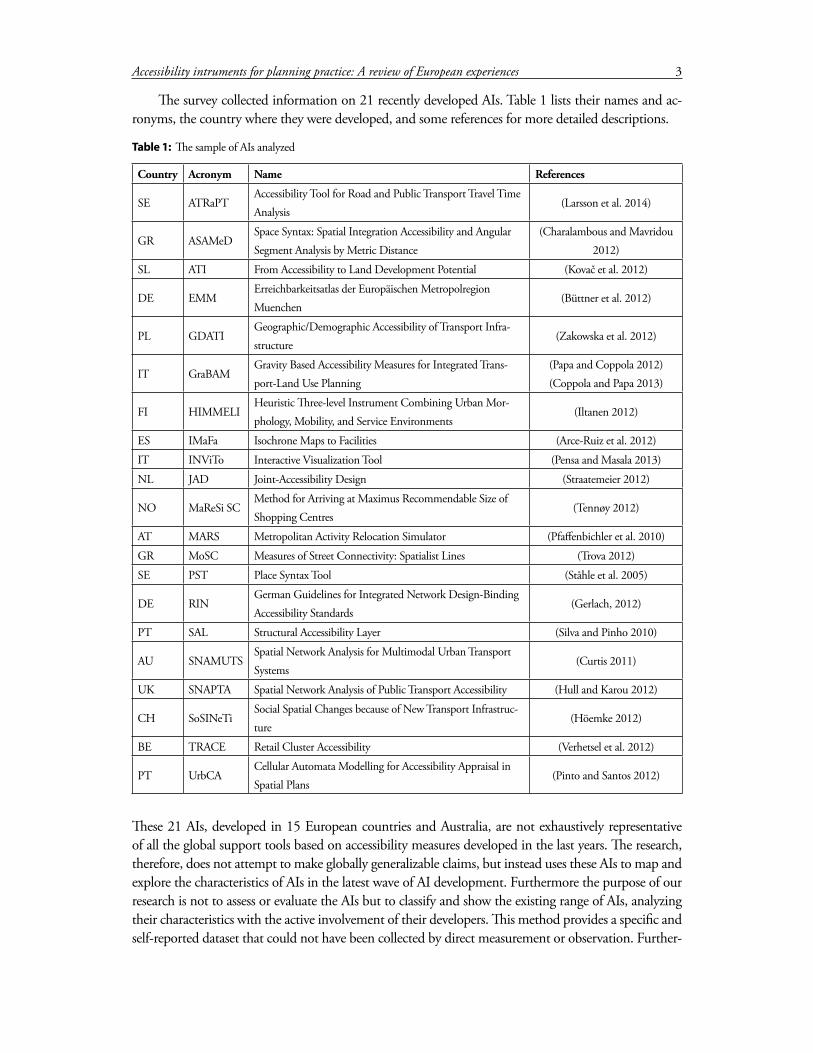
The survey collected information on 21 recently developed AIs. Table 1 lists their names and ac-ronyms, the country where they were developed, and some references for more detailed descriptions.
These 21 AIs, developed in 15 European countries and Australia, are not exhaustively representative of all the global support tools based on accessibility measures developed in the last years. The research, therefore, does not attempt to make globally generalizable claims, but instead uses these AIs to map and explore the characteristics of AIs in the latest wave of AI development. Furthermore the purpose of our research is not to assess or evaluate the AIs but to classify and show the existing range of AIs, analyzing their characteristics with the active involvement of their developers. This method provides a specific and self-reported dataset that could not have been collected by direct measurement or observation. Further-
Table 1: The sample of AIs analyzed
Country Acronym Name References
SE ATRaPTAccessibility Tool for Road and Public Transport Travel Time Analysis
(Larsson et al. 2014)
GR ASAMeDSpace Syntax: Spatial Integration Accessibility and Angular Segment Analysis by Metric Distance
(Charalambous and Mavridou 2012)
SL ATI From Accessibility to Land Development Potential (Kovač et al. 2012)
DE EMMErreichbarkeitsatlas der Europäischen Metropolregion Muenchen
(Büttner et al. 2012)
PL GDATIGeographic/Demographic Accessibility of Transport Infra-structure
(Zakowska et al. 2012)
IT GraBAMGravity Based Accessibility Measures for Integrated Trans-port-Land Use Planning
(Papa and Coppola 2012) (Coppola and Papa 2013)
FI HIMMELIHeuristic Three-level Instrument Combining Urban Mor-phology, Mobility, and Service Environments
(Iltanen 2012)
ES IMaFa Isochrone Maps to Facilities (Arce-Ruiz et al. 2012)
IT INViTo Interactive Visualization Tool (Pensa and Masala 2013)
NL JAD Joint-Accessibility Design (Straatemeier 2012)
NO MaReSi SCMethod for Arriving at Maximus Recommendable Size of Shopping Centres
(Tennøy 2012)
AT MARS Metropolitan Activity Relocation Simulator (Pfaffenbichler et al. 2010)
GR MoSC Measures of Street Connectivity: Spatialist Lines (Trova 2012)
SE PST Place Syntax Tool (Ståhle et al. 2005)
DE RINGerman Guidelines for Integrated Network Design-Binding Accessibility Standards
(Gerlach, 2012)
PT SAL Structural Accessibility Layer (Silva and Pinho 2010)
AU SNAMUTSSpatial Network Analysis for Multimodal Urban Transport Systems
(Curtis 2011)
UK SNAPTA Spatial Network Analysis of Public Transport Accessibility (Hull and Karou 2012)
CH SoSINeTiSocial Spatial Changes because of New Transport Infrastruc-ture
(Höemke 2012)
BE TRACE Retail Cluster Accessibility (Verhetsel et al. 2012)
PT UrbCACellular Automata Modelling for Accessibility Appraisal in Spatial Plans
(Pinto and Santos 2012)

4 JOURNAL OF TRANSPORT AND LAND USE: ARTICLE IN PRESS
more, engagement with so many AI developers allowed the authors to pilot several versions of the ques-tionnaire through focus groups and interviews until a common language and an objective interpretation of the questions had been achieved. Focus groups were also important for a bottom-up generation of concerns and issues, which helped establish survey variables.
The survey was structured into five groups of questions as described below:
1. The first group of questions aimed to map general information on the AI.2. The second group aimed to identify a number of contextual issues for the development of the
AI, namely whether there are political requirements for accessibility planning in the country or region in which the AI was developed, as well as information on the status of development of the AI and the type of planning process for which it is intended.
3. The third set of questions aimed to identify the main planning goals considered in the develop-ment of the AI, and the planning goals that the AI is capable of considering or addressing.
4. The fourth set aimed to summarize the main operational characteristics of the AIs surveyed, including the accessibility measure type; the components considered (transport, land use, tem-poral, and individual components); the level of disaggregation with regard to spatial; socioeco-nomic and temporal data; and the transport modes and opportunities considered. This portion of the survey also contained questions evaluating the developers’ perception of the AI’s ability to replicate reality, its programming speed, and its usefulness in planning practice for gauging goodness of fit with the needs of potential end users.
5. Fifth, with regard to the developers’ perception of AI usefulness, respondents were asked to rate how easy it is to use the AI, the knowledge and skills required to use it, its ability to provide understanding on the quality and experience of travel, and its success in its intended role in urban planning. Additional questions in this last section covered potential users, the AI’s role in connecting service users and accessibility providers, and its role in urban planning. The survey ended with questions on the main issues blocking implementation of the AI.
The second step of the research methodology consisted in verifying the acceptability, validity, and reli-ability of the survey results, and then in the analysis of those results. Acceptability, validity, and reliability were tested by means of post-survey interviews with the developers, to find out whether the responses given in the questionnaire were consistent with their opinions. Furthermore, each developer was asked to produce a written report containing a qualitative description of his or her AIs, which was compared with the survey responses. The analysis of the results, which is described in the following sections, has been split into two parts, according to the two research questions stated above: the first provides a description of AI characteristics, and the second focuses on the perceived usability of AIs for planning practice, from the developers perception.
3 AI characteristics
The 21 AIs differ according to three key features:
• The purpose of the analysis and the nature of the planning issue, or the planning goals that the analysis can most helpfully inform.
• The measure of accessibility used, geographical scale, transport mode and trip purpose. • The representation of the analytical results.
The analysis that follows clusters those AIs that offer similar characteristics.

5Accessibility intruments for planning practice: A review of European experiences
3.1 AI characteristics: Purpose of accessibility analysis and planning issue
AIs are defined in this study as support planning tools, which incorporate transport planning and spa-tial planning aspects by making use of accessibility concepts and indicators. In some cases, the spatial component prevails over that of transport planning or vice versa, according to the specific purpose of accessibility analysis. Based on this main difference, the analyzed AIs were clustered into three categories (see Figure 1) in detail as follows:
• Multiple planning oriented: This group contains the AIs that can be applied for different aims.• Transport planning oriented: The second group encompasses AIs that are mainly aimed at man-
aging, encouraging, or reducing the use of a particular transport mode (i.e., oriented toward transport planning). This category of AIs includes public transport or road journey planners that focus on calculating the time required to reach a desired destination.
• Land-use planning oriented: To the third group belong AIs mostly focused on giving answers to spatial planning issues, such as deciding on the location of a specific activity and that help providers, such as public transport operators, retailers, and educational or health service orga-nizations, carry out strategic planning by analyzing the perceived needs of potential customers within defined catchment areas. Within this group, some AIs were created to support policies or decisions in specific sectors such as retail, education, health, or leisure services (TRACE and IMaFa), but others were conceived to take into account several different activities (SAL and GraBAM). One AI (EMM) has the objective of stimulating economic development. Economic and social equity goals are covered by three AIs (SNAMUTS, RIN, and ATI). Other interesting questions concerning equity arise in some of the AIs; for example, SNAPTA has been designed to evaluate the spatial accessibility and social equity of an urban public transport system. Cur-rently, SNAPTA has been applied to the Edinburgh transport network to analyze spatial acces-sibility and equality in the distribution of urban services, and the impact that planned transport projects in the local transport strategy will have on spatial accessibility by public transport. It is therefore used for both ex-post and ex-ante evaluation of public transport services.

6 JOURNAL OF TRANSPORT AND LAND USE: ARTICLE IN PRESS
Figure 1: AI clusters according to the purpose of accessibility analysis and nature of the planning issue
With regard to their relationship with the user, AIs can be categorized as described in Figure 2 and grouped into the following clusters:
• PDS: Passive Decision Support instruments, which aid the process of decision making, but cannot identify explicit decision suggestions or solutions (PST and SAL).
• ADS: Active Decision Support instruments, which can identify such decision suggestions or solutions (GraBAM, MaReSi SC, and RIN).
• CDS: Cooperative Decision Support instruments, which allow the decision maker to modify, complete, or refine the decision suggestions provided by the system before sending them back to the system for validation (UrbCA, ATRaPT, GDATi, MoSC, TRACE).
• Ex-post evaluation instruments (MARS, ASAMeD, SNAPTA, SoSINeTi) used in undertaking a review of a land-use and transport plan.
• SPS: Strategic Planning Support instruments (ATI, EMM, HIMMELI, IMaFa, INViTo, JAD, SNAMUTS), which have been developed to be used to define strategic interventions for long-term planning.
To decide on location activities
To manage the use of a particular transport mode(s)
To ensure economic equity
To ensure social equity and/or cohesion
To stimulate economic development
Others
SNAM
UTS
RIN
ATI
JAD
EMM
ASAM
eD
PST
IMaF
a
SoSI
NeT
i
HIM
MEL
I
ATR
aPT
INVi
To
MAR
S
MoS
C
SNAP
TA
TRAC
E
Urb
CA
GD
ATI
Gra
BAM
MaR
eSi S
C
SAL
Multiple planning goals oriented
Land use planning oriented
Transport
planning oriented

7Accessibility intruments for planning practice: A review of European experiences
Figure 2: AI clusters according to the relationship with the user
AIs also have different intended roles. The main motivations to develop an AI can be roughly divided into three categories: policy and planning support, scientific enquiry, or a combination of the two. Since the borders between these categories are not always clearly defined (Hull, Silva, and Bertolini 2012), the survey specifically asked AI developers to choose the specific role or roles for which the AI was designed, from among the following options: to create new insights, to justify decisions and positions already taken, to support strategy or option generation or selection, or to support the integration of urban plan-ning perspectives (Figure 3). According to this categorization, two AIs (PST and UrbCA) claim to have all the above-mentioned functions, and 12 of the analyzed AIs (including the two above) have multiple roles in urban planning, focusing on most of the different roles for which planning support systems are generally developed. Nine AIs have more specific roles, concentrating on one of two of these roles at a time. Looking in greater detail, within the AIs primarily motivated by a policy support aim, two groups can be identified. One group is primarily directed at supporting policy development in an integrated way, incorporating both transport and land-use implications and working with multiple and diverse stakeholders. Examples are SNAMUTS, EMM, InViTo, MARS, and JAD. A second group aims to develop tools for the evaluation of existing or proposed provision of services such as transport, retail and/or health care. Examples are TRACE, RIN, MaReSi SC, IMaFa, and SNAPTA. On the other extreme of the spectrum are AIs originally created for scientific enquiry, although in these tools the potential relevance for planning is also envisaged. In this category fall HIMMELI, GDATI, UrbCA, and SoSI-NeTi. An intermediate category is motivated by the need to apply to planning practice insights that have already been fairly well consolidated in the scientific domain. The space syntax–inspired AIs, namely ASAMeD, MoSC, and PST, fall into this category. Other examples are GraBAM, SAL, and ATI.
Passive Decision Support instruments
Active Decision Support instruments
Cooperative Decision Support instruments
Ex-post Evaluation Support instruments
Strategic Planning Support instruments
PST
SAL
Gra
BAM
MaR
eSi S
C
RIN
Urb
CA
ATR
aPT
GD
ATI
MoS
C
TRAC
E
MAR
S
ASAM
eD
SNAP
TA
SoSI
NeT
i
ATI
EMM
HIM
MEL
I
IMaF
a
INVi
To
JAD
SNAM
UTS
PDS
ADS
CDS
ex-post ES
SPS

8 JOURNAL OF TRANSPORT AND LAND USE: ARTICLE IN PRESS
Figure 3: AI clusters according to intended role
3.2 AI characteristics: Accessibility measures
One key element that distinguishes the AIs is the type of accessibility indicators that they use. A review of the literature reveals numerous studies that have attempted to classify such measures (Geurs and van Eck 2001; Geurs and van Wee 2004; Halden 2003; Curl, Nelson, and Anable 2015). The various ap-proaches differ in their level of complexity and practical applicability. In this paper we refer to the fol-lowing categories of accessibility indicators:
• Spatial separation measures or infrastructural-based measures: These relate to the performance of the transport supply network and include measures of travel impediment, such as physical distance (by mode), travel time (by mode), travel time (by network status—congestion, free-flow), and travel cost.
• Contour or cumulative measures: These represent the accessibility at a location to another or to a set of destinations, counting the number of opportunities reachable in a given travel time, dis-tance or cost, or measuring the time or cost required to access a fixed number of opportunities.
• Gravity-based measures: Based on the concept of attraction and impedance, these can be con-sidered as an extension of cumulative measures, with the use of weight opportunities by an impedance factor (i.e., travel time, distance, generalized cost, etc.) and the attractiveness of the destination (i.e., the distribution of population, employment, income, etc.).
• Network measures: This group of measures, based on graph theory and network analysis, corre-lates accessibility with topological measures of the transportation network (Curtis and Scheurer 2010).
• Activity-based measures/time-space measures: These relate to individuals’ level of ac-cess to spatially distributed activities, consider location of activities, travel through the network, and incorporate a behavioral element, usually captured via travel diary data.
• Utility-based measures: These include individual behavior characteristics in accessibility and are supported by travel behavior theories. They consider the likelihood of an individual making a certain travel choice based on the maximization on his/her utility. The measure of accessibility defined in this way is in monetary units.
To create new insights
To justify decisions/ positions already taken
To support strategy/ option generation
To support strategy/ option selection
To support integration of urban planning perspectives
Other
PST
Urb
CA
MAR
S
ASAM
eD
EMM
INVi
To
SAL
SNAM
UTS
ATR
aPT
IMaF
a
TRAC
E
RIN
HIM
MEL
I
JAD
GD
ATI
Gra
BAM
SNAP
TA
ATI
MaR
eSi S
C
MoS
C
SoSI
NeT
i
Multiple role
Specifice role

9Accessibility intruments for planning practice: A review of European experiences
Figure 4 shows that the analyzed AIs make use of a combination of accessibility indicators, which differ in each case. This may be because the new wave of AI developers is less dependent on land-use and trans-portation models and their computing infrastructure. The variation in approaches covers the spatial unit for analysis, the range of socioeconomic groups and spatial opportunities included, the mode of travel, the origins and destinations, the attractiveness of the destinations, and the travel impedance.
The spatial unit for accessibility analysis in some AIs is a zone (such as a census tract); in others it is a building block, a household or an individual. The travel mode in some cases is walking or cycling; in others it is private cars, buses, trains, trams, or a combination (see Figure 6). The attractiveness of spatial opportunities is in some AIs the number of activities, their physical size, or their economic value (for instance, the number of jobs). Travel impedance, representing the spatial separation between an origin and a destination, is measured in some cases in terms of distance, time or cost; in others it is estimated by straight-line distance or network distance or calculated by network models that simulate travel demand and congestion levels (Liu and Zhu 2004).
Seven AIs are attached to only one of these measures; the others use combinations of accessibility measures in their analysis. It is worth noting the continual advancement of AIs that measure only the physical and morphological aspects of space and define accessibility in terms of the topological net-work properties of urban space, using transportation and other networks based on visual perception. ASAMeD and MoSC are examples of these AIs, which are based strongly on the space syntax approach.
The theoretical underpinnings in defining the accessibility measures in the AIs vary from geography to architecture. Just under half of the AIs utilize gravity-based accessibility measures and are thus related to the modeling tradition of urban geography. AIs that emphasize the spatial and structural properties of urban environments are mostly related to the space syntax school, which has its origins in architecture and urban morphology. AIs that are part of larger model structures, such as HIMMELI and UrbCA, are related to different traditions of modeling theories, such as systems theory, complexity theory, and the theory of cellular automata. Many AI developers did not report having any theoretical underpin-nings, but stated that the tools were merely developed for normative planning purposes (Hull, Silva, and Bertolini 2012). The techniques for computing accessibility vary from spatial syntax (ASaMEd, MoSC, PST) and gravity models (SNAMUTS, TRACE, EMM, GraBAM, SNAPTA) to activity-based (SAL), social-based (JAD, MaReSi SC, SoSINeTi) and clustering (SAL) approaches.
The types of measures most often used in the AIs analyzed are based on spatial separation and cu-mulative accessibility measures. The use of more complex measures such as time-space measures seems, according to developers, too difficult to explain to stakeholders, as well as being difficult to compare longitudinally.
10 JOURNAL OF TRANSPORT AND LAND USE: ARTICLE IN PRESS
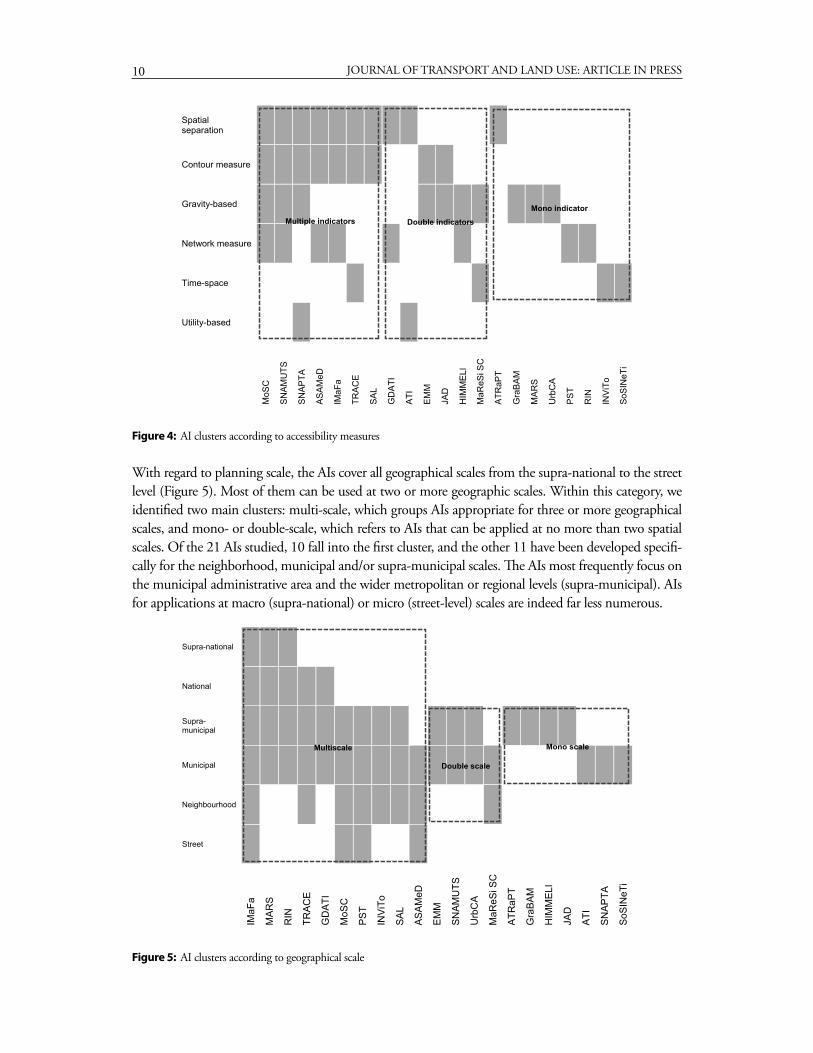
Figure 4: AI clusters according to accessibility measures
With regard to planning scale, the AIs cover all geographical scales from the supra-national to the street level (Figure 5). Most of them can be used at two or more geographic scales. Within this category, we identified two main clusters: multi-scale, which groups AIs appropriate for three or more geographical scales, and mono- or double-scale, which refers to AIs that can be applied at no more than two spatial scales. Of the 21 AIs studied, 10 fall into the first cluster, and the other 11 have been developed specifi-cally for the neighborhood, municipal and/or supra-municipal scales. The AIs most frequently focus on the municipal administrative area and the wider metropolitan or regional levels (supra-municipal). AIs for applications at macro (supra-national) or micro (street-level) scales are indeed far less numerous.
Figure 5: AI clusters according to geographical scale
Spatial separation
Contour measure
Gravity-based
Network measure
Time-space
Utility-based
MoS
C
SNAM
UTS
SNAP
TA
ASAM
eD
IMaF
a
TRAC
E
SAL
GD
ATI
ATI
EMM
JAD
HIM
MEL
I
MaR
eSi S
C
ATR
aPT
Gra
BAM
MAR
S
Urb
CA
PST
RIN
INVi
To
SoSI
NeT
i
Multiple indicators Double indicators
Mono indicator
Supra-national
National
Supra-municipal
Municipal
Neighbourhood
Street
IMaF
a
MAR
S
RIN
TRAC
E
GD
ATI
MoS
C
PST
INVi
To
SAL
ASAM
eD
EMM
SNAM
UTS
Urb
CA
MaR
eSi S
C
ATR
aPT
Gra
BAM
HIM
MEL
I
JAD
ATI
SNAP
TA
SoSI
NeT
i
Double scale
Multiscale Mono scale

11Accessibility intruments for planning practice: A review of European experiences
AIs also cover different transport modes or, in most cases, combinations of them (Figure 6). All the main transport modes are covered in the AIs analyzed, with a prevalence of AIs that focus on the accessibility of public transport. With regard to multimodal approaches, we found that some AIs can incorporate any mode (such as MaReSi SC, MARS, EMM, RIN, and SAL). Most AIs consider more than one transport mode, but AIs dedicated exclusively to a single mode exist for car accessibility (HIMMELI and UrbCA) and for public transport (ATRaPT, SNAMUTS, SNPTA, GDATI, and SoSINeTi).
Figure 6: AI clustering according to transport mode
With regard to trip purposes, most of the AIs account for all purposes (i.e., work, leisure, healthcare, shopping, and education). Some of these use an aggregate measure and are thus unable to specify acces-sibility related to particular activities, whereas others can consider accessibility for any particular activity type. Among the remaining AIs, a primary emphasis on work and shopping activities can be inferred (Figure 7).
Car
Public transport
Walking
Bicycle
Other
Not applicable
MaR
eSi S
C
MAR
S
EMM
RIN
SAL
JAD
Gra
BAM
INVi
To
HIM
MEL
I
Urb
CA
IMaF
a
ATR
aPT
GD
ATI
SNAM
UTS
SNAP
TA
SoSI
NeT
i
ASAM
eD
PST
MoS
C
ATI
TRAC
E
Multi modal
Car
Sustainable mobility

12 JOURNAL OF TRANSPORT AND LAND USE: ARTICLE IN PRESS
Figure 7: AI clustering according to trip purpose
3.3 AI characteristics: Representation of the analytical results
The output from the AIs varies from the provision of a complex dataset to relatively simple maps and graphs that help planners understand the spatial dimensions of the key accessibility statistics. Sometimes the output is solely numerical and listed in tables, matrices, or datasheets, without offering any kind of visual outcome (i.e. TRACE, MaReSi SC, GDATI, ATI, and SoSINETi). On the other hand, most of the AIs generate a visual product, generally represented by bi-dimensional maps, thus highlighting the importance of visual communication for planning analysis and practice.
The main categories in the different approaches to visualization can be described as follows (see Figure 8):
• 2D areal aggregation: Data are grouped in macro-zones and classified on the basis of a color scale.
• 2D axis-based maps: Data are defined by the road network (i.e., space syntax–based AIs) or by lines connecting points, and the color of shapes defines the intensity of values.
• 2D point-based maps: Data are represented by points on 2D maps, and the size and color of shapes define the intensity of values.
All purposes
Work
Education
Healthcare
Shopping
Leisure
Other
Not applicable
EMM
JAD
MoS
C
PST
RIN
SAL
SNAM
UTS
SNAP
TA
Urb
CA
IMaF
a
Gra
BAM
MAR
S
HIM
MEL
I
MaR
eSi S
C
TRAC
E
ATR
aPT
ASAM
eD
ATI
GD
ATI
INVi
To
SoSI
NeT
i
Any purpose
Commuting trips
Non-commuting trips

13Accessibility intruments for planning practice: A review of European experiences
Figure 8: Examples of visualization output
4 Perceived usability of AIs for planning practice
In addition to describing the operational characteristics of their AIs, the 21 AI developers were asked to assess the usability of their AIs in planning practice. This section deals specifically with the developers’ perceptions of the following items:
• The potential users of their AIs (i.e., for whom the AIs were developed (Figure 9).• The performance and requirements of their AIs on specific issues that influence usability (Figure
10).• The institutional barriers blocking their use in practice (Figure 11).
All AIs have been developed for use in spatial planning. Most of them (17 out of 21) have been de-veloped for spatial and transport planners. This prevalence is in line with the academic literature, which points to the importance of accessibility measures in the integration of land-use and transport planning. The third most significant potential group of AI users consists of researchers and developers themselves, showing the importance of research activities in developing AIs. Nevertheless, regardless of their role in research, AI developers seem to have a genuine interest in seeing their AIs used for practical planning purposes. Analysis of this issue revealed two complementary groups of clusters:
• The main user types for each AI (represented by dotted black boxes in Figure 9). • The range of users of each AI (represented by dotted red boxes in Figure 9).
Regarding user types, the AIs can be grouped into three main clusters: spatial and transport plan-ners, researchers, and others (which encompasses seven additional types, as shown in Figure 9). As for the range of users, almost half of the AIs reviewed in this study were developed for more than three dif-ferent end-user types. These are categorized as broad-band AIs, since they have a broad range of potential users. Within this cluster we can find AIs fitting the needs of almost every user type considered in the survey.
Example of 2D AREAL AGGREGATION (GraBAM)
Example of 2D AXIS-BASED MAPS (MoSC)
Example of 2D POINT-BASED MAPS (HIMMELI)

14 JOURNAL OF TRANSPORT AND LAND USE: ARTICLE IN PRESS
Figure 9: Perceived usability of AIs: potential users (N=21)
Developers gave their own evaluations of their AI’s performance and requirements on specific issues in-fluencing usability, on a scale of one (poorest performance or being the most demanding to implement) to seven (best performance or being the least demanding to implement).
Figure 10 shows the distribution of developers’ perceptions of the performance and requirements of their AI for each issue under evaluation. Of the 21 AIs whose developers responded to the survey, only 19 were considered to have valid responses to these questions (and there were only 18 on the issue of “understanding policy context”). Figure 10 also presents the average score of the 19 AIs for each issue.
On all but one issue under evaluation, at least one developer had full confidence (i.e., giving a rating of seven) in the performance or requirements of his or her AI. This result is as anticipated, since AI developers could be expected to believe in the capabilities of their own products. The one exception concerned the spatial awareness skills required of practitioners seeking to implement the AI. This result is also easily understood, considering the conceptual complexity of accessibility measurement and its strong mutual relationship with the spatial environment. It is unreasonable to expect that an AI would require no spatial awareness skills on the part of its users.
When we look at the opposite side of the performance scale, i.e., where the performance ratings are lowest, the results are not as homogeneous. Although on some issues, such as speed or spatial awareness, a few developers gave scores as low as one to their own AIs, on other issues even the weakest AIs (ac-cording to the perceptions of their developers) present fair or average performance or requirements. For instance, on the issue of understandability of outputs, scores ranged from four to seven, showing high developer confidence in the quality of numerical or spatial outputs generated by their AI.
Spatial/urban planners
Transport planners
Developers/ researchers
Health service planners
Education service planners
Politicians
Retailers
Citizens
Instrument initiators
ASAM
eD
ATR
aPT
SNAP
TA
INVi
To
TRAC
E
ATI
SNAM
UTS
GD
ATI
IMaF
a
SAL
JAD
EMM
MAR
S
HIM
MEL
I
PST
Gra
BAM
RIN
MaR
eSi S
C
MoS
C
SoSI
NeT
i
Urb
CA
Broad band Narrow band
Researchers
Others
Spatial/ transport planners

15Accessibility intruments for planning practice: A review of European experiences
Figure 10: Perceived usability of AIs (The number of valid responses was 19 in all cases except “understanding policy context,” which had only 18 valid responses. Data here presented are available on a per instrument scale and AI single ranks are available on the COST Action’s website at www.accessibilityplanning.eu.)
In general, developers seem to be less confident in the performance of their AIs with regard to ease of operation (average score of 3.6), speed (average score of 3.9) and ease of collecting data (average score of 4.3). They are also less confident with regard to the level of demand imposed on users’ spatial aware-ness skills (average score of 3.5) and their modeling and computational skills (average score of 3.5), as well as the AI’s understanding of the policy context (average score of 4.4). With regard to requirements, modeling and computational skills stand out as the requirement found to be very demanding by almost 20 percent of the AI developers. Although it is possible to find some developers who recognize their own AI’s subpar performance on some issues, the average ratings reveal medium or higher levels of con-fidence among most of them. It is thus fair to say that, even on the issues that developers recognize as most challenging, the results suggest that they still believe their AIs perform quite well. Detailed results on perceived usability for AIs are available in Hull, Silva, and Bertolini (2012).
All the remaining issues present an average score between five and six, with the highest average scores granted on quality of data and quality of calculations. We can also see that transparency, quality of data, quality of calculations, and visual representation are all issues on which most developers (around 80 percent) ranked their AIs as above average (five or higher). Of these, quality of calculations shows the greatest number of developers with very high confidence, as seven out of 19 gave their AI a rating of seven. Accuracy of the models, flexibility, and production of understandable outputs were also gener-ally perceived very positively by developers, with around 70 percent considering their AIs as performing above average in these areas.
0% 20% 40% 60% 80% 100%
Quality of dataQuality of calculationsAccuracy of the model
Speed of the instrumentEase of collecting data
Ease to playTransparency
FlexibilityUnderstandable output
Visual representationModelling and computational skills
Spatial awareness skillsUnderstanding policy context
1 2 3 4 5 6 7
Mean N*5.5 195.5 195.1 193.9 194.3 193.6 195.4 195.4 195.4 195.4 193.5 193.5 194.4 18

16 JOURNAL OF TRANSPORT AND LAND USE: ARTICLE IN PRESS
Figure 11: Perceived usability of AIs: developers’ perceptions of institutional barriers blocking their use (N=21)
Finally, the developers’ perspectives on institutional barriers blocking the use of AIs in practice indicated that data availability and the separation of urban and transport planning institutions are the main rea-sons for the low level of AI implementation. All potential barriers mentioned in the survey were identi-fied by at least several AI developers as constraining practical implementation. In addition, three further barriers were suggested by respondents (in the portion of the survey that invited additional comments):
• “Accessibility is not seen as priority (rather mobility).”• “Resources including time available to planning agencies to engage in such deliberation.”• “Black boxing and competing analyses (non-transparent, non-understandable, incomprehen-
sible assumptions, etc.) from the initiators’ consultants.”
5 Conclusion and discussion
The paper provided an updated framework on the tools for accessibility analysis and planning that have been developed over the last decade in Europe. The research first of all shows the emergence of accessibil-ity planning in many European countries and furthermore uncovers the highly cross-sectorial nature of accessibility planning and diversity of approaches using accessibility measures in planning instruments. This variety is partly explained by the backgrounds of the AI developers, which range from architecture, to engineering, to geography, and transport and land-use planning, but also by the different cultural and planning contexts in which they are developed and used.
With regard to the first research question on how urban and transport planners are developing accessibility planning tools, the paper shows a set of the most recent AIs, the purposes of accessibility analysis, the natures of planning issues, accessibility indicators used and the representation of the analyti-cal results chosen by AI developers. One key aspect is that, in line with the assumption that accessibility is a complex, multi-dimensional concept, AIs incorporate a variety of indicators, each of which is specifi-cally designed to explain one specific aspect of accessibility. In any case, although cumulative measure pitfalls are clearly demonstrated in the literature (Curl, Nelson, and Anable 2015), they remain the most widely used in AIs for planning practice and policy development.
In relation to the second research question on the AI developers’ usability perception, the paper showed that more common context barriers limiting the use of AIs in practice are data availability and
26%
20%
15%
9%
13%
11%
6%
Data availability
Separate urban andtransport planninginstitutionsFormal processes
Different planningobjectives/ and assumptions
Political commitment
Staff technical skills
Financial arrangements

17Accessibility intruments for planning practice: A review of European experiences
the separation of urban and transport planning institutions. With regard to AI performances, calcula-tion slowness, and lack of playability are considered the most important barriers for the implementation; according to the developers’ perspective, AIs should be simple, plain, easy to understand, and consistent with the intended uses. In short, there should be a good balance between their scientific rigor (sound-ness) and their practical relevance (plainness).
Future research steps should focus on adjusting this imbalance, both in academic research and in accessibility planning practice. This can be done by incorporating prospective users in the process of improving existing AIs or developing new ones and in gaining further insights into the perceptions and experiences of the intended users of the AIs. Both paths were explored in other phases of the COST Action TU1002 (te Brömmelstroet, Silva, and Bertolini 2014).
Acknowledgements
The authors would like to acknowledge the valuable contribution of all the members of the COST Action TU1002 to the work presented in this paper, as well as the COST Office for funding Action TU1002.
References
Arce-Ruiz, R., E. Calderón, A. Condeço-Melhorado, and E. Ortega. 2012. Isochrone maps to facilities. Shopping centers in the Metrosur Influence Area (IMaFa), In Accessibility Instruments for Planning Practice, edited by A. Hull, C. Silva, and L. Bertolini: COST Office. ISBN: 978-989-20-3187-3.
Bertolini, L. 2012. Integrating mobility and urban development agendas: A manifesto. disP—The Plan-ning Review 48(1): 1–26. doi: 10.1080/02513625.2012.702956.
Büttner, B., J. Keller, and G. Wulfhorst. 2012. Erreichbarkeitsatlas der europäischen metropolregion München (EMM). In Accessibility Instruments for Planning Practice, edited by A. Hull, C. Silva, and L. Bertolini: COST Office. ISBN: 978-989-20-3187-3.
Charalambous, N., and M. Mavridou. 2012. Space syntax: Spatial integration accessibility and angular segment analysis by metric distance (ASAMeD). In Accessibility Instruments for Planning Practice, edited by A. Hull, C. Silva, and L. Bertolini: COST Office. ISBN: 978-989-20-3187-3.
Curl, A., J. D. Nelson, and J. Anable. 2015. Same question, different answer: A comparison of GIS-based journey time accessibility with self-reported measures from the National Travel Survey in England. Computers, Environment and Urban Systems 49: 86–97. doi: 10.1016/j.compenvurb-sys.2013.10.006.
Curtis, C., and J. Scheurer. 2010. Planning for sustainable accessibility: Developing tools to aid discus-sion and decision-making. Progress in Planning 74(2): 53–106. doi: 10.1016/j.progress.2010.05.001.
Ferreira, A., E. Beukers, and M. te Brömmelstroet. 2012. Accessibility is gold, mobility is not: A pro-posal for the improvement of Dutch transport-related cost-benefit analysis. Environment and Plan-ning B: Planning and Design 39(4): 683–697. doi: 10.1068/b38073.
Gerlach, J. 2012. The German guidelines for integrated network design—binding accessibility stan-dards (RIN), In Accessibility Instruments for Planning Practice, edited by A. Hull, C. Silva, and L. Bertolini: COST Office. ISBN: 978-989-20-3187-3.
Geurs, K. T., and J. R. R. van Eck. 2001. Accessibility Measures: Review and Applications: Evaluation of Accessibility Impacts of Land-use Transport Scenarios, and Related Social and Economic Impacts. Na-tional Institute for Public Health and the Environment. RIVM report 408505 00. www.rivm.nl.
18 JOURNAL OF TRANSPORT AND LAND USE: ARTICLE IN PRESS
Geurs, K. T., and B. van Wee. 2004. Accessibility evaluation of land-use and transport strategies: Re-view and research directions. Journal of Transport Geography 12(2): 127–140. doi: http://dx.doi.org/10.1016/j.jtrangeo.2003.10.005.
Halden, D. 2003. Accessibility analysis: concepts and their application to transport policy,programme and project evaluation. In Transport Projects, Programmes and Policies: Evaluation Needs and Capabili-ties, edited by A. Pearman, P. Mackie, and J. Nellthorp. Ashgate, Hampshire.
Handy, S. L. 2002. Accessibility vs. Mobility-Enhancing Strategies for Addressing Automobile Dependence in the US. Davis, California: Institute of Transportation Studies, University of California, Davis.
Handy, S. L., and D. A. Niemeier. 1997. Measuring accessibility: An exploration of issues and alterna-tives. Environment and Planning A 29(7): 1175–1194. doi: 10.1068/a291175.
Höemke, M. 2012. Social spatial influences of new transport infrastructure (SoSINeTi). In Accessibility Instruments for Planning Practice, edited by A. Hull, C. Silva, and L. Bertolini: COST Office. ISBN: 978-989-20-3187-3.
Holden, M. 2012. Is integrated planning any more than the sum of its parts? Considerations for planning sustainable cities. Journal of Planning Education and Research 32(3): 305–318. doi: 10.1177/0739456X12449483.
Hull, A., and S. Karou. 2012. Spatial network analysis of public transport accessibility (SNAPTA). In Accessibility Instruments for Planning Practice, edited by A. Hull, C. Silva, and L. Bertolini: COST Office. ISBN: 978-989-20-3187-3.
Hull, A., C. Silva, and L. Bertolini, eds. 2012. Accessibility Instruments for Planning Practice: COST Of-fice. ISBN: 978-989-20-3187-3.
Iltanen, S. 2012. Heuristic three-level instrument combining urban morphology, mobility, service envi-ronments and locational information (HIMMELI). In Accessibility Instruments for Planning Practice, edited by A. Hull, C. Silva, and L. Bertolini: COST Office. ISBN: 978-989-20-3187-3.
Kovač, M. Š., P. Pergar, and M. Sitar. 2012. From accessibility to the land development potential (ATI). In Accessibility Instruments for Planning Practice, edited by A. Hull, C. Silva, and L. Bertolini: COST Office. ISBN: 978-989-20-3187-3.
Liu, S., and X. Zhu. 2004. Accessibility analyst: An integrated GIS tool for accessibility analysis in urban transportation planning. Environment and Planning B 31(1): 105–124. doi: 10.1068/b305
Makrí, M. B. 2001. Accessibility indices. A tool for comprehensive land-use planning. Proceedings of the TLEnet 5th workshop, The Nordic Research Network on Modeling Transport, Land-Use and the Environ-ment, Nynäshamn, Sweden.
Nuzzolo, A., P. Coppola, and E. Papa. 2014. Marginal activity access cost (MAAC): A new indicator for sustainable land use/transport (LUT) planning. Procedia-Social and Behavioral Sciences 111: 450–459. doi: 10.1016/j.sbspro.2014.01.078.
Papa, E., and P. Coppola. 2012. Gravity-based accessibility measures for integrated transport-land use planning (GraBAM). In Accessibility Instruments for Planning Practice, edited by A. Hull, C. Silva, and L. Bertolini: COST Office. ISBN: 978-989-20-3187-3.
Pensa, S., and E. Masala. 2013. InViTo: An onteractive visualisation tool to support spatial decision processes. Technologies for Urban and Spatial Planning: Virtual Cities and Territories. Hershey, PA: IGI Global. doi:10.4018/978-1-4666-4349-9.
Pfaffenbichler, P., G. Emberger, and S. Shepherd. 2010. A system dynamics approach to land use trans-port interaction modeling: The strategic model MARS and its application. System Dynamics Review 26 (3): 262–282. doi: 10.1002/sdr.451.
Pinto, N. N., and B. Santos. 2012. Cellular automata modeling for accessibility appraisal in spatial plans (UrbCA). In Accessibility Instruments for Planning Practice, edited by A. Hull, C. Silva, and L.

19Accessibility intruments for planning practice: A review of European experiences
Bertolini: COST Office. ISBN: 978-989-20-3187-3.Silva, C., and P. Pinho. 2010. The structural accessibility layer (SAL): Revealing how urban structure
constraints travel choice. Environment and Planning A 42: 2735–2752. doi: 10.1068/a42477.Stead, D., H. Geerlings, and E. Meijers. 2004. Policy Integration in Practice: The Integration of Land Use
Planning, Transport and Environmental Policy Making in Denmark, England and Germany. Delft, The Netherlands: Delft University Press.
Straatemeier, T. 2008. How to plan for regional accessibility? Transport Policy 15(2): 127–137. doi: 10.1016/j.tranpol.2007.10.002.
Straatemeier, T. 2012. Joint-accessibility design (JAD). In Accessibility Instruments for Planning Practice, edited by A. Hull, C. Silva, and L. Bertolini: COST Office. ISBN: 978-989-20-3187-3.
Te Brömmelstroet, M. 2010. Equip the warrior instead of manning the equipment: Land use and transport planning support in the Netherlands. Journal of Transport and Land Use 3(1): 25–41. doi: http://dx.doi.org/10.5198/jtlu.v3i1.99.
Te Brömmelstroet, M., and L. Bertolini. 2010. Integrating land use and transport knowledge in strate-gy-making. Transportation 37(1): 85–104. doi: 10.1007/s11116-009-9221-0.
Te Brömmelstroet, M., C. Silva, L. Bertolini, eds. 2014. Assessing Usability of Accessibility Instruments: COST Office. ISBN 978-90-9028212-1.
Tennøy, A. 2012. Method for arriving at maximum recommendable size of shopping centers (MaReSi SC). In Accessibility Instruments for Planning Practice, edited by A. Hull, C. Silva, and L. Bertolini: COST Office. ISBN: 978-989-20-3187-3.
Trova, V. 2012. Measures of street connectivity: Spatialist lines (MoSC). In Accessibility Instruments for Planning Practice, edited by A. Hull, C. Silva, and L. Bertolini: COST Office. ISBN: 978-989-20-3187-3.
Verhetsel, A., J. Cant, and T. Vanoutrive. 2012. Retail cluster accessibility (TRACE). In Accessibility Instruments for Planning Practice, edited by A. Hull, C. Silva, and L. Bertolini: COST Office. ISBN: 978-989-20-3187-3.
Zakowska, L., W. Starowicz, and S. Pulawska. 2012. Geographic/demographic accessibility of transport Infrastructure (GDATI). In Accessibility Instruments for Planning Practice, edited by A. Hull, C. Silva, and L. Bertolini: COST Office. ISBN: 978-989-20-3187-3.
Related Documents