Accepted Manuscript Thunderstorm characteristics favouring downward and upward lightning to wind turbines Nicolau Pineda, Joan Montanyà, Albert Salvador, Oscar A. van der Velde, Jesús A. López PII: S0169-8095(18)30073-5 DOI: doi:10.1016/j.atmosres.2018.07.012 Reference: ATMOS 4317 To appear in: Atmospheric Research Received date: 16 January 2018 Revised date: 10 July 2018 Accepted date: 10 July 2018 Please cite this article as: Nicolau Pineda, Joan Montanyà, Albert Salvador, Oscar A. van der Velde, Jesús A. López , Thunderstorm characteristics favouring downward and upward lightning to wind turbines. Atmos (2018), doi:10.1016/j.atmosres.2018.07.012 This is a PDF file of an unedited manuscript that has been accepted for publication. As a service to our customers we are providing this early version of the manuscript. The manuscript will undergo copyediting, typesetting, and review of the resulting proof before it is published in its final form. Please note that during the production process errors may be discovered which could affect the content, and all legal disclaimers that apply to the journal pertain.

Welcome message from author
This document is posted to help you gain knowledge. Please leave a comment to let me know what you think about it! Share it to your friends and learn new things together.
Transcript

Accepted Manuscript
Thunderstorm characteristics favouring downward and upwardlightning to wind turbines
Nicolau Pineda, Joan Montanyà, Albert Salvador, Oscar A. vander Velde, Jesús A. López
PII: S0169-8095(18)30073-5DOI: doi:10.1016/j.atmosres.2018.07.012Reference: ATMOS 4317
To appear in: Atmospheric Research
Received date: 16 January 2018Revised date: 10 July 2018Accepted date: 10 July 2018
Please cite this article as: Nicolau Pineda, Joan Montanyà, Albert Salvador, Oscar A. vander Velde, Jesús A. López , Thunderstorm characteristics favouring downward and upwardlightning to wind turbines. Atmos (2018), doi:10.1016/j.atmosres.2018.07.012
This is a PDF file of an unedited manuscript that has been accepted for publication. Asa service to our customers we are providing this early version of the manuscript. Themanuscript will undergo copyediting, typesetting, and review of the resulting proof beforeit is published in its final form. Please note that during the production process errors maybe discovered which could affect the content, and all legal disclaimers that apply to thejournal pertain.
ACC
EPTE
D M
ANU
SCR
IPT
THUNDERSTORM CHARACTERISTICS FAVOURING DOWNWARD AND
UPWARD LIGHTNING TO WIND TURBINES
Nicolau Pineda a,b
, Joan Montanyà a, Albert Salvador
a,b, Oscar A. van der Velde
a, Jesús A.
López a
a Lightning Research Group, Technical University of Catalonia, Carrer Colom 1, 08222 Terrassa, Spain
b Meteorological Service of Catalonia, Carrer Berlín 38-46, 08029 Barcelona, Spain
Contact: [email protected]
ABSTRACT
Meteorological conditions and thunderstorm characteristics related to lightning threats to wind turbines are
discussed in this paper. Due to the rotating blades, wind turbines may be regarded peculiar tall objects, more
susceptible to lightning strikes than other tall man-made structures. In the present study, Lightning Mapping
Array and weather radar observations allowed to draw a clear picture of the thunderstorm characteristics
leading to lightning strokes to wind turbines, in a coastal area of the Mediterranean basin. Results showed
that lightning threats to wind turbines tend to occur during transitional periods (spring and autumn),
although the main thunderstorm activity concentrates in the warm summer months. Thunderstorms with
downward strokes to wind turbines presented particular features, like a limited vertical development and a
dominant lower positive charge layer. Downward cloud-to-ground strokes hitting wind turbines were mainly
of negative polarity and with peak currents above the average. On the other hand, conditions for self-
initiated upwards from wind turbines resemble those reported in Japan and the U.S winter thunderstorms,
with low-cloud based large electrified stratiform regions. These particular conditions, leading to lightning
threats to wind turbines, should be properly included in lightning protection standards.
KEY WORDS: lightning mapping array, thunderstorm charge structure, downward and upward lightning,
wind turbines
1. INTRODUCTION
The observations of lightning strokes to tall objects have been extensively reported in the literature (e.g.
McEachron, 1939; Berger, 1967; Eriksson, 1978). A summary of the research efforts on this subject can be
found in Rakov and Uman (2003). Interest in lightning to tall structures has grown in recent years, in
particular due to the rapid expansion of wind energy globally (e.g. Rachidi et al., 2008; Foley et al., 2012).
Structures of limited height (below 100 m) will suffer from downward strikes whereas tall structures like
wind turbines (hereafter, WT) are more prone to initiate upward lightning (e.g. Rachidi et al., 2008; Zhou et
al., 2010). High towers (>100 m height) are exposed to strong local electric fields under thunderclouds,
being prone to initiate upward propagating leaders (Berger, 1967). Besides, local topography plays a role on
the effective height of the structure. Towers on mountain tops are said to have an effective height that is
considerably larger than the physical height of the tower (e.g. Risk 1990; Rachidi et al., 2008; Zhou et al.,
2010). The concept of effective height is used to account for the additional field distortion (enhancement)
ACCEPTED MANUSCRIPT

ACC
EPTE
D M
ANU
SCR
IPT
due to the presence of the mountain on which the structure is located (e.g. Pierce, 1971; Eriksson, 1978;
Risk, 1994; Zhou et al., 2010).
In addition, rotating blades make WT peculiar tall objects (almost 40% of the total turbine height is in
rotation). In this regard, a growing number of studies speculate whether a rotating WT is more susceptible to
lightning strikes than stationary turbines (e.g., Rachidi et al., 2008; Wang et al., 2008; Radicevic et al., 2012;
Wang and Takagi, 2012; Montanyà et al., 2014). According to Montanyà et al. (2014) the effect of rotation
induces an electric field growth rate, necessary for the initiation of stable leaders.
All in all, tall structures like multi-megawatt WT have a higher probability of being struck by lightning,
compared to their surroundings (e.g. Rachidi et al., 2008; Wang and Takagi, 2012). Indeed, lightning is one
of the major causes of severe damage to WT and add a significant cost to their operation and maintenance
(e.g. Braam et al., 2002; Minowa et al., 2006; Yasuda et al., 2012; Candela et al., 2014).
1.1. Type of lightning to tall structures
Lightning strikes can be divided into several categories, where the ones relevant to WT mainly concern
lightning polarity and the direction of initiation. Downward lightning occurs mainly under deep convection
(e.g. warm-season thunderstorms) and the threat to WT calculated in relation to the regional lightning
density (Ng). Downward discharges are predominantly of negative polarity, in correspondence with
lightning climatology (Rivas-Soriano et al., 2005; Pineda et al., 2011; Poelman et al., 2016).
As mentioned previously, tall structures above a certain height are prone to initiate upward lightning (UL).
Leaders may originate from WT due to locally strong electric fields (self-initiated upward lightning, SIUL)
or may be triggered by prior lightning discharges in the vicinity, which can provide the necessary electric
fields for the inception of an upward leader (lightning-triggered upward lightning, LTUL). Regarding WT,
Wang and Takagi (2012) noted that self-initiation occurred more frequently with higher observed wind
speeds (or a rotating windmill) compared with LTUL. It should be added here that upward propagating
leaders not followed by return stroke sequences can go unnoticed by conventional Lightning Location
Systems (LLS), and therefore the number of upward leaders from WT will be underestimated (e.g. March,
2017).
Despite the modest occurrence of winter lightning, compared to lightning activity associated to deep
convection, winter thunderstorms can produce very energetic lightning events (Zhou et al., 2012a; 2012b),
and a large amount of damage to sensitive tall structures such as WT (e.g. Shindo et al., 2012; Wang and
Takagi, 2012; Yokoyama, 2013; Honjo, 2015). The underlying reason is the low altitude of the cloud
charge, as well as the reduced or even absent lower positive charge region (Murphy et al., 1996; Montanyà
et al., 2007; Nag and Rakov, 2009; Williams, 2018). Although the highest winter lightning activity is
reported in Japan, Montanyà et al. (2016a) identified other areas prone to winter lightning such as parts of
the Mediterranean basin, the eastern coast of the US or in the Southern Hemisphere, Uruguay and its
surroundings. For example, Levin et al. (1996), Yair et al. (1998) and Altaratz et al. (1999) have reviewed
the meteorological conditions favouring lightning in the eastern Mediterranean. There, winter lightning
activity concentrates between December and February. Thunderclouds develop at the cold front or, within
the cold air mass, just immediately after passing through the “Cyprus lows” (Altaratz et al., 2001). This type
of storm is very similar to winter thunderstorms in western Japan (Michimoto, 1991; 1993), and is different
from the summertime, continental, mesoscale convective system type thunderclouds.
ACCEPTED MANUSCRIPT
ACC
EPTE
D M
ANU
SCR
IPT
1.2. Lightning risk assessment
Current lightning protection standards for WT (e.g. IEC 61400-24, 2010) rely on three main parameters: (i)
the lightning density (Ng) of the region where the wind farm is to be installed; (ii) the height of the wind
turbine itself and (iii) the environmental factor (Cd). Downward lightning is the most frequent type of
lightning and its incidence on a particular wind farm is related to the local Ng. Conversely, UL is only
considered in the standard within the environmental factor, among other factors like the complexity of local
terrain and the height above sea level. According to different authors (e.g. Rachidi et al., 2008; March 2017)
the majority of the strikes to modern turbines are expected to come from UL, and therefore a more realistic
approach to calculate its contribution is suggested (e.g. Chan et al., 2018). A proposal on how to account for
UL in protection standards is beyond the scope of this paper, but the aforementioned issues emphasise the
importance of expanding the knowledge on this topic.
1.3. Objectives
There has been very little study of the in-cloud components of UL from man-made structures. In recent
years, the use of high resolution lightning mapping systems and high-speed video have provided relevant
information about lightning occurrence on WT. Observations of lightning initiated by WT with a Lightning
Mapping Array (LMA) system (Van der Velde et al., 2011; Schultz et al., 2011; Montanyà et al., 2014;
Wang et al. 2017), as well as of direct impacts from downward strokes (Montanyà et al., 2016b) have been
recently presented. Bearing in mind the growing concern on the lightning impact on the wind power sector
as the wind farm deployment grows around the globe, it is of interest to analyse the meteorological context
that favours lightning to/from WT. In particular, our objective in the present study was to identify the
characteristics and common features of the thunderstorms that produced flashes striking WT in a coastal
area of the western Mediterranean basin. To this end, the analysis mainly relied on LMA, weather radar
volumetric data and temperature vertical profiles, to characterise thunderstorms that pose a threat to WT,
with special emphasis on the vertical charge structure.
The area of study (hereafter, AoS) is a hilly area in south Catalonia, near the river Ebre’s Delta, not far from
the coast on the western Mediterranean Sea (Fig. 1). Wind farms have been progressively deployed in the
AoS since 1995. Roughly speaking, wind farms consist of 25 to 50 small WT (40-80 m height), with a
baseline ranging from 150 to 250 m and produce from 5 to 50 MW. The AoS is an area largely covered by
meteorological observation systems, as it has been designed to cover the post launch Cal/Val field campaign
of the ASIM project (Neubert et al., 2006).
The organization of the paper is as follows: Section 2 describes the instrumentation and analysis technique;
Section 3 collects the results; Section 4 deals with the discussion of the results and finally section 5 presents
the concluding remarks.
2. INSTRUMENTATION AND ANALYSIS TECHNIQUES
2.1. Intra-cloud lightning
Intra-cloud (IC) lightning was measured with a LMA (Rison et al., 1999; Thomas et al., 2004) deployed in
the Ebre’s Delta during the summer of 2011 (Fig. 1). The LMA system detects lightning radio emissions in
the very high frequency range (VHF, 60–66 MHz) and locates them in three dimensions by a time-of-arrival
(TOA) technique. Each station samples, over 80 μs intervals, the maximum signal amplitude and its GPS-
ACCEPTED MANUSCRIPT

ACC
EPTE
D M
ANU
SCR
IPT
derived precise time, allowing to locate 2000 to 3000 sources per second coming from lightning channels
inside the cloud. The accuracy of the mapped source locations is expected to be within 10 m in the
horizontal dimension, 30 m in the vertical dimension and 40 ns in time (Thomas et al., 2004). This level of
accuracy allows identifying the upward leaders associated with a WT.
The so called Ebre Lightning Mapping Array (ELMA) is operated by the Lightning Research Group of the
Technical University of Catalonia (http://lrg.upc.edu/en). The initial six-station ELMA was expanded to 11
stations during 2012, enlarging the area of coverage. Details on the ELMA can be found in Van der Velde
and Montanyà (2013).
2.2. Cloud to ground lightning
Cloud-to-ground (CG) data is needed to complement the LMA, since the LMA only detects the cloud phase
of lightning. CG stroke information used in the current study was obtained from the LLS operated by the
Meteorological Service of Catalonia (SMC), composed by four VAISALA LS8000 stations covering the
region of Catalonia (NE Iberian Peninsula) including the AoS. CG return strokes are detected by a low
frequency (LF) sensor and located using a combination of TOA and Magnetic Direction Finding (MDF)
technique (Cummins and Murphy, 2009). Throughout the years of operation, the SMC-LLS performance has
been experimentally evaluated by means of electromagnetic field measurements and video recordings of
natural lightning in successive campaigns (Montanyà et al., 2006; 2012; Pineda and Montanyà, 2009). The
analysis of the 2013-campaign (Montanyà, 2014) establishes a CG flash detection efficiency for the SMC-
LLS around 80–85%.
Additionally, CG data from the European LINET network was available for the analysed events. LINET
employs TOA to detect CG lightning strokes in the very low frequency range Betz et al. (2009a). LINET
offers a location accuracy reaching an average value of around ∼150 m, as verified by CG strokes to towers
of known position (Betz et al. 2009a). More details about the LINET system can be found in Betz et al.
(2009b).
2.3. Weather Radar
In this work, we also took advantage of weather radar products. The SMC operates a weather radar network
in the Catalonia region, with “La Miranda” radar (N 41° 05′ 30.24″ E 0° 51′ 48.58″; 950 m above MSL)
located at 40–50 km of the AoS (Fig. 1). The SMC radars operate in C-band (5.600 to 5.650 MHz) and are
Doppler type. Polar volumes (radar reflectivity and radial velocity) are acquired every 6 min. Further
technical details of the SMC weather radars and network characteristics can be found in Bech et al. (2004)
and Argemí et al. (2014).
Since the introduction of weather radar, many studies have dealt with the necessary conditions for the
initiation of lightning (e.g. Workman and Reynolds, 1949; Reynolds and Brook, 1956; Larsen and
Stansbury, 1974; Dye et al. 1989; Buechler and Goodman, 1990; Hondl and Eilts, 1994). All in all, the onset
of significant electrification is associated with a rapid vertical development of convection, which allows the
presence of precipitation in the mixed phase region (i.e., the presence of small ice crystals and super-cooled
cloud water) above the height of the –10°C isotherm. Therefore, the appearance of a 30–40 dBZ or greater
radar echo at heights above the –10°C isotherm indicates the presence of a large enough quantity of
hydrometeors in the mixed phase region for electrical charging, and ultimately, lightning.
ACCEPTED MANUSCRIPT
ACC
EPTE
D M
ANU
SCR
IPT
To account for the thunderstorm vertical development, we worked with the radar echo top product, with 12
and 35 dBZ thresholds (that is, the maximum height reached by the 12/35 dBZ reflectivity echoes). Besides,
constant-altitude plan position indicator (CAPPI) at 1000 m AGL images, were used to analyse the storm
morphology.
2.4. Sounding vertical profiles
Reviews of charge structure (e.g. Khrehbiel, 1986; Williams, 1989) illustrate a relationship between the
height of electrical charge centres and the temperature profile. In this regard, the heights of the
representative environmental temperature values selected were obtained from the Barcelona radiosonde data
(Abellán et al., 2011). The Barcelona station (N 41º 23’ 4.08” E 2º 7’ 3.36”) takes part on the Global
Telecommunications Service (GTS) observations from 2008, with the code 08190.
Relying on the graupel–ice mechanism conceptual model to explain cloud electrification (e.g. Takahashi,
1978; MacGorman and Rust, 1998), the environmental temperatures selected in this study were –10°C and –
40°C, aiming to delimit the mixed-phase cloud region, where the main negative charge region resides
(MacGorman and Rust, 1998). In fact, many studies have reported a strong correlation between lightning
initiation and radar echoes at –10°C to –20°C levels (e.g. Krehbiel et al. 1984; Buechler and Goodman,
1990; Gremillion and Orville, 1999; Vincent et al., 2003; Yeung et al., 2007). Krehbiel et al. (1984) has
noted that this main negative charge region remains at fairly constant altitudes as the storm evolves.
Moreover, Tomine et al. (1986) and Michimoto (1991) have stated that these environmental temperatures
also apply to winter storms, despite taking place at rather low altitudes.
On the other hand, two instability indices derived from the Barcelona sounding were used to briefly
characterise the environment of the analysed thunderstorms: the CAPE (Convective Available Potential
Energy, Wallace and Hobbs, 1973), a common metric for the energy available in the environment for
thunderstorm growth; and the Lifting Condensation Level (LCL), used to estimate boundary layer cloud
heights (e.g., Stackpole, 1967).
2.5. Case study selection
Episodes with lightning flashes involving WT in the AoS were primarily identified by means of LINET CG
data. Since clusters of CG are often observed around tall structures (e.g. Betz et al., 2004; Diendorfer et al
2014, Nag et al 2015), the area with wind farms within the LMA coverage was systematically monitored,
looking for clusters of strokes in a buffer of 150 m around WT. Data from this first selection was manually
inspected using LMA data, searching for leaders ending or starting on WT. This exercise resulted in 5 case
studies. Besides, two summer thunderstorm episodes are included in the analysis, in order to have a
reference on the typical warm-season vertical charge structure for comparison.
2.6. Analysis technique
The analysis of the evolution of the vertical structure of the storm relied mainly on the evolution of the LMA
source density, two radar echo top products (12 and 35 dBZ) and temperature vertical profiles (–10°C and –
40°C). Besides, the vertical charge structure was inferred from the LMA observations for the periods when
lightning to/from WT occurred. In particular, we used the method developed by van der Velde and
Montanyà (2013), which uses a time-distance-altitude projection to identify the polarity of each IC leader
process from the inferred velocity of lightning channels. The LMA predominantly locates sources coming
from negative leaders moving through regions of positively charged cloud particles, with propagation speeds
ACCEPTED MANUSCRIPT

ACC
EPTE
D M
ANU
SCR
IPT
of 1–2·105 ms-1. Weaker sources from positive leader traces inside the negative charge region are often
detected as well, caused generally by recoil leaders (e.g., Mazur, 2002; van der Velde and Montanyà, 2013).
Compared to negative leaders, the propagation speed of positive channels is almost an order of magnitude
lower, with velocities around 2–3·104 ms-1 (e.g. Mazur et al., 1998; Shao and Krehbiel, 1996). The majority
of these sources typically cluster over a shallow range of altitude, creating regions of net positive and
negative charge. LMA observations have also shown that the lightning discharge tend to initiate in-between
these opposite charge layers (van der Velde and Montanyà, 2013).
Finally, to account for the horizontal dimensions of the storm system, storm morphology analysis was
carried out using the classifications by Parker and Johnson (2000) and Duda and Gallus (2010). All systems
were classified using visual inspection of radar CAPPI sequences.
3 RESULTS
The case studies with lightning strokes to WT are summarized in Table 1, which includes both downward
and upward lightning events. The selection of case studies includes also includes two summer thunderstorm
episodes, to be used as a reference for typical warm season thunderstorms in the analysis and discussion of
the charge structure.
3.1. Lightning activity in the region of interest
The first thing to stress about Table 1 is that the episodes involving lightning strokes to WT correspond
usually to months with low lightning activity in the AoS, such as April and November. Therefore, before the
case overview, lightning patterns throughout the year in the AoS were analysed, using data from the SMC-
LLS (12–year period, 2005–2016). The average CG flash density in the AoS is of 2.8 CG flashes km2 year-1,
0.8 above the average density of the whole Catalonia. On the one hand, nearly 87% of the annual CG flashes
occur between June and October, with a peak at the end of summer (24% in August and 33% in September).
Conversely, months from November to April account for only 9% of the observed lightning activity. Indeed,
the seasonal cycle in the AoS is driven by two main factors: the solar heating which peaks in summer and
favours the onset of convective storms, and the proximity to the Mediterranean Sea conditioning the autumn
and winter activity. From the late summer on, lightning activity moves gradually to the coast and offshore,
where the activity is dominant in autumn. This change is related to the average land/sea temperature
difference, the average sea surface temperature being warmer during autumn compared to land (Kotroni and
Lagouvardos, 2016; Galanaki et al., 2018).
3.2. Typical summer thunderstorms. Case overview
1st JULY 2014
On that day, convective indices presented moderate conditions of instability (see Table 1). Convection
started to develop in the mountainous region west of the Ebre’s Delta, traveling to the Northeast afterwards.
The initial cells began to cluster in a line, oriented in the direction of the predominant SW-NE flow. Over
time, the flow rotated to a West-East pattern. New growing cells kept clustering but in a less organized
manner. The cluster of cells crossed the AoS between 17:00 and 18:00 UTC and promptly decayed soon
after. Fig. 2 shows the evolution of the vertical structure of the storm occurring in the AoS. Thunderstorms
in this episode began to grow rapidly around 11:00 UTC, and continued intensifying until 15:00 UTC, as
indicated by increases both in the density of VHF sources. The seesaw trend of the TOP–35 in the following
ACCEPTED MANUSCRIPT

ACC
EPTE
D M
ANU
SCR
IPT
hours suggests a sequential development of pulse-type convection. High IC activity was reported by the
LMA as the TOP–35 remained around the –40°C. The abrupt decay of the TOP–35 by 18:30 UTC led to the
termination of the lightning activity. It is worth noticing the increase in the CG lightning flash rate (hereafter
LFR) on the latest hours, as the VHF burst density showed activity in the lower positive layer (16:30 – 18:00
UTC approx.).
2nd AUGUST 2014
Convection initiated around 11:00 UTC with diverse cells that progressively clustered SW of the Delta, to
finally form a non-linear convective system with a large area of reflectivity above 45 dBZ (CAPPI 1km
13:00 UTC) in what looks like the period of maximum development. After that, while moving to the Ebre’s
Delta from West to East, the complex split into different cells, to finally dissipate around 14:00 UTC. In the
meantime, new cells appeared in the radar coverage coming from SW, this time showing a leading stratiform
pattern. Subsequent cells continued in the same SW-NE flow over the Delta. The 35–dBZ echo tops (Fig. 3),
growing rapidly to reach first the –10°C (4.5 km AMSL approx.) and shortly after the –40°C (9 km AMSL
approx.), spanning the mixed-phase region, suggested the presence of graupel and an environment
conductive to active charge separation. The LMA density bursted shortly after, showing a high activity
between 12:00 and 14:00 UTC, related to negative channels at heights between 9–11 km ASML. Negative
channels in the lower layer also became apparent from 12:00 to 13:00 UTC, coinciding with the period of
maximum LFR (15 CG min-1). Between 13:00 and 14:00 UTC the TOP–35 almost lost half of its height, and
so did the VHF source density and the CG activity. In the following hours the TOP–35 stayed around the -
10°C with a moderate lightning activity until a rapid decline around 20:00 UTC.
3.3. Case studies involving lightning to wind-turbines
The cases listed in Table 1, involving lightning strokes to WT, showed modestly unstable environments with
400 J kg-1 of CAPE at most, –10°C levels below 4500m AMSL, nearly saturated vertical profiles and the
tropopause at around 10–11 km AMSL or lower. Accordingly, the resulting storm systems were not
particularly vigorous. Weather radar sequences showed that thunderstorms favouring lightning strokes to
WT did not have any particular precipitation configuration. Besides, they all showed a weak LFR, with
lightning to WT occurring around the maximum LFR period.
20th NOVEMBER 2011
For this episode, radar imagery showed a stationary thunderstorm system with a parallel-stratiform
precipitation configuration, moving SE-NW, with weak convective cells at its southernmost end. The VHF
source density (Fig. 4) shows two periods of maximum activity, the first around 04:30 UTC and the second
at 07:30 UTC, with a strong lower positive layer at 3–4 km ASML and a weaker upper positive layer
between 7 and 9 km ASML. These two periods of maximum activity are delimited by TOP–35 above the –
10°C height, and the moments of maximum LFR (7–8 CG min-1) are collocated with the maximum TOP–35
heights. Downward lightning to WT (04:29, 04:37, 04:39, 04:45 UTC) were observed during the first period
of maximum activity. At that time, 1-km CAPPI imagery showed a rainfall field extension (>12 dBZ) at that
time of about 100 x 40 km. Another series of downwards to WT was observed between 06:55 and 07:15
UTC (06:55, 06:57, 06:58, 07:11, 07:15 UTC), coinciding with high VHF source densities in the low charge
layer.
As an example, the LMA plot of the 04:37 UTC flash is shown in Fig. 5. The flash started immediately
above a wind turbine with a fast negative downward leader originated at around 3 km altitude, producing
two CG strokes to a WT. The first CG stroke produced a current of –98 kA, the second stroke was of –7 kA
ACCEPTED MANUSCRIPT

ACC
EPTE
D M
ANU
SCR
IPT
and occurred 23 ms after. The flash had a low altitude positive leader development with negative leader
activity above. No leader activity was observed above 6 km during this lightning event. The plain view
panel shows radial channels spreading simultaneously in various directions, all starting from the lightning
initiation region. Regarding to the precipitation structure, Fig. 6 shows the 04:39 UTC flash in combination
with the radar reflectivity. Similar to the 04:37 UTC flash (Fig.5), this flash also started on the perimeter of a
convective core, with a downward channel right after the breakdown, and cloud channels spreading radially
to the stratiform precipitation region after the CG return stroke. The second series of lightning to WT had a
similar pattern, with the CG flashes to WT starting in the vicinity of convective cores, showing first CG
strokes followed afterwards by cloud channels spreading away.
3rd APRIL 2012
At the time of the first downward flashes to WT (18:38, 18:44 UTC), the north-eastward moving
thunderstorms looked like a trailing-stratiform system with embedded weak convective cores above the
AoS. Two periods of IC activity were observed above the AoS, the first one starting around 13:00 UTC
when the TOP–35 reached the –40°C height (the evolution is not shown). After a short period of inactivity,
activity restarted between 18:00 and 19:30 UTC approx. The sequence of the LMA source density indicates
a progressive decrease in the height of the low charge layer. The downward stroke to a WT occurred during
this later period.
Fig. 7 shows the LMA detection of the downward stroke that impacted a WT during this episode. Note that
the leader activity stayed below 6 km a with remarkable positive leader development. A negative leader to
ground started at the beginning of the flash and ended with a –18 kA stroke to a turbine located on one of the
wind farms in the AoS (≈640 m AMSL). According to the radar imagery analysis (not shown), in this case
the leader initiated in the rear edge of a convective cell and hit a turbine which was under the same cell at
that moment. Compared to precedent case, maximum reflectivity was slightly higher, but the vertical
development was similar, with the Top–35 reaching 6.0 to 7.0 km.
17th NOVEMBER 2012
Around 11:00 UTC, a broken line of cells crossed the AoS South to North, progressively transforming into a
parallel stratiform precipitation structure. From 13:00 UTC some of the cores intensified to reach 50 dBZ.
Around 17:30 UTC the storm intensity decreased still, the system remained active and intensified again by
22:00 UTC. However, by that time the main cells were leaving the area of coverage of the LMA and were
not well represented in Fig.8. VHF source density detected by the LMA shows a bimodal distribution with
maximums at 3–4 km and 6–7 km height (similar to the precedent cases). A downward lightning flash to a
WT was identified at 17:34 UTC (see Fig. 9). This case corresponds to a complex flash originated about 50
km away from the WT. Before striking the turbine, an intense +CG stroke (+52 kA) triggered a sprite (see
van der Velde et al. 2014). After the long negative leader had passed near the WT, positive breakdown
occurred and suddenly a negative leader was directed towards a WT, producing 9 strokes. The leader
sequence suggests that the first leader development related to the intense +CG flash initiated a new leader
breakdown in the wind turbine area. Radar reflectivity in Fig 9 helps locating the negative leader which
starts at the border of a convective cell with maximum reflectivity around 45 dBZ. The cloud channel
crossed a stratiform area with lower reflectivity, to finally reach a WT which was close to a smaller
convective core.
ACCEPTED MANUSCRIPT
ACC
EPTE
D M
ANU
SCR
IPT
16th NOVEMBER 2013
On that day, radar imagery showed a leading stratiform precipitation structure, with a large area of moderate
reflectivity reaching the AoS around 05:30 UTC. Lightning activity in the AoS was mainly related to
embedded convection cores that formed offshore. Ground temperature was about 8°C with a cold air mass
from the North and a flow from the Mediterranean due to a low. In this case, the storm was close to the
threshold for being considered a winter thunderstorm according to Montanyà et al (2016a) criteria. The
evolution of the vertical structure of the storms occurring in the AoS for this episode (not shown) limits the
presence of lightning to a narrow timespan of one hour between 08:15 and 09:15 UTC approximately. This
is the only period where the TOP–35 was above the –10°C level (3,100 m AMSL). It is during this period
that the upward flashes were detected by the LMA (08:13, 08:37, 08:41 UTC). Fig. 10 reveals pulses related
to an upward positive leader, starting close to the ground. After 400 ms approx., a very well resolved
negative leader rapidly accelerated upwards into a layer of positive charge. The right panel of Fig. 10 shows
leader speeds (van der Velde and Montanyà 2013). In this case, the likely source of the UL was a WT. The
flash grew to a size of 65 by 40 km. There seem to be two other upward leaders in the figure (435.6 s and
435.85 s), but not as well resolved by the LMA as the first one.
18TH JANUARY 2014
In the AoS, thunderstorms occurring in winter months like the present case study are usually associated with
fronts moving northward along the Spanish east coast, or with Mediterranean humid, unstable air lifted over
the elevated terrain near the coast. According to the radar sequence of that day (not shown), around 05:00
UTC some weak cells started crossing the AoS, South to North. From 06:30 UTC, some organisation
became apparent, which can be described as a weak leading stratiform precipitation system. It produced
lightning between 08:00 and 10:00 UTC aprox. During that period, the evolution of the vertical structure of
the storm (not shown) depicted negative channels at two different layers, the upper corresponding to positive
charge level between 7 to 9 km, with the low positive layer around 4–5 km. Four downward CG strokes to
WT were observed between 08:40 and 09:37 UTC. As an example, Figure 11 presents the flash to a WT that
occurred at 08:40:18 UTC. Like in the 20th November 2011 episode (Fig.6), the flash initiated in the vicinity
of a convective core. The LMA depicts a flash starting at 3 km height with a stepped leader that produced
three CG strokes to WT (–36, –13, –9 kA). However, this time, the following cloud channels stayed around
the core and did not spread to the stratiform region.
Besides, a lightning triggered upward flash was reported at 09:00 by the ELMA (see Fig 12) Although the
leader trail was not as well-defined as in the upward flashes detected on the 16th November 2013, it seemed
to initiate from a WT. The flash started with a negative CG, followed by cloud positive leader at 4–5 km
height. Half a second after the beginning of the event, negative strokes reported by LINET were followed by
negative leaders, spreading at 8–9 km height, before the negative leader from a WT accelerated upwards to
reach the negative layer at 6–7 km height. No other strokes where recorded by LINET after the upward
leader.
3.4. Inferred charge structure
As seen throughout this study, the LMA system depicts the height of the localised VHF sources,
predominantly coming from negative leaders moving through positively charged regions. Therefore, the
relative density of sources can be used to infer the charge structure inside the thunderstorm cells. Indeed, the
majority of these sources typically cluster over a shallow range of altitude, as shown in the previous
evolution figures. However, we do not intend here to do a complete characterization of thunderstorms
ACCEPTED MANUSCRIPT

ACC
EPTE
D M
ANU
SCR
IPT
charge structure. Instead, our focus lies on the period with lightning activity concerning WT. Hence, vertical
profiles of the charge layer structure have been inferred for the periods in which lightning to/from WT
occurred (Fig. 13). While the relative density of LMA sources helps locating the charge layer altitudes, the
dominant polarity on each layer was confirmed through the inferred velocity of lightning channels, using the
aforementioned method by van der Velde and Montanyà (2013).
As expected, typical summer storms display the basic tripole structure (Williams, 1989, 2001). After a rapid
vertical growth (Fig 2, 3) a dipole developed, the upper positive charge layer reaching 10–11 km height (–
40ºC). The negative charge region below, related to the mixed phase region (e.g. Williams et al 1991), is
located between the 5 and 8 km height (–10ºC to –25°C). Figs. 2 and 3 also show, at certain stages, the
development of a lower positive charge layer, constituting the classical tripole structure.
Interestingly, apart from the 16th November episode, all the other cases analysed showed the same basic
tripole structure, the difference being the vertical development they reached. Whereas the upper positive
layer reached the 10 km AMSL in the warm season episodes, the cases with downward lightning to WT,
only reached 8–9 km height. On the other hand, it is worth noticing that the lower charge positive region is
closer to the surface in all the lightning to WT related episodes. Besides, higher LMA source densities were
found on the upper positive layer in the summer reference cases, while LMA source activity dominates in
the lowest positive charge layer in the WT related cases.
4. DISCUSSION
4.1. Charge Structure
Results showed charge structures that can be compatible with the tripole produced by the non-inductive
charge mechanism (NIC, e.g. Takahashi, 1978; Williams, 1989; Saunders et al., 2006). The LMA inferred
charge layers shown in Fig 13 suggest three different types of structure. Firstly, the LMA source density in
the warm-season convection episodes (Figs. 2 and 3) shows the maximum activity concentrated in the upper
positive charge layer. Deep-convection results in elevated charge structures, with large total LFR but low
ground LFR. The CG LFR increases only when a low charge layer is apparent (see Figs. 2 and 3).
Secondly, spring and autumn episodes (e.g. 3rd April, 17th Nov., 20th Nov, Figs. 4 and 8), also having a
tripole structure, share another common feature: the lower positive charge layer is the dominant (contrary to
warm-season convection where the upper level dominates). This particularity will result in an enhancement
of the electric field at the bottom of the negative charge region, providing the means to discharges to
propagate to ground as CG flashes (e.g., Jacobson and Krider 1976, Williams 2001, Marshall and
Stolzenburg 2002, Pawar and Kamra 2004). Early works by Clarence and Malan (1957) already suggested
that lower positive charge centre (LPCC) is essential for the initiation of CG lightning. On the other hand, an
excessive LPCC may prevent the occurrence of CG flashes by ‘‘blocking’’ the progression of descending
negative leaders from reaching ground (Qie et al 2005, Nag and Rakov, 2009). In this regard, it is worth
noting certain differences between the analysed episodes. Lighting to WT on the 20th November, 18th
January and 3rd April episodes correspond mainly to CG flashes starting with negative leaders vertically
descending to ground. According to the CG classification based on the magnitude of the LPCC by Nag and
Rakov (2009), this behaviour suggests a relatively thin LPCC, where the descending negative leader would
traverse the positive charge region keeping a predominantly vertical propagation direction towards the
ground. Regarding precipitation structure, this “vertical” negative CG flashes tended to have their origin on
ACCEPTED MANUSCRIPT

ACC
EPTE
D M
ANU
SCR
IPT
the periphery of convective cores. Studies like Carey et al. (2003), Lund et al. (2007) and Akita et al. (2011)
pointed out these areas along the perimeter of updrafts as prone to originate CG lightning. Contrarily,
lightning strokes to WT on the 17th November show significant horizontal propagation before reaching
ground, suggesting a larger LPCC compared to the precedent cases. According to the Nag and Rakov (2009)
classification, in this scenario, a negatively-charged leader channel originated in the base of the main
negative charge region would travel predominantly horizontally because of the blocking LPCC effect,
eventually making a termination to ground.
Thirdly, the 16th November 2013 episode presented a particular structure, with two layers of opposite
polarity and no apparent lower positive layer. The structure on that day had common features with what has
been observed, also with an LMA, by Wang et al. (2017) in winter thunderstorms in Japan: (i) an horizontal
extension much larger than the vertical extension (a large-scale stratiform cloud with relatively weak echo
intensity and low cloud top height (ii) the charge regions enclosed between the –10ºC and –20ºC isotherms,
in agreement with the NIC, and (iii) a low altitude of the whole cloud, with positive charge over negative
charge. This particular charge distribution has also been reported by Schultz et al. (2011) for upwards from
high towers during electrified snowfall events. All in all, this particular scenario featured favourable
conditions for the self-initiation of UL. Finally, it is worth mentioning that the LMA system can infer the
charge structure only when lightning occurs. In this particular case, the lightning rate was very small, so the
charge structure inferred from LMA sources cannot be seen as the complete picture of the thunderstorm
charge structure.
4.2. Transition season thunderstorms
Results presented bring new evidence on the low correlation existing between lightning incidence on WT
and the month average lightning density for the region surrounding the wind farm. Results point out that
lightning activity in the AoS concentrates between June and October (85% of the year-round CGs) and
especially during August and September (57% of CGs). However, all the analysed episodes with lightning
from/to WT occurred between November and April, months that account only for nine percent of the year-
round lightning activity.
Other studies on lightning incidence to tall structures have shown a similar pattern. For instance, studies at
the Gaisberg Tower (Montanyà et al., 2007; Diendorfer, 2009) have shown that although the thunderstorm
season in Austria is between April and August, actually the months with the highest numbers of recorded
flashes at the Gaisberg tower are March and November, respectively, which are definitely months outside
the convective season and generally with very little thunderstorm activity in Austria (Diendorfer, 2017).
Other studies in towers around Europe also registered a majority of self-initiated flashes during the winter
period, such as the Peissenberg Tower (Manhardt et al., 2012). On the contrary, the majority of upward
flashes at the Säntis Tower occur during summer (Romero et al., 2013; Smorgonskiy et al., 2015) like in
Rapid City (Warner et al., 2012a, b). According to Smorgonskiy et al. (2015) seasonal variations could be
attributed to the differences in the tower effective height, although they pointed out that further research is
needed to validate this hypothesis.
Going back to the present results, with the exception of the January case, the rest occurred during the
transition from summer to winter and vice versa. During these transition periods, at most mid-latitude
locations, like the AoS, the lower boundary of the mixed phase region (i.e., the –10 °C isotherm) suffers a
sudden change of height. Fig.14 shows the average evolution of the height of the –10 °C isotherm
throughout the year near the AoS (calculated from the Barcelona radiosounding database). The average over
a 10–year period (2006–2015) indicates that the –10°C isotherm is between 5.5 and 6 km height during the
ACCEPTED MANUSCRIPT

ACC
EPTE
D M
ANU
SCR
IPT
thunderstorm season (June-September) and around 4 km height in winter (December to March).
Interestingly, most of the episodes with lightning to WT have been observed during the transitional season,
when the isotherm –10°C is approximately 1.5 km below the typical thunderstorm season and therefore
closer to ground.
4.3. Morphology and Size of the storm
Results showed that the storms involved in lightning strokes to WT had no particular precipitation structure,
developed in a weak convective environment and had modest amounts of lightning. Recently, Wang et al.
(2017) pointed out the preference of CG lightning for regions with weak updraft and downdraft. In the
present case study, the majority of downward lightning striking WTs are linked to weak convective cores
embedded into stratiform dominant systems.
Interestingly, some of the analysed case studies also produced sprites, episodes which are analysed in detail
in Van de Velde et al. (2014). There are other studies that reported sprite-parent +CGs involved also in UL
(Warner et al., 2011; Lyons et al., 2011 and 2014). High peak current +CGs are followed by long continuing
currents, thus resulting in large charge moment changes (CMC) capable of producing transient luminous
events (TLE) (e.g. sprites, elves, halos) as documented in different studies (Takahashi et al., 2003; Suzuki et
al., 2006; Matsudo et al., 2007; Van de Velde et al., 2014). It is worth stressing out that in our cases most
storm systems were relatively small (see dimensions in Table 1) compared to other TLE-related systems like
those documented in the central United States (e.g., Lyons, 1996; Lyons et al., 2003; Lang et al., 2010,
2011; Lu et al., 2013). Thunderstorms like 20th November, 3rd April and 17th November exhibited slow
storm motion and weak organization in the absence of a strong cold pool, having only weak updrafts in the
humid, low energy environment (van der Velde et al 2014). In any case, the stratiform region of these
thunderstorms may grow large enough to allow the necessary charge moment change to trigger a sprite.
Regarding the SIUL episode, the 16th November 2013, the storm system area is significantly larger than the
rest of episodes.
4.4. Peak current and polarity
CG peak current and polarity reported on Table 1 corresponding to the CGs to WT show that almost all
downward strokes had negative polarity (only one positive case), with rather high peak currents. According
to the SMC-LLS records, the average (and median) for Catalonia over the last 7 years (2010–2016) for
negative CG strokes is of –18.2 kA (–12.9 kA). In the present study, fifteen of the twenty-two negative
downwards to WT had peak currents above the average, and furthermore, in 8 cases the peak current is
extremely high (above the 95 percentile, –48 kA). These figures suggest that the peak current plays a role on
the attachment process to WT. The distance between the tips of the negative downward leaders and the
grounded structure (striking distance, Golde 1945), can be estimated using expressions that relate this
distance and the peak current (Love 1973, Cooray et al. 2007) The striking distance increases with
increasing peak current (Love 1973, Wang et al. 2013, Tran and Rakov 2015, Visacro et al. 2016), thus
favouring the attachment to salient objects like WT.
4.5. Self-initiated and Lightning-triggered upwards
As stated in the introduction, upward lightning (UL) may originate from WT due to locally strong electric
fields (self-initiated upward lightning, SIUL) or may be triggered by prior lightning discharges (lightning-
triggered upward lightning, LTUL). In our case study, all SIUL cases were reported during a single episode,
ACCEPTED MANUSCRIPT

ACC
EPTE
D M
ANU
SCR
IPT
the 16th November 2013. Complementary data from LMA and LINET allows to confirm the absence of a
pre-existing lightning (IC or CG) in the vicinity that may have triggered those upwards. Vertical trails of the
SIUL flashes detected on that day (Fig. 10) are similar to LMA observations reported by Schultz et al (2011)
during a thundersnow. In both cases, upward flashes start with a series of very low altitude pulses, followed
by a upward negative leader that reaches the upper positive layer. This sequence may be repeated in time,
starting from other turbines of the wind farm. The 16th November 2013 episode has very low cloud bases,
low freezing levels and a considerable stratiform region (more than 30,000 km2, 2 to 7 times more than the
“downward” cases). Under these conditions, the electric field above the WT may become large enough to
initiate breakdown, and an upward leader may initiate even without additional transient enhancement from a
nearby CG or IC lightning discharge. According to Yuan et al. (2017), the relatively low lightning frequency
may have facilitated the efficient charge accumulation in the stratiform cloud, favouring the upward leader
inception.
On the other hand, Warner et al. 2014 pointed out that strong ambient winds may not be essential for the
triggering as SIULs could originate from rotating turbine blade tips at almost any ambient wind velocity.
Wang and Takagi (2012) also noted that self-initiation occurred with higher observed wind speeds (or a
rotating windmill) compared with other-triggered upward flashes. The underlying reason would be the wind
removal of the screening layer present near the tip of the tower that acts as an inhibitor of the upward leader
initiation. Unfortunately, for our case studies we do not have wind records from the windfarms to analyse
the possible influence of the wind speed.
In Wang and Takagi (2012), LTUL flashes occurred during taller and more active storms, whereas the
majority of SIUL took place when there was not significant lightning activity. In our cases studies, Fig.13
shows a thinner and lower charge structure for the SIUL triggering episode, as well as intermediate
conditions for the downward/LTUL episodes, compared to the higher typical summer charge structure. On
the other hand, LFR in the AoS were similar in both SIUL and LTUL episodes, the difference being the
distance between the embedded convective cores and the wind farms. Downward strokes and LTUL from
WT emanate from the vicinity of convective cores, whereas on the 16 November SIUL occurred far from the
embedded cores of the precipitation system (50 km approx.).
4.6. Risk assessment
Since the availability of simultaneous observations of weather radar and LLS became available for the
analysis of life-cycle of the thunderstorms, different studies have attempted to establish links between radar
reflectivity, environmental temperature profiles and lightning. Lang and Rutledge (2011), summarizing on
earlier studies, state that the general scope is that the existence of a 40 dBZ echo at or above the altitude of –
10°C corresponds to a very high probability of lightning. The present analysis has shown that, as a general
rule, LMA detections are limited to periods when the TOP–12 lies above the –10°C height. Moreover, VHF
source’s density showed a close relation with the height of the TOP–35. Surges in the number of sources
detected by the LMA are usually observed shortly after the TOP–35 overtakes the –10°C height, and larger
densities are collocated in time with greater heights of the TOP–35, which can reach the –40°C in the
summer cases. In a similar way, lightning activity decreases as the TOP–35 losses height and ceases as the
TOP–12 decays below the –10°C height. These conditions have been observed in all case studies, and
therefore results suggest that they apply throughout the year. This pattern can be of utility in lightning
hazard warning systems devoted to wind farms, considering that damage to WT is not solely linked to deep
convection or severe weather conditions but also to low-intensity thunderstorms outside the main
thunderstorm season.
ACCEPTED MANUSCRIPT

ACC
EPTE
D M
ANU
SCR
IPT
On the other hand, whereas empirical formulas have been developed to estimate the number of downward
flashes to a tall object, the majority of the strokes to modern turbines are expected to be UL. In this regard, it
is worth recalling that upward leaders not followed by return strokes can go unnoticed by conventional LLS,
and therefore the number of UL is being underestimated (e.g. March 2017). As Rachidi et al. (2008) pointed
out, neglecting upward flashes, as done in practice nowadays, might result in an important underestimation
of the actual number of strokes to WT. The present results provide evidence supporting this statement, as
lightning that may pose a threat to wind turbines is linked to “out of season” low-intensity thunderstorms,
which are not a significant contribution to the lightning climatology of the region, in terms of the amount of
lightning and therefore the region’s average flash density, which is the main lightning parameter used in risk
assessment.
5. CONCLUDING REMARKS
The meteorological conditions and thunderstorm characteristics favouring lightning to wind turbines have
been analysed in a series of episodes, by means of Lightning Mapping Array and weather radar data. The
main takeaways of this study are summarized hereunder.
As a general rule, lightning activity can be expected in cells where the radar TOP–12 product (height
of the echo-tops >12 dBZ) is above the –10°C height. Besides, the TOP–35 reaching the –40°C is
indicative of deep convection and large lightning intensities will follow. This rule of thumb applies
throughout the year and may be useful to identify thundery conditions that can pose a threat to wind
turbines outside the main thunderstorm season
Lightning threats to wind turbines in the area of study do not occur during the main thunderstorm
season, but during transitional periods (spring and autumn). Lightning activity in the area of study
concentrates between June and October (85% of the year-round CGs) and especially during August
and September (57% of CGs). However, all the analysed episodes with lightning from/to wind
turbines occurred between November and April, months that account only for nine percent of the
year-round lightning activity.
Thunderstorms with downward lightning to wind turbines present a regular charge layer structure
(tripole), but with particular features. The dominant charge layer is the lower positive one, which is,
in turn, closer to the ground due to the environmental temperature. Besides, the reported downward
CGs striking WT were mainly of negative polarity and with peak currents above the average.
Conditions for self-initiated upward lightning from wind turbines were different, with a considerable
stratiform region with a low cloud base, bearing a two layer charge structure with positive over
negative charge. Such characteristics are similar to those reported for upward lightning in winter
thunderstorms in Japan and the US
Although the thunderstorms involved in lightning incidence on wind turbines had no particular
precipitation structure, downwards to wind turbines are related to convective cores embedded in a
dominant stratiform region. This stratiform field may grow large enough to allow the necessary
charge moment change to trigger upwards from the wind turbines.
ACCEPTED MANUSCRIPT
ACC
EPTE
D M
ANU
SCR
IPT
The particular conditions that lead to lightning strokes to wind turbines shall be taken into account in
the lightning protection standards, which currently seem to be underestimating the actual number of
strokes to wind turbines.
6. ACKNOWLEDGEMENTS
The authors are grateful to the Meteorological Service of Catalonia for providing radar, lightning and
radiosonde data. We thank Patricia Altube and the two anonymous reviewers for their comments, that led to
further refinement of this study. This work was supported by research grants from the Spanish Ministry of
Economy and Competitiveness (MINECO) and the European Regional Development Fund (FEDER):
(MINECO) AYA2011-29936-C05-04; (MINECO/FEDER) ESP2013- 48032-C5-3-R and
(MINECO/FEDER) ESP2015-69909-C5-5-R; as well as by Fulgura S.L., the Meteorological Service of
Catalonia and the Autonomous Government of Catalonia, under the framework of the Industrial Doctorate
Programme.
7. REFERENCES
Abellán, E., Aran, M., Codina, B., Cunillera, J., 2011. Complex quality control of Barcelona radiosounding database.
6th
European Conference on Severe Storms (ECSS) 2011, Palma de Mallorca, Spain.
Akita, M., Yoshida, S., Nakamura, Y., Morimoto, T., Ushio, T., Kawasaki, Z., Wang, D., 2011. Effects of charge
distribution in thunderstorms on lightning propagation paths in Darwin, Australia. J. Atmos. Sci., 68, 719–726,
doi.org/10.1175/2010JAS3597.1
Altaratz, O., Levin, Z., Yair, Y., 1999. Electrical and radar observation of thunderstorms in the eastern
Mediterranean. Preprints, 11th
Int. Conf. on Atmospheric Electricity, Guntersville, AL, ICAE, 468–471.
Altaratz, O., Levin, Z., Yair, Y., 2001. Winter Thunderstorms in Israel: A Study with Lightning Location Systems
and Weather Radar. Mon. Weather Rev., 129, 1259–1266.
Argemí, O., Altube, P., Rigo, T., Ortiga, X., Pineda, N., Bech, J., 2014. Towards the improvement of monitoring and
data quality assessment in the weather radar network of the Meteorological Service of Catalonia , 8th
European
Conference on Radar in Meteorology and Hydrology (ERAD), Garmisch-Partenkirchen, Germany, Sept. 2014
Bech, J., Vilaclara, E., Pineda, N., Rigo, T., López, J., O'Hora, F., Lorente, J., Sempere, D., Fàbregas, F.X., 2004.
The weather radar network of the Catalan Meteorological Service: description and applications. Proceedings of
the 3rd
European Conference on Radar (ERAD 2004), Copernicus GmbH.
Berger, K., 1967. Novel observations on lightning discharges: Results of research on Mount San Salvatore, J.
Franklin Inst., 283, 478–525, doi:10.1016/0016-0032(67)90598-4.
Betz, H.D., Schmidt, K., Oettinger, P., Wirz, M., 2004. Lightning detection with 3-D discrimination of intracloud
and cloud-to-ground discharges. Geophys. Res. Lett., 31, L11108, doi:10.1029/2004GL019821.
Betz, H.D., Schmidt, K., Laroche, P., Blanchet, P., Oettinger, W.P., Defer, E., Dziewit, Z, Konarski, J., 2009a.
Linet—An international lightning detection network in Europe. Atmos. Res., 91: 564 –573.
doi:https://doi.org/10.1016/j.atmosres.2008.06.012
Betz, H.D., Schmidt, K, Oettinger, W.P. 2009b. LINET: An international VLF/LF lightning detection network in
Europe. Springer, 2009b. In: Betz, H.-D., Schumann, U., Laroche, P. (Eds.), Lightning: Principles, Instruments
and Applications. Springer, Netherlands, pp. 115–140.
ACCEPTED MANUSCRIPT

ACC
EPTE
D M
ANU
SCR
IPT
Braam, H., Rademakers, L.W.M.M., Wessels, H.R.A., Prins, R.K.N.J., Lok., R., Leunis, L., Ramakers, S.G.M.,
2002. Lightning damage of OWECS Part 3: Case studies, published by ECN (www.ecn.nl), Netherlands
Buechler, D.E., Goodman, S.J., 1990. Echo Size and Asymmetry: Impact on NEXRAD Storm Identification. J.
Appl. Meteor., 29, 962–969
Candela, A., Madsen, S.F., Nissim, M., Myers, J.D., Holboell, J., 2016. Lightning Damage to Wind Turbine Blades
From Wind Farms in the U.S. IEEE Trans. Power Del., 31(3): 1043
Carey, L.D., Petersen, W.A.; Rutledge, S.A., 2003. Evolution of cloud-to-ground lightning and storm structure in the
Spencer, South Dakota, Tornadic Supercell of 30 May 1998. Mon. Weather Rev. 131, 1811–1831.
Chan, M.-K., Chen, M., Du, Y-P., 2018. A macroscopic physical model for self-initiated upward leaders from tall
grounded objects and its application. Atmos. Res., 200, 13–24.
Cummins, K.L., Murphy, M.J., 2009. An overview of lightning locating systems: history, techniques, and data uses,
with an in-depth look at the U.S. NLDN. IEEE Trans. Electromagn. Compat. 51 (3), 499–518.
Clarence, N.D., Malan, D.J., 1957. Preliminary discharge processes in lightning flashes to ground, Q. J. R. Meteorol.
Soc., 83, 161–172.
Cooray, V., Rakov, V., Theethayi, N., 2007. The lightning striking distance—Revisited. J. Electrostat. 65(5–6), 296–
306. doi.org/10.1016/j.elstat.2006.09.008
Diendorfer, G., Pichler, H., Mair, M., 2009. Some parameters of negative upward-initiated lightning to the Gaisberg
Tower (2000–2007). IEEE Trans. Electromagn. Compat. 51, 443–452.
Diendorfer, G., Pichler, H., Schulz, W., 2014. EUCLID Located Strokes to the Gaisberg Tower – Accuracy of
Location and its assigned Confidence Ellipse. In: Int. Lightning Detection Conf. and Int. Lightning Meteorology
Conf. (ILDC/ILMC), Tucson, 2014.
Diendorfer, G. 2017. Review of seasonal variations in occurrence and some current parameters of lightning
measured at the Gaisberg Tower. 4th
Int. Symposium on Winter Lightning (ISWL 2017), Joetsu, Japan.
Duda, J.D., Gallus, W.A., 2010. Spring and Summer Midwestern Severe Weather Reports in Supercells Compared
to Other Morphologies. Wea. Forecasting, 25, 190–206.
Dye, J.E., Jones, J.J., Winn, W.P., Cerni, T.A., Gardiner, B., Lamb, D., Pitter, R.L., Hallett, J.,Saunders, C.P.R.,
1986. Early electrification and precipitation development in a small, isolated Montana cumulonimbus. J.
Geophys. Res. 91, 1231–1247.
Eriksson, A. J., 1978. Lightning and tall structures, Trans. S. Afr. Inst. Electr. Eng., vol. 69, pp. 238–252.
Foley, A.M., Leahy, P.G., Marvuglia, A., McKeogh, E.J., 2012. Current Methods and Advances in Forecasting of
Wind Power Generation. Renewable Energy, 37, 1-8.
Galanaki, E., Lagouvardos, K., Kotroni, V., Flaounas, E., Argiriou, A., 2018. Thunderstorm climatology in the
Mediterranean using cloud-to-ground lightning observations, Atmos. Res., 207: 136-144
Golde, R. H., 1945. The frequency of occurrence and the distribution of lightning flashes to transmission lines.
Electrical Engineering, 64(12): 902–910. doi.org/10.1109/EE.1945.6441405
Gremillion, M, Orville, R, 1999. Thunderstorm Characteristics of Cloud-to-Ground Lightning at the Kennedy Space
Center, Florida: A Study of Lightning Initiation Signatures as Indicated by the WSR-88D. Amer. Meteor. Soc.,
14, 640-649.
Hondl, K., Eilts, M., 1994. Doppler radar signatures of developing thunderstorms and their potential to indicate the
onset of cloud-to-ground lightning. Mon. Weather Rev., 122, 1818-1836.
ACCEPTED MANUSCRIPT

ACC
EPTE
D M
ANU
SCR
IPT
Honjo, N., 2015. Risk and its reduction measure for wind turbine against the winter lightning, in Proc. Asia-Pacific
Intl. Conf. on Lightning, 2015, pp. 665-670.
IEC 61400-24, Wind Turbines – Part 24: Lightning Protection, 2010.
Jacobson, E.A., Krider, E.P., 1976. Electrostatic field Changes produced by Florida lightning, J. Atmos. Sci., 33,
103-117
Kotroni, V., Lagouvardos, K., 2016. Lightning in the Mediterranean and its relation with sea-surface temperature.
Environ. Res. Lett. 11, 034006. http://dx.doi.org/10.1002/asl.685.
Krehbiel, P. R., 1986: The electrical structure of thunderstorms. In: The Earth’s Electrical Environment, National
Academies Press, 90–113.
Krehbiel, P.R., Brook, M., Khanna-Gupta, S., Lennon, C. L., Lhermitte, R., 1984. Some results concerning VHF
lightning radiation from the real-time LDAR system at KSC, Florida. Proc. 7th
Int. Conf. on Atmospheric
Electricity, Boston, MA, Amer. Meteor. Soc., 388–393
Lang, T.J. Rutledge, S.A., 2011. A Framework for the Statistical Analysis of Large Radar and Lightning Datasets:
Results from STEPS 2000. Mon. Weather. Rev., 139, 2536–2551
Lang, T.J., Lyons, W.A., Rutledge, S.A., Meyer, J.D., MacGorman, D.R., Cummer, S.A., 2010. Transient luminous
events above two mesoscale convective systems: Storm structure and evolution, J. Geophys. Res., 115,
A00E22, doi:10.1029/2009JA014500.
Lang, T.J., Li, J., Lyons, W.A., Cummer, S.A., Rutledge, S.A., MacGorman, D. R., 2011. Transient luminous events
above two mesoscale convective systems: Charge moment change analysis, J. Geophys. Res., 116, A10306,
doi:10.1029/2011JA016758.
Larsen, H.R., Stansbury, E.J., 1974. Association of lightning flashes with precipitation cores extending to height 7
km. J. Atmos. Terr. Phys. 36, 1547–1553.
Levin, Z., Yair, Y., Ziv, B., 1996: Positive cloud-to-ground flashes and wind shear in Tel-Aviv thunderstorms.
Geophys. Res. Lett., 23, 2231–2234.
Love, E.R., 1973. Improvements on lightning stroke modeling and applications to the design of EHV and UHV
transmission lines, University of Colorado.
Lund, N., and Coauthors, 2007. Relationship between lightning location and polarimetric radar signatures in an
MCS. Proc. 13th Int. Conf. on Atmospheric Electricity, Beijing, China, ICAE, 557–560.
Lu, G., et al., 2013. Coordinated observations of sprites and in-cloud lightning flash structure, J. Geophys. Res.
Atmos., 118, 6607–6632, doi:10.1002/jgrd.50459
Lyons, W.A., 1996. Sprite observations above the U.S. High Plains in relation to their parent thunderstorm systems,
J. Geophys. Res., 101, 29,641–29,652, doi:10.1029/96JD01866.
Lyons, W.A., Williams, E. R., Cummer, S. A., Stanley, M. A., 2003. Characteristics of sprite-producing positive
cloud-to-ground lightning during the 19 July 2000 STEPS mesoscale convective systems, Mon. Weather Rev.,
131, 2417–2427.
Lyons, W.A., Cummer, S.A., Rutledge, S.A., Lang, T.J., Meyer, T., Warner, T.A., Samaras, T.A., 2011. TLEs and
their parent lightning discharges, paper presented at 14th
International Conference on Atmospheric Electricity
(ICAE), Rio De Janeiro, Brazil, 7–12 Aug.
Lyons, W.A., et al., 2014. Meteorological Aspects of Two Modes of Lightning-Triggered Upward Lightning
(LTUL) Events in Sprite-Producing MCS, 23rd Int. Lightning Detection Conf., 18-19 March 2014, Tucson,
Arizona.
ACCEPTED MANUSCRIPT

ACC
EPTE
D M
ANU
SCR
IPT
MacGorman, D.R., Rust, W.D.,1998. The Electrical Nature of Storms, 422 pp., Oxford Univ. Press, Oxford.
Manhardt, M., Heidler, F., Stimper, K., 2012. The electric field of negative upward lightning strikes at the
Peissenberg tower, Germany. Int. Conf. on Lightning Protection (ICLP), 2012, IEEE,pp.1–9.
10.1109/ICLP.2012.6344205.
March, V., 2017. Key issues to define a method of lightning risk assessment for wind farms, Electr. Power Syst.
Res., doi:10.1016/j.epsr.2017.08.020
Marshall, T.C., Stolzenburg, M., 2002. Electrical energy constraints on lightning. J. Geophys. Res. 107 (D7).
doi:10.1029/2000JD000024.
Matsudo, Y., Suzuki, T., Hayakawa, M., Yamashita, K., Ando, Y., Michimoto, K., Korepanov, V., 2007.
Characteristics of Japanese winter sprites and their parents’ lightning as estimated by VHF lightning and ELF
transients, J. Atmos. Sol. Terr. Phys., 59, 1431–1446
Mazur, V., 2002. Physical processes during development of lightning flashes, C. R. Phys., 3, 1393–1409.
Mazur, V., Shao, X., Krehbiel, P.R., 1998. “Spider” lightning in intra-cloud and positive cloud-to-ground flashes, J.
Geophys. Res., 103, 19,811–19,822, doi: 10.1029/98JD02003.
McEachron, K. B., 1939. Lightning to the Empire State Building, J. Franklin Inst., 227, 149–217,
doi:10.1016/S0016-0032(39)90397-2.
Michimoto, K., 1991: A study of radar echoes and their relation to lightning discharge of thunderclouds in the
Hokuriku district, Part 1: Observation and analysis of thunderclouds in summer and winter. J. Meteor. Soc.
Japan, 69, 327–335.
Michimoto, K., 1993. A study of radar echoes and their relation to lightning discharge of thunderclouds in the
Hokuriku district, Part 2: Observation and analysis of ‘‘single flash’’ thunderclouds in midwinter. J. Meteor.
Soc. Japan, 71, 195–203.
Minowa, M, Minami, M, Yoda, M., 2006. Research into Lightning Damages and Protection Systems for Wind
Power Plants in Japan. Proceedings of the 28th
International Conference on Lightning Protection, Kanazawa,
2006; 1539–1544.
Montanyà, J., Pineda, N., March, V., Illa, A., Romero, D., Solà, G., 2006. Experimental evaluation of the Catalan
Lightning Detection Network. 19th
Int. Lightning Detection Conf., Tucson, Arizona.
Montanyà, J., Soula, S., Diendorfer, G., Solà, G., Romero, D., 2007. Analysis of altitude of isotherms and the
electrical charge for flashes that struck the Gaisberg Tower. 13th
International Conference on Atmospheric
Electricity (ICAE), August 13-17 2007, Beijing, China.
Montanyà, J., van der Velde, O.A., March, V., Romero, D., Solà, G., Pineda, N., 2012. High-speed video of
lightning and x-ray pulses during the 2009–2010 observation campaigns in north-eastern Spain. Atmos. Res.
117, 91–98.
Montanyà, J., 2014. Annual Report on the Performance of the Lightning Location System Operated by the
Meteorological Service of Catalonia, Internal Technical Report, not Published.
Montanyà, J., van der Velde, O., Williams, E. R., 2014. Lightning discharges produced by wind turbines. J.
Geophys. Res. Atmos., 119, 1455–1462, doi:10.1002/ 2013JD020225.
Montanyà, J., Fabró, F., van der Velde, O., March, V., Williams, E.R., Pineda, N., Romero, D., Solà, G., Freijo, M.,
2016a. Global distribution of winter lightning: a threat to wind turbines and aircraft. Nat. Hazards Earth Syst.
Sci., 16, 1465-1472
ACCEPTED MANUSCRIPT

ACC
EPTE
D M
ANU
SCR
IPT
Montanyà, J., van der Velde, O., Domingo-Dalmau, A., Pineda, N., Argemí, O., Salvador, A., 2016b. Lightning
mapping observations of downward lightning flashes to wind turbines. 33rd
Int. Conf. Lightning Protection,
Estoril, Portugal, 25-30 September 2016.
Murphy, M.J., Krider, E.P., Maier, M.W., 1996. Lightning charge analyses in small Convection and Precipitation
Electrification (CaPE) experiment storms, J. Geophys. Res., 101(D23), 29615–29626, doi:10.1029/96JD01538.
Nag, A., Rakov V.A, 2009. Some inferences on the role of lower positive charge region in facilitating different types
of lightning, Geophys. Res. Lett., 36, L05815, doi:10.1029/2008GL036783.
Nag, A., Murphy, M. J., Schulz, W., Cummins, K.L., 2015. Lightning locating systems: Insights on characteristics
and validation techniques, Earth and Space Science, 2, 65–93, doi:10.1002/ 2014EA000051.
Neubert, T., Kuvvetli, I., Budtz-Jørgensen, C., Østgaard, N., Reglero, V. Arnold, N., 2006. The atmosphere-space
interactions monitor (ASIM) for the international space station. ILWS Workshop 2006, GOA, February 19-24,
2006
Parker, M.D., Johnson, R.H., 2000. Organizational modes of mid-latitude mesoscale convective systems. Mon.
Weather Rev.,128, 3413–3436
Pawar, S.D., Kamra, A.K., 2004. Evolution of lightning and the possible initiation/triggering of lightning discharges
by the lower positive charge center in an isolated thundercloud in the tropics, J. Geophys. Res., 109, D02205,
doi:10.1029/2003JD003735.
Pierce, E.T., 1971. Triggered Lightning and Some Unsuspected Lightning Hazards. Stanford Research Institute,
Menlo Park, CA, 1971, pp. 20.
Pineda, N., Montanyà, J., 2009. Lightning detection in Spain: the particular case of Catalonia. In: Betz, H.-D.,
Schumann, U., Laroche, P. (Eds.), Lightning: Principles, Instruments and Applications. Springer, Netherlands,
pp. 161–185.
Pineda, N., Soler, X., Vilaclara, E., 2011. Approximation to the Lightning Climatology in Catalonia. Technical Note
nº 73. Meteorological Service of Catalonia: 71 p. Generalitat de Catalunya B-7024-2011 (in Catalan)
Poelman, D.R., Schulz, W., Diendorfer, G., Bernardi, M., 2016. The European lightning location system EUCLID –
Part 2: Observations. Nat. Hazards Earth Syst. Sci., 16, 607–616, 2016. doi:10.5194/nhess-16-607-2016
Qie, X., Zhang, T., Chen, C., Zhang, G., Zhang, T., Wei, W., 2005. The lower positive charge center and its effect
on lightning discharges on the Tibetan Plateau, Geophys. Res. Lett., 32, L05814, doi:10.1029/2004GL022162
Rachidi, F., Rubinstein, M., Montanyà, J., Bermudez, J.L., Rodriguez, R., Solà, G., Korovkin, N., 2008. A review of
current issues in lightning protection of new generation wind turbine blades, IEEE Trans. Ind. Electron., vol. 55,
no. 6, pp. 2489–2496, doi:10.1109/TIE.2007.896443.
Radicevic, R.M., Savic, M.S., Madsen S.F., Badea I., 2012. Impact of wind turbine blade rotation on the lightning
strike incidence—A theoretical and experimental study using a reduced-size model, Energy, 45, 644–654.
Reynolds, S.E., Brook, M., 1956. Correlation of the initial electric field and the radar echo in thunderstorms. J.
Meteor. , 13, 376-380.
Rizk, F.A.M. 1990. Modeling of transmission line exposure to direct lightning strokes, IEEE Trans. Power Del. 5
(4): 1983-1997
Rizk, F.A.M., 1994. Modelling of lightning incidence to tall structures, part I & II. IEEE Trans. Power Del. 9 (1):
162-193
Rison, W., Thomas, R.J., Krehbiel, P.R., Hamlin, T., Harlin J., 1999. A GPS-based three-dimensional lightning
mapping system: Initial observations in central New Mexico, J. Geophys. Res., 26, 3573-3576.
ACCEPTED MANUSCRIPT

ACC
EPTE
D M
ANU
SCR
IPT
Rivas Soriano, L. de Pablo F., Tomas, C., 2005. Ten-year study of cloud-to-ground lightning activity in the Iberian
Peninsula. J. Atmos. Terr. Phys. 67: 1632–1639
Rakov, V.A., Uman, M.A., 2003. Lightning: Physics and Effects, Cambridge University Press, Cambridge.
Romero, C., Rachidi, F., Paolone, M., Rubinstein. M., 2013. Statistical Distributions of Lightning Currents
Associated With Upward Negative Flashes Based on the Data Collected at the Säntis (EMC) Tower in 2010 and
2011. IEEE Trans. Power Del., 28( 3)
Saunders, C.P.R., Bax-Norman, H., Emersic, C., Avila, E.E., Castellano, N.E., 2006. Laboratory studies of the effect
of cloud conditions on graupel/ crystal charge transfer in thunderstorm electrification. Q. J. Roy. Met. Soc. 132,
2653–2673.
Schultz, C.J., Bruning, E.C., Carey, L.D., Petersen, W.A., Heckman, S., 2011. Total lightning within electrified
snowfall using LMA, NLDN, and WTLN measurements. Eos. Trans. AGU, Fall Meet. Suppl.
Shao, X., Krehbiel, P., 1996. The spatial and temporal development of intracloud lightning, J. Geophys. Res., 101,
26,641–26,668, doi:10.1029/ 96JD01803
Shindo, T., Sekioka, S., Ishi, M., Shiraishi, H., Natsuno, D., 2012. Studies of lightning protection design for wind
power generation systems in Japan, CIGRE 2012, C4 306.
Smorgonskiy, A., Tajalli, A., Rachidi, F., Rubinstein, M., Diendorfer, G., Pichler, H., 2015. An analysis of the
initiation of upward flashes from tall towers with particular reference to Gaisberg and Säntis Towers, J. Atmos.
Terr. Phys. 136(A): 46-51
Stackpole, J.D., 1967. Numerical analysis of atmospheric soundings. J. Appl. Meteor., 6, 464–467.
Suzuki, T., Hayakawa, M., Matsudo, Y., Michimoto, K. 2006, How do winter thundercloud systems generate sprite-
inducing lightning in the Hokuriku area of Japan?, Geophys. Res. Lett., 33, L10806,
doi:10.1029/2005GL025433.
Takahashi, T., 1978: Riming electrification as a charge generation mechanism in thunderstorms. J. Atmos. Sci., 35,
1536-1548.
Takahashi, Y., Miyasato, R., Adachi, T., Adachi, K., Sera, M., Uchida, U., Fukunishi, H., 2003. Activities of sprites
and elves in the winter season, Japan, J. Atmos. Sol. Terr. Phys., 65: 551–560.
Thomas, R., Krehbiel, P.R., Rison,W., Hunyady, S.J.,Winn, W.P., Hamlin, T., Harlin, J., 2004. Accuracy of the
lightning mapping array. J. Geophys. Res. 109, D14207. doi:10.1029/2004JD004549
Tomine, K., Michimoto, K., Abe, S., 1986. Studies on thunderstorm in winter in the area surrounding Komatsu by
radar (in Japanese). Tenki, 33, 445–452.
Tran, M.D., Rakov, V.A., 2015. When does the lightning attachment process actually begin? Journal of Geophysical
Research: Atmospheres, 120, 6922–6936. doi.org/10.1002/2015JD023155
van der Velde, O.A., Montanyà, J., Romero, D., Pineda, N., Rico, R., Fabró, F., Solà, G., March, V., Soula, S., 2011.
Results of the 2010-2011 lightning measurement campaigns in Spain, 6th
European Conf. on Severe Storms,
Palma de Mallorca, Spain, 3-7 October 2011
van der Velde, O.A., Montanyà, J., 2013. Asymmetries in bidirectional leader development of lightning flashes, J.
Geophys. Res. Atmos., 118, doi:10.1002/2013JD020257.
van der Velde, O.A., J. Montanyà, S. Soula, N. Pineda, and J. Mlynarczyk, 2014. Bidirectional leader development
in sprite-producing positive cloud-to-ground flashes: Origins and characteristics of positive and negative
leaders, J. Geophys. Res. Atmos., 119, 12,755–12,779, doi:10.1002/ 2013JD021291.
ACCEPTED MANUSCRIPT
ACC
EPTE
D M
ANU
SCR
IPT
Vincent, B.R, Carey L.D., Schneider, D., Keeter, K., Gonski, R., 2003. Using WSR-88D reflectivity data for the
prediction of cloud-to-ground lightning: A North Carolina study. Nat. Wea. Digest, 27, 35-44.
Visacro, S., Guimaraes, M., Murta Vale, M.H., 2017. Striking distance determined from high-speed videos and
measured currents in negative cloud-to-ground lightning. J. Geophys. Res. Atmos., 122, 13,356–13,369.
doi.org/10.1002/2017JD027354
Wallace, J.M., Hobbs, P.V., 1973. Atmospheric Science, An Introductory Survey, International Geophysics, vol. 92,
2nd ed., 504 pp., Academic Press, New York.
Wang, D., Takagi, N., Watanabe, T., Sakurano, H., Hashimoto M., 2008. Observed characteristics of upward leaders
that are initiated from a windmill and its lightning protection tower. Geophys. Res. Lett., 35, L02803,
doi:10.1029/2007GL032136
Wang, D., Takagi, N., 2012. Characteristics of winter lightning that occurred on a windmill and its lightning
protection tower in Japan, IEEJ Trans. Power Energy, 132(6), 568–572, doi:10.1541/ieejpes.132.568.
Wang, D., Takagi, N., Gamerota, W.R., Uman, M.A., Hill, J.D., Jordan, D.M., 2013. Initiation processes of return
strokes in rocket-triggered lightning. Journal of Geophysical Research: Atmospheres, 118, 9880–9888.
doi.org/10.1002/jgrd.50766
Wang, D., Wu, T., Takagi, N., 2017. Charge structure of winter thunderstorm in Japan: a review and an update, 4th
International Symposium on Winter Lightning, Japan, April 2017.
Wang, C., Zheng, D., Zhang, Y., Liu, L., 2017. Relationship between lightning activity and vertical airflow
characteristics in thunderstorms, Atmos. Res., 191, 2017, 12-19
Warner, T.A., Cummer, S.A., Lyons, W.A., Lang, T.J., Orville, R.E., 2011. Coordinated video and RF
measurements of positive CGs inducing both sprites and upward tower discharges, paper presented at 5th
Conference on Meteorological Applications of Lightning Data, Am. Meteor. Soc., Seattle, Wash.
Warner, T.A., Cummins, K.L., Orville, R.E., 2012a. Upward lightning observations from towers in Rapid City,
South Dakota and comparison with National Lightning Detection Network data, 2004–2010, J. Geophys. Res.,
117, D19109, doi:10.1029/2012JD018346.
Warner, T.A., Helsdon Jr., J.H. Bunkers, M.J., Saba, M.F., Orville, R.E., 2012b. UPLIGHTS: Upward lightning
triggering study. Bull. Am. Meteorol. Soc., 94, 631 –635, doi:10.1175/BAMS-D-11-00252.1.
Williams, E.R., 1989. The tripole structure of thunderstorms. J. Geophys. Res. 94 (D11): 13,151–13,167.
Williams, E.R., 2001. The electrification of severe storms. Severe convective storms, meteor. Monogr., no. 50. Am.
Meteorol. Soc. 527–561.
Williams, E.R., Zhang, R., Rydock, J., 1991. Mixed-Phase Microphysics and Cloud Electrification. J. Atmos. Sci.,
48, 2195–2203
Williams, E.R., 2018. Lightning Activity in Winter Storms: A Meteorological and Cloud Microphysical Perspective.
IEEJ Transactions on Power and Energy 138 (5): 364-373 doi:10.1541/ieejpes.138.364
Workman, E.J., Reynolds, S.E., 1949: Electrical activity as related to thunderstorm cell growth. Bull. Amer.Meteor.
Soc., 30,142-149.
Yair, Y., Levin, Z., Altaratz, O., 1998. Lightning phenomenology in the Tel Aviv area from 1989 to 1996. J.
Geophys. Res., 103, 9015–9025.
Yasuda, Y., Yokoyama, S., Minowa, M., Satoh, T., 2012. Classification of Lightning Damage to Wind Turbine
Blades IEEJ Transactions on Electrical and Electronic Engineering: 559–566, doi:10.1002/tee.21773
ACCEPTED MANUSCRIPT
ACC
EPTE
D M
ANU
SCR
IPT
Yeung, L.H.Y., Lai, E.S.T., Chiu, S.K.S., 2007. Lightning Initiation and Intensity Nowcasting Based on Isothermal
Radar Reflectivity - A Conceptual Model. In: 33rd
Int. Conf. on Radar Meteorology, Cairns, Australia, 6-10
August 2007
Yokoyama, S., 2013. Lightning protection of wind turbine blades. Electric Power Systems Research 94 (2013) 3– 9
Yuan, S., Jiang, R., Qie, X., Wang, D., Sun, Z., Liu, M., 2017. Characteristics of upward lightning on the Beijing
325 m meteorology tower and corresponding thunderstorm conditions. Journal of Geophysical Research:
Atmospheres, 122. https://doi.org/10.1002/2017JD027198
Zhou, H., Theethayi, N., Diendorfer, G., Thottappillil, R., Rakov, V.A. , 2010. On estimation of the effective height
of towers on mountaintops in lightning incidence studies, Journal of Electrostatics 68: 415-418
Zhou, H., Diendorfer, G., Thottappillil, R., Pichler, H., Mair, M., 2012a. Measured current and close electric field
changes associated with theinitiation of upward lightning from a tall tower, J. Geophys. Res., 117, D08102,
doi:10.1029/2011JD017269.
Zhou, H., Diendorfer, G., Thottappillil, R., Pichler, H., Mair, M., 2012b. Characteristics of upward positive lightning
flashes initiated from the Gaisberg Tower, J. Geophys. Res., 117, D06110, doi:10.1029/2011JD016903.
ACCEPTED MANUSCRIPT
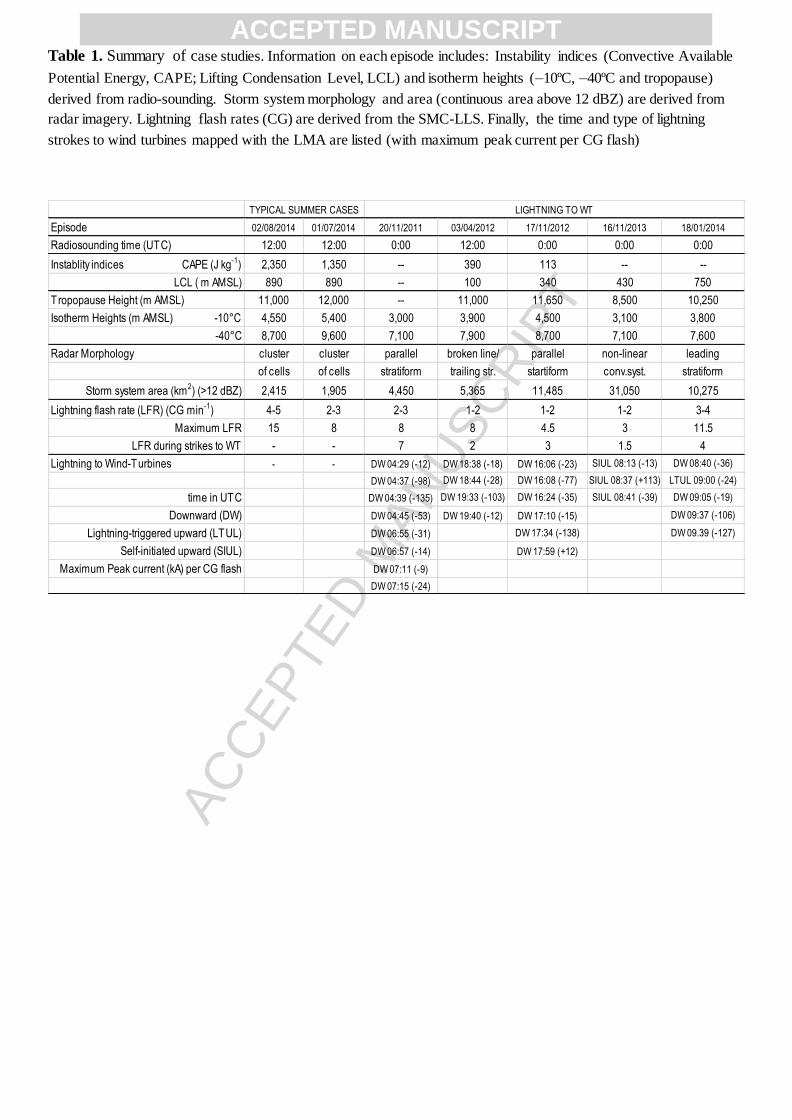
ACC
EPTE
D M
ANU
SCR
IPT
Table 1. Summary of case studies. Information on each episode includes: Instability indices (Convective Available
Potential Energy, CAPE; Lifting Condensation Level, LCL) and isotherm heights (–10ºC, –40ºC and tropopause)
derived from radio-sounding. Storm system morphology and area (continuous area above 12 dBZ) are derived from
radar imagery. Lightning flash rates (CG) are derived from the SMC-LLS. Finally, the time and type of lightning
strokes to wind turbines mapped with the LMA are listed (with maximum peak current per CG flash)
Episode 02/08/2014 01/07/2014 20/11/2011 03/04/2012 17/11/2012 16/11/2013 18/01/2014
Radiosounding time (UTC) 12:00 12:00 0:00 12:00 0:00 0:00 0:00
Instablity indices CAPE (J kg-1) 2,350 1,350 -- 390 113 -- --
LCL ( m AMSL) 890 890 -- 100 340 430 750
Tropopause Height (m AMSL) 11,000 12,000 -- 11,000 11,650 8,500 10,250
Isotherm Heights (m AMSL) -10°C 4,550 5,400 3,000 3,900 4,500 3,100 3,800
-40°C 8,700 9,600 7,100 7,900 8,700 7,100 7,600
Radar Morphology cluster cluster parallel broken line/ parallel non-linear leading
of cells of cells stratiform trailing str. startiform conv.syst. stratiform
Storm system area (km2) (>12 dBZ) 2,415 1,905 4,450 5,365 11,485 31,050 10,275
Lightning flash rate (LFR) (CG min-1) 4-5 2-3 2-3 1-2 1-2 1-2 3-4
Maximum LFR 15 8 8 8 4.5 3 11.5
LFR during strikes to WT - - 7 2 3 1.5 4
Lightning to Wind-Turbines - - DW 04:29 (-12) DW 18:38 (-18) DW 16:06 (-23) SIUL 08:13 (-13) DW 08:40 (-36)
DW 04:37 (-98) DW 18:44 (-28) DW 16:08 (-77) SIUL 08:37 (+113) LTUL 09:00 (-24)
time in UTC DW 04:39 (-135) DW 19:33 (-103) DW 16:24 (-35) SIUL 08:41 (-39) DW 09:05 (-19)
Downward (DW) DW 04:45 (-53) DW 19:40 (-12) DW 17:10 (-15) DW 09:37 (-106)
Lightning-triggered upward (LTUL) DW 06:55 (-31) DW 17:34 (-138) DW 09.39 (-127)
Self-initiated upward (SIUL) DW 06:57 (-14) DW 17:59 (+12)
Maximum Peak current (kA) per CG flash DW 07:11 (-9)
DW 07:15 (-24)
TYPICAL SUMMER CASES LIGHTNING TO WT
ACCEPTED MANUSCRIPT

ACC
EPTE
D M
ANU
SCR
IPT
Fig 1. Area of study (AoS), nearby the Ebre’s river Delta, south Catalonia, in the Mediterranean coast at the NE of the
Iberian Pensinsula . Black diamonds correspond to locations of the Ebre Lightning Mapping Array sensors. The
black square corresponds to La Miranda weather radar site. The highlighted area ecompasses the wind turbines
(black triangles) analyzed.
ACCEPTED MANUSCRIPT

ACC
EPTE
D M
ANU
SCR
IPT
Fig 2. Evolution of the vertical structure of the storms occurring in the area of study on the 1st July 2014. Time–height
LMA source density plot. Colour indicates relative density of sources according to a pink-yellow-green colour
scheme. The largest source densities are in green. Red lines correspond to the height of the TOP–12 (dashed)
and TOP–35 (solid) products. Bar lines indicate the CG flash rate in a 10–min timestamp. Finally, blue lines
correspond to the representative environmental temperature values obtained from the vertical sounding profiles
(–10°C, –40°C and tropopause heights in km)
ACCEPTED MANUSCRIPT

ACC
EPTE
D M
ANU
SCR
IPT
Fig. 3. Analogous to Fig. 2, but showing the evolution of the vertical structure of the storms occurring in the area of
study on the 2nd
August 2014.
ACCEPTED MANUSCRIPT
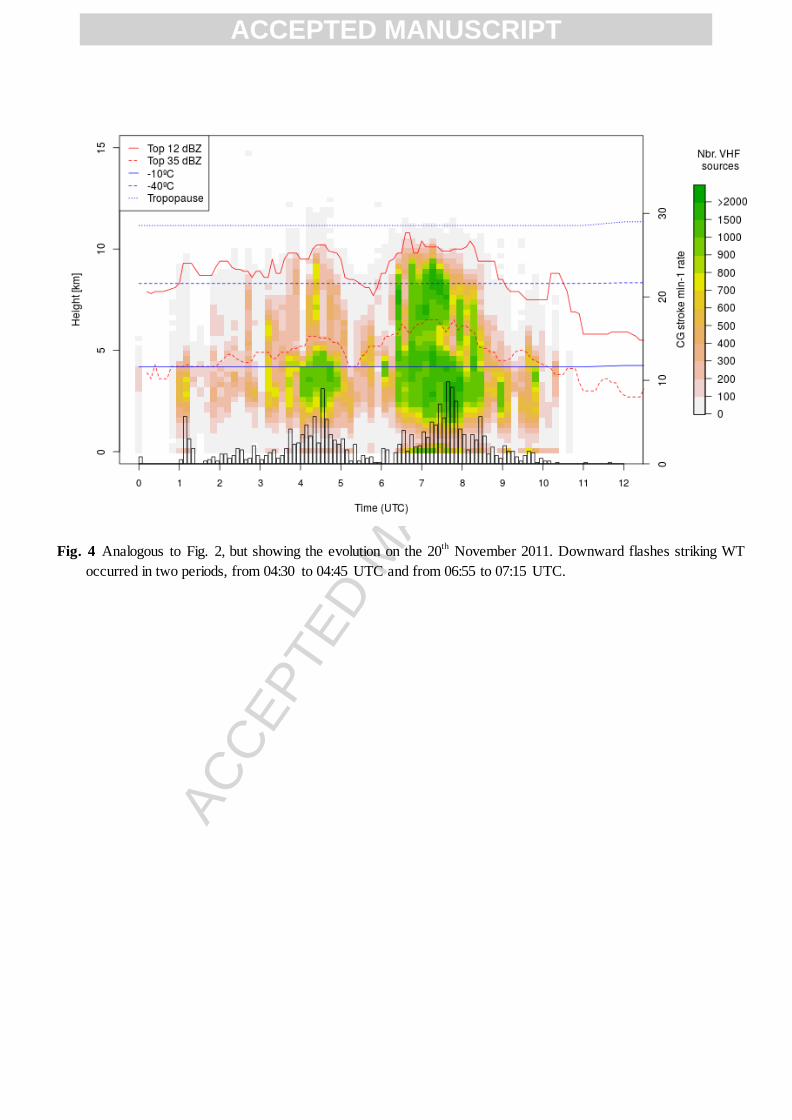
ACC
EPTE
D M
ANU
SCR
IPT
Fig. 4 Analogous to Fig. 2, but showing the evolution on the 20th
November 2011. Downward flashes striking WT
occurred in two periods, from 04:30 to 04:45 UTC and from 06:55 to 07:15 UTC.
ACCEPTED MANUSCRIPT

ACC
EPTE
D M
ANU
SCR
IPT
Fig. 5 Multi-panel display of a lightning flash detected by the LMA on the 20th
November 2011 at 04:37:26 UTC.
VHF sources are coloured as a function of time. The top panel is altitude AMSL (km) versus time (seconds).
The left panel is a plan view map (0.1° latitude equals 11.1 km) with contours of the Ebre river (blue) and WT
(black triangles) as background. The panels at the right show altitude (km) as a function of latitude and
longitude respectively. LINET strokes are displayed with symbols X for negative and +for positive.
ACCEPTED MANUSCRIPT
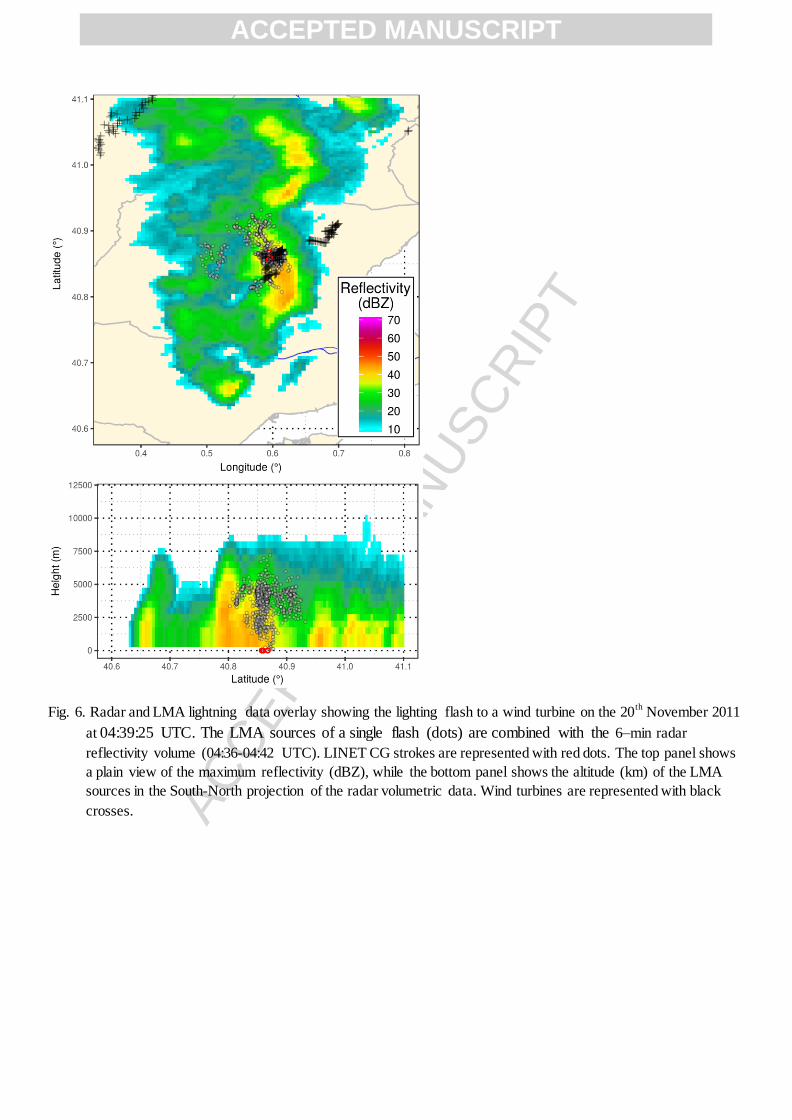
ACC
EPTE
D M
ANU
SCR
IPT
Fig. 6. Radar and LMA lightning data overlay showing the lighting flash to a wind turbine on the 20th
November 2011
at 04:39:25 UTC. The LMA sources of a single flash (dots) are combined with the 6–min radar
reflectivity volume (04:36-04:42 UTC). LINET CG strokes are represented with red dots. The top panel shows
a plain view of the maximum reflectivity (dBZ), while the bottom panel shows the altitude (km) of the LMA
sources in the South-North projection of the radar volumetric data. Wind turbines are represented with black
crosses.
ACCEPTED MANUSCRIPT
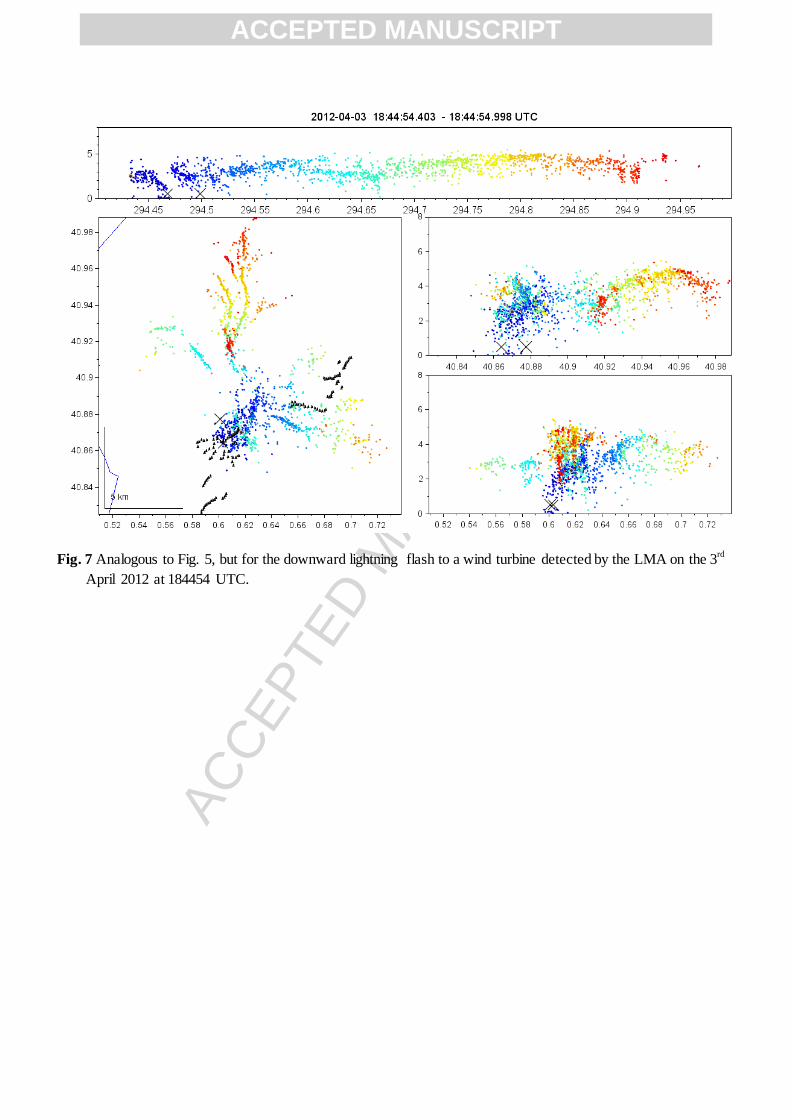
ACC
EPTE
D M
ANU
SCR
IPT
Fig. 7 Analogous to Fig. 5, but for the downward lightning flash to a wind turbine detected by the LMA on the 3rd
April 2012 at 184454 UTC.
ACCEPTED MANUSCRIPT
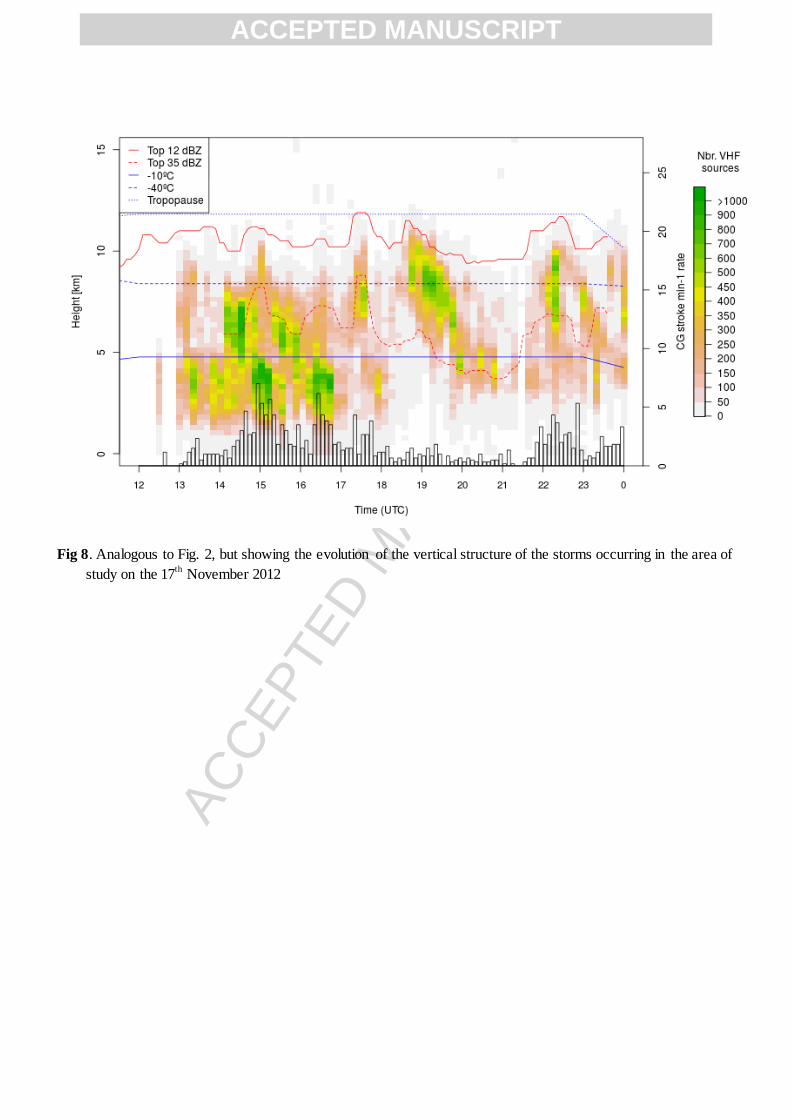
ACC
EPTE
D M
ANU
SCR
IPT
Fig 8. Analogous to Fig. 2, but showing the evolution of the vertical structure of the storms occurring in the area of
study on the 17th
November 2012
ACCEPTED MANUSCRIPT
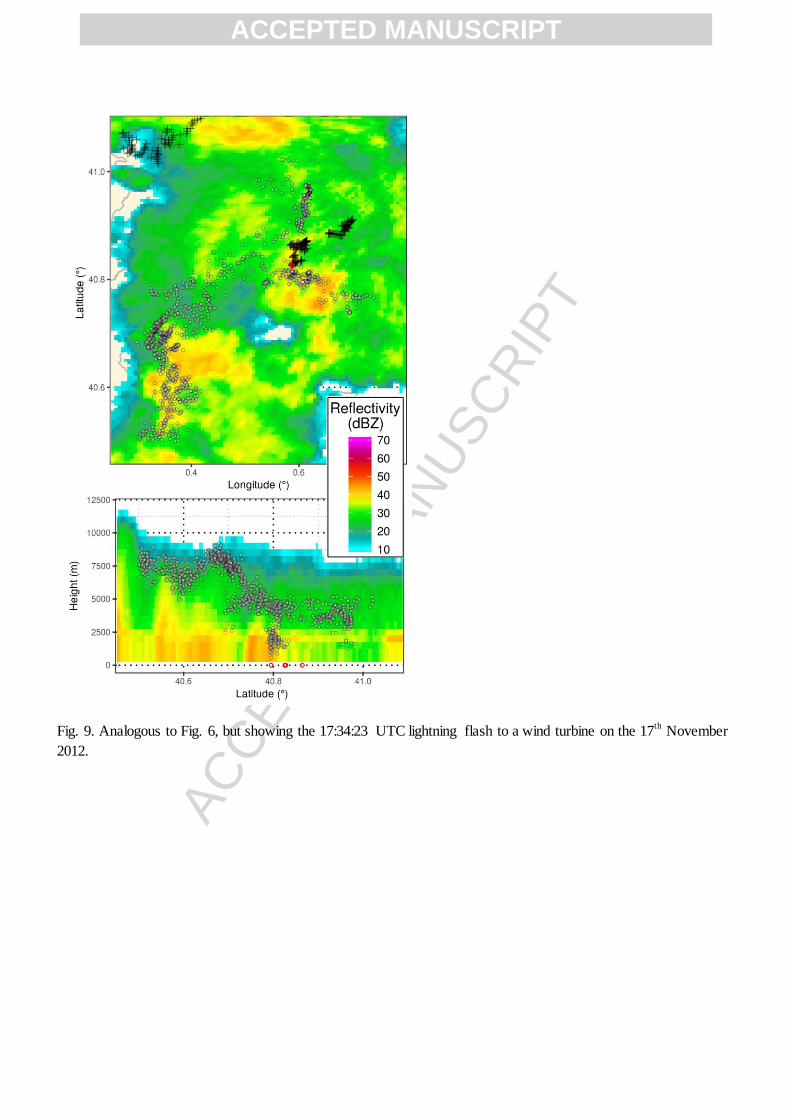
ACC
EPTE
D M
ANU
SCR
IPT
Fig. 9. Analogous to Fig. 6, but showing the 17:34:23 UTC lightning flash to a wind turbine on the 17th
November
2012.
ACCEPTED MANUSCRIPT

ACC
EPTE
D M
ANU
SCR
IPT
Fig. 10 Multi-panel display of a downward lightning flash to a wind turbine detected by the LMA on the 16th
November 2013 at 08:37:14 UTC. For top and left panels see legend in Fig. 5. Unlike the previous LMA
figures, here the right panels show the time-distance graph. The dashed reference lines indicate slopes
corresponding to speeds of 2·104
ms-1
, 105
ms-1
, and 106
ms-1
. The reference location for the distance is the
initiation point of each flash or a cloud-to-ground stroke (at t=0). Black square marks are low-frequency sources
detected by LINET (intra-cloud or cloud-to-ground strokes).
ACCEPTED MANUSCRIPT

ACC
EPTE
D M
ANU
SCR
IPT
Fig. 11. Analogous to Fig. 6, but showing the 08:40:18 UTC lighting flash to a wind turbine on the 18th
January
2014.
ACCEPTED MANUSCRIPT

ACC
EPTE
D M
ANU
SCR
IPT
Fig. 12 Analogous to Fig. 10, but for the lightning-triggered upward lightning flash from a wind turbine detected by
the LMA on the 18th
January 2014 at 09:00:13 UTC.
ACCEPTED MANUSCRIPT

ACC
EPTE
D M
ANU
SCR
IPT
Fig. 13 Charge structure in a vertical profile during the periods for which lightning to/from WT were recorded. The
charge structure is inferred from the Lightning Mapping Array (LMA) data analysis, the size of the symbols
(+/-) being proportinonal to VHF source density (approximation, not to scale).
ACCEPTED MANUSCRIPT

ACC
EPTE
D M
ANU
SCR
IPT
Fig. 14 Annual evolution of the –10°C isotherm height over a 10-year period (2006–2015). Median (bold line), area
between percent 25 and 75 (dark grey) and area between min and max (light grey) AMGL Source: Barcelona
radiosonde data
ACCEPTED MANUSCRIPT

ACC
EPTE
D M
ANU
SCR
IPT
HIGHLIGHTS
Lightning to wind turbines tend to occur outside the main thunderstorm warm-season
Thunderstorms initiating downwards to wind turbines presented limited vertical
developments
Downwards to wind turbines were mainly negative CGs with peak currents above the average
Conditions for self-initiated upwards resemble those of Japan /U.S winter thunderstorms
ACCEPTED MANUSCRIPT
Related Documents