Physics 1050 Experiment 2 Acceleration Due to Gravity

Welcome message from author
This document is posted to help you gain knowledge. Please leave a comment to let me know what you think about it! Share it to your friends and learn new things together.
Transcript
Physics 1050Experiment 2
Acceleration Due to Gravity

Physics 1050Experiment 2
Prelab Questions
These questions need to be completed before entering the lab. Show all workings.
Prelab 1:For a falling ball which bounces, draw the expected shape of the vertical position vs time graph.
Prelab 2:From the position vs time graph of an object moving with constant acceleration, how could you find the instantaneous velocity?
Q
Q
!

Physics 1050Experiment 2
Contents
Part I: Introduction
Part II: Apparatus
Part III: Data Acquisition
Part IV: Data Analysis
Part V: Summary

Physics 1050Experiment 2
Part I: Introduction
In this experiment you will study the motion of a falling ball which experiences constant acceleration.
You will use a Motion Detector to measure the position of the ball as a function of time. The motion detector is connected to the computer through a LabPro interface and controlled using Logger Pro. You will use this combination of hardware and software to generate graphs of distance, velocity, and acceleration as functions of time. The goals of this experiment are:
To represent the motion of an object through graphs of position, velocity, and acceleration versus time.
To investigate the relationship between displacement versus time, velocity versus time, and acceleration versus time representations of a given motion.
Physics 1050Experiment 2
Part II: Apparatus
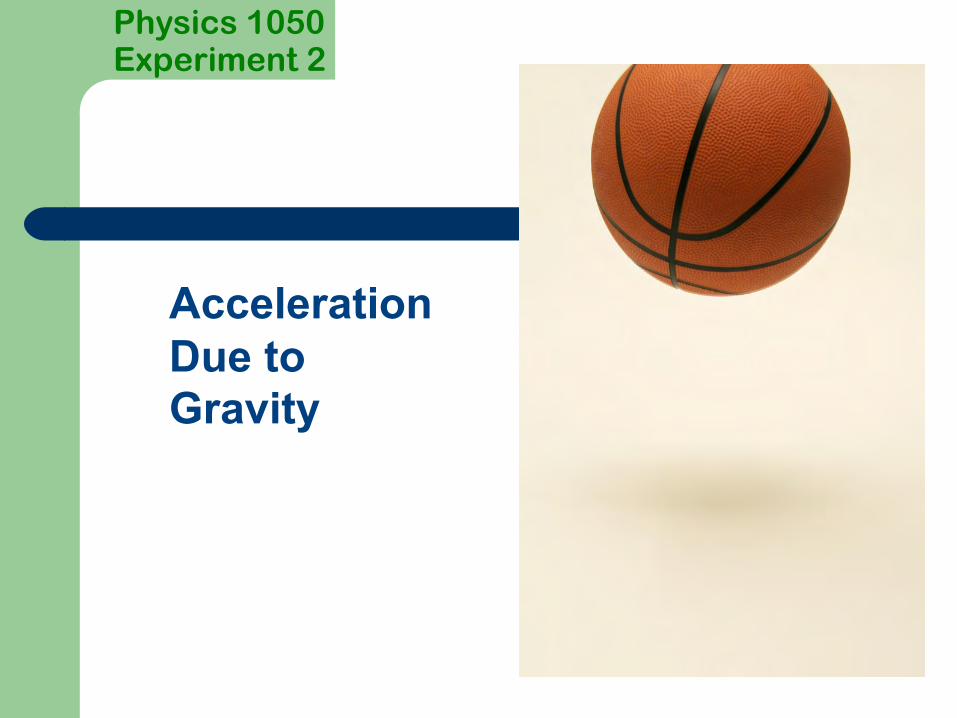
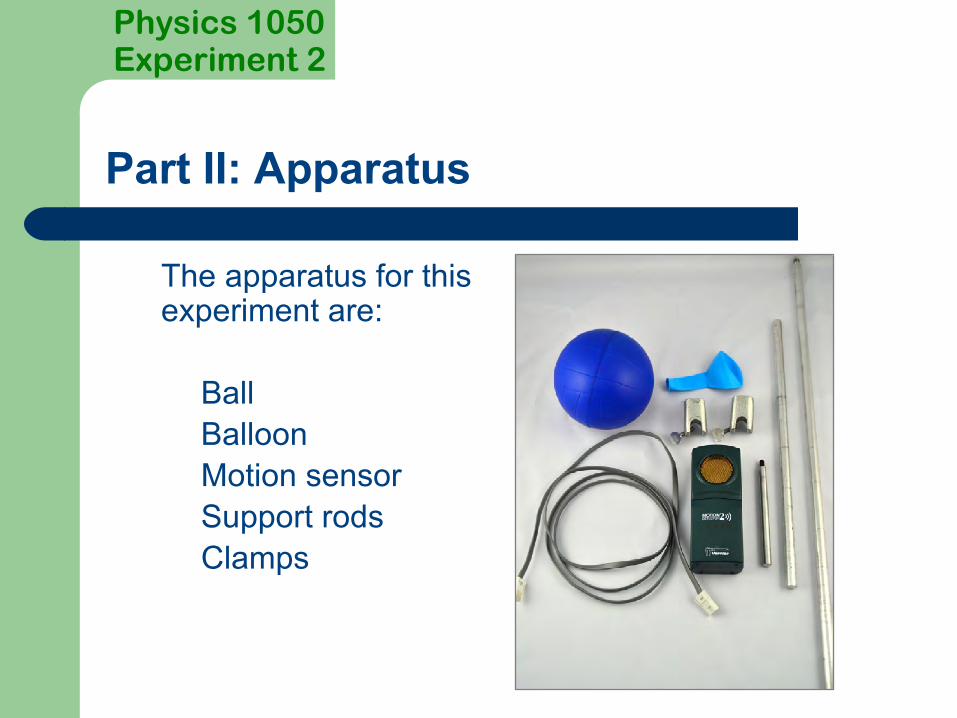
The apparatus for this experiment are:
BallBalloonMotion sensorSupport rodsClamps
Physics 1050Experiment 2
Part II: Apparatus Setup
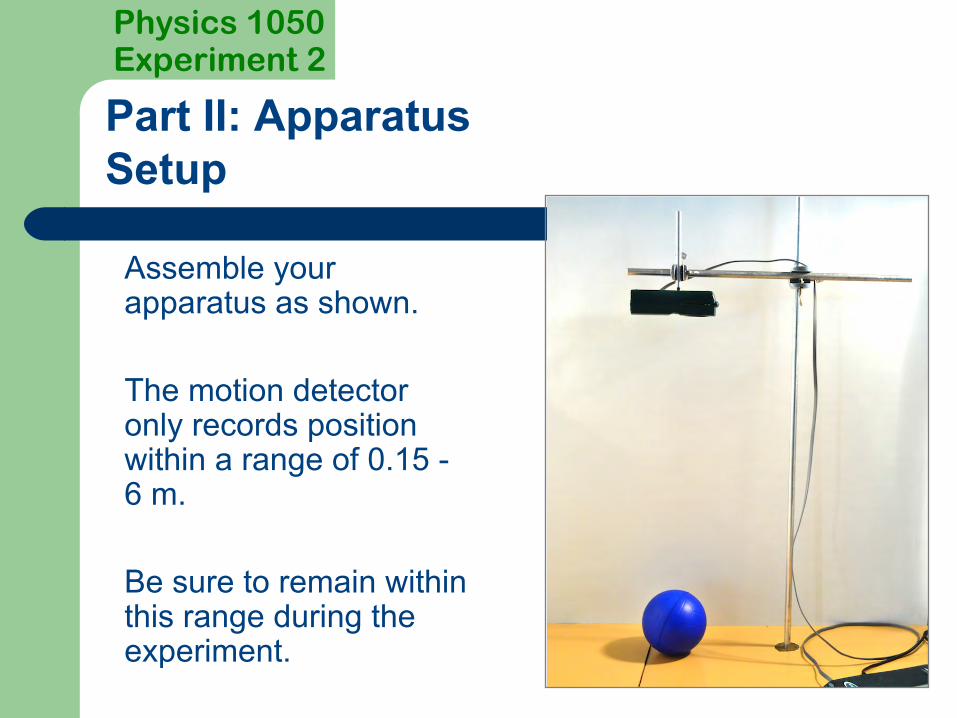
Assemble your apparatus as shown.
The motion detector only records position within a range of 0.15 -6 m.
Be sure to remain within this range during the experiment.
Physics 1050Experiment 2
Part III: Data Acquisition
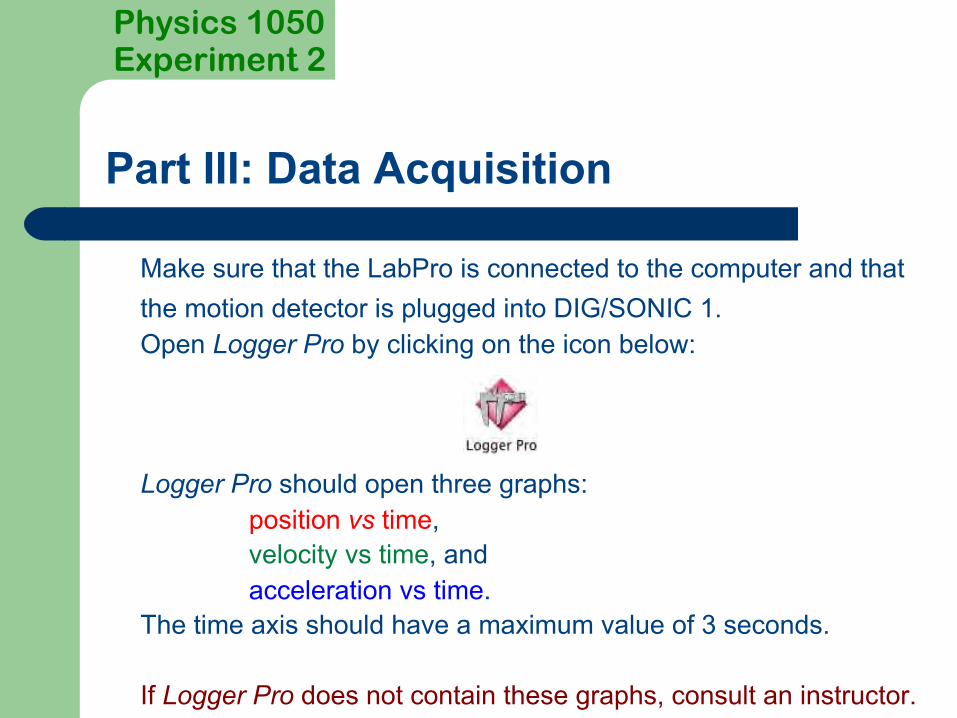
Make sure that the LabPro is connected to the computer and that the motion detector is plugged into DIG/SONIC 1. Open Logger Pro by clicking on the icon below:
Logger Pro should open three graphs:position vs time,velocity vs time, andacceleration vs time.
The time axis should have a maximum value of 3 seconds.
If Logger Pro does not contain these graphs, consult an instructor.
Physics 1050Experiment 2
Part III: Data Acquisition
Before collecting data:
Zero the motion sensor relative to the table top:
Make sure the path is clear (nothing between the motion sensor and the table top)
Click Experiment then Zero.
!
Physics 1050Experiment 2
Part III: Data Acquisition
Hold the ball under the motion detector at a minimum distance of 0.15 m.Click the Collect button in Logger Pro.
Logger Pro will begin to collect data (collection begins when the detector begins to "click" rapidly).
Release the ball smoothly ensuring it hits the table top after it falls.
Logger Pro should now display three graphs representing the ball’s motion: position vs time, velocity vs time, and acceleration vs time.
Do not print your graph yet! Printing instructions are on the following slides.
!

Physics 1050Experiment 2
Part IV: Data Analysis
Examine your data. Are they reasonable? If not, repeat the experiment or consult an instructor.
When you are happy with your data, save it! First switch to LoggerPro, then click File and Save As. Change the name of the graph to graph1.cmbl and save the file to the Desktop.Autoscale each graph by clicking on it then clicking
CHECKPOINT: Have an instructor check your graph and initial your lab report.
QUESTION 1: Did the shape of your position vs time graph on LoggerPro match your predicted graph from Prelab Question 1? Explain any differences.
Q
!
CP

Physics 1050Experiment 2
Part IV: Data AnalysisPrint your Graph
Click File then Page Setup. Click landscape orientation. Click OK.
Click File then Print.
To select the only necessary page: Click Pages. Choose Single. OR Choose From 1 to 1.
Click File and Print to print your graph.Attach your graph to your lab report.LW
P

Physics 1050Experiment 2
Part IV: Data Analysis
In LoggerPro:
Display the coordinates in a box on the graph:
• Click on each graph to activate it
• Click Analyze then Examine or click
Physics 1050Experiment 2
Part IV: Data Analysis
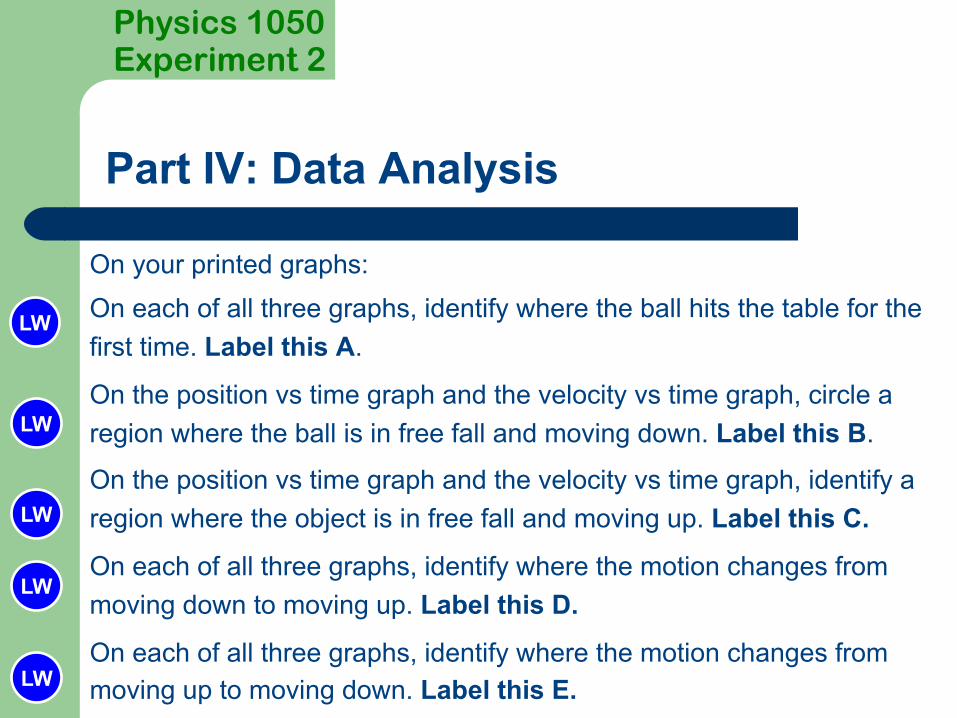
On your printed graphs:On each of all three graphs, identify where the ball hits the table for the first time. Label this A.
On the position vs time graph and the velocity vs time graph, circle a region where the ball is in free fall and moving down. Label this B.
On the position vs time graph and the velocity vs time graph, identify a region where the object is in free fall and moving up. Label this C.
On each of all three graphs, identify where the motion changes from moving down to moving up. Label this D.
On each of all three graphs, identify where the motion changes from moving up to moving down. Label this E.
LW
LW
LW
LW
LW

Physics 1050Experiment 2
Part IV: Data Analysis
Activate the position vs time graph and use the Analyze then Examine function to:QUESTION 2: Examine your position vs time graph and record the time,
t1, at which the ball first hits the table.Also record t2, the time at which the ball hits the table for the second time.
You may use the Analyze then Examine function to identify co-ordinates on the graphs.QUESTION 3: What are the position and velocity at time t1?
Are these values expected? Comment.
By examining the velocity vs time graph in the region between t1 and t2:QUESTION 4: What is the maximum upward velocity?
What is the maximum downward velocity? Are these two velocities related? Is this result expected?
Q
Q
Q
Physics 1050Experiment 2
Part IV: Data Analysis
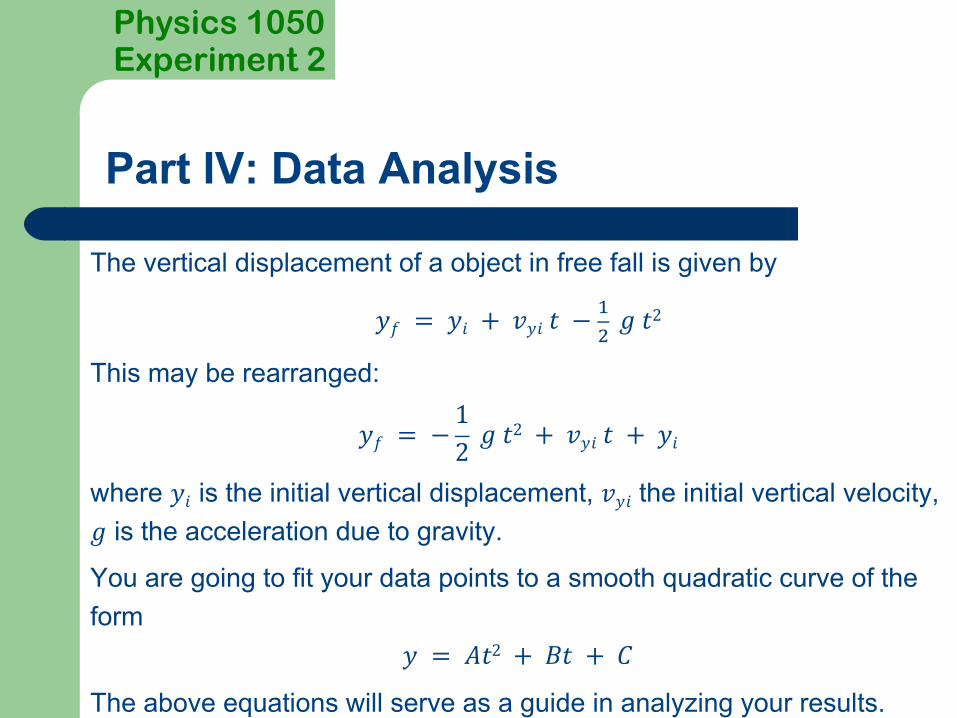
The vertical displacement of a object in free fall is given by
𝑦𝑓 = 𝑦𝑖 + 𝑣𝑦𝑖𝑡 −*+ 𝑔𝑡
2
This may be rearranged:
𝑦𝑓 = −12 𝑔𝑡
2 + 𝑣𝑦𝑖𝑡 + 𝑦𝑖
where 𝑦𝑖 is the initial vertical displacement, 𝑣𝑦𝑖 the initial vertical velocity, 𝑔 is the acceleration due to gravity.
You are going to fit your data points to a smooth quadratic curve of the form
𝑦 = 𝐴𝑡2 + 𝐵𝑡 + 𝐶
The above equations will serve as a guide in analyzing your results.

Physics 1050Experiment 2
Part IV: Data Analysis
QUESTION 5: To what physical parameter does A in the fit equation (𝑦 = 𝐴𝑡2 + 𝐵𝑡 + 𝐶) correspond? Explain or show your workings.
What value do you expect for parameter A (including units)? Record this value in Table 1.If you are having trouble, refer to the previous slide.
Q
LW
Physics 1050Experiment 2
Part IV: Data Analysis
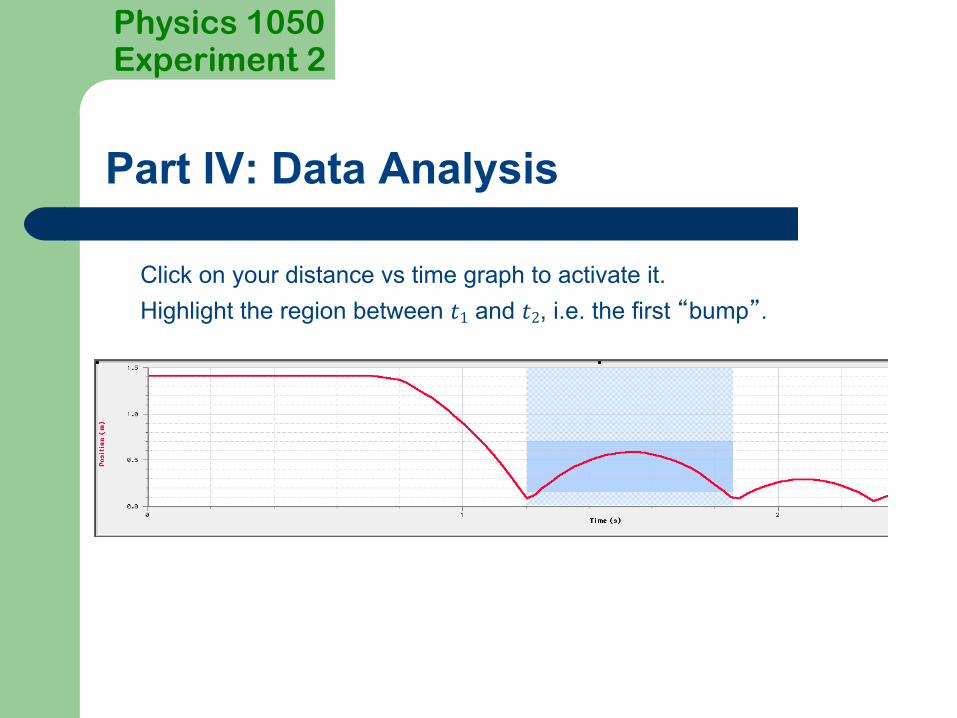
Click on your distance vs time graph to activate it.Highlight the region between 𝑡1 and 𝑡2, i.e. the first “bump”.

Physics 1050Experiment 2
Part IV: Data Analysis
Click Analyze then Curve Fit.Under Options: Fit Type select “Automatic”
Select Quadratic from the General Equation list and click Try Fit.
If the fit is satisfactory, click on OK. Enter the value of the Automatic best fit parameter A in Table 1.Edit the title of your graph to “Distance vs. Time”.
LW
Physics 1050Experiment 2
Part IV: Data Analysis
QUESTION 6: How does your expected value of A match the displayed value of the automatic curve fit? Comment on any differences.
QUESTION 7: From your automatic curve fit, what is the value of g and its uncertainty?
Print your graph (with fit parameters) and include it with your lab report.
Q
Q
P

Physics 1050Experiment 2
Part V: Data Acquisition and Analysis (Falling Balloon)
Inflate your balloon until it has a rounded shape (with approximately the same diameter as your ball).
Repeat your experiment using the balloon, i.e., drop the balloon and use the computer to record the position as a function of time.
Use LoggerPro to create an automatic fit to the position vs time data.
Do not print this graph!
Record your automatic fit parameter A in Table 2.LW
!

Physics 1050Experiment 2
Part VI: Summary
QUESTION 8: From your automatic curve fit, what is the value of the balloon’s acceleration and its uncertainty? How does this value compare with the acceleration of the ball?
QUESTION 9: Write the range of the value of 𝑔 found in Question 7. Is it equal to the accepted value of 9.81𝑚/𝑠2? Comment on any differences.
QUESTION 10: Why do the ball and balloon have different accelerations?
Hint: Think carefully about the forces acting on each object. How do those forces depend on the mass of the objects?
Q
Q
Q
!

Physics 1050Experiment 2
Part V: Summary
QUESTION 11: List at least 3 uncertainties in this experiment.
Classify them as random or systematic.
l Make sure you have answered all Questions completely.
l Check that you have completed all Tables.
l Include your printed graphs from LoggerPro.
Q
Related Documents