Accelerating the development and deployment of clean technologies through prospective life-cycle systems analysis Eric Masanet Morris E. Fine Junior Professor of Materials and Manufacturing Associate Professor of Mechanical Engineering Associate Professor of Chemical and Biological Engineering Guest Faculty Researcher, Argonne National Laboratory e [email protected] http://ersal.mccormick.northwestern.edu/

Accelerating the development and deployment of clean technologies through prospective life-cycle systems analysis Eric Masanet Morris E. Fine Junior Professor.
Dec 27, 2015
Welcome message from author
This document is posted to help you gain knowledge. Please leave a comment to let me know what you think about it! Share it to your friends and learn new things together.
Transcript

Accelerating the development and deployment of clean technologies through prospective life-
cycle systems analysisEric Masanet
Morris E. Fine Junior Professor of Materials and Manufacturing
Associate Professor of Mechanical Engineering
Associate Professor of Chemical and Biological Engineering
Guest Faculty Researcher, Argonne National Laboratory
http://ersal.mccormick.northwestern.edu/
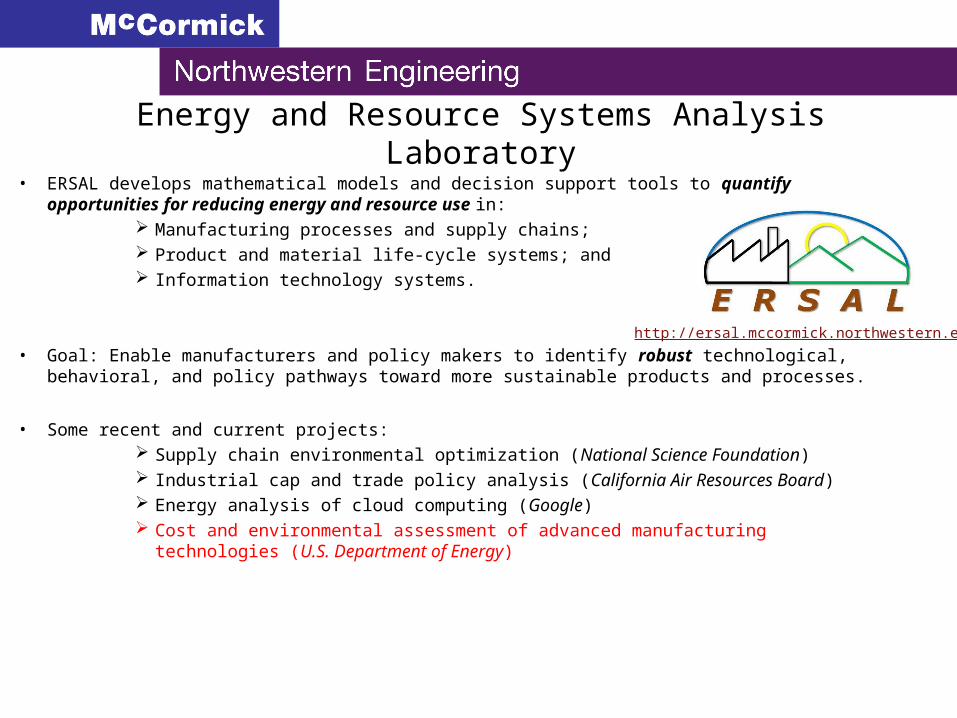
Energy and Resource Systems Analysis Laboratory• ERSAL develops mathematical models and decision support tools to quantify opportunities for
reducing energy and resource use in: Manufacturing processes and supply chains; Product and material life-cycle systems; and Information technology systems.
• Goal: Enable manufacturers and policy makers to identify robust technological, behavioral, and policy pathways toward more sustainable products and processes.
• Some recent and current projects: Supply chain environmental optimization (National Science Foundation) Industrial cap and trade policy analysis (California Air Resources Board) Energy analysis of cloud computing (Google) Cost and environmental assessment of advanced manufacturing technologies (U.S.
Department of Energy)
http://ersal.mccormick.northwestern.edu

Source: IIASA (2012). GEA.
150 Years of Engineering Impact

Source: Bruce E. Dale, Michigan State (IEA data)
Energy use and human development
As of 2013:
-1.3 billion people are without access to electricity
-2.6 billion people rely on the traditional use of biomass for cooking
-1.1 billion people lack access to clean water
Source: IEA (2013); WHO (2014)
As of 2013:
-1.3 billion people are without access to electricity
-2.6 billion people rely on the traditional use of biomass for cooking
-1.1 billion people lack access to clean water
Source: IEA (2013); WHO (2014)

Source: International Energy Agency (IEA) (2010)Notes: WEO = IEA World Energy Outlook; ETP = EA Energy Technology Perspectives
Engineering’s Grand Challenge for the 21st Century:
d
Accelerating development and deployment of sustainable technologies
Where we’re headed without technology interventions
Where we could be with massive-scale technology development and deployment
We are here
Avoiding catastrophic climate change – 450 ppm case
Technology “wedges”
40
20
0
-20
-40
-60
-80
-100
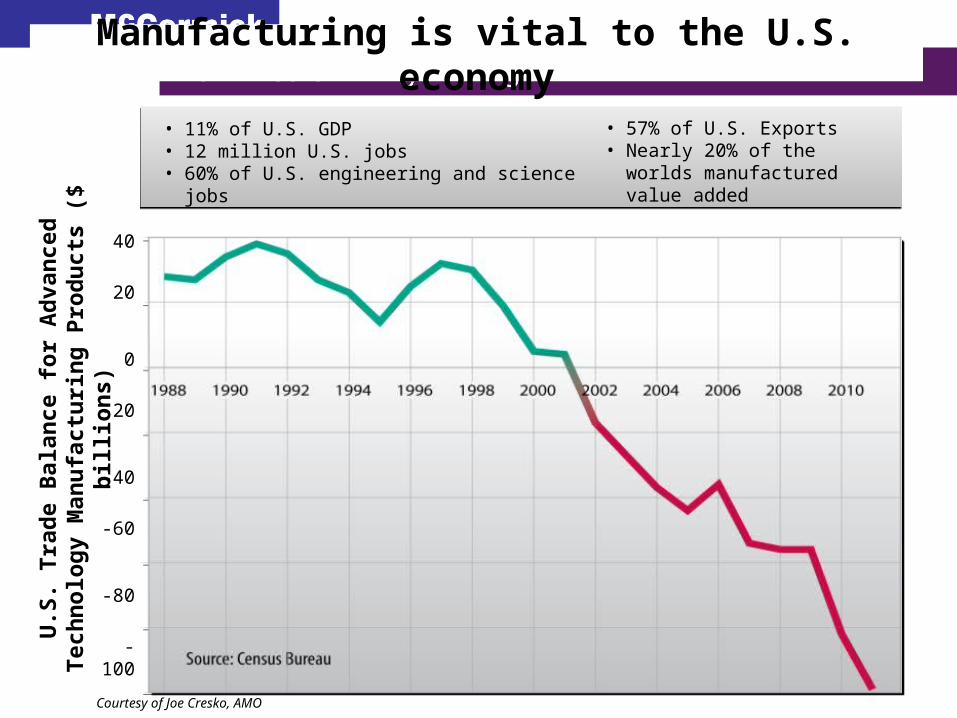
Manufacturing is vital to the U.S. economy
• 57% of U.S. Exports• Nearly 20% of the worlds
manufactured value added
• 11% of U.S. GDP• 12 million U.S. jobs• 60% of U.S. engineering and science jobs
U.S
. Tra
de
Bal
an
ce
for
Ad
van
ced
Te
chn
olo
gy
Man
ufa
ctu
rin
g P
rod
uc
ts (
$ b
illio
ns)
Courtesy of Joe Cresko, AMO

Strengthen America's energy security, environmental quality, and economic vitality through enhanced energy efficiency and productivity
Spark a renaissance in American manufacturing through public private partnerships that help our manufacturers compete with anyone in the world.
Office of Energy Efficiency and
Renewable Energy
U.S. Dept. of Energy
Office of Energy Efficiency and
Renewable Energy
U.S. Dept. of Energy
Advanced Manufacturing Office – Goals and National Importance
The Advanced Manufacturing Partnership
The Advanced Manufacturing Partnership
Partner with industry, small business, universities, and other stakeholders to invest in technologies with the potential to create high-quality domestic manufacturing jobs and enhance the global competitiveness of the United States.
Advanced Manufacturing
Office
Courtesy of Joe Cresko, AMO

Energy Economy-wide lifecycle impacts
Manufacturing investments impact all sectors
Courtesy of Joe Cresko, AMO
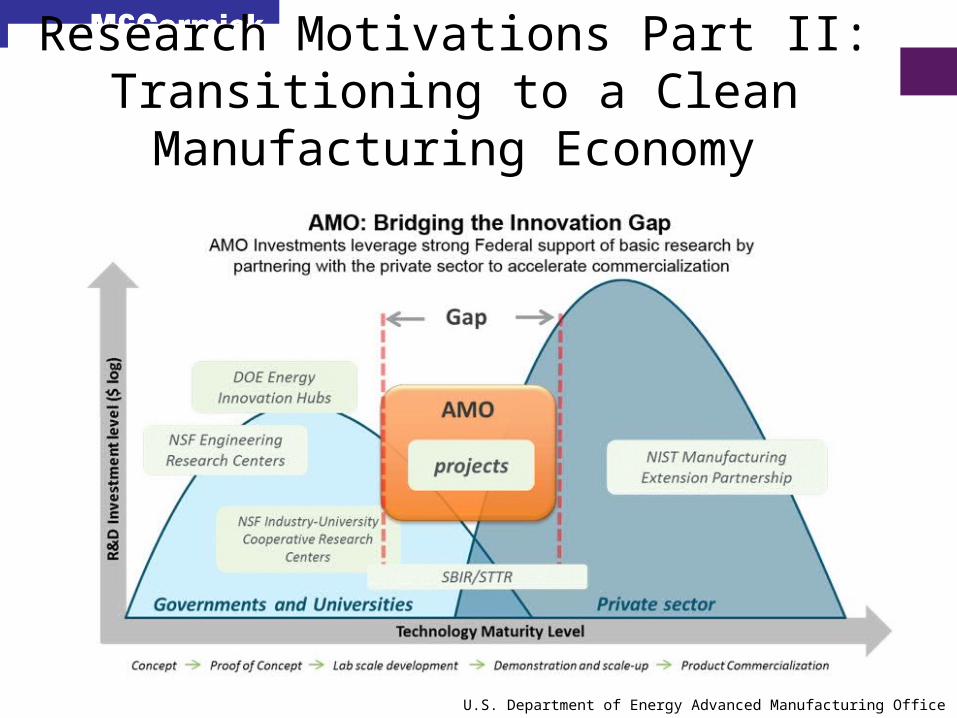
Research Motivations Part II:Transitioning to a Clean Manufacturing Economy
U.S. Department of Energy Advanced Manufacturing Office (AMO)
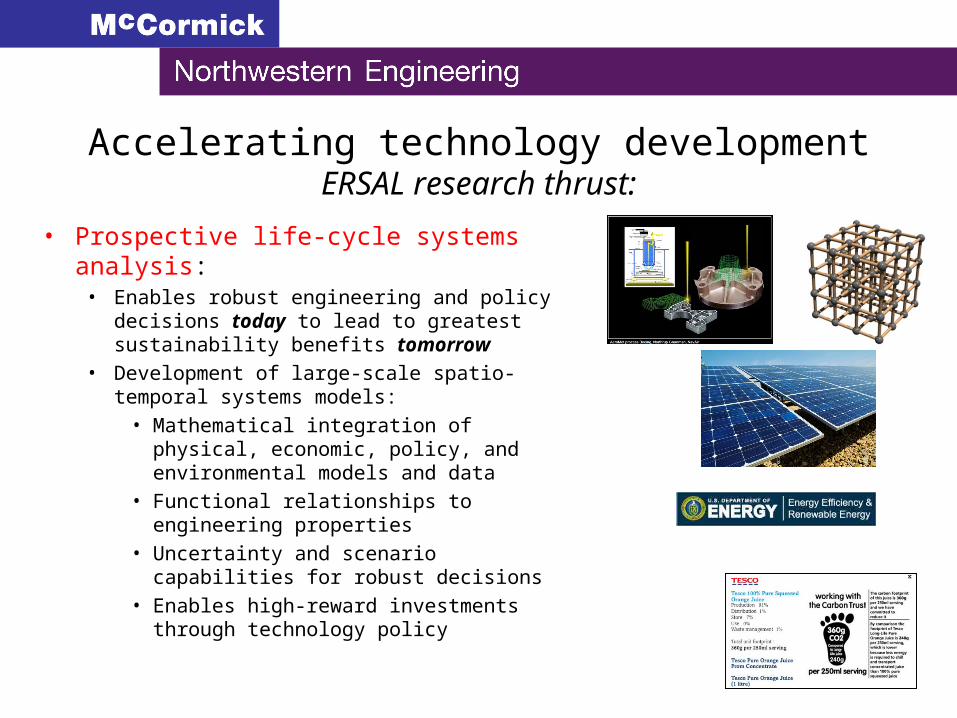
Accelerating technology developmentERSAL research thrust:
• Prospective life-cycle systems analysis:• Enables robust engineering and policy decisions
today to lead to greatest sustainability benefits tomorrow
• Development of large-scale spatio-temporal systems models:
• Mathematical integration of physical, economic, policy, and environmental models and data
• Functional relationships to engineering properties
• Uncertainty and scenario capabilities for robust decisions
• Enables high-reward investments through technology policy

Additive Manufacturing Example
• 3-D graphical models, parts built in layers
• No tools, dies, or forms• Near final shape• Reduced delivery times 75%• Mechanical properties equivalent
to wrought• Reduced material use• Reduced inventory• Significant cost and energy
savingsAdditive Manufacturing
0.38 kg
Conventional Machining
1.09 kg
Airbus example (120 brackets)

IngotForging
(slab, billet, etc.)
Machining
Atomization
Electron Beam
Melting
Selective Laser
Melting
Conventional Machining
Additive Manufacturing
Process Final part kg
Ingot consumed kg
Raw mat’lMJ
ManufMJ
TransportMJ
Use phaseMJ
End of life Total energyper bracket MJ
Total energy per (120 brackets) MJ
Machining
1.09 9.69 8892 990 41 218,000
Not considered
227,923 27.4 MM
SLM 0.38 0.64 583 198 14 76,000 Not considered
76,795 9.2 MM
EBM 0.38 0.64 583 154 14 76,000 Not considered
76,751 9.2 MM
High embodied energy of ingot plus high buy-to-fly ratio of machining pathway drives
energy differences
Courtesy of Josh Warren and Sujit Das, ORNL

Spatial-temporal systems modeling framework
Huang, R., Riddle, M., Graziano, D., and E. Masanet (2014). “The Energy and Emissions Saving Potential of Additive Manufacturing: The Case of Lightweight Aircraft.” Journal of Cleaner Production. Under review.
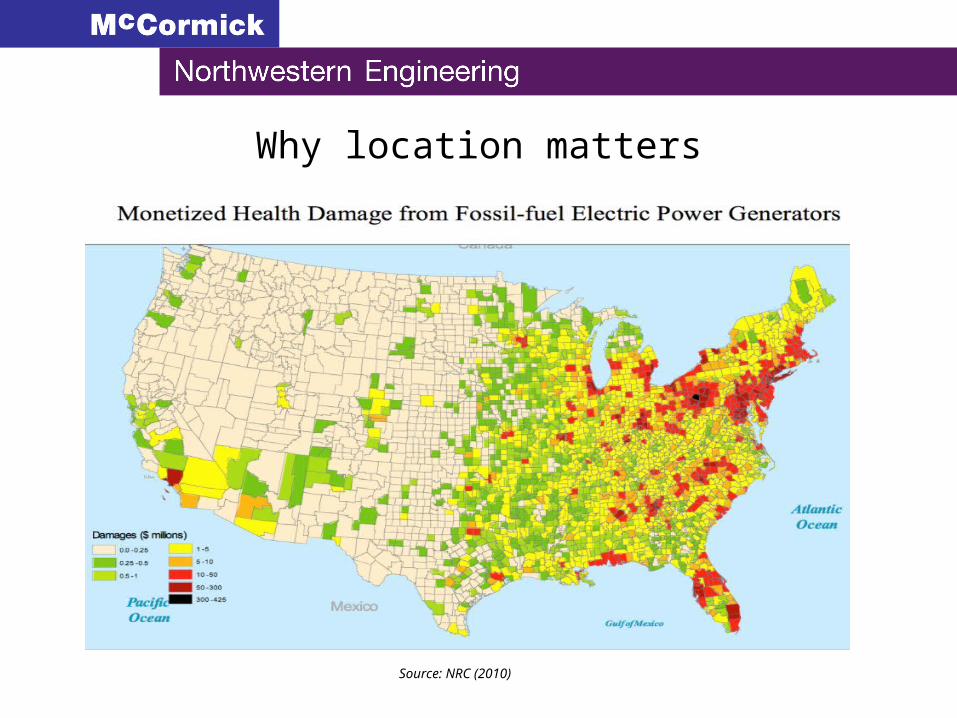
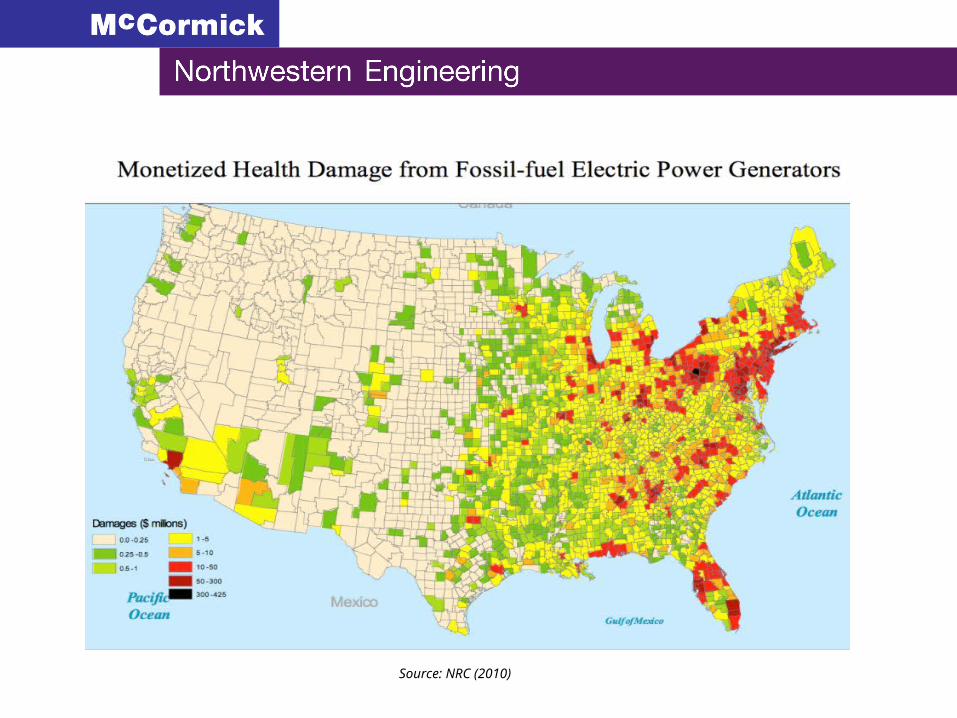
Why location matters
Source: NRC (2010)

Why time matters
Note: vertical dashed line indicates a change in the time period between data points Sources: U.S. DOE (2010), USGS (2010b), World Steel (2010)
0
10
20
30
40
50
60
70
80
90
100
0
2
4
6
8
10
12
14
16
18
20
1985 1988 1991 1994 1998 2002 2006
Perc
ent o
f U.S
. Cru
de S
teel
Pro
ducti
on
Mill
ion
Btu
per
Met
ric
Ton
of C
rude
Ste
el
Energy Intensity
Electric Furnace
Energy intensity of U.S. steelmaking

Material flow and distribution
Metrics
Demand
Technologies
TIM
E

U.S. Aircraft Fleet Case Study (2015-2050)
Huang, R., Riddle, M., Graziano, D., and E. Masanet (2014). “The Energy and Emissions Saving Potential of Additive Manufacturing: The Case of Lightweight Aircraft.” Journal of Cleaner Production. Under review.

Replaceable mass screening
Huang, R., Riddle, M., Graziano, D., and E. Masanet (2014). “The Energy and Emissions Saving Potential of Additive Manufacturing: The Case of Lightweight Aircraft.” Journal of Cleaner Production. Under review.

Replaceable mass and timing
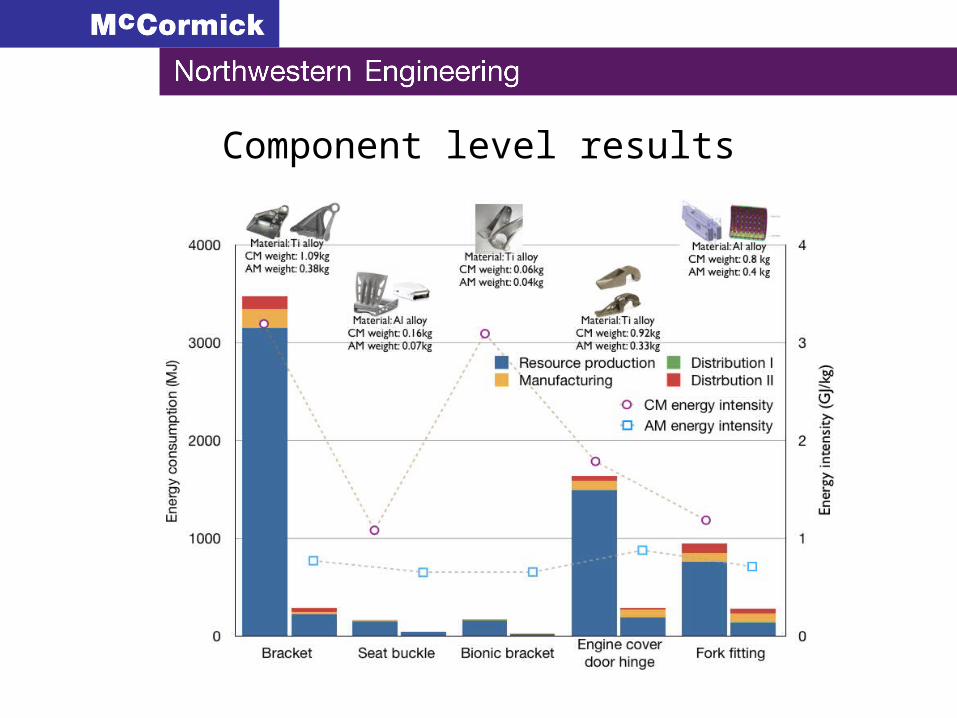
Component level results

Temporal fleet adoption modeling
Policy and R&D levers for rapid adoption:-Improved surface finish (basic research)-Reduced residual stresses (basic research)-Pilots and technology transfer-Cost and externality incentives for AM adoption

Engineering functionality drives energy savings!

Huang, R., Riddle, M., Graziano, D., and E. Masanet (2014). “The Energy and Emissions Saving Potential of Additive Manufacturing: The Case of Lightweight Aircraft.” Journal of Cleaner Production. Under review.

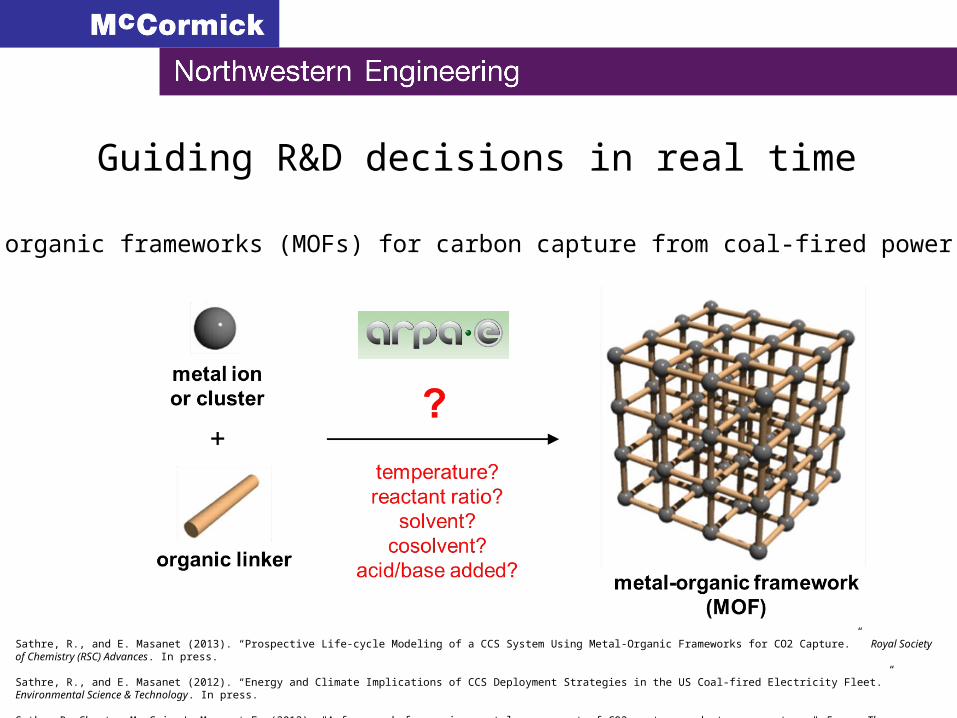
Guiding R&D decisions in real time
Metal organic frameworks (MOFs) for carbon capture from coal-fired power plants
Sathre, R., and E. Masanet (2013). “Prospective Life-cycle Modeling of a CCS System Using Metal-Organic Frameworks for CO2 Capture.” Royal Society of Chemistry (RSC) Advances. In press.
Sathre, R., and E. Masanet (2012). “Energy and Climate Implications of CCS Deployment Strategies in the US Coal-fired Electricity Fleet.” Environmental Science & Technology. In press.
Sathre R, Chester M, Cain J, Masanet E. (2012). "A framework for environmental assessment of CO2 capture and storage systems." Energy - The International Journal. 37(1): 540-548.

2Power plantsCO2 capture
CO2 compression
1Scenario conditions
5CO2 pipeline transport
CO2 re-compression
6CO2 injection
CO2
CO2
3Coal supply
4Coal transportation
8MEA consumption rate
7MEA production
10Solvent production and
recycling
9MOF production
Coal
MEANewMOF
13MOF recycling
OldMOF
12Metal extraction and
processing
11Organic ligand
production
Dynamic Prospective Systems Model• Describes system-wide energy use, GHG emissions, and cost
• Parameters describe uncertain and variable values
2Power plantsCO2 capture
CO2 compression
1Scenario conditions
5CO2 pipeline transport
CO2 re-compression
6CO2 injection
CO2
CO2
3Coal supply
4Coal transportation
8MEA consumption rate
7MEA production
10Solvent production and
recycling
9MOF production
Coal
MEANewMOF
13MOF recycling
OldMOF
12Metal extraction and
processing
11Organic ligand
production
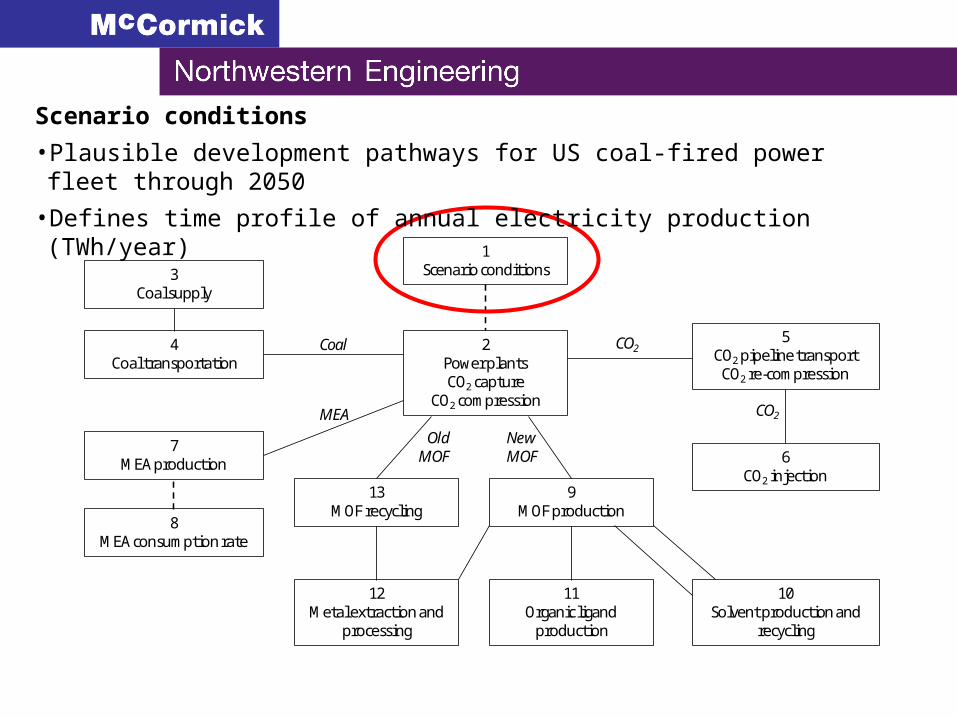
Scenario conditions
• Plausible development pathways for US coal-fired power fleet through 2050
• Defines time profile of annual electricity production (TWh/year)

CCS deployment scenarios
0
500
1000
1500
2000
2500
2010 2015 2020 2025 2030 2035 2040 2045 2050
TWh/
year
Ultra-super-criticalSuper-criticalSub-critical
0
500
1000
1500
2000
2500
2010 2015 2020 2025 2030 2035 2040 2045 2050
TWh/
year
Ultra-super-critical CCSSuper-critical CCSSuper-criticalSub-critical CCSSub-critical
No CCS CCS in new plants and retrofitted plants
• Development of US coal-fired power plant fleet through 2050
• Electricity demand through 2035 based on EIA (2010), extrapolated thereafter
• Retirement of existing plants based on Ventyx (2011)
• CCS available for deployment after 2020
• Other scenarios (not shown) describe other deployment patterns
• Material presented today shows upper bound of CCS and MOF use in coal-fired plants
2Power plantsCO2 capture
CO2 compression
1Scenario conditions
5CO2 pipeline transport
CO2 re-compression
6CO2 injection
CO2
CO2
3Coal supply
4Coal transportation
8MEA consumption rate
7MEA production
10Solvent production and
recycling
9MOF production
Coal
MEANewMOF
13MOF recycling
OldMOF
12Metal extraction and
processing
11Organic ligand
production
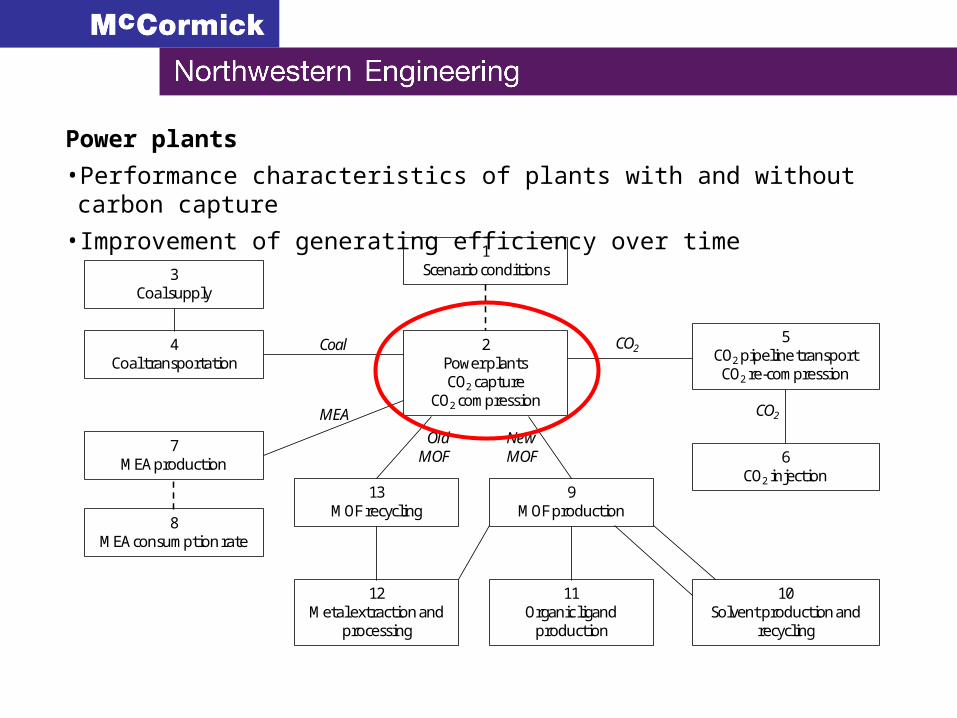
Power plants
• Performance characteristics of plants with and without carbon capture
• Improvement of generating efficiency over time

2Power plantsCO2 capture
CO2 compression
1Scenario conditions
5CO2 pipeline transport
CO2 re-compression
6CO2 injection
CO2
CO2
3Coal supply
4Coal transportation
8MEA consumption rate
7MEA production
10Solvent production and
recycling
9MOF production
Coal
MEANewMOF
13MOF recycling
OldMOF
12Metal extraction and
processing
11Organic ligand
production
Coal supply and transportation
• Energy use and emissions for coal mining and rail transport
• Coal mine methane emissions

2Power plantsCO2 capture
CO2 compression
1Scenario conditions
5CO2 pipeline transport
CO2 re-compression
6CO2 injection
CO2
CO2
3Coal supply
4Coal transportation
8MEA consumption rate
7MEA production
10Solvent production and
recycling
9MOF production
Coal
MEANewMOF
13MOF recycling
OldMOF
12Metal extraction and
processing
11Organic ligand
production
CO2 transport and sequestration
• Construction and operation of CO2 pipelines
• Injection in geologic formations

2Power plantsCO2 capture
CO2 compression
1Scenario conditions
5CO2 pipeline transport
CO2 re-compression
6CO2 injection
CO2
CO2
3Coal supply
4Coal transportation
8MEA consumption rate
7MEA production
10Solvent production and
recycling
9MOF production
Coal
MEANewMOF
13MOF recycling
OldMOF
12Metal extraction and
processing
11Organic ligand
production
MEA production
• Baseline capture technology to which MOF is compared

2Power plantsCO2 capture
CO2 compression
1Scenario conditions
5CO2 pipeline transport
CO2 re-compression
6CO2 injection
CO2
CO2
3Coal supply
4Coal transportation
8MEA consumption rate
7MEA production
10Solvent production and
recycling
9MOF production
Coal
MEANewMOF
13MOF recycling
OldMOF
12Metal extraction and
processing
11Organic ligand
production
MOF production
• Projections of large-scale MOF synthesis
• Hybrid modeling using MOF-specific data plus proxy data from chemical industries

2Power plantsCO2 capture
CO2 compression
1Scenario conditions
5CO2 pipeline transport
CO2 re-compression
6CO2 injection
CO2
CO2
3Coal supply
4Coal transportation
8MEA consumption rate
7MEA production
10Solvent production and
recycling
9MOF production
Coal
MEANewMOF
13MOF recycling
OldMOF
12Metal extraction and
processing
11Organic ligand
production
MOF input materials
• Potential material supply for large-scale MOF production
• Hybrid modeling using MOF-specific data plus proxy data from chemical industries
2Power plantsCO2 capture
CO2 compression
1Scenario conditions
5CO2 pipeline transport
CO2 re-compression
6CO2 injection
CO2
CO2
3Coal supply
4Coal transportation
8MEA consumption rate
7MEA production
10Solvent production and
recycling
9MOF production
Coal
MEANewMOF
13MOF recycling
OldMOF
12Metal extraction and
processing
11Organic ligand
production
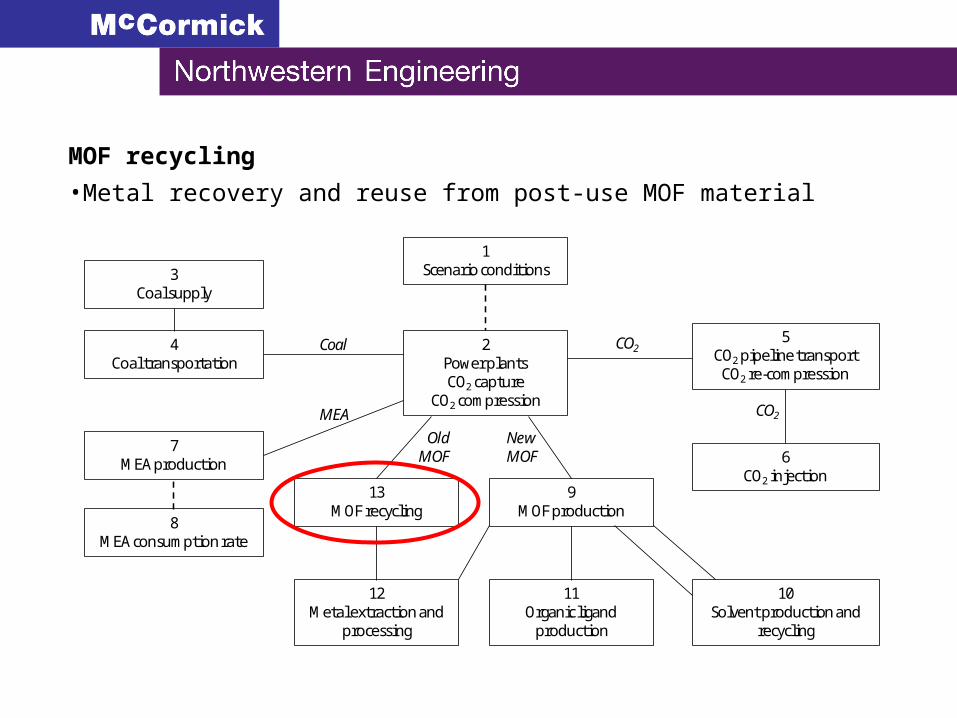
MOF recycling
• Metal recovery and reuse from post-use MOF material
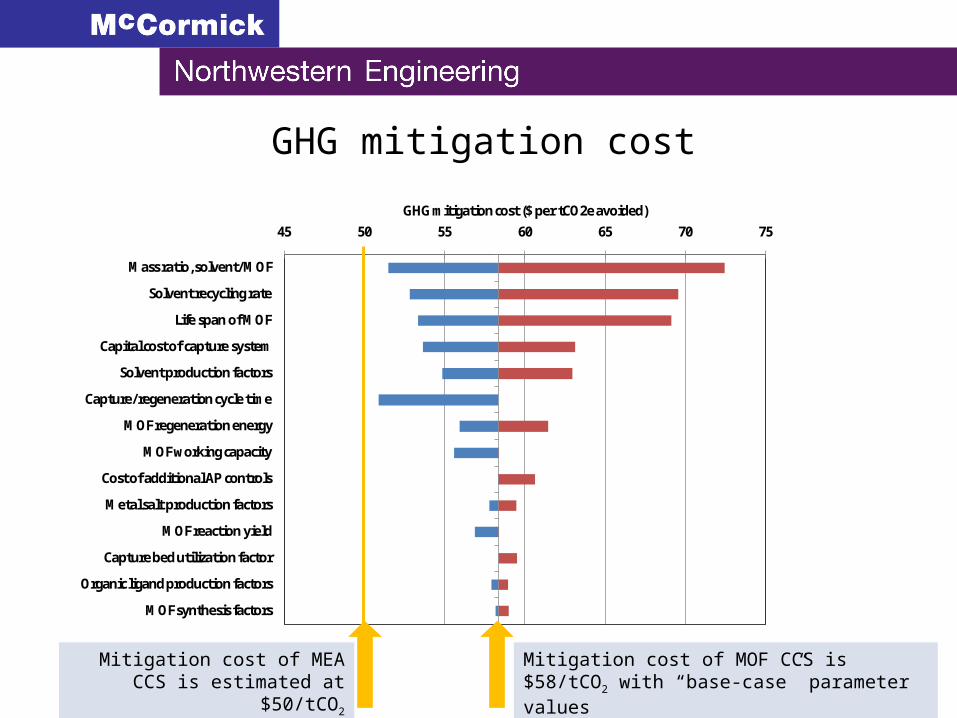
GHG mitigation cost
Mitigation cost of MEA CCS is estimated at $50/tCO2
45 50 55 60 65 70 75
Mass ratio, solvent/MOF
Solvent recycling rate
Life span of MOF
Capital cost of capture system
Solvent production factors
Capture/regeneration cycle time
MOF regeneration energy
MOF working capacity
Cost of additional AP controls
Metal salt production factors
MOF reaction yield
Capture bed utilization factor
Organic ligand production factors
MOF synthesis factors
GHG mitigation cost ($ per tCO2e avoided)
Mitigation cost of MOF CCS is $58/tCO2 with “base-case” parameter values
Environmental Impacts of Large-scale Photovoltaic (PV)
Deployment
Pei Zhai1, Peter Larsen1, Dev Millstein1, Surabi Menon1, Eric Masanet2
1 Lawrence Berkeley National Laboratory2 Northwestern University
Source: NRC (2010)
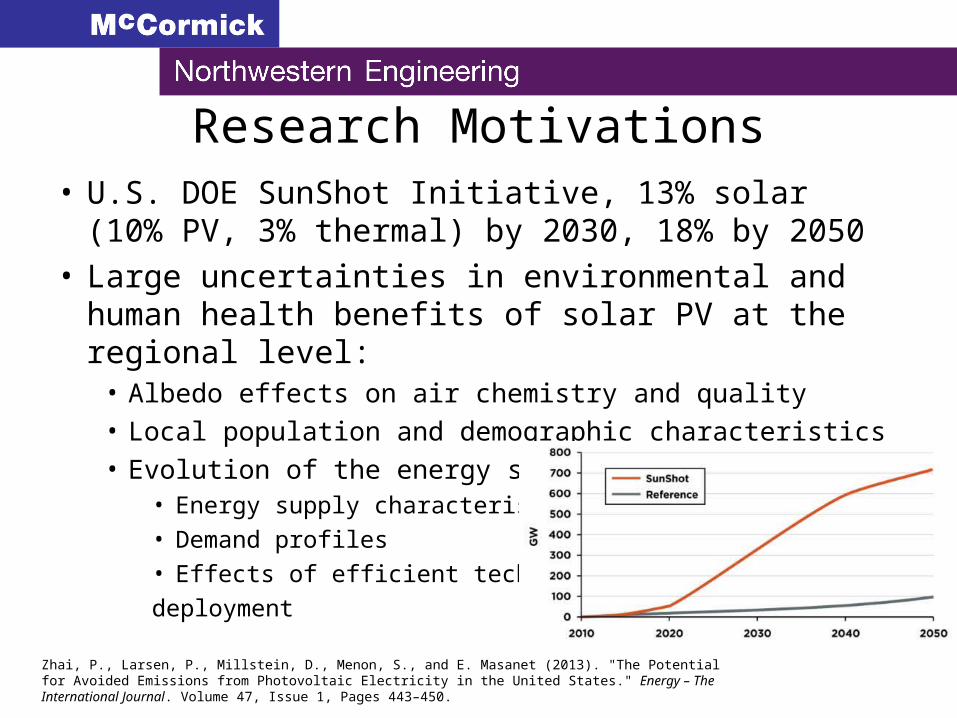
• U.S. DOE SunShot Initiative, 13% solar (10% PV, 3% thermal) by 2030, 18% by 2050
• Large uncertainties in environmental and human health benefits of solar PV at the regional level:
• Albedo effects on air chemistry and quality• Local population and demographic characteristics• Evolution of the energy system
• Energy supply characteristics
• Demand profiles
• Effects of efficient technology
deployment
Research Motivations
Zhai, P., Larsen, P., Millstein, D., Menon, S., and E. Masanet (2013). "The Potential for Avoided Emissions from Photovoltaic Electricity in the United States." Energy – The International Journal. Volume 47, Issue 1, Pages 443–450.
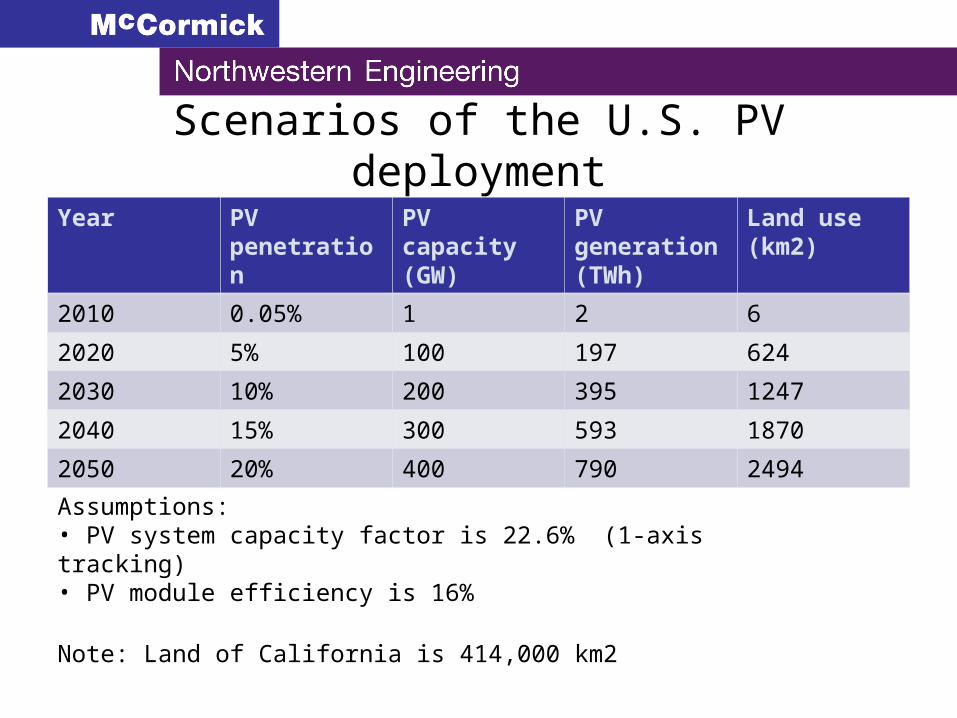
Scenarios of the U.S. PV deployment
Year PV penetration
PV capacity (GW)
PV generation (TWh)
Land use (km2)
2010 0.05% 1 2 6
2020 5% 100 197 624
2030 10% 200 395 1247
2040 15% 300 593 1870
2050 20% 400 790 2494
Assumptions: • PV system capacity factor is 22.6% (1-axis tracking)• PV module efficiency is 16%
Note: Land of California is 414,000 km2

Research framework and models
Environmental impacts
Environmental impacts
Large-scale PV deployment
(eg. 10% by 2030)
Large-scale PV deployment
(eg. 10% by 2030)
Weather model
EmissionsEmissions
Albedo (reflection coefficient)
Albedo (reflection coefficient)
Electricity generationElectricity generation
Land useLand use
GIS model
Energy model
Coal PP retirement
(eg. 50% by 2050)
Coal PP retirement
(eg. 50% by 2050)
Scenario analysis
Health impactsHealth
impacts
Storage requirement (capacity, duration)
Storage requirement (capacity, duration)
Material Requirement (abundance, cost, energy)Material Requirement (abundance, cost, energy)
Emerging technologies (early stage)
Emerging technologies (early stage)
Other renewable
Other renewable
Energy efficiencyEnergy
efficiency
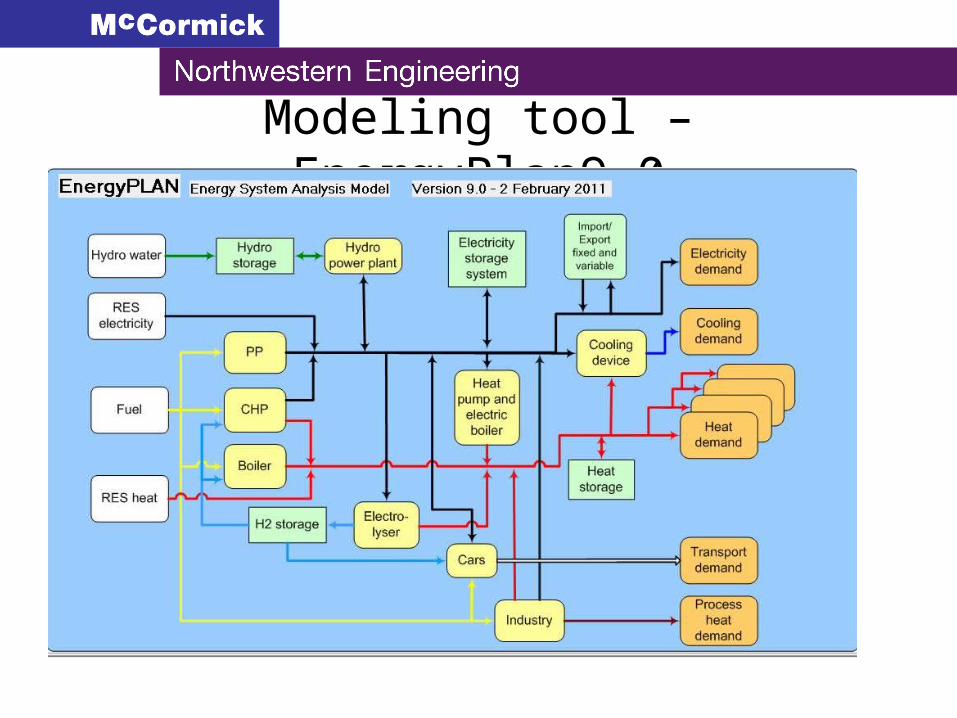
Modeling tool – EnergyPlan9.0

Understanding hourly generation is important to renewable energy integration, energy efficiency analysis

Results: PV benefits?
Prospective techno-economic life-cycle systems analysis
for sound policy
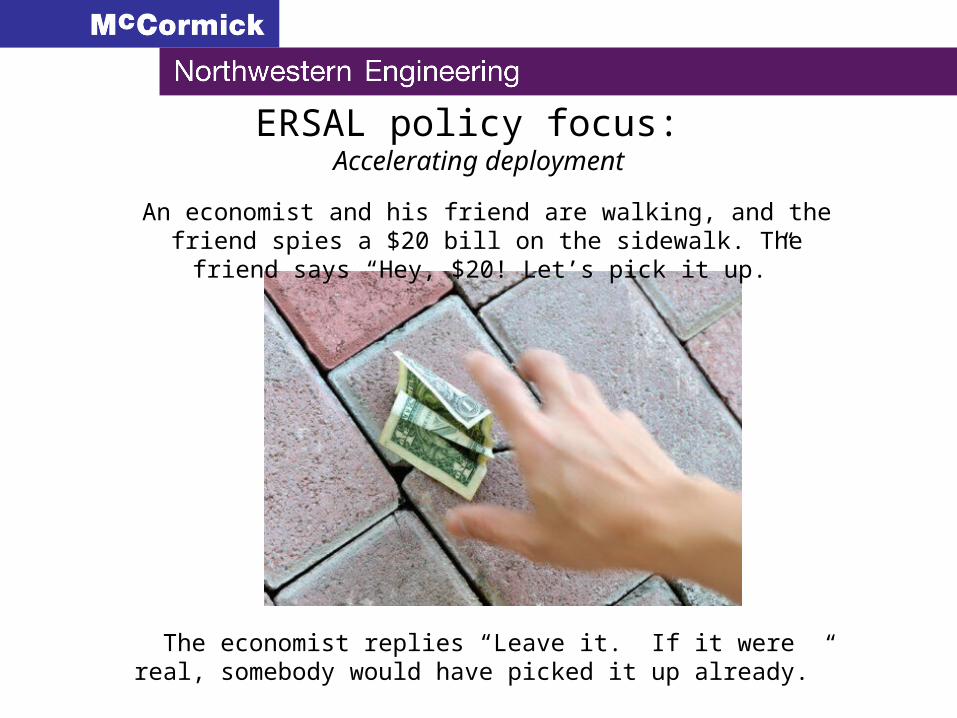
ERSAL policy focus: Accelerating deployment
An economist and his friend are walking, and the friend spies a $20 bill on the sidewalk. The friend says “Hey, $20! Let’s pick it up.”
The economist replies “Leave it. If it were real, somebody would have picked it up already.”
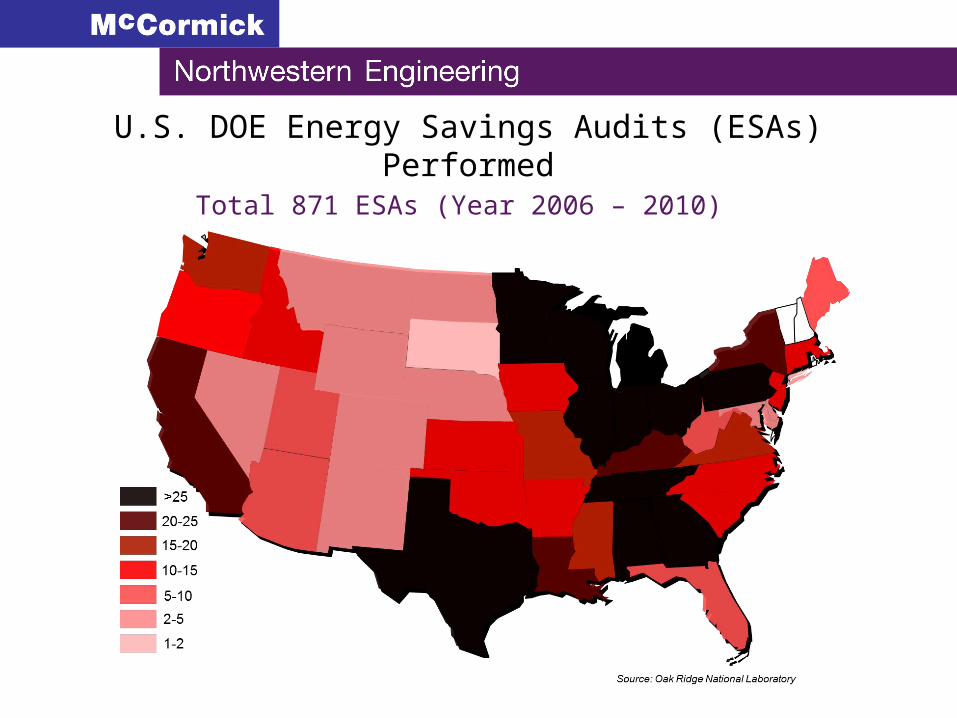
U.S. DOE Energy Savings Audits (ESAs) PerformedTotal 871 ESAs (Year 2006 – 2010)
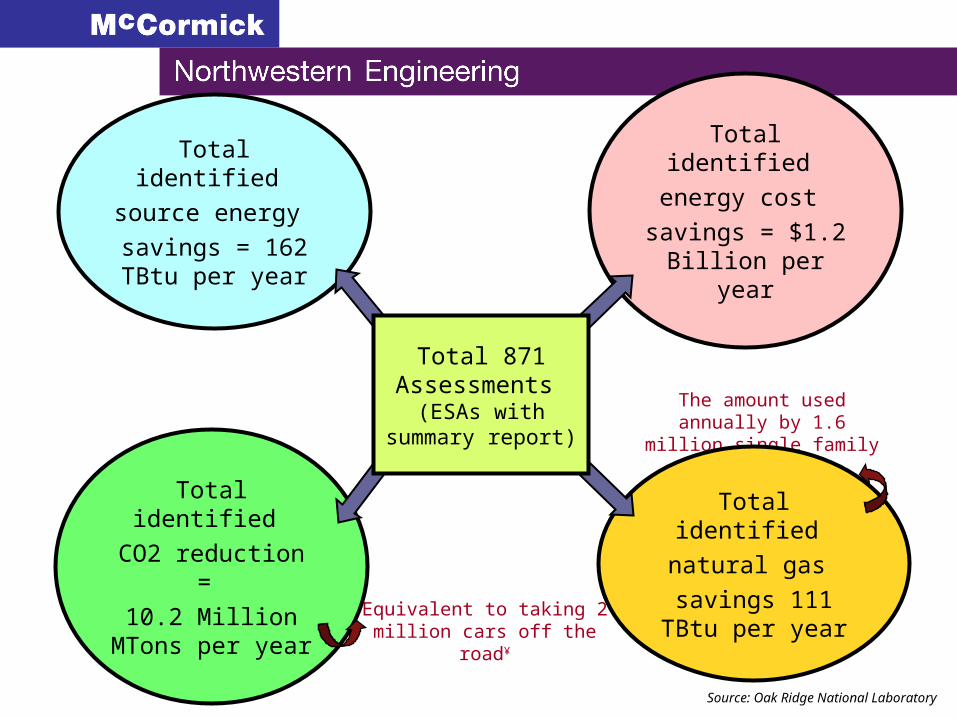
Equivalent to taking 2 million cars off the road¥
The amount used annually by 1.6 million single family homes*
Total identified
source energy
savings = 162 TBtu per year
Total identified
natural gas
savings 111 TBtu per year
Total identified
energy cost
savings = $1.2 Billion per year
Total identified
CO2 reduction =
10.2 Million MTons per year
Total 871 Assessments
(ESAs with summary report)
Source: Oak Ridge National Laboratory

Source energy:Implemented: 27.6 TBtu/year
In-Progress: 25.0 TBtu/year
In-Planning: 30.3 TBtu/year
Energy cost:Implemented: $163 Million/year
In-Progress: $173 Million/year
In-Planning: $252 Million/year
CO2 reduction:Implemented: 1.78 Million MTons/year
In-Progress: 1.52 Million MTons/year
In-Planning: 1.92 Million MTons/year
Total 624 Assessments
(ESAs with follow-up information) Based on different reporting
timeframes (6, 12 and 24 months follow-up calls)
Identified source energy savings for 624 ESAs is 114 TBtu/yr and cost savings are $858 million/yr.
Source: Oak Ridge National Laboratory
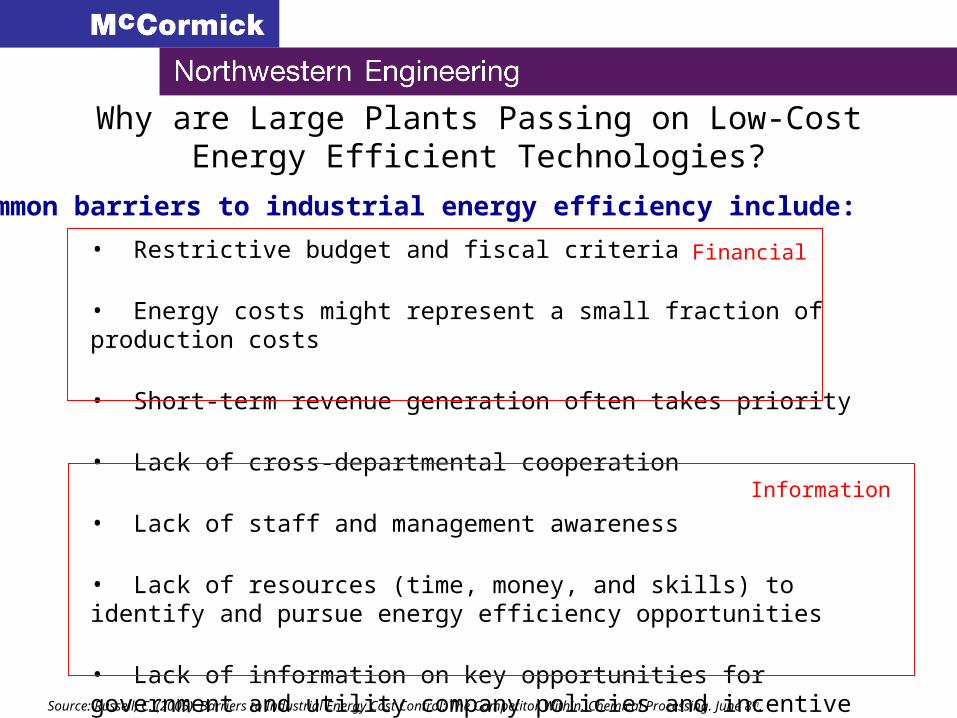
Why are Large Plants Passing on Low-Cost Energy Efficient Technologies?
• Restrictive budget and fiscal criteria
• Energy costs might represent a small fraction of production costs
• Short-term revenue generation often takes priority
• Lack of cross-departmental cooperation
• Lack of staff and management awareness
• Lack of resources (time, money, and skills) to identify and pursue energy efficiency opportunities
• Lack of information on key opportunities for government and utility company policies and incentive programs
Source: Russell, C. (2005). Barriers to Industrial Energy Cost Control: The Competitor Within. Chemical Processing. June 8th.
Common barriers to industrial energy efficiency include:
Financial
Information

OEM leverage
Source:
Economic Impact, Energy Use, and GHG Emissions Associated with the Manufacture of an Average Midsize U.S. Passenger Car
0%
10%
20%
30%
40%
50%
60%
70%
80%
90%
100%
Economic Impact (Total = $46,000)
Energy Use (Total = 121 GJ)
GHG emissions (Total = 10 mt CO2e)
Rel
ativ
e C
on
trib
uti
on
(%
)
Remaining supply chain
First tier suppliers
Auto manufacturing (336110)
Most reduction opportunities may be in the extended supply chain!
How can OEMs enable savings in complex and distant supply chains?
Source: Sathaye, J.A., Lecocq, F., Masanet, E., Najam, A., Schaeffer, R., Swart, R., and H. Winkler (2009). “Opportunities to Change Development Pathways Towards Lower Greenhouse Gas Emissions Through Energy Efficiency.” Journal of Energy Efficiency, Volume 2, Number 4.

• So we have a supply chain environmental footprint … now what? What and where are specific opportunities for reducing this footprint along the supply chain, and at what level of cost?
Research Question
We can do this: Supply chain initiatives require this:

Input-Output Life-Cycle Analysis
IO Sector-Level Environmental Coefficients
Annual GHG emissions (kg)Annual output X ($)
kg CO2e$

$0.00
$0.10
$0.20
$0.30
$0.40
$0.50
$0.60
$0.70
$0.80
$0.90
$1.00
0 100 200 300 400 500 600 700 800
Co
st o
f C
on
serv
ed E
ner
gy
(200
4 $/
Th
-sav
ed)
Cumulative Savings (MTh)
Industrial Natural Gas Maximum Achievable Potential -California Cumulative through 2012 (MTh)
Friedmann, R., F. Coito, E. Worrell, L. Price, E. Masanet, and M. Rufo (2005). “California Industrial Energy Efficiency Potential.” Proceedings of the 2005 ACEEE Summer Study on Energy Efficiency in Industry, West Point, New York, ACEEE.
Maintain boilers
Steam system controls
Process heater upgrade
Eff
icie
ncy
mea
su
re i
nve
stm
ent
co
st
= discrete efficiency technology/practice
Techno-Economic Potentials AnalysisIndustrial Natural Gas Efficiency Example

2002 U.S. IO Total Requirements Matrix (426)
IO Analysis
Output (purchase) from
IO sector i ($)
Input required from IO sector 1 ($)
Input required from IO sector n ($)
…
Environmental Coefficients for Supply Chain Sector n
Electricity (kWh/$)Natural gas (Th/$)Coal (Btu/$)CH4 (g/$)…and so on
X
Fuel Use and Emissions for Supply Chain Sector n
Electricity (kWh) Natural Gas (Th) Coal (Btu) And so on …
=
Producing SectorSupply Chain Sectors
Hybrid Modeling Schematic
Black = Input-output model

2002 U.S. IO Total Requirements Matrix (426)
IO Analysis
Output (purchase) from
IO sector i ($)
Input required from IO sector 1 ($)
Input required from IO sector n ($)
…
Environmental Coefficients for Supply Chain Sector n
Electricity (kWh/$)Natural gas (Th/$)Coal (Btu/$)CH4 (g/$)…and so on
X
Fuel Use and Emissions for Supply Chain Sector n
Electricity (kWh) Natural Gas (Th) Coal (Btu) And so on …
=
Fuel End Use Breakdown (from techno-economic energy models and data)
Lighting (kWh) HVAC (kWh) Pumping systems (kWh) Compressed air (KWh) And so on …
Energy-efficient measure 1 Energy-efficient measure n…
Fuel use and emissions reduction potentials
Producing SectorSupply Chain Sectors
Hybrid Modeling Schematic
Black = Input-output model Green = Techno-economic potentials models

Manufacturer Leverage Characterization
IO Sector Description
Total Electricity Use (kWh)
Motor SystemElectricity Use (kWh)
MotorSystem Efficiency Potential
PotentialElectricity Savings (kWh)
336110 Automobile and light truck manufacturing 727 313 15% 47
Auto manufacturer total 47
Selected major suppliers (direct and indirect)
336300 Motor vehicle parts manufacturing 1283 552 15% 83
331111 Iron and steel mills 681 341 12% 41
331312 Primary aluminum production 574 80 12% 10
331510 Ferrous metal foundries 215 71 12% 9
325180 Other basic inorganic chemical manufacturing 130 74 16% 12
32721A Glass and glass products, except containers 102 33 15% 5
325211 Plastics material and resin manufacturing 89 51 16% 8
334413 Semiconductors and related device manufacturing 86 28 23% 6
325190 Other basic organic chemical manufacturing 85 48 16% 8
326210 Tire manufacturing 65 34 15% 5
Total for selected suppliers 186
Fraction to plant’s pumps, fans, drives, etc.
Auto plant electricity use
Potential savings from efficiency upgrades
An auto manufacturer might increase savings by a factor of 4 by replicating motor system efficiency best practices across just 10 key suppliers
Case Study:If Carbon Labels Work, Which Products Should Be Labeled?

• Initiatives are emerging globally to estimate and report the carbon footprints associated with goods and services
• Carbon Trust (UK) Carbon Reduction Label and British Standards Institute PAS 2050
• Tesco (UK) and Wal-Mart (US) supply chain reporting initiatives• Industry-led initiatives (breweries, dairies, others)• California Assembly Bill 19• Waxman-Markey Bill
• Challenges• Cost, complexity, reliability• Data gaps and uncertainties• Singular focus on carbon• Market adoption
• Opportunities• Increased supply chain accountability• Improved energy and emissions management• Long-term corporate culture change toward continuous improvement
http://www.carbon-label.com/
Application to California Policy Analysis: Potential of Product Application to California Policy Analysis: Potential of Product Carbon Labels (for the California Air Resources Board)Carbon Labels (for the California Air Resources Board)
Research questions 1. By how much might GHG emissions be reduced across the life-cycle of a given product if carbon labels and/or standards are successful in driving the market to best practice for low carbon and energy efficient life cycles?
2. Of the estimated emissions reductions, how much is likely to occur within California?
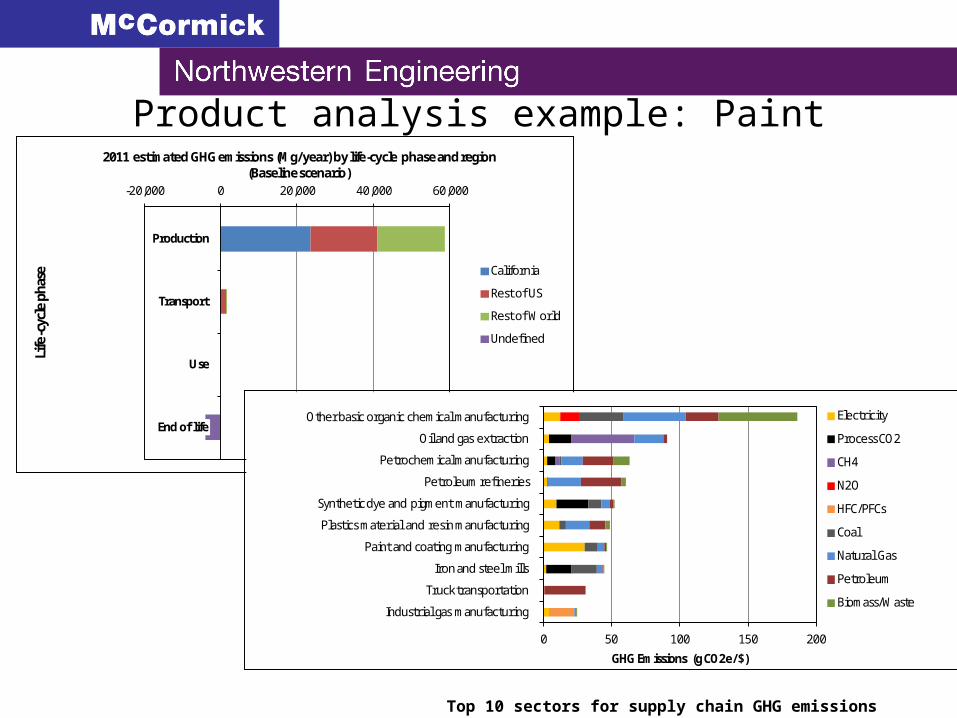
Product analysis example: Paint
-20,000 0 20,000 40,000 60,000
Production
Transport
Use
End of life
2011 estimated GHG emissions (Mg/year) by life-cycle phase and region(Baseline scenario)
Life
-cyc
le p
hase California
Rest of US
Rest of World
Undefined
0 50 100 150 200
Industrial gas manufacturing
Truck transportation
Iron and steel mills
Paint and coating manufacturing
Plastics material and resin manufacturing
Synthetic dye and pigment manufacturing
Petroleum refineries
Petrochemical manufacturing
Oil and gas extraction
Other basic organic chemical manufacturing
GHG Emissions (g CO2e/$)
Electricity
Process CO2
CH4
N2O
HFC/PFCs
Coal
Natural Gas
Petroleum
Biomass/Waste
Top 10 sectors for supply chain GHG emissions
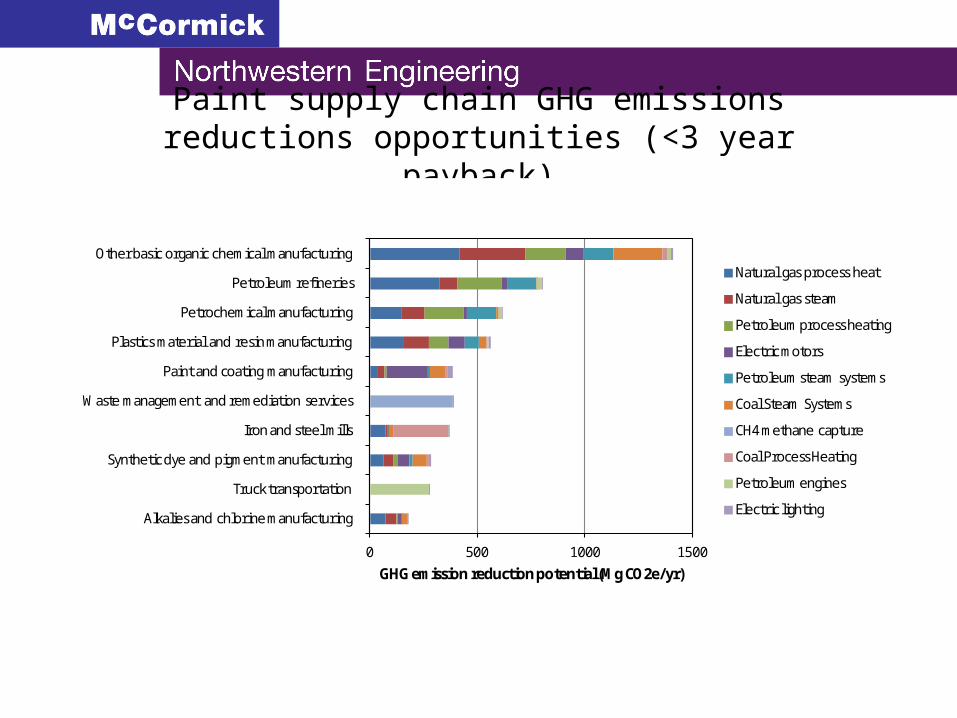
Paint supply chain GHG emissions reductions opportunities (<3 year payback)
0 500 1000 1500
Alkalies and chlorine manufacturing
Truck transportation
Synthetic dye and pigment manufacturing
Iron and steel mills
Waste management and remediation services
Paint and coating manufacturing
Plastics material and resin manufacturing
Petrochemical manufacturing
Petroleum refineries
Other basic organic chemical manufacturing
GHG emission reduction potential (Mg CO2e/yr)
Natural gas process heat
Natural gas steam
Petroleum process heating
Electric motors
Petroleum steam systems
Coal Steam Systems
CH4 methane capture
Coal Process Heating
Petroleum engines
Electric lighting
0
2,000,000
4,000,000
6,000,000
8,000,000
10,000,000
12,000,000
14,000,000
Ex
tern
al H
DD
Pa
int
Me
n's
dre
ss s
hir
t
Pa
pe
r to
we
ls
Ca
nn
ed
to
ma
toe
s
CF
L
Be
er
Bre
ad
So
ft d
rin
k
Wo
od
en
ca
bin
et
To
rtill
as
Ma
son
ry c
em
en
t
Win
e
Ch
ick
en
Ch
ee
se
Fla
t p
an
el
TV
De
skto
p P
C
Mil
k
Re
frig
era
tor
Be
ef
Wa
ter
he
ate
r
Re
sta
ura
nt
Esti
ma
ted
an
nu
al
GH
G e
mis
sio
ns
(Mg
CO
2e
/y
r)
Technical potential for emissions savings
Low-carbon technical potential scenario
-100,000
100,000
300,000
500,000
700,000
900,000
1,100,000
1,300,000
1,500,000
1,700,000
Ex
tern
al H
DD
Pa
int
Me
n's
dre
ss s
hir
t
Pa
pe
r to
we
ls
Ca
nn
ed
to
ma
toe
s
CF
L
Be
er
Bre
ad
So
ft d
rin
k
Wo
od
en
ca
bin
et
To
rtill
as
Ma
son
ry c
em
en
t
Win
e
Ch
ick
en
Ch
ee
se
Fla
t p
an
el
TV
De
skto
p P
C
Mil
k
Re
frig
era
tor
Be
ef
Wa
ter
he
ate
r
Re
sta
ura
nt
Esti
ma
ted
an
nu
al
GH
G e
mis
sio
ns
sav
ing
s (M
g C
O2
e/
yr)
Undefined
Rest of World
Rest of US
California
Technical potential for emissions savings by region
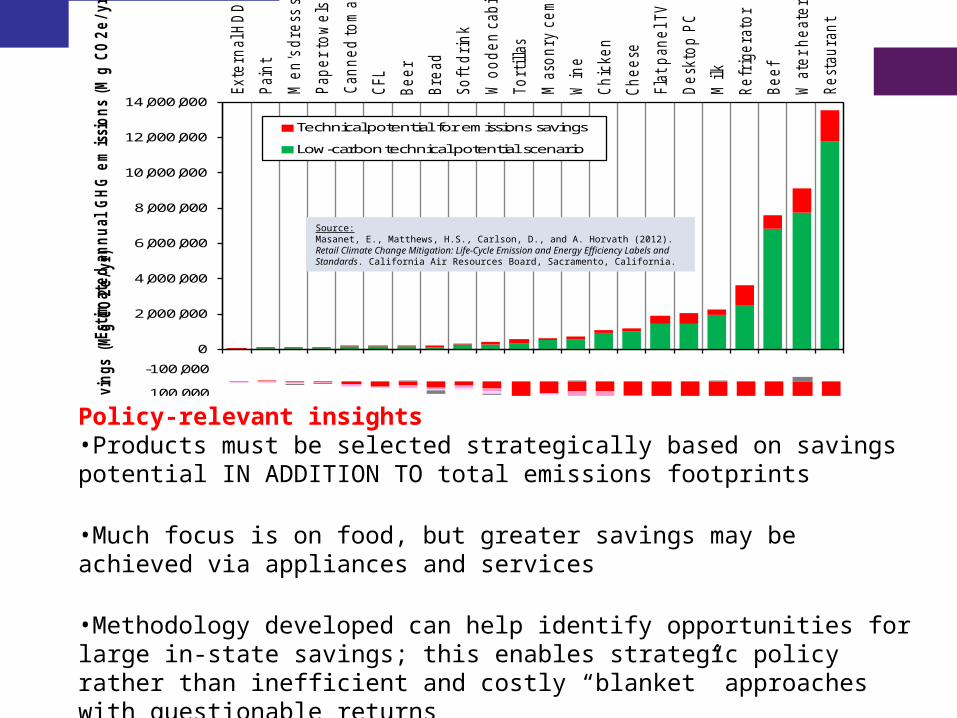
Source:Masanet, E., Matthews, H.S., Carlson, D., and A. Horvath (2012). Retail Climate Change Mitigation: Life-Cycle Emission and Energy Efficiency Labels and Standards. California Air Resources Board, Sacramento, California.
Policy-relevant insights•Products must be selected strategically based on savings potential IN ADDITION TO total emissions footprints
•Much focus is on food, but greater savings may be achieved via appliances and services
•Methodology developed can help identify opportunities for large in-state savings; this enables strategic policy rather than inefficient and costly “blanket” approaches with questionable returns

How Green is That Product? An Introduction to Life Cycle Assessment
• Nine-week MOOC (January – March, 2014)
• Goal: a basic quantitative introduction to LCA for scientists and engineers
• Topics:o Rationale for LCAo Quantitative basics (mass and
energy balancing, scaling, unit process modeling)
o Goal and scope definitiono LCI and LCIAo Interpretationo ISO 14040 standardso Course project

Some statistics
• Total student enrollments as of the course start date (Jan 25, 2014): around 17,000
• Students who watched all lecture videos: around 1,200• Students who watched at least one lecture video: around 8,200• Students who turned in one or more homework assignments:
around 2,300• Students who passed the course (final grade >=70%): around
700• Students who passed the course with distinction (final grade
>=90%): around 400• Total discussion forum views: around 42,000• Total discussion forum posts and comments: around 6,900
67

Advancing LCA pedagogyShifting needs of LCA students
Masanet, E., and Y. Chang. (2014) “Who Cares About LCA? A Survey of 900 Prospective LCA Practitioners.” Journal of Industrial Ecology. In press.

Advancing LCA pedagogyCore skills and training
Masanet, E., Chang, Y., Yao, Y., Briam, R., and R. Huang (2014). “Reflections on a Massive Open Online LCA Course.” International Journal of Life Cycle Assessment. In press.
AcknowledgementsUndergraduate students (20): Kristin Bernstein (2013), Cindy Chen (2014), Kedric Daly (2014), Sarah DeSoto (2013), Michael Goldberg (2013), Asher Goldman (2013), Abby Hawley (2013), Jan Jaro (2013), Jeremy Koszela (2012), Callie Larson (2013), Lauren Miller (2012), Eric Niemeyer (2013), Nirajan Rajkarnikar (2012), Arun Ramachandran (2012), Brooke Stanislawski (2013), Christopher Timpone (2012), Paige VonAchen (2012), Randall Waymire (2014), Sarah Wolff (2013), Lily Zhou (2014) M.S. students (16): Craig Arnold (M.S. 2012 – currently at Apple), Bisola Bruno (current), Xinyi Che (current), Nuoa Lei (current), Do Yong Lee (M.S. 2014), Gonzalo Lema (M.S. 2014 – currently at SUMAC), Jiaqi Liang (M.S. 2014 – currently at CLEAResult), Liying Li (current), Shiqi Louhong (M.S. 2014 – currently at General Motors), Zhen Lv (M.S. 2012), Sam Malin (M.S. 2012 – currently at Invenergy), Matthew Montalbano (M.S. 2014), Fred Thwaites (M.S. 2012 – currently at CLEAResult), Hui Yao (M.S. 2014 – currently at General Motors), Benjamin Walker (M.S. 2014 – currently at Hospital Energy), Yiqi Zhang (current). Ph.D. students (3): Remy Briam (current), Runze Huang (current), Yuan Yao (current) Postdoctoral Scholars (3): Yuan Chang (2012-2014 – currently Associate Professor at Central University of Finance and Economics, Beijing), Venkata Krishna Kumar Upadhyayula (2012-2013 – currently Life Cycle Analyst at SABIC), Michael Walker (2012-2014 – currently Instructor at University of Colorado, Boulder)

Thank you for your attention!
Questions?
Related Documents