Anal Bioanal Chem (2006) 384: 1331–1340 DOI 10.1007/s00216-005-0249-5 ORIGINAL PAPER J. Sanz-Landaluze . L. Bartolome . O. Zuloaga . L. González . C. Dietz . C. Cámara Accelerated extraction for determination of polycyclic aromatic hydrocarbons in marine biota Received: 19 September 2005 / Revised: 17 November 2005 / Accepted: 18 November 2005 / Published online: 25 February 2006 # Springer-Verlag 2006 Abstract A rapid and simple method is proposed for determination of polycyclic aromatic hydrocarbons (PAH) in complex matrices such as marine biota. The method uses sonication, by means of an ultrasonic probe, as a new tool for assisted extraction, coupled with reversed-phase liquid chromatography (RP-LC) with fluorescence detection (FL) for determination of 16 US EPA priority PAH. Separation and detection of the 16 PAH were complete in 45 min by RP- LC with a C 18 column and acetonitrile–water gradient elution. Multivariate optimisation of the variables affecting extraction (ultrasound radiation amplitude, sonication time, and temperature of the water-bath in which the extraction cell was placed) was conducted. The accuracy of the method was determined by analysis of a certified reference material and comparison of the results obtained with those from another method (microwave-assisted extraction and GC– MS). The new technique avoids the main problems encountered in the determination of PAH in complex matrices such as marine biota, and no clean-up step is necessary. The method was applied to determination of PAH in estuarine biota samples from the Urdaibai estuary (Biscay, Spain). Keywords PAH . Extraction . Ultrasonic probe . Biota samples Introduction Development of human activity has always been closely associated with different water resources but, unfortu- nately, anthropogenic activity has often resulted in chem- ical contamination of these resources. Lately mankind has become aware of the potential long-term adverse effects of these chemicals in general and their potential risks for aquatic and terrestrial ecosystems in particular. Several national and international organizations (ONU, WHO, EU, USEPA …) have classified some PAH as among the most hazardous and persistent organic pollutants originating from a wide variety of natural and anthropogenic sources. PAH are a class of hydrophobic organic contaminant comprising two or more fused benzene rings [1]. High molecular weight PAH (e.g. benzo(a)pyrene) are known to be carcinogenic and di and triaromatic compounds have been shown to be narcotic to marine organisms [2]. Quantification of these compounds enables better under- standing of their behavior and, for example, the level of contamination of a site and its remediation after an oil spill can be followed quantitatively [3]. Quantification of PAH in complex matrices, for example environmental samples and petroleum, can be difficult, because many compounds can interfere during the analysis. There is, therefore, a basic need for reliable analytical procedures for determination of these pollutants to correctly monitor their distribution in time and space. The best methods for analysis of PAH are high-performance liquid chromatog- raphy (HPLC) coupled with fluorescence (FL) or with UV absorbance detection or gas chromatography (GC) with mass spectrometric detection (MS). These two separation–detec- tion steps were chosen as US Environmental Protection Agency (EPA) methods 8310 and 8100, respectively [4]. To characterize PAH in solid matrices such as biota, an extraction step is required before the analysis; many well established extraction techniques are commonly used for isolation and analysis of PAH and similar organic com- pounds. Traditionally, Soxhlet extraction has been used for solid samples and liquid-liquid extraction for aqueous samples. These techniques have inherent disadvantages, J. Sanz-Landaluze . L. González . C. Dietz . C. Cámara (*) Department of Analytical Chemistry, Faculty of Chemistry, University Complutense de Madrid, Ciudad Universitaria, 28040 Madrid, Spain e-mail: [email protected] L. Bartolome . O. Zuloaga Department of Analytical Chemistry, Faculty of Technology, Euskal Herriko Unibertsitatea, 644 P.K., 48080 Bilbao, Spain

Welcome message from author
This document is posted to help you gain knowledge. Please leave a comment to let me know what you think about it! Share it to your friends and learn new things together.
Transcript
Anal Bioanal Chem (2006) 384: 1331–1340DOI 10.1007/s00216-005-0249-5
ORIGINAL PAPER
J. Sanz-Landaluze . L. Bartolome . O. Zuloaga .L. González . C. Dietz . C. Cámara
Accelerated extraction for determination of polycyclic aromatichydrocarbons in marine biota
Received: 19 September 2005 / Revised: 17 November 2005 / Accepted: 18 November 2005 / Published online: 25 February 2006# Springer-Verlag 2006
Abstract A rapid and simple method is proposed fordetermination of polycyclic aromatic hydrocarbons (PAH) incomplex matrices such as marine biota. The method usessonication, bymeans of an ultrasonic probe, as a new tool forassisted extraction, coupled with reversed-phase liquidchromatography (RP-LC) with fluorescence detection (FL)for determination of 16 US EPA priority PAH. Separationand detection of the 16 PAHwere complete in 45min by RP-LC with a C18 column and acetonitrile–water gradientelution. Multivariate optimisation of the variables affectingextraction (ultrasound radiation amplitude, sonication time,and temperature of the water-bath in which the extractioncell was placed) was conducted. The accuracy of the methodwas determined by analysis of a certified reference materialand comparison of the results obtained with those fromanother method (microwave-assisted extraction and GC–MS). The new technique avoids the main problemsencountered in the determination of PAH in complexmatrices such as marine biota, and no clean-up step isnecessary. The method was applied to determination of PAHin estuarine biota samples from the Urdaibai estuary (Biscay,Spain).
Keywords PAH . Extraction . Ultrasonic probe .Biota samples
Introduction
Development of human activity has always been closelyassociated with different water resources but, unfortu-nately, anthropogenic activity has often resulted in chem-ical contamination of these resources. Lately mankind hasbecome aware of the potential long-term adverse effects ofthese chemicals in general and their potential risks foraquatic and terrestrial ecosystems in particular. Severalnational and international organizations (ONU, WHO, EU,USEPA …) have classified some PAH as among the mosthazardous and persistent organic pollutants originatingfrom a wide variety of natural and anthropogenic sources.PAH are a class of hydrophobic organic contaminantcomprising two or more fused benzene rings [1]. Highmolecular weight PAH (e.g. benzo(a)pyrene) are known tobe carcinogenic and di and triaromatic compounds havebeen shown to be narcotic to marine organisms [2].Quantification of these compounds enables better under-standing of their behavior and, for example, the level ofcontamination of a site and its remediation after an oil spillcan be followed quantitatively [3]. Quantification of PAHin complex matrices, for example environmental samplesand petroleum, can be difficult, because many compoundscan interfere during the analysis.
There is, therefore, a basic need for reliable analyticalprocedures for determination of these pollutants to correctlymonitor their distribution in time and space. The best methodsfor analysis of PAH are high-performance liquid chromatog-raphy (HPLC) coupled with fluorescence (FL) or with UVabsorbance detection or gas chromatography (GC) with massspectrometric detection (MS). These two separation–detec-tion steps were chosen as US Environmental ProtectionAgency (EPA) methods 8310 and 8100, respectively [4].
To characterize PAH in solid matrices such as biota, anextraction step is required before the analysis; many wellestablished extraction techniques are commonly used forisolation and analysis of PAH and similar organic com-pounds. Traditionally, Soxhlet extraction has been used forsolid samples and liquid-liquid extraction for aqueoussamples. These techniques have inherent disadvantages,
J. Sanz-Landaluze . L. González . C. Dietz . C. Cámara (*)Department of Analytical Chemistry,Faculty of Chemistry, University Complutense de Madrid,Ciudad Universitaria,28040 Madrid, Spaine-mail: [email protected]
L. Bartolome . O. ZuloagaDepartment of Analytical Chemistry,Faculty of Technology,Euskal Herriko Unibertsitatea,644 P.K., 48080 Bilbao, Spain
however, for example the large volumes of organic solventsrequired; they are also time-consuming and involve multi-step processes that always risk loss of some analytes [5–7].Supercritical-fluid extraction (SFE) [8–10], pressurizedliquid extraction (PLE) [11, 12], microwave-assisted extrac-tion (MAE) [10, 13], ultrasonic assisted extraction [10, 14],and subcritical water extraction [10, 15] have been devel-oped as alternative techniques to replace classical extractionmethods. All these methods reduce time consumption andthe volumes of solvent required, but have the disadvantagesof high investment andmaintenance costs of the instruments,especially for SPE, ASE, and MAE. For evaluation of PAHin biota Soxhlet is, even nowadays, the principal extractiontechnique, especially for routine studies [16–18]. Very fewstudies have been performed using these new extractionprocedures [14, 19]. Several studies have compared theefficiency of extraction of PAH using these techniques [5,10, 11], but only for soil, sediment, and sewage samples. Allthese studies concluded that, once optimized, these extrac-tion techniques are comparably efficient, with similarstandard deviations.
Ultrasonic probe-assisted extraction is a relatively newtechnique being used with success for analysis of a variety ofcompounds [20–23] including PAH in soil [24]. In thistechnique solid–liquid extraction occurs as a consequence ofcavitation phenomena—implosion of cavitational bubblesleading to extreme temperatures and pressures. Furthermore,when a cavitating bubble collapses near the surface of a solidsample particle, micro-jets of solvent propagate toward thesurface at great velocity, causing pitting and mechanicalerosion of the solid surface, and leading to particle rupture.This is the main characteristic of focussed ultrasound, and itmakes this extractionmethod unique, because the smaller theparticle size, the higher the total area exposed to the solvent[24].
For complete development of an analytical method,optimization of all the variables involved in the analysis isfundamental [25, 26]. Most optimisation procedures,however, are conducted one-factor-at-a-time. Generallyspeaking, optimisation procedures that alter all variables atthe same time are more advantageous, because interactionsamong them are considered. Use of an experimental design(e.g. full factorial, fractional factorial, Plackett and Burmandesigns, central composite, face-centred cube, routablecentral composite, Doehlert, etc.) combined with analysisof variance (ANOVA) is much more reliable, and avoidsthe limitations mentioned above, but, surprisingly, is stillnot extensively applied in analytical applications. Multi-variate methods involve simultaneous combination ofseveral conditions enabling evaluation of the interdepen-dence of variables and their effect on the response, andoptimization of these influential factors.
The method proposed here is based on use of staticultrasound-assisted extraction for leaching of PAH fromnatural contaminated estuarine biota before separation anddetermination by HPLC–FL. This analytical procedure wasthen applied to a reference material, a mussel tissue (NIST-
2977), to validate the procedure. The sample-preparationprocedure developed was then used to assess the extent ofcontamination of oysters and mussels collected along theUrdaibai estuary (Biscay, Spain). Urdaibai is a protectedestuary, situated in a rural area, which in 1984 was declaredReserve of the Biosphere by the United Nations for theEducation, Science, and Culture Organization (UNESCO).
Experimental
Cleaning procedures
All laboratory ware and other equipment that comes intocontact with samples must be rigorously cleaned to avoidcontamination. All glass and plastic ware was washed with acommon detergent, thoroughly rinsed with MilliRo qualitywater (Milli-Q Model 185, Millipore; Bedford, MA, USA),and soaked in clean dilute (15%) HNO3 for 24 h. Theequipment was then rinsed with Milli-Q (Millipore) qualitywater and then soaked for another 24 h in acetone (HPLCgrade, Scharlau; Barcelona, Spain). Finally, glassware wasplaced overnight in an oven at 150°C and plastic in an ovenat 90°C.
Reagents
Working standard PAHmixtures were prepared by suitabledilution of stock standard solutions (Supelco; Barcelona,Spain) with acetonitrile. HPLC-grade n-hexane (Scharlau;Barcelona, Spain) was used. Other chemical reagents, forexample methanol and acetonitrile (Carlo Erba; Milan,Italy) were also of HPLC purity. Commercial acetone waspurchased from Dismadel (Madrid,Spain). Water waspurified with a Milli-Q system (Millipore).
Stock solutions and certified reference materials
Stock solutions, Dr Ehrenstorfer PAH mix 64 (17 PAHeach at 2,000 μg mL−1), were purchased from Supelco(Walton-on-Thames, UK), in a 1:1 mixture of HPLC gradedichloromethane and benzene. The stock solutions werestored under refrigeration and protected against light.Intermediate dilution of this stock solution was performedfor calibration. More dilute solutions (∼1,000 ng mL−1)were prepared weekly by appropriate dilution of the stocksolution with acetonitrile. These solutions were used toproduce calibration solutions, following the standardaddition method.
A certified reference material was used to check theaccuracy of the proposed method and for validation. NIST-2977 mussel tissue was provided by the National Institute ofStandards and Technology (Gaithersburg, MD, USA). Themussels (Perna perna, edible brown mussel) used for thepreparation of NIST 2977 were collected in Guanabara Bay,
1332
Brazil. Certified values are given for 10 of the 16 EPA-PAHsand indicative concentrations for another 16 PAH.
Instrumentation
A Cryodos-50 laboratory freeze dryer from TelstarInstrumat (Sant Cugat del Valles, Catalonia, Spain) and aPulverisette-6 agate mortar (Fritsh, Idar-Oberstein, Ger-many), respectively, were used to lyophilise and grind thesamples. For PAH extraction, a Bandelin sonifier ultrasoniccell disruptor/homogeniser (20 kHz, Bandelin Electronic,Berlin) equipped with a 3 mm titanium microtip was used.The energy of ultrasonic irradiation was fixed at the desiredlevel by using power settings up to 40%.
PAH analysis was performed with a Spectra System P4000 (Thermo Electron Corporation, San Jose, USA)HPLC chromatograph equipped with an FL 3000 pro-grammable fluorescence detector (Thermo Electron Cor-poration). The 16 PAH to be quantified were separated on aHypersil Green PAH (200 mm×4.6 mm; particle size,5 μm) column by gradient elution. Acetonitrile–watermixtures were used as mobile phase at a flow-rate of1.2 mL min−1. The composition of the gradient started with40% water and 60% acetonitrile; the acetonitrile contentwas then increased to 65% (0–10 min) and later to 100%(10–40 min). This level was held constant for 4 min andfinally reduced to 40% at the end of the analysis. Analysiswas performed at room temperature and excitation andemission wavelength pairs were programmed to changeduring the analytical run to optimise the detection of eachcomponent. Data collection and integration were con-ducted using HPLC ChromQuest software version 4.1-Surveyor LC systems (Thermo Electron Corporation).
The area studied
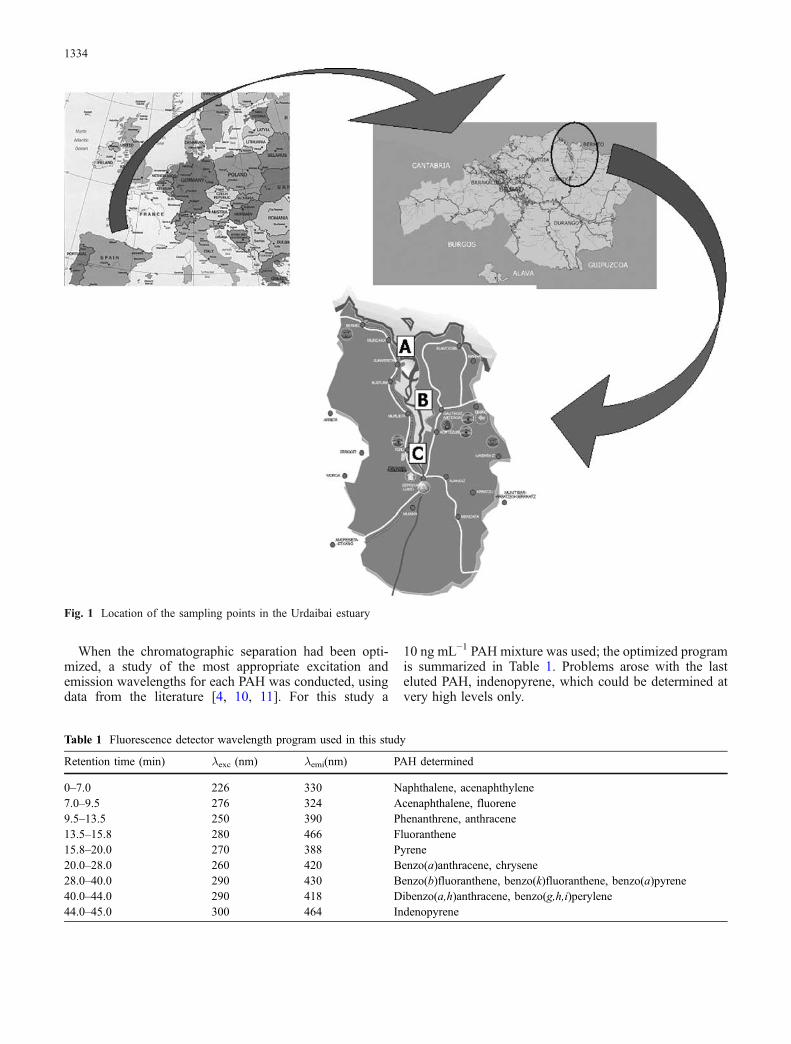
The Urdaibai estuary is in the centre of the Reserve and isformed by waters mainly from the hydrographic basin ofthe Oka river, but also from the mouths of the riversGolako, Mape, Artike and Laga. The estuary is 13 km long,has an average width of 500 m, and approximately 80% ofthe surface belongs to the inter-tidal zone. A variety ofindustrial activity can be found (metallurgic, shipyards,treatment of surfaces, dies, manufacture of cutlery), mainlyin the surroundings of the town of Gernika. Twomonitoring programmes (spring 2003 and spring 2004)were conducted at three sampling points (A≡Kanala,B≡Murueta, C≡Gernika) in the Urdaibai estuary (Fig. 1).These programmes were designed to evaluate the impact ofthe breaking up, in heavy seas off Galicia on the Northwestcoast of Spain, of the large oil tanker Prestige, in November2002, spilling more than 77,000 tons of crude oil. Itscomposition, according to analysis by the Superior Centreof Scientific Research of Spain (CSIC), was 50% aromatichydrocarbons including PAH, 20% saturated hydrocar-bons, and 35% resins and asphaltene [27].
Sample collection, storage, and preservation
Oyster samples were collected manually at the coast, storedin sealed plastic bags, transported to the laboratory in coldboxes and frozen until lyophilisation. Lyophilisation of theoysters was performed at −45°C and 0.05 mbar for 24 h.The lyophilised samples were ground and sieved through a63-μm metal sieve and stored in hermetically closed Pyrexvials at 4°C until analysis.
Analytical procedures
Extraction
For ultrasound-assisted extraction, 0.1 g lyophilised oystertissue was weighed and placed in a 10-mL vial with 5 mLn-hexane. The vial was immersed in an ice–water bath(0°C) and the sample was exposed to ultrasonic irradiationfor 2 min, with the titanium tip of the probe 1 cm from theupper surface in the slurry (output amplitude ∼15% of thenominal amplitude of the converter, applied power 200W).Extracts were filtered through 0.22 μm Millipore Millex-HV filters (Scharlab) into amber flasks, the solvent wasevaporated with a stream of argon, and the residues werereconstituted in 0.5 mL acetonitrile.
HPLC analysis
Approximately 20 μL of the reconstituted samples wereinjected into the high-performance liquid chromatograph.As already mentioned, acetonitrile–water mixtures wereused as mobile phase at a flow-rate of 1.2 mL min−1. Thecolumn was maintained at room temperature. The fluores-cence excitation and emission wavelengths were changedduring chromatographic separation, a powerful techniquefor enhancing sensitivity and selectivity (Table 1).
Results and discussion
Chromatographic separation
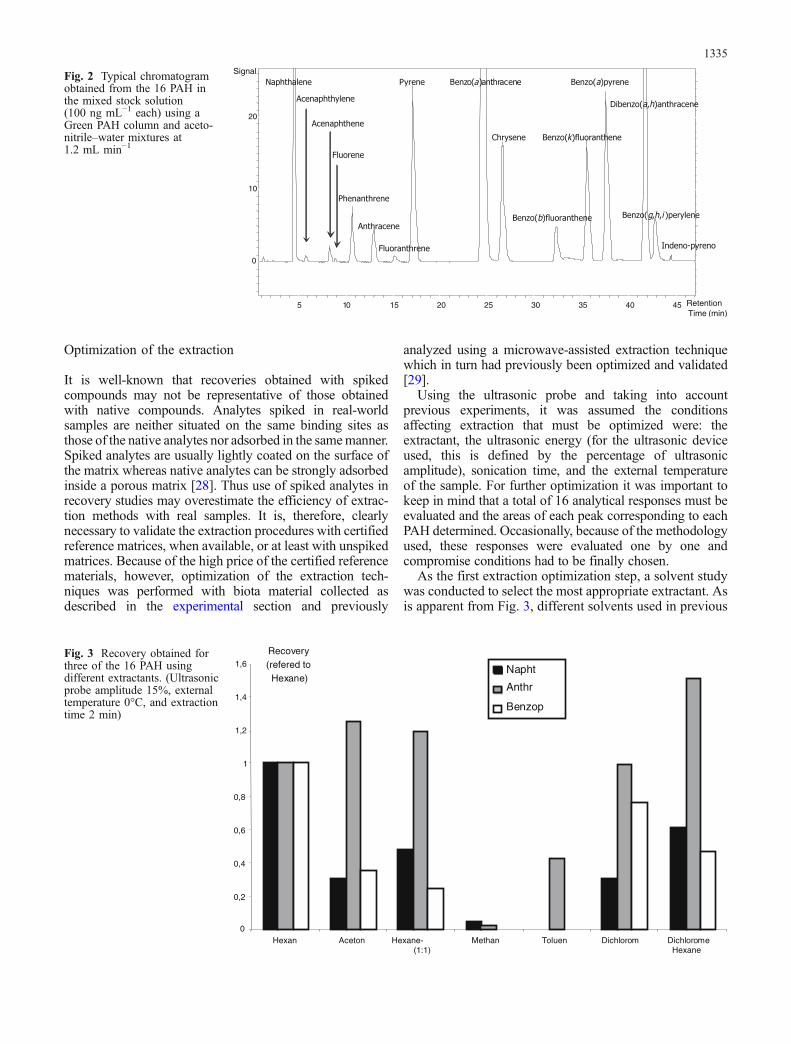
A Spherisorb ODS-2 column from Waters and a GreenPAH column from Hypersil were evaluated for separationof the 16 PAH under different gradient elution conditionswith acetonitrile–water mixtures. This study was con-ducted using a high-concentration PAH standard solution(1 μg mL−1) and with a fluorescence program using non-specific excitation and emission wavelengths (λexc=280and λem=390) [4]. Only the second column (Green PAHfrom Hypersil) enabled complete separation of all 16 PAHat room temperature, as shown by the chromatogram inFig. 2. The chromatographic cycle for the completeseparation of the 16 PAH was 45 min, including 5 minfor the equilibration of the column. This time is suitable foreconomic and routine analysis of the 16 PAH.
1333
When the chromatographic separation had been opti-mized, a study of the most appropriate excitation andemission wavelengths for each PAH was conducted, usingdata from the literature [4, 10, 11]. For this study a
10 ng mL−1 PAH mixture was used; the optimized programis summarized in Table 1. Problems arose with the lasteluted PAH, indenopyrene, which could be determined atvery high levels only.
Fig. 1 Location of the sampling points in the Urdaibai estuary
Table 1 Fluorescence detector wavelength program used in this study
Retention time (min) λexc (nm) λemi(nm) PAH determined
0–7.0 226 330 Naphthalene, acenaphthylene7.0–9.5 276 324 Acenaphthalene, fluorene9.5–13.5 250 390 Phenanthrene, anthracene13.5–15.8 280 466 Fluoranthene15.8–20.0 270 388 Pyrene20.0–28.0 260 420 Benzo(a)anthracene, chrysene28.0–40.0 290 430 Benzo(b)fluoranthene, benzo(k)fluoranthene, benzo(a)pyrene40.0–44.0 290 418 Dibenzo(a,h)anthracene, benzo(g,h,i)perylene44.0–45.0 300 464 Indenopyrene
1334
Optimization of the extraction
It is well-known that recoveries obtained with spikedcompounds may not be representative of those obtainedwith native compounds. Analytes spiked in real-worldsamples are neither situated on the same binding sites asthose of the native analytes nor adsorbed in the samemanner.Spiked analytes are usually lightly coated on the surface ofthe matrix whereas native analytes can be strongly adsorbedinside a porous matrix [28]. Thus use of spiked analytes inrecovery studies may overestimate the efficiency of extrac-tion methods with real samples. It is, therefore, clearlynecessary to validate the extraction procedures with certifiedreference matrices, when available, or at least with unspikedmatrices. Because of the high price of the certified referencematerials, however, optimization of the extraction tech-niques was performed with biota material collected asdescribed in the experimental section and previously
analyzed using a microwave-assisted extraction techniquewhich in turn had previously been optimized and validated[29].
Using the ultrasonic probe and taking into accountprevious experiments, it was assumed the conditionsaffecting extraction that must be optimized were: theextractant, the ultrasonic energy (for the ultrasonic deviceused, this is defined by the percentage of ultrasonicamplitude), sonication time, and the external temperatureof the sample. For further optimization it was important tokeep in mind that a total of 16 analytical responses must beevaluated and the areas of each peak corresponding to eachPAH determined. Occasionally, because of the methodologyused, these responses were evaluated one by one andcompromise conditions had to be finally chosen.
As the first extraction optimization step, a solvent studywas conducted to select the most appropriate extractant. Asis apparent from Fig. 3, different solvents used in previous
Fig. 2 Typical chromatogramobtained from the 16 PAH inthe mixed stock solution(100 ng mL−1 each) using aGreen PAH column and aceto-nitrile–water mixtures at1.2 mL min−1
0
0,2
0,4
0,6
0,8
1
1,2
1,4
1,6
Hexan Aceton Hexane-(1:1)
Methan Toluen Dichlorom DichloromeHexane
Recovery (refered to
Hexane)Napht
Anthr
Benzop
Fig. 3 Recovery obtained forthree of the 16 PAH usingdifferent extractants. (Ultrasonicprobe amplitude 15%, externaltemperature 0°C, and extractiontime 2 min)
1335
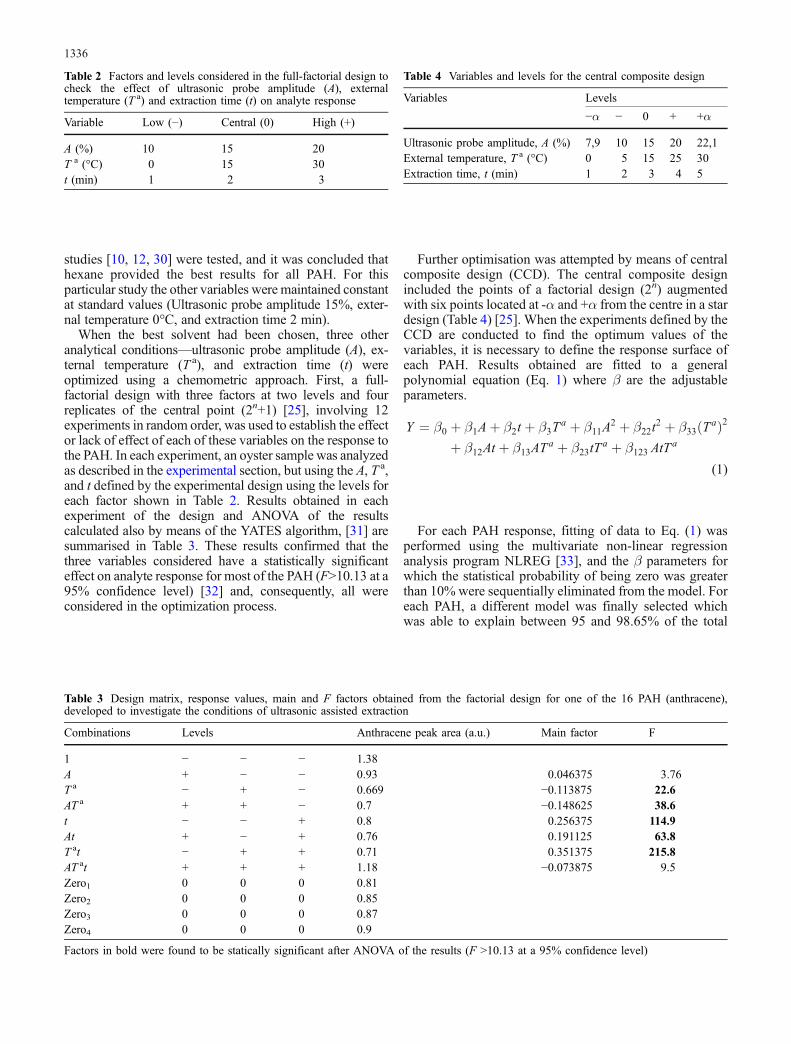
studies [10, 12, 30] were tested, and it was concluded thathexane provided the best results for all PAH. For thisparticular study the other variables were maintained constantat standard values (Ultrasonic probe amplitude 15%, exter-nal temperature 0°C, and extraction time 2 min).
When the best solvent had been chosen, three otheranalytical conditions—ultrasonic probe amplitude (A), ex-ternal temperature (T a), and extraction time (t) wereoptimized using a chemometric approach. First, a full-factorial design with three factors at two levels and fourreplicates of the central point (2n+1) [25], involving 12experiments in random order, was used to establish the effector lack of effect of each of these variables on the response tothe PAH. In each experiment, an oyster sample was analyzedas described in the experimental section, but using the A, T a,and t defined by the experimental design using the levels foreach factor shown in Table 2. Results obtained in eachexperiment of the design and ANOVA of the resultscalculated also by means of the YATES algorithm, [31] aresummarised in Table 3. These results confirmed that thethree variables considered have a statistically significanteffect on analyte response for most of the PAH (F>10.13 at a95% confidence level) [32] and, consequently, all wereconsidered in the optimization process.
Further optimisation was attempted by means of centralcomposite design (CCD). The central composite designincluded the points of a factorial design (2n) augmentedwith six points located at -α and +α from the centre in a stardesign (Table 4) [25]. When the experiments defined by theCCD are conducted to find the optimum values of thevariables, it is necessary to define the response surface ofeach PAH. Results obtained are fitted to a generalpolynomial equation (Eq. 1) where β are the adjustableparameters.
Y ¼ β0 þ β1Aþ β2t þ β3Ta þ β11A
2 þ β22t2 þ β33ðTaÞ2
þ β12At þ β13ATa þ β23tT
a þ β123 AtTa
(1)
For each PAH response, fitting of data to Eq. (1) wasperformed using the multivariate non-linear regressionanalysis program NLREG [33], and the β parameters forwhich the statistical probability of being zero was greaterthan 10% were sequentially eliminated from the model. Foreach PAH, a different model was finally selected whichwas able to explain between 95 and 98.65% of the total
Table 2 Factors and levels considered in the full-factorial design tocheck the effect of ultrasonic probe amplitude (A), externaltemperature (T a) and extraction time (t) on analyte response
Variable Low (−) Central (0) High (+)
A (%) 10 15 20T a (°C) 0 15 30t (min) 1 2 3
Table 3 Design matrix, response values, main and F factors obtained from the factorial design for one of the 16 PAH (anthracene),developed to investigate the conditions of ultrasonic assisted extraction
Combinations Levels Anthracene peak area (a.u.) Main factor F
1 − − − 1.38A + − − 0.93 0.046375 3.76T a − + − 0.669 −0.113875 22.6AT a + + − 0.7 −0.148625 38.6t − − + 0.8 0.256375 114.9At + − + 0.76 0.191125 63.8T at − + + 0.71 0.351375 215.8AT at + + + 1.18 −0.073875 9.5Zero1 0 0 0 0.81Zero2 0 0 0 0.85Zero3 0 0 0 0.87Zero4 0 0 0 0.9
Factors in bold were found to be statically significant after ANOVA of the results (F >10.13 at a 95% confidence level)
Table 4 Variables and levels for the central composite design
Variables Levels
−α − 0 + +α
Ultrasonic probe amplitude, A (%) 7,9 10 15 20 22,1External temperature, T a (°C) 0 5 15 25 30Extraction time, t (min) 1 2 3 4 5
1336
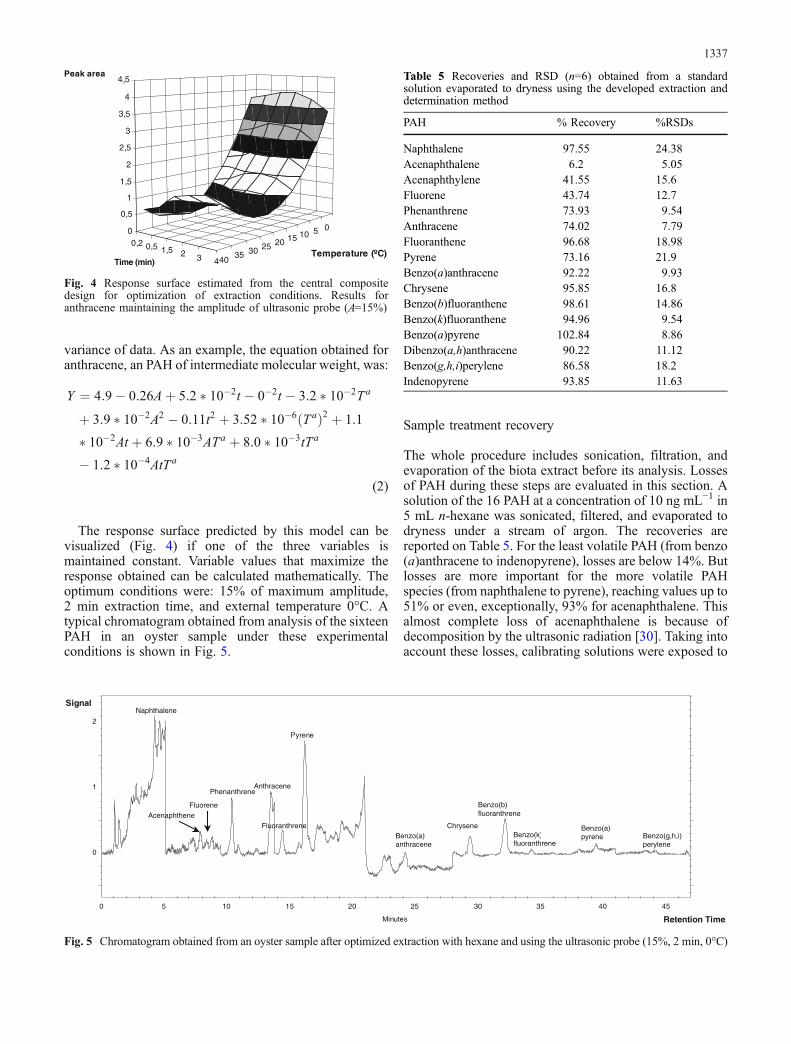
variance of data. As an example, the equation obtained foranthracene, an PAH of intermediate molecular weight, was:
Y ¼ 4:9� 0:26Aþ 5:2 � 10�2t � 0�2t � 3:2 � 10�2Ta
þ 3:9 � 10�2A2 � 0:11t2 þ 3:52 � 10�6 Tað Þ2 þ 1:1
� 10�2At þ 6:9 � 10�3ATa þ 8:0 � 10�3tTa
� 1:2 � 10�4AtTa
(2)
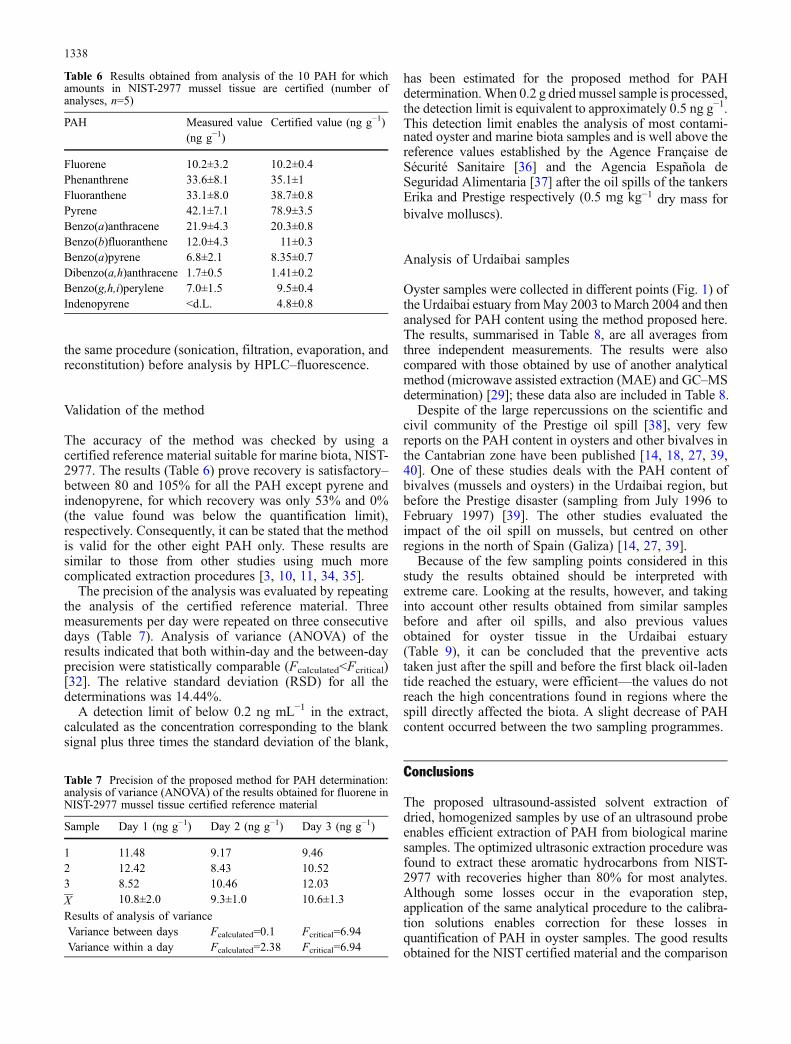
The response surface predicted by this model can bevisualized (Fig. 4) if one of the three variables ismaintained constant. Variable values that maximize theresponse obtained can be calculated mathematically. Theoptimum conditions were: 15% of maximum amplitude,2 min extraction time, and external temperature 0°C. Atypical chromatogram obtained from analysis of the sixteenPAH in an oyster sample under these experimentalconditions is shown in Fig. 5.
Sample treatment recovery
The whole procedure includes sonication, filtration, andevaporation of the biota extract before its analysis. Lossesof PAH during these steps are evaluated in this section. Asolution of the 16 PAH at a concentration of 10 ng mL−1 in5 mL n-hexane was sonicated, filtered, and evaporated todryness under a stream of argon. The recoveries arereported on Table 5. For the least volatile PAH (from benzo(a)anthracene to indenopyrene), losses are below 14%. Butlosses are more important for the more volatile PAHspecies (from naphthalene to pyrene), reaching values up to51% or even, exceptionally, 93% for acenaphthalene. Thisalmost complete loss of acenaphthalene is because ofdecomposition by the ultrasonic radiation [30]. Taking intoaccount these losses, calibrating solutions were exposed to
Fig. 5 Chromatogram obtained from an oyster sample after optimized extraction with hexane and using the ultrasonic probe (15%, 2 min, 0°C)
Table 5 Recoveries and RSD (n=6) obtained from a standardsolution evaporated to dryness using the developed extraction anddetermination method
PAH % Recovery %RSDs
Naphthalene 97.55 24.38Acenaphthalene 6.2 5.05Acenaphthylene 41.55 15.6Fluorene 43.74 12.7Phenanthrene 73.93 9.54Anthracene 74.02 7.79Fluoranthene 96.68 18.98Pyrene 73.16 21.9Benzo(a)anthracene 92.22 9.93Chrysene 95.85 16.8Benzo(b)fluoranthene 98.61 14.86Benzo(k)fluoranthene 94.96 9.54Benzo(a)pyrene 102.84 8.86Dibenzo(a,h)anthracene 90.22 11.12Benzo(g,h,i)perylene 86.58 18.2Indenopyrene 93.85 11.63
0510152025303540
0,2 0,5 1,5 2 3 4
0
0,5
1
1,5
2
2,5
3
3,5
4
4,5Peak area
Temperature (ºC)Time (min)
Fig. 4 Response surface estimated from the central compositedesign for optimization of extraction conditions. Results foranthracene maintaining the amplitude of ultrasonic probe (A=15%)
1337
the same procedure (sonication, filtration, evaporation, andreconstitution) before analysis by HPLC–fluorescence.
Validation of the method
The accuracy of the method was checked by using acertified reference material suitable for marine biota, NIST-2977. The results (Table 6) prove recovery is satisfactory–between 80 and 105% for all the PAH except pyrene andindenopyrene, for which recovery was only 53% and 0%(the value found was below the quantification limit),respectively. Consequently, it can be stated that the methodis valid for the other eight PAH only. These results aresimilar to those from other studies using much morecomplicated extraction procedures [3, 10, 11, 34, 35].
The precision of the analysis was evaluated by repeatingthe analysis of the certified reference material. Threemeasurements per day were repeated on three consecutivedays (Table 7). Analysis of variance (ANOVA) of theresults indicated that both within-day and the between-dayprecision were statistically comparable (Fcalculated<Fcritical)[32]. The relative standard deviation (RSD) for all thedeterminations was 14.44%.
A detection limit of below 0.2 ng mL−1 in the extract,calculated as the concentration corresponding to the blanksignal plus three times the standard deviation of the blank,
has been estimated for the proposed method for PAHdetermination.When 0.2 g driedmussel sample is processed,the detection limit is equivalent to approximately 0.5 ng g−1.This detection limit enables the analysis of most contami-nated oyster and marine biota samples and is well above thereference values established by the Agence Française deSécurité Sanitaire [36] and the Agencia Española deSeguridad Alimentaria [37] after the oil spills of the tankersErika and Prestige respectively (0.5 mg kg−1 dry mass forbivalve molluscs).
Analysis of Urdaibai samples
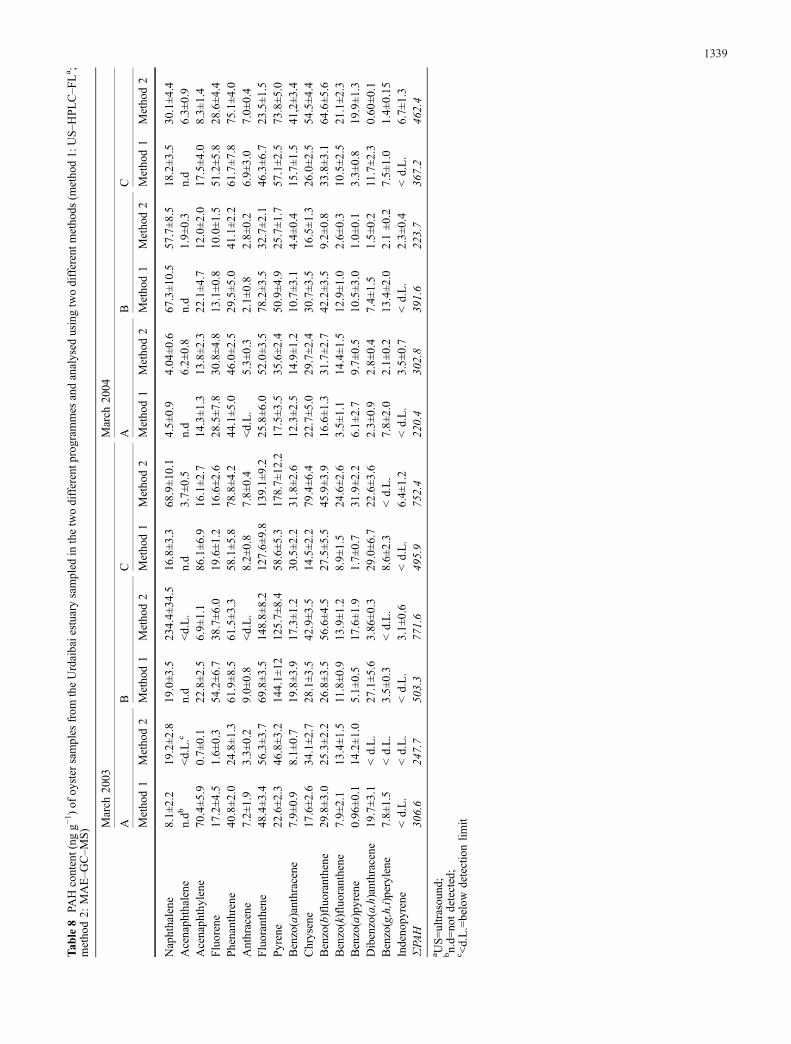
Oyster samples were collected in different points (Fig. 1) ofthe Urdaibai estuary fromMay 2003 toMarch 2004 and thenanalysed for PAH content using the method proposed here.The results, summarised in Table 8, are all averages fromthree independent measurements. The results were alsocompared with those obtained by use of another analyticalmethod (microwave assisted extraction (MAE) and GC–MSdetermination) [29]; these data also are included in Table 8.
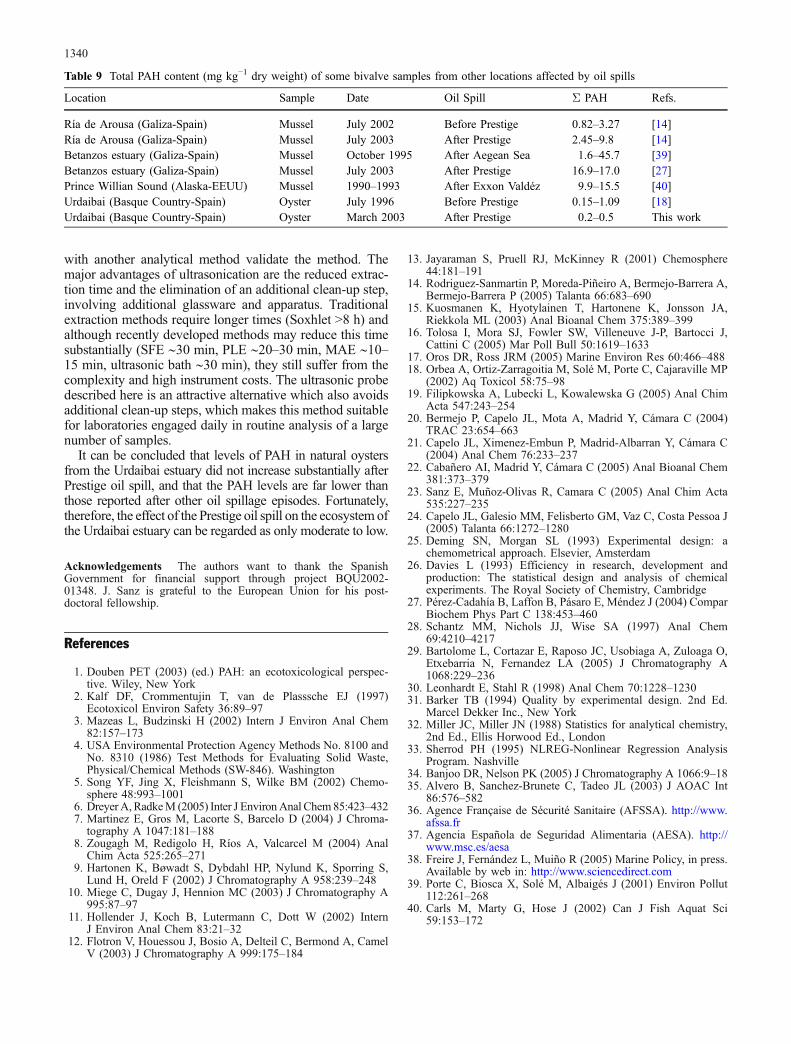
Despite of the large repercussions on the scientific andcivil community of the Prestige oil spill [38], very fewreports on the PAH content in oysters and other bivalves inthe Cantabrian zone have been published [14, 18, 27, 39,40]. One of these studies deals with the PAH content ofbivalves (mussels and oysters) in the Urdaibai region, butbefore the Prestige disaster (sampling from July 1996 toFebruary 1997) [39]. The other studies evaluated theimpact of the oil spill on mussels, but centred on otherregions in the north of Spain (Galiza) [14, 27, 39].
Because of the few sampling points considered in thisstudy the results obtained should be interpreted withextreme care. Looking at the results, however, and takinginto account other results obtained from similar samplesbefore and after oil spills, and also previous valuesobtained for oyster tissue in the Urdaibai estuary(Table 9), it can be concluded that the preventive actstaken just after the spill and before the first black oil-ladentide reached the estuary, were efficient—the values do notreach the high concentrations found in regions where thespill directly affected the biota. A slight decrease of PAHcontent occurred between the two sampling programmes.
Conclusions
The proposed ultrasound-assisted solvent extraction ofdried, homogenized samples by use of an ultrasound probeenables efficient extraction of PAH from biological marinesamples. The optimized ultrasonic extraction procedure wasfound to extract these aromatic hydrocarbons from NIST-2977 with recoveries higher than 80% for most analytes.Although some losses occur in the evaporation step,application of the same analytical procedure to the calibra-tion solutions enables correction for these losses inquantification of PAH in oyster samples. The good resultsobtained for the NIST certified material and the comparison
Table 7 Precision of the proposed method for PAH determination:analysis of variance (ANOVA) of the results obtained for fluorene inNIST-2977 mussel tissue certified reference material
Sample Day 1 (ng g−1) Day 2 (ng g−1) Day 3 (ng g−1)
1 11.48 9.17 9.462 12.42 8.43 10.523 8.52 10.46 12.03
X 10.8±2.0 9.3±1.0 10.6±1.3
Results of analysis of varianceVariance between days Fcalculated=0.1 Fcritical=6.94Variance within a day Fcalculated=2.38 Fcritical=6.94
Table 6 Results obtained from analysis of the 10 PAH for whichamounts in NIST-2977 mussel tissue are certified (number ofanalyses, n=5)
PAH Measured value(ng g−1)
Certified value (ng g−1)
Fluorene 10.2±3.2 10.2±0.4Phenanthrene 33.6±8.1 35.1±1Fluoranthene 33.1±8.0 38.7±0.8Pyrene 42.1±7.1 78.9±3.5Benzo(a)anthracene 21.9±4.3 20.3±0.8Benzo(b)fluoranthene 12.0±4.3 11±0.3Benzo(a)pyrene 6.8±2.1 8.35±0.7Dibenzo(a,h)anthracene 1.7±0.5 1.41±0.2Benzo(g,h,i)perylene 7.0±1.5 9.5±0.4Indenopyrene <d.L. 4.8±0.8
1338
Tab
le8
PAHcontent(ng
g−1)of
oyster
samples
from
theUrdaibaiestuary
sampled
inthetwodifferentp
rogram
mes
andanalysed
usingtwodifferentm
etho
ds(m
etho
d1:
US–H
PLC–F
La ;
metho
d2:
MAE–G
C–M
S) M
arch
2003
March
2004
AB
CA
BC
Metho
d1
Metho
d2
Metho
d1
Metho
d2
Metho
d1
Metho
d2
Metho
d1
Metho
d2
Metho
d1
Metho
d2
Metho
d1
Metho
d2
Naphthalene
8.1±
2.2
19.2±2
.819
.0±3
.523
4.4±
34.5
16.8±3
.368
.9±1
0.1
4.5±
0.9
4.04
±0.6
67.3±1
0.5
57.7±8
.518
.2±3
.530
.1±4
.4Acenaph
thalene
n.db
<d.L.c
n.d
<d.L.
n.d
3.7±
0.5
n.d
6.2±
0.8
n.d
1.9±
0.3
n.d
6.3±
0.9
Acenaph
thylene
70.4±5
.90.7±
0.1
22.8±2
.56.9±
1.1
86.1±6
.916
.1±2
.714
.3±1
.313
.8±2
.322
.1±4
.712
.0±2
.017
.5±4
.08.3±
1.4
Fluorene
17.2±4
.51.6±
0.3
54.2±6
.738
.7±6
.019
.6±1
.216
.6±2
.628
.5±7
.830
.8±4
.813
.1±0
.810
.0±1
.551
.2±5
.828
.6±4
.4Phenanthrene
40.8±2
.024
.8±1
.361
.9±8
.561
.5±3
.358
.1±5
.878
.8±4
.244
.1±5
.046
.0±2
.529
.5±5
.041
.1±2
.261
.7±7
.875
.1±4
.0Anthracene
7.2±
1.9
3.3±
0.2
9.0±
0.8
<d.L.
8.2±
0.8
7.8±
0.4
<d.L.
5.3±
0.3
2.1±
0.8
2.8±
0.2
6.9±
3.0
7.0±
0.4
Fluoranthene
48.4±3
.456
.3±3
.769
.8±3
.514
8.8±
8.2
127.6±
9.8
139.1±
9.2
25.8±6
.052
.0±3
.578
.2±3
.532
.7±2
.146
.3±6
.723
.5±1
.5Pyrene
22.6±2
.346
.8±3
.214
4.1±
1212
5.7±
8.4
58.6±5
.317
8.7±
12.2
17.5±3
.535
.6±2
.450
.9±4
.925
.7±1
.757
.1±2
.573
.8±5
.0Benzo(a)anthracene
7.9±
0.9
8.1±
0.7
19.8±3
.917
.3±1
.230
.5±2
.231
.8±2
.612
.3±2
.514
.9±1
.210
.7±3
.14.4±
0.4
15.7±1
.541
,2±3
.4Chrysene
17.6±2
.634
.1±2
.728
.1±3
.542
.9±3
.514
.5±2
.279
.4±6
.422
.7±5
.029
.7±2
.430
.7±3
.516
.5±1
.326
.0±2
.554
.5±4
.4Benzo(b)fluoranthene
29.8±3
.025
.3±2
.226
.8±3
.556
.6±4
.527
.5±5
.545
.9±3
.916
.6±1
.331
.7±2
.742
.2±3
.59.2±
0.8
33.8±3
.164
.6±5
.6Benzo(k)fluoranthene
7.9±
2.1
13.4±1
.511.8±0
.913
.9±1
.28.9±
1.5
24.6±2
.63.5±
1.1
14.4±1
.512
.9±1
.02.6±
0.3
10.5±2
.521
.1±2
.3Benzo(a)pyrene
0.96
±0.1
14.2±1
.05.1±
0.5
17.6±1
.91.7±
0.7
31.9±2
.26.1±
2.7
9.7±
0.5
10.5±3
.01.0±
0.1
3.3±
0.8
19.9±1
.3Dibenzo(a,h)anthracene
19.7±3
.1<d.L.
27.1±5
.63.86
±0.3
29.0±6
.722
.6±3
.62.3±
0.9
2.8±
0.4
7.4±
1.5
1.5±
0.2
11.7±2
.30.60
±0.1
Benzo(g,h,i)perylene
7.8±
1.5
<d.L.
3.5±
0.3
<d.L.
8.6±
2.3
<d.L.
7.8±
2.0
2.1±
0.2
13.4±2
.02.1±0
.27.5±
1.0
1.4±
0.15
Indeno
pyrene
<d.L.
<d.L.
<d.L.
3.1±
0.6
<d.L.
6.4±
1.2
<d.L.
3.5±
0.7
<d.L.
2.3±
0.4
<d.L.
6.7±
1.3
ΣPA
H30
6.6
247.7
503.3
771.6
495.9
752.4
220.4
302.8
391.6
223.7
367.2
462.4
a US=ultrasou
nd;
bn.d=
notdetected;
c <d.L.=below
detectionlim
it
1339
with another analytical method validate the method. Themajor advantages of ultrasonication are the reduced extrac-tion time and the elimination of an additional clean-up step,involving additional glassware and apparatus. Traditionalextraction methods require longer times (Soxhlet >8 h) andalthough recently developed methods may reduce this timesubstantially (SFE ∼30 min, PLE ∼20–30 min, MAE ∼10–15 min, ultrasonic bath ∼30 min), they still suffer from thecomplexity and high instrument costs. The ultrasonic probedescribed here is an attractive alternative which also avoidsadditional clean-up steps, which makes this method suitablefor laboratories engaged daily in routine analysis of a largenumber of samples.
It can be concluded that levels of PAH in natural oystersfrom the Urdaibai estuary did not increase substantially afterPrestige oil spill, and that the PAH levels are far lower thanthose reported after other oil spillage episodes. Fortunately,therefore, the effect of the Prestige oil spill on the ecosystem ofthe Urdaibai estuary can be regarded as only moderate to low.
Acknowledgements The authors want to thank the SpanishGovernment for financial support through project BQU2002-01348. J. Sanz is grateful to the European Union for his post-doctoral fellowship.
References
1. Douben PET (2003) (ed.) PAH: an ecotoxicological perspec-tive. Wiley, New York
2. Kalf DF, Crommentujin T, van de Plasssche EJ (1997)Ecotoxicol Environ Safety 36:89–97
3. Mazeas L, Budzinski H (2002) Intern J Environ Anal Chem82:157–173
4. USA Environmental Protection Agency Methods No. 8100 andNo. 8310 (1986) Test Methods for Evaluating Solid Waste,Physical/Chemical Methods (SW-846). Washington
5. Song YF, Jing X, Fleishmann S, Wilke BM (2002) Chemo-sphere 48:993–1001
6. DreyerA,RadkeM (2005) Inter J EnvironAnal Chem85:423–4327. Martinez E, Gros M, Lacorte S, Barcelo D (2004) J Chroma-
tography A 1047:181–1888. Zougagh M, Redigolo H, Ríos A, Valcarcel M (2004) Anal
Chim Acta 525:265–2719. Hartonen K, Bøwadt S, Dybdahl HP, Nylund K, Sporring S,
Lund H, Oreld F (2002) J Chromatography A 958:239–24810. Miege C, Dugay J, Hennion MC (2003) J Chromatography A
995:87–9711. Hollender J, Koch B, Lutermann C, Dott W (2002) Intern
J Environ Anal Chem 83:21–3212. Flotron V, Houessou J, Bosio A, Delteil C, Bermond A, Camel
V (2003) J Chromatography A 999:175–184
13. Jayaraman S, Pruell RJ, McKinney R (2001) Chemosphere44:181–191
14. Rodriguez-Sanmartin P, Moreda-Piñeiro A, Bermejo-Barrera A,Bermejo-Barrera P (2005) Talanta 66:683–690
15. Kuosmanen K, Hyotylainen T, Hartonene K, Jonsson JA,Riekkola ML (2003) Anal Bioanal Chem 375:389–399
16. Tolosa I, Mora SJ, Fowler SW, Villeneuve J-P, Bartocci J,Cattini C (2005) Mar Poll Bull 50:1619–1633
17. Oros DR, Ross JRM (2005) Marine Environ Res 60:466–48818. Orbea A, Ortiz-Zarragoitia M, Solé M, Porte C, Cajaraville MP
(2002) Aq Toxicol 58:75–9819. Filipkowska A, Lubecki L, Kowalewska G (2005) Anal Chim
Acta 547:243–25420. Bermejo P, Capelo JL, Mota A, Madrid Y, Cámara C (2004)
TRAC 23:654–66321. Capelo JL, Ximenez-Embun P, Madrid-Albarran Y, Cámara C
(2004) Anal Chem 76:233–23722. Cabañero AI, Madrid Y, Cámara C (2005) Anal Bioanal Chem
381:373–37923. Sanz E, Muñoz-Olivas R, Camara C (2005) Anal Chim Acta
535:227–23524. Capelo JL, Galesio MM, Felisberto GM, Vaz C, Costa Pessoa J
(2005) Talanta 66:1272–128025. Deming SN, Morgan SL (1993) Experimental design: a
chemometrical approach. Elsevier, Amsterdam26. Davies L (1993) Efficiency in research, development and
production: The statistical design and analysis of chemicalexperiments. The Royal Society of Chemistry, Cambridge
27. Pérez-Cadahía B, Laffon B, Pásaro E, Méndez J (2004) ComparBiochem Phys Part C 138:453–460
28. Schantz MM, Nichols JJ, Wise SA (1997) Anal Chem69:4210–4217
29. Bartolome L, Cortazar E, Raposo JC, Usobiaga A, Zuloaga O,Etxebarria N, Fernandez LA (2005) J Chromatography A1068:229–236
30. Leonhardt E, Stahl R (1998) Anal Chem 70:1228–123031. Barker TB (1994) Quality by experimental design. 2nd Ed.
Marcel Dekker Inc., New York32. Miller JC, Miller JN (1988) Statistics for analytical chemistry,
2nd Ed., Ellis Horwood Ed., London33. Sherrod PH (1995) NLREG-Nonlinear Regression Analysis
Program. Nashville34. Banjoo DR, Nelson PK (2005) J Chromatography A 1066:9–1835. Alvero B, Sanchez-Brunete C, Tadeo JL (2003) J AOAC Int
86:576–58236. Agence Française de Sécurité Sanitaire (AFSSA). http://www.
afssa.fr37. Agencia Española de Seguridad Alimentaria (AESA). http://
www.msc.es/aesa38. Freire J, Fernández L, Muiño R (2005) Marine Policy, in press.
Available by web in: http://www.sciencedirect.com39. Porte C, Biosca X, Solé M, Albaigés J (2001) Environ Pollut
112:261–26840. Carls M, Marty G, Hose J (2002) Can J Fish Aquat Sci
59:153–172
Table 9 Total PAH content (mg kg−1 dry weight) of some bivalve samples from other locations affected by oil spills
Location Sample Date Oil Spill Σ PAH Refs.
Ría de Arousa (Galiza-Spain) Mussel July 2002 Before Prestige 0.82–3.27 [14]Ría de Arousa (Galiza-Spain) Mussel July 2003 After Prestige 2.45–9.8 [14]Betanzos estuary (Galiza-Spain) Mussel October 1995 After Aegean Sea 1.6–45.7 [39]Betanzos estuary (Galiza-Spain) Mussel July 2003 After Prestige 16.9–17.0 [27]Prince Willian Sound (Alaska-EEUU) Mussel 1990–1993 After Exxon Valdéz 9.9–15.5 [40]Urdaibai (Basque Country-Spain) Oyster July 1996 Before Prestige 0.15–1.09 [18]Urdaibai (Basque Country-Spain) Oyster March 2003 After Prestige 0.2–0.5 This work
1340
Related Documents


![Polycyclic aromatic hydrocarbons (PAH) guidance · Polycyclic aromatic hydrocarbons (Benzo[a]pyrene) General Information Key Points Identity The term polycyclic aromatic hydrocarbons](https://static.cupdf.com/doc/110x72/5af498db7f8b9a8d1c8c6b2b/polycyclic-aromatic-hydrocarbons-pah-guidance-aromatic-hydrocarbons-benzoapyrene.jpg)