Report No. CDOT-2010-1 Final Report ACCELERATED CURING AND STRENGTH-MODULUS CORRELATION FOR LIME-STABILIZED SOILS Michael A. Mooney Nathan M. Toohey January 2010 COLORADO DEPARTMENT OF TRANSPORTATION DTD APPLIED RESEARCH AND INNOVATION BRANCH

Welcome message from author
This document is posted to help you gain knowledge. Please leave a comment to let me know what you think about it! Share it to your friends and learn new things together.
Transcript
Report No. CDOT-2010-1 Final Report ACCELERATED CURING AND STRENGTH-MODULUS CORRELATION FOR LIME-STABILIZED SOILS Michael A. Mooney Nathan M. Toohey January 2010 COLORADO DEPARTMENT OF TRANSPORTATION DTD APPLIED RESEARCH AND INNOVATION BRANCH
The contents of this report reflect the views of the
authors, who are responsible for the facts and
accuracy of the data presented herein. The contents do
not necessarily reflect the official views of the
Colorado Department of Transportation or the Federal
Highway Administration. This report does not
constitute a standard, specification, or regulation.
Technical Report Documentation Page 1. Report No. CDOT-2010-1
2. Government Accession No.
3. Recipient's Catalog No.
4. Title and Subtitle ACCELERATED CURING AND STRENGTH-MODULUS CORRELATION FOR LIME-STABILIZED SOILS
5. Report Date January 2010 6. Performing Organization Code
7. Author(s) Michael A. Mooney, Ph.D., P.E.; Nathan M. Toohey, B.S., E.I.T.
8. Performing Organization Report No. CDOT-2010-1
9. Performing Organization Name and Address Colorado School of Mines 1500 Illinois Street Golden, Colorado 80401
10. Work Unit No. (TRAIS) 11. Contract or Grant No. 80.26
12. Sponsoring Agency Name and Address Colorado Department of Transportation – Research 4201 East Arkansas Avenue Denver, CO 80222
13. Type of Report and Period Covered Final 14. Sponsoring Agency Code
15. Supplementary Notes Prepared in cooperation with the US Department of Transportation, Federal Highway Administration 16. Abstract
This study sought to identify the equivalent 105°F curing duration for lime-stabilized soil (LSS) that will yield the equivalent unconfined compressive strength (UCS) to that resulting from 28-day, 73°F curing. Both 5-day and 7-day 105°F (or 100°F) curing have been used in practice. The study also sought to characterize the relationship between resilient modulus (Mr) and UCS for LSS soils, since the prevailing correlation between Mr and UCS for LSS – based on Thompson (1966) – was not developed from cyclic loading and has been validated with only limited data. The study revealed that the 5-day, 105°F accelerated curing yielded UCS values more representative of 28-day 73°F UCS than did the 7-day, 105°F curing regime. However, there is no universal equivalent accelerated curing duration for LSS; therefore, 5-day 105°F curing can yield erroneous estimates of 28-day 73°F UCS. The study recommends verification of the equivalent 105°F curing duration for each LSS to gage the most representative accelerated curing duration. Based on experimental Mr – UCS data, the relationship Mr (ksi) = 0.124 UCS (psi) + 9.98 was found to be conservative in its prediction of Mr from UCS.
Implementation
Based on the results of the study, the Colorado Department of Transportation (CDOT) will continue using the 5-day, 100°F accelerated curing protocol for LSS, in addition to other approved curing procedures.
The construction process for lime-stabilized soil requires diligent quality control and quality assurance (QC/QA). CDOT should investigate alternative methods of QC/QA that can be conducted in the field instead of the laboratory. 17. Key Words LSS, accelerated curing, equivalent unconfined compressive strength (UCS), resilient modulus, quality control/quality assurance (QC/QA)
18. Distribution Statement No restrictions. This document is available to the public through the National Technical Information Service, Springfield, VA 22161; www.ntis.gov
19. Security Classif. (of this report) Unclassified
20. Security Classif. (of this page) Unclassified
21. No. of Pages 54
22. Price
Form DOT F 1700.7 (8-72) Reproduction of completed page authorized
ii
ACCELERATED CURING AND STRENGTH- MODULUS CORRELATION FOR LIME-
STABILIZED SOILS
by
Principal Investigators Michael A. Mooney, Ph.D., P.E., Associate Professor
Nathan M. Toohey, B.S, E.I.T, Graduate Student
Report No. CDOT-2010-1
Prepared by Colorado School of Mines Division of Engineering
1500 Illinois Street Golden, Colorado 80401
Sponsored by the Colorado Department of Transportation
In Cooperation with the U.S. Department of Transportation Federal Highway Administration
January 2010
Colorado Department of Transportation DTD Applied Research and Innovation Branch
4201 E. Arkansas Ave. Denver, CO 80222
(303) 757-9506
iii
ACKNOWLEDGEMENTS The authors wish to thank the CDOT-DTD Applied Research and Innovation Branch for funding this study and Roberto DeDios for overseeing the project on behalf of CDOT. We wish to thank the project panel members - C.K. Su, Bob Locander, Gary DeWitt, Aziz Khan, Matt McMechen, Shamshad Hussain, Alan Hotchkiss, Scott Roalofs, Paul Smith, and Jim Noll (Kumar & Associates) - for their feedback throughout the project and for their assistance in locating and securing soils for lab testing. We are extremely grateful to the many CDOT personnel and consultants at project sites that helped during this study. We would particularly like to acknowledge Bob LaForce (Yeh & Associates, Inc.), Derek Garben (ARS, Inc.), Nick Andrade (Ground Engineering Consultants, Inc.) and Joels Malama (Terracon Consultants, Inc.) for their assistance. Information on CDOT practice was gleaned through conversations with Bob LaForce, formerly of Region 1; Bob Locander; James Chang of Region 6; and a number of engineers with local geotechnical firms. We are grateful for their assistance. We would also like to acknowledge and thank Derrick Schimming for performing a literature review of accelerated curing and Kyle Jackson for his assistance with laboratory testing.
iv
EXECUTIVE SUMMARY This report presents the findings from CDOT Study No. 80.26 entitled “Accelerated Curing and Strength-Modulus Correlation for Lime-Stabilized Soils.” The objectives of the study were to identify the most appropriate accelerated curing regime (temperature and duration) for lime- stabilized soil (LSS) specimens that will yield unconfined compressive strength (UCS) values equivalent to UCS of 28-day room temperature 73°F (23°C) cured samples. In addition, the study aimed to characterize the relationship between resilient modulus (Mr) and UCS for LSS soils, since the prevailing correlation between Mr and UCS for LSS is based on limited data.
Lime stabilization of roadway subgrade soils is widely used to reduce soil plasticity, mitigate heave, and increase subgrade stiffness and strength. Lime-stabilized soil performance requires careful construction, and the relatively involved construction process requires diligent quality control (QC) and quality assurance (QA). The need to assess design-related parameters such as 28-day unconfined compressive strength and resilient modulus of LSS during QC/QA conflicts with more rapid pavement construction schedules. Strength and stiffness growth in LSS stems from pozzolanic reactions that continue over months, whereas contractors and construction schedules often desire evaluation of acceptance after days.
As a result, accelerated curing of LSS specimens is commonly employed to estimate 28-day normal (room temperature) unconfined compressive strength (UCS). The National Lime Association (NLA) recommends accelerated curing of LSS specimens at 104°F (40°C) for 7 days. CDOT currently has adopted the 5-day 100°F (38°C) accelerated curing regime recommended by the Metropolitan Government Pavement Engineers Council (MGPEC) Pavement Design Standards of Denver, Colorado.
A thorough review of the literature and a detailed laboratory testing program were performed. Six soils with plasticity indices (PI) ranging from 13-37 were selected from the Denver metropolitan area for laboratory evaluation. Both 4.5 inch tall and 8.0 inch tall specimens (all 4.0 inch diameter) were investigated because Colorado practice is to perform UCS testing on 4.5 inch tall Proctor mold specimens yet Mr testing requires a 2:1 height to diameter ratio. Specimens were subjected to accelerated (2, 4, 6, and 8 day at 105ºF) and normal (28-day 73°F) curing prior to UCS testing. Resilient modulus testing was performed on three of the soils.
Previous studies of accelerated curing documented in the literature suggest that no unique equivalent accelerated curing regime exists. The strength gain of LSS due to time-dependent pozzolanic reactions is a function of soil composition, soil processing, lime content, and temperature. It has been shown that accelerated curing of 7-days at 105°F generally over-estimates UCS determined from samples cured for 28-days at room temperature. In some cases, 28-day strength gain was achieved following 2-days 105°F.
Consistent with the literature, a universal equivalent 105°F curing duration that predicted 28-day 73°F cured UCS was not found. The equivalent 105°F curing durations for soils 1 through 4 (PI = 13, 24, 26 and 37) were found to be 5.4, 4.6, 5.9, and 1.8 days, respectively. The equivalent 105°F curing durations for soils 5 and 6 were less than 1.5 days because the soil was more thoroughly processed. The 7-day, 105°F curing duration overestimated UCS after 28-day 73°F curing by 13 to 256%. The 5-day accelerated curing for UCS testing slightly underestimated 28-
v
day 73°F cured UCS for soils 1 and 3 (less than 10%) and overestimated 28-day 73°F cured UCS for soil 2 (2%) and 4 (94%). Thompson’s correlation (Thompson 1966) presented in Equation (1) is used by CDOT and recommended by the 2007 Interim Mechanistic-Empirical Pavement Design Guide (MEPDG). Test results from soils 4, 5 and 6 demonstrated that Equation 1 used by CDOT and proposed in the 2007 Interim MEPDG is conservative in its prediction of Mr from UCS of LSS. Equation (1) underestimates measured Mr (σc = 2 psi) by 20 – 50% and measured Mr (σc = 4 psi) by 50 - 80% for 8.0 in. tall UCS specimens. More appropriately for Colorado practice, the current equation underestimates Mr by 40 – 80% (for σc = 2 psi) and 80 - 110% (for σc = 4 psi) using UCS from 4.5 in. tall Proctor-molded specimens commonly used in CDOT practice. Mr (ksi) = 0.124 UCS (psi) + 9.98 (1)
Based on the results of this study, the following recommendations are made for CDOT practice:
1. The study supports the use of 5-day, 100°F curing as a more realistic accelerated curing regime than 7-day, 105°F curing. However, 5-day 100°F curing can yield erroneous estimates of 28-day 73°F UCS. Note that the difference between 100°F and 105°F curing is deemed negligible (the variation in reporting resolution and measurement accuracy is 2-5°F).
2. CDOT should consider requiring verification of the equivalent 100°F curing duration for each LSS. The procedure would be straightforward (e.g., comparison of 4, 6 and 8-day accelerated UCS with 28-day normal temperature UCS) and could be performed during the design or early construction phase.
3. CDOT should consider adopting the Mr – UCS correlation recommended by Little (2004) for LSS. The limited results collected during this study support this relationship. Additional testing should be performed in early adopter projects to validate the use of this correlation. Alternatively, adjust the Mr – UCS correlation per the results presented here combined with further testing.
A more general recommendation about QC/QA of LSS is provided. The limitations of accelerated curing and Mr – UCS correlation notwithstanding, QC/QA involving laboratory compaction, curing, and testing to estimate field performance has limitations. Laboratory and field compaction yield different soil structure and fabric. Curing conditions (temperature, confinement) differ in the field and lab. For these reasons, and given the relative complexity of LSS construction, CDOT should consider alternative methods of QC/QA. Sampling could be conducted in the field on LSS that is field compacted and field cured to be representative of the parent material. Performance-related parameters such as modulus and strength could be measured directly, rather than correlated.
vi
TABLE OF CONTENTS CHAPTER 1: Introduction 1.1 Overview and Objectives ...............................................................................................1 1.2 Pavement Design Practice with Lime-Stabilized Soils ..................................................2 1.3 Summary of Report ........................................................................................................4 CHAPTER 2: Literature Review 2.1 Accelerated Curing Protocols for Lime-Stabilized Soils ...............................................5 2.2 Correlation between Resilient Modulus and UCS .......................................................13 CHAPTER 3: Test Program and Results 3.1 Test Program ................................................................................................................18
3.1.1 Soils and Lime Treatment ...................................................................................18 3.1.2 Specimen Preparation .........................................................................................20 3.1.3 UCS Testing ........................................................................................................23 3.1.4 Resilient Modulus Testing ..................................................................................24
3.2 Test Results ..................................................................................................................26 3.1.1 UCS for Specimens Cured under Normal and Accelerated Conditions .............26 3.1.2 Correlation of Resilient Modulus and UCS ........................................................34 3.3 Summary of Findings ...................................................................................................39
CHAPTER 4: Conclusions and Recommendations 4.1 Equivalent Accelerated Curing Regime.......................................................................40 4.2 Resilient Modulus-Unconfined Compressive Strength Correlation ............................41 REFERENCES ..............................................................................................................................44
vii
LIST OF FIGURES Figure 2-1. Hours of 105°F (40°C) accelerated curing required to match UCS obtained under
normal curing temperature 73°F (23°C) (from Biswas 1972) Figure 2-2. Relationship between 120°F (50°C) and 140°F (60°C) accelerated curing times
and curing time at 73°F (23°C) (from Biswas 1972) Figure 2-3. Comparison of 7-Day 110°F (43°C) UCS with UCS from samples cured at 72°F
(22°C) (from Doty & Alexander, 1978) Figure 2-4. UCS for ML with 3% Lime (after Townsend & Donaghe 1976) Figure 2-5. UCS for ML with 6% Lime (after Townsend & Donaghe 1976) Figure 2-6. UCS for CH with 5% Lime (after Townsend & Donaghe 1976) Figure 2-7. UCS for CH with 8% Lime (after Townsend & Donaghe 1976) Figure 2-8. Modulus versus unconfined compressive strength relationship (Equation 2) for
lime-stabilized soils developed by Thompson (1966) Figure 2-9. Relationship between unconfined compressive strength and modulus from
Thompson’s (1966) zero confining stress yields a different relationship than Figure2-8
Figure 2-10. Results of limited testing by CTL/Thompson (1998) corroborate Equation (2). Note that Thompson’s correlation is incorrectly referenced in this Figure from CTL/Thompson (1998) as Dallas Little’s equation
Figure 2-11. Design Mr vs. UCS relationship for lime-stabilized soil recommended by Little et al. (1994) based on three sets of findings: (a) UCS versus compressive modulus E from Thompson (1966); (b) UCS versus flexural modulus from Thompson & Figueroa (1989); and (c) UCS versus back-calculated FWD modulus from Little et al. (1994)
Figure 3-1. Final field mixing of lime-treated soil 1 Figure 3-2. Laboratory mixing used for lime-treated soils 2 through 6 Figure 3-3. Two specimen geometries used during testing: 4.0 in. diameter × 4.5 in. tall and
4.0 in. diameter × 8.0 in. tall Figure 3-4. Preparation of 4.0 x 8.0 in. specimens Figure 3-5. Load frame and data acquisition system at CSM research facility Figure 3-6. UCS test setup use by Ground Engineering Figure 3-7. Mr test setup used by Ground Engineering Figure 3-8. UCS vs. curing time for 4- 4 x 4.5 inch accelerated cure (A4) and normal cure
(N4) samples. Individual sample UCS in filled symbols, average UCS in open symbols
Figure 3-9. UCS with time for soils 5 (left) and 6 (right) for 4- 4 x 4.5 inch accelerated cure (A4) and normal cure (N4) samples. Individual sample UCS in filled symbols, average UCS in open symbols
Figure 3-10. Axial stress-strain behavior of soil 1 (top) and soil 2 (bottom) specimens (4 x 4.5 in.). Accelerated cure on left side and normal cure on right.
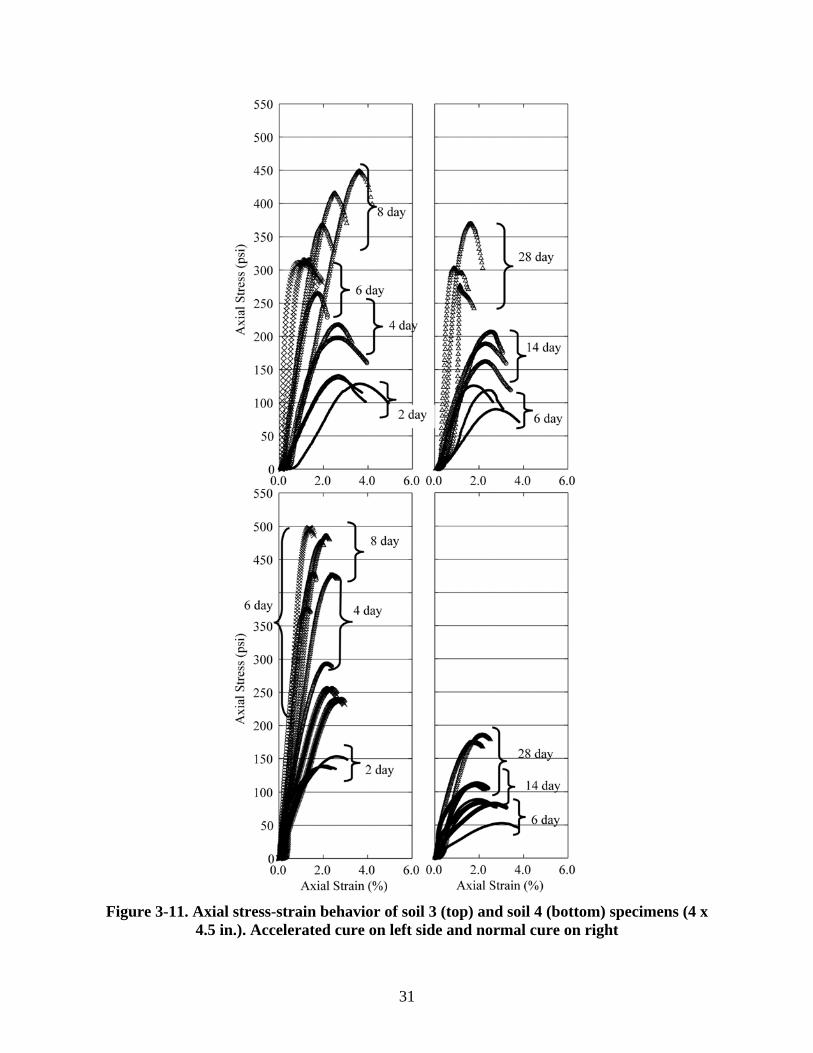
Figure 3-11. Axial stress-strain behavior of soil 3 (top) and soil 4 (bottom) specimens (4 x 4.5 in.). Accelerated cure on left side and normal cure on right
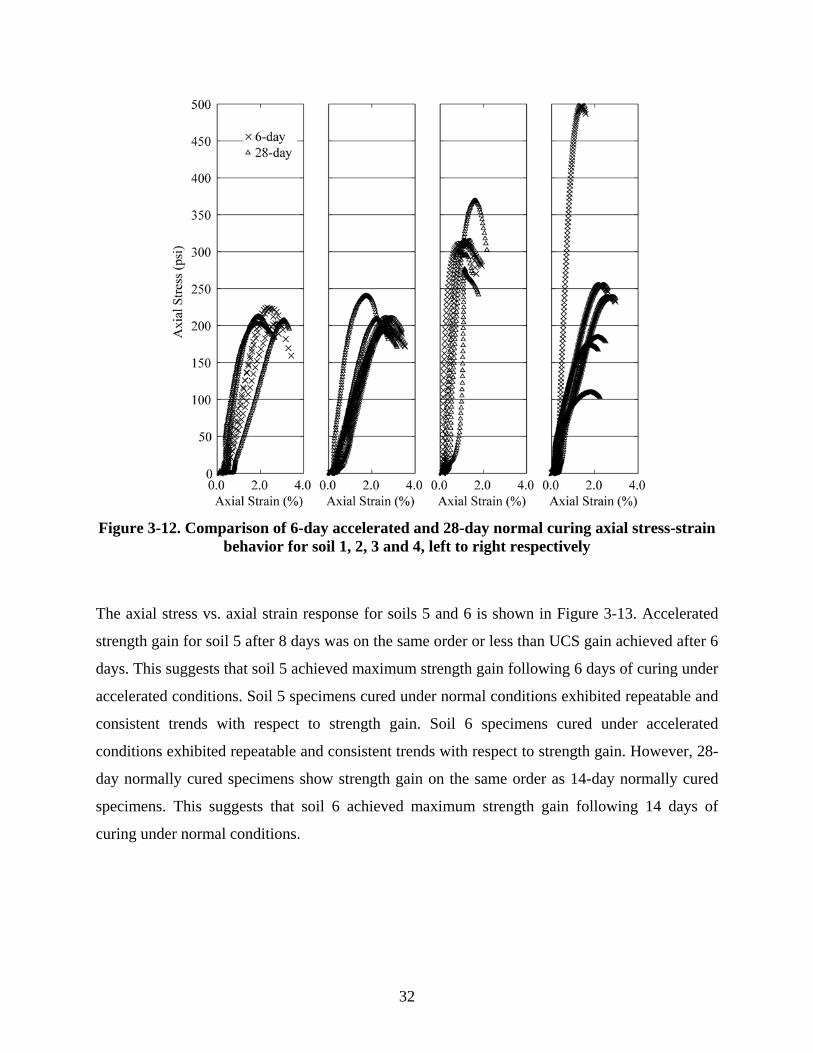
Figure 3-12. Comparison of 6-day accelerated and 28-day normal curing axial stress-strain behavior for soil 1, 2, 3 and 4, left to right respectively
viii
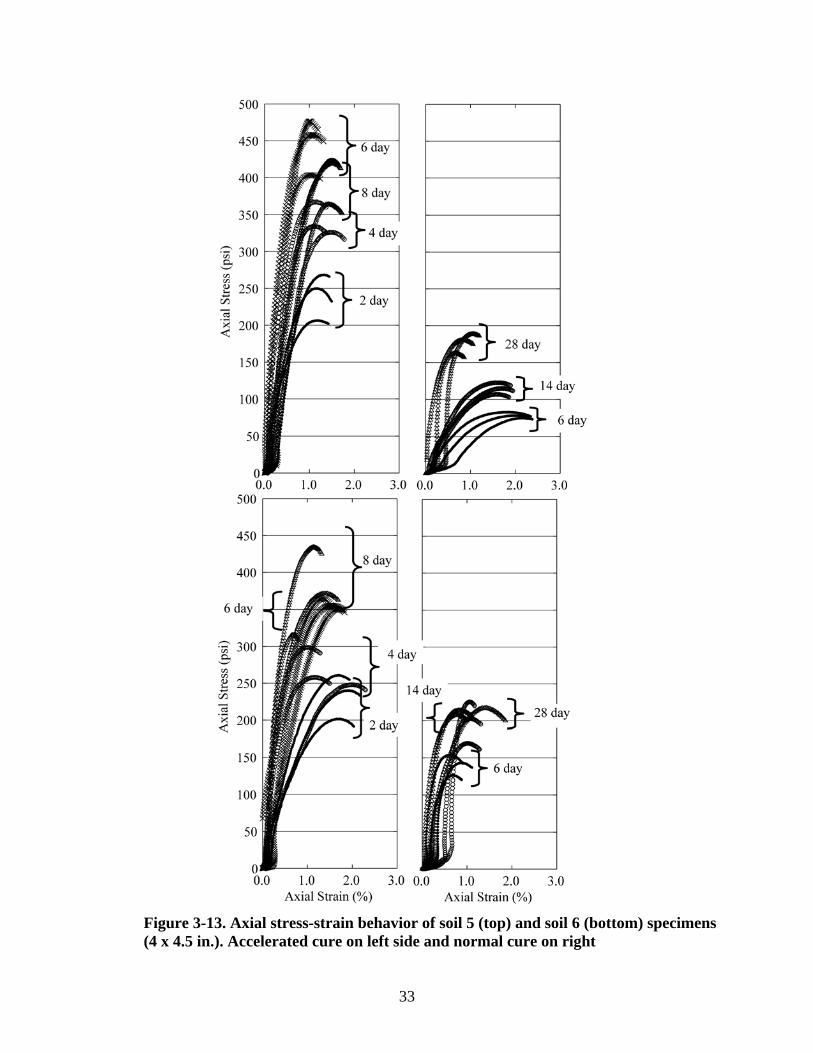
Figure 3-13. Axial stress-strain behavior of soil 5 (top) and soil 6 (bottom) specimens (4 x 4.5 in.). Accelerated cure on left side and normal cure on right
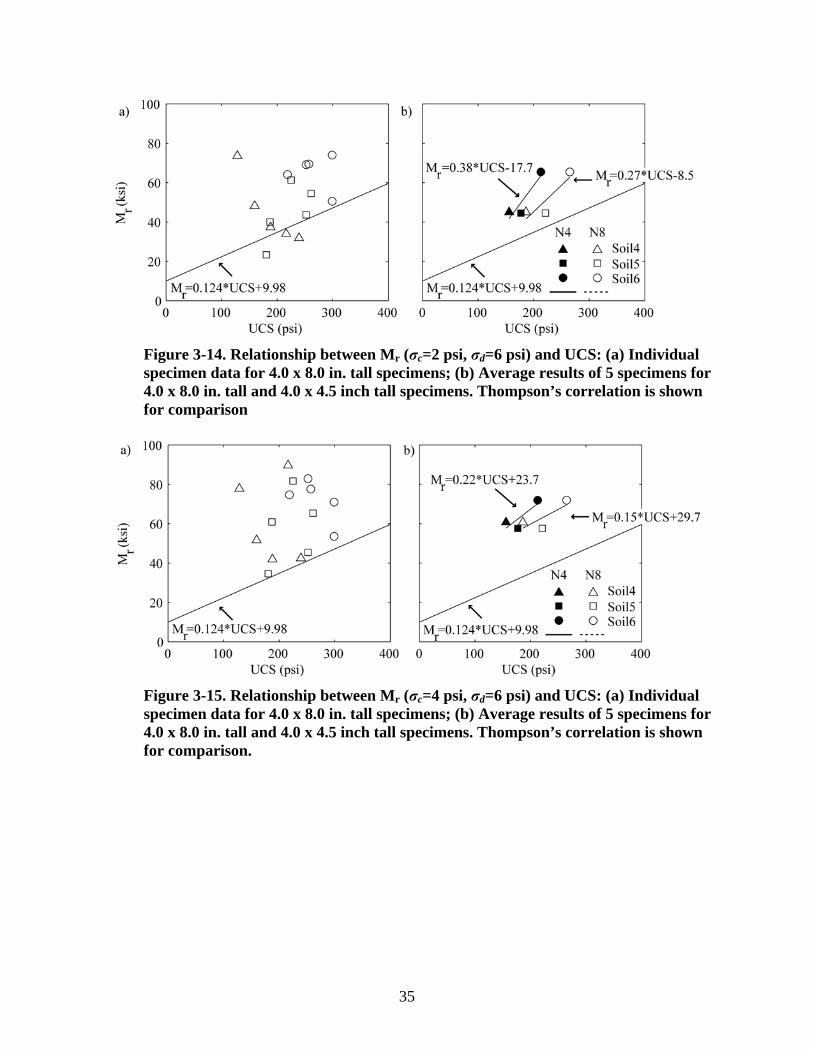
Figure 3-14. Relationship between Mr (σc=2 psi, σd=6 psi) and UCS: (a) Individual specimen data for 4.0 x 8.0 in. tall specimens; (b) Average results of 5 specimens for 4.0 x 8.0 in. tall and 4.0 x 4.5 inch tall specimens. Thompson’s correlation is shown for comparison
Figure 3-15. Relationship between Mr (σc=4 psi, σd=6 psi) and UCS: (a) Individual specimen data for 4.0 x 8.0 in. tall specimens; (b) Average results of 5 specimens for 4.0 x 8.0 in. tall and 4.0 x 4.5 inch tall specimens. Thompson’s correlation is shown for comparison
Figure 3-16. Average UCS values of 4.5 in. tall and 8 in. tall specimens Figure 3-17. Comparison of measured data with proposed relationship from Little (1994): (a)
σc=2 psi, σd=6 psi, (b) σc=4 psi, σd=6 psi. Measured data reflect average results of 5 specimens
ix
LIST OF TABLES
Table 2-A. Summary of Biswas (1972) soils tested and accelerated curing times that yield UCS values equivalent to 28-day, 73 °F cured samples
Table 2-B. Summary of the soils investigated by Alexander and Doty (1978) Table 2-C. Summary of soils tested by Thompson (1966) Table 2-D. Recommended Mr ratios for LSS and untreated soil (Little 1994) Table 3-A. Summary of soils investigated Table 3-B. UCS testing matrix Table 3-C. Subgrade Soil Testing Sequence (AASHTO T-307) Table 3-D. Comparison of 6 and 28-day normal and accelerated cured UCS Table 3-E. Comparison of UCS gain with time for normal and accelerated curing Table 3-F. Comparison of UCS from 5 and 7-day accelerated cure with 28 day normal cure Table 3-G. Summary of UCS (N8) and Mr (N8) (σc=2 psi, σd=6 psi) Table 3-H. Comparison of measured (N8) and estimated (N8) (Eq. 1) Mr (σc=2 psi, σd=6 psi) Table 3-I. Summary of UCS (N8) and Mr (N8) (σc=4 psi, σd=6 psi) Table 3-J. Comparison of measured (N8) and estimated (N8) (Eq. 1) Mr (σc=4 psi, σd=6 psi) Table 3-K. Summary of UCS (N4) and Mr (N8) (σc=2 psi, σd=6 psi) Table 3-L. Comparison of measured Mr (N8) and estimated Mr (N4) (Eq. 1) (σc=2 psi, σd=6
psi) Table 3-M. Summary of UCS (N4) and Mr (N8) (σc=4 psi, σd=6 psi) Table 3-N. Comparison of measured Mr (N8) and estimated Mr (N4) (Eq. 1) (σc=4 psi, σd=6
psi) Table 4-A. Summary of equivalent 105°F curing durations Table 4-B. Comparison of measured (N8) and estimated (N8) (per Chapter 2, Eq. 1)
Mr (σc=2 psi, σd=6 psi) Table 4-C. Comparison of measured (N8) and estimated (N8) (per Chapter 2, Eq. 1)
Mr (σc=4 psi, σd=6 psi) Table 4-D. Comparison of measured (N8) and estimated (N4) (per Chapter 2, Eq. 1)
Mr (σc=2 psi, σd=6 psi) Table 4-E. Comparison of measured (N8) and estimated (N4) (per Chapter 2, Eq. 1)
Mr (σc=4 psi, σd=6 psi)
1
CHAPTER 1: INTRODUCTION 1.1 Overview and Objectives Lime stabilization of roadway subgrade soils is widely used to reduce soil plasticity, mitigate
heave, and increase subgrade stiffness and strength. The lime-stabilized soil (LSS) layer becomes
a structural component of the pavement system whereby flexural strength and (resilient) modulus
are important performance-related and thus design parameters (MEPDG 2007). LSS
performance requires careful construction, and the relatively involved construction process,
(uniformly blending lime with soil, mellowing, re-mixing, etc.), requires diligent quality control
(QC) and quality assurance (QA). The need to assess performance-related parameters (e.g., 28-
day unconfined compressive strength, resilient modulus) of LSS during QC/QA conflicts with
pavement constructability. Strength and stiffness growth in LSS stems from pozzolanic reactions
that continue over months, whereas contractors and construction schedules often desire
evaluation of acceptance after days. As a result, the acceptance criteria in current QC/QA
specifications of LSS vary throughout the U.S., are only loosely tied to design parameters, and
often involved accelerated curing of LSS samples.
For construction expediency, UCS testing is performed after accelerated curing of LSS samples
in CDOT practice. ASTM D 5102-96 proposes a curing period of 7 days at room temperature but
allows elevated temperatures. The accelerated testing protocol suggested by the National Lime
Association (NLA) calls for accelerated 7-day curing at 104°F (40°C). The Metropolitan
Government Pavement Engineers Council (MGPEC) Pavement Design Standards of Denver,
Colorado recommends 5-day accelerated curing at 100°F (38°C). The latter has become the
standard practice of Colorado engineers. Presently, CDOT has adopted the MGPEC 5-day,
100°F (38°C) accelerated testing protocol in its Pavement Design Manual; however, there is
significant uncertainty as to its equivalence to 28-day room temperature curing.
The CDOT Pavement Design Manual currently recommends the use of a structural layer
coefficient for stabilized subgrade, consistent with the AASHTO 1993 pavement design guide.
The coefficient, which cannot be ascertained directly, is determined through correlation to
resilient modulus (Mr). CDOT does not currently perform Mr testing; rather, Mr is determined via
2
correlation from unconfined compressive strength (UCS). The 2007 Interim Mechanistic-
Emperical Pavement Design Guide (MEPDG) indicates that the design Mr for LSS can be
approximated from the results of UCS tests using Equation (1). The MGPEC of Denver also
utilizes this relationship for LSS.
Mr (ksi) = 0.124 UCS (psi) + 9.98 (1)
The data upon which Equation (1) was developed appears limited, and a recent study by Little
(1994) asserts that Equation (1) is conservative. Further, Equation (1) was derived from samples
with 2:1 height to diameter ratios. In Colorado practice, UCS testing is performed on Proctor size
samples with 4.0 inch diameter and 4.5 inch height (1.15:1 height to diameter ratio). The
influence of Proctor size samples requires clarification.
The objectives of this study are two-fold:
1. Identify the most appropriate accelerated curing regime (temperature and duration) for
LSS specimens that will yield UCS values equivalent to UCS of 28-day room
temperature 73°F (23°C) cured samples.
2. Investigate the Mr – UCS relationship (Equation 1) recommended for LSS soils.
To meet these objectives, a thorough review of the literature and a detailed laboratory testing
program were conducted. Six soils with plasticity indices (PI) ranging from 13 - 37 were selected
for laboratory evaluation. Both 4.5 inch tall and 8.0 inch tall specimens (all 4.0 inch diameter)
were prepared and subjected to accelerated and normal (28-day 73°F) curing prior to UCS
testing. Resilient modulus testing was performed on three of the soils.
1.2 Pavement Design Practice with Lime-Stabilized Soils In recent years, CDOT pavement design has been aligned with the 1993 AASHTO Pavement
Design Guide approach. For unbound untreated subgrade soil, the flexible pavement design input
is resilient modulus (Mr). In CDOT practice, Mr is determined via correlation to R-value. The
combination of Mr, estimated traffic and design serviceability loss leads to a required structural
number (SN) of the subbase-base-asphalt concrete system. The SN is determined per Equation
3
(2) based on structural layer coefficients (ai), thickness (Di) and drainage coefficients (mi) of the
subbase, base and asphalt layers.
SN = a1D1 + a2D2m2 + a3D3m3 (2) Values of base and subbase ai are determined via empirical correlation to modulus E, Mr, R-
value or CBR. Per CDOT practice in Regions 1 and 6, when LSS is used, the stabilized layer
typically replaces the subbase and/or base layer and contributes to the SN via Equation (1). The
subgrade Mr used in design is then a reflection of the soil beneath the lime-stabilized layer. The
determination of ai for the LSS layer varies across CDOT regions. Region 1 determines ai based
on a correlation to 7-day UCS using Table 3.2 from the CDOT Pavement Design Manual. In
tracing the origin of Table 3.2, the 1993 AASHTO pavement design guide has a nomograph with
similar values relating 7-day UCS to ai for cement-treated and bituminous-treated bases. The
curing regime (temperature) or sample size for these 7-day UCS tests is not stated in the 2008
CDOT Pavement Design Manual or the 1993 AASHTO Design guide. Region 6 assumes the
minimum layer coefficient value per Table 3.2, i.e., ai = 0.11, and does not perform UCS testing.
Based on this value, Region 6 requires a minimum field UCS of 160 psi.
In rigid pavement design, a LSS layer beneath a PCC pavement is considered a base course in
CDOT design; a base course modulus (E) is used in design. The coefficient of subgrade reaction
(k-value) required for design is therefore a reflection of the unbound subgrade beneath the LSS
layer. Chapter 4 of the CDOT Pavement Design Guide does not specify a value of E for the base
nor does it specifically mention stabilized base materials. Section 4.7 of the CDOT Pavement
Design Guide suggests that the resilient modulus Mr of the base course should be determined and
used to represent the base course. Table S.11 of the CDOT Pavement Design Guide provides a
range of E (or Mr) values from 30-60 ksi for LSS, with a typical value of 45 ksi. For comparison,
the 1998 AASHTO pavement design guide supplement suggests a range of E values for LSS
bases of 20-70 ksi. The 2007 MEPDG provides a level 3 design E value for LSS of 45 ksi.
Regions 1 and 6 use design E = 45 ksi for LSS.
As CDOT transitions to mechanistic-empirical design, a synopsis of recommended practice
reflected in the 2007 Interim MEPDG is warranted. CDOT LSS design practice is consistent
4
with the 2007 Interim MEPDG in that LSS is considered as a separate structural layer. Under this
case, a LSS layer can be considered as a material that is insensitive to moisture and the resilient
modulus or stiffness can be held constant over time. Both resilient modulus and flexural strength
are important for LSS layer performance. The 2007 AASHTO Interim MEPDG recommends the
following design inputs for LSS, both for flexible and rigid pavement. Recall that AASHTO uses
the level system.
Level one (laboratory determined values): Mr determined via AASHTO T307 Flexural strength (AC only) determined via levels two or three Level two (correlation to UCS): Mr (ksi) = 0.124 UCS (psi) + 9.98 Flexural strength (AC only) = 0.2 UCS (from lab samples or cores) Level three (default values) Mr = 45 ksi
Flexural strength (AC only) = 0.2(UCS) where UCS = 250 psi for subbase, select or subgrade under flexible, or 750 psi for base layer.
1.3 Summary of Report Chapter 1 introduces the study, explains the objectives, and summarizes pavement design using
LSS. In Chapter 2, a detailed review of the literature on accelerated curing of LSS and on the
correlation between UCS and Mr is provided. The laboratory testing program and results are
presented in Chapter 3. Conclusions and recommendations are provided in Chapter 4.
5
CHAPTER 2: LITERATURE REVIEW 2.1 Accelerated Curing Protocols for Lime-Stabilized Soils This section summarizes the literature on accelerated curing protocols and their relationship to
producing UCS values that are equivalent to UCS from 28-day room temperature cured samples.
ASTM 5102-04 recommends curing at 73±4°F (23±2°C) and indicates that any curing period
may be specified (7, 28 and 90 day are listed as most common). ASTM 5102 notes that if
accelerated curing conditions are necessary, temperatures higher than 120°F (49°C) should be
avoided. ASTM 5102 also notes that a curing temperature of 105°F (40°C) does not introduce
additional pozzolanic reactive products that significantly differ than field conditions.
Of specific interest to CDOT practice is the nature and efficacy of the 5-day 100°F curing regime
recommended in the MGPEC pavement design manual and the 7-day 105°F (40°C) curing
regime recommended by the AASHTO 2007 interim MEPDG. The only documented source for
the 5-day 100°F curing regime is Little (1999), where it is recommended without support from
data, analysis or reference. Dr. Little does not recall the origin of the 5-day curing
recommendation (Little, personal communication, March 2008). Conversations with a number of
Colorado area geotechnical engineers suggest that the 5-day 100°F (38°C) curing came from the
LSS construction at Denver International Airport (DIA) in the early 1990s. Unfortunately, there
is no documentation or available data to support this approach. The 7-day 105°F (40°C) regime
recommended in the 2007 MEPDG can be traced to a National Lime Association (NLA)
recommendation per Little (2000). Dr. Little based this recommendation on a survey of the
accelerated curing literature (Little, personal communication, March 2008). The NLA also
recommends that samples should be sealed in plastic bags for the 7-day 105°F (40°C) curing
period, and that curing should be followed by a 24-hour capillary soak prior to UCS testing.
Biswas (1972) conducted an investigation with five A-7-6 soils mixed with optimal lime
concentration determined via Eades and Grim pH test (ASTM D 6276) to explore the effect of
time and temperature on UCS (summary of soils in Table 2-A). UCS testing was performed on
2.0 in. diameter by 4.0 in. tall samples prepared with equivalent standard Proctor compaction
energy. Three accelerated curing temperatures were investigated: 105°F (40°C), 122°F (50°C)
6
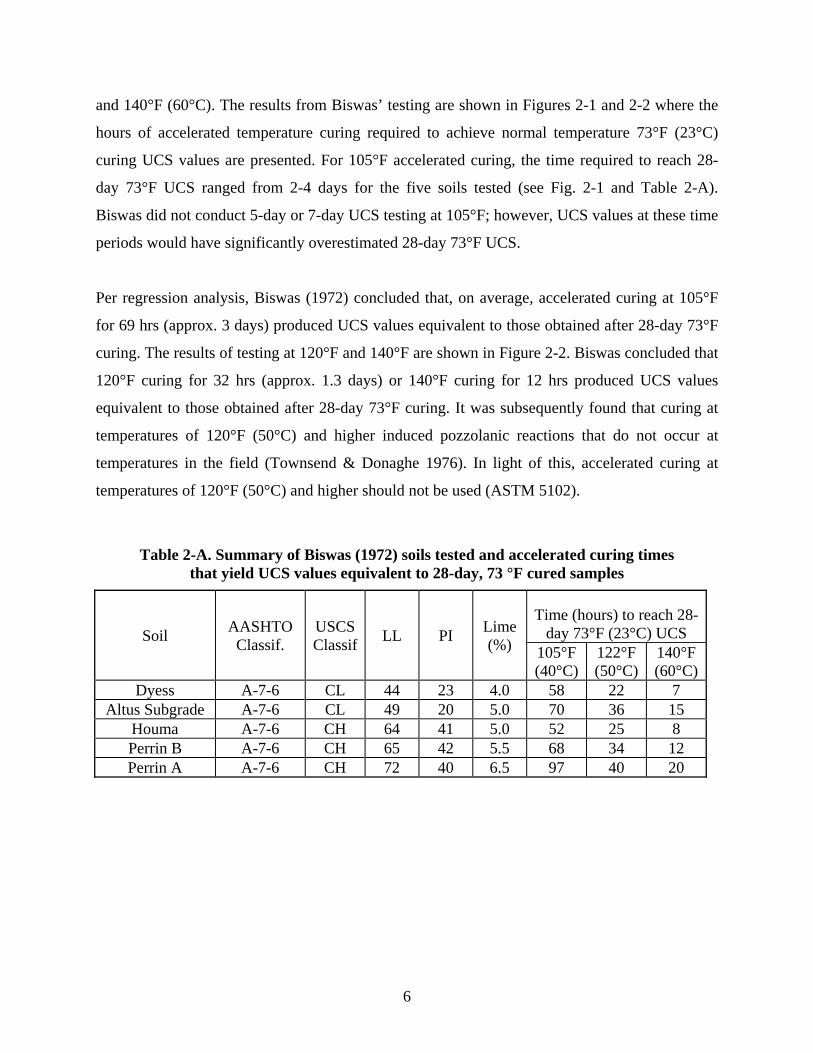
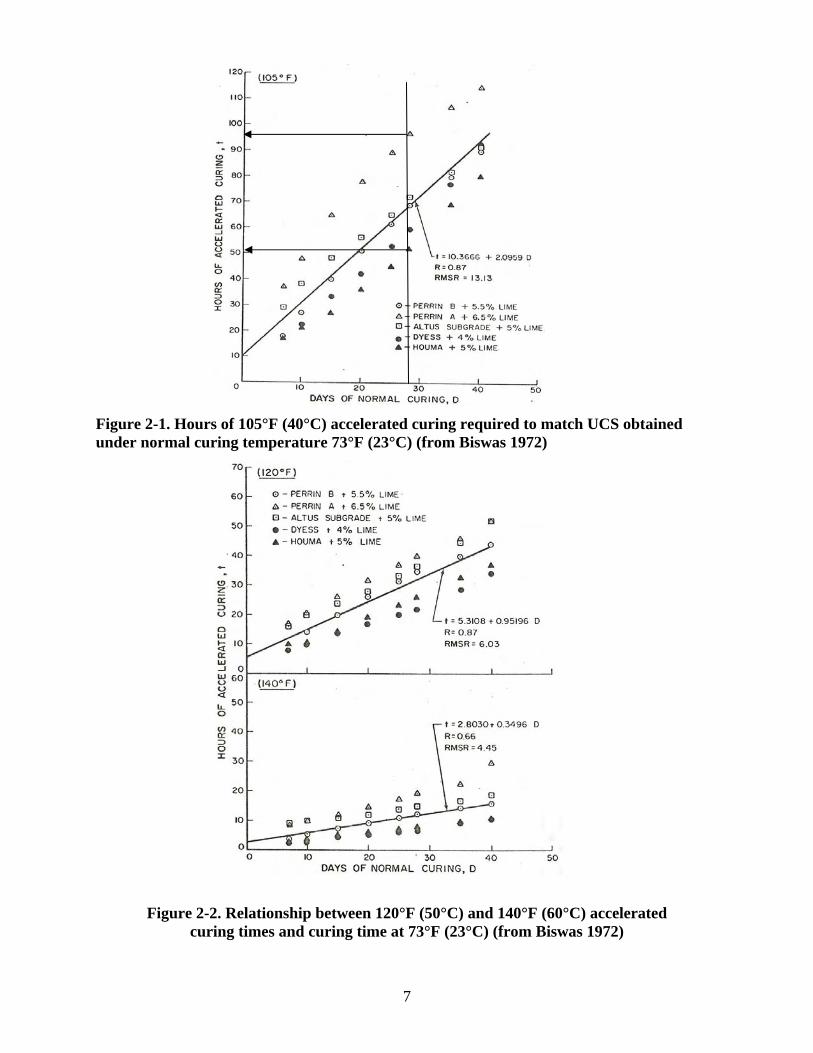
and 140°F (60°C). The results from Biswas’ testing are shown in Figures 2-1 and 2-2 where the
hours of accelerated temperature curing required to achieve normal temperature 73°F (23°C)
curing UCS values are presented. For 105°F accelerated curing, the time required to reach 28-
day 73°F UCS ranged from 2-4 days for the five soils tested (see Fig. 2-1 and Table 2-A).
Biswas did not conduct 5-day or 7-day UCS testing at 105°F; however, UCS values at these time
periods would have significantly overestimated 28-day 73°F UCS.
Per regression analysis, Biswas (1972) concluded that, on average, accelerated curing at 105°F
for 69 hrs (approx. 3 days) produced UCS values equivalent to those obtained after 28-day 73°F
curing. The results of testing at 120°F and 140°F are shown in Figure 2-2. Biswas concluded that
120°F curing for 32 hrs (approx. 1.3 days) or 140°F curing for 12 hrs produced UCS values
equivalent to those obtained after 28-day 73°F curing. It was subsequently found that curing at
temperatures of 120°F (50°C) and higher induced pozzolanic reactions that do not occur at
temperatures in the field (Townsend & Donaghe 1976). In light of this, accelerated curing at
temperatures of 120°F (50°C) and higher should not be used (ASTM 5102).
Table 2-A. Summary of Biswas (1972) soils tested and accelerated curing times that yield UCS values equivalent to 28-day, 73 °F cured samples
Soil AASHTO Classif.
USCS Classif LL PI Lime
(%)
Time (hours) to reach 28-day 73°F (23°C) UCS
105°F (40°C)
122°F (50°C)
140°F (60°C)
Dyess A-7-6 CL 44 23 4.0 58 22 7 Altus Subgrade A-7-6 CL 49 20 5.0 70 36 15
Houma A-7-6 CH 64 41 5.0 52 25 8 Perrin B A-7-6 CH 65 42 5.5 68 34 12 Perrin A A-7-6 CH 72 40 6.5 97 40 20
7
Figure 2-1. Hours of 105°F (40°C) accelerated curing required to match UCS obtained under normal curing temperature 73°F (23°C) (from Biswas 1972)
Figure 2-2. Relationship between 120°F (50°C) and 140°F (60°C) accelerated curing times and curing time at 73°F (23°C) (from Biswas 1972)
8
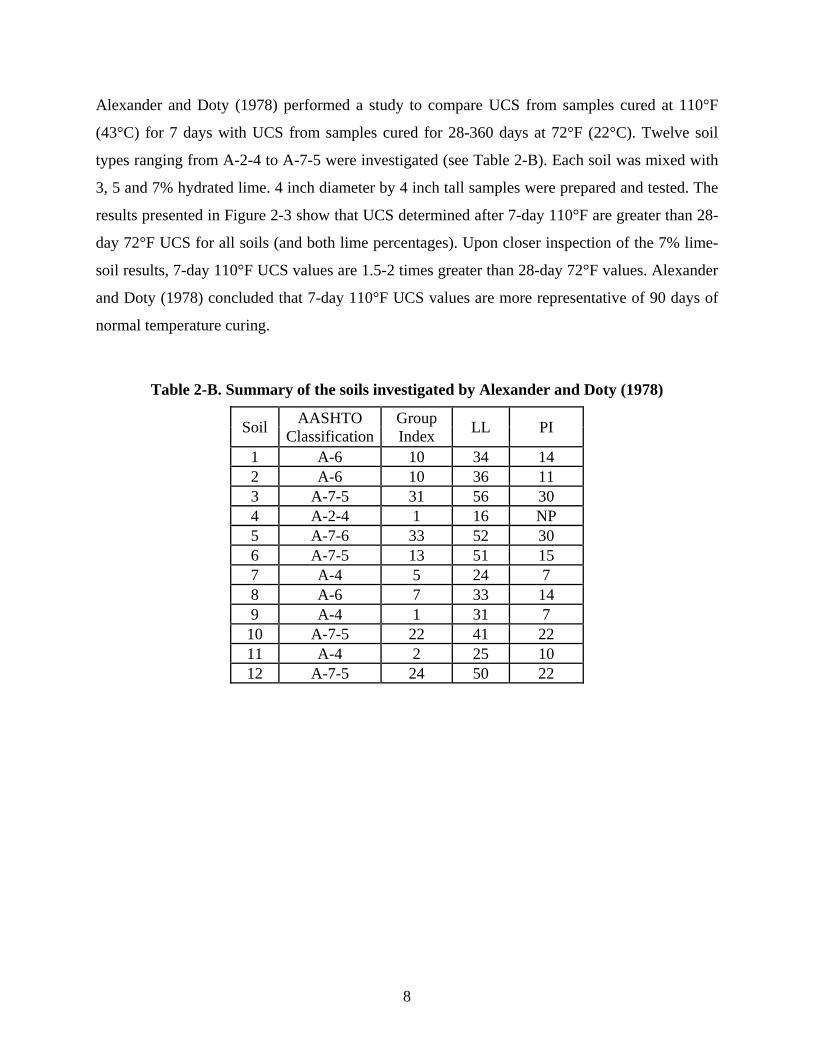
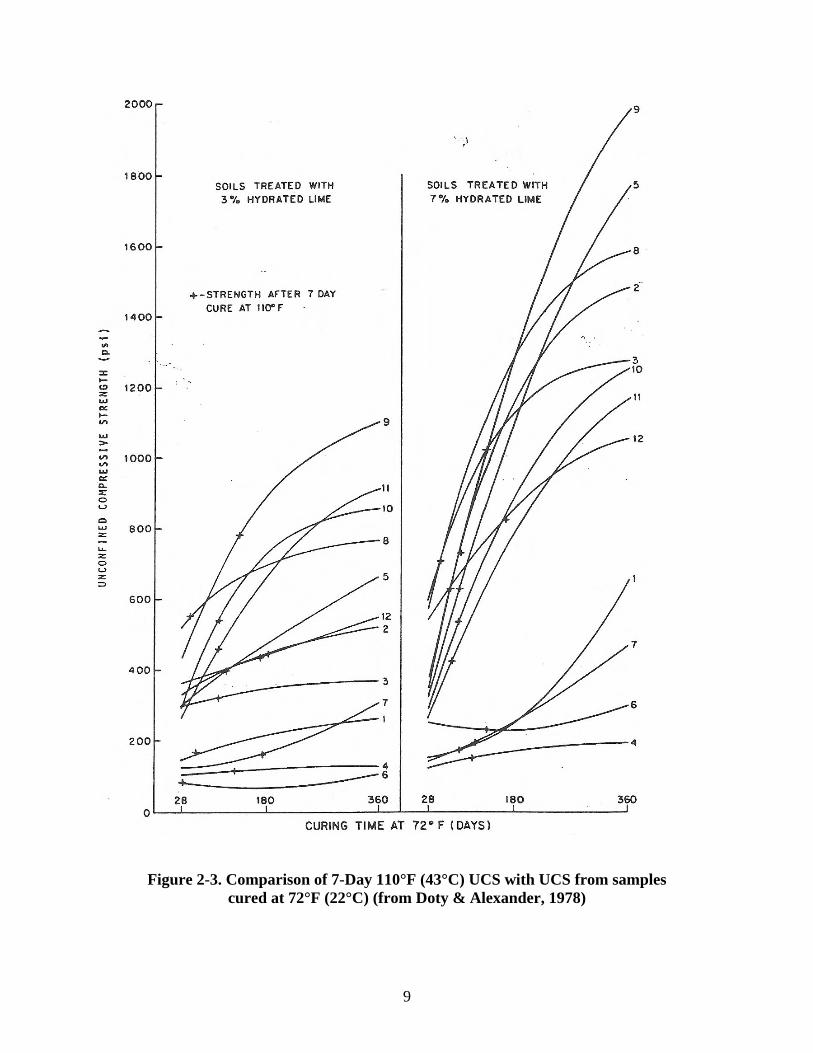
Alexander and Doty (1978) performed a study to compare UCS from samples cured at 110°F
(43°C) for 7 days with UCS from samples cured for 28-360 days at 72°F (22°C). Twelve soil
types ranging from A-2-4 to A-7-5 were investigated (see Table 2-B). Each soil was mixed with
3, 5 and 7% hydrated lime. 4 inch diameter by 4 inch tall samples were prepared and tested. The
results presented in Figure 2-3 show that UCS determined after 7-day 110°F are greater than 28-
day 72°F UCS for all soils (and both lime percentages). Upon closer inspection of the 7% lime-
soil results, 7-day 110°F UCS values are 1.5-2 times greater than 28-day 72°F values. Alexander
and Doty (1978) concluded that 7-day 110°F UCS values are more representative of 90 days of
normal temperature curing.
Table 2-B. Summary of the soils investigated by Alexander and Doty (1978)
Soil AASHTO Classification
Group Index LL PI
1 A-6 10 34 14 2 A-6 10 36 11 3 A-7-5 31 56 30 4 A-2-4 1 16 NP 5 A-7-6 33 52 30 6 A-7-5 13 51 15 7 A-4 5 24 7 8 A-6 7 33 14 9 A-4 1 31 7 10 A-7-5 22 41 22 11 A-4 2 25 10 12 A-7-5 24 50 22
9
Figure 2-3. Comparison of 7-Day 110°F (43°C) UCS with UCS from samples cured at 72°F (22°C) (from Doty & Alexander, 1978)
10
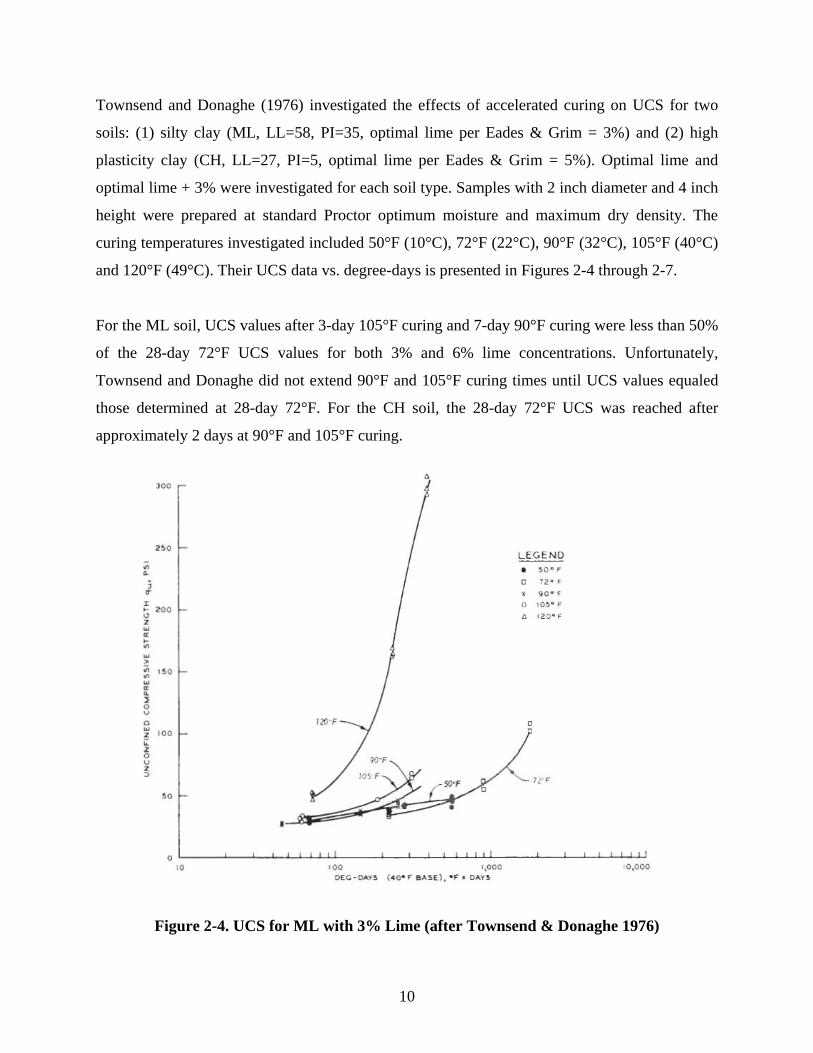
Townsend and Donaghe (1976) investigated the effects of accelerated curing on UCS for two
soils: (1) silty clay (ML, LL=58, PI=35, optimal lime per Eades & Grim = 3%) and (2) high
plasticity clay (CH, LL=27, PI=5, optimal lime per Eades & Grim = 5%). Optimal lime and
optimal lime + 3% were investigated for each soil type. Samples with 2 inch diameter and 4 inch
height were prepared at standard Proctor optimum moisture and maximum dry density. The
curing temperatures investigated included 50°F (10°C), 72°F (22°C), 90°F (32°C), 105°F (40°C)
and 120°F (49°C). Their UCS data vs. degree-days is presented in Figures 2-4 through 2-7.
For the ML soil, UCS values after 3-day 105°F curing and 7-day 90°F curing were less than 50%
of the 28-day 72°F UCS values for both 3% and 6% lime concentrations. Unfortunately,
Townsend and Donaghe did not extend 90°F and 105°F curing times until UCS values equaled
those determined at 28-day 72°F. For the CH soil, the 28-day 72°F UCS was reached after
approximately 2 days at 90°F and 105°F curing.
Figure 2-4. UCS for ML with 3% Lime (after Townsend & Donaghe 1976)

11
Figure 2-5. UCS for ML with 6% Lime (after Townsend & Donaghe 1976)
Figure 2-6. UCS for CH with 5% Lime (after Townsend & Donaghe 1976)
12
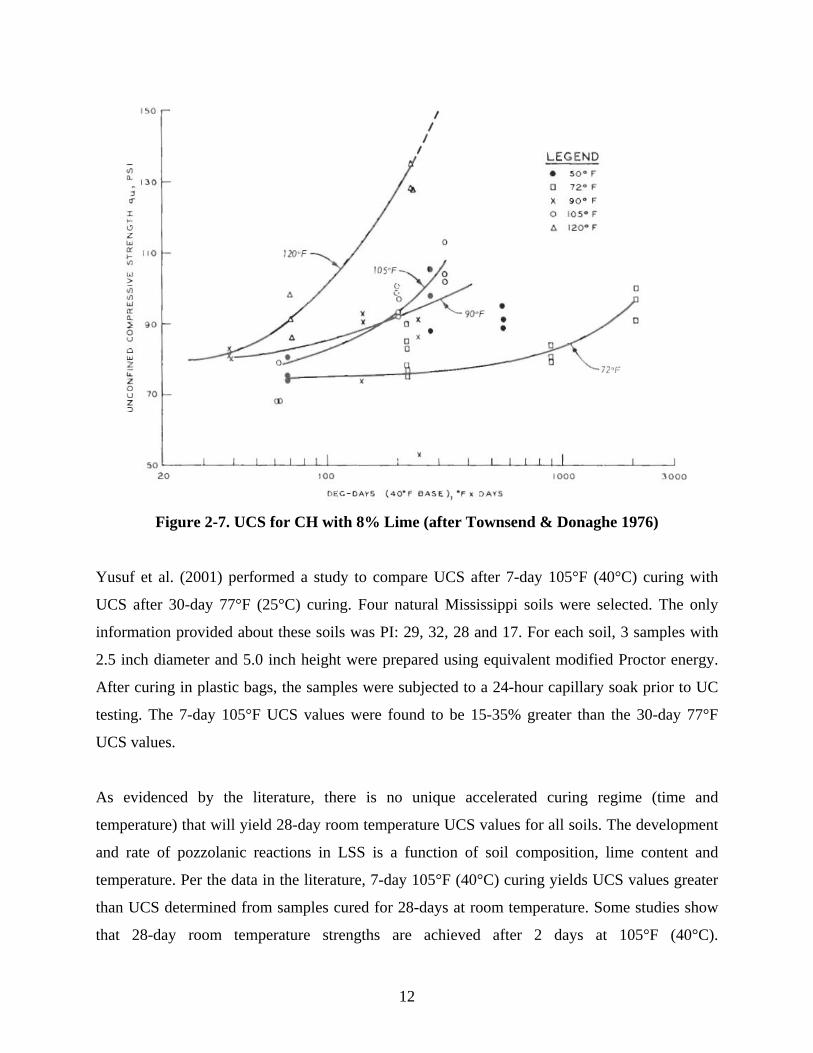
Figure 2-7. UCS for CH with 8% Lime (after Townsend & Donaghe 1976)
Yusuf et al. (2001) performed a study to compare UCS after 7-day 105°F (40°C) curing with
UCS after 30-day 77°F (25°C) curing. Four natural Mississippi soils were selected. The only
information provided about these soils was PI: 29, 32, 28 and 17. For each soil, 3 samples with
2.5 inch diameter and 5.0 inch height were prepared using equivalent modified Proctor energy.
After curing in plastic bags, the samples were subjected to a 24-hour capillary soak prior to UC
testing. The 7-day 105°F UCS values were found to be 15-35% greater than the 30-day 77°F
UCS values.
As evidenced by the literature, there is no unique accelerated curing regime (time and
temperature) that will yield 28-day room temperature UCS values for all soils. The development
and rate of pozzolanic reactions in LSS is a function of soil composition, lime content and
temperature. Per the data in the literature, 7-day 105°F (40°C) curing yields UCS values greater
than UCS determined from samples cured for 28-days at room temperature. Some studies show
that 28-day room temperature strengths are achieved after 2 days at 105°F (40°C).

13
2.2 Correlation between Resilient Modulus and UCS
The 2007 Interim M-E Pavement Design Guide (Table 25, p. 122) and Mallela et al. (2004)
indicate that the design Mr for lime-stabilized subgrade can be approximated from the results of
UCS tests using Equation (1).
Mr (ksi) = 0.124 UCS (psi) + 9.98 [(1) re-stated]
Mallela et al. (2004) cites Thompson (1966) as the source of Equation (1) and indicates that the
design Mr and UCS values should be based on testing of 28-day room temperature cured
strengths in accordance with ASTM D5102. Mallela et al. (2004) states that 7-day, 104°F (40°C)
curing can be used and is representative of the 28-day curing at “room temperature.”
Equation (1) was developed by Thompson (1966) from unconsolidated undrained triaxial
compression testing of 2.0 inch diameter by 4.0 inch tall remolded LSS samples. Samples from
four different soil types (see Table 2-C) were compacted into 2.0 inch diameter molds using an
equivalent standard Proctor energy (3 layers, 20 blows/layer of 4.0 lbf hammer). Samples were
cured at 120°F (49°C) within sealed metal cans for periods of 1, 2, 4 and 6 days. Regarding the
curing regime, Thompson refers to Anday (1963) and states “these curing conditions produce
strengths that are comparable to those developed under field curing conditions.” Confinement
was applied (0, 5, 15 or 35 psi) and the samples were axially compressed at a rate of 0.05 in/min.
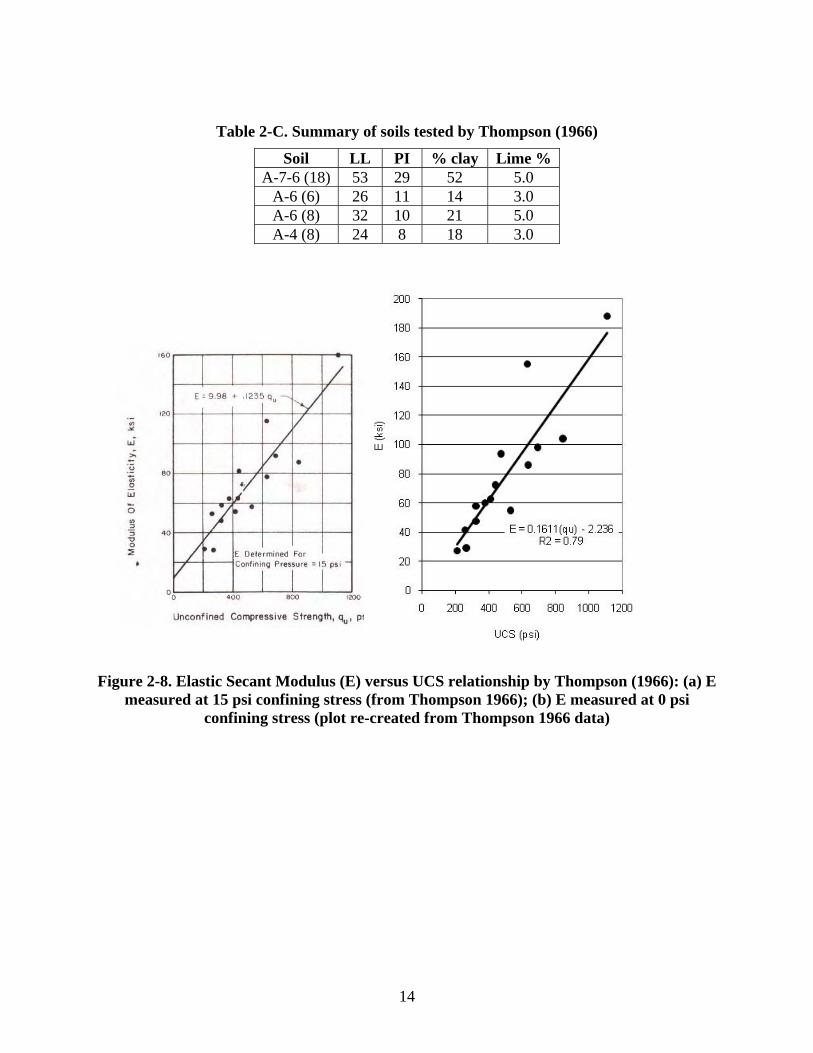
The data used to derive Equation (1) are shown in Figure 2-8(a). These data show the UCS
values (from samples tested at 0 psi confining stress) plotted against elastic modulus (E) values
from samples tested at 15 psi confining stress. E values were determined as the secant modulus
at approximately 0.7-0.8 of the UCS. A confining stress = 15 psi is considerably higher than the
2, 4 and 6 psi used in AASHTO T307 for subgrade soils. For posterity, the UCS vs. E
relationship from 0 psi confining stress is shown in Figure 3.8b. The relationship is mildly
different and indicates that for these LSS, confining stress had little effect on the sample
stiffness.
14
Table 2-C. Summary of soils tested by Thompson (1966)
Soil LL PI % clay Lime %A-7-6 (18) 53 29 52 5.0
A-6 (6) 26 11 14 3.0 A-6 (8) 32 10 21 5.0 A-4 (8) 24 8 18 3.0
Figure 2-8. Elastic Secant Modulus (E) versus UCS relationship by Thompson (1966): (a) E measured at 15 psi confining stress (from Thompson 1966); (b) E measured at 0 psi
confining stress (plot re-created from Thompson 1966 data)
15
Thompson’s relationship (Equation 1) was derived based on samples with height to diameter
ratios of 2 to 1. Per ASTM D 5102, height to diameter ratios of 2 to 1 provide the standard
measure of compressive strength. UCS testing is permitted on traditional Proctor mold samples
(4 inch diameter by 4.5 inch tall) per ASTM D 5102 Method B; however, Proctor mold UCS
values may be different than those from 2:1 height to diameter ratio samples, and should not
necessarily be used interchangeably.
In addition, Equation (1) was developed based on the results of static triaxial tests. Resilient
modulus testing is dynamic, and the Mr values are dynamic moduli. Research has shown that Mr
values can be 5-10 times greater than statically determined E values. Finally, Mr is the ratio of
deviator stress to resilient or recoverable strain. The E values used to derive Equation (1) were
determined from an initial secant modulus using a stress level at 0.7-0.8 peak strength. Stress-
strain plots from UCS tests tend to become nonlinear at stress levels above 0.5 UCS (Yusuf et al.
2001), with some strains being non-recoverable.
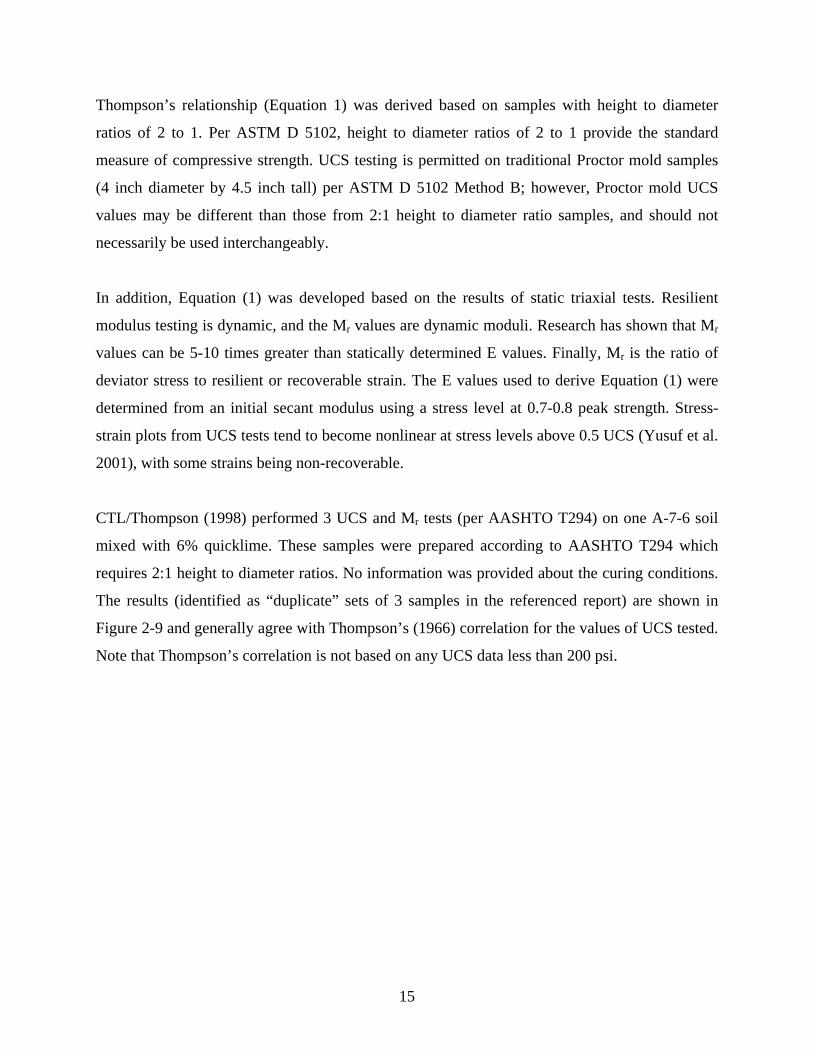
CTL/Thompson (1998) performed 3 UCS and Mr tests (per AASHTO T294) on one A-7-6 soil
mixed with 6% quicklime. These samples were prepared according to AASHTO T294 which
requires 2:1 height to diameter ratios. No information was provided about the curing conditions.
The results (identified as “duplicate” sets of 3 samples in the referenced report) are shown in
Figure 2-9 and generally agree with Thompson’s (1966) correlation for the values of UCS tested.
Note that Thompson’s correlation is not based on any UCS data less than 200 psi.
16
Figure 2-9. Results of limited testing by CTL/Thompson (1998) corroborate Equation (1). Note that Thompson’s correlation is incorrectly referenced in this Figure from
CTL/Thompson (1998) as Dallas Little’s equation
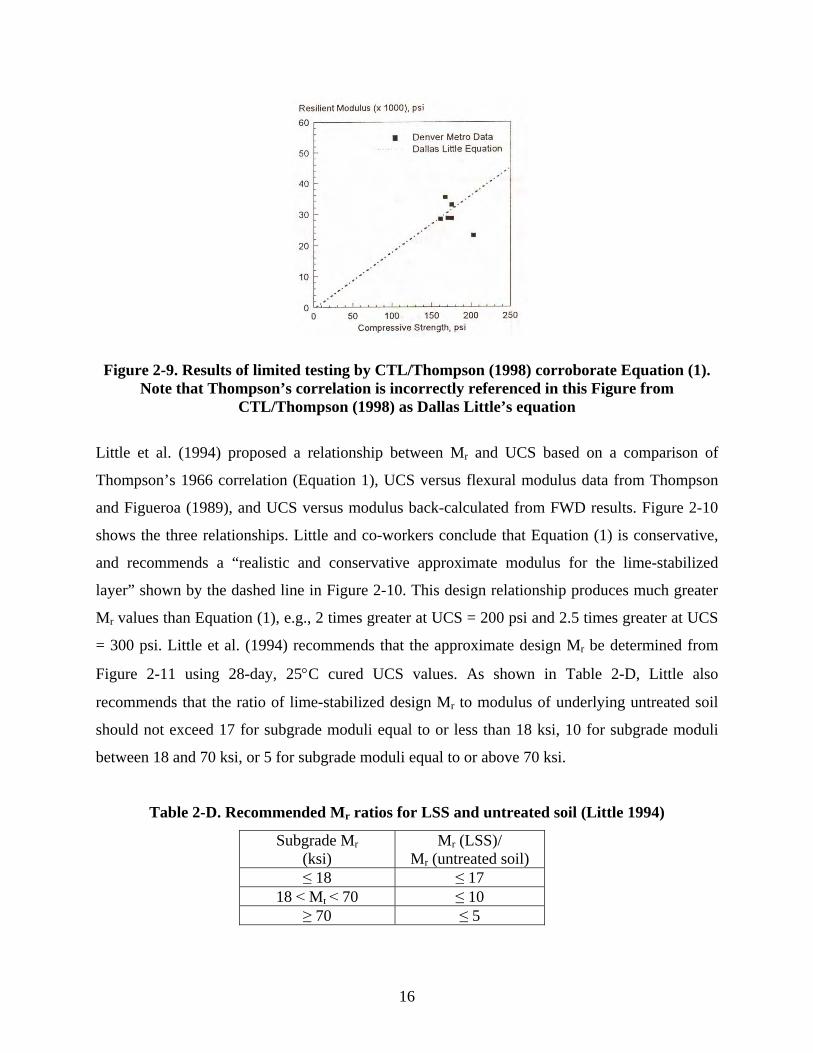
Little et al. (1994) proposed a relationship between Mr and UCS based on a comparison of
Thompson’s 1966 correlation (Equation 1), UCS versus flexural modulus data from Thompson
and Figueroa (1989), and UCS versus modulus back-calculated from FWD results. Figure 2-10
shows the three relationships. Little and co-workers conclude that Equation (1) is conservative,
and recommends a “realistic and conservative approximate modulus for the lime-stabilized
layer” shown by the dashed line in Figure 2-10. This design relationship produces much greater
Mr values than Equation (1), e.g., 2 times greater at UCS = 200 psi and 2.5 times greater at UCS
= 300 psi. Little et al. (1994) recommends that the approximate design Mr be determined from
Figure 2-11 using 28-day, 25°C cured UCS values. As shown in Table 2-D, Little also
recommends that the ratio of lime-stabilized design Mr to modulus of underlying untreated soil
should not exceed 17 for subgrade moduli equal to or less than 18 ksi, 10 for subgrade moduli
between 18 and 70 ksi, or 5 for subgrade moduli equal to or above 70 ksi.
Table 2-D. Recommended Mr ratios for LSS and untreated soil (Little 1994)
Subgrade Mr (ksi)
Mr (LSS)/ Mr (untreated soil)
≤ 18 ≤ 17 18 ˂ Mr ˂ 70 ≤ 10
≥ 70 ≤ 5
17
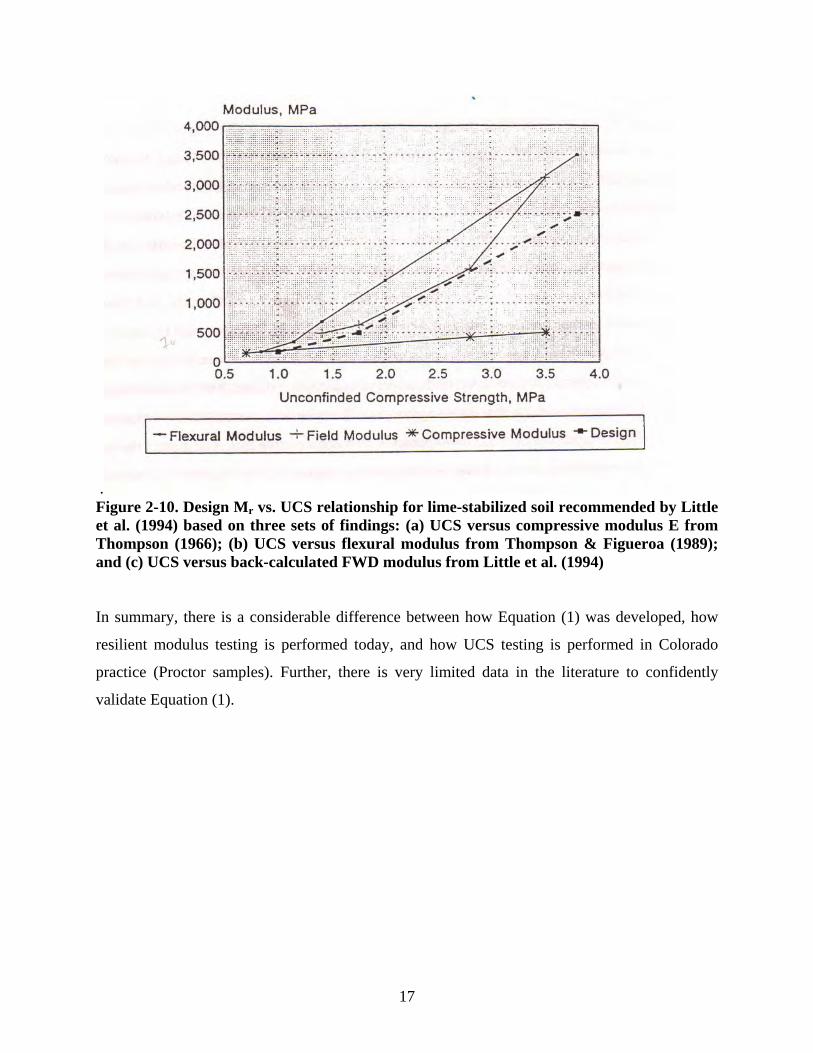
. Figure 2-10. Design Mr vs. UCS relationship for lime-stabilized soil recommended by Little et al. (1994) based on three sets of findings: (a) UCS versus compressive modulus E from Thompson (1966); (b) UCS versus flexural modulus from Thompson & Figueroa (1989); and (c) UCS versus back-calculated FWD modulus from Little et al. (1994) In summary, there is a considerable difference between how Equation (1) was developed, how
resilient modulus testing is performed today, and how UCS testing is performed in Colorado
practice (Proctor samples). Further, there is very limited data in the literature to confidently
validate Equation (1).
18
CHAPTER 3: TEST PROGRAM AND RESULTS 3.1 Test Program 3.1.1 Soils and Lime Treatment Six soils from the Denver metropolitan area with plasticity indexes (PI) ranging from 13 to 37
were selected for laboratory testing. The key characteristics of the untreated (natural) soils
selected for testing are summarized in Table 3-A. Soils were homogenized and processed over
the ASTM No. 4 sieve (0.187 in.) prior to specimen preparation. The AASHTO classifications
provided in Table 3-A reflect minus No. 4 material. Soil 1 was collected after lime treatment,
mixing, 48 hours of mellowing and re-mixing (with additional moisture conditioning to achieve
wopt) in the field (see Fig. 3-1). Soil 1 was processed on the No. 4 sieve following field lime
treatment and prior to specimen preparation. Moisture content was not altered from field
conditions. Test specimens were prepared using standard Proctor energy in accordance with
ASTM D698. Sampling the field-prepared lime-treated soil is the standard industry practice for
QC/QA UCS testing. This practice was not followed for soils 2 through 6 because lime-
stabilization projects were not available during the project timeline. Soils 2 through 6 were
sampled from various field sites (Table 3-A), processed over the No. 4 sieve, and lime-treated in
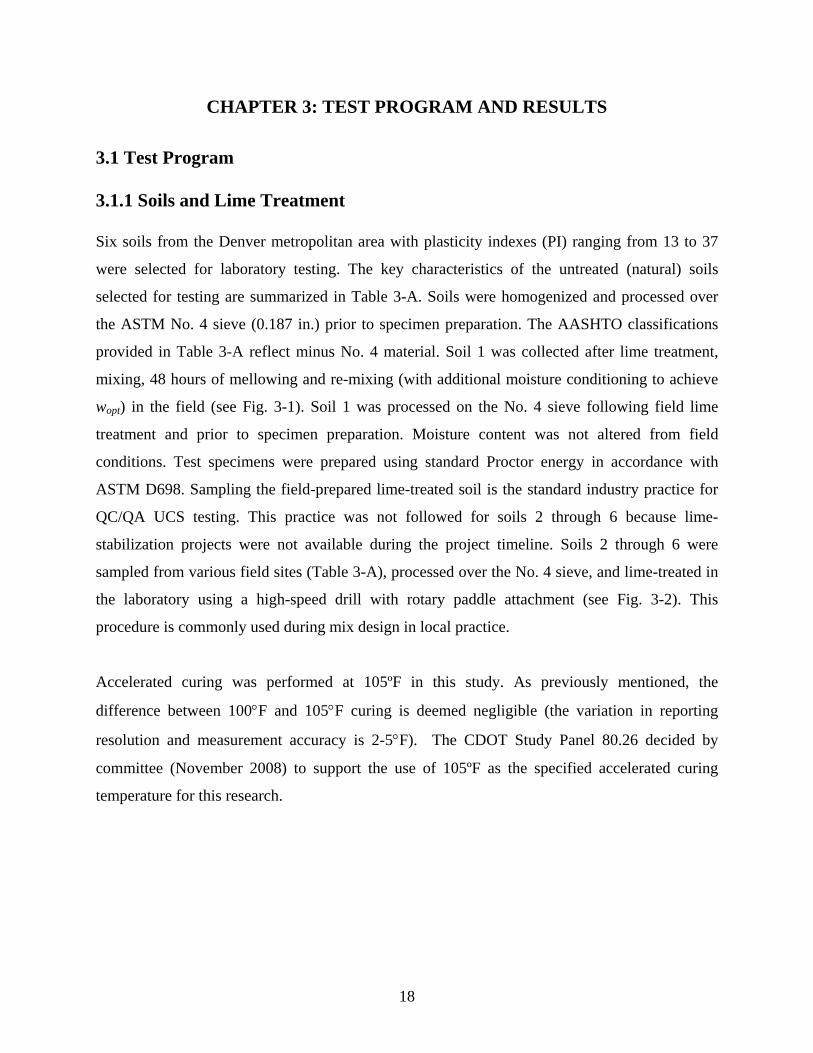
the laboratory using a high-speed drill with rotary paddle attachment (see Fig. 3-2). This
procedure is commonly used during mix design in local practice.
Accelerated curing was performed at 105ºF in this study. As previously mentioned, the
difference between 100°F and 105°F curing is deemed negligible (the variation in reporting
resolution and measurement accuracy is 2-5°F). The CDOT Study Panel 80.26 decided by
committee (November 2008) to support the use of 105ºF as the specified accelerated curing
temperature for this research.

19
Table 3-A. Summary of soils investigated
Untreated Soil Treated Soil
Soil Locationd AASHTO Classification
% Clay
% Silt LLc PLc PIc wopt
(%) γd(max) (pcf)
1a C470 & Alameda A-6 8 29 39 26 13 28 93
2b 98th & Sheridan A-6 28 35 39 15 24 25 94
3b 98th & Sheridan A-7-6 29 50 41 15 26 26 94
4 b University & County
Line A-7-6 29 19 55 18 37 29 87
5 b I-25 & Douglas A-6 12 41 33 16 17 19 105
6 b 98th & Sheridan A-7-6 15 58 43 15 29 25 97
aField mixed with 6 % lime. bLab mixed with 6 % lime. cLL=Liquid Limit, PL=Plastic Limit, PI=Plastic Index dAll locations in Denver metropolitan area in Colorado
Figure 3-1. Final field mixing of lime-treated soil 1
20
Figure 3-2. Laboratory mixing used for lime-treated soils 2 through 6
The processing for soils 2, 3 and 4 is differed from that used on soils 5 and 6. For soils 2, 3 and
4, small aggregations of clay particles were broken using a mortar and pestle, and then re-sieved.
Moisture was added during initial mixing and final mixing to achieve wopt. Soils 5 and 6 were
received in an air-dried state and contained a much greater portion of clay clods requiring
additional processing to a degree beyond that observed in typical practice. Prior to laboratory
lime treating, soils 5 and 6 were mechanically processed using a Bico Braun Chipmunk Rock
Crusher. Moisture was added gradually over a 10-day period to ensure uniform distribution prior
to sieve processing. Similar to soils 2, 3 and 4, soils 5 and 6 were initially mixed with lime and
moisture, mellowed for 48 hours, and final mixed with additional moisture to achieve wopt and
maximum dry unit weight γd(max) (determined per ASTM D698). The lime content for each of
these six soils was 6% by dry mass, consistent with Colorado practice.
3.1.2 Specimen Preparation Both 4.0 in. diameter × 4.5 in. tall Proctor specimens and 4.0 in. diameter × 8.0 in. tall specimens
were prepared and cured for UCS testing (see Fig. 3-3) and for resilient modulus testing (4.0 in.
× 8.0 in. specimens only). The 4.0 in. × 4.5 in. samples were prepared using standard Proctor
energy in accordance with ASTM D698 (i.e., 3 layers, 25 hammer blows per layer). The 4.0 in. ×
8.0 in. specimens were prepared to similar w = wopt and γd = γd(max) conditions using a procedure
21
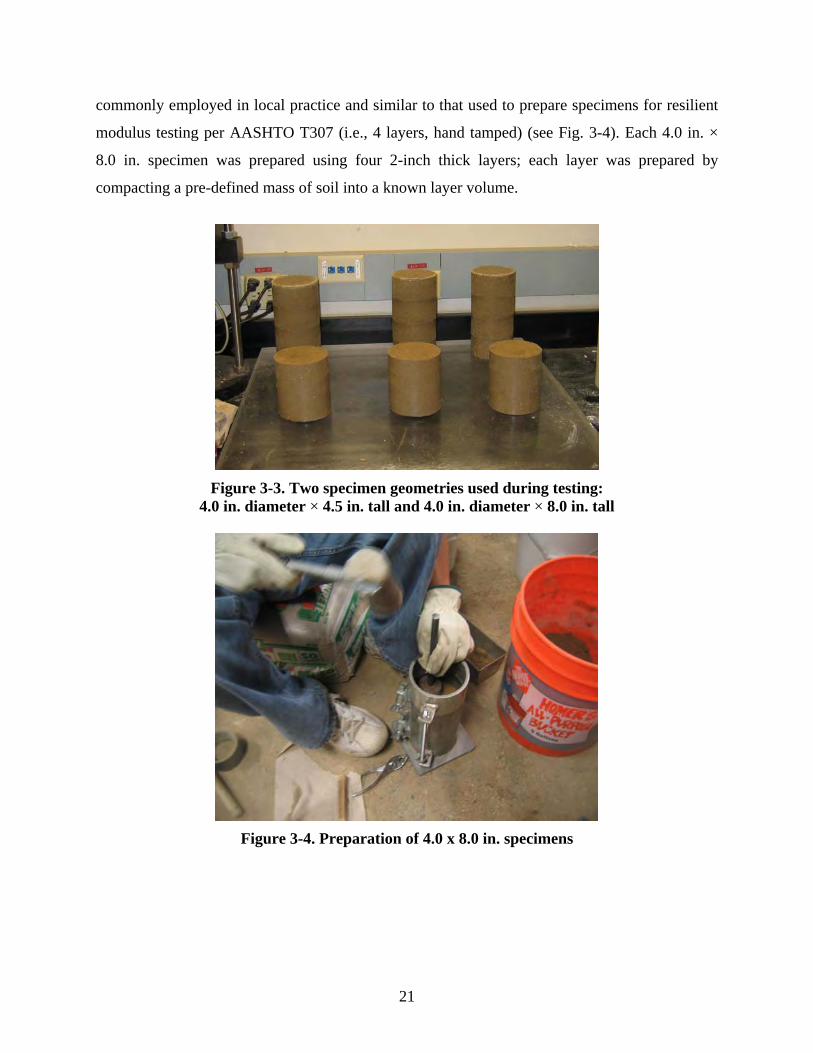
commonly employed in local practice and similar to that used to prepare specimens for resilient
modulus testing per AASHTO T307 (i.e., 4 layers, hand tamped) (see Fig. 3-4). Each 4.0 in. ×
8.0 in. specimen was prepared using four 2-inch thick layers; each layer was prepared by
compacting a pre-defined mass of soil into a known layer volume.
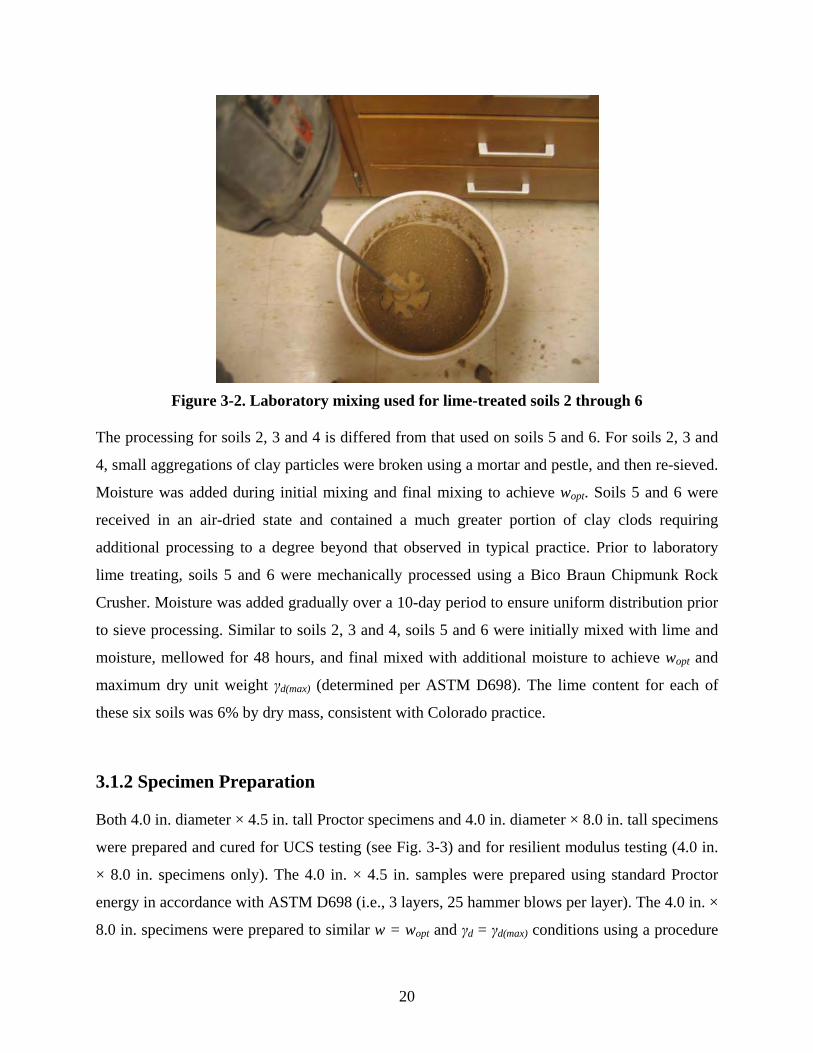
Figure 3-3. Two specimen geometries used during testing:
4.0 in. diameter × 4.5 in. tall and 4.0 in. diameter × 8.0 in. tall
Figure 3-4. Preparation of 4.0 x 8.0 in. specimens
22
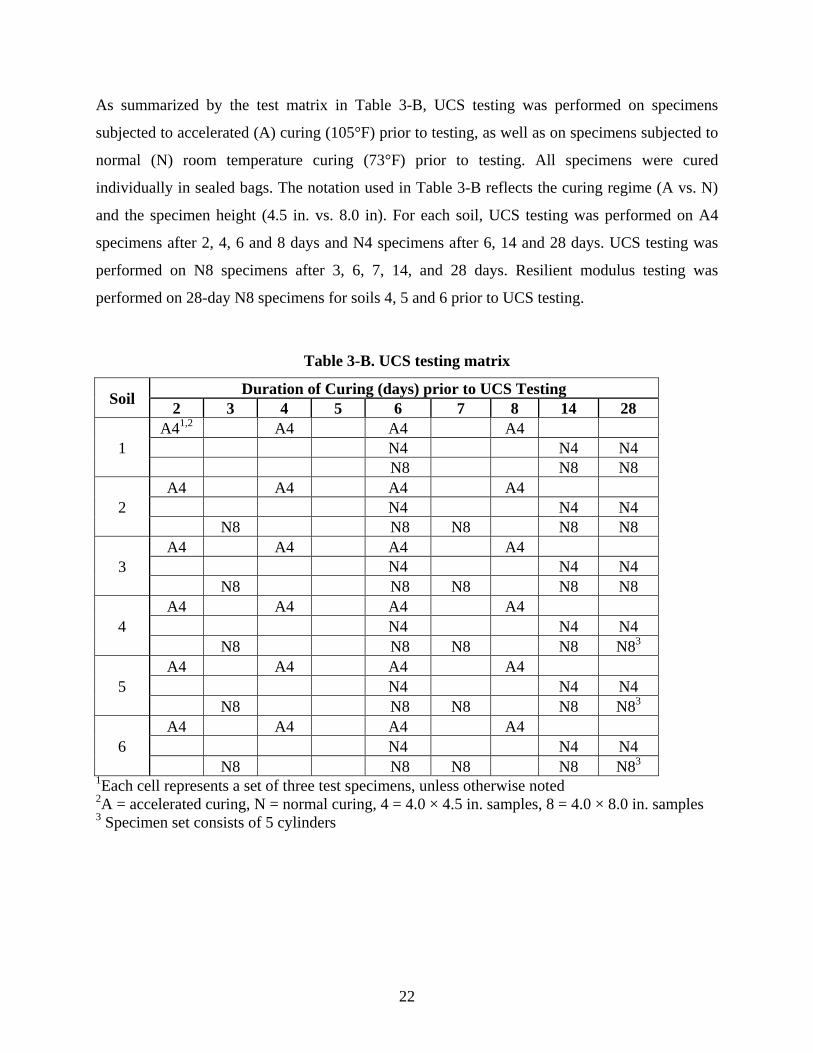
As summarized by the test matrix in Table 3-B, UCS testing was performed on specimens
subjected to accelerated (A) curing (105°F) prior to testing, as well as on specimens subjected to
normal (N) room temperature curing (73°F) prior to testing. All specimens were cured
individually in sealed bags. The notation used in Table 3-B reflects the curing regime (A vs. N)
and the specimen height (4.5 in. vs. 8.0 in). For each soil, UCS testing was performed on A4
specimens after 2, 4, 6 and 8 days and N4 specimens after 6, 14 and 28 days. UCS testing was
performed on N8 specimens after 3, 6, 7, 14, and 28 days. Resilient modulus testing was
performed on 28-day N8 specimens for soils 4, 5 and 6 prior to UCS testing.
Table 3-B. UCS testing matrix
Soil Duration of Curing (days) prior to UCS Testing 2 3 4 5 6 7 8 14 28
1 A41,2 A4 A4 A4
N4 N4 N4 N8 N8 N8
2 A4 A4 A4 A4 N4 N4 N4 N8 N8 N8 N8 N8
3 A4 A4 A4 A4 N4 N4 N4 N8 N8 N8 N8 N8
4 A4 A4 A4 A4 N4 N4 N4 N8 N8 N8 N8 N83
5 A4 A4 A4 A4 N4 N4 N4 N8 N8 N8 N8 N83
6 A4 A4 A4 A4 N4 N4 N4 N8 N8 N8 N8 N83
1Each cell represents a set of three test specimens, unless otherwise noted 2A = accelerated curing, N = normal curing, 4 = 4.0 × 4.5 in. samples, 8 = 4.0 × 8.0 in. samples 3 Specimen set consists of 5 cylinders
23
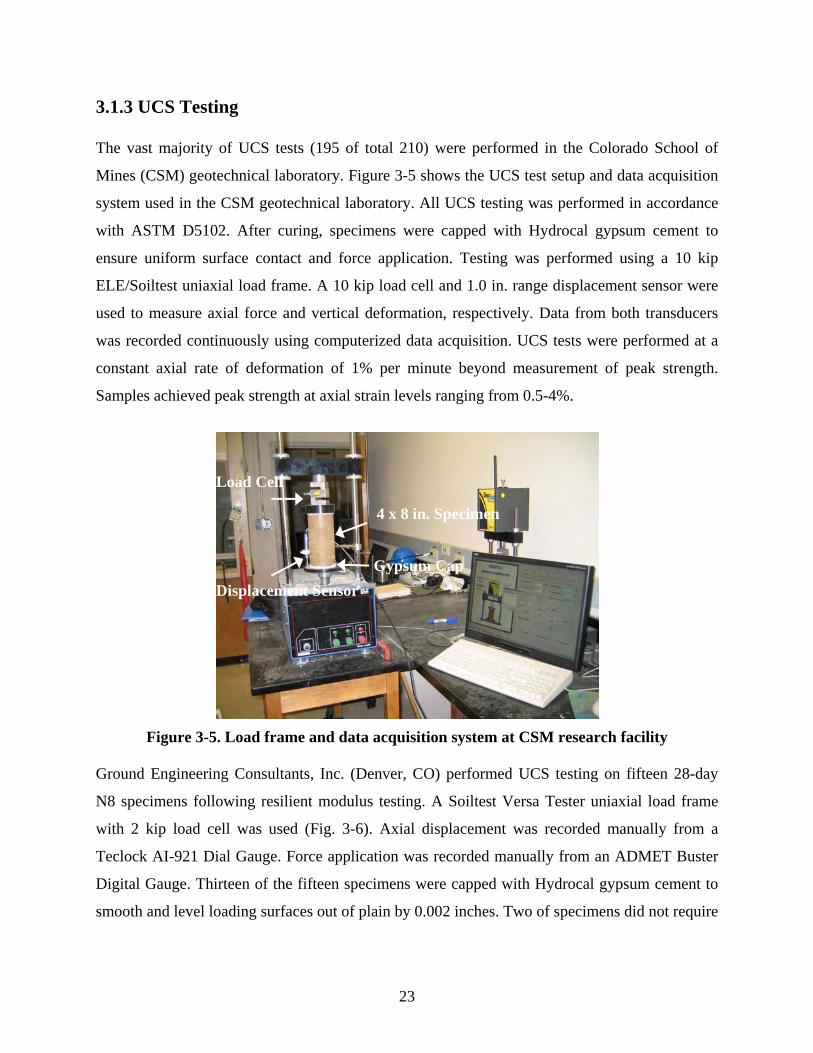
3.1.3 UCS Testing The vast majority of UCS tests (195 of total 210) were performed in the Colorado School of
Mines (CSM) geotechnical laboratory. Figure 3-5 shows the UCS test setup and data acquisition
system used in the CSM geotechnical laboratory. All UCS testing was performed in accordance
with ASTM D5102. After curing, specimens were capped with Hydrocal gypsum cement to
ensure uniform surface contact and force application. Testing was performed using a 10 kip
ELE/Soiltest uniaxial load frame. A 10 kip load cell and 1.0 in. range displacement sensor were
used to measure axial force and vertical deformation, respectively. Data from both transducers
was recorded continuously using computerized data acquisition. UCS tests were performed at a
constant axial rate of deformation of 1% per minute beyond measurement of peak strength.
Samples achieved peak strength at axial strain levels ranging from 0.5-4%.
Figure 3-5. Load frame and data acquisition system at CSM research facility
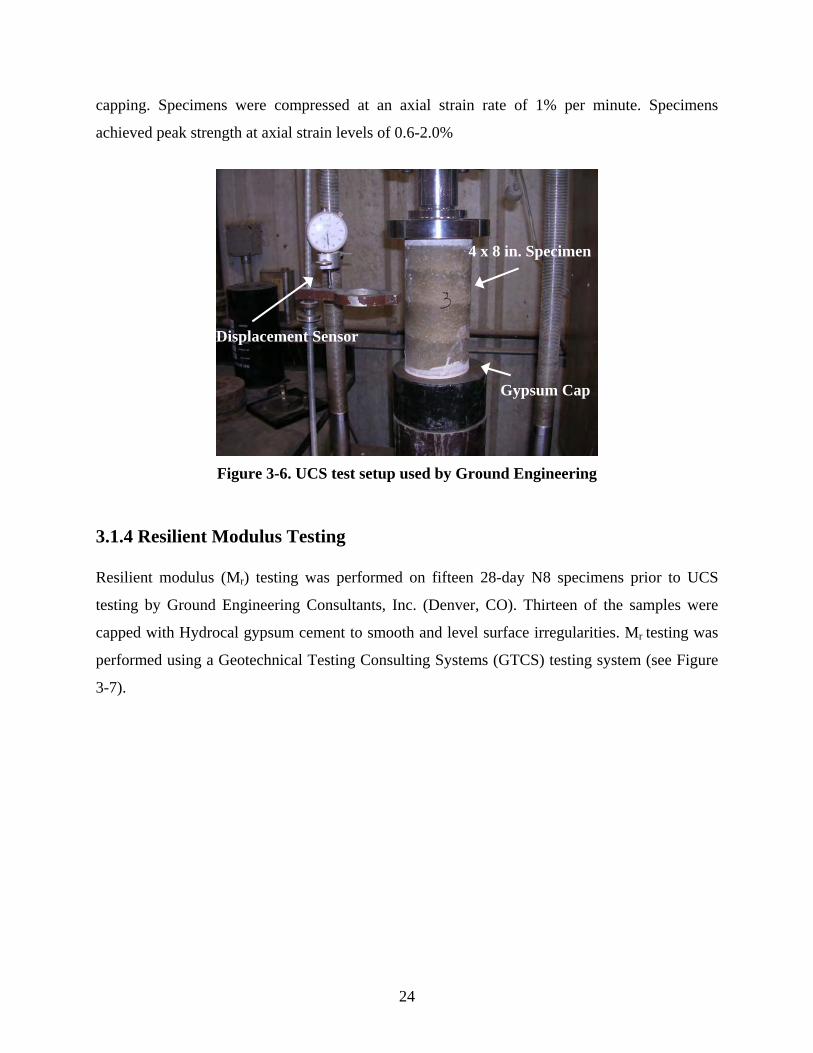
Ground Engineering Consultants, Inc. (Denver, CO) performed UCS testing on fifteen 28-day
N8 specimens following resilient modulus testing. A Soiltest Versa Tester uniaxial load frame
with 2 kip load cell was used (Fig. 3-6). Axial displacement was recorded manually from a
Teclock AI-921 Dial Gauge. Force application was recorded manually from an ADMET Buster
Digital Gauge. Thirteen of the fifteen specimens were capped with Hydrocal gypsum cement to
smooth and level loading surfaces out of plain by 0.002 inches. Two of specimens did not require
Gypsum Cap
4 x 8 in. Specimen
Displacement Sensor
Load Cell
24
capping. Specimens were compressed at an axial strain rate of 1% per minute. Specimens
achieved peak strength at axial strain levels of 0.6-2.0%
Figure 3-6. UCS test setup used by Ground Engineering
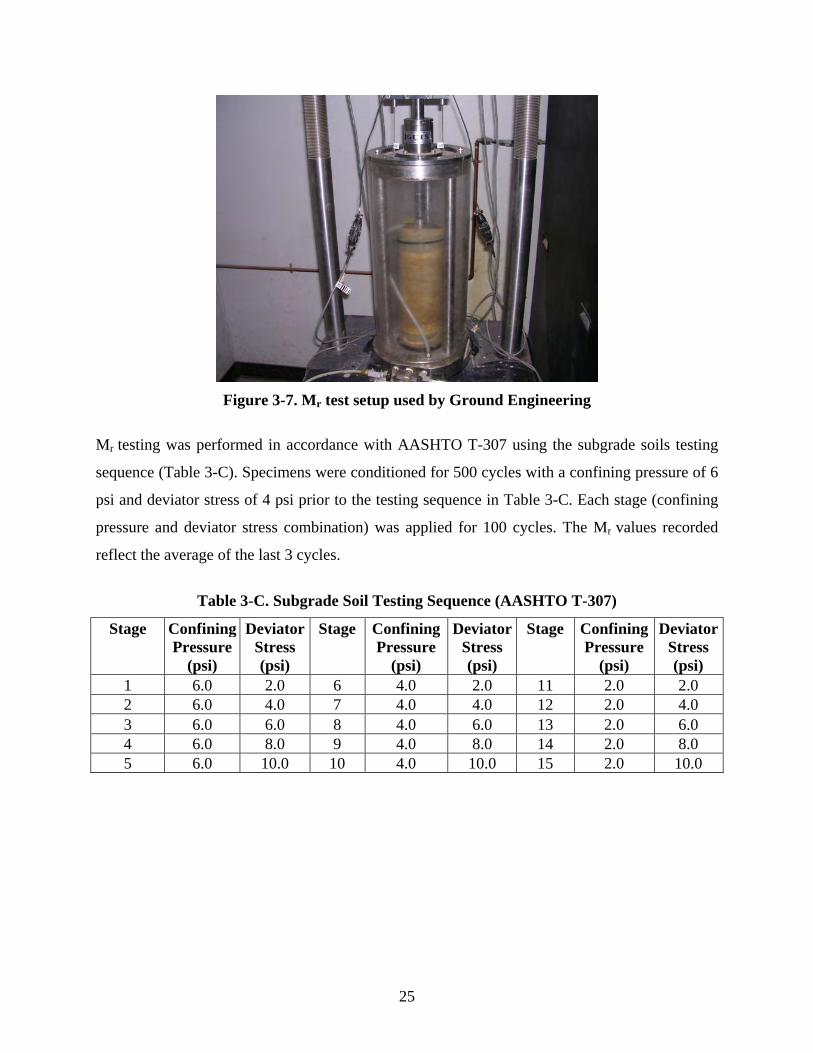
3.1.4 Resilient Modulus Testing Resilient modulus (Mr) testing was performed on fifteen 28-day N8 specimens prior to UCS
testing by Ground Engineering Consultants, Inc. (Denver, CO). Thirteen of the samples were
capped with Hydrocal gypsum cement to smooth and level surface irregularities. Mr testing was
performed using a Geotechnical Testing Consulting Systems (GTCS) testing system (see Figure
3-7).
4 x 8 in. Specimen
Gypsum Cap
Displacement Sensor
25
Figure 3-7. Mr test setup used by Ground Engineering
Mr testing was performed in accordance with AASHTO T-307 using the subgrade soils testing
sequence (Table 3-C). Specimens were conditioned for 500 cycles with a confining pressure of 6
psi and deviator stress of 4 psi prior to the testing sequence in Table 3-C. Each stage (confining
pressure and deviator stress combination) was applied for 100 cycles. The Mr values recorded
reflect the average of the last 3 cycles.
Table 3-C. Subgrade Soil Testing Sequence (AASHTO T-307)
Stage Confining Pressure
(psi)
Deviator Stress (psi)
Stage Confining Pressure
(psi)
Deviator Stress (psi)
Stage Confining Pressure
(psi)
Deviator Stress (psi)
1 6.0 2.0 6 4.0 2.0 11 2.0 2.0 2 6.0 4.0 7 4.0 4.0 12 2.0 4.0 3 6.0 6.0 8 4.0 6.0 13 2.0 6.0 4 6.0 8.0 9 4.0 8.0 14 2.0 8.0 5 6.0 10.0 10 4.0 10.0 15 2.0 10.0

26
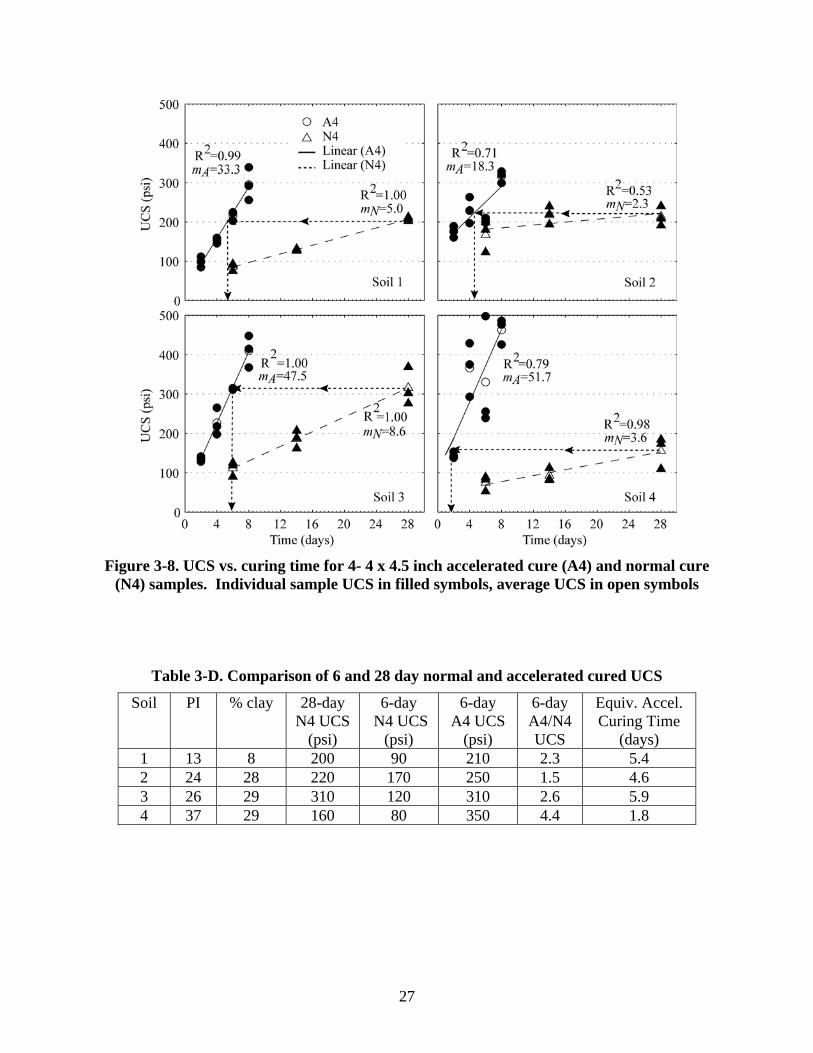
3.2 Test Results 3.2.1 UCS from Specimens Cured under Normal and Accelerated Conditions The results of UCS testing on 4.5 in. tall specimens cured under normal (N4) conditions and
accelerated (A4) conditions are presented in Figure 3-8 for soils 1 through 4. Summary data is
provided in Table 3-D. Results from soils 5 and 6 are presented separately because they were
processed more rigorously and different from typical industry practice (Section 3.1.2). As shown
in Figure 3-8, each soil exhibited reasonably linear growth in UCS under normal and accelerated
curing. Least squares linear regression was sufficient in characterizing the strength gain with
time (all R2 > 0.7).
Figure 3-8 illustrates the accelerated curing time required to achieve a UCS equivalent to 28-day
normal curing. The equivalent accelerated curing durations for the four soils were found to be
5.4, 4.6, 5.9, and 1.8 days, respectively (Table 3-D). Similar to the literature (Chapter 2), a
consistent equivalent accelerated curing time was not found. The high PI soil (soil 4, PI = 37)
yielded the shortest equivalent accelerated curing time, yet the lowest PI soil (soil 1, PI = 13) did
not yield the longest equivalent accelerated curing time. The range of observed equivalent
accelerated curing time (1.8-5.9 days) is similar to those reported in the literature (2.5-6.0 days).
The slope of each best fit line (m = ΔUCS/Δt) reflects the UCS gain with curing time. As
illustrated by visual observation and by the values of m in Figure 3-8 and Table-3-E, the rate of
strength gain varies considerably across these four soils both for normally cured and accelerated
cured specimens. The influence of elevated curing temperature on UCS gain with time is clearly
significant for each soil. The high PI soil (soil 4, PI = 37) was most significantly impacted by
accelerated curing (mA/mN = 14.4).
27
Figure 3-8. UCS vs. curing time for 4- 4 x 4.5 inch accelerated cure (A4) and normal cure
(N4) samples. Individual sample UCS in filled symbols, average UCS in open symbols
Table 3-D. Comparison of 6 and 28 day normal and accelerated cured UCS
Soil PI % clay 28-day N4 UCS
(psi)
6-day N4 UCS
(psi)
6-day A4 UCS
(psi)
6-day A4/N4 UCS
Equiv. Accel. Curing Time
(days) 1 13 8 200 90 210 2.3 5.4 2 24 28 220 170 250 1.5 4.6 3 26 29 310 120 310 2.6 5.9 4 37 29 160 80 350 4.4 1.8
28
Table 3-E. Comparison of UCS gain with time for normal and accelerated curing
Soil PI % clay % fines mN (Normal) (psi/day)
mA (Accel) (psi/day)
mA/mN
1 13 8 36 5.0 33.3 6.7 2 24 28 63 2.3 18.3 8.0 3 26 29 79 8.6 47.5 5.5 4 37 29 48 3.6 51.7 14.4
m = ΔUCS/Δt, A=accelerated curing, N=normal curing
When considering the use of accelerated curing in practice, the results presented here and in the
literature indicate that 7-day 105°F curing will yield UCS values greater than UCS values from
28-day normally cured specimens for all soils. Table 3-F summarizes the UCS values and the
over/underestimation of 28-day normal cure UCS. 7-day 105°F curing overestimates 28-day
normal cure UCS by 13-256%. The use of 5-day 105°F curing would slightly underestimate 28-
day normal cure UCS for soils 1 and 3 (less than 10%) and overestimate 28-day normal cure
UCS for soil 2 (2%) and 4 (94%). The variability in degree of over/underestimation is
significant.
Table 3-F. Comparison of UCS from 5 and 7-day accelerated cure with 28 day normal cure
Soil N428-day UCS (psi)
A45-day UCS (psi)
A47-day UCS (psi)
A45-day/ N428-day
A47-day/ N428-day
1 200 195 250 0.98 1.25 2 220 225 280 1.02 1.27 3 310 280 350 0.90 1.13 4 160 310 410 1.94 2.56
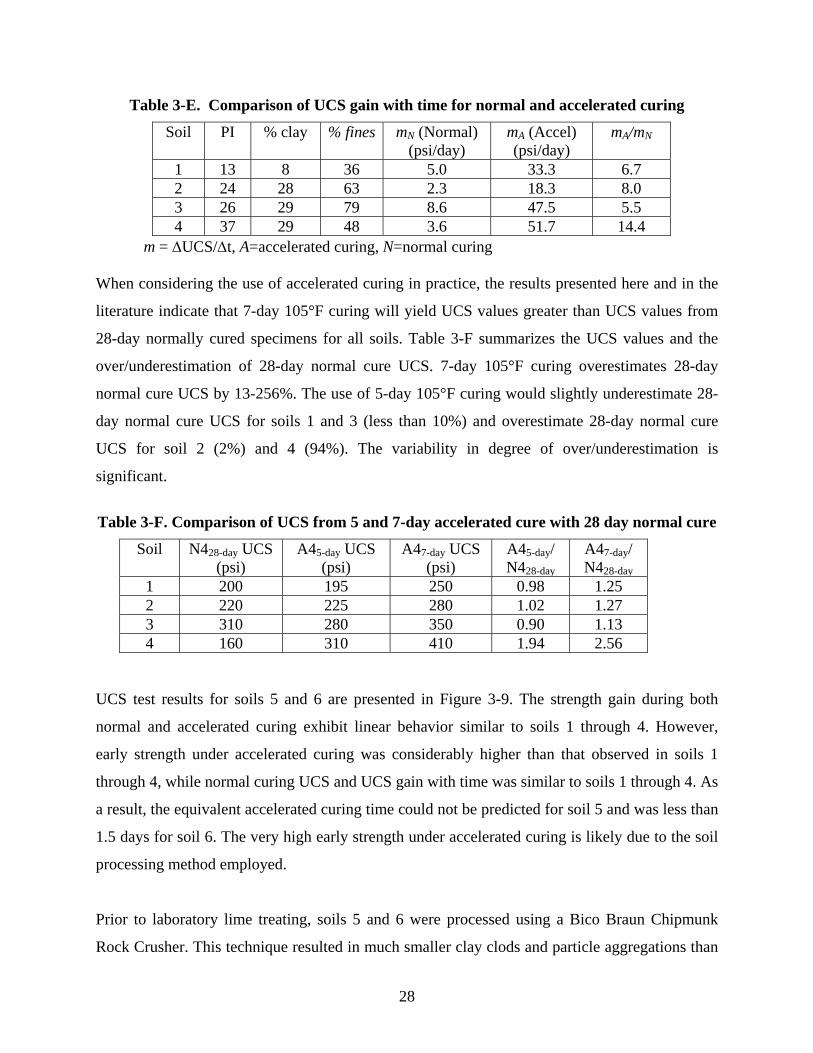
UCS test results for soils 5 and 6 are presented in Figure 3-9. The strength gain during both
normal and accelerated curing exhibit linear behavior similar to soils 1 through 4. However,
early strength under accelerated curing was considerably higher than that observed in soils 1
through 4, while normal curing UCS and UCS gain with time was similar to soils 1 through 4. As
a result, the equivalent accelerated curing time could not be predicted for soil 5 and was less than
1.5 days for soil 6. The very high early strength under accelerated curing is likely due to the soil
processing method employed.
Prior to laboratory lime treating, soils 5 and 6 were processed using a Bico Braun Chipmunk
Rock Crusher. This technique resulted in much smaller clay clods and particle aggregations than
29
the technique used for soils 1 through 4. In addition, soils 5 and 6 were moisture conditioned to
wopt over a ten day period whereas, moisture was added to soils 2 through 4 in bulk at two
instances, prior to mellowing and just before final mixing. Pozzolanic reactions are highly
dependent upon the soil’s mineralogical content and the uniformity of lime and water
distribution. The higher percentage of clods and particle aggregations coupled with increased
moisture distribution permitted greater surface area contact between lime and soil particles.
Interestingly, this translated to higher early strength for accelerated curing but not for normal
curing.
Figure 3-9. UCS with time for soils 5 (left) and 6 (right) for 4- 4 x 4.5 inch accelerated cure
(A4) and normal cure (N4) samples. Individual sample UCS in filled symbols, average UCS in open symbols
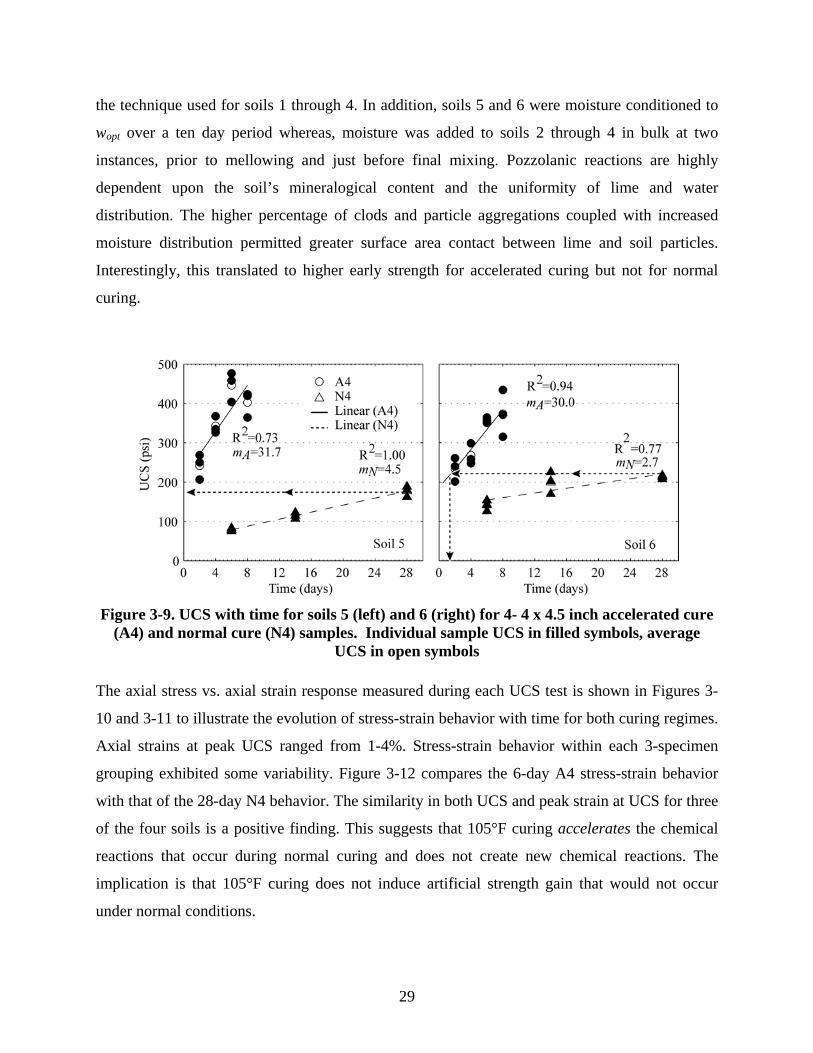
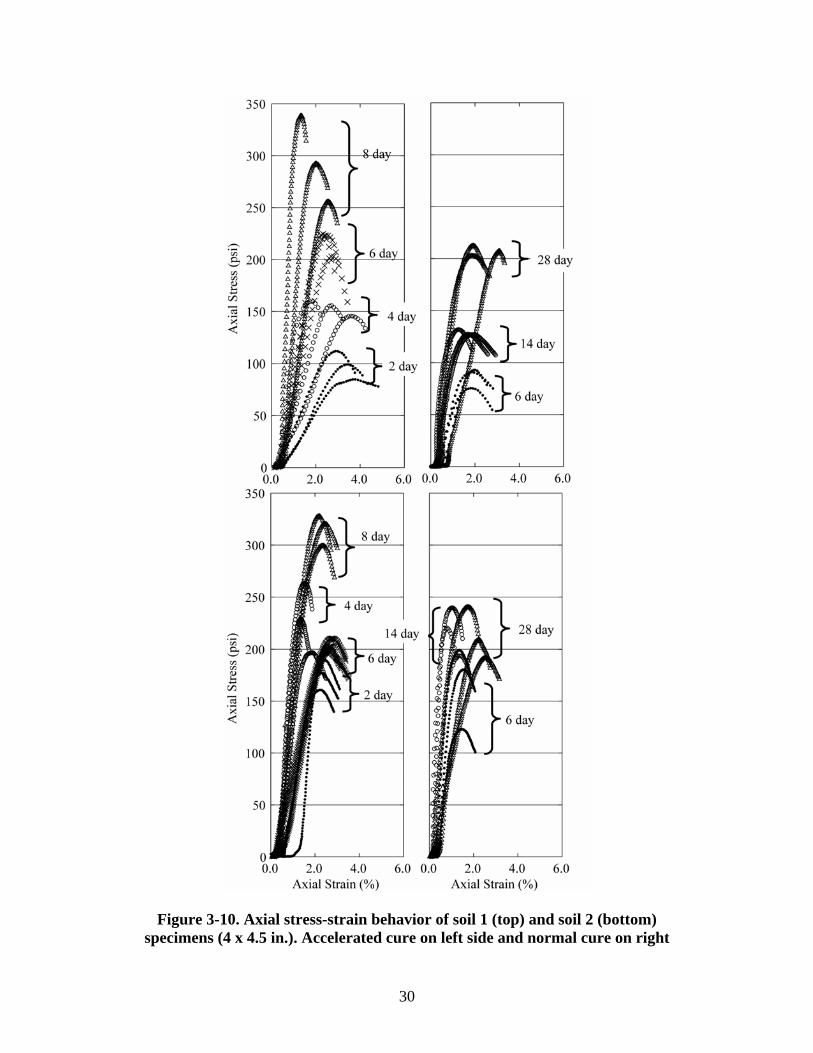
The axial stress vs. axial strain response measured during each UCS test is shown in Figures 3-
10 and 3-11 to illustrate the evolution of stress-strain behavior with time for both curing regimes.
Axial strains at peak UCS ranged from 1-4%. Stress-strain behavior within each 3-specimen
grouping exhibited some variability. Figure 3-12 compares the 6-day A4 stress-strain behavior
with that of the 28-day N4 behavior. The similarity in both UCS and peak strain at UCS for three
of the four soils is a positive finding. This suggests that 105°F curing accelerates the chemical
reactions that occur during normal curing and does not create new chemical reactions. The
implication is that 105°F curing does not induce artificial strength gain that would not occur
under normal conditions.
30
Figure 3-10. Axial stress-strain behavior of soil 1 (top) and soil 2 (bottom) specimens (4 x 4.5 in.). Accelerated cure on left side and normal cure on right
31
Figure 3-11. Axial stress-strain behavior of soil 3 (top) and soil 4 (bottom) specimens (4 x
4.5 in.). Accelerated cure on left side and normal cure on right
32
Figure 3-12. Comparison of 6-day accelerated and 28-day normal curing axial stress-strain
behavior for soil 1, 2, 3 and 4, left to right respectively
The axial stress vs. axial strain response for soils 5 and 6 is shown in Figure 3-13. Accelerated
strength gain for soil 5 after 8 days was on the same order or less than UCS gain achieved after 6
days. This suggests that soil 5 achieved maximum strength gain following 6 days of curing under
accelerated conditions. Soil 5 specimens cured under normal conditions exhibited repeatable and
consistent trends with respect to strength gain. Soil 6 specimens cured under accelerated
conditions exhibited repeatable and consistent trends with respect to strength gain. However, 28-
day normally cured specimens show strength gain on the same order as 14-day normally cured
specimens. This suggests that soil 6 achieved maximum strength gain following 14 days of
curing under normal conditions.
33
Figure 3-13. Axial stress-strain behavior of soil 5 (top) and soil 6 (bottom) specimens (4 x 4.5 in.). Accelerated cure on left side and normal cure on right
34
3.2.2 Correlation of Mr and UCS The 2007 Interim M-E Pavement Design Guide (Table 25, p. 122) and Mallela et al. (2004)
indicate that the design Mr for lime-stabilized subgrade can be approximated from the results of
UCS tests using Thompson’s (1966) correlation shown in Equation (1). Per specification
(AASHTO T307), Mr testing must be performed on specimens with a 2:1 height to diameter
ratio. Equation (1) was developed using 2:1 height to diameter specimens (see Chapter 2).
Mr (ksi) = 0.124* UCS (psi) + 9.98 [(1) re-stated] Mr testing was performed on fifteen 4.0 x 8.0 inch specimens of lime-stabilized soils 4, 5, and 6
cured for 28-days under normal conditions. Mr values obtained with confining pressures σc = 2
psi and 4 psi at a deviator stress σd = 6 psi were used to assess the validity of Thompson’s (1966)
correlation for LSS. Each specimen’s UCS was determined immediately following Mr testing on
the same specimens (typical practice since Mr testing is non-destructive).
UCS and Mr data for the three soils are plotted in Figure 3-14a (Mr σc=2 psi) and 3-15a (Mr σc=4
psi) together with Thompson’s equation. The data is also summarized in Tables 3-G and 3-I. The
data exhibits considerable scatter as evidenced by the Range/Mean values in Tables 3-G and 3-I.
The scatter is particularly high for Mr results from soils 4 and 5. To reduce scatter and
uncertainty, the data from the five specimens for each soil was averaged and are presented in
Figure 3-14b (Mr σc=2psi) and 3-15b (Mr σc=4psi). Here, N8 refers to the 8.0 in. tall specimen
results. The N4 results are described below. For each soil at both confining pressures,
Thompson’s correlation (Eq. 1) underestimates Mr considerably and is therefore conservative.
Per the summary data in Tables 3-H and 3-J, the measured Mr (σc=2 psi) is 20 - 50 % greater
than Mr predicted by Thompson’s correlation, and the measured Mr (σc=4 psi) is 50 - 80 %
greater than Mr predicted by Thompson’s correlation.
35
Figure 3-14. Relationship between Mr (σc=2 psi, σd=6 psi) and UCS: (a) Individual specimen data for 4.0 x 8.0 in. tall specimens; (b) Average results of 5 specimens for 4.0 x 8.0 in. tall and 4.0 x 4.5 inch tall specimens. Thompson’s correlation is shown for comparison
Figure 3-15. Relationship between Mr (σc=4 psi, σd=6 psi) and UCS: (a) Individual specimen data for 4.0 x 8.0 in. tall specimens; (b) Average results of 5 specimens for 4.0 x 8.0 in. tall and 4.0 x 4.5 inch tall specimens. Thompson’s correlation is shown for comparison.

36
Table 3-G. Summary of UCS (N8) and Mr (N8) (σc=2 psi, σd=6 psi)
Specimen Soil 4 Soil 5 Soil 6
Mr (ksi)
UCS (psi)
Mr (ksi)
UCS (psi)
Mr (ksi)
UCS (psi)
1 37.4 188 23.3 180 50.5 299 2 31.9 239 40.0 187 74.0 299 3 73.6 128 61.3 225 69.4 257 4 48.2 160 54.6 261 64.1 219 5 34.0 216 43.6 252 69.1 252
Mean 45.0 186 44.6 221 65.4 265 Range/Mean 0.93 0.60 0.85 0.36 0.36 0.30
Table 3-H. Comparison of measured (N8) and estimated (N8) (Eq. 1) Mr (σc=2 psi, σd=6 psi)
Soil UCS (psi) (N8)
Measured Mr (ksi)
Estimated Mr (ksi) (Eq. 1)
Mr (meas)/Mr (Eq. 1)
4 186 45.0 33.0 1.4 5 221 44.6 37.4 1.2 6 265 65.4 42.8 1.5
Table 3-I. Summary of UCS (N8) and Mr (N8) (σc=4 psi, σd=6 psi)
Specimen Soil 4 Soil 5 Soil 6
Mr (ksi)
UCS (psi)
Mr (ksi)
UCS (psi)
Mr (ksi)
UCS (psi)
1 41.9 188 34.6 180 53.6 299 2 42.5 239 60.9 187 71.0 299 3 77.9 128 81.7 225 77.6 257 4 51.6 160 65.3 261 74.7 219 5 89.7 216 45.5 252 82.9 252
Mean 60.7 186 57.6 221 72.0 265 Range/Mean 0.87 0.60 0.82 0.36 0.41 0.30
Table 3-J. Comparison of measured (N8) and estimated (N8) (Eq. 1) Mr (σc=4 psi, σd=6 psi)
Soil UCS (psi) (N8)
Measured Mr (ksi)
Estimated Mr (ksi) (Eq. 1)
Mr (meas)/Mr (Eq. 1)
4 186 60.7 33.0 1.8 5 221 57.6 37.4 1.5 6 265 72.0 42.8 1.7

37
In Colorado practice, UCS is performed on 4.5 in. tall specimens. Given the reported influence
that slenderness ratio has on UCS, the relationship between UCS4.5 and UCS8.0 was investigated.
Average UCS values from 4.5 in. tall and 8.0 in. tall specimens after normal curing times of 6,
14 and 28 days are shown in Figure 3-16. While the general trend is 1:1, UCS4.5 values were
found to be lower than UCS8.0 values.
In addition to the UCS testing performed on 4.0 x 8.0 in. specimens after Mr testing, UCS testing
was performed on 28-day N4 specimens (4.0 x 4.5 in. tall). The results are summarized in Tables
3-K and 3-M, and the average values are plotted in Figures 3-14 and 3-15. UCS4.5 values were on
average 0.8 times the UCS8.0 values. It is possible that the Mr testing densified and thus
strengthened the 8.0 in. tall specimens prior to UCS testing. As a result, the predicted Mr values
per Thompson’s correlation using UCS8.0 are likely more conservative. Per the summary data in
Tables 3-L and 3-N, the measured Mr (σc=2 psi) is 40 - 80% greater than Mr predicted by
Thompson’s correlation, and the measured Mr (σc=4 psi) is 80 - 110 % greater than Mr predicted
by Thompson’s correlation.
Figure 3-16. Average UCS values of 4.5 in. tall and 8 in. tall specimens
38
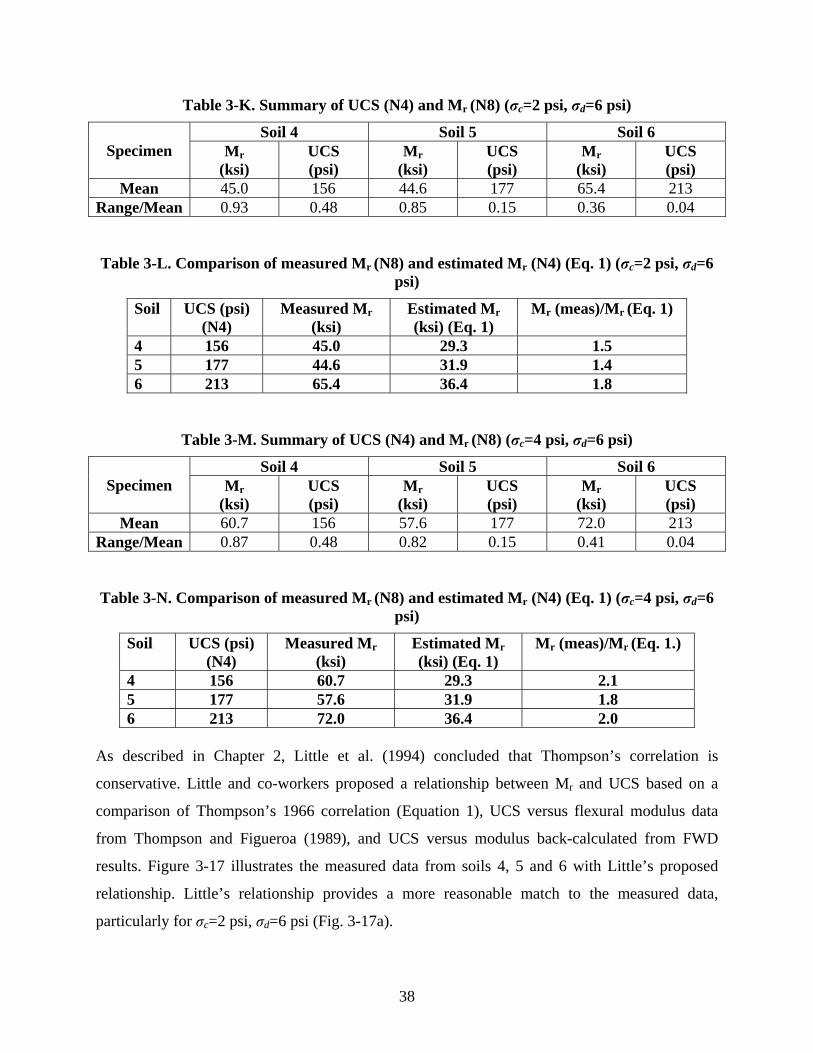
Table 3-K. Summary of UCS (N4) and Mr (N8) (σc=2 psi, σd=6 psi)
Specimen Soil 4 Soil 5 Soil 6
Mr (ksi)
UCS (psi)
Mr (ksi)
UCS (psi)
Mr (ksi)
UCS (psi)
Mean 45.0 156 44.6 177 65.4 213 Range/Mean 0.93 0.48 0.85 0.15 0.36 0.04
Table 3-L. Comparison of measured Mr (N8) and estimated Mr (N4) (Eq. 1) (σc=2 psi, σd=6 psi)
Soil UCS (psi) (N4)
Measured Mr (ksi)
Estimated Mr (ksi) (Eq. 1)
Mr (meas)/Mr (Eq. 1)
4 156 45.0 29.3 1.5 5 177 44.6 31.9 1.4 6 213 65.4 36.4 1.8
Table 3-M. Summary of UCS (N4) and Mr (N8) (σc=4 psi, σd=6 psi)
Specimen Soil 4 Soil 5 Soil 6
Mr (ksi)
UCS (psi)
Mr (ksi)
UCS (psi)
Mr (ksi)
UCS (psi)
Mean 60.7 156 57.6 177 72.0 213 Range/Mean 0.87 0.48 0.82 0.15 0.41 0.04
Table 3-N. Comparison of measured Mr (N8) and estimated Mr (N4) (Eq. 1) (σc=4 psi, σd=6 psi)
Soil UCS (psi) (N4)
Measured Mr (ksi)
Estimated Mr (ksi) (Eq. 1)
Mr (meas)/Mr (Eq. 1.)
4 156 60.7 29.3 2.1 5 177 57.6 31.9 1.8 6 213 72.0 36.4 2.0
As described in Chapter 2, Little et al. (1994) concluded that Thompson’s correlation is
conservative. Little and co-workers proposed a relationship between Mr and UCS based on a
comparison of Thompson’s 1966 correlation (Equation 1), UCS versus flexural modulus data
from Thompson and Figueroa (1989), and UCS versus modulus back-calculated from FWD
results. Figure 3-17 illustrates the measured data from soils 4, 5 and 6 with Little’s proposed
relationship. Little’s relationship provides a more reasonable match to the measured data,
particularly for σc=2 psi, σd=6 psi (Fig. 3-17a).
39
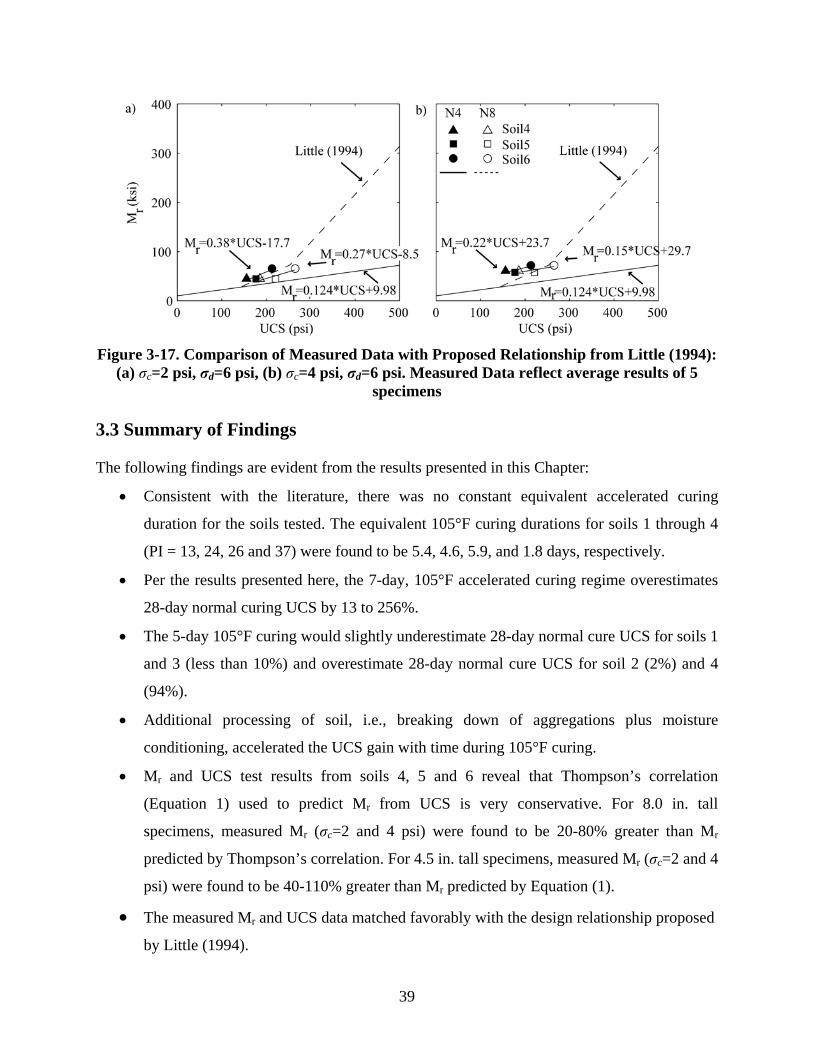
Figure 3-17. Comparison of Measured Data with Proposed Relationship from Little (1994):
(a) σc=2 psi, σd=6 psi, (b) σc=4 psi, σd=6 psi. Measured Data reflect average results of 5 specimens
3.3 Summary of Findings The following findings are evident from the results presented in this Chapter:
• Consistent with the literature, there was no constant equivalent accelerated curing
duration for the soils tested. The equivalent 105°F curing durations for soils 1 through 4
(PI = 13, 24, 26 and 37) were found to be 5.4, 4.6, 5.9, and 1.8 days, respectively.
• Per the results presented here, the 7-day, 105°F accelerated curing regime overestimates
28-day normal curing UCS by 13 to 256%.
• The 5-day 105°F curing would slightly underestimate 28-day normal cure UCS for soils 1
and 3 (less than 10%) and overestimate 28-day normal cure UCS for soil 2 (2%) and 4
(94%).
• Additional processing of soil, i.e., breaking down of aggregations plus moisture
conditioning, accelerated the UCS gain with time during 105°F curing.
• Mr and UCS test results from soils 4, 5 and 6 reveal that Thompson’s correlation
(Equation 1) used to predict Mr from UCS is very conservative. For 8.0 in. tall
specimens, measured Mr (σc=2 and 4 psi) were found to be 20-80% greater than Mr
predicted by Thompson’s correlation. For 4.5 in. tall specimens, measured Mr (σc=2 and 4
psi) were found to be 40-110% greater than Mr predicted by Equation (1).
• The measured Mr and UCS data matched favorably with the design relationship proposed
by Little (1994).
40
CHAPTER 4: CONCLUSIONS AND RECOMMENDATIONS 4.1 Equivalent Accelerated Curing Regime This study explored the influence of accelerated curing (i.e., elevated temperature) on short term
UCS of lime-stabilized soils (LSS) and the relationship of UCS after accelerated curing (2-8 day
105°F) with UCS after 28-day room temperature curing. In addition, the relationship between
resilient modulus (Mr) and UCS, and how it compares with the standard relationship used in
CDOT practice (Equation 1) was investigated. A thorough review of the literature and a detailed
laboratory testing program were conducted. Six fine-grained soils with plasticity indices (PI)
ranging from 13 - 37 were selected for laboratory evaluation. Both 4.5 inch tall and 8.0 inch tall
specimens (all 4.0 inch diameter) were prepared and subjected to accelerated (2-8 day 105°F)
and normal (28-day 73°F) curing prior to UCS testing. Resilient modulus testing was performed
on three of the soils.
Consistent with the literature on the influence of elevated temperature curing on UCS, no
constant equivalent 105°F curing duration was identified from the test results of six lime-
stabilized soils (see Table 4-A). Soils 5 and 6 were processed to a degree not experienced during
field mixing and therefore should not be directly compared to field conditions. The results from
soils 1-4 demonstrate that 28-day 73°F UCS is reached after 1.8 – 5.9 days of 105°F curing.
Based on these results and the literature, the use of 7-day 105°F curing as a proxy for 28-day
73°F UCS is considerably un-conservative. The use of 5-day 105°F curing is more reasonable
per soils 1-3 yet still significantly un-conservative for soil 4.
41
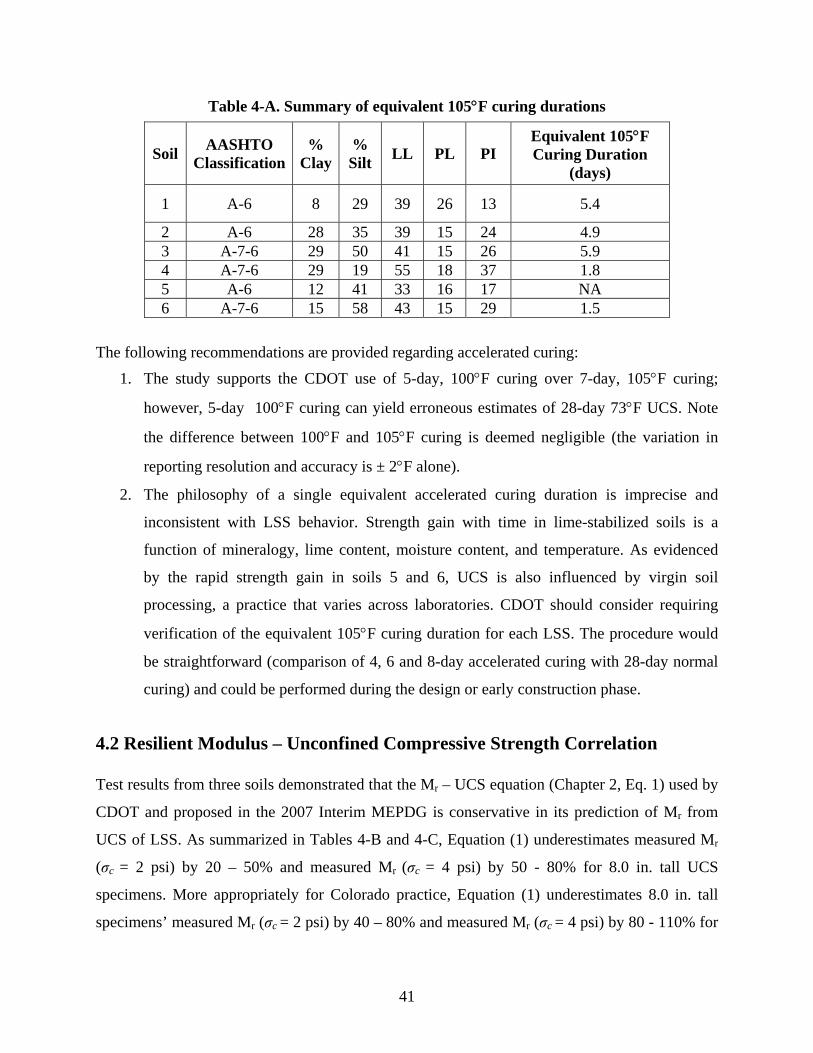
Table 4-A. Summary of equivalent 105°F curing durations
Soil AASHTO Classification
% Clay
% Silt LL PL PI
Equivalent 105°F Curing Duration
(days)
1 A-6 8 29 39 26 13 5.4
2 A-6 28 35 39 15 24 4.9 3 A-7-6 29 50 41 15 26 5.9 4 A-7-6 29 19 55 18 37 1.8 5 A-6 12 41 33 16 17 NA 6 A-7-6 15 58 43 15 29 1.5
The following recommendations are provided regarding accelerated curing:
1. The study supports the CDOT use of 5-day, 100°F curing over 7-day, 105°F curing;
however, 5-day 100°F curing can yield erroneous estimates of 28-day 73°F UCS. Note
the difference between 100°F and 105°F curing is deemed negligible (the variation in
reporting resolution and accuracy is ± 2°F alone).
2. The philosophy of a single equivalent accelerated curing duration is imprecise and
inconsistent with LSS behavior. Strength gain with time in lime-stabilized soils is a
function of mineralogy, lime content, moisture content, and temperature. As evidenced
by the rapid strength gain in soils 5 and 6, UCS is also influenced by virgin soil
processing, a practice that varies across laboratories. CDOT should consider requiring
verification of the equivalent 105°F curing duration for each LSS. The procedure would
be straightforward (comparison of 4, 6 and 8-day accelerated curing with 28-day normal
curing) and could be performed during the design or early construction phase.
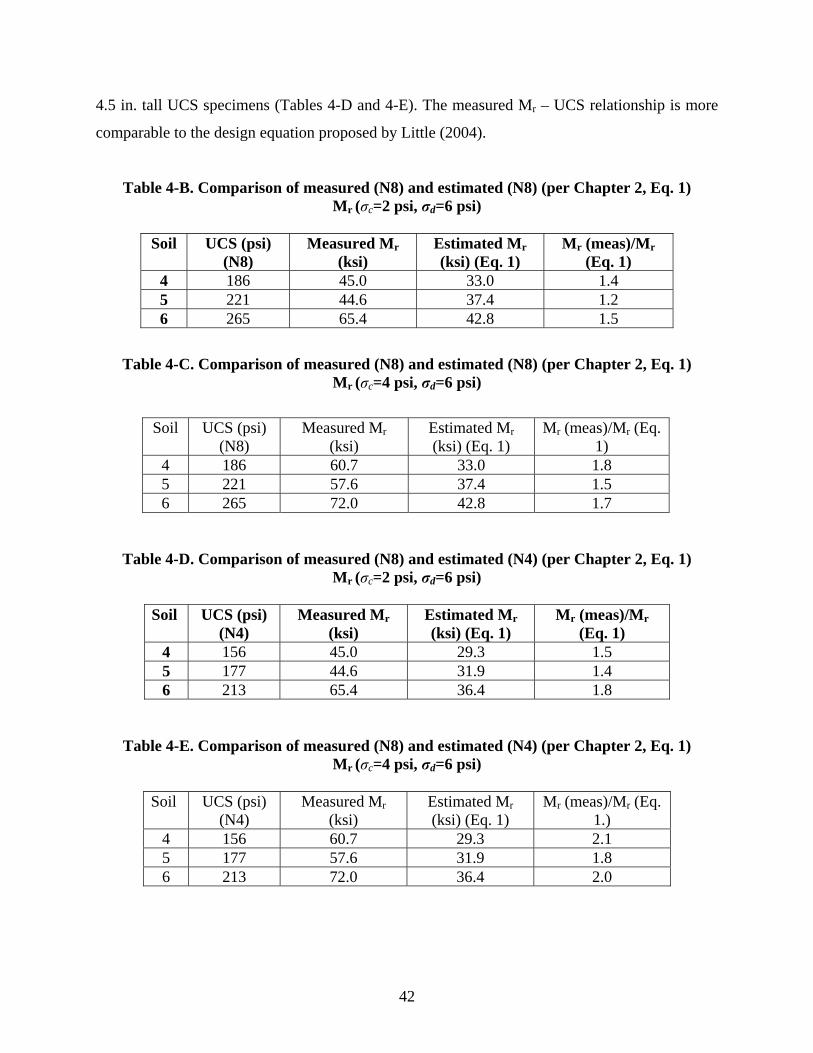
4.2 Resilient Modulus – Unconfined Compressive Strength Correlation Test results from three soils demonstrated that the Mr – UCS equation (Chapter 2, Eq. 1) used by
CDOT and proposed in the 2007 Interim MEPDG is conservative in its prediction of Mr from
UCS of LSS. As summarized in Tables 4-B and 4-C, Equation (1) underestimates measured Mr
(σc = 2 psi) by 20 – 50% and measured Mr (σc = 4 psi) by 50 - 80% for 8.0 in. tall UCS
specimens. More appropriately for Colorado practice, Equation (1) underestimates 8.0 in. tall
specimens’ measured Mr (σc = 2 psi) by 40 – 80% and measured Mr (σc = 4 psi) by 80 - 110% for
42
4.5 in. tall UCS specimens (Tables 4-D and 4-E). The measured Mr – UCS relationship is more
comparable to the design equation proposed by Little (2004).
Table 4-B. Comparison of measured (N8) and estimated (N8) (per Chapter 2, Eq. 1) Mr (σc=2 psi, σd=6 psi)
Soil UCS (psi)
(N8) Measured Mr
(ksi) Estimated Mr (ksi) (Eq. 1)
Mr (meas)/Mr (Eq. 1)
4 186 45.0 33.0 1.4 5 221 44.6 37.4 1.2 6 265 65.4 42.8 1.5
Table 4-C. Comparison of measured (N8) and estimated (N8) (per Chapter 2, Eq. 1) Mr (σc=4 psi, σd=6 psi)
Soil UCS (psi)
(N8) Measured Mr
(ksi) Estimated Mr (ksi) (Eq. 1)
Mr (meas)/Mr (Eq. 1)
4 186 60.7 33.0 1.8 5 221 57.6 37.4 1.5 6 265 72.0 42.8 1.7
Table 4-D. Comparison of measured (N8) and estimated (N4) (per Chapter 2, Eq. 1) Mr (σc=2 psi, σd=6 psi)
Soil UCS (psi)
(N4) Measured Mr
(ksi) Estimated Mr (ksi) (Eq. 1)
Mr (meas)/Mr (Eq. 1)
4 156 45.0 29.3 1.5 5 177 44.6 31.9 1.4 6 213 65.4 36.4 1.8
Table 4-E. Comparison of measured (N8) and estimated (N4) (per Chapter 2, Eq. 1) Mr (σc=4 psi, σd=6 psi)
Soil UCS (psi)
(N4) Measured Mr
(ksi) Estimated Mr (ksi) (Eq. 1)
Mr (meas)/Mr (Eq. 1.)
4 156 60.7 29.3 2.1 5 177 57.6 31.9 1.8 6 213 72.0 36.4 2.0
43
The following recommendations are provided regarding Mr – UCS correlation:
1. Adopt the Mr – UCS correlation recommended by Little (2004) for LSS. Additional
testing may be performed in early adopted projects to validate the use of this correlation.
2. Adjust the Mr – UCS correlation per the results presented here. The results of this study
(3 soils, 5 tests per soil) are limited and scattered; therefore, additional testing is
recommended to validate a shift in the correlation.
A more general recommendation about QC/QA of LSS is warranted. The limitations of
accelerated curing and Mr – UCS correlation notwithstanding, QC/QA involving laboratory
compaction, curing and testing to estimate field performance has further limitations. Laboratory
and field compaction yield different soil structures and curing conditions (temperature,
confinement) differ in the field and lab. For these reasons, and given the relative complexity of
LSS construction, we recommend that CDOT investigate alternative methods of QC/QA.
Sampling could be conducted in the field on LSS that is field compacted and field cured to be
representative of the parent material. Performance-related parameters such as modulus and
strength could be measured directly, rather than correlated.
44
REFERENCES
1) Alexander, M. L. and Doty, R. N., 1978, “Determination of Strength Equivalency
Factors for the Design of Lime-Stabilized Roadways,” California Department of Transportation. Sacramento: California Department of Transportation, pp. 60.
2) ASTM D 698, 2007, “Standard Test Methods for Laboratory Compaction Characteristics of Soil Using Standard Effort (12 400 ft-lbf/ft3 (600 kN-m/m3)),” ASTM International.
3) ASTM D 5102, 2004, “Standard Test Method for Unconfined Compressive Strength
of Compacted Soil-Lime,” ASTM International.
4) ASTM D 6276 REV A, 1999, “Standard Test Method for Using pH to Estimate the Soil-Lime Proportion Requirement for Soil Stabilization,” ASTM International.
5) Biswas, Bhupati R., 1972, “Study of Accelerated Curing and Other Factors
Influencing Soil Stabilization,” Ph.D. Dissertation, Texas A&M Univ., pp. 295.
6) CTL/Thompson, Inc., 1998, “Pavement Design Standards and Construction Specifications,” Report prepared for the Metropolitan Government Pavement Engineers Council, Denver, Co.
7) Drake, J. A., and Haliburton, T.A., 1972, “Accelerated Curing of Salt-Treated and Lime-Treated Cohesive Soils,” Highway Research Bulletin, 381, pp. 10-19.
8) Little, D. N., 1999, “Evaluation of Structural Properties of Lime Stabilized Soils and Aggregates,” Volume 1: Summary of Findings, National Lime Association, Arlington, Va., pp. 89.
9) Little, D. N., 2000, “Evaluation of Structural Properties of Lime Stabilized Soils and Aggregates,” Volume 3: Mixture Design And Testing Protocol for Lime Stabilized Soils, The National Lime Association, Arlington, Va.
10) Little, D. N., Scullion, T., Kota, P., and Bhuiyan, J., 1994, “Identification of the structural benefits of base and subgrade stabilization,” Report 1287-2, Texas Transportation Institute, Texas A&M Univ., College Station, Tx.
11) Mallela, J., von Quintus, H. and Smith, K.L., 2004, “Consideration of Lime-Stabilized Layers in Mechanistic-Empirical Pavement Design,” Report prepared for the National Lime Association, pp. 36.
12) Ravaska, O., 2006, “Effect of testing conditions on the shear strength parameters – a numerical study,” Numerical Methods in Geotechnical Engineering, Schweiger, ed., pp. 161-165.
45
13) Thompson, M. R., 1975, “Shear Strength and Elastic Properties of Lime Soil Mixtures,” Highway Research Record, pp. 1-14.
14) Thompson, M. R., and Figueroa, J.L., 1989, “Mechanistic Thickness Design Procedure for Soil-Lime Layers,” Transportation Research Record, 754, pp. 32-36.
15) Townsend, F. C., and Donaghe, T.R., 1976, “Investigation of Accelerated Curing of Soil-Lime and Lime-Fly Ash-Aggregate Mixtures United States of America,” Army Corps of Engineers, Waterways Experiment Station, pp. 84.
16) Yusuf, F., Little, D.N., and Sarkar, S.L., 2001, “Evaluation of Structural Contribution of Lime Stabilization of Subgrade Soils in Mississippi,” Transportation Research Record, pp. 22-31.
Related Documents