ACCELERATE DOCUMENT DIST UTION SYSTEM REGULATC INFORMATION DISTRIBUTION STEM (RIDS) ACCESSION NBR:9308230088 DOC.DATE: 93/06/30 NOTARIZED: NO DOCKET # FACIL:50-270 Oconee Nuclear Station, Unit 2, Duke Power Co. 05000270 AUTH.NAME AUTHOR AFFILIATION HUTCHESON,M.A. Duke Power Co. COYLE,D.B. Duke Power Co. R HAMPTON,J.W. Duke Power Co. RECIP.NAME RECIPIENT AFFILIATION SUBJECT: "Oconee Nuclear Station,Unit 2 Reactor Containment D Integrated Leakage Rate Test Rept." W/930817 ltr. DISTRIBUTION CODE: A017D COPIES RECEIVED:LTR I ENCL SIZE: S TITLE: OR Submittal: Append J Containment Leak Rate Testing NOTES: A RECIPIENT COPIES RECIPIENT COPIES ID CODE/NAME LTTR ENCL ID CODE/NAME LTTR ENCL D PD2-3 PD 1 1 WIENS,L 2 2 INTERNAL: ACRS 6 6 OC/LFDCB 1 0 D OGC/HDS2 1 1 wRgFiEtER 01 1 1 RES/DE/SEB 1 1 RES/DSIR/SAIB 1 1 S EXTERNAL: NRC PDR 1 1 NSIC 1 1 R I D S A D D NOTE TO ALL "RIDS" RECIPIENTS: PLEASE HELP US TO REDUCE WASTE! CONTACT THE DOCUMENT CONTROL DESK, ROOM P1-37 (EXT. 504-2065) TO ELIMINATE YOUR NAME FROM DISTRIBUTION LISTS FOR DOCUMENTS YOU DON'T NEED! TOTAL NUMBER OF COPIES REQUIRED: LTTR 16 ENCL 15

Welcome message from author
This document is posted to help you gain knowledge. Please leave a comment to let me know what you think about it! Share it to your friends and learn new things together.
Transcript
ACCELERATE DOCUMENT DIST UTION SYSTEM REGULATC INFORMATION DISTRIBUTION STEM (RIDS)
ACCESSION NBR:9308230088 DOC.DATE: 93/06/30 NOTARIZED: NO DOCKET # FACIL:50-270 Oconee Nuclear Station, Unit 2, Duke Power Co. 05000270 AUTH.NAME AUTHOR AFFILIATION HUTCHESON,M.A. Duke Power Co. COYLE,D.B. Duke Power Co. R HAMPTON,J.W. Duke Power Co. RECIP.NAME RECIPIENT AFFILIATION
SUBJECT: "Oconee Nuclear Station,Unit 2 Reactor Containment D Integrated Leakage Rate Test Rept." W/930817 ltr.
DISTRIBUTION CODE: A017D COPIES RECEIVED:LTR I ENCL SIZE: S TITLE: OR Submittal: Append J Containment Leak Rate Testing
NOTES: A
RECIPIENT COPIES RECIPIENT COPIES ID CODE/NAME LTTR ENCL ID CODE/NAME LTTR ENCL D
PD2-3 PD 1 1 WIENS,L 2 2
INTERNAL: ACRS 6 6 OC/LFDCB 1 0 D OGC/HDS2 1 1 wRgFiEtER 01 1 1 RES/DE/SEB 1 1 RES/DSIR/SAIB 1 1 S
EXTERNAL: NRC PDR 1 1 NSIC 1 1
R
I
D
S
A
D
D NOTE TO ALL "RIDS" RECIPIENTS:
PLEASE HELP US TO REDUCE WASTE! CONTACT THE DOCUMENT CONTROL DESK, ROOM P1-37 (EXT. 504-2065) TO ELIMINATE YOUR NAME FROM DISTRIBUTION LISTS FOR DOCUMENTS YOU DON'T NEED!
TOTAL NUMBER OF COPIES REQUIRED: LTTR 16 ENCL 15
Duke Power Company J W HArN Oconee Nuclear Site Vice President P.O. Box 1439 (803)885-3499 Office Seneca, SC 29679 (803)8853564 Fax
DUKE POWER
August 17, 1993
U. S. Nuclear Regulatory Commission Attn: Document Control Desk Washington, DC 20555
Subject: Oconee Nuclear Site Docket No. 50-270 Reactor Containment Building Integrated Leak Rate Test
Gentlemen:
Pursuant to 10 CFR 50, Appendix J, Section V.B, and Oconee Nuclear Station Technical Specification 4.4.1.1.5, please find attached the Oconee Unit 2 Reactor Containment Integrated Leak Rate Test Report for June, 1993.
Very truly yours,
W. Ham ton
cc: Mr. S. D. Ebneter, Regional Administrator U. S. Nuclear Regulatory Commission, Region II
Mr. L. A. Wiens, Project Manager Office of Nuclear Reactor Regulation
Mr. P. E. Harmon Senior Resident Inspector Oconee Nuclear Site
edonreyldpa 9308230088 930630 PDR ADOCK 05000270 U P PDR
Duke Power Company
Oconee Nuclear Station Unit 2
Reactor Containment Building Integrated Leakage Rate Test Report
June 1993
Submitted to The United States Nuclear Regulatory Commission
Docket Number 50-270-DPR-47
Prepared By: M. A. Hutcheson Nuclear Production Engineer
J. M. Boyles Nuclear ProductionEngin r
Reviewed By: G. K. McAhinch Engineering Supervisor
Approved By: D. B. Coyle Systems Engineering Manager
Oconee Unit 2
TABLE OF CONTENTS
Page
I. INTRODUCTION......
II. TEST SYNOPSIS .................................................. 2
III. TEST DATA SUMMARY..................................... ........ 4
A. Plant Information B. Technical Data C. Type A Test Results D. Verification Controlled Leakage Rate Test Results E. Type B and C Test Results F. Integrated Leakage Rate Measurement System G. Description of Computer Program H. Information Retained at Plant
IV. ANALYSIS AND INTERPRETATION................................... 10
A. ILRT Test Corrections B. Reported "As Left" ILRT Results C. "As Found" Evaluation of Containment
V. REFERENCES .................................................... 13
VI. APPENDICES ..................................................... 14
A. Temperature Stabilization Phase Data and Graphs B. Integrated Leakage Rate Test Data and Graphs C. Verification Controlled Leakage Rate Test Data and Graphs D. Miscellaneous Information E. Test Data Summary F. Local Leakage Rate Testing Conducted Since the Last ILRT
Oconee Unit 2
INTRODUCTION
A periodic Type A Containment Integrated Leakage Rate Test (ILRT) was
successfully conducted on the primary containment structure of the Oconee Nuclear
Station, Unit 2 pressurized water reactor. The test was completed on June 11, 1993. The
purpose of the test was to demonstrate that leakage through the primary reactor
containment, and systems and components penetrating primary containment does not
exceed the allowable leakage rate specified in the Plant Technical Specifications.
The test was conducted in accordance with the requirements of 10CFR50, Appendix J
using the Absolute Method defined in ANSI N45.4-1972. The leakage rate was calculated
for both the Type A test and the verification test using the Total Time methodology and the
calculational requirements of BN-TOP-1, Revision 1, "Testing Criteria for Integrated
Leakage Rate Testing of Primary Containment Structures for Nuclear Power Plants."
Leakage rates for both the Type A test and the verification test were also calculated, for
information only, using the Mass Point methodology given by ANSI/ANS 56.8-1987. The
ILRT was performed at a pressure in excess of the calculated peak containment internal
pressure related to the design basis accident as specified in the Final Safety Analysis Report
(FSAR) and the Plant Technical Specifications.
This report describes and presents the results of this periodic Type A test, including
the supplemental test method used for verification. The summary of events and test
chronology are presented in Section II, Test Synopsis. Plant information, technical data, test
results and measurement system information are presented in Section III, Test Data
Summary. The test results are compared with the Acceptance Criteria in Section IV,
Analysis and Interpretation. A summary of the local leakage rate testing (Type B and C)
performed since the last ILRT is also provided in this report as Appendix F.
The "As Left" Type A test result reported at the 95 percent upper confidence limit is
0.1509 percent of the contained mass per day. The "As Found" Type A test result reported
at the 95 percent upper confidence limit is also 0.1509 percent of the contained mass per
day. The acceptance criteria specified in the plant Technical Specifications is a leakage rate
less than 0.75 La , or 0.1875 percent of the contained air mass per day.
1
Oconee Unit 2 . 11. TEST SYNOPSIS
Preparations to pressurize containment for the conduct of the JLRT included internal
and external inspections of the containment structure; installation and checkout of the LLRT
instrumentation; completion of all Type B and Type C local leakage rate testing; alignment
of valves and breakers for test conditions; and the installation and checkout of the
temporary pressurization facilities. All preparations were completed on June 9, 1993.
Temperature sensor number 2 was not installed due to a short in the auxiliary building side
of the electrical penetration. Its assigned volume fraction was added to the volume fraction
for temperature sensor number 13.
Containment pressurization started at 1330 on June 9, 1993. Pressurization continued
at an average rate of 4.2 psi/hr using the 10,500 scfm capacity available from the seven
diesel driven air compressors. Both "A" and "C" reactor building cooling unit fans were
operated in low speed at this time. A containment air sample was taken by Radiation
Protection personnel at a building pressure of 40 psig and both "A" and "C" reactor
building cooling unit fans were removed from service at 45 psig. At 0355 on June 10, with
a building pressure of 60.0 psig, two compressors were secured. At 0430, with five
compressors still running, the building test pressure of 61.36 psig was reached. The
pressurization line was isolated and vented and the stabilization period started.
The temperature stabilization period was started with data set number 61 at 0430. At
0445, Quality Assurance was given permission to perform a visual inspection on valves
2LDW99 and 2LDW103 - this visual inspection was completed at 0500. Four and one-half
hours into the stabilization period, both BN-TOP-1 and ANSI 56.8-1987 temperature
stabilization criteria were satisfied. Stabilization data continued for 3.5 additional hours to
allow for the contained air mass to stabilize sufficiently to start the test. Penetration leak
searches were periodically conducted throughout the pressurization and stabilization phases
- no significant leaks were observed.
The Type A test period started with data set number 93, at 1230 on June 10. By 1500
the Upper Confidence Limit leak rates for both the Total Time and Mass Point calculations
were within the acceptance limit. A successful 6.5 hour test was completed at 1900, with
data set number 119. The Total Time and Mass Point Leak Rates at the 95 % Upper
Confidence Limit were 0.1506 wt.%/day and 0.1190 wt.%/day respectively. All BN-TOP-1
termination criteria were also met at this time.
2
Oconee Unit 2
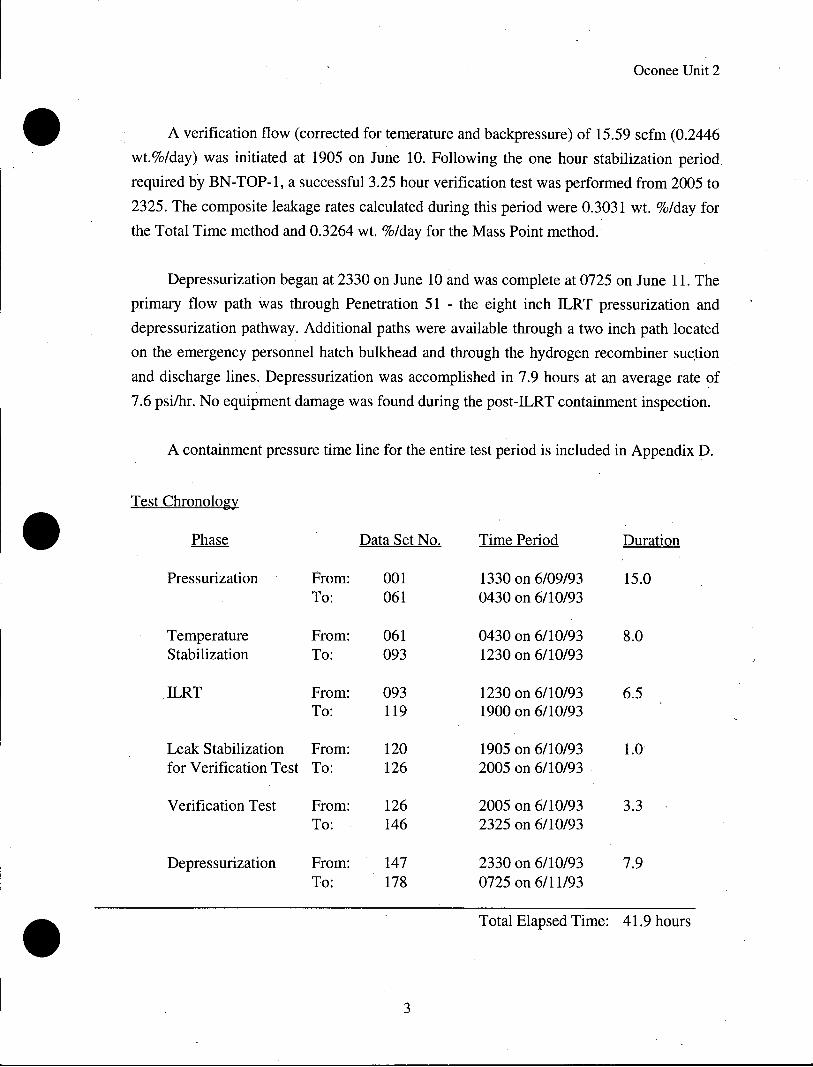
A verification flow (corrected for temerature and backpressure) of 15.59 scfm (0.2446
wt.%/day) was initiated at 1905 on June 10. Following the one hour stabilization period
required by BN-TOP-1, a successful 3.25 hour verification test was performed from 2005 to
2325. The composite leakage rates calculated during this period were 0.3031 wt. %/day for
the Total Time method and 0.3264 wt. %/day for the Mass Point method.
Depressurization began at 2330 on June 10 and was complete at 0725 on June 11. The
primary flow path was through Penetration 51 - the eight inch ILRT pressurization and
depressurization pathway. Additional paths were available through a two inch path located
on the emergency personnel hatch bulkhead and through the hydrogen recombiner suction
and discharge lines. Depressurization was accomplished in 7.9 hours at an average rate of
7.6 psi/hr. No equipment damage was found during the post-ILRT containment inspection.
A containment pressure time line for the entire test period is included in Appendix D.
Test Chronology
Phase Data Set No. Time Period Duration
Pressurization From: 001 1330 on 6/09/93 15.0 To: 061 0430 on 6/10/93
Temperature From: 061 0430 on 6/10/93 8.0 Stabilization To: 093 1230 on 6/10/93
JLRT From: 093 1230 on 6/10/93 6.5 To: 119 1900 on 6/10/93
Leak Stabilization From: 120 1905 on 6/10/93 1.0 for Verification Test To: 126 2005 on 6/10/93
Verification Test From: 126 2005 on 6/10/93 3.3 To: 146 2325 on 6/10/93
Depressurization From: 147 2330 on 6/10/93 7.9 To: 178 0725 on 6/11/93
* Total Elapsed Time: 41.9 hours
3
Oconee Unit 2
II. TEST DATA SUMMARY
A. Plant Information
Owner Duke Power Company
Plant Oconee Nuclear Station, Unit 2
Location Hwy 130 & 183 Seneca, South Carolina
Containment Type Prestressed, post-tensioned concrete
NSSS Supplier, Type B&W, PWR
Docket No. 50-270
License No. DPR-47
B. Technical Data
Containment Net 1,836,000 cu. ft. Free Air Volume
Design Pressure, P 61.5 psig
Design Temperature, T 150 OF
Calculated Peak Accident 59.0 psig Pressure, Pa
Calculated Peak Accident 286 OF
Temperature
Maximum Allowable 0.250 wt. % / day Leakage Rate, La
C. Test Results - Type A Test
1. Test Method Absolute
2. Test Pressure 60.48,psig
3. Data Analysis Total Time (per BN-TOP-1, 1972), Techniques Mass Point (for information only,
per ANSI/ANS 56.8-1987)
4. LRT Acceptance 0.1875 wt. % / day Criteria (< 0.75 La)
4

Oconee Unit 2
5. Type A Test Results BN-TOP-1 ANSI 56.8 Total Time Mass Point
Simple Leakage Rate 0.1143 wt.%/day 0.1143 wt.%/day Fitted Leakage Rate (L.) 0.1169 wt.%/day 0.1152 wt.%/day Upper 95 % Confidence Level 0.1506 wt.%/day 0.1190 wt.%/day
6. All acceptance criteria for the Reduced Duration BN-TOP-i ILRT were satisfied in 6.5 hours.. A printout of the BN-TOP-l Total Time Termination Criteria is included in Appendix B. Report printouts and data plots for both the Total Time and the Mass Point Analysis techniques are also provided in Appendix B.
D. Verification Controlled Leakage Rate Test Results
1. Verification Test Super- 15.59 SCFM (0.2446 wt.%/day) imposed Leakage Rate (Lo)
2. Verification Test Total Time Analysis Results and Limits
Upper Limit 0.4240 wt.%/day (Lo + L. + 0.25 La)
Verification Test Total 0.3031 wt.%/day Time Results (Lc)
Lower Limit 0.2990 wt.%/day (Lo + L. - 0.25 La)
3. Verification Test Mass Point Analysis Results and Limits (Presented for information only)
Upper Limit 0.4223 wt.%/day (Lo + La + 0.25 La)
Verification Test Mass 0.3264 wt.%/day Point Results (Le)
Lower Limit 0.2973 wt.%/day (Lo + L. - 0.25 La)
4. The report printouts and data plots for both the Total Time Analysis and Mass Point Analysis techniques are provided in Appendix C.
E. Test Results - Type B and C Tests
A summary of the local leakage rate test results conducted since the last Unit 2
5
Oconee Unit 2
JLRT conducted in October, 1990 is included in Appendix F.
F. Integrated Leakage Rate Measurement System
The containment system was equipped with instrumentation to permit leakage rate
determination by the absolute method. Data from the absolute system is reduced to a
containment air mass by application of the Ideal Gas Law. The leakage rate is equal to
the time rate of change of this value. The mass of dry air, W within containment is
calculated as follows:
( P-P) V W=
RT
where: P = Containment Total Absolute Pressure
Pv = Containment Water Vapor Pressure (Average) V = Containment Net Free Volume R = Gas Constant for Air T = Containment Absolute Temperature (Average)
The primary measurement variables required are containment absolute pressure,
containment dew point temperature and containment temperature as a function of time.
During the supplemental verification test, the calibrated leakage imposed on the
existing leakage in the containment system is also recorded.
1. Absolute Pressure (2 Sensors)
Type: Paroscientific Model 760-A Portable Field Standard Range: 0-100 psia Relative Accuracy: + 0.01 % Full Scale Repeatability: + 0.005 % Full Scale Sensitivity: + 0.0001 psia Calibration Date: March 17-18, 1993
The sensors provide an RS232 direct digital input to the computer. Both sensors were used with a weighting factor of 0.5 in the leakage rate calculations.
2. Dew Point Temperature (6 Sensors)
Type: General Eastern Hygro-El Optical Dew Point Monitor with Model 111 1H single stage sensor
6
Oconee Unit 2
Range: -40'F - 140'F, Analog output rescaled from 20'F - IOOT dew point, corresponding to 4 - 20 mA.
Accuracy: + 1.0 OF Repeatability: + 0.090F Sensitivity: + 0.090F Calibration Date: May 5-10, 1993
3. Dry Bulb Temperature (23 Sensors)
Type: Rosemount Model No. 78S, 4 wire, 100 ohm platinum Resistance Temperature Detector, RTD
Calibrated Range: OoF - 200oF Accuracy: + 0.450F over entire range Sensitivity: + 0.090F (for conservatism, the manuf. specified
repeatability is used for this value in the ISG calculation.) Calibration Date: April 27, 1993
4. Data Acquisition System
The data acquisition system consists of a Fluke 2289A Helios system front end which interfaces with an IBM compatible, 486 processor computer. The Fluke system acquires data from the dew point sensors and the dry bulb temperature sensors. The required cards and pertinent data are as follows:
Dew Point - DC current measurement
Cards Required: 161 High Performance A/D 162 Thermocouple / DC Volts 171 Current Input Connector
Range: +64 mA * Accuracy: + 0.02 % of Input, + 5 uA (150C-350C Operating Temp.)
Repeatability: + 0.015 % of Input, + 2 uA Resolution: 0.6uA Calibration Date: April 21, 1993
* Note: Accuracy improved over manuf. stated spec. due to change to 8 ohm, + 0.01 % precision resistors.
Temperature - RTD Resistance Measurement
Cards Required: 161 High Performance A/D 163 RTD / Resistance Scanner 177 RTD / Resistance Input Connector
Range: 256 ohms Accuracy: + 0.0175 % of Input, + 5.7 m ohms (15oC-35 0C Operating
Temp)
7
Oconee Unit 2
Repeatability: + 0.005 % of Input, ±4 m ohms Resolution: 2.4 m ohms Calibration Date: April 21, 1993
5. Verification Flow (2 flowmeters)
Type: Brooks Hi-Accuracy, Full-View Flowmeter, Model No. 1110, 1OK3BlA
Calibrated Range: 0 - 9.5 SCFM Accuracy: + 1 % Full Scale Calibration Dates: April 28, 1993
Two flowmeters are installed in parallel for the verification test. The imposed leak rate is equal to the sum of the readings from the two meters.
6. Instrumentation Selection Guide (ISG) Calculation
The ISG calculation is a method used to evaluate the total instrumentation systems' ability to detect leakage rates in the range required. The ISG formula is described in ANSI/ANS 56.8-1987, Appendix G and requires that the sensitivity must be at least four times better than the containment's allowable leakage (ISG ; 0.25 La). The ISG calculated for the instrumentation used for this test was 0.0336 wt.%/day for the 6.5 hour test. The allowable value for this test is 0.0625 wt.%/day..
The ISG value given by the computer for the end of test data point reflects actual containment atmospheric conditions and the number of sensors in service at that time. For this test, the ISG value is based on 2 pressure sensors, 6 dew point sensors and 23 temperature sensors.
7. Sensor Calibration Information and Volume Fractions
Appendix D, Miscellaneous Information contains a Sensor Information report. This report lists the calibration coefficients for each sensor, instrument serial numbers, DAS channel assignments and final volume fraction assignments as installed for the 1993 ILRT.
G. Description of Computer Program
The Duke Power ILRT is written in the C programming language and runs under
the Microsoft (R) Windows operating environment. Through use of pull down menus,
the user is made aware of all program options at any given time. All data including
individual sensor readings, containment average readings and leakage calculations are
8
Oconee Unit 2
accessible through spreadsheet data display windows, graphs, standardized reports, custom reports and data files written to disk. The program provides for multiple views of test data, both graphical and tabular, and also provides for real time updating of the displays with each new data set. Both ANSI 56.8 mass point and BN-TOP-1 total time leakage calculations are performed concurrently.
The ILRT program actually consists of two separate programs. The main program, called LEAK.EXE, is a generic data analysis and reporting program. It can be used at any facility with no changes required, as its personality is derived from a configuration file developed prior to each test. The configuration file specifies all plant specific information, such as station name, unit number, number of compartments in containment, number of each sensor type within each compartment, sensor calibration
constants, volume fractions, serial numbers, DAS channel assignments and containment
volume. The second program, called DATACQ.EXE, controls data acquisition and is customized for the type of system being used.
The TLRT program calculations were verified prior to test performance by loading a hand verified benchmark Raw Data File and Configuration Data file into the
subdirectory containing the ILRT program. Following selection of the Configuration
data file, a Test Data file was recalculated by the program. Having rebuilt the Test Data
File, all calculated values output by the program were compared with the benchmark
calculations. Exact agreement (to the same number of significant figures given in the
Benchmark Summary) was achieved between the benchmark calculation and the ILRT
program output.
H. Information Retained at Plant
The following information is available for review at Oconee Nuclear Station:
1. A listing of all containment penetrations, including the total number of like penetrations, penetration size and function.
2. A listing of normal operating instrumentation used for the leakage rate test.
3. A system lineup (at time of test), showing required valve positions and status of piping systems.
4. A continuous sequential log of events from initial survey of containment to
9
Oconee Unit 2
restoration of all tested systems.
5. Documentation of instrumentation calibration and standards.
6. The working copy of the test procedure that includes signature sign-off of procedural steps.
7. The procedure and all data that would verify completion of penetrations and valve testing (Type B and C tests), including as found leakage rates, corrective action taken, and final leak rate.
8. A listing of all test exceptions including changes in containment system boundaries instituted by Oconee to conclude successful testing.
9. Description of method of leak rate verification of instrument measuring system (superimposed leakage), with calibration information on flowmeters along with calculations that were used to measure the verification leakage rate.
10. The Instrumentation Selection Guide (ISG) Calculation
11. The P&ID's of pertinent systems.
IV. ANALYSIS AND INTERPRETATION
A. LRT Test Corrections
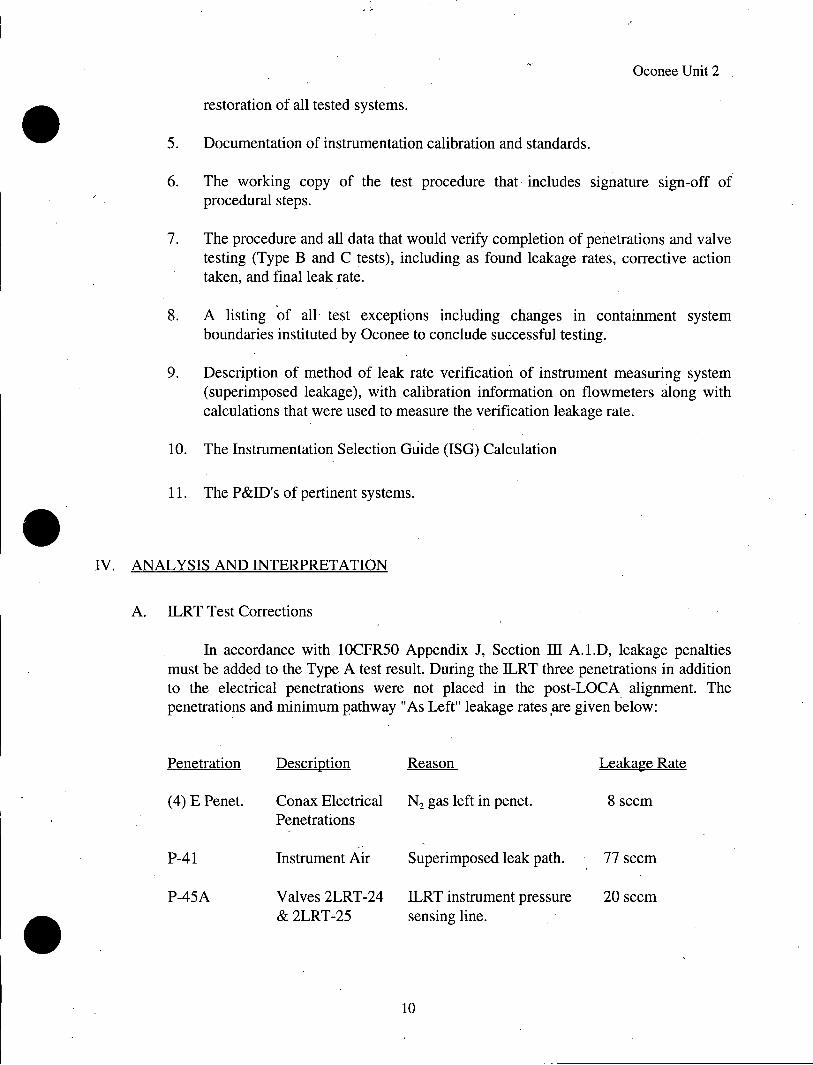
In accordance with 10CFR50 Appendix J, Section M A. 1.D, leakage penalties must be added to the Type A test result. During the LLRT three penetrations in addition to the electrical penetrations were not placed in the post-LOCA alignment. The penetrations and minimum pathway "As Left" leakage rates are given below:
Penetration Description Reason Leakage Rate
(4) E Penet. Conax Electrical N2 gas left in penet. 8 sccm Penetrations
P-41 Instrument Air Superimposed leak path. 77 sccm
P-45A Valves 2LRT-24 JLRT instrument pressure 20 sccm & 2LRT-25 sensing line.
10
Oconee Unit 2
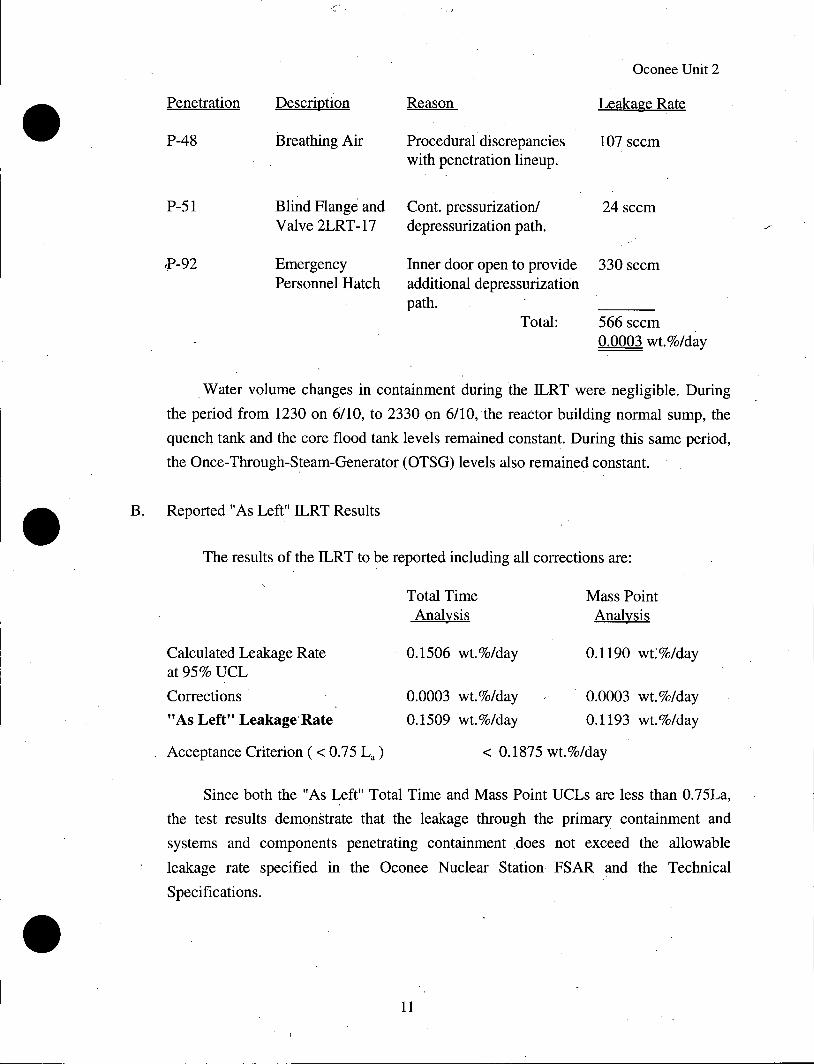
Penetration Description Reason Leakage Rate
P-48 Breathing Air Procedural discrepancies 107 sccm with penetration lineup.
P-51 Blind Flange and Cont. pressurization/ 24 sccm Valve 2LRT-17 depressurization path.
iP-92 Emergency Inner door open to provide 330 sccm Personnel Hatch additional depressurization
path.
Total: 566 sccm 0.0003 wt.%/day
Water volume changes in containment during the LRT were negligible. During
the period from 1230 on 6/10, to 2330 on 6/10, the reactor building normal sump, the
quench tank and the core flood tank levels remained constant. During this same period,
the Once-Through-Steam-Generator (OTSG) levels also remained constant.
B. Reported "As Left" ILRT Results
The results of the ILRT to be reported including all corrections are:
Total Time Mass Point Analysis Analysis
Calculated Leakage Rate 0.1506 wt.%/day 0.1190 wt.%/day at 95% UCL
Corrections 0.0003 wt.%/day 0.0003 wt.%/day
"As Left" Leakage Rate 0.1509 wt.%/day 0.1193 wt.%/day
Acceptance Criterion ( < 0.75 La) < 0.1875 wt.%/day
Since both the "As Left" Total Time and Mass Point UCLs are less than 0.75La,
the test results demonstrate that the leakage through the primary containment and
systems and components penetrating containment does not exceed the allowable
leakage rate specified in the Oconee Nuclear Station FSAR and the Technical
Specifications.
11
Oconee Unit 2
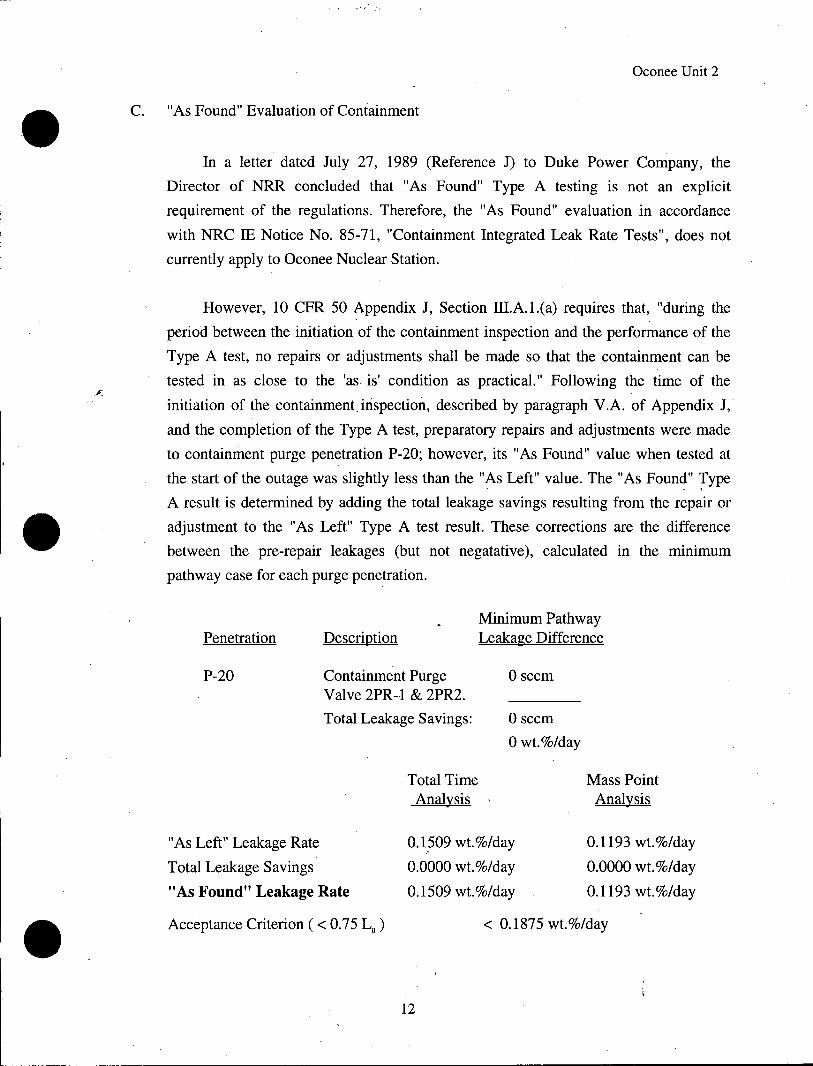
C. "As Found" Evaluation of Containment
In a letter dated July 27, 1989 (Reference J) to Duke Power Company, the
Director of NRR concluded that "As Found" Type A testing is not an explicit
requirement of the regulations. Therefore, the "As Found" evaluation in accordance
with NRC IE Notice No. 85-71, "Containment Integrated Leak Rate Tests", does not
currently apply to Oconee Nuclear Station.
However, 10 CFR 50 Appendix J, Section III.A.1.(a) requires that, "during the
period between the initiation of the containment inspection and the performance of the
Type A test, no repairs or adjustments shall be made so that the containment can be
tested in as close to the 'as. is' condition as practical." Following the time of the
initiation of the containment. inspection, described by paragraph V.A. of Appendix J,
and the completion of the Type A test, preparatory repairs and adjustments were made
to containment purge penetration P-20; however, its "As Found" value when tested at
the start of the outage was slightly less than the "As Left" value. The "As Found" Type
A result is determined by adding the total leakage savings resulting from the repair or
adjustment to the "As Left" Type A test result. These corrections are the difference
between the pre-repair leakages (but not negatative), calculated in the minimum
pathway case for each purge penetration.
Minimum Pathway Penetration Description Leakage Difference
P-20 Containment Purge 0 sccm Valve 2PR-1 & 2PR2.
Total Leakage Savings: 0 sccm
0 wt.%/day
Total Time Mass Point Analysis Analysis
"As Left" Leakage Rate 0.1509 wt.%/day 0.1193 wt.%/day
Total Leakage Savings 0.0000 wt.%/day 0.0000 wt.%/day
"As Found" Leakage Rate 0.1509 wt.%/day 0.1193 wt.%/day
Acceptance Criterion (< 0.75 La) < 0.1875 wt.%/day
12
Oconee Unit 2 . V. REFERENCES
A. Oconee Nuclear Station FSAR Sections 3.8.1.7.3 and 3.8.1.7.4.
B. Oconee Nuclear Station Technical Specifications; Section 4.4.1.1.
C. Oconee Nuclear Station, Procedure PT/2/A/0150/03A, Unit 2, Reactor Building Integrated Leak RateTest, Change 10.
D. Oconee Nuclear Station, Procedure PT/2/A/0150/03C, Integrated Leak Rate Test Penetration Venting and Draining , Change 7.
E. Duke Power Company Integrated Leak Rate Test Software Documentation, Version 1.76.
F. Oconee Nuclear Station, Procedure MP/2/A/3005/010, Unit 2, Reactor Building Civil Inspection for Integrated Leak Rate Test (ILRT), Change 3.
G. Code of Federal Regulations, Title 10, Part 50, Appendix J, "Primary Reactor Containment Leakage Testing for Water Cooled Power Reactors".
H. ANSI/ANS 56.8-1987, "Containment System Leakage Testing Requirements".
I. Bechtel Topical Report BN-TOP-1, "Testing Criteria for Integrated Leakage Rate Testing of Primary Containment Structures for Nuclear Power Plants", Revision 1, 1972.
J. ANSI N45.4-1972, "Leakage-Rate Testing of Containment Structures for Nuclear Reactors".
K. July 27, 1989 Letter to Mr. H. B. Tucker, Vice President Duke Power Company from Mr. Thomas E. Murley, Director Office of Nuclear Regulation, Determination of Backfit Appeal Regarding Containment Integrated Leakage Rate Testing at Oconee, McGuire, and Catawba Nuclear Station (TACS 68443-68449).
0 13
Oconee Unit 2
0 SECTION VI
APPENDICES
14
Oconee Unit 2
APPENDIX A
Temperature Stabilization Phase Data and Graphs Reading No. 61 to 93
Reports:
* BN-TOP- 1 Temperature Stabilization Criteria * Mass Point Temperature Stabilization Criteria * Containment Calculated Values by Reading No.
Graphs:
* Containment Mass * Average Pressure & Average Temperature * Average Vapor Pressure * Average Dew Point
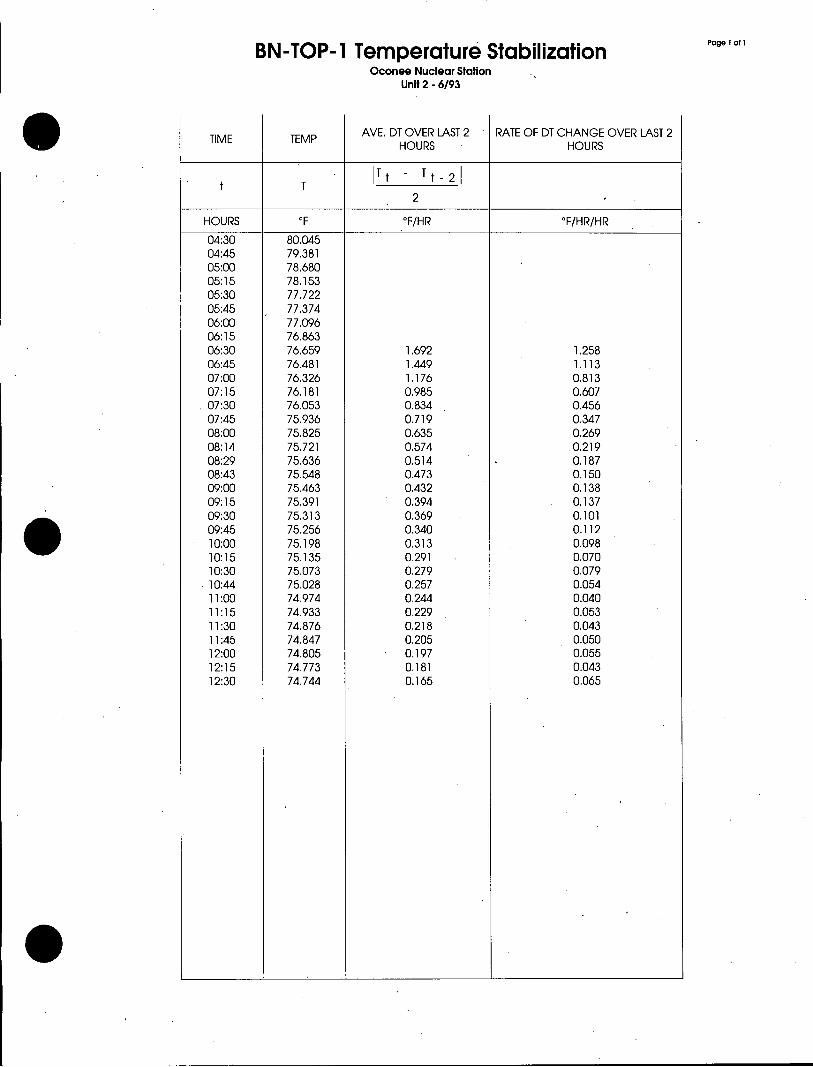
BN-TOP- 1 Temperature Stabilization Page 1
Oconee Nuclear Station Unit 2 - 6/93
AVE. DT OVER LAST 2 RATE OF DT CHANGE OVER LAST 2 HOURS HOURS
t T Tt - Tt- 2
2
HOURS oF oF/HR 'F/HR/HR
04:30 80.045 04:45 79.381 05:00 78.680 05:15 78.153 05:30 77.722 05:45 77.374 06:00 77.096 06:15 76.863 06:30 76.659 1.692 1.258 06:45 76.481 1.449 1.113 07:00 76.326 1.176 0.813 07:15 76.181 0,985 0.607 07:30 76.053 0.834 0.456 07:45 75.936 0.719 0.347 08:00 75.825 0.635 0.269 08:14 75.721 0.574 0.219 08:29 75.636 0.514 0.187 08:43 75.548 0.473 0.150 09:00 75.463 0.432 0.138 09:15 75.391 0.394 0.137 09:30 75.313 0.369 0.101 09:45 75.256 0.340 0.112 10:00 75.198 0.313 0.098 10:15 75.135 0.291 0.070 10:30 75.073 0.279 0.079 10:44 75.028 0.257 0.054 11:00 74.974 0.244 0.040 11:15 74.933 0.229 0.053 11:30 74.876 0.218 0.043 11:45 74.847 0.205 0.050 12:00 74.805 0.197 0.055 12:15 74.773 0.181 0.043 12:30 74.744 0.165 0.065
0 __ __
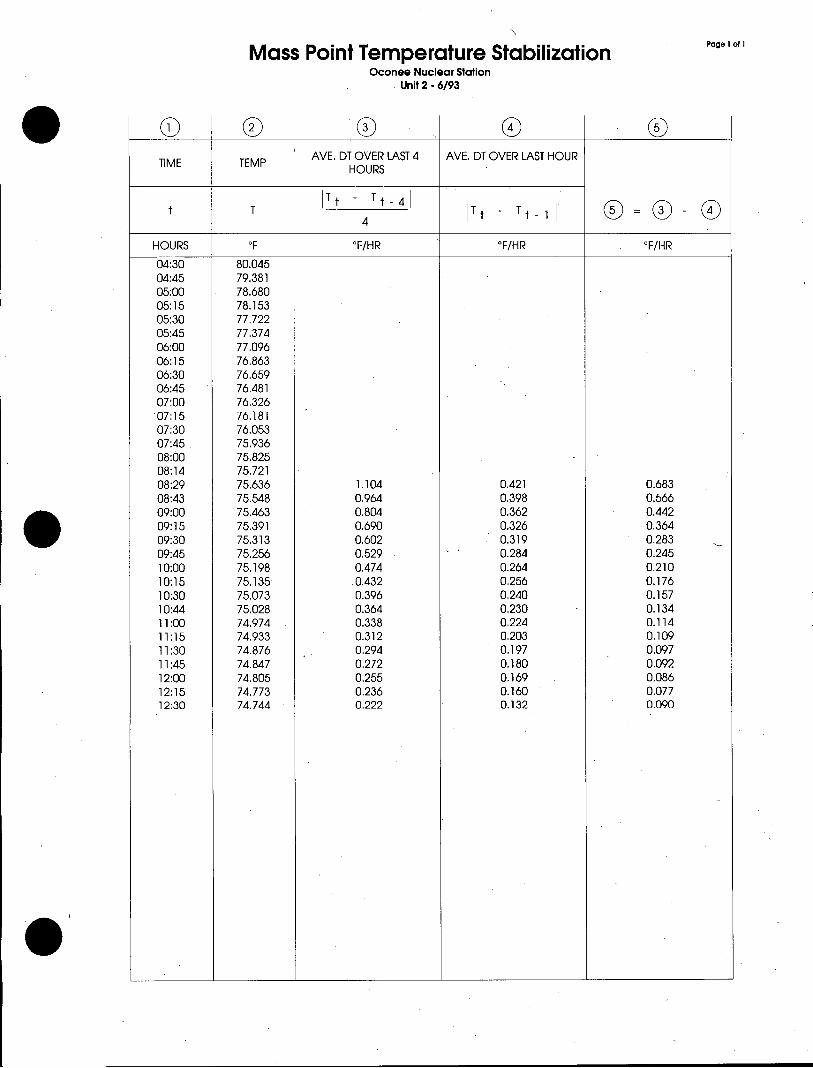
Mass Point Temperature Stabilization Page ofn
Oconee Nuclear Station Unit 2 - 6/93
TIME TEMP AVE. DT OVER LAST 4 AVE. DT OVER LAST HOUR HOURS
T Tt - TT - Tt 1
HOURS oF 0F/HR 0F/HR 'F/HR
04:30 80.045 04:45 79.381 05:00 78.680 05:15 78.153 05:30 77.722 05:45 77.374 06:00 77.096 06:15 76.863 06:30 76.659 06:45 76.481 07:00 76.326 07:15 76.181 07:30 76.053 07:45 75.936 08:00 75.825 08:14 75.721 08:29 75.636 1.104 0.421 0,683 08:43 75.548 0.964 0.398 0.566 09:00 75.463 0.804 0.362 0.442 09:15 75.391 0.690 0.326 0.364 09:30 75.313 0.602 0.319 0.283 09:45 75.256 0.529 0.284 0.245 10:00 75,198 0.474 0.264 0.210 10:15 75.135 .0.432 0,256 0.176 10:30 75.073 0.396 0.240 0.157 10:44 75.028 0.364 0.230 0.134 11:00 74.974 0.338 0.224 0.114 11:15 74.933 0.312 0.203 0.109 11:30 74.876 . 0,294 0.197 0.097 11:45 74.847 0.272 0.180 0.092 12:00 74.805 0,255 0.169 0.086 12:15 74.773 0.236 0.160 0.077 12:30 74.744 0.222 0.132 0.090
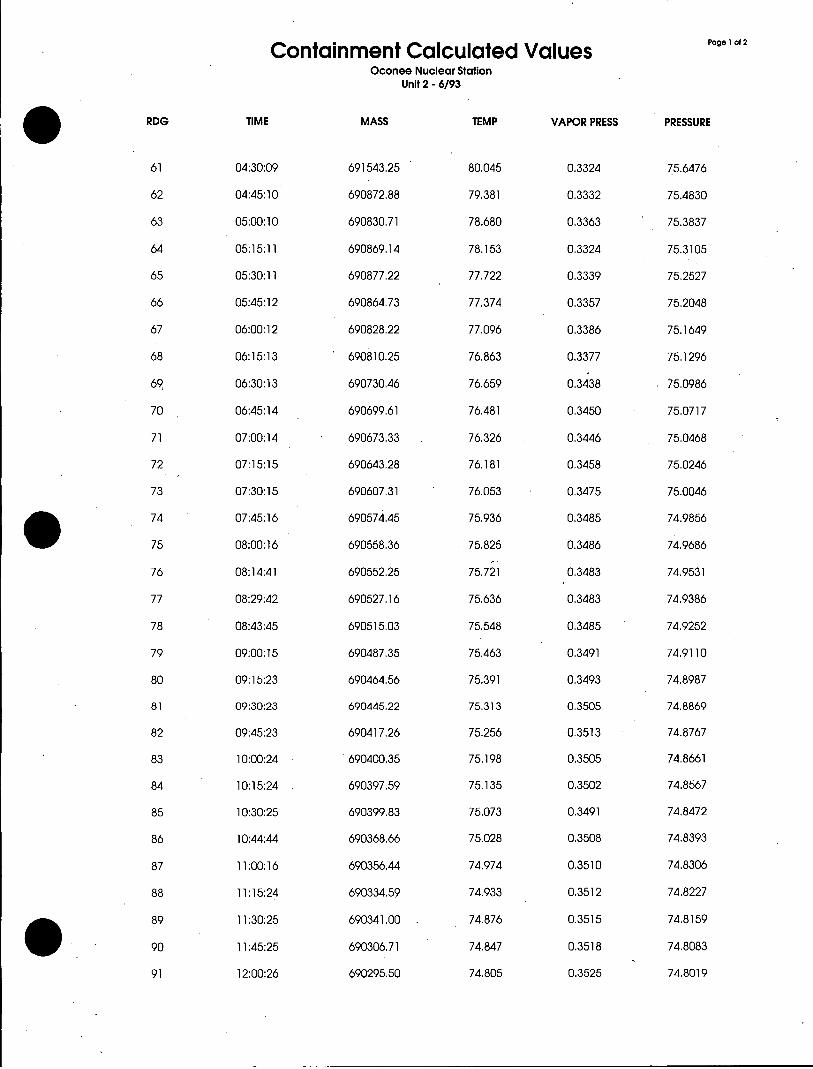
Containment Calculated Values P1 of Oconee Nuclear Station
Unit 2 - 6/93
RDG TIME MASS TEMP VAPOR PRESS PRESSURE
61 04:30:09 691543.25 80.045 0.3324 75.6476
62 04:45:10 690872.88 79.381 0.3332 75.4830
63 05:00:10 690830.71 78,680 0.3363 75.3837
64 05:15:11 690869.14 78.153 0.3324 75.3105
65 05:30:11 690877.22 77.722 0.3339 75,2527
66 05:45:12 690864.73 77.374 0.3357 75.2048
67 06:00:12 690828.22 77.096 0.3386 75.1649
68 06:15:13 690810.25 76.863 0.3377 75.1296
69 06:30:13 690730.46 76.659 0.3438 75,0986
70 06:45:14 690699.61 76.481 0,3450 75.0717
71 07:00:14 690673.33 76.326 0.3446 75.0468
72 07:15:15 690643.28 76.181 0.3458 75.0246
73 07:30:15 690607.31 76.053 0.3475 75.0046
74 07:45:16 690574.45 75.936 0.3485 74.9856
75 08:00:16 690558.36 75.825 0.3486 74.9686
76 08:14:41 690552.25 75.721 0.3483 74.9531
77 08:29:42 690527.16 75.636 0.3483 74.9386
78 08:43:45 690515.03 75.548 0.3485 74.9252
79 09:00:15 690487.35 75.463 0.3491 74.9110
80 09:15:23 690464.56 75.391 0.3493 74.8987
81 09:30:23 690445.22 75.313 0.3505 74.8869
82 09:45:23 690417.26 75.256 0.3513 74.8767
83 10:00:24 690400.35 75.198 0.3505 74.8661
84 10:15:24 690397.59 75.135 0.3502 74.8567
85 10:30:25 690399.83 75.073 0.3491 74.8472
86 10:44:44 690368.66 75.028 0.3508 74.8393
87 11:00:16 690356.44 74.974 0.3510 74.8306
88 11:15:24 690334.59 74.933 0.3512 74.8227
89 11:30:25 690341.00 74.876 0.3515 74.8159
90 11:45:25 690306.71 74.847 0.3518 74.8083
91 12:00:26 690295.50 74.805 0.3525 74.8019
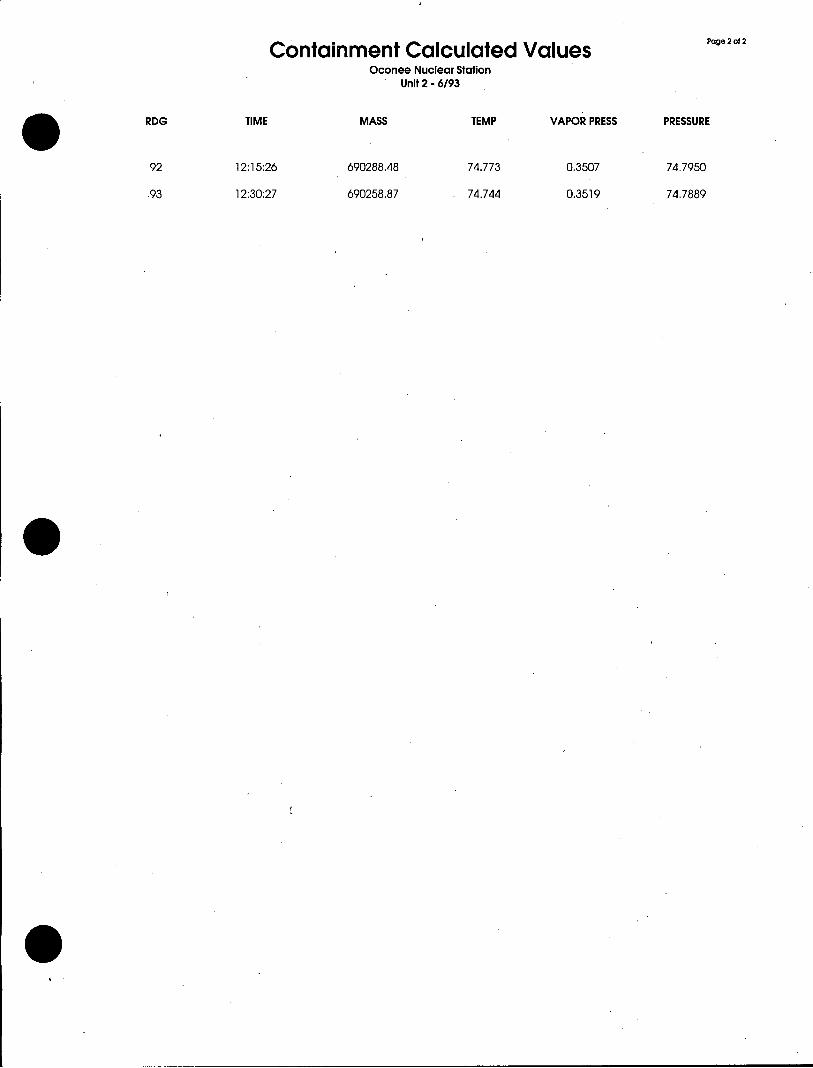
Containment Calculated Values Page 2of2
Oconee Nuclear Station Unit 2 - 6/93
RDG TIME MASS TEMP VAPOR PRESS PRESSURE
92 12:15:26 690288.48 74.773 0.3507 74.7950
93 12:30:27 690258.87 . 74.744 0.3519 74.7889
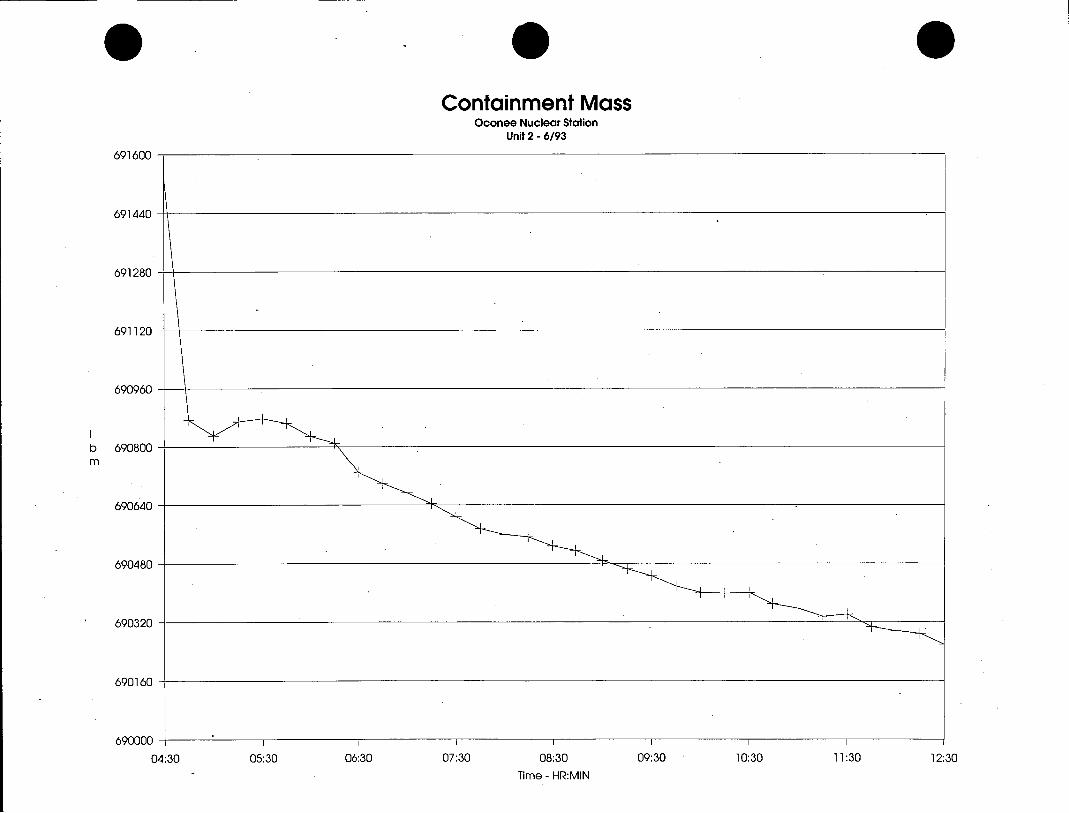
Containment Mass Oconee Nuclear Station
Unit 2 - 6/93
691600
691440
691280
691120
690960
b 690800 m
690640
690480
690320
690160
690000
04:30 05:30 06:30 07:30 08:30 09:30 10:30 11:30 12:30 Time - HR:MIN
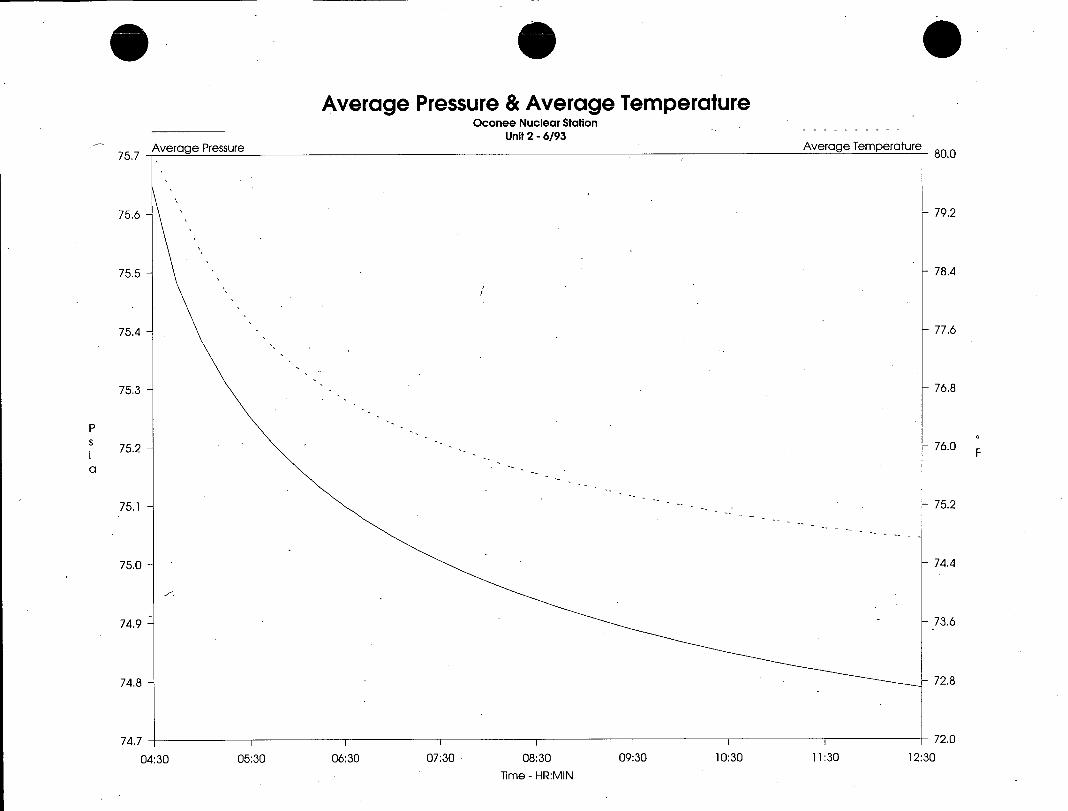
Average Pressure & Average Temperature Oconee Nuclear Station
Unit 2 - 6/93
75.7 Average Pressure Average Temperature 80.0
75.6 79.2
75.5 - 78.4
75.4 77.6
75.3 76.8
P
S 75.2 76.0 F a
75.1 -- 75.2
75.0 - 74.4
74.9 - -- 73.6
74.8 72.8
74.7 I I I I I72.0
04:30 05:30 06:30 07:30 08:30 09:30 10:30 11:30 12:30
Time - HR:MIN
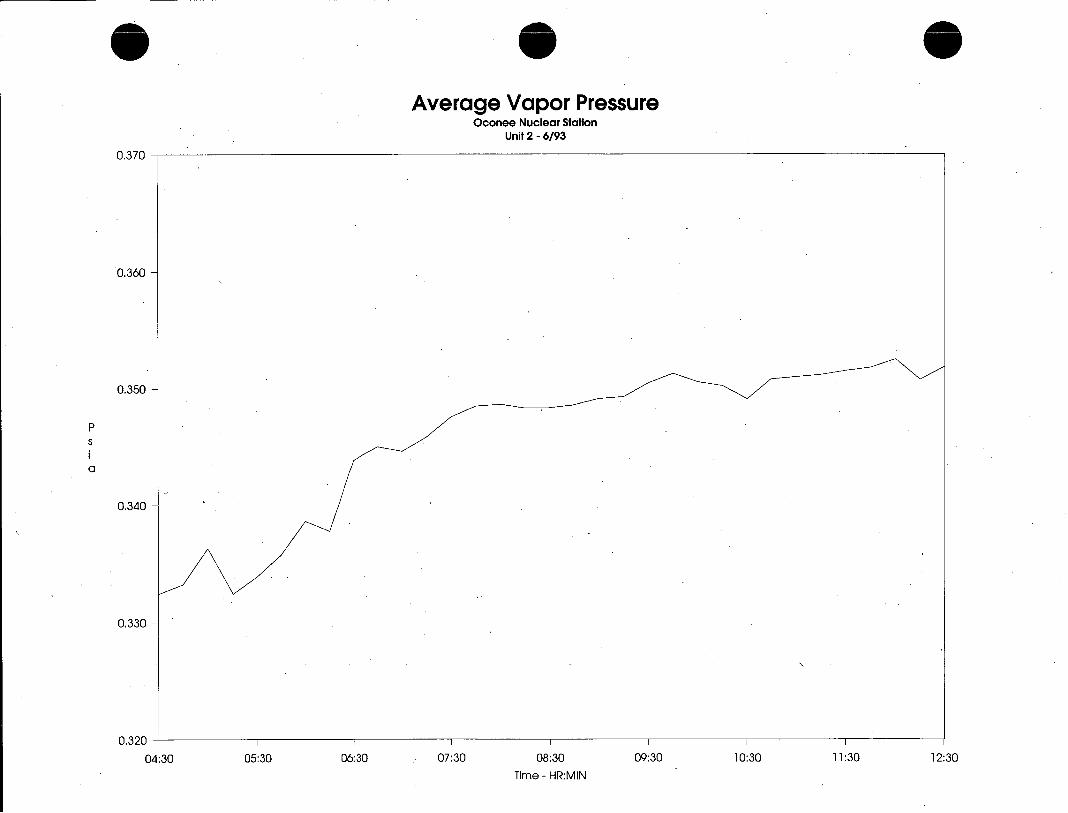
Average Vapor Pressure Oconee Nuclear Station
Unit 2 - 6/93
0.370
0.360
0.350
P S
a
0.340
0.330
0.320
04:30 05:30 06:30 07:30 08:30 09:30 10:30 11:30 12:30 Time - HR:MIN

Average Dew Point Oconee Nuclear Station
Unit 2 - 6/93
71.0
70.0
69.0
F
68.0
67.0
66.0
04:30 05:30 06:30 07:30 08:30 09:30 10:30 11:30 12:30 Time - HR:MIN
Oconee Unit 2
APPENDIX B
Integrated Leakage Rate Test Data and Graphs Reading No. 93 to 119
Reports:
* BN-TOP- 1 Total Time Test Termination Criteria * Total Time Leak Rate Analysis * Mass Point Leak Rate Analysis * Containment Calculated Values by Reading No.
Graphs:
* Total Time Leak at UCL and Calculated Total Time Leak * Mass Point Leak at UCL and Mass Point Leak * Containment Mass * Average Pressure * Average Vapor Pressure * Average Temperature
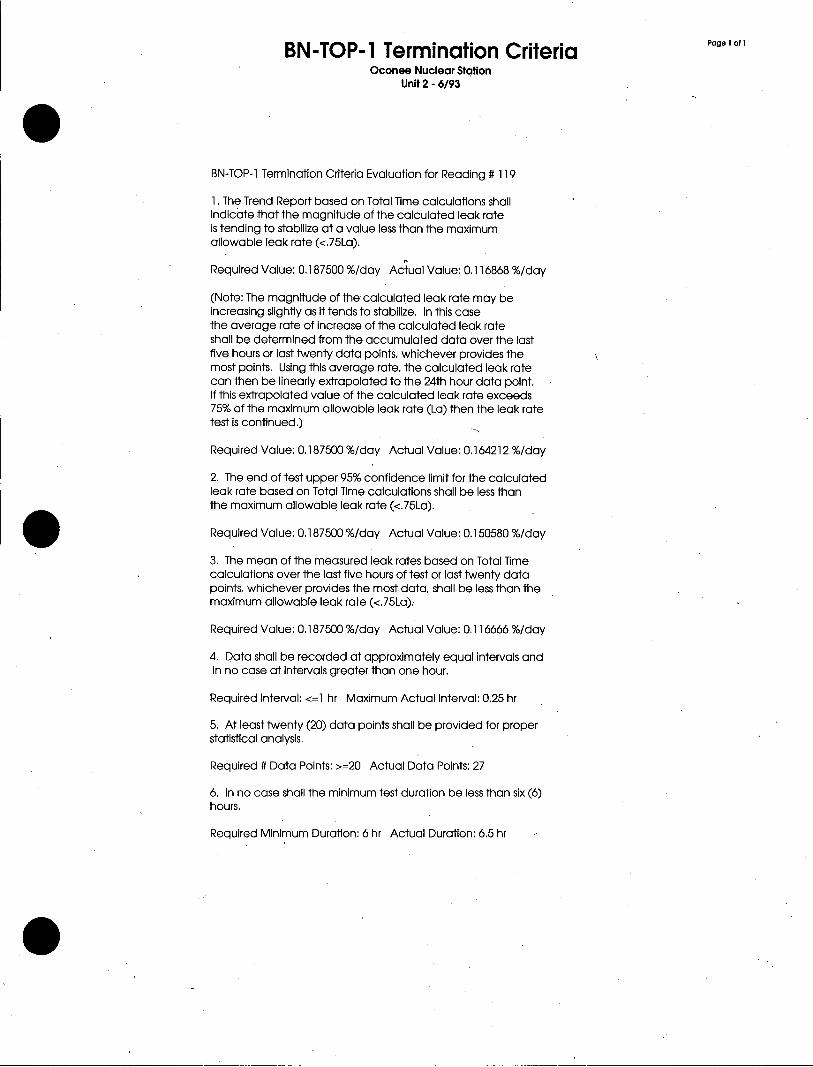
BN-TOP-1 Termination Criteria Page 1 of 1
Oconee Nuclear Station Unit 2 - 6/93
BN-TOP-1 Termination Criteria Evaluation for Reading # 119
1. The Trend Report based on Total Time calculations shall indicate that the magnitude of the calculated leak rate is tending to stabilize at a value less than the maximum allowable leak rate (<.75La).
Required Value: 0.187500 %/day Actual Value: 0,116868 %/day
(Note: The magnitude of the calculated leak rate may be increasing slightly as it tends to stabilize. In this case the average rate of increase of the calculated leak rate shall be determined from the accumulated data over the last five hours or last twenty data points, whichever provides the most points. Using this average rate, the calculated leak rate can then be linearly extrapolated to the 24th hour data point. If this extrapolated value of the calculated leak rate exceeds 75% of the maximum allowable leak rate (La) then the leak rate test is continued,)
Required Value: 0.187500 %/day Actual Value: 0,164212 %/day
2. The end of test upper 95% confidence limit for the calculated leak rate based on Total Time calculations shall be less than the maximum allowable leak rate (<.75La).
Required Value: 0.187500 %/day Actual Value: 0.150580%/day
3. The mean of the measured leak rates based on Total Time calculations over the last five hours of test or last twenty data points, whichever provides the most data, shall be less than the maximum allowable leak rate (<.75La).
Required Value: 0.187500 %/day Actual Value: 0.116666%/day
4. Data shall be recorded at approximately equal intervals and in no case at intervals greater than one hour.
Required Interval: <=1 hr Maximum Actual Interval: 0.25 hr
5. At least twenty (20) data points shall be provided for proper statistical analysis,
Required # Data Points: >=20 Actual Data Points: 27
6. In no case shall the minimum test duration be less than six (6) hours.
Required Minimum Duration: 6 hr Actual Duration: 6,5 hr
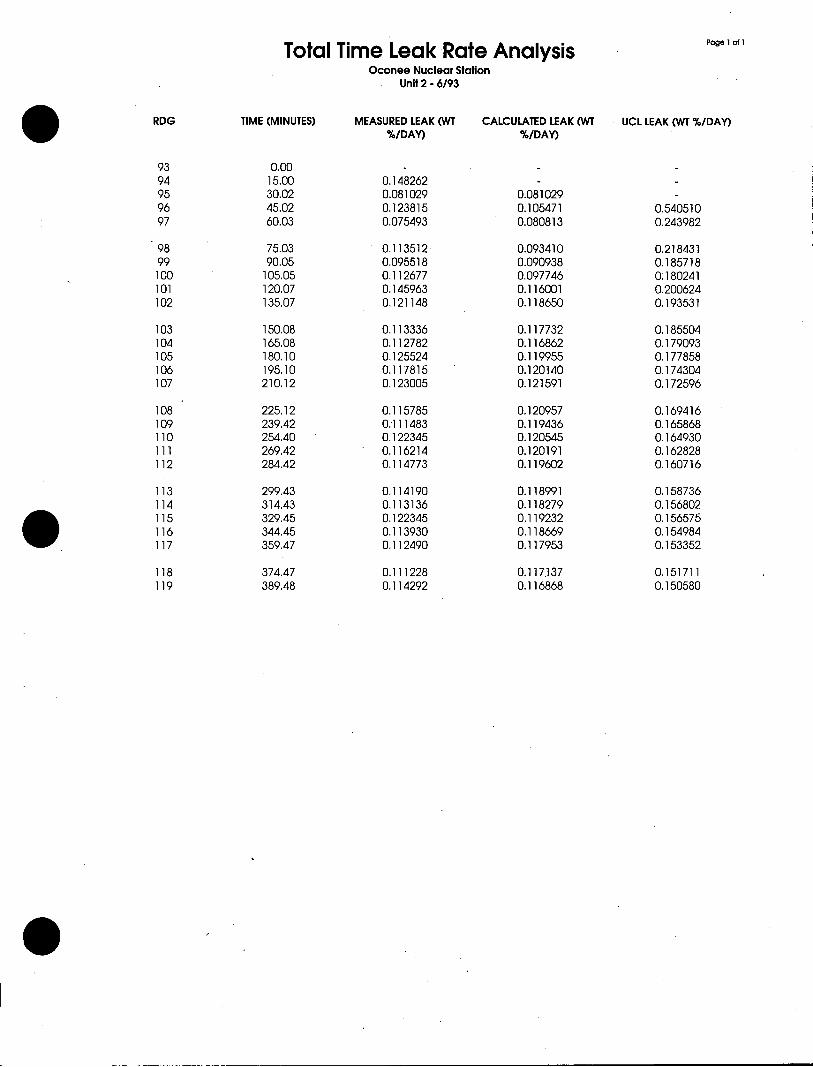
Total Time Leak Rate Analysis Page 1 of 1
Oconee Nuclear Station Unit 2 - 6/93
RDG TIME (MINUTES) MEASURED LEAK (WT CALCULATED LEAK (WT UCL LEAK (WT %/DAY) %/DAY) %/DAY)
93 0.00 94 15.00 0.148262 95 30.02 0.081029 0.081029 96 45.02 0.123815 0.105471 0.540510 97 60.03 0.075493 0.080813 0.243982
98 75.03 0.113512 0.093410 0.218431 99 90.05 0.095518 0.090938 0.185718 100 105.05 0.112677 0.097746 0.180241 101 120.07 0.145963 0.116001 0,200624 102 135.07 0.121148 0.118650 0.193531
103 150.08 0.113336 0.117732 0.185504 104 165.08 0.112782 0.116862 0.179093 105 180.10 0.125524 0.119955 0.177858 106 195.10 0.117815 0.120140 0.174304 107 210.12 0.123005 0.121591 0.172596
108 225.12 0.115785 0.120957 0.169416 109 239.42 0.111483 0.119436 0.165868 110 254.40 0.122345 0.120545 0.164930 111 269.42 0.116214 0.120191 0.162828 112 284.42 0.114773 0.119602 0.160716
113 299.43 0.114190 0.118991 0.158736 114 314.43 0,113136 0.118279 0.156802 115 329.45 0.122345 0.119232 0.156575 116 344.45 0.113930 0.118669 0,154984 117 359.47 0.112490 0.117953 0.153352
118 374.47 0.111228 0.117.137 0.151711 119 389.48 0.114292 0.116868 0.150580
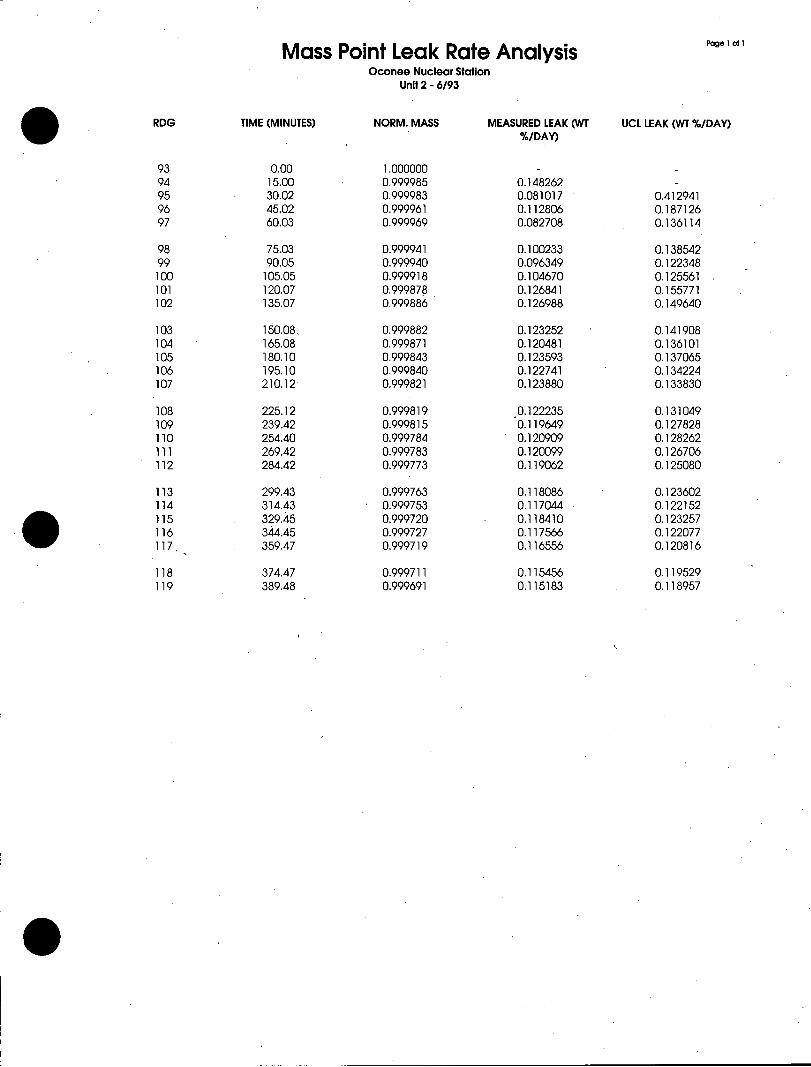
Mass Point Leak Rate Analysis Page Ilof 1
Oconee Nuclear Station Unit 2 - 6/93
RDG TIME (MINUTES) NORM. MASS MEASURED LEAK (WT UCL LEAK (WT %/DAY) %/DAY) 93 0.00 1.000000 94 15.00 0.999985 0.148262 95 30.02 0.999983 0.081017 0.412941 96 45.02 0.999961 0.112806 0.187126 97 60.03 0.999969 0.082708 0.136114
98 75.03 0.999941 0.100233 0.138542 99 90.05 0.999940 0.096349 0.122348 100 105.05 0.999918 0.104670 0.125561 101 120.07 0.999878 0.126841 0.155771 102 135.07 0.999886 0.126988 0.149640
103 150.08, 0.999882 0.123252 0.141908 104 165.08 0.999871 0.120481 0.136101 105 180.10 0.999843 0.123593 0.137065 106 195.10 0.999840 0.122741 0.134224 107 210.12 0.999821 0.123880 0.133830
108 225.12 0.999819 0.122235 0.131049 109 239.42 0.999815 0.119649 0.127828 110 254.40 0.999784 0.120909 0.128262 111 269.42 0.999783 0.120099 0.126706 112 284.42 0.999773 0.119062 0.125080
113 299.43 0.999763 0.118086 0.123602 114 314.43 0.999753 0.117044 0,122152 115 329.45 0.999720 0.118410 0.123257 116 344.45 0.999727 0.117566 0.122077 117. 359.47 0.999719 0.116556 0.120816
118 374.47 0.999711 0,115456 0,119529 119 389.48 0.999691 0.115183 0.118957
0
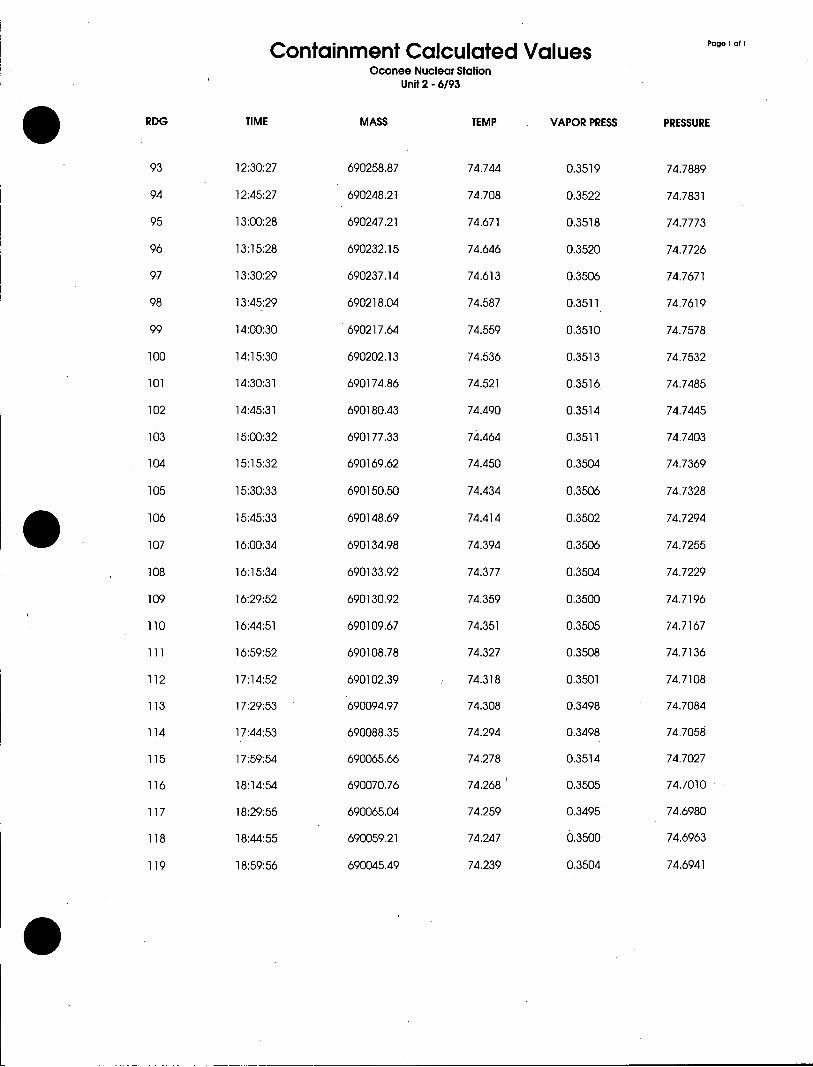
Containment Calculated Values page I on 1
Oconee Nuclear Station Unit 2 - 6/93
RDG TIME MASS TEMP VAPOR PRESS PRESSURE
93 12:30:27 690258.87 74.744 0.3519 74.7889
94 12:45:27 690248.21 74.708 0.3522 74.7831
95 13:00:28 690247.21 . 74.671 0.3518 74.7773
96 13:15:28 690232.15 74.646 0.3520 74,7726
97 13:30:29 690237.14 74.613 0.3506 74.7671
98 13:45:29 690218.04 74,587 0.3511 74.7619
99 14:00:30 690217.64 74.559 0.3510 74.7578
100 14:15:30 690202.13 74.536 0.3513 74.7532
101 14:30:31 690174.86 74.521 0.3516 74.7485
102 14:45:31 690180.43 74.490 0.3514 74.7445
103 15:00:32 690177.33 74.464 0.3511 74.7403
104 15:15:32 690169.62 74.450 0.3504 74.7369
105 15:30:33 690150.50- 74.434 0.3506 74.7328
106 15:45:33 690148.69 74.414 0.3502 74.7294
107 16:00:34 690134.98 74.394 0.3506 74.7255
108 16:15:34 690133.92 74.377 0.3504 74.7229
109 16:29:52 690130.92 74.359 0.3500 74.7196
110 16:44:51 690109.67 74.351 0.3505 74.7167
111 16:59:52 690108.78 74.327 0.3508 74.7136
112 17:14:52 690102.39 74.318 0.3501 74.7108
113 17:29:53 690094.97 74.308 0.3498 74.7084
114 17:44:53 690088.35 74.294 0.3498 74.7058
115 17:59:54 690065.66 74.278 0.3514 74.7027
116 18:14:54 690070.76 74.268 0.3505 74.7010
117 18:29:55 690065.04 74.259 0.3495 74.6980
118 18:44:55 690059.21 74.247 0.3500 74.6963
119 18:59:56 690045.49 74,239 0.3504 74.6941
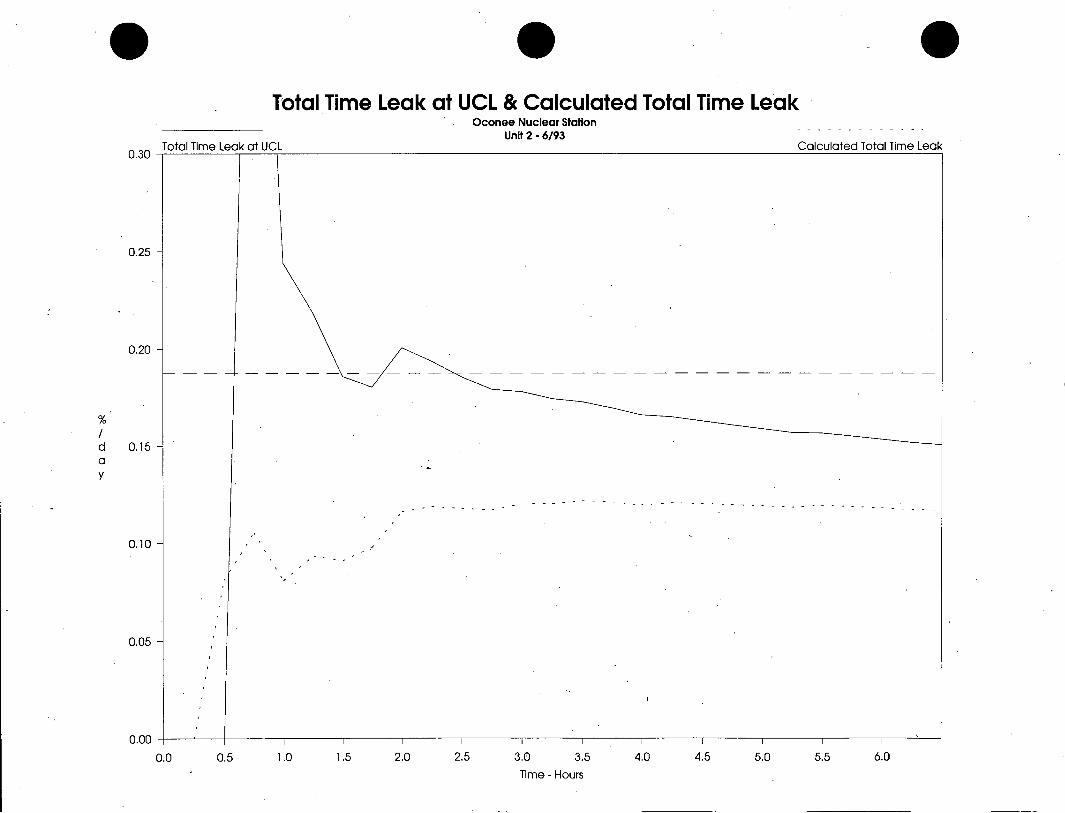
* g 0 Total Time Leak at UCL & Calculated Total Time Leak
Oconee Nuclear Station Unit 2 - 6/93
0.30 Total Time Leak at UCL Calculated Total Time Leak
0.25
0.20
d 0.15 a y
0.10
0.05
0.00
0.0 0.5 1.0 1.5 2.0 2.5 3.0 3.5 4.0 4.5 5.0 5.5 6.0 Time - Hours
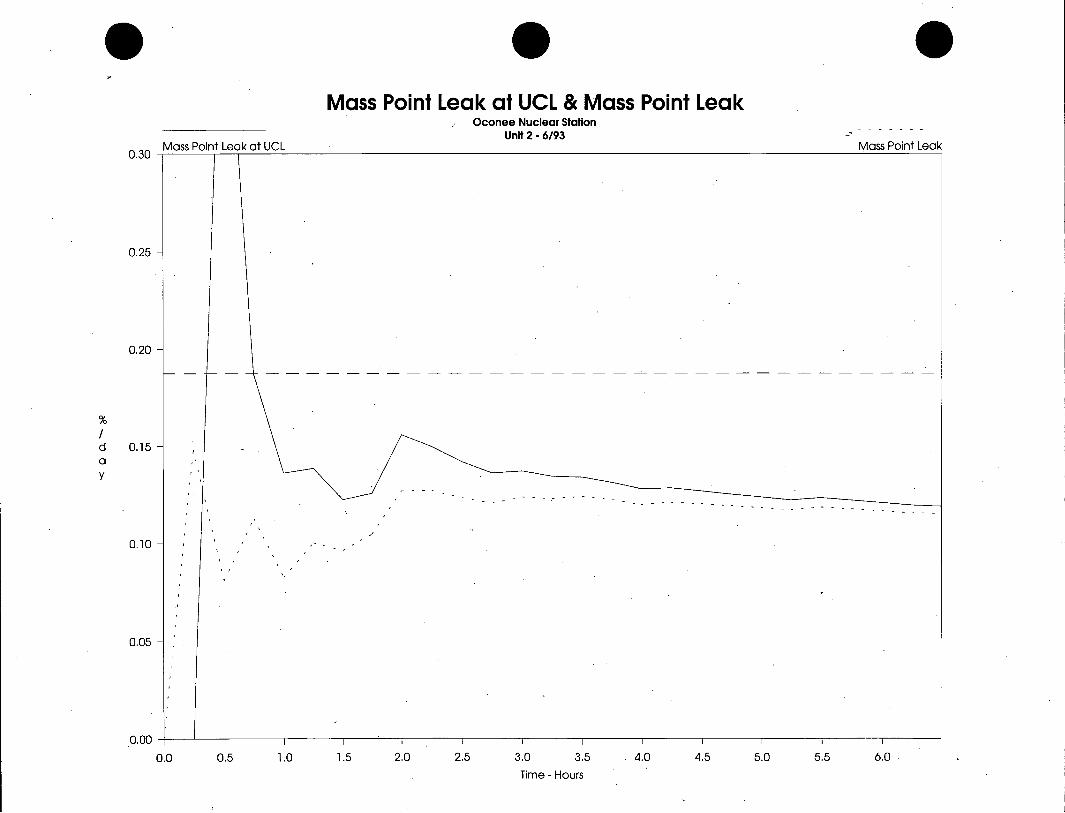
Mass Point Leak at UCL & Mass Point Leak Oconee Nuclear Station
Unit 2 - 6/93 0.30 Mass Point Leak at UCL Mass Point Leak
0.25
0.20
d 0.15 a y
0.10
0.05
0.00
0.0 0.5 1.0 1.5 2.0 2.5 3.0 3.5 4.0 4.5 5.0 5.5 6.0 Time - Hours

Containment Mass Oconee Nuclear Station
Unit 2 - 6/93
690300
690270
690240
690210
690180
b 690150
690120
690090
690060
690030
690000 I
12:30 13:00 13:30 14:00 14:30 15:00 15:30 16:00 16:30 17:00 17:30 18:00 18:30 Time - HR:MIN
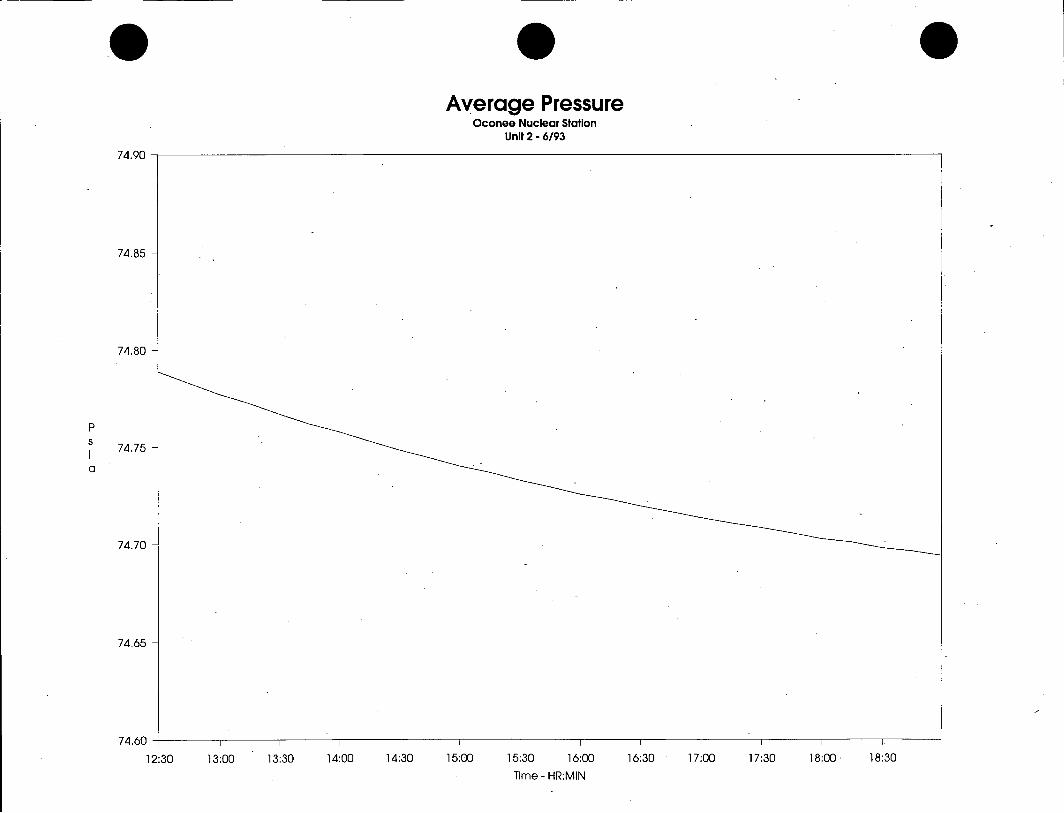
Average Pressure Oconee Nuclear Station
Unit 2 - 6/93
74.90
74.85
74.80
P
74.75
74.70
74.65
12:30 13:00 13:30 14:00 14:30 15:00 15:30 16:00 16:30 17:00 17:30 18:00 18:30 Time - HR:MIN
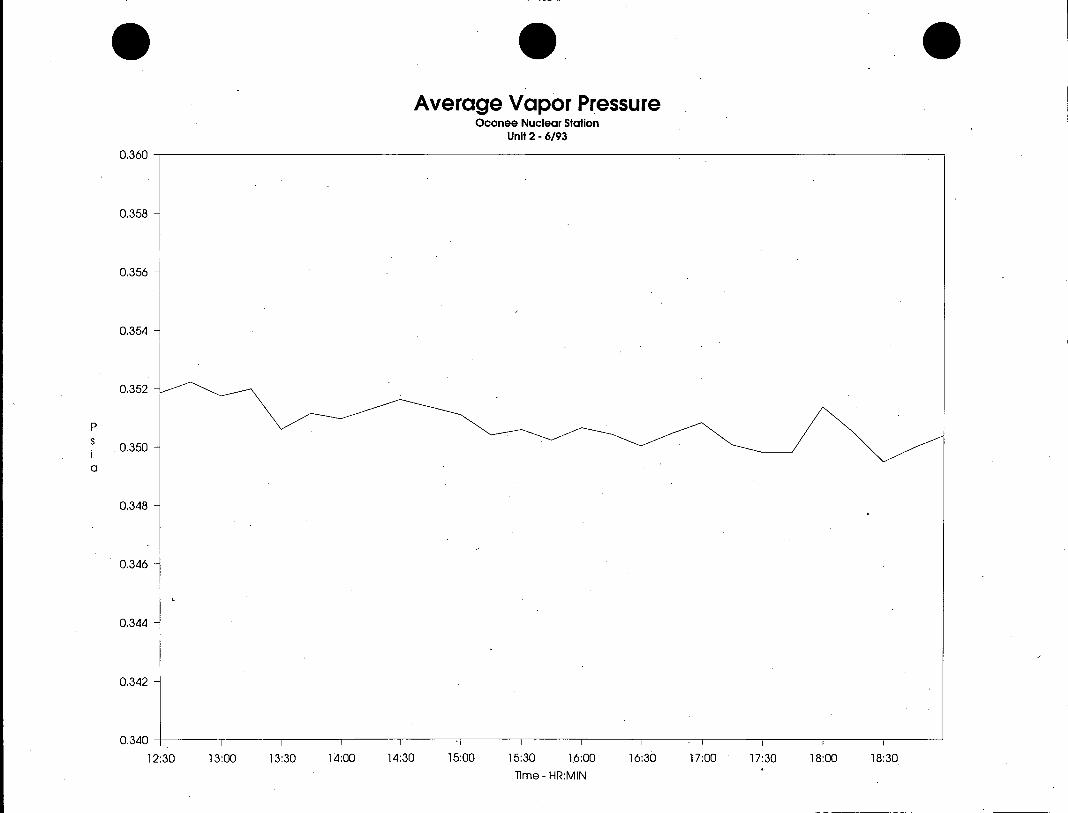
Average Vapor Pressure Oconee Nuclear Station
Unit 2 - 6/93
0,360
0.358
0.356
0.354
0,352
P s . 0.350
a
0.348
0.346
0.344
0.342
0.340 I
12:30 13:00 13:30 14:00 14:30 15:00 15:30 16:00 16:30 17:00 17:30 18:00 18:30 Time - HR:MIN
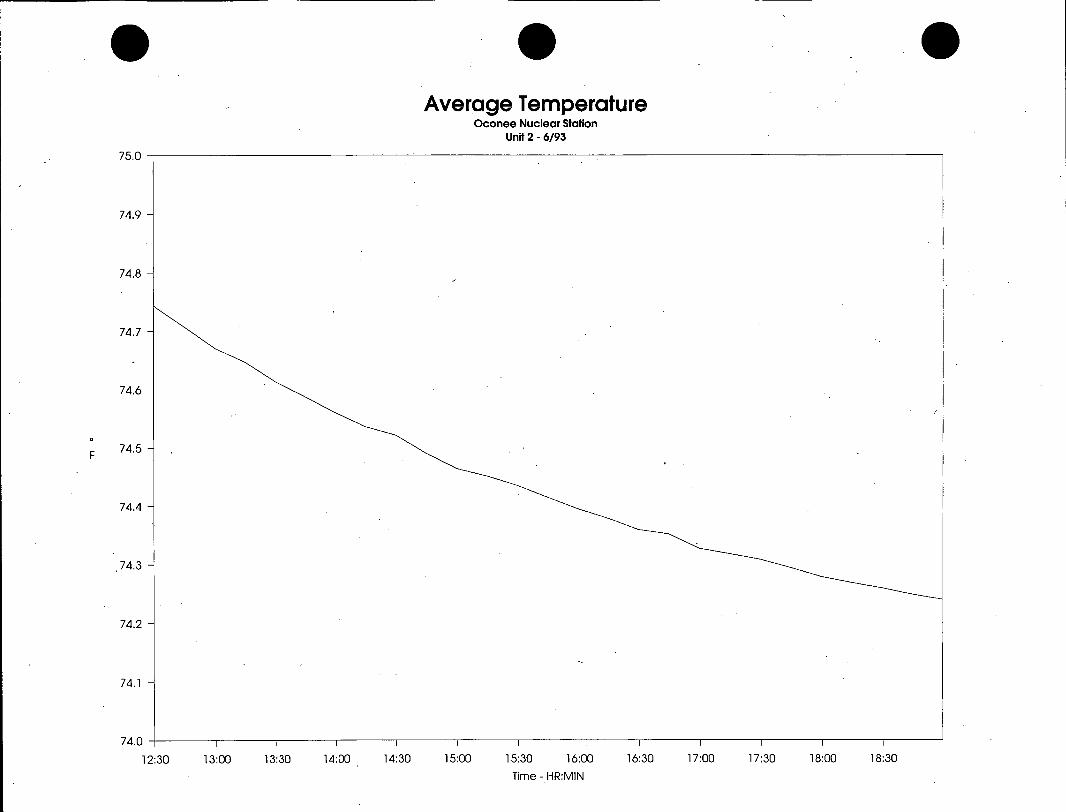
Average Temperature Oconee Nuclear Station
Unit 2 - 6/93
75.0
74.9
74.8
74.7
74.6
0
F 74.5
74.4
.74.3
74.2
74.1
74.0 I I lIll
12:30 13:00 13:30 14:00 14:30 15:00 15:30 16:00 16:30 17:00 17:30 18:00 18:30
Time - HR:MIN
Oconee Unit 2
APPENDIX C
Verification Controlled Leakage Rate Test Data and Graphs Reading No. 126 to 146
Reports:
* Total Time Leak Rate Analysis * Mass Point Leak Rate Analysis * Containment Calculated Values by Reading No.
Graphs:
* Calculated Total Time Leak & Measured Total Time Leak * Mass Point Leak * Containment Mass * Average Pressure * 'Average Vapor Pressure * Average Temperature
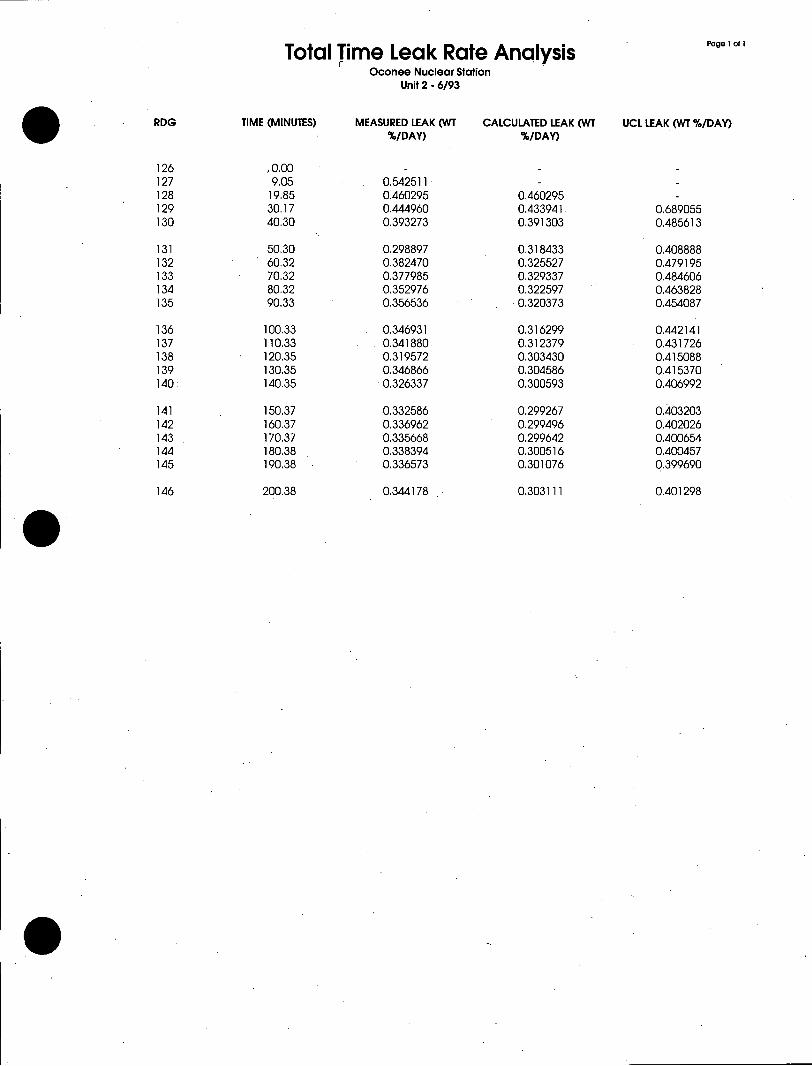
Total Time Leak Rate Analysis Oconee Nuclear Station
Unit 2 - 6/93
RDG TIME (MINUTES) MEASURED LEAK (WT CALCULATED LEAK (WT UCL LEAK (WT %/DAY) %/DAY) %/DAY)
126 .0.00 127 9.05 0.542511 128 19.85 0.460295 0.460295 129 30.17 0.444960 0.433941. 0.689055 130 40.30 0.393273 0.391303 0.485613
131 50.30 0.298897 0.318433 0.408888 132 60.32 0.382470 0.325527 0.479195 133 70.32 0.377985 0.329337 0.484606 134 80.32 0.352976 0.322597 0.463828 135 90.33 0.356536 0.320373 0.454087
136 100.33 . 0.346931 0.316299 0.442141 137 110.33 . . 0.341880 0,312379 0.431726 138 120.35 0.319572 0.303430 0.415088 139 130.35 0.346866 0.304586 0.415370 140 140.35 0.326337 0.300593 0,406992
141 150.37 0.332586 0.299267 0.403203 142 160.37 0.336962 0.299496 0.402026 143 170.37 0.335668 0.299642 0.400654 144 180.38 0.338394 0.300516 0.400457 145 190.38 0.336573 0.301076 0.399690
146 200.38 0.344178 0.303111 0.401298
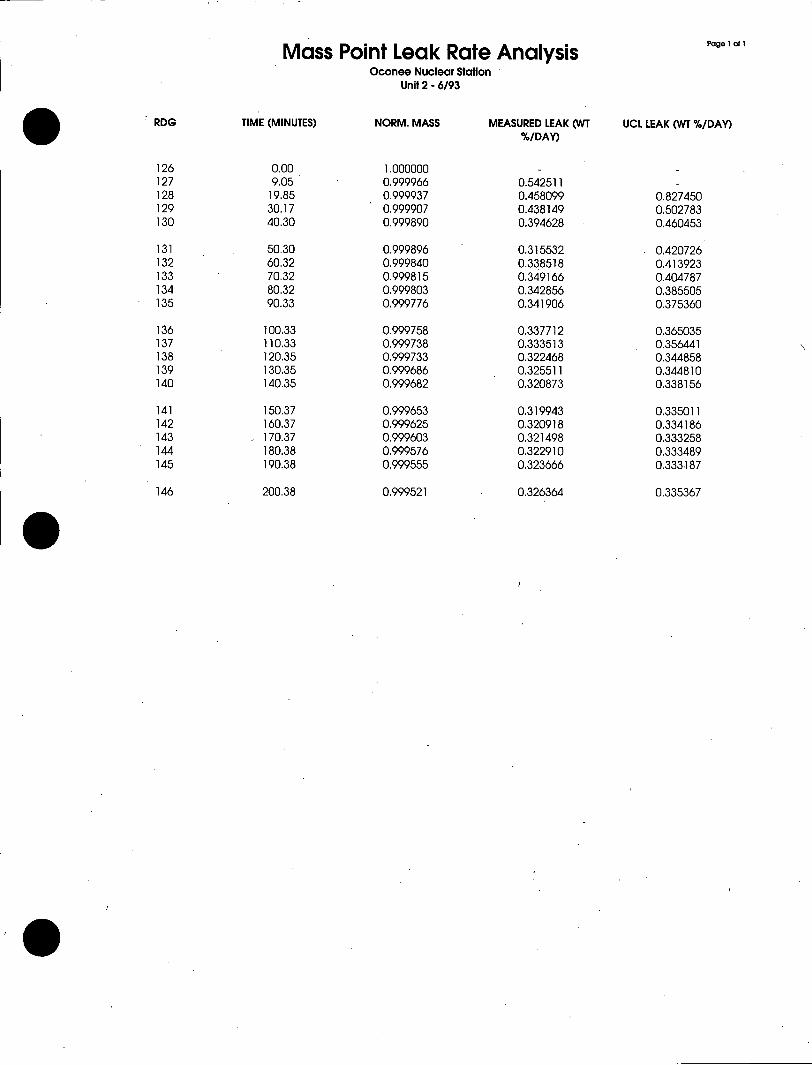
Mass Point Leak Rate Analysis Page Ionl
Oconee Nuclear Station Unit 2 - 6/93
RDG TIME (MINUTES) NORM. MASS MEASURED LEAK (WT UCL LEAK (WT %/DAY) %/DAY)
126 0.00 1.000000 127 9.05 0.999966 0.542511 128 19.85 0.999937 0.458099 0.827450 129 30.17 0.999907 0.438149 0.502783 130 40.30 0.999890 0.394628 0.460453
131 50.30 0.999896 0.315532 0.420726 132 60.32 0.999840 0.338518 0.413923 133 70,32 0.999815 0.349166 0.404787 134 80.32 0.999803 0.342856 0.385505 135 90.33 0.999776 0.341906 0.375360
136 100.33 0.999758 0.337712 0.365035 137 110.33 0.999738 0.333513 0.356441 138 120.35 0.999733 0.322468 0.344858 139 130.35 0.999686 0.325511 0.344810 140 140.35 0.999682 0.320873 0.338156
141 150.37 0.999653 0.319943 0.335011 142 160.37 0,999625 0.320918 0.334186 143 170.37 0,999603 0,321498 0.333258 144 180.38 0.999576 0.322910 0.333489 145 190.38 0.999555 0,323666 0.333187
146 200.38 0.999521 0.326364 0.335367
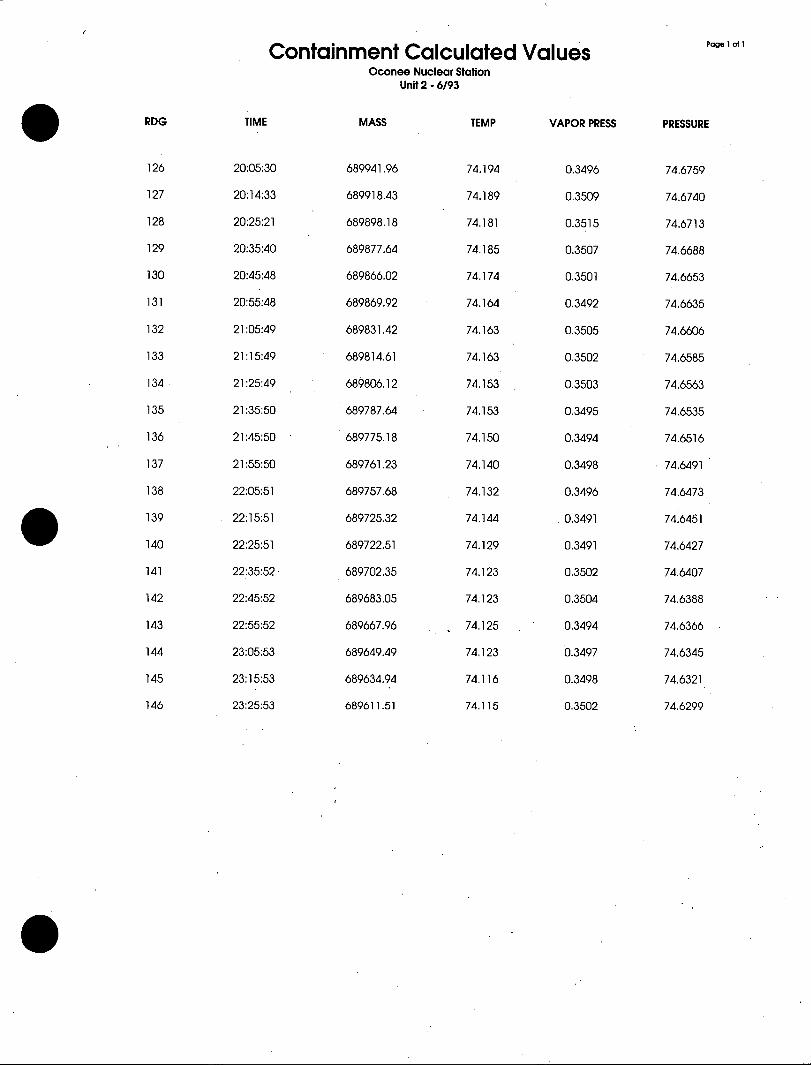
Containment Calculated Values Page 1 of 1
Oconee Nuclear Station Unit 2 - 6/93
RDG TIME MASS TEMP VAPOR PRESS PRESSURE
126 20:05:30 689941.96 74.194 0.3496 74.6759
127 20:14:33 689918.43 74.189 0.3509 74.6740
128 20:25:21 689898.18 74.181 0.3515 74.6713
129 20:35:40 689877.64 74,185 0.3507 74.6688
130 20:45:48 689866.02 74.174 0.3501 74.6653
131 20:55:48 689869.92 74.164 0,3492 74.6635
132 21:05:49 689831.42 74.163 0.3505 74.6606
133 21:15:49 689814.61 74,163 0.3502 74.6585
134 21:25:49 689806.12 74.153 0.3503 74,6563
135 21:35:50 689787.64 74.153 0.3495 74.6535
136 21:45:50 689775.18 74.150 0.3494 74.6516
137 21:55:50 689761.23 74.140 0.3498 74.6491
138 22:05:51 689757.68 74.132 0.3496 74.6473
139 22:15:51 689725.32 74.144 0.3491 74.6451
140 22:25:51 689722.51 74.129 0.3491 74.6427
141 22:35:52 689702.35 74.123 0,3502 74,6407
142 22:45:52 689683.05 74.123 0.3504 74.6388
143 22:55:52 689667.96 74.125 0.3494 74.6366
144 23:05:53 689649.49 74.123 0.3497 74.6345
145 23:15:53 689634.94 74.116 0.3498 74.6321
146 23:25:53 689611.51 74.115 0.3502 74.6299
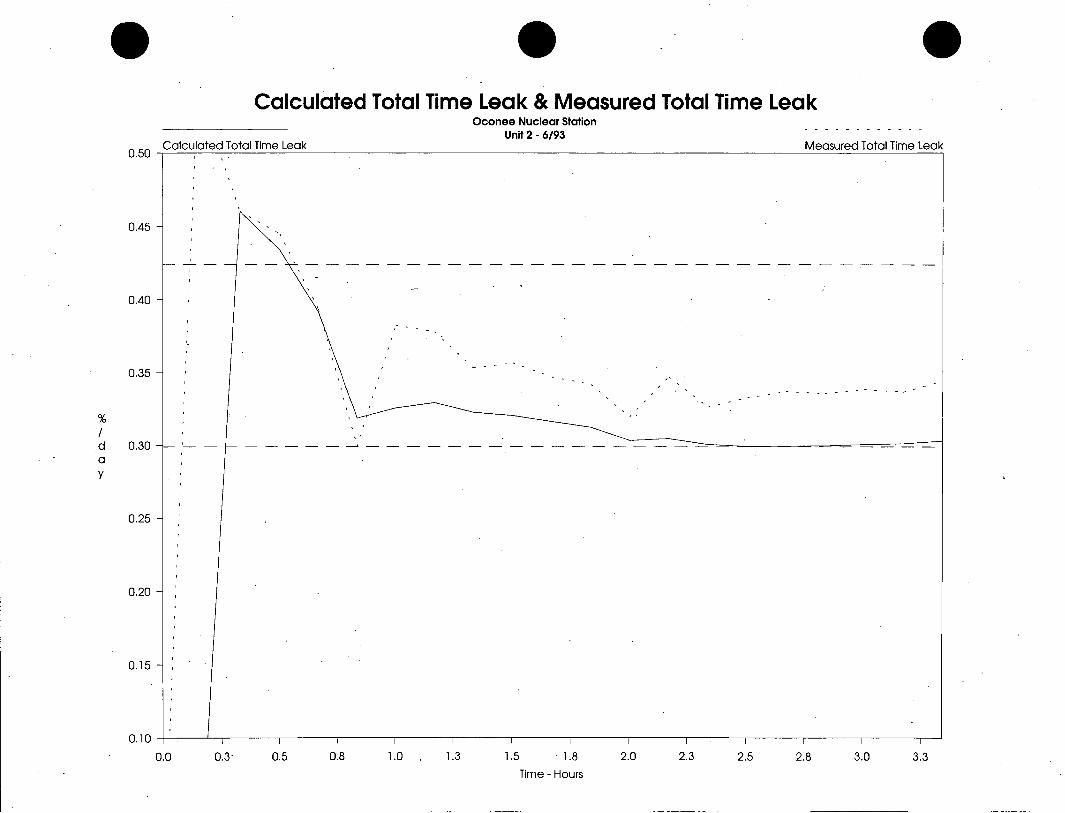
Calculated Total Time Leak & Measured Total Time Leak Oconee Nuclear Station
Unit 2 - 6/93
0.50 Calculated Total Time Leak Measured Total Time Leak
0.45
0.40
0.35
%
d 0.30 - - - - - - - -- - -- - - --
a y
0.25
0.20
0.15
0.10
0.0 0.3 0.5 0.8 1.0 . 1.3 1.5 1.8 2.0 2.3 2.5 2.8 3.0 3.3 Time - Hours
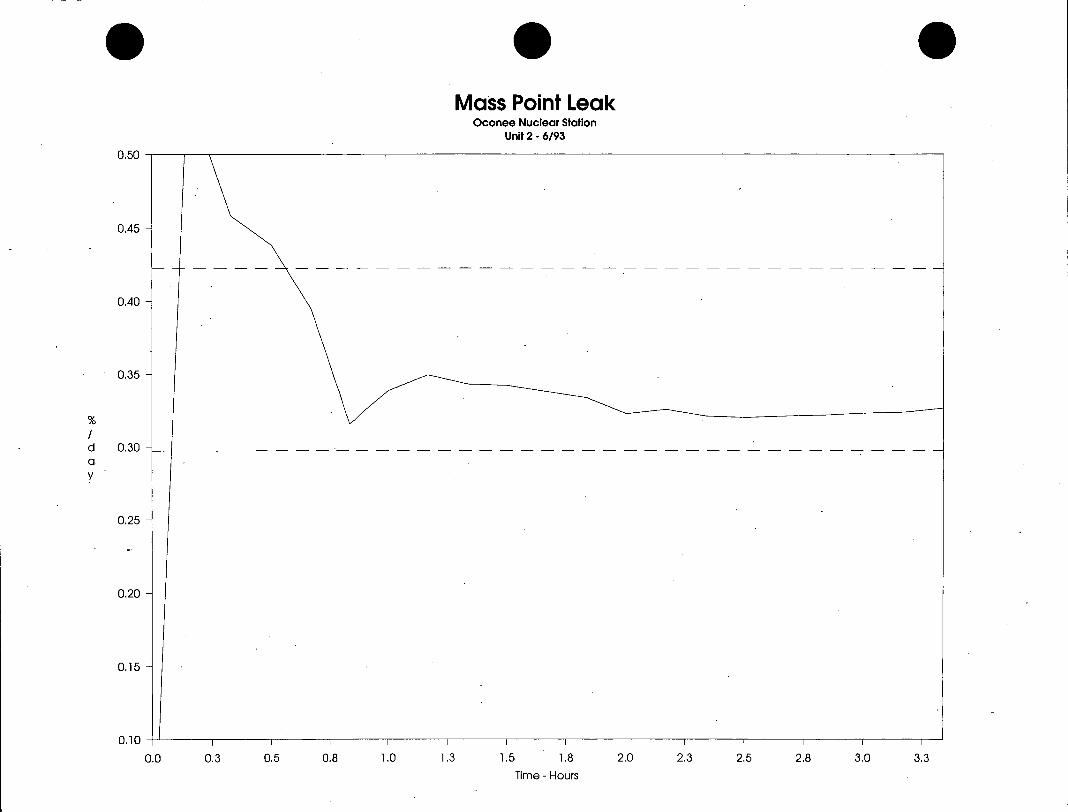
Mass Point Leak Oconee Nuclear Station
Unit 2 - 6/93
0.50
0.45
0.40
0.35
d 0.30 -- a y
0.25
0.20
0.15
0.10
0.0 0.3 0.5 0.8 1,0 1.3 1.5 1.8 2.0 2.3 2.5 2.8 3.0 3.3 Time - Hours

Containment Mass Oconee Nuclear Station
Unit 2 - 6/93
689980
689940
689900
689860
689820
b 689780 m
689740
689700
689660
689620
689580
20:05 20:20 20:35 20:50 21:05 21:20 21:35 21:50 22:05 22:20 22:35 22:50 23:05 23:20 Time - HR:MIN
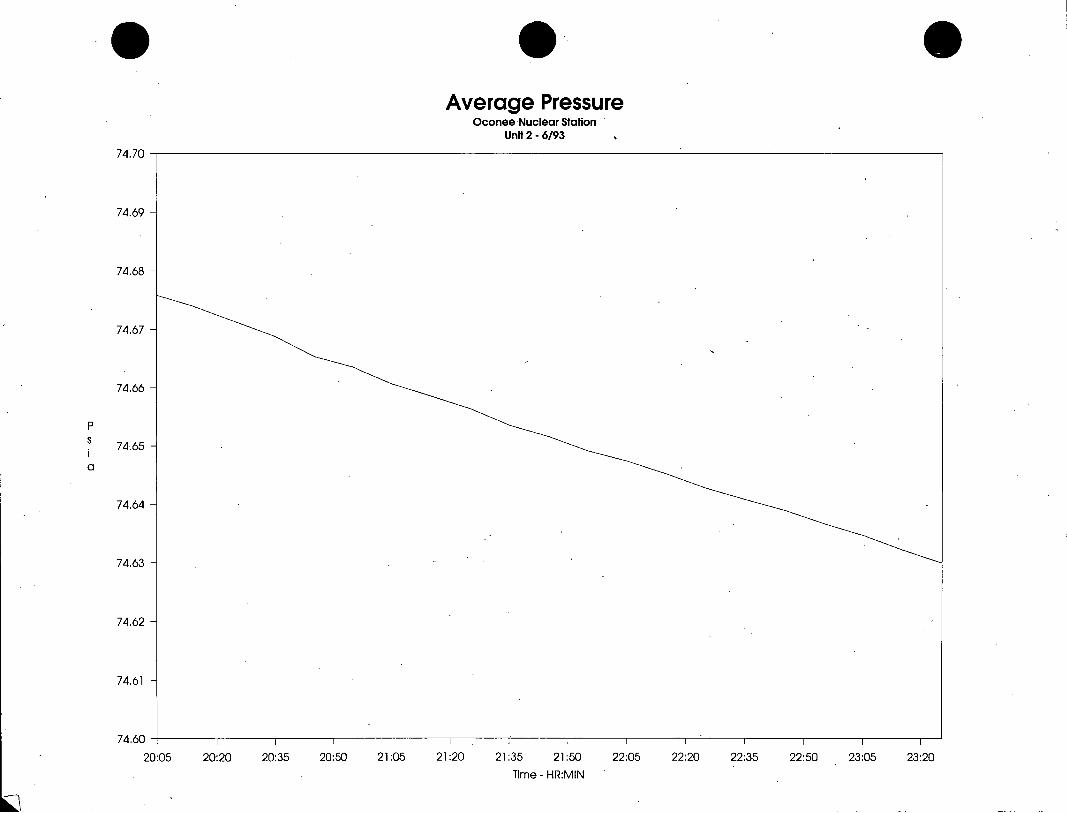
Average Pressure Oconee Nuclear Station
Unit 2 - 6/93
74.70
74.69
74.68
74.67
74.66
P
. 74.65
a
74.64
74.63
74.62
74.61
7460.
20:05 20:20 20:35 20:50 21:05 21:20 21:35 21:50 22:05 22:20 22:35 22:50 23:05 23:20 Time - HR:MIN
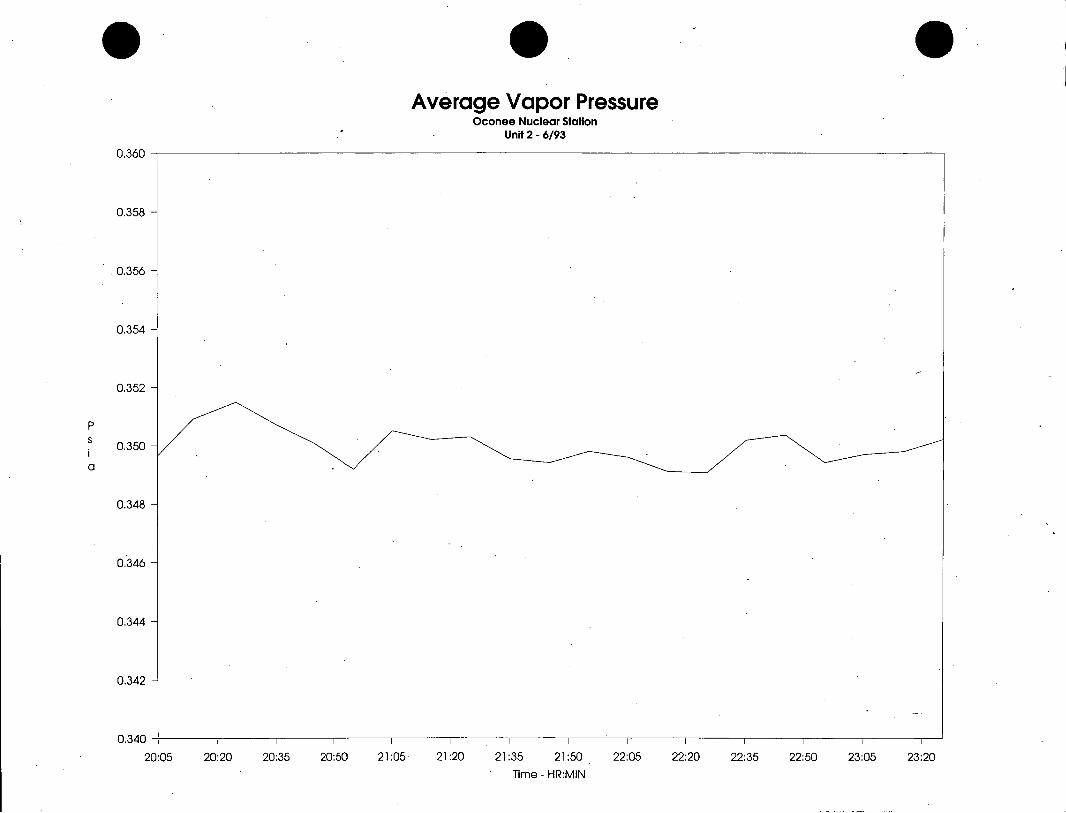
Average Vapor Pressure Oconee Nuclear Station
Unit 2 - 6/93
0.360
0.358
0.356
0.354
0.352
P
. 0.350
a
0.348
0.346
0.344
0.342
0.340
20:05 20:20 20:35 20:50 21:05 21:20 21:35 21:50 22:05 22:20 22:35 22:50 23:05 23:20 Time - HR:MIN
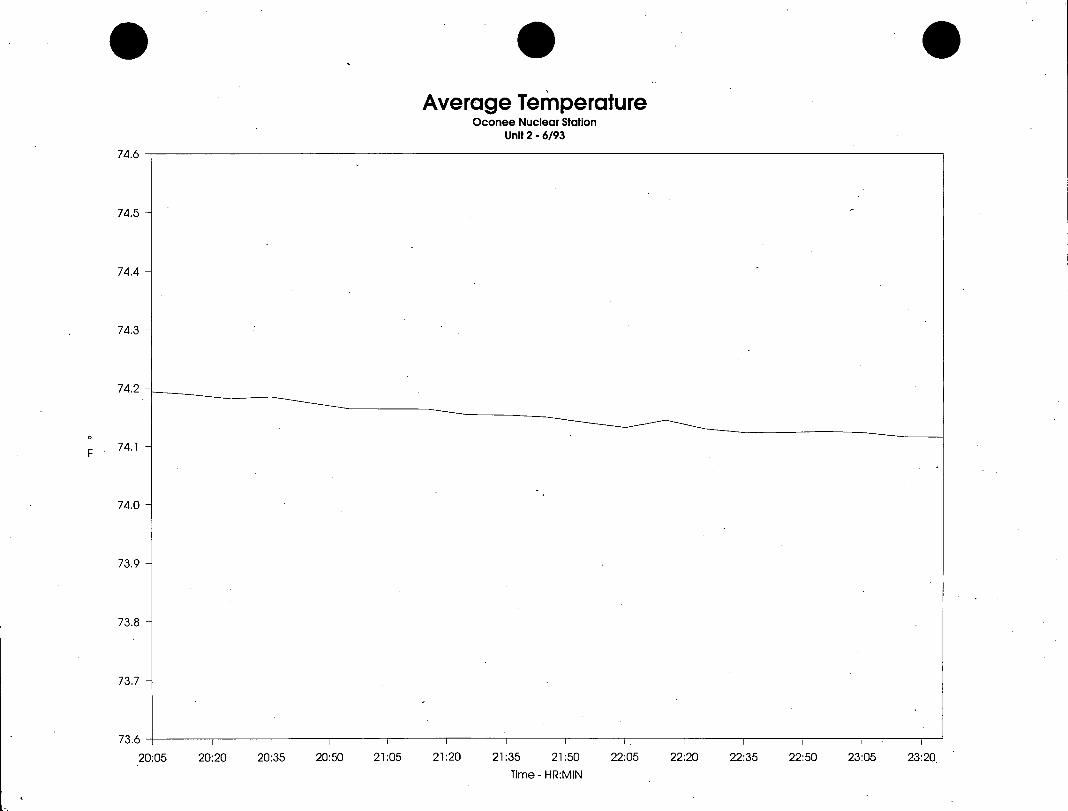
Average Temperature Oconee Nuclear Station
Unit 2 - 6/93
74.6
74.5
74.4
74.3
74.2
F 74.1
74.0
73.9
73.8
73.7
73.6 -
20:05 20:20 20:35 20:50 21:05 21:20 21:35 21:50 22:05 22:20 22:35 22:50 23:05 23:20. Time - HR:MIN
Oconee Unit 2
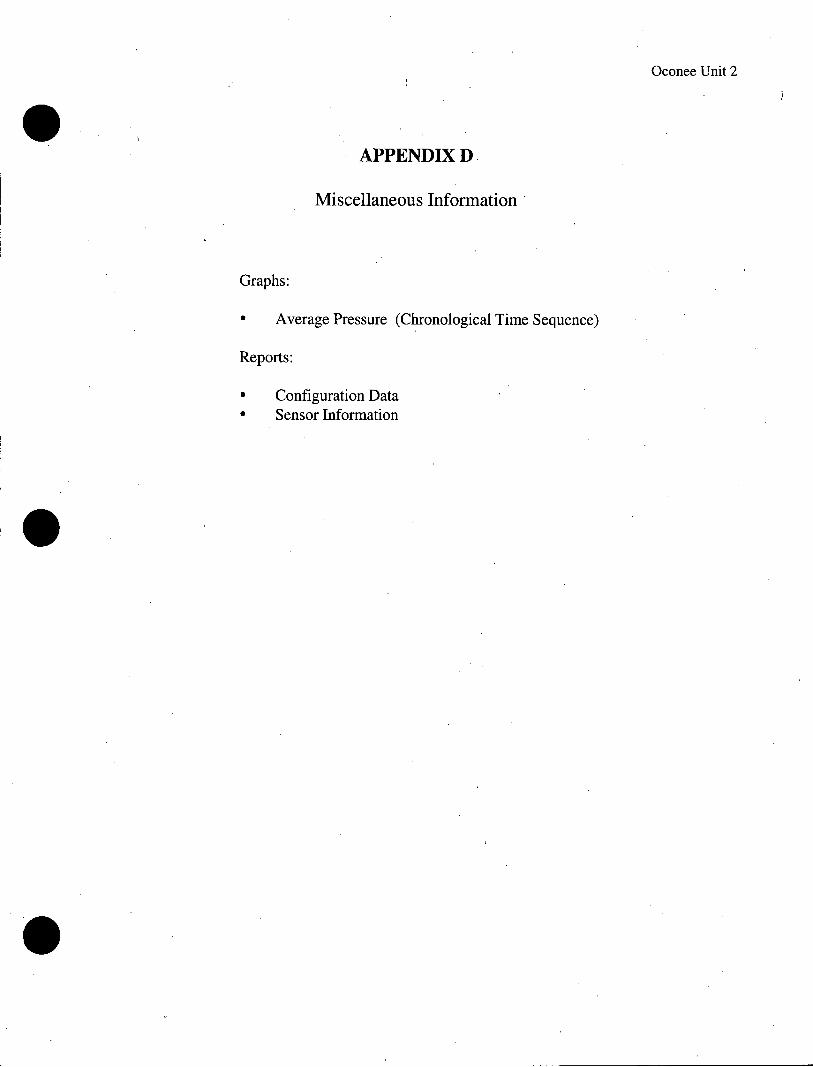
APPENDIX D
Miscellaneous Information
Graphs:
* Average Pressure (Chronological Time Sequence)
Reports:
* Configuration Data * Sensor Information
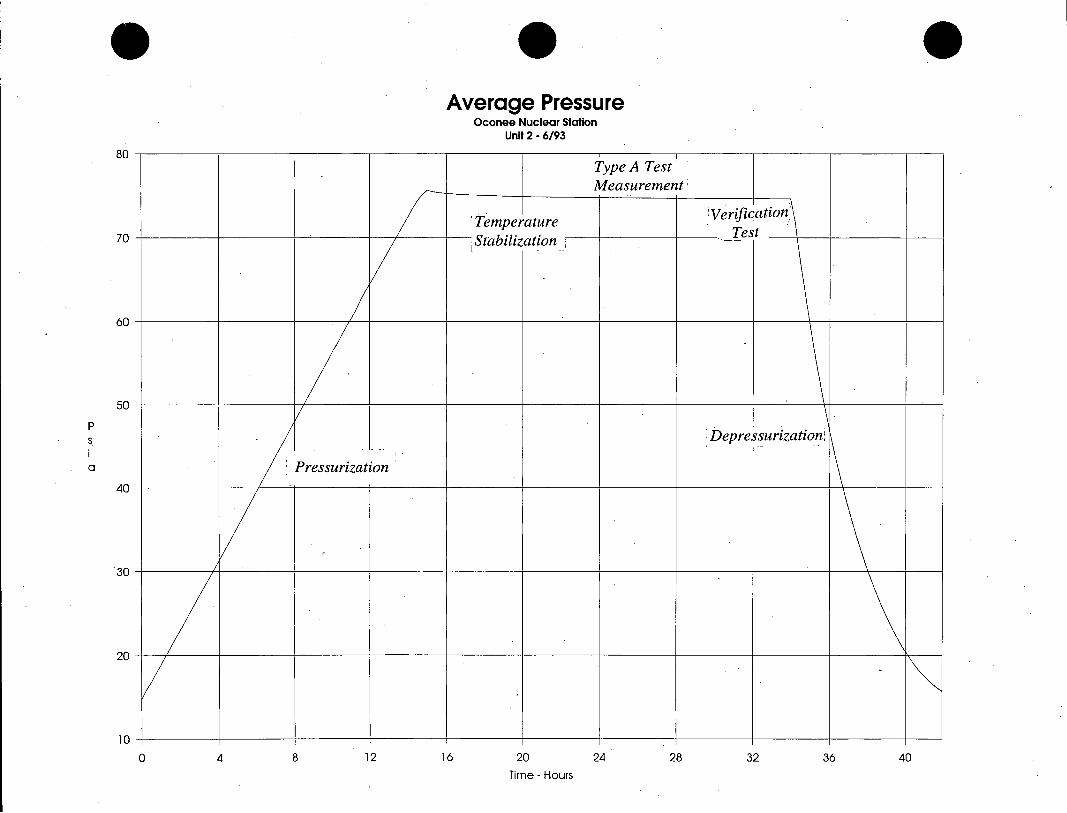
Average Pressure Oconee Nuclear Station
Unit 2 - 6/93
80 Type A Test Measurement
Verification Temperature -er t
70 - Stabilization
60
50
p s .Depressurization!
a Pressurization 40
30
20
10
0 4 8 12 16 20 24 28 32 36 40 Time - Hours
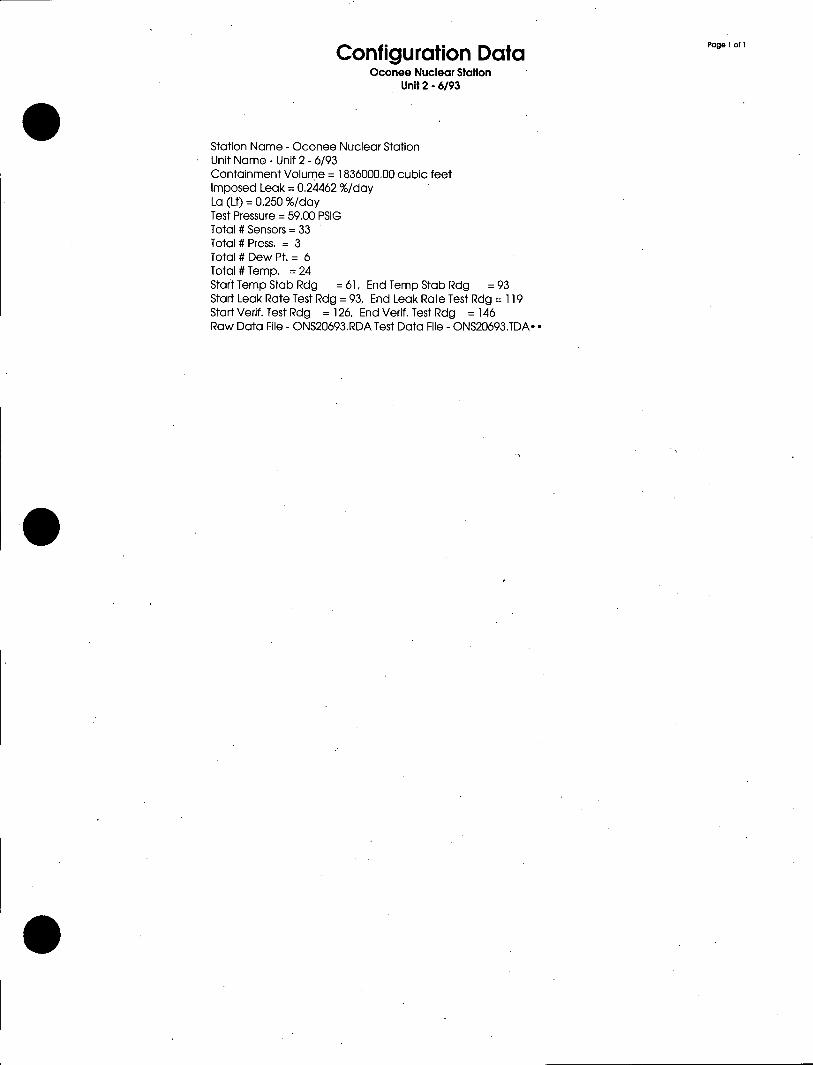
Configuration Data " Oconee Nuclear Station
Unit 2 - 6/93
0 Station Name - Oconee Nuclear Station Unit Name - Unit 2 - 6/93 Containment Volume = 1836000.00 cubic feet Imposed Leak = 0.24462 %/day La (Lt) = 0.250 %/day Test Pressure = 59.00 PSIG Total # Sensors = 33 Total # Press. = 3 Total # Dew Pt. = 6 Total # Temp. =24 Start Temp Stab Rdg = 61, End Temp Stab Rdg = 93 Start Leak Rate Test Rdg = 93, End Leak Rate Test Rdg = 119 Start Verif. Test Rdg = 126, End Verif. Test Rdg = 146 Raw Data File - ONS20693.RDA Test Data File - ONS20693.TDA**
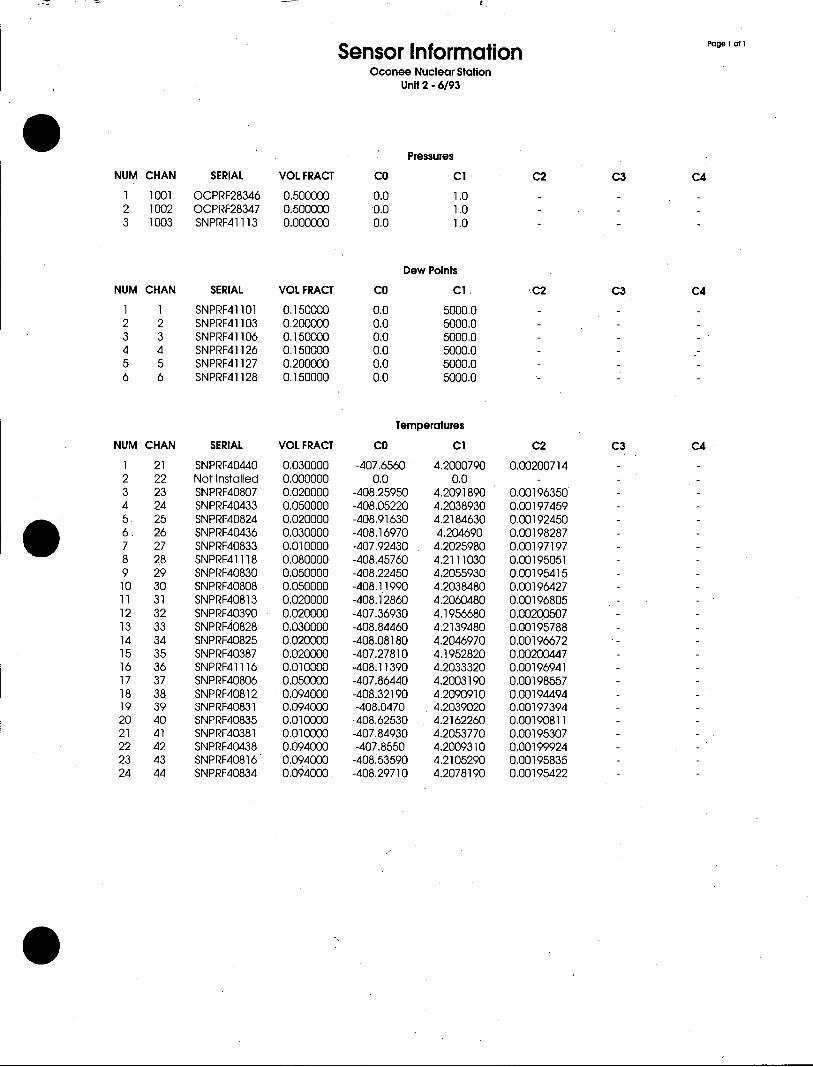
Sensor Information Page oll
Oconee Nuclear Station Unit 2 - 6/93
Pressures
NUM CHAN SERIAL VOL FRACT CO Cl C2 C3 C4
1 1001 CCPRF28346 0.500000 0.0 1.0 - -
2 1002 CCPRF28347 0.500000 0.0 1.0 - -
3 1003 SNPRF41113 0.000000 0.0 1.0 - -
Dew Points
NUM CHAN SERIAL VOL FRACT CO Cl. C2 C3 C4
1 1 SNPRF41101 0.150000 0.0 5000.0 - -
2 2 SNPRF41103 0.200000 0.0 5000.0 - -
3 3 SNPRF41106 0.150000 0.0 5000.0 - -4 4 SNPRF41126 0.150000 0.0 5000.0 - -5 5 SNPRF41127 0.200000 0.0 5000.0 - -6 6 SNPRF41128 0.150000 0.0 5000.0 - -
Temperatures
NUM CHAN SERIAL VOL FRACT CO Cl C2 C3 C4
1 21 SNPRF40440 0.030000 -407.6560 4.2000790 0.00200714 -2 22 Not Installed 0.000000 0.0 0.0 - -3 23 SNPRF40807 0.020000 -408.25950 4.2091890 0.00196350- 4 24 SNPRF40433 0.050000 -408.05220 4.2038930 0.00197459 -5 25 SNPRF40824 0.020000 -408.91630 4.2184630 0.00192450 -6. 26 SNPRF40436 0.030000 -408.16970 4.204690 0.00198287 -7 27 SNPRF40833 0.010000 -407.92430 4.2025980 0.00197197 -
8 28 SNPRF41118 0.080000 -408.45760 4.2111030 0.00195051 -9 29 SNPRF40830 0.050000 -408.22450 4.2055930 0.00195415 -10 30 SNPRF40808 0.050000 -408.11990 4,2038480 0.00196427 -11 31 SNPRF40813 0.020000 -408.12860 4.2060480 0.00196805 12 32 SNPRF40390 0.020000 -407.36930 4,1956680 0.00200507 -13 33 SNPRF40828 0.030000 -408.84460 4.2139480 0.00195788 -14 34 SNPRF40825 0.020000 -408.08180 4.2046970 0.00196672 -15 35 SNPRF40387 0.020000 -407.27810 4.1952820 0.00200447 -16 36 SNPRF41116 0.010000 -408.11390 4.2033320 0.00196941 -17 37 SNPRF40806 0.050000 -407.86440 4.2003190 0.00198557 -18 38 SNPRF40812 0.094000 -408.32190 4.2090910 0.00194494 -19 39 SNPRF40831 0.094000 -408.0470 4.2039020 0.00197394 -20 40 SNPRF40835 0.010000 -408.62530 4.2162260 0.00190811 -21 41 SNPRF40381 0.010000 -407.84930 4.2053770 0.00195307 -22 42 SNPRF40438 0.094000 -407.8550 4.2009310 0,00199924 -23 43 SNPRF40816 0.094000 -408.53590 4.2105290 0.00195835 -24 44 SNPRF40834 0.094000 -408.29710 4.2078190 0.00195422 -
0II
Oconee Unit 2
APPENDIX E
Test Data Summary
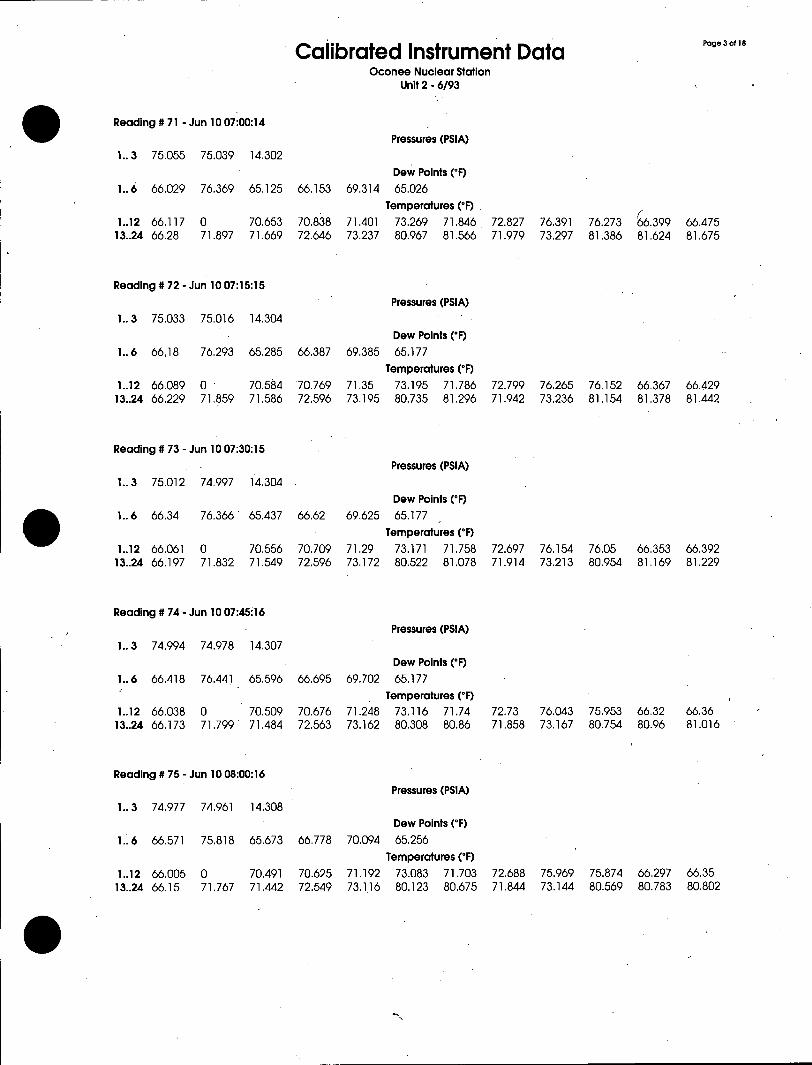
Reports:
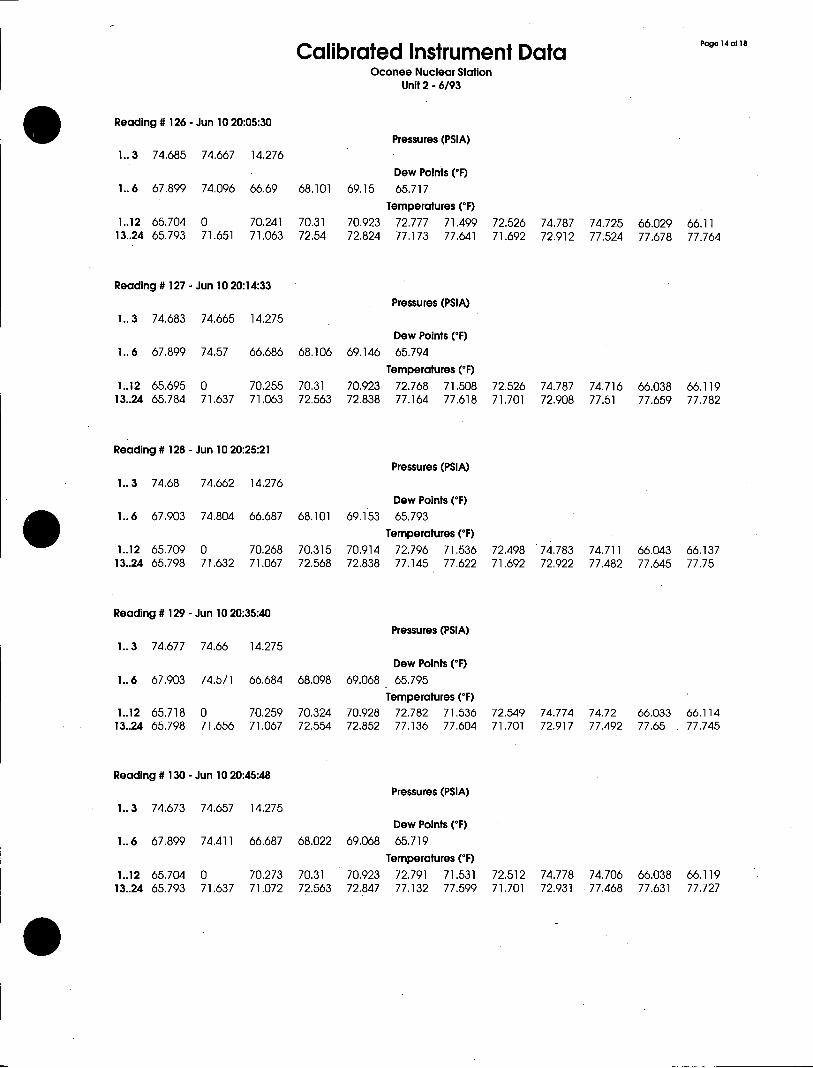
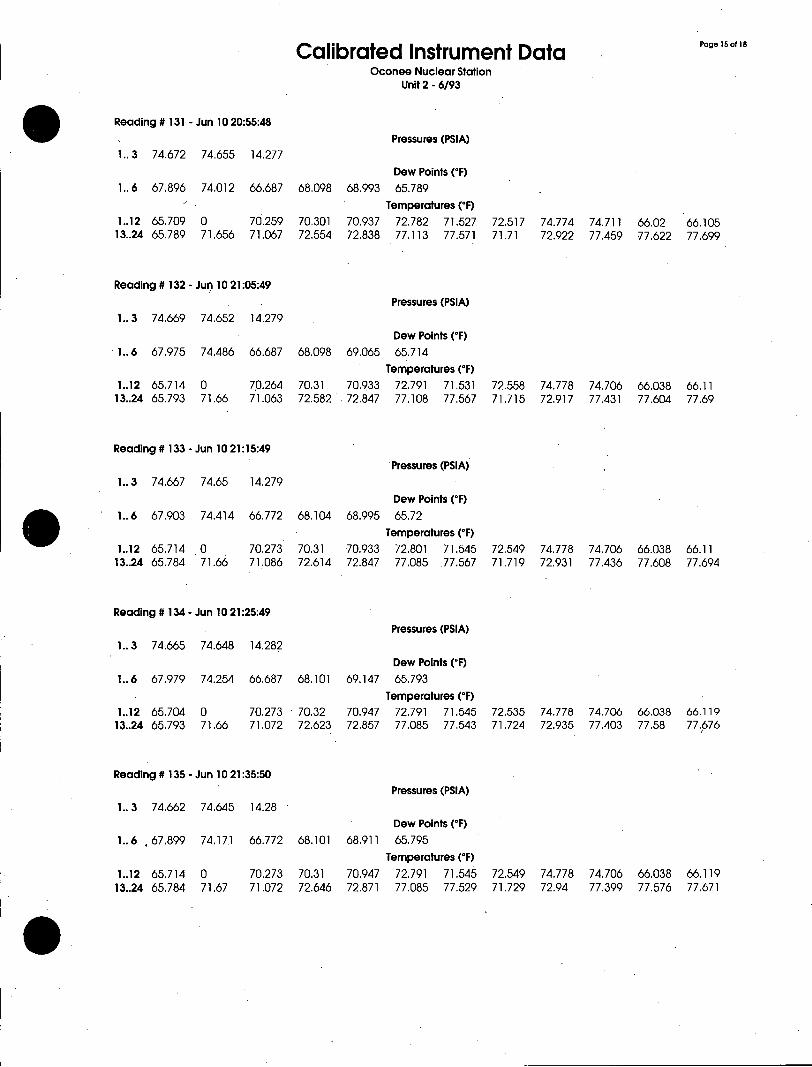
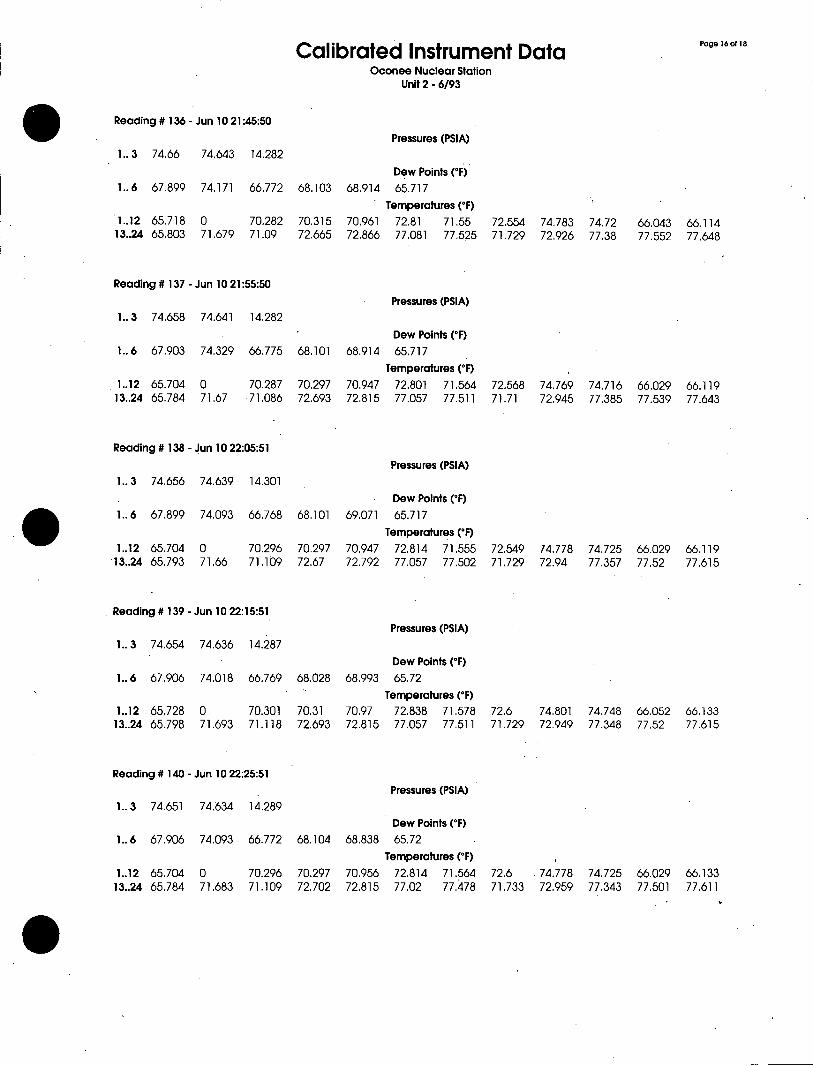
* Calibrated Instrument Data (by reading number)
0
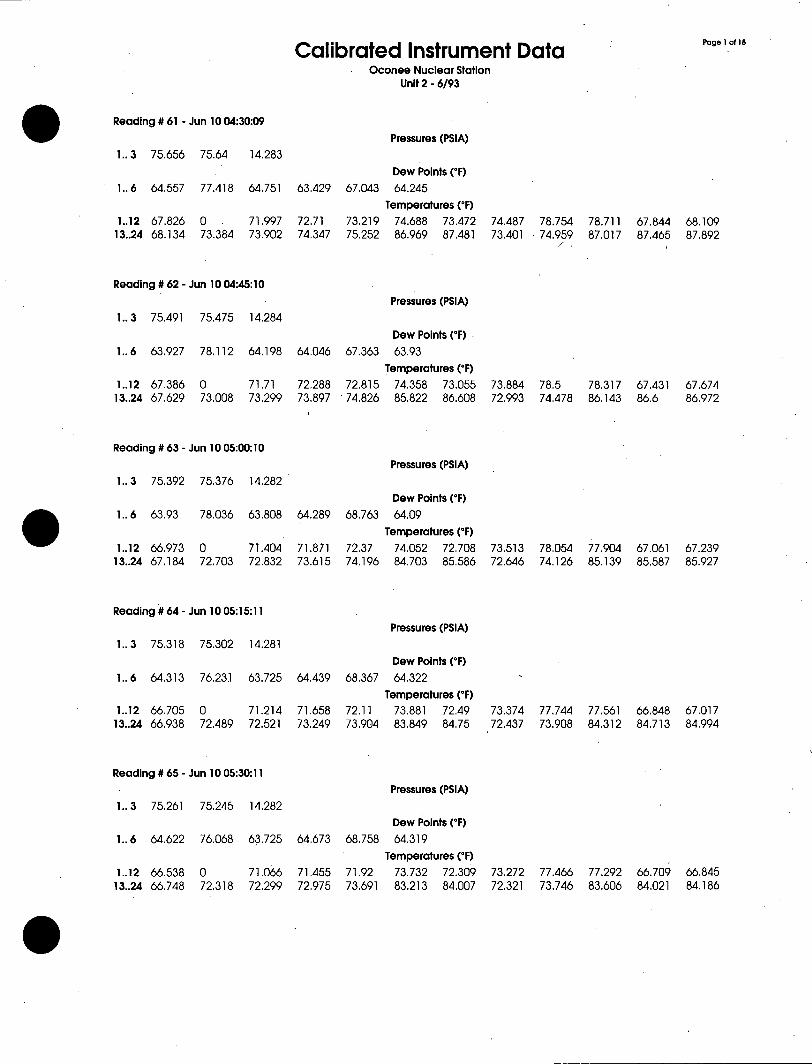
Calibrated Instrument Data Oconee Nuclear Station
Unit 2 - 6/93
Reading # 61 - Jun 10 04:30:09 Pressures (PSIA)
1.. 3 75.656 75.64 14.283 Dew Points (*F)
1.. 6 64.557 77.418 64.751 63.429 67,043 64.245 Temperatures ("F)
1..12 67.826 0 71.997 72.71 73,219 74.688 73.472 74.487 78.754 78.711 67.844 68.109 13..24 68.134 73.384 73.902 74.347 75.252 86.969 87.481 73.401 74.959 87.017 87.465 87.892
Reading # 62 - Jun 10 04:45:10 Pressures (PSIA)
1.. 3 75.491 75.475 14.284 Dew Points (*F)
1..6 63.927 78.112 64.198 64.046 67.363 63.93 Temperatures (*F)
1.12 67.386 0 71.71 72.288 72.815 74.358 73.055 73.884 78.5 78.317 67.431 67.674 13..24 67.629 73.008 73.299 73.897 74.826 85,822 86.608 72.993 74.478 86.143 86.6 86.972
Reading # 63 - Jun 10 05:00:10 Pressures (PSIA)
1.. 3 75.392 75.376 14.282 Dew Points ('F)
1.. 6 63.93 78.036 63.808 64.289 68.763 64.09 Temperatures (*F)
1..12 66.973 0 71.404 71.871 72.37 74.052 72.708 73.513 78.054 77.904 67.061 67.239 13..24 67.184 72.703 72.832 73.615 74.196 84.703 85.586 72.646 74.126 85.139 85.587 85.927
Reading # 64 - Jun 10 05:15:11 Pressures (PSIA)
1.. 3 75.318 75.302 14.281 Dew Points (*F)
1.. 6 64.313 76.231 63.725 64.439 68.367 64.322 Temperatures (*F)
1..12 66.705 0 71.214 71.658 72.11 73.881 72.49 73.374 77.744 77.561 66.848 67.017 13..24 66.938 72.489 72.521 73.249 73.904 83.849 84.75 72.437 73.908 84.312 84.713 84.994
Reading # 65 - Jun 10 05:30:11 Pressures (PSIA)
1.. 3 75.261 75.245 14.282 Dew Points (*F)
1.. 6 64.622 76.068 63.725 64.673 68.758 64.319 Temperatures ('F)
1.12 66.538 0 71.066 71.455 71.92 73.732 72.309 73.272 77.466 77.292 66.709 66.845 13..24 66.748 72.318 72.299 72,975 73.691 83.213 84.007 72.321 73.746 83.606 84.021 84.186
0
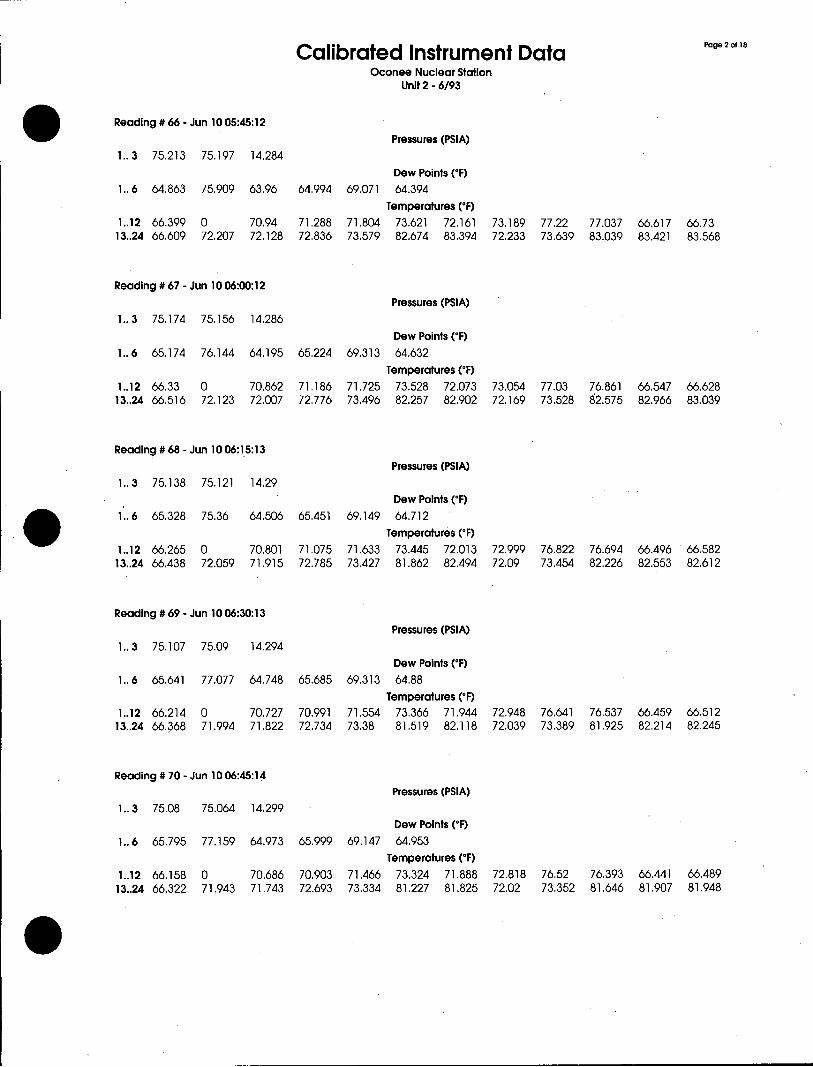
Calibrated Instrument Data Page 2 of 18
Oconee Nuclear Station Unit 2 - 6/93
Reading # 66 - Jun 10 05:45:12 Pressures (PSIA)
1.. 3 75.213 75.197 14.284 Dew Points (*F)
1.. 6 64.863 75.909 63.96 64.994 69.071 64.394 Temperatures (*F)
1..12 66.399 0 70.94 71.288 71.804 73.621 72.161 73.189 77.22 77.037 66.617 66.73 13..24 66.609 72.207 72.128 72.836 73.579 82.674 83.394 72.233 73.639 83.039 83.421 83.568
Reading # 67 - Jun 10 06:00:12 Pressures (PSIA)
1.. 3 75.174 75,156 14.286 Dew Points ('F)
1.. 6 65.174 76.144 64.195 65.224 69.313 64.632 Temperatures (*F)
1..12 66.33 0 70.862 71,186 71.725 73.528 72.073 73.054 77.03 76.861 66.547 66.628 13..24 66.516 72.123 72.007 72.776 73.496 82.257 82.902 72.169 73.528 82.575 82.966 83.039
Reading # 68 - Jun 10 06:15:13 Pressures (PSIA)
1.. 3 75.138 75.121 14.29 Dew Points (*F)
1.. 6 65.328 75.36 64.506 65.451 69.149 64.712
Temperatures (*F) 1..12 66.265 0 70.801 71.075 71.633 73.445 72.013 72.999 76.822 76.694 66.496 66.582 13..24 66.438 72.059 71.915 72.785 73.427 81.862 82.494 72.09 73.454 82.226 82.553 82.612
Reading # 69 - Jun 10 06:30:13 Pressures (PSIA)
1.. 3 75.107 75.09 14.294 Dew Points (*F)
1.. 6 65.641 77.077 64.748 65.685 69.313 64.88 Temperatures (*F)
1..12 66.214 0 70.727 70.991 71.554 73.366 71.944 72.948 76.641 76.537 66.459 66.512 13..24 66.368 71.994 71.822 72.734 73.38 81.519 82.118 72.039 73.389 81.925 82.214 82.245
Reading # 70 - Jun 10 06:45:14 Pressures (PSIA)
1.. 3 75.08 75.064 14.299 Dew Points (*F)
1.. 6 65.795 77.159 64.973 65.999 69.147 64.953 Temperatures (*F)
1..12 66.158 0 70.686 70.903 71.466 73.324 71.888 72.818 76.52 76.393 66.441 66.489 13..24 66.322 71.943 71.743 72.693 73.334 81.227 81.825 72.02 73.352 81.646 81.907 81.948
0
Calibrated Instrument Data " Oconee Nuclear Station
Unit 2 - 6/93
Reading # 71 - Jun 10 07:00:14 P Pressures (PSIA)
1.. 3 75.055 75.039 14.302 Dew Points (IF)
1.. 6 66.029 76.369 65.125 66.153 69.314 65.026 Temperatures (IF)
1.12 66.117 0 70.653 70.838 71.401 73.269 71.846 72.827 76.391 76.273 66.399 66.475 13..24 66.28 71.897 71.669 72.646 73.237 80.967 81.566 71.979 73.297 81.386 81.624 81.675
Reading # 72 - Jun 10 07:15:15 Pressures (PSIA)
1.. 3 75.033 75.016 14.304 Dew Points (IF)
1..6 66,18 76.293 65.285 66,387 69.385 65.177 Temperatures (IF)
1..12 66.089 0 70.584 '70.769 71.35 73.195 71.786 72.799 76.265 76.152 66.367 66.429 13..24 66.229 71.859 71.586 72.596 73,195 80.735 81.296 71.942 73.236 81.154 81.378 81.442
Reading # 73 - Jun 10 07:30:15 Pressures (PSIA)
1..3 75.012 74.997 14.304 Dew Points (IF)
1.. 6 66.34 76.366 65.437 66.62 69.625 65.177 Temperatures (IF)
1..12 66.061 0 70.556 70.709 71.29 73.171 71.758 72.697 76.154 76.05 66.353 66.392 13..24 66.197 71.832 71.549 72.596 73.172 80.522 81,078 71.914 73.213 80.954 81.169 81.229
Reading # 74 - Jun 10 07:45:16 Pressures (PSIA)
1.. 3 74.994 74.978 14.307 Dew Points (IF)
1.. 6 66.418 76.441 65.596 66.695 69.702 65.177 Temperatures (IF)
1..12 66.038 0 70.509 70.676 71.248 73.116 71.74 72.73 76.043 75.953 66.32 66.36 13..24 66.173 71.799 71.484 72.563 73.162 80.308 80.86 71.858 73,167 80.754 80.96 81.016
Reading # 75 - Jun 10 08:00:16 Pressures (PSIA)
1.. 3 74.977 74.961 14.308 Dew Points (IF)
1.. 6 66.571 75.818 65.673 66.778 70.094 65.256 Temperatures (IF)
1..12 66.005 0 70.491 70.625 71.192 73.083 71.703 72.688 75.969 75.874 66.297 66.35 13..24 66.15 71,767 71.442 72.549 73.116 80.123 80.675 71.844 73.144 80.569 80.783 80.802

Calibrated Instrument Data P " Oconee Nuclear Station
Unit 2 - 6/93
Reading # 76 - Jun 10 08:14:41 Pressures (PSIA)
1..3 74.962 74.945 14.309 Dew Points (*F)
1.. 6 66.724 75.581 65.829 66.85 69.86 65.328 Temperatures (*F)
1.12 65.973 0 70.449 70.579 71.169 73.051 71.675 72.633 75.881 75,777 66.279 66.327 13..24 66.118 71.748 71.401 72.526 73.088 79.96 80.521 71.798 73.107 80.402 80.584 80.626
Reading # 77 - Jun 10 08:29:42 Pressures (PSIA)
1..3 74.947 74.93 14.312 Dew Points ("F)
1.. 6 66.804 75.427 65.906 67.008 69.782 65.331 Temperatures (fF)
1..12 65.973 0 70.426 70.537 71.127 73.018 71.652 72.633 75.807 75.712 66.265 66.318 13..24 66.099 71.725 71.368 72.517 73.074 79.798 80.364 71.784 73.084 80.244 80.44 80.491
Reading # 78 - Jun 10 08:43:45 Pressures (PSIA)
1.. 3 74.934 74.917 14.314 Dew Points ('F)
1.. 6 66.884 75.66 65.984 67.088 69.461 65.331 Temperatures (*F)
1..12 65.936 0 70.398 70.486 71.1 72.977 71.61 72.563 75.746 75.642 66.26 66.309 13..24 66,067 71.707 71.359 72.512 73.047 79.673 80.224 71.775 73.07 80.095 80.277 80.352
Reading # 79 - Jun 10 09:00:15 Pressures (PSIA)
1.. 3 74.92 74.902 14.314 Dew Points (*F)
1..6 66.963 75.893 66.147 67.164 69.228 65.334 Temperatures (F)
1.12 65.922 0 70.398 70.454 71.058 72.977 71.61 72.586 75.682 75.564 66.228 66.286 13..24 66.058 71.674 71.331 72.512 73 79.506 80.108 71.733 73.056 79.933 80.129 80.18
Reading # 80 - Jun 10 09:15:23 Pressures (PSIA)
1.. 3 74.907 74.891 14.315 Dew Points (fF)
1..6 67.037 75.816 66.145 67.323 69.147 65.408 Temperatures (*F)
1..12 65.913 0 70.356 70.431 71.049 72.935 71,592 72.563 75.64 75.508 66.228 66.235 13..24 66.025 71.683 71.285 72.521 73 79,381 79.965 71.729 73.014 79.812 79.994 80.078
Calibrated Instrument Data P "ge5ofl1 Oconee Nuclear Station
Unit 2 - 6/93
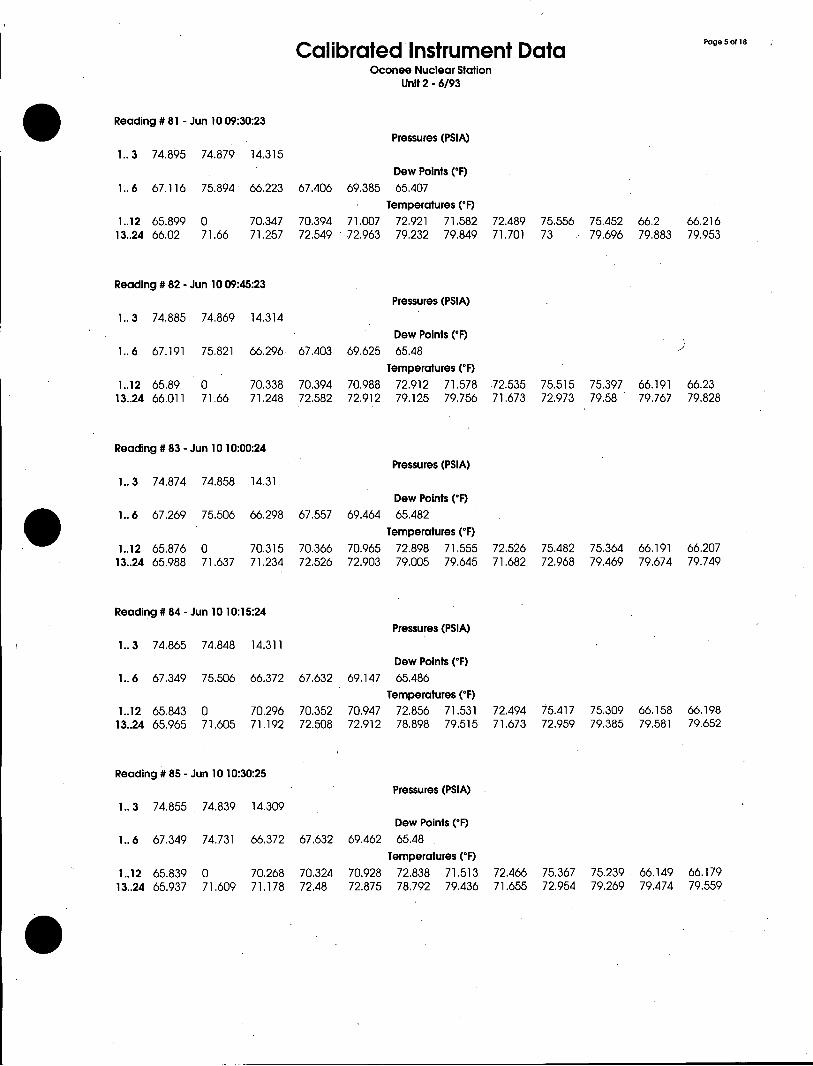
Reading # 81 - Jun 10 09:30:23 Pressures (PSIA)
1.. 3 74.895 74.879 14.315 Dew Points (*F)
1..6 67.116 75.894 66.223 67.406 69.385 65.407 Temperatures (*F)
1..12 65.899 0 70.347 70.394 71.007 72,921 71.582 72.489 75.556 75.452 66.2 66.216 13..24 66.02 71.66 71.257 72.549 72.963 79.232 79.849 71.701 73 79.696 79.883 79.953
Reading # 82 - Jun 10 09:45:23 Pressures (PSIA)
1.. 3 74.885 74.869 14.314 Dew Points (*F)
1.. 6 67.191 75.821 66.296 67.403 69.625 65.48 Temperatures (*F)
1..12 65.89 0 70.338 70.394 70.988 72.912 71.578 72.535 75,515 75.397 66.191 66.23 13..24 66.011 71.66 71.248 72.582 72.912 79.125 79.756 71.673 72.973 79.58 79.767 79.828
Reading # 83 - Jun 10 10:00:24 Pressures (PSIA)
1.. 3 74.874 74.858 14.31 Dew Points ("F)
1.. 6 67.269 75.506 66.298 67.557 69.464 65.482 Temperatures ('F)
1..12 65.876 0 70.315 70.366 70.965 72.898 71.555 72.526 75.482 75.364 66.191 66.207 13..24 65.988 71.637 71.234 72.526 72.903 79.005 79.645 71.682 72.968 79.469 79.674 79.749
Reading # 84 - Jun 10 10:15:24 Pressures (PSIA)
1..3 74.865 74.848 14.311 Dew Points ('F)
1.. 6 67.349 75.506 66.372 67.632 69.147 65.486 Temperatures (*F)
1..12 65.843 0 70.296 70.352 70.947 72.856 71.531 72.494 75.417 75.309 66.158 66.198 13..24 65.965 71.605 71.192 72.508 72.912 78.898 79.515 71.673 72.959 79.385 79.581 79.652
Reading # 85 - Jun 10 10:30:25 Pressures (PSIA)
1.. 3 74.855 . 74.839 14.309 Dew Points (*F)
1.. 6 67.349 74.731 66.372 67.632 69.462 65.48 Temperatures (*F)
1..12 65.839 0 70.268 70.324 70.928 72.838 71.513 72.466 75.367 75.239 66.149 66.179 13..24 65.937 71.609 71.178 72.48 72.875 78.792 79.436 71.655 72.954 79.269 79.474 79.559
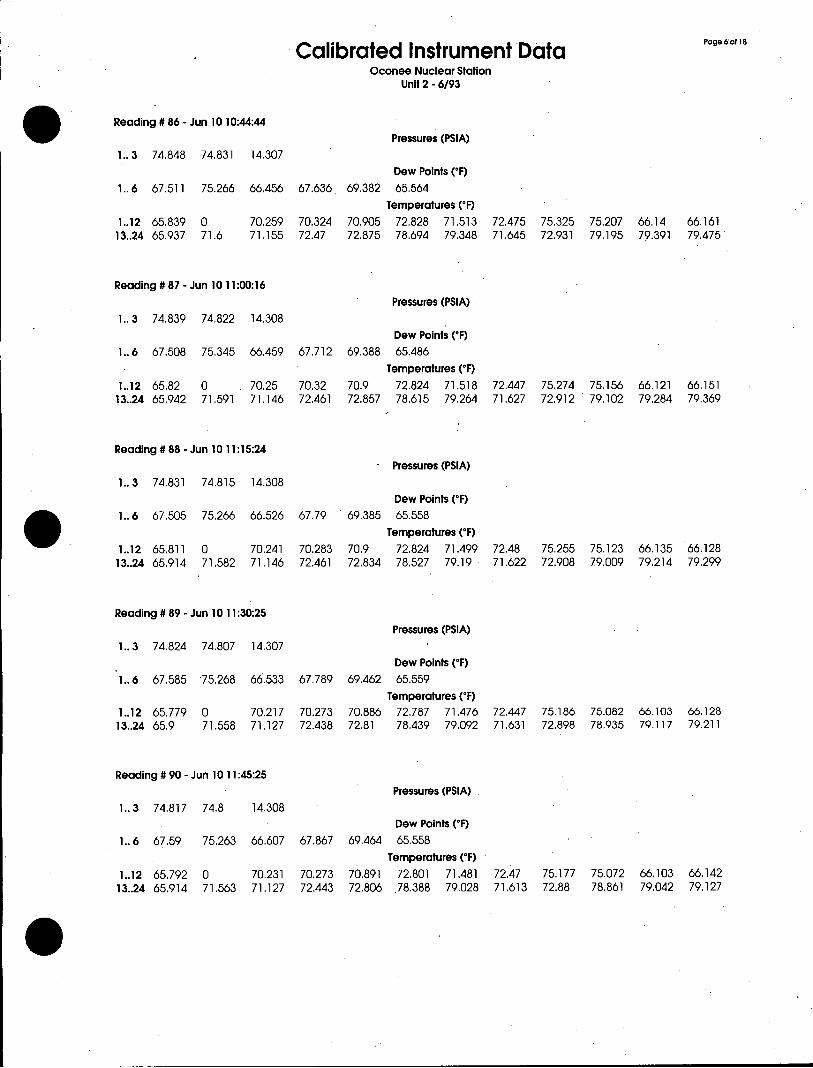
Calibrated Instrument Data Pg""
Oconee Nuclear Station Unit 2 - 6/93
Reading # 86 - Jun 10 10:44:44 Pressures (PSIA)
1.. 3 74.848 74.831 14.307 Dew Points (F)
1..6 67.511 75.266 66,456 67.636. 69.382 65.564 Temperatures (*F)
1..12 65.839 0 70.259 70.324 70.905 72.828 71.513 72.475 75.325 75.207 66.14 66.161 13..24 65.937 71.6 71.155 72.47 72.875 78.694 79.348 71.645 72.931 79.195 79.391 79.475
Reading # 87 - Jun 10 11:00:16 Pressures (PSIA)
1.. 3 74.839 74.822 14.308 Dew Points ('F)
1..6 67.508 75.345 66.459 67.712 69.388 65.486 Temperatures (*F)
1..12 65.82 0 . 70.25 70.32 70.9 72.824 71.518 72.447 75.274 75.156 66.121 66.151 13.24 65,942 71.591 71.146 72.461 72.857 78.615 79.264 71.627 72.912 79.102 79.284 79.369
Reading # 88 - Jun 10 11:15:24 Pressures (PSIA)
1.. 3 74.831 74.815 14.308 Dew Points (*F)
1.. 6 67.505 75.266 66.526 67.79 69.385 65.558 Temperatures (F)
1..12 65.811 0 70.241 70.283 70.9 72.824 71.499 72.48 75.255 75.123 66.135 66.128 13..24 65.914 71.582 71.146 72.461 72.834 78.527 79.19 71.622 72.908 79.009 79.214 79.299
Reading # 89 - Jun 10 11:30:25 Pressures (PSIA)
1.. 3 74.824 74.807 14.307 Dew Points (*F)
1.. 6 67.585 75.268 66.533 67.789 69,462 65.559 Temperatures (*F)
1..12 65.779 0 70.217 70.273 70.886 72.787 71.476 72.447 75.186 75.082 66.103 66.128 13..24 65.9 71.558 71,127 72.438 72.81 78.439 79.092 71,631 72.898 78.935 79.117 79.211
Reading # 90 - Jun 10 11:45:25 Pressures (PSIA)
1.. 3 74.817 74.8 14.308 Dew Points (F)
1.. 6 67.59 75.263 66.607 67.867 69.464 65.558 Temperatures (*F)
1..12 65.792 0 70.231 70.273 70.891 72.801 71.481 72.47 75,177 75.072 66.103 66.142 13..24 65,914 71.563 71,127 72.443 72.806 78.388 79.028 71.613 72.88 78.861 79.042 79.127
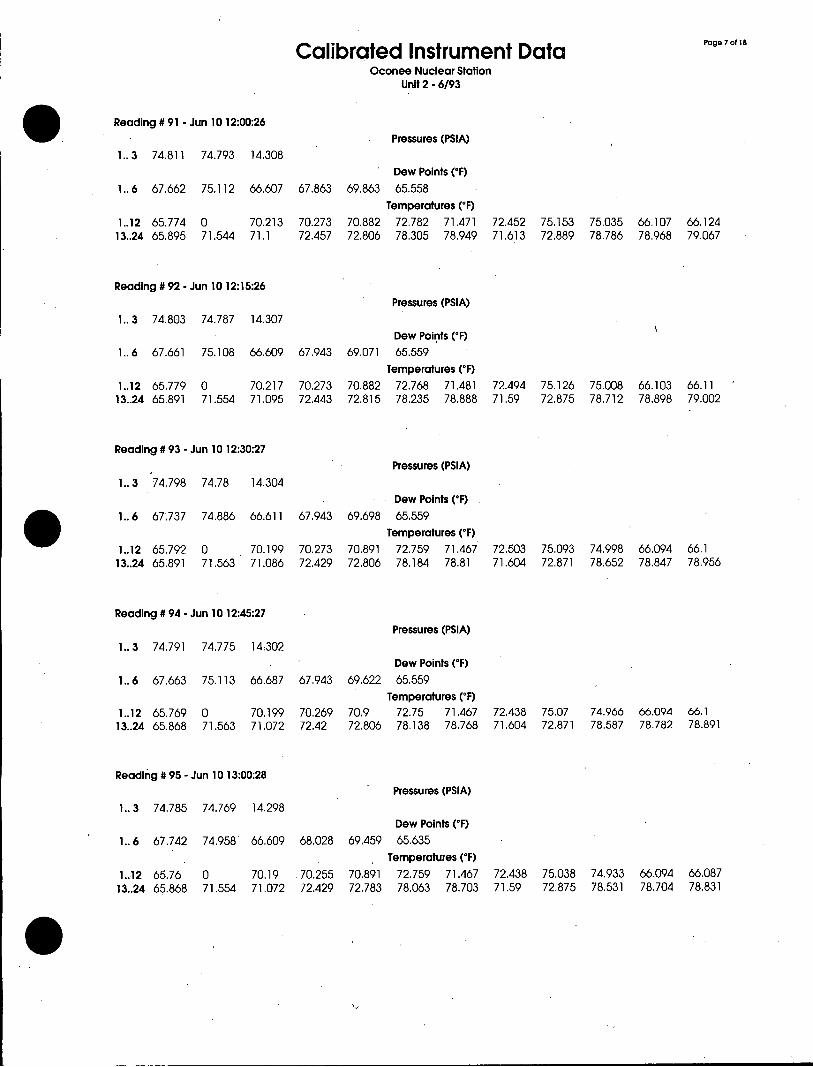
Calibrated Instrument Data Page 7 of 18
Oconee Nuclear Station Unit 2 - 6/93
Reading # 91 - Jun 10 12:00:26 Pressures (PSIA)
1..3 74.811 74.793 14.308 Dew Points (*F)
1..6 67.662 75.112 66.607 67.863 69.863 65.558 Temperatures (*F)
1..12 65.774 0 70.213 70.273 70.882 72.782 71.471 72.452 75.153 75,035 66.107 66.124 13..24 65.895 71.544 71.1 72.457 72.806 78.305 78.949 71.613 72.889 78,786 78.968 79.067
Reading # 92 - Jun 10 12:15:26 Pressures (PSIA)
1.. 3 74.803 74.787 14.307 Dew Points (*F)
1.. 6 67.661 75.108 66.609 67.943 69.071 65.559 Temperatures (0F)
1..12 65.779 0 70.217 70.273 70.882 72.768 71.481 72.494 75.126 75.008 66.103 66.11 13..24 65.891 71.554 71.095 72.443 72.815 78.235 78.888 71.59 72.875 78.712 78.898 79.002
Reading # 93 - Jun 10 12:30:27 Pressures (PSIA)
1.. 3 74.798 74.78 14.304 Dew Points (*F)
1..6 67.737 74.886 66.611 67.943 69.698 65.559 Temperatures (*F)
1..12 65.792 0 70.199 70.273 70.891 72.759 71.467 72.503 75.093 74.998 66.094 66.1 13..24 65.891 71.563 71.086 72.429 72.806 78.184 78.81 71.604 72.871 78.652 78.847 78.956
Reading # 94 - Jun 10 12:45:27 Pressures (PSIA)
1.. 3 74.791 74.775 14.302 Dew Points (oF)
1.6 67.663 75.113 66.687 67,943 69.622 65.559 Temperatures (*F)
1..12 65.769 0 70.199 70.269 70.9 72.75 71.467 72.438 75.07 74.966 66.094 66.1 13..24 65.868 71.563 71.072 72.42 72.806 78,138 78.768 71.604 72.871 78.587 78.782 78.891
Reading # 95 - Jun 10 13:00:28 Pressures (PSIA)
1.. 3 74.785 74.769 14.298 Dew Points ("F)
1.. 6 67.742 74.958 66.609 68.028 69.459 65.635 Temperatures (*F)
1..12 65.76 0 70.19 .70.255 70.891 72.759 71.467 72.438 75.038 74,933 66.094 66.087 13..24 65.868 71.554 71.072 72.429 72.783 78.063 78.703 71.59 72.875 78.531 78.704 78.831

Calibrated Instrument Data Page 8 of 18
Oconee Nuclear Station Unit 2 - 6/93
Reading # 96 - Jun 10 13:15:28 Pressures (PSIA)
1.. 3 74.781 74.764 14.298 Dew Points (OF)
1.. 6 67.738 74.885 66.683 67.948 69,697 65.558 Temperatures (OF)
1..12 65.76 0 70.19 70.246 70,882 72.759 71.467 72.447 75.028 74.933 66.084 66.077 13..24 65.858 71.54 71.072 72.42 72.773 78.031 78.638 71.622 72.866 78.475 78.662 78.78
Reading # 97 - Jun 10 13:30:29 Pressures (PSIA)
1.. 3 74.776 74.759 14.314 Dew Points (*F)
1.. 6 67.824 74.489 66.684 68.028 69.385 65.562 Temperatures (OF)
1..12 65.755 0 70,194 70.25 70.896 72.745 71.462 72.456 75.01 74.906 66.089 66,096 13..24 65.854 71.549 71.072 72.415 72.778 77.98 78.568 71.594 72.834 78.415 78.574 78.705
Reading # 98 - Jun 10 13:45:29 Pressures (PSIA)
1.. 3 74.77 74.754 14.295 Dew Points (OF)
1.. 6 67.817 74.649 66.686 68.021 69.461 65.564 Temperatures (OF)
1..12 65.76 0 70.19 70.269 70.882 72.736 71.457 72.461 74.982 74.91 66.07 66.068 13..24 65.858 71.54 71.053 72.42 72.783 77.924 78.508 71.608 72.829 78.364 78.536 78.645
Reading # 99 - Jun 10 14:00:30 Pressures (PSIA)
1.. 3 74.766 74.75 14.293 Dew Points ("F)
1.. 6 67.824 74.489 66.687 68.022 69.54 65.559 Temperatures ('F)
1..12 65.737 0 70.19 70.255 70.882 72.736 71.448 72.447 74.963 74.869 66.061 66.077 13..24 65.849 71.531 71.063 72.42 72.773 77.869 78.476 71.599 72.852 78.322 78.485 78.594
Reading # 100 - Jun 10 14:15:30 Pressures (PSIA)
1.. 3 74.762 74.744 14.292 Dew Points (*F)
1.. 6 67.822 74.575 66.691 68.105 69.466 65.639 Temperatures ('F)
1..12 65.737 0 70.176 70.273 70.882 72.726 71.467 72.484 74.94 74.855 66,047 66.068 13..24 65.849 71.54 71.044 72.41 72.783 77.813 78.411 71.599 72.843 78.276 78.43 78.548
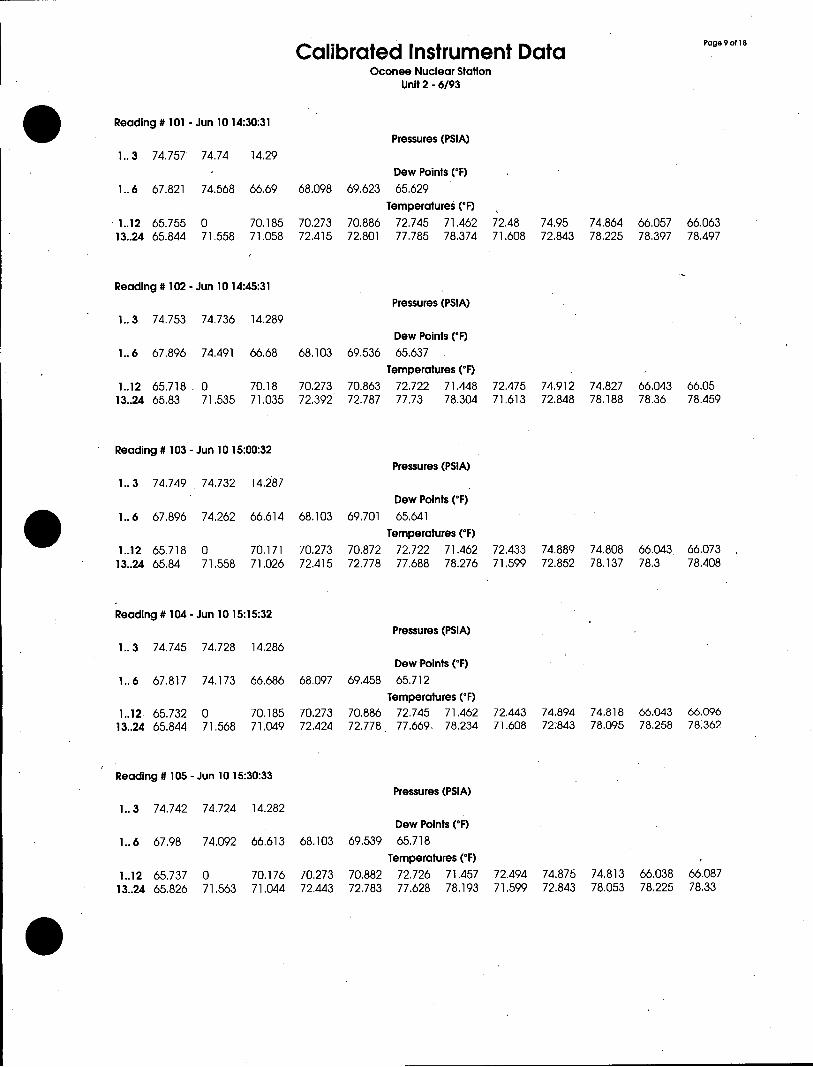
Calibrated Instrument Data Page 9 of 18
Oconee Nuclear Station Unit 2 - 6/93
Reading # 101 - Jun 10 14:30:31 Pressures (PSIA)
1.. 3 74.757 74.74 14.29 Dew Points (*F)
1.. 6 67.821 74.568 66.69 68.098 69.623 65.629 Temperatures (*F)
1..12 65.755 0 70.185 70.273 70.886 72.745 71.462 72.48 74.95 74,864 66.057 66,063 13..24 65.844 71.558 71.058 72.415 72.801 77,785 78.374 71.608 72.843 78.225 78.397 78.497
Reading # 102 - Jun 10 14:45:31 Pressures (PSIA)
1.. 3 74.753 74.736 14.289 Dew Points (*F)
1.. 6 67.896 74.491 66.68 68.103 69.536 65.637 Temperatures ('F)
1..12 65.718 . 0 70.18 70.273 70.863 72.722 71.448 72.475 74.912 74.827 66.043 66.05 13..24 65.83 71.535 71.035 72.392 72.787 77.73 78.304 71.613 72.848 78.188 78.36 78.459
Reading # 103 - Jun 10 15:00:32 Pressures (PSIA)
1.. 3 74.749 74.732 14.287 Dew Points ('F)
1.. 6 67.896 74.262 66.614 68.103 69.701 65.641 Temperatures (*F)
1..12 65.718 0 70.171 70.273 70.872 72.722 71.462 72.433 74.889 74.808 66.043 66.073 13..24 65.84 71.558 71.026 72.415 72.778 77.688 78.276 71,599 72.852 78.137 78.3 78.408
Reading # 104 - Jun 10 15:15:32 Pressures (PSIA)
1.. 3 74.745 74.728 14.286 Dew Points ("F)
1.. 6 67.817 74.173 66.686 68.097 69.458 65.712 Temperatures (*F)
1..12 65.732 0 70.185 70.273 70.886 72,745 71.462 72,443 74.894 74.818 66.043 66.096 13..24 65.844 71.568 71.049 72.424 72.778 77.669. 78.234 71.608 72:843 78.095 78.258 78.362
Reading # 105 - Jun 10 15:30:33 Pressures (PSIA)
1.. 3 74.742 74.724 14.282 Dew Points (*F)
1.. 6 67.98 74.092 66.613 68.103 69.539 65.718 Temperatures (0F)
1..12 65.737 0 70.176 70.273 70.882 72.726 71.457 72.494 74.875 74.813 66.038 66.087 13..24 65.826 71.563 71.044 72.443 72.783 77.628 78,193 71.599 72.843 78.053 78.225 78.33
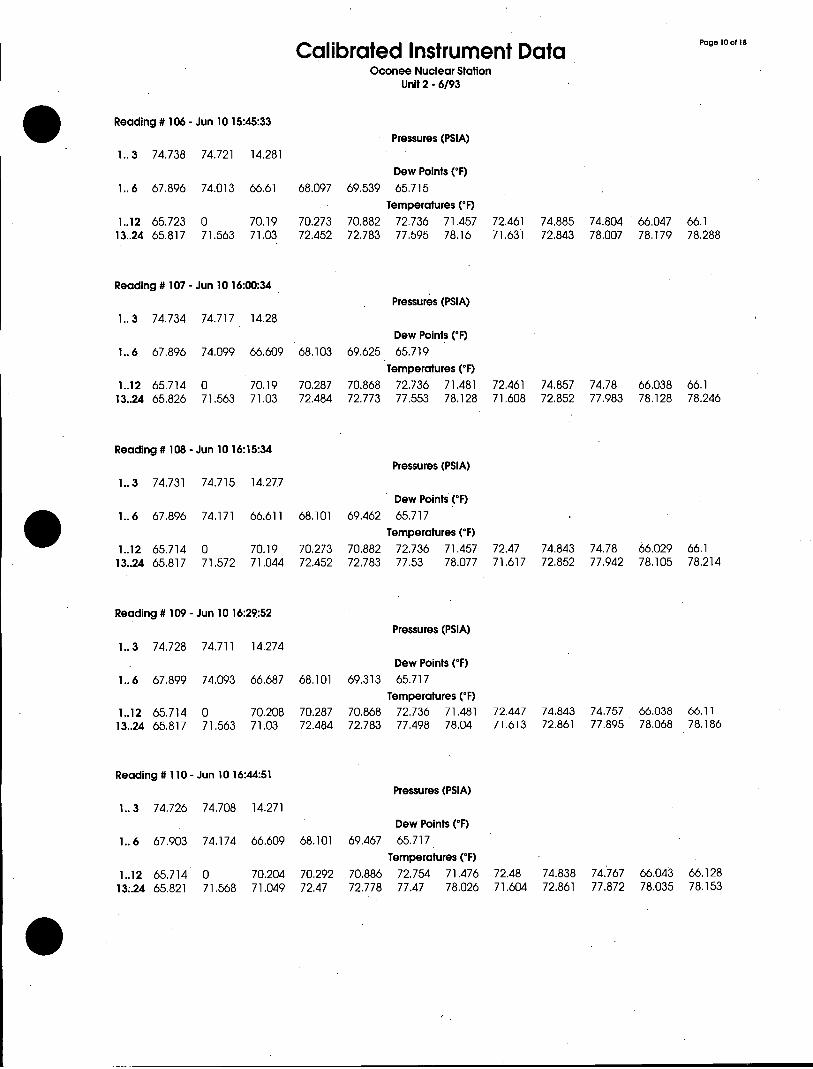
Calibrated Instrument Data Page 10 of 18
Oconee Nuclear Station Unit 2 - 6/93
Reading # 106 - Jun 10 15:45:33 Pressures (PSIA)
1.. 3 74.738 74.721 14.281 Dew Points (*F)
1.. 6 67.896 74.013 66.61 68.097 69.539 65.715 Temperatures (*F)
1..12 65.723 0 70.19 70.273 70.882 72,736 71.457 72.461 74.885 74.804 66.047 66.1 13..24 65.817 71.563 71.03 72.452 72.783 77.595 78.16 71.631 72.843 78.007 78.179 78.288
Reading # 107 - Jun 10 16:00:34 Pressures (PSIA)
1.. 3 74.734 74.717 14.28 Dew Points (*F)
1.. 6 67,896 74.099 66.609 68.103 69.625 65.719 Temperatures (*F)
1..12 65.714 0 70.19 70.287 70.868 72.736 71.481 72.461 74.857 74.78 66.038 66.1 13..24 65.826 71.563 71.03 72.484 72.773 77.553 78.128 71.608 72.852 77.983 78.128 78.246
Reading # 108 - Jun 10 16:15:34 Pressures (PSIA)
1.. 3 74.731 74,715 14.277 Dew Points (*F)
1..6 67.896 74,171 66.611 68,101 69.462 65.717 Temperatures (0F)
1..12 65.714 0 70.19 70.273 70.882 72.736 71.457 72.47 74.843 74.78 66.029 66,1 13..24 65.817 71.572 71.044 72.452 72.783 77.53 78.077 71.617 72.852 77.942 78.105 78.214
Reading # 109 - Jun 10 16:29:52 Pressures (PSIA)
1..3 74.728 74.711 14.274 Dew Points (oF)
1.. 6 67.899 74.093 66.687 68.101 69,313 65.717 Temperatures (*F)
1..12 65.714 0 70.208 70.287 70.868 72.736 71.481 72.447 74.843 74.757 66.038 66.11 13..24 65.817 71.563 71.03 72.484 72.783 77.498 78.04 71.613 72.861 77.895 78.068 78.186
Reading # 110 - Jun 10 16:44:51 Pressures (PSIA)
1.. 3 74.726 74.708 14.271 Dew Points ('F)
1.. 6 67.903 74.174 66.609 68.101 69.467 65.717 Temperatures (*F)
1..12 65.714 0 70.204 70.292 70.886 72.754 71.476 72.48 74.838 74.767 66.043 66.128 13.24 65.821 71.568 71.049 72.47 72.778 77.47 78.026 71.604 72.861 77.872 78.035 78.153
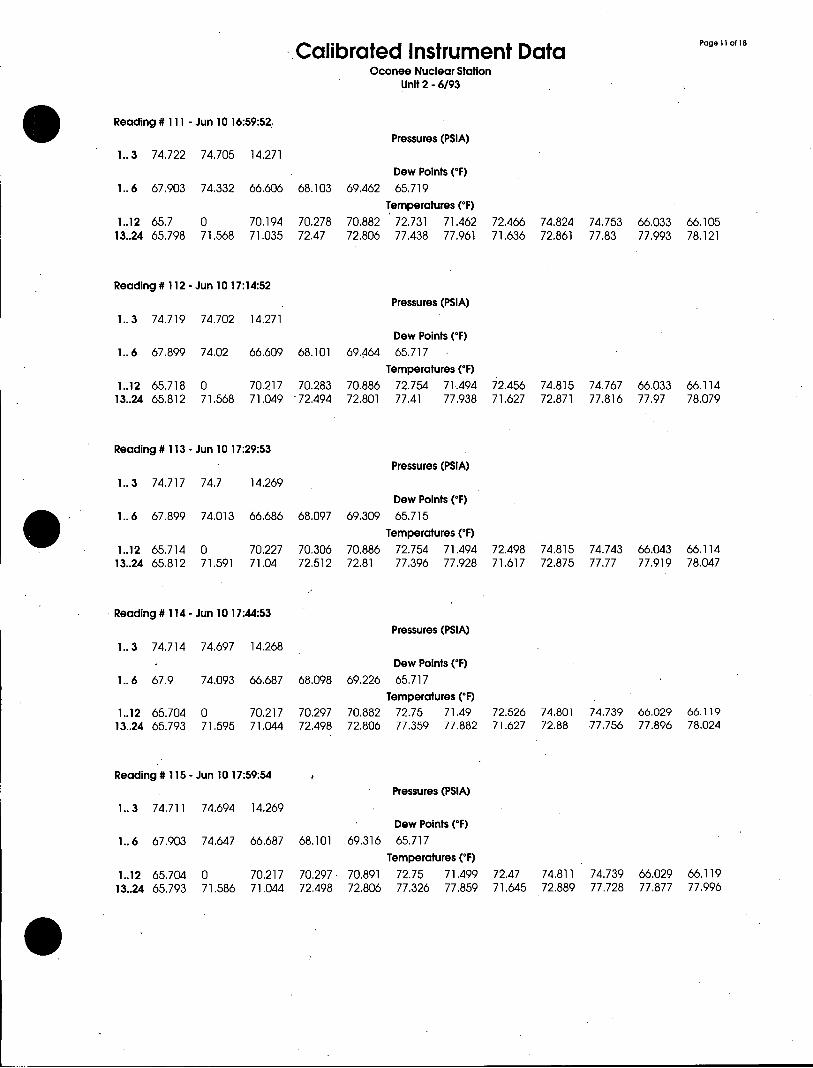
Calibrated Instrument Data Page " of 18
Oconee Nuclear Station Unit 2 - 6/93
Reading # 111 - Jun 10 16:59:52. Pressures (PSIA)
1.. 3 74.722 74.705 14.271 Dew Points (OF)
1.. 6 67.903 74.332 66.606 68.103 69.462 65.719 Temperatures (OF)
1..12 65.7 0 70,194 70.278 70.882 72.731 71.462 72.466 74.824 74.753 66.033 66.105 13..24 65.798 71.568 71.035 72.47 72.806 77.438 77.961 71.636 72.861 77.83 77.993 78.121
Reading # 112 - Jun 10 17:14:52 Pressures (PSIA)
1..3 74.719 74.702 14.271 Dew Points (OF)
1.. 6 67.899 74.02 66.609 68.101 69.464 65.717 Temperatures (OF)
1..12 65.718 0 70.217 70.283 70.886 72.754 71.494 72.456 74.815 74.767 66.033 66.114 13..24 65.812 71.568 71.049 72.494 72.801 77.41 77.938 71.627 72.871 77.816 77.97 78.079
Reading # 113 - Jun 10 17:29:53 Pressures (PSIA)
1..3 74.717 74.7 14.269 Dew Points (OF)
1.. 6 67.899 74.013 66.686 68.097 69.309 65.715 Temperatures (OF)
1..12 65.714 0 70.227 70.306 70.886 72.754 71.494 72.498 74.815 74.743 66.043 66.114 13..24 65.812 71.591 71.04 72.512 72.81 77.396 77.928 71.617 72.875 77.77 77.919 78.047
Reading # 114 - Jun 10 17:44:53 Pressures (PSIA)
1.. 3 74.714 74,697 14.268 Dew Points ("F)
1.. 6 67.9 74.093 66.687 68.098 69.226 65,717 Temperatures ('F)
1..12 65.704 0 70.217 70.297 70.882 72.75 71.49 72.526 74.801 74.739 66.029 66.119 13..24 65.793 71.595 71.044 72,498 72.806 77.359 77.882 71.627 72.88 77.756 77.896 78.024
Reading # 115 - Jun 10 17:59:54 Pressures (PSIA)
1..3 74.711 74.694 14.269 Dew Points ("F)
1.. 6 67.903 74.647 66.687 68.101 69.316 65.717 Temperatures ('F)
1..12 65.704 0 70.217 70.297 70.891 72.75 71.499 72.47 74.811 74.739 66.029 66.119 13..24 65.793 71.586 71.044 72.498 72.806 77.326 77.859 71.645 72.889 77.728 77.877 77.996

Calibrated Instrument Data P2
Oconee Nuclear Station Unit 2 - 6/93
Reading # 116 - Jun 10 18:14:54
Pressures (PSIA) 1..3 74.709 74.693 14.269
Dew Points (*F) 1..6 67.899 74.409 66.607 68.027 69.309 65.718
Temperatures (*F) 1..12 65.704 0 70.231 70.297 70.882 72.768 71.49 72.484 74.811 74.739 66.029 66,119 13..24 65.807 71.586 71.053 72.508 72.806 77.326 77.826 71,65 72.88 77.7 77.84 77.959
Reading # 117 - Jun 10 18:29:55 Pressures (PSIA)
1.. 3 74.707 74.689 14.27 Dew Points (*F)
1.. 6 67.903 73.866 66.69 68.103 69.31 65.717 Temperatures (*F)
1..12 65.704 0 70.217 70.297 70.9 72.759 71.49 72.512 74.801 74.739 66.029 66.119 13..24 65.807 71.605 71.063 72.498 72.792 77.303 77.803 71.65 72.889 77.677 77.808 77.945
Reading # 118 - Jun 10 18:44:55 Pressures (PSIA)
1.. 3 74.705 74.688 14.27 Dew Points (*F)
1.. 6 67.979 73.94 66.609 68.102 69.387 65.793 Temperatures (*F)
1..12 65.704 0 70.231 70.297 70.9 72.759 71.499 72.503 74.811 74.739 66.038 66.11 13..24 65.793 71.614 71.053 72.508 72.815 77.28 77.771 71.659 72.88 77.645 77.794 77.917
Reading # 119 - Jun 10 18:59:56 Pressures (PSIA)
1.. 3 74.702 74.686 14.268 Dew Points (0F)
1.. 6 67.899 74.335 66.609 68.106 69.223 65.793 Temperatures (*F)
1..12 65.714 0 70.227 70.315 70.905 72.773 71.518 72.489 74.815 74.743 66.043 66.114 13..24 65.803 71.623 71.058 72.535 72.81 77,257 77.766 71.655 72.894 77.617 77.766 77.889
Reading # 120 - Jun 10 19:05:20 Pressures (PSIA)
1.. 3 74.701 74.684 14.27 Dew Points (*F)
1.. 6 67.9 74.335 66.685 68,104 69.144 65.793 Temperatures (*F)
1..12 65.709 0 70.245 70.315 70.914 72.773 71.504 72.517 74.806 74.73 66.033 66.124 13..24 65.812 71.609 71.067 72.521 72.806 77.257 77.752 71.659 72.903 77.612 77.752 77.87
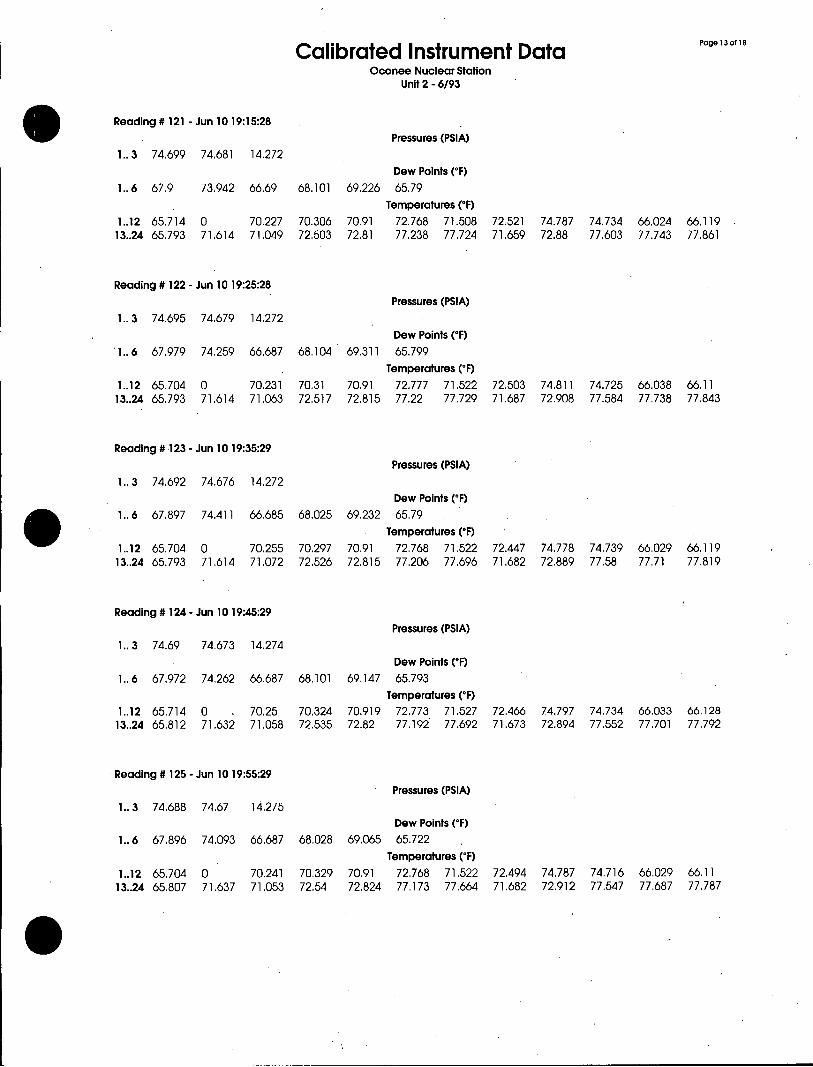
Calibrated Instrument Data Page 13 of 18
Oconee Nuclear Station Unit 2 - 6/93
Reading # 121 - Jun 10 19:15:28 Pressures (PSIA)
1.. 3 74.699 74.681 14.272 Dew Points (IF)
1.. 6 67.9 73.942 66.69 68.101 69.226 65.79 Temperatures ('F)
1..12 65.714 0 70.227 70.306 70.91 72.768 71.508 72.521 74.787 74,734 66.024 66,119 13..24 65.793 71.614 71.049 72.503 72.81 77.238 77.724 71.659 72.88 77.603 77.743 77.861
Reading # 122 - Jun 10 19:25:28 Pressures (PSIA)
1.. 3 74.695 74.679 14.272 Dew Points ("F)
1.. 6 67.979 74.259 66.687 68.104 69.311 65.799 Temperatures (IF)
1..12 65.704 0 70.231 70.31 70.91 72.777 71.522 72.503 74.811 74.725 66.038 66.11 13..24 65.793 71.614 71.063 72.517 72.815 77.22 77.729 71.687 72.908 77.584 77.738 77.843
Reading # 123 - Jun 10 19:35:29 Pressures (PSIA)
1.. 3 74.692 74.676 14.272 Dew Points (OF)
1..6 67.897 74.411 66.685 68.025 69.232 65.79 Temperatures (IF)
1..12 65.704 0 70.255 70,297 70.91 72.768 71.522 72.447 74.778 74.739 66.029 66.119 13..24 65.793 71,614 71.072 72.526 72.815 77.206 77.696 71.682 72.889 77.58 77,71 77.819
Reading # 124 - Jun 10 19:45:29 Pressures (PSIA)
1.. 3 74.69 74.673 14.274 Dew Points ('F)
1.. 6 67.972 74.262 66.687 68.101 69.147 65.793
Temperatures (IF) 1..12 65.714 0 - 70.25 70.324 70.919 72.773 71.527 72.466 74.797 74.734 66.033 66.128 13..24 65.812 71.632 71.058 72.535 72.82 77.192 77.692 71.673 72.894 77.552 77.701 77.792
Reading # 125 - Jun 10 19:55:29 Pressures (PSIA)
1.. 3 74.688 74.67 14.275 Dew Points (IF)
1.. 6 67.896 74.093 66.687 68.028 69.065 65.722 Temperatures (OF)
1..12 65.704 0 70.241 70.329 70.91 72.768 71.522 72.494 74.787 74.716 66.029 66.11 13..24 65.807 71.637 71.053 72.54 72.824 77,173 77.664 71.682 72.912 77.547 77.687 77.787
Calibrated Instrument Data Page 14 of 18
Oconee Nuclear Station Unit 2 - 6/93
Reading # 126 - Jun 10 20:05:30 Pressures (PSIA)
1.. 3 74.685 74.667 14.276 Dew Points (*F)
1.. 6 67.899 74.096 66.69 68.101 69.15 65.717 Temperatures ("F)
1..12 65.704 0 70.241 70.31 70,923 72.777 71.499 72.526 74.787 74.725 66.029 66.11 13..24 65.793 71.651 71.063 72.54 72,824 77.173 77,641 71.692 72.912 77.524 77.678 77.764
Reading # 127 - Jun 10 20:14:33 Pressures (PSIA)
1.. 3 74.683 74.665 14.275 Dew Points (*F)
1.. 6 67.899 74.57 66.686 68.106 69.146 65.794 Temperatures (*F)
1..12 65.695 0 70.255 70.31 70.923 72.768 71.508 72.526 74.787 74.716 66.038 66.119 13..24 65.784 71.637 71.063 72.563 72.838 77.164 77,618 71.701 72.908 77.51 77.659 77.782
Reading # 128 - Jun 10 20:25:21 Pressures (PSIA)
1.. 3 74.68 74.662 14.276 Dew Points (*F)
1.. 6 67.903 74.804 66.687 68.101 69.153 65.793 Temperatures (*F)
1..12 65.709 0 70.268 70.315 70.914 72.796 71.536 72.498 74.783 74.711 66.043 66.137 13..24 65.798 71.632 71.067 72.568 72.838 77.145 77.622 71.692 72.922 77.482 77.645 77.75
Reading # 129 - Jun 10 20:35:40 Pressures (PSIA)
1.. 3 74.677 74.66 14.275 Dew Points ("F)
1.. 6 67.903 74.571 66.684 68.098 69.068 65.795 Temperatures (*F)
1..12 65.718 0 70.259 70.324 70.928 72.782 71.536 72.549 74.774 74.72 66.033 66.114 13..24 65.798 71.656 71.067 72.554 72.852 77.136 77.604 71.701 72.917 77.492 77.65 77.745
Reading # 130 - Jun 10 20:45:48 Pressures (PSIA)
1.. 3 74.673 74.657 14.275 Dew Points (*F)
1..6 67.899 74.411 66.687 68.022 69.068 65.719 Temperatures (*F)
1..12 65.704 0 70.273 70.31 70.923 72.791 71.531 72.512 74.778 74.706 66.038 66.119 13.24 65.793 71.637 71.072 72.563 72.847 77.132 77.599 71.701 72.931 77.468 77.631 77.727
Calibrated Instrument Data on1
Oconee Nuclear Station Unit 2 - 6/93
Reading # 131 - Jun 10 20:55:48 Pressures (PSIA)
1.. 3 74.672 74.655 14.277 Dew Points (IF)
1.. 6 67.896 74.012 66.687 68.098 68.993 65.789 Temperatures (IF)
1..12 65.709 0 70.259 70.301 70.937 72.782 71.527 72.517 74.774 74.711 66.02 66.105 13..24 65.789 71.656 71.067 72.554 72.838 77.113 77.571 71.71 72.922 77.459 77.622 77.699
Reading # 132 - Jun 10 21:05:49 Pressures (PSIA)
1.. 3 74.669 74.652 14.279 Dew Points (*F)
1.. 6 67.975 74.486 66.687 68.098 69.065 65.714 Temperatures (IF)
1..12 65.714 0 7.0.264 70.31 70.933 72.791 71.531 72.558 74.778 74.706 66.038 66.11 13.24 65.793 71.66 71.063 72.582 .72.847 77.108 77.567 71.715 72.917 77.431 77.604 77.69
Reading # 133 - Jun 10 21:15:49 Pressures (PSIA)
1.. 3 74.667 74.65 14,279 Dew Points ("F)
1.. 6 67.903 74.414 66.772 68.104 68.995 65.72 Temperatures (IF)
1..12 65.714 0 70.273 70.31 70.933 72.801 71.545 72.549 74.778 74.706 66.038 66.11 13..24 65.784 71.66 71.086 72.614 72.847 77.085 .77.567 71.719 72.931 77.436 77.608 77.694
Reading # 134 - Jun 10 21:25:49 Pressures (PSIA)
1.. 3 74.665 74.648 14.282 Dew Points ("F)
1.. 6 67.979 74.254 66.687 68.101 69.147 65.793 Temperatures (IF)
1..12 65.704 0 70.273 70.32 70.947 72.791 71.545 72.535 74.778 74.706 66.038 66.119 13..24 65.793 71.66 71.072 72.623 72.857 77.085 77,543 71.724 72.935 77,403 77.58 77.1676
Reading # 135 - Jun 10 21:35:50 Pressures (PSIA)
1.. 3 74.662 74.645 14.28 Dew Points ("F)
1.. 6 ,67.899 74,17.1 66.772 68.101 68.911 65.795 Temperatures (IF)
1..12 65.714 0 70.273 70.31 70.947 72.791 71.545 72.549 74.778 74.706 66.038 66,119 13..24 65.784 71.67 71.072 72.646 72.871 77.085 77.529 71.729 72.94 77.399 77.576 77.671
Calibrated Instrument Data Page 16 of 18
Oconee Nuclear Station Unit 2 - 6/93
Reading # 136 - Jun 10 21:45:50
Pressures (PSIA) 1..3 74.66 74.643 14.282
Dew Points (*F) 1.. 6 67.899 74.171 66.772 68.103 68.914 65.717
Temperatures (*F) 1.12 65.718 0 70.282 70.315 70,961 72.81 71.55 72.554 74.783 74.72 66.043 66.114 13..24 65.803 71.679 71.09 72.665 72.866 77.081 77.525 71.729 72.926 77.38 77.552 77,648
Reading # 137 - Jun 1021:55:50 Pressures (PSIA)
1.. 3 74.658 74.641 14,282
Dew Points (0F) 1.. 6 67.903 74.329 66.775 68.101 68.914 65.717
Temperatures (*F) 1..12 65.704 0 70.287 70.297 70.947 72.801 71.564 72.568 74.769 74.716 66.029 66.119
13..24 65.784 71.67 71.086 72.693 72.815 77.057 77.511 71.71 72.945 77.385 77.539 77.643
Reading # 138 - Jun 10 22:05:51 Pressures (PSIA)
1..3 74.656 74.639 14.301 Dew Points (*F)
1.. 6 67.899 74.093 66.768 68.101 69.071 65.717 Temperatures (*F)
1.12 65.704 0 70.296 70.297 70.947 72.814 71.555 72.549 74.778 74.725 66.029 66.119 13..24 65.793 71.66 71.109 72.67 72.792 77.057 77.502 71.729 72.94 77.357 77.52 77.615
Reading # 139 - Jun 10 22:15:51 Pressures (PSIA)
1.. 3 74.654 74.636 14.287 Dew Points (*F)
1..6 67.906 74.018 66.769 68.028 68.993 65.72 Temperatures (*F)
1..12 65.728 0 70.301 70.31 70.97 72.838 71.578 72.6 74.801 74.748 66.052 66.133 13..24 65.798 71.693 71.118 72,693 72.815 77.057 77.511 71.729 72.949 77.348 77.52 77.615
Reading # 140 - Jun 10 22:25:51 Pressures (PSIA)
1..3 74.651 74,634 14.289 Dew Points (*F)
1.. 6 67.906 74.093 66.772 68.104 68.838 65.72 Temperatures ('F)
1..12 65.704 0 70.296 70.297 70.956 72.814 71.564 72.6 74.778 74.725 66.029 66.133 13..24 65.784 71.683 71.109 72.702 72.815 77.02 77.478 71.733 72.959 77.343 77.501 77.611
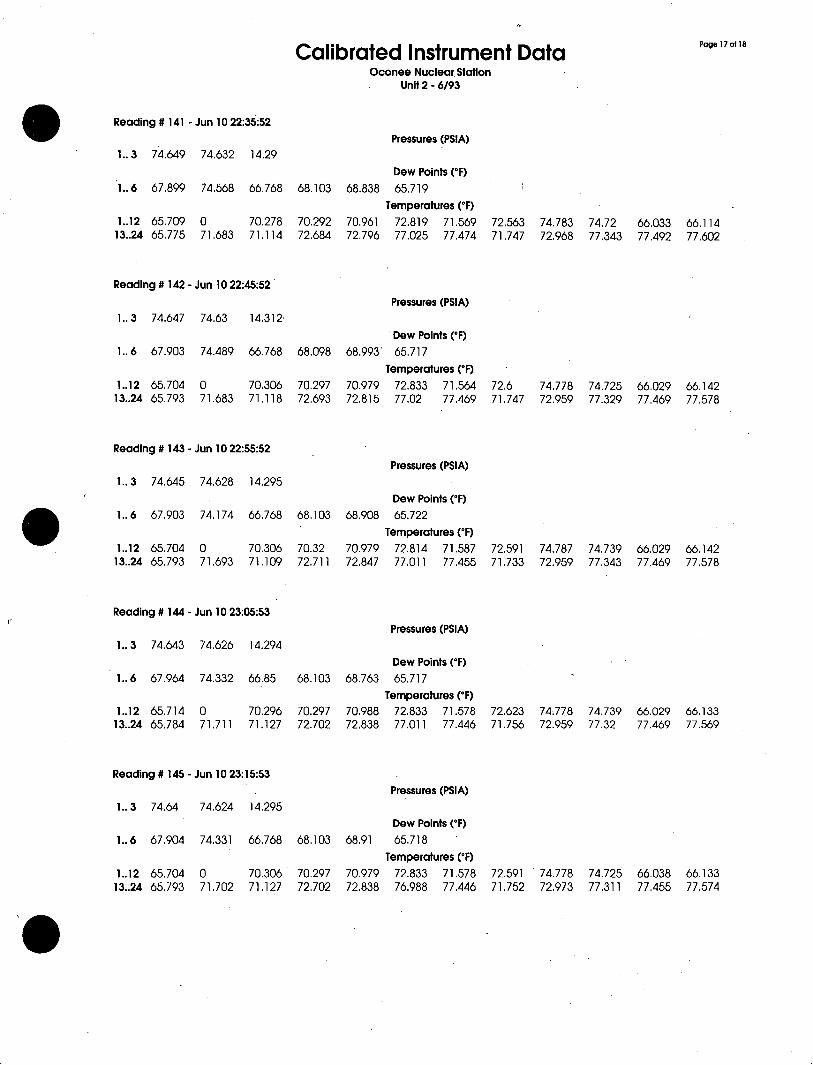
Calibrated Instrument Data Page 17 of 18
Oconee Nuclear Station Unit 2 - 6/93
Reading # 141 - Jun 10 22:35:52 Pressures (PSIA)
1.. 3 74.649 74.632 14.29 Dew Points (*F)
1.. 6 67.899 74.568 66.768 68.103 68.838 65.719 Temperatures (*F)
1.12 65.709 0 70.278 70.292 70.961 72.819 71.569 72.563 74.783 74.72 66.033 66.114 13..24 65,775 71.683 71.114 72.684 72.796 77.025 77.474 71.747 72,968 77.343 77.492 77.602
Reading # 142 - Jun 10 22:45:52 Pressures (PSIA)
1.. 3 74.647 74.63 14.312 Dew Points (*F)
1.. 6 67.903 74.489 66.768 68.098 68.993 65,717 Temperatures (*F)
1..12 65.704 0 70.306 70.297 70.979 72.833 71.564 72.6 74.778 74.725 66.029 66.142 13..24 65.793 71.683 71,118 72.693 72.815 77.02 77.469 71.747 72.959 77.329 77.469 77.578
Reading # 143 - Jun 10 22:55:52 Pressures (PSIA)
1.. 3 74.645 74.628 14.295 Dew Points (*F)
1.. 6 67.903 74.174 66.768 68.103 68.908 65.722 Temperatures (*F)
1..12 65.704 0 70.306 70.32 70.979 72.814 71.587 72.591 74.787 74.739 66.029 66.142 13..24 65.793 71.693 71.109 72.711 72.847 77.011 77.455 71.733 72.959 77.343 77.469 77.578
Reading # 144 - Jun 10 23:05:53 Pressures (PSIA)
1.. 3 74.643 74.626 14.294 Dew Points (*F)
1.. 6 67.964 74.332 66.85 68.103 68.763 65.717 Temperatures (*F)
1..12 65.714 0 70.296 70.297 70.988 72.833 71.578 72.623 74.778 74.739 66.029 66.133 13..24 65.784 71,711 71.127 72.702 72.838 77.011 77.446 71.756 72.959 77.32 77.469 77.569
Reading # 145 - Jun 10 23:15:53 Pressures (PSIA)
1.. 3 74.64 74.624 14.295 Dew Points (*F)
1.. 6 67.904 74.331 66.768 68.103 68.91 65.718 Temperatures ("F)
1..12 65.704 0 70.306 70.297 70.979 72.833 71.578 72.591 74.778 74.725 66.038 66.133 13..24 65.793 71.702 71.127 72.702 72.838 76.988 77.446 71.752 72.973 77.311 .77.455 77.574
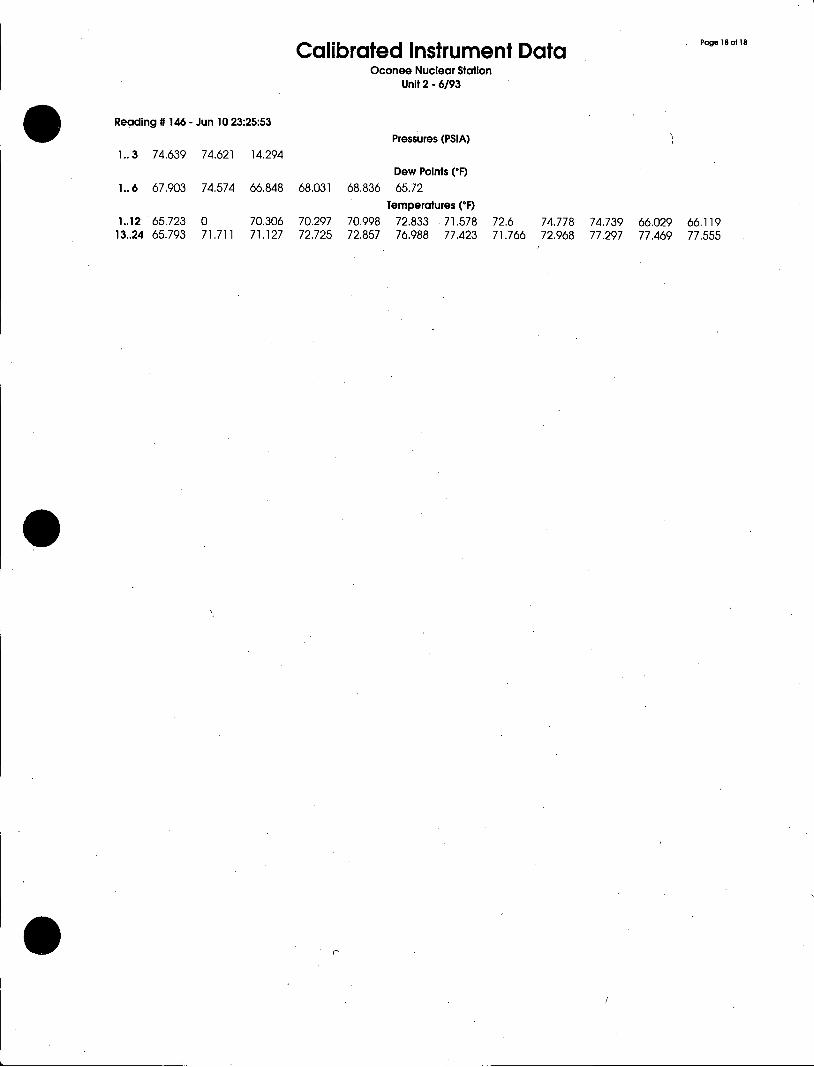
Calibrated Instrument Data P "gel8ofI8 Oconee Nuclear Station
Unit 2 - 6/93
Reading # 146 - Jun 10 23:25:53 Pressures (PSIA)
1.. 3 74.639 74.621 14.294 Dew Points (*F)
1.. 6 67.903 74.574 66.848 68,031 68.836 65.72 Temperatures (*F)
1..12 65.723 0 70.306 70.297 70.998 72.833 71.578 72.6 74.778 74.739 66.029 66,119 13.24 65.793 71.711 71.127 72.725 72.857 76.988 77.423 71.766 72.968 77.297 77.469 77.555
Oconee Unit 2
APPENDIX F
Local Leakage Rate Testing Conducted Since Last ILRT
Reports:
* EOC-12 Type C Summary * EOC-13 Type C Summary * Type B Leakage Summary Since Last ILRT * EOC- 12 Type B & C Test Failures * EOC- 13 Type B & C Test Failures
0
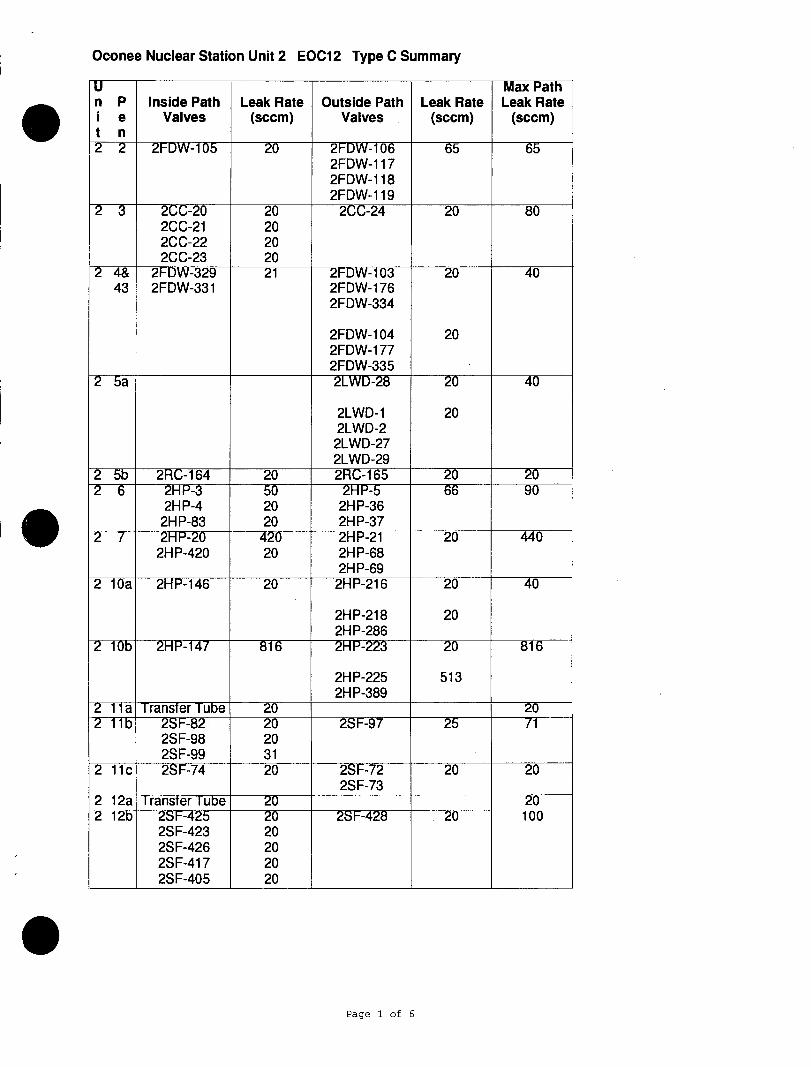
Oconee Nuclear Station Unit 2 EOC12 Type C Summary
U Max Path n P Inside Path Leak Rate Outside Path Leak Rate Leak Rate ie Valves (sccm) Valves (sccm) (sccm) t n 2 2 2FDW-105 20 2FDW-106 65 6
2FDW-117 2FDW-1 18 2FDW-1 19
2 3 200-20 20 2CC-24 20 80 2CC-21 20 2CC-22 20 2CC-23 20
2 4& 2FDW-329 21 2-FDW-TO3 20 40 43 2FDW-331 2FDW-176
2FDW-334
2FDW-104 20 2FDW-177 2FDW-335 2LWD-28 20 40
2LWD-1 20 2LWD-2
2LWD-27 2LWD-29
225b RC-164 2 2RC-165 20 20 2 6 2HP-3 50 66 90
2HP-4 20 2HP-36 2HP-83 20 2HP-37
2T 2HP-20 420 2HP-21 20 440 2HP-420 20 2HP-68
2HP-69
2 10a 2HP-146 20 2HP-216 20 40
2HP-218 20 2HP-286
2710 2HP-147 816 2HP-223 0 816
2HP-225 513 S ~ 2H P-389
-211a Transfer Tube 20 20 2 Tb 2SF-82 20 2SF-97 2 71
2SF-98 20 2SF-99 31
2 11c 2SF-74 20 2SF-72 20 20 S ~ 2SF-73
2 12a Transfer Iube 20 20 2 12b 2SF-425 20 28E428 20 100
2SF-423 20 2SF-426 20 2SF-417 20 2SF-405 20
P Page 1 of 6
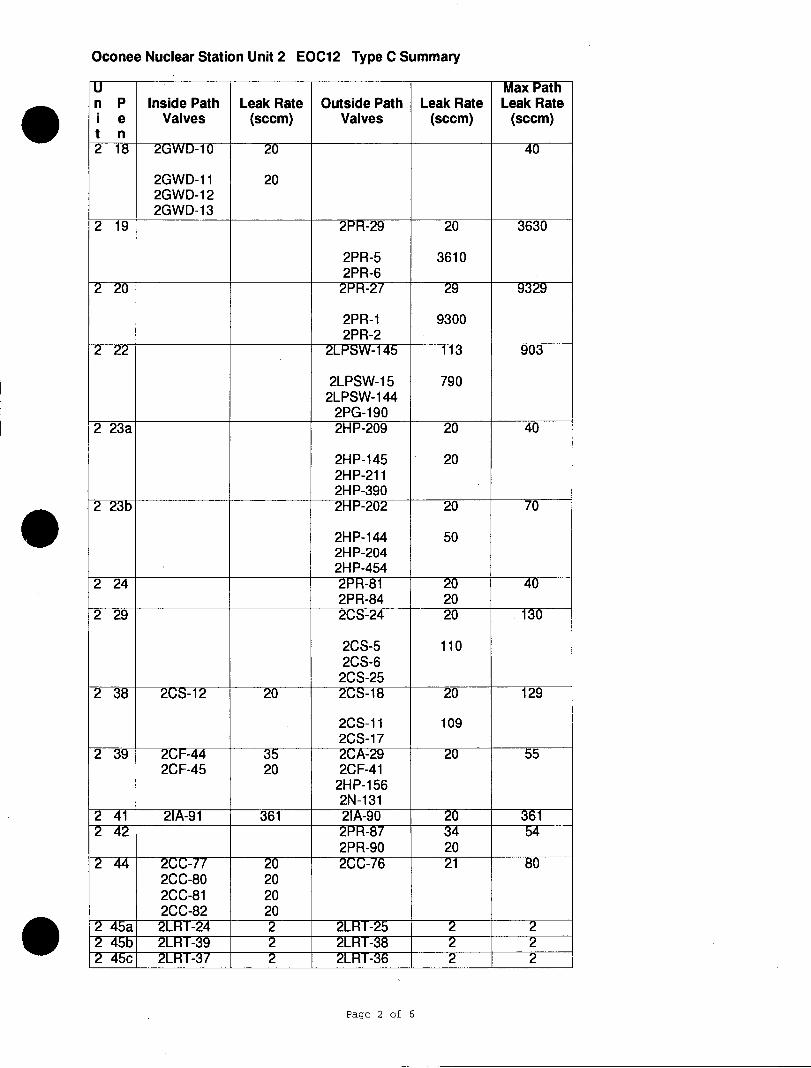
Oconee Nuclear Station Unit 2 EOC12 Type C Summary
U Max Path n P Inside Path Leak Rate Outside Path Leak Rate Leak Rate ie Valves (sccm) Valves (sccm) (sccm)
S 2GWD-1 20
2GWD-11 20 2GWD-12 2GWD-13
2 19 2PR-29 20 3630
2PR-5 3610 2PR-6
2 20 PH-2/ 29 9329
2PR-1 9300 2PR-2
2-22 2LPSW-145 13 903
2LPSW-15 790 2LPSW-144
2PG-190 2 23a 2HP-209 20 40
2HP-145 20 2HP-211 2H P-390
2 23bi 2HP-202 2
2HP-144 50 2H P-204 2HP-454
2 24 2PR-81 20 40 2PR-84 20
2 29 2CS-24 20
2CS-5 110 2CS-6
2CS-25 2 38 2CS-12 20 2CS-18 20 29
2CS-11 109 2CS-17
2 39 2CF-44 35 2CA-29 20 55 2CF-45 20 2CF-41
2HP-156 2N-131
2 41 21A-91 361 21A-90 20 361 2 42 2PR-87345
2PR-90 20 2 447 2C-77 07 2
2CC-80 20 2CC-81 20 2CC-82 20
45a 2LRI-24 2 2LRT-25 2 2 2 4 2L-39 2 2LRI-38 2 2 2 45c 2LRT-37 2 2LRT-36 2 2
Page 2 of 6
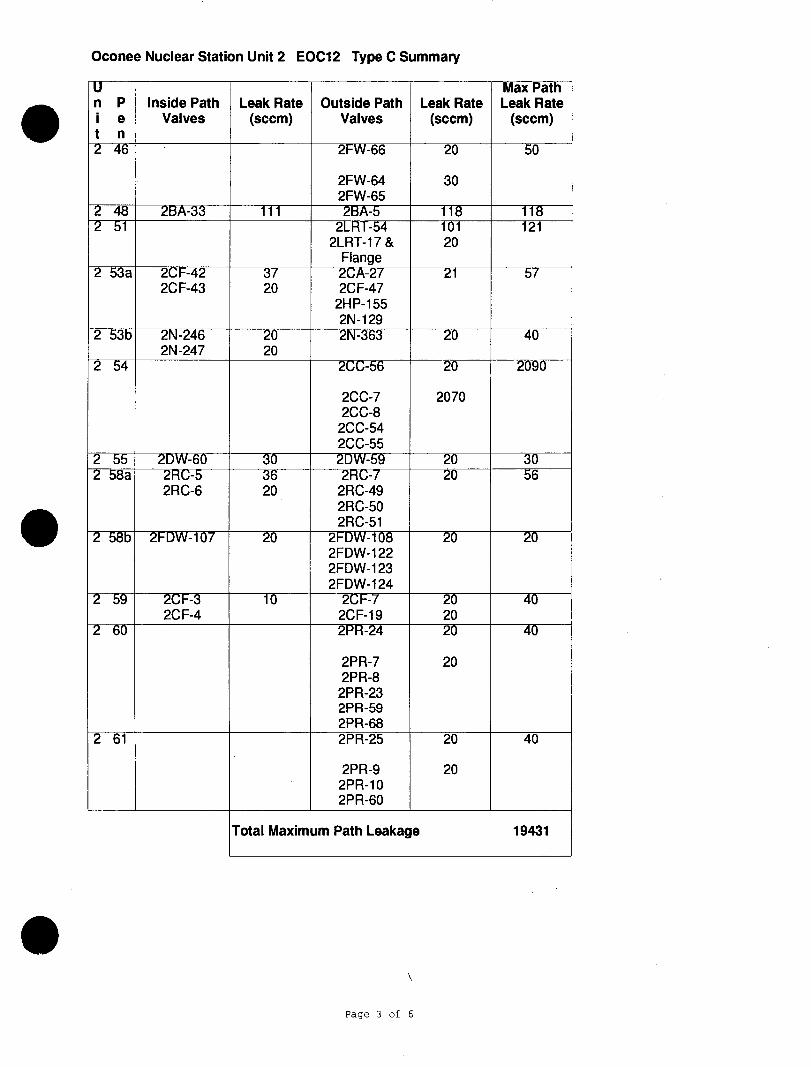
Oconee Nuclear Station Unit 2 EOC12 Type C Summary
U Max Path n P Inside Path Leak Rate Outside Path Leak Rate Leak Rate I e Valves (sccm) Valves (sccm) (sccm) t n 246 -2FW-66 20 50
2FW-64 30 2FW-65
248 2BA-33 111 2BA-5 118 118 251 E2LRT-54 1
2LRT-17 & 20 Flange
2 3a 20F-42 37 2CA-27 2 2CF-43 20 2CF-47
2HP-155 2N-129
2 53b 2N-246 20 2N-3632 2N-247 20
2 54 2C5 20 29
2CC-7 2070 2CC-8
2CC-54 2CC-55
255 2DW-60 30 2DW-59 2 30 2-58a 2RC-b 36 20-R1 20 6
2RC-6 20 2RC-49 2RC-50 2RC-51
2 58b 2FDW-107 20 2FDW-108 20 20 2FDW-122 2FDW-123 2FDW-124
269 21--3 10 2CF-7 20 40 2CF-4 2CF-19 20
2PR-24 2
2PR-7 20 2PR-8
2PR-23 2PR-59 2PR-68
2 61 2PR-25 20 40
2PR-9 20 2PR-10 2PR-60
Total Maximum Path Leakage 19431
Page 3 of 6
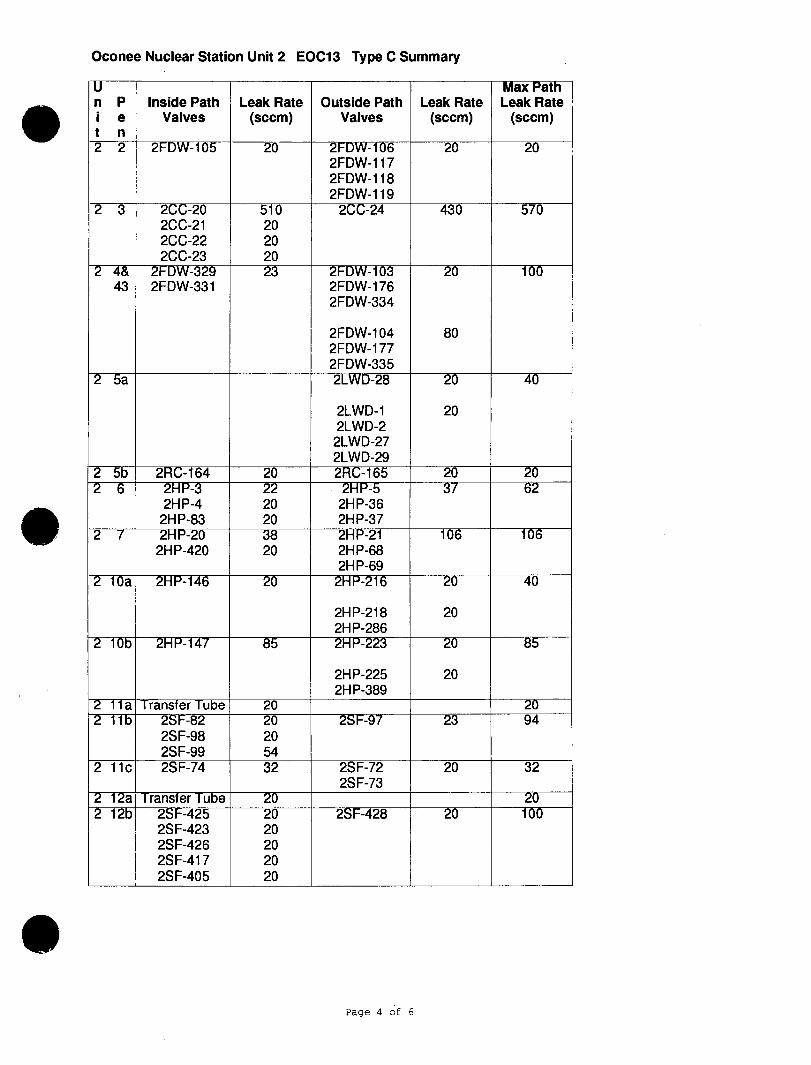
Oconee Nuclear Station Unit 2 EOC13 Type C Summary
U Max Path n P Inside Path Leak Rate Outside Path Leak Rate Leak Rate i e Valves (sccm) Valves (sccm) (scom)
2 2 2FDW-105 20 2FDW-106 20 2 2FDW-1 17 2FDW-1 18 2FDW-1 19
2 3 2CC-20 510 2CC-24 430 570 2CC-21 20 2CC-22 20 2CC-23 20
2 4& 2FDW-329 23 2FDW-103 20 100 43 2FDW-331 2FDW-176
2FDW-334
2FDW-104 80 2FDW-177 2FDW-335
2 2LWD-28
2LWD-1 20 2LWD-2 2LWD-27 2LWD-29
2-5b 2RC-164 20 2RC-165 20 2 6 2HP-3 22 2HP-5 37 82
2HP-4 20 2HP-36 2HP-83 20 2HP-37
27- 2HP-20 38 2HP-21 106 106 2HP-420 20 2HP-68
2H P-69 2 10a 2HP-146 20 2HP-216 20 40
2HP-218 20 2HP-286
2 10b 2HP-147 85 2HP-223 20 85
2HP-225 20 ___________2H P-389
2 11a Transfer Iube 20 20 2 b 2SF-82 2 2SF-97 23
2SF-98 20 2SF-99 54
2 11c 2SF-74 32 2SF-72 20 32 2SF-73
2 12a Transter Tube 20 20 2 F1 2SF-425 20 2SF-428 2
2SF-423 20 2SF-426 20 2SF-417 20 2SF-405 20
Page 4 of 6
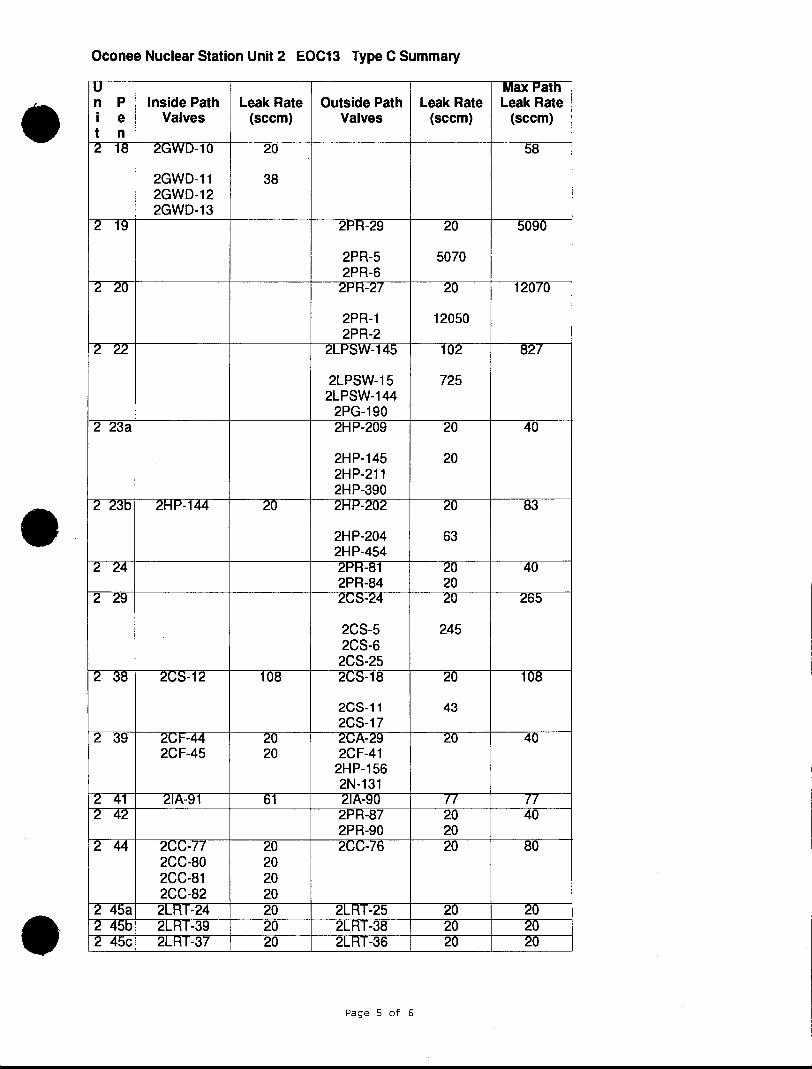
Oconee Nuclear Station Unit 2 EOC13 Type C Summary
U Max Path n P Inside Path Leak Rate Outside Path Leak Rate Leak Rate i e Valves (sccm) Valves (sccm) (sccm)
2 18 2GWD-10 20 58
2GWD-1 1 38 2GWD-12 2GWD-13
2 19 2PR-29 20 5090
2PR-5 5070 2PR-6
2PR-27 2 120/0
2PR-1 12050 2PR-2
2 22 2LPSW-145 102 827
2LPSW-15 725 2LPSW-144
2PG-190 2 23a 2HP-209 20 40
2HP-145 20 2HP-211 2HP-390
2 23b 2HP-144 20 2HP-202 20
2HP-204 63 2HP-454
2 24 2PR-81 20 40 2PR-84 20 ---- _2_6_5 _
2 9 2CS-24 20 265
2CS-5 245 2CS-6
2CS-25 2 38 2S-12 108 2CS-18 2 08
2CS-11 43 2CS-17
-2-3 2CF-44 20 2CA-29 20 40 2CF-45 20 2CF-41
2HP-156 2N-131
2 41 21A-91 6 21A-90 /7/ 77 2 42 2PR-87 20 40
2PR-90 20 2 44 20077 20 2C-76 20 80
2CC-80 20 2CC-81 20 2CC-82 20
2 45a 2LRT-24 20 2LRI-25 20 20 .4I5b 2RI-39 20 2LHR-38 . 20 ---- 202 45cr 2LR-37 20 2LRT-36 20 20
Page 5 of 6
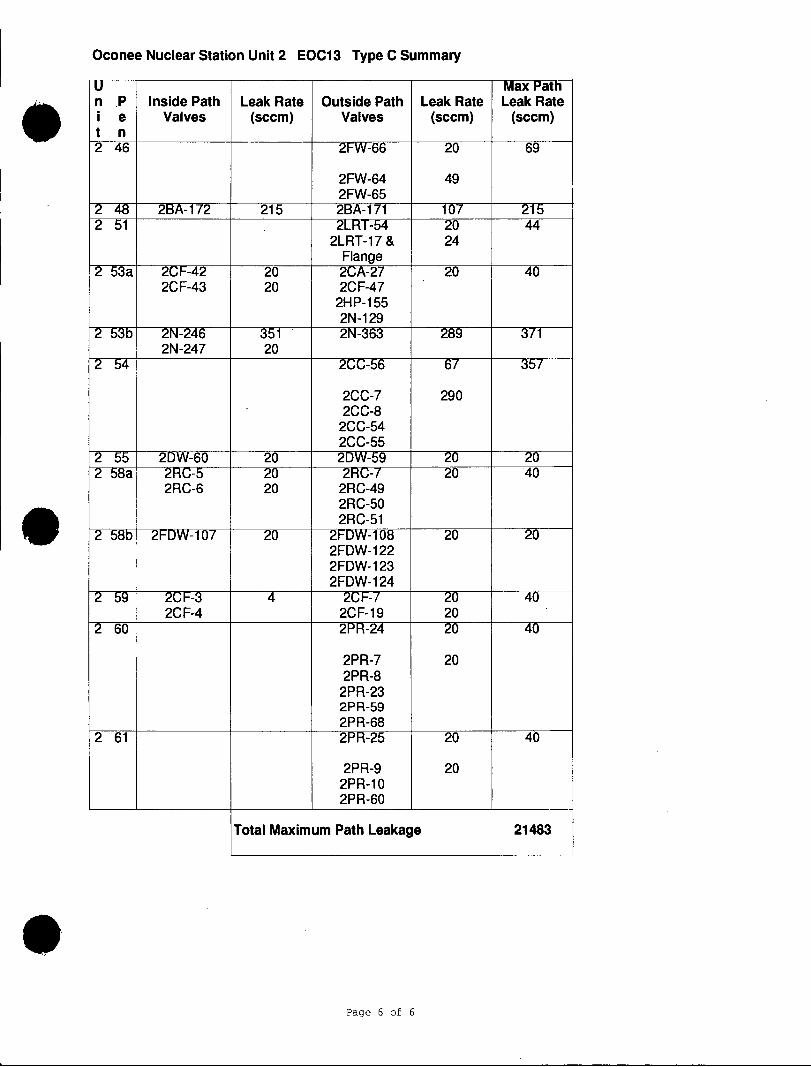
Oconee Nuclear Station Unit 2 EOC13 Type C Summary
U Max Path n P Inside Path Leak Rate Outside Path Leak Rate Leak Rate ie Valves (sccm) Valves (sccm) (sccm) t n 2 46 2FW-66 20 69
2FW-64 49 2FW-65
2 48 2BA-172 215 2BA- 171 107 215 2- 5 2LRT-54 20 44
2LRT-17 & 24 Flange
23a 2CF-42 20 2CA-27 20 40 2CF-43 20 2CF-47
2HP-155 2N-129
23b 2N-246 351 2N-363 2 2N-247 20
2CC-7 290 2CC-8
2CC-54 2CC-55
255 2DW-60 20 2DW-5920 20
2 58a 2RC-5 20 20 40 2RC-6 20 2RC-49
2RC-50 2RC-51
2 58b 2FDW-107 20 2FDW-108 20 20 2FDW-122 2FDW-123 2FDW-124
259 2C1- 4 20F-7 2 40 2CF-4 2CF-19 20
2 60 2PR-24 20 40
2PR-7 20 2PR-8 2PR-23 2PR-59 2PR-68
2 61 2PR-25 20 40
2PR-9 20 2PR-10 2PR-60
Total Maximum Path Leakage 21483
Page 6 of 6
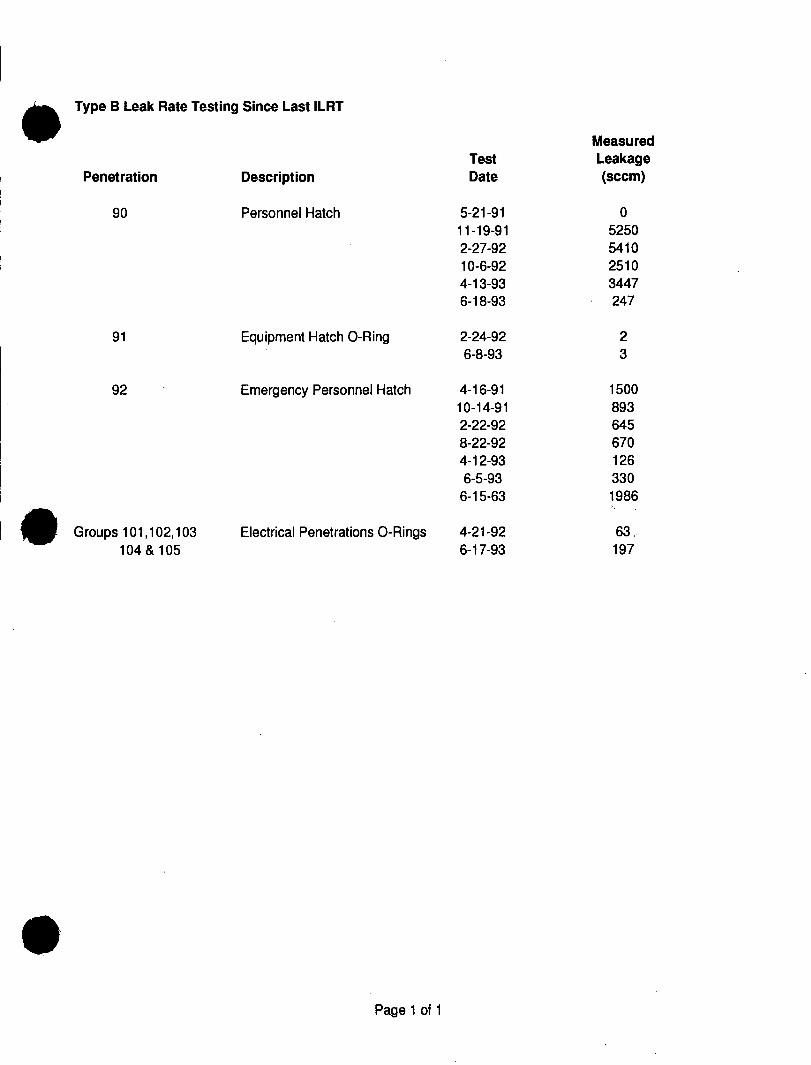
Type B Leak Rate Testing Since Last ILRT
Measured Test Leakage
Penetration Description Date (sccm)
90 Personnel Hatch 5-21-91 0 11-19-91 5250 2-27-92 5410 10-6-92 2510 4-13-93 3447 6-18-93 247
91 Equipment Hatch O-Ring 2-24-92 2 6-8-93 3
92 Emergency Personnel Hatch 4-16-91 1500 10-14-91 893 2-22-92 645 8-22-92 670 4-12-93 126 6-5-93 330
6-15-63 1986
Groups 101,102,103 Electrical Penetrations O-Rings 4-21-92 63 104 & 105 6-17-93 197
Page 1 of 1
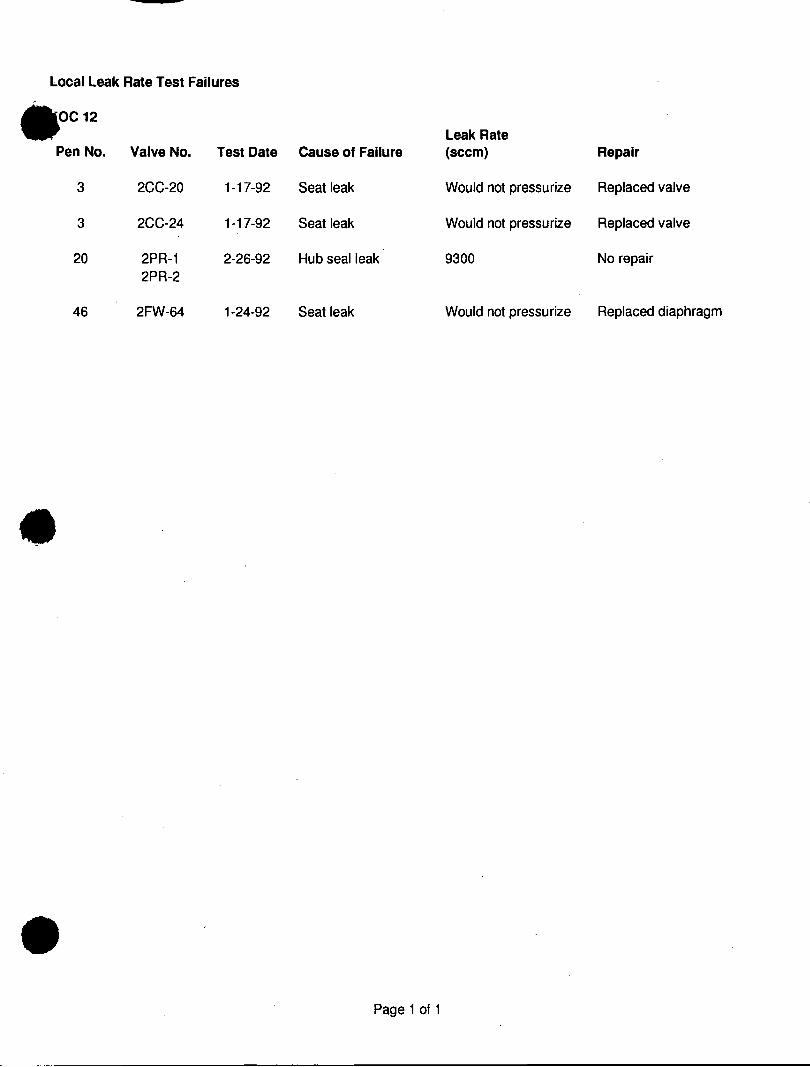
Local Leak Rate Test Failures
OC 12 W 1Leak Rate
Pen No. Valve No. Test Date Cause of Failure (sccm) Repair
3 2CC-20 1-17-92 Seat leak Would not pressurize Replaced valve
3 2CC-24 1-17-92 Seat leak Would not pressurize Replaced valve
20 2PR-1 2-26-92 Hub seal leak 9300 No repair 2PR-2
46 2FW-64 1-24-92 Seat leak Would not pressurize Replaced diaphragm
Page 1 of 1
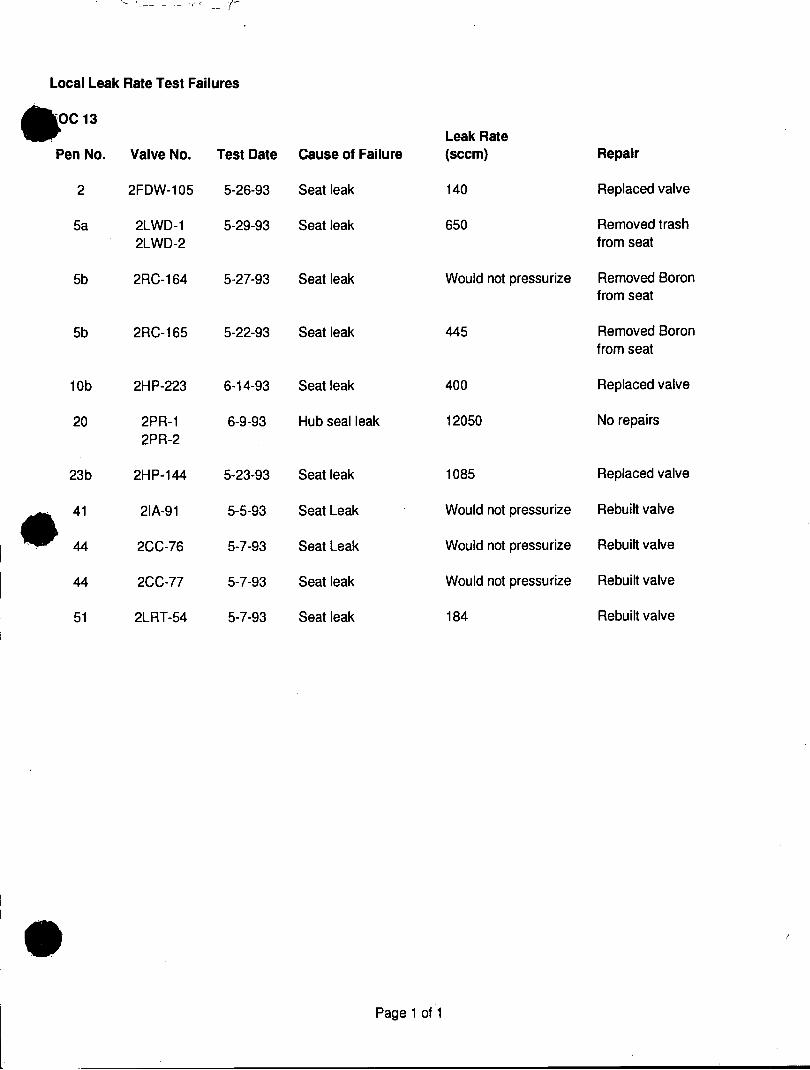
Local Leak Rate Test Failures
* OC 13 Leak Rate Pen No. Valve No. Test Date Cause of Failure (sccm) Repair
2 2FDW-105 5-26-93 Seat leak 140 Replaced valve
5a 2LWD-1 5-29-93 Seat leak 650 Removed trash 2LWD-2 from seat
5b 2RC-164 5-27-93 Seat leak Would not pressurize Removed Boron from seat
5b 2RC-165 5-22-93 Seat leak 445 Removed Boron from seat
10b 2HP-223 6-14-93 Seat leak 400 Replaced valve
20 2PR-1 6-9-93 Hub seal leak 12050 No repairs 2PR-2
23b 2HP-144 5-23-93 Seat leak 1085 Replaced valve
. 41 21A-91 5-5-93 Seat Leak Would not pressurize Rebuilt valve
44 2CC-76 5-7-93 Seat Leak Would not pressurize Rebuilt valve
44 2CC-77 5-7-93 Seat leak Would not pressurize Rebuilt valve
51 2LRT-54 5-7-93 Seat leak 184 Rebuilt valve
Page 1 of 1
Related Documents