Academic Outcomes of Home Schooling Review of Research and Analysis of Statewide Tests December 2014

Welcome message from author
This document is posted to help you gain knowledge. Please leave a comment to let me know what you think about it! Share it to your friends and learn new things together.
Transcript
Academic Outcomes of Home Schooling
Review of Research and Analysis of Statewide Tests
December 2014
© 2014 Copyright Board of Studies, Teaching and Educational Standards for and on behalf of the Crown in right of the State of New South Wales. This document contains Material prepared by the Board of Studies, Teaching and Educational Standards for and on behalf of the Crown in right of the State of New South Wales. The Material is protected by Crown copyright. All rights reserved. No part of the Material may be reproduced in Australia or in any other country by any process, electronic or otherwise, in any material form, or transmitted to any other person or stored electronically in any form without the prior written permission of the Board of Studies, Teaching and Educational Standards, except as permitted by the Copyright Act 1968. When you access the Material you agree: • to use the Material for information purposes only • to reproduce a single copy for personal bona fide study use only and not to
reproduce any major extract or the entire Material without the prior permission of the Board of Studies, Teaching and Educational Standards
• to acknowledge that the Material is provided by the Board of Studies, Teaching and Educational Standards • to include this copyright notice in any copy made • not to modify the Material or any part of the Material without the express prior written permission of the Board of Studies, Teaching and Educational Standards. The Material may contain third-party copyright materials such as photos, diagrams, quotations, cartoons and artworks. These materials are protected by Australian and international copyright laws and may not be reproduced or transmitted in any format without the copyright owner’s specific permission. Unauthorised reproduction, transmission or commercial use of such copyright materials may result in prosecution. The Board of Studies, Teaching and Educational Standards has made all reasonable attempts to locate owners of third-party copyright material and invites anyone from whom permission has not been sought to contact the Copyright Officer. Phone (02) 9367 8289 Fax on (02) 9279 1482. Email: [email protected] Published by Board of Studies, Teaching and Educational Standards GPO Box 5300 Sydney NSW 2001 Australia www.bostes.nsw.edu.au DSSP-26865
Academic Outcomes of Home Schooling
Table of Contents
Executive Summary ............................................................................................................................. 1
1 Introduction .................................................................................................................................... 2
2 Literature Review ........................................................................................................................... 2
2.1 Overview ................................................................................................................................. 2
2.2 Context and Limitations of the Research on Home Schooling ............................................... 2
2.3 Academic Outcomes of Home Schooled Students ................................................................. 3
3 NAPLAN Results – Home Schooled Students .............................................................................. 3
4 NAPLAN Results – Previously Home Schooled Students ............................................................ 5
5 School Certificate Test Results – Previously Home Schooled Students ....................................... 8
6 Higher School Certificate English Results – Previously Home Schooled Students ...................... 8
7 Demographic Characteristics ......................................................................................................... 9
7.1 Gender ..................................................................................................................................... 9
7.2 Socio-Economic Status (SES) ................................................................................................. 9
8 Conclusion ..................................................................................................................................... 9
Appendix 1: Tables ............................................................................................................................ 11

Academic Outcomes of Home Schooling
1
Executive Summary
Under the Education Act 1990 home schooling is education delivered in a child’s home by a parent
or guardian. Registration with the Board of Studies, Teaching and Educational Standards NSW
(BOSTES) is a legal requirement for home schooling while a child is of compulsory school age and
not enrolled in a school.
This report examines available evidence on the academic outcomes of children who have been
home schooled. This evidence includes a literature review of previous studies and analysis of results
in statewide assessments such as the National Assessment Program Literacy and Numeracy
(NAPLAN) tests, School Certificate and Higher School Certificate.
There is a paucity of research evidence on the academic outcomes of home schooled students. The
major reviews of the research literature note major shortcomings, including the lack of quantitative
studies and the self-selection of participants. These reviews have tentatively concluded that home
educated children have achieved at a level at least equivalent to the average achievement of students
who attend school.
The research reported in this paper shares similar shortcomings. The only achievement data
available for currently home schooled students is that arising from students who voluntarily
undertake the NAPLAN tests. Only a small minority of home schooled students (about 10%)
choose to undertake the tests, and thus any results must be treated with extreme caution. The results
indicate that this group of students scored significantly above the overall NSW average in nearly
every test. The differences were largest in Reading, Grammar & Punctuation and Numeracy, where
home schooled students’ average scores were typically about 70 marks (or about one standard
deviation) higher than the NSW average. The differences were smaller in Spelling (about 40 marks)
and Writing (about 20 marks).
The other groups for whom data was available were students who had been previously home
schooled and had subsequently attended school and participated in statewide tests. While these
groups were larger than the small group of current home schooled students in NAPLAN, they still
suffer from sampling issues, as it is impossible to know to what extent they represent home
schooled students as a whole. In addition, all of these students had some part (in some cases the
great part) of their education delivered at school rather than at home.
In relation to NAPLAN tests, the analysis showed that students who were previously home
schooled scored significantly higher in the Reading and Grammar & Punctuation tests, generally by
about 20-25 marks (or about one-third of a standard deviation) in Reading, and 15-25 marks in
Grammar & Punctuation. In Writing, Spelling and Numeracy, the home schooled student averages
are generally not statistically significantly different from the overall NSW average. These results
were consistent, regardless of the Year Levels being tested, and whether students have been
registered for home schooling for shorter or longer periods.
In the School Certificate tests (English, Mathematics and Science) the average results of students
who had been previously home schooled were similar to the state averages for all students,
particularly for those who had been home schooled for two years or less. For those who had been
home schooled for more than two years, average scores were slightly higher than the state average.
In HSC 2 Unit English (Advanced and Standard), there were no statistically significant differences
between the average results of students who had been previously home schooled and the average
results for the whole HSC cohort,. Averages for the two groups generally differed by less than two
marks, regardless of the length of time that students had been previously home schooled.
In summary, the research reported in this paper provides no strong evidence to indicate that home
schooling is associated with substantially different academic outcomes. The shortcomings in the
research, in particular the very limited representation of home schooled students in the samples,
prevent any firm conclusions being drawn.

Academic Outcomes of Home Schooling
2
Academic Outcomes of Home Schooling
1 Introduction
Under the Education Act 1990 home schooling is education delivered in a child’s home by a parent
or guardian.
Home schooling allows a parent or guardian to integrate the NSW curriculum with the learning
processes that occur naturally in the home throughout a child's development.
Parents or guardians who are home schooling a child are responsible for developing and
implementing their child's educational program and assessing their child's program. Registration
with the Board of Studies, Teaching and Educational Standards NSW (BOSTES) is a legal
requirement for home schooling while a child is of compulsory school age and not enrolled in a
school.
This report examines available evidence on the academic outcomes of children who have been
home schooled. This evidence includes a literature review of previous studies and analysis of results
in statewide assessments such as the National Assessment Program Literacy and Numeracy
(NAPLAN) tests, School Certificate and Higher School Certificate.
2 Literature Review
2.1 Overview
Two major summary reports into the outcomes of home schooling have been published, one looking
at the international literature and the second looking at Australian research.
Home Schooling: A Comprehensive Survey of the Research, by Robert Kunzman and Milton
Gaither, is a major research endeavour that addresses and evaluates the significant international
literature published in this area up to 2013. Most of this literature is based on the USA, where the
number of home schooled children was around 1.5 million in 2007 and is estimated to have grown
substantially since then. The authors also examine the body of English language research in Europe
and elsewhere. The numbers of studies in countries outside the USA understandably reflect the
smaller numbers of home schooled students in those countries.
The much smaller body of Australian research is outlined in Summary of Australian Research on
Home Education (2014) by Glenda Jackson. Other reports by Jackson include Fundamental
Elements in Examining a Child’s Right to Education: a Study of Home Education Research and
Regulation in Australia (2010) and her 2009 unpublished doctoral thesis, ‘More than One Way to
Learn’: Home Educated Students’ Transitions Between Home and School’.
2.2 Context and Limitations of the Research on Home Schooling
Kunzman and Gaither’s work identifies some significant caveats and contextual factors, as
identified below, that need to be borne in mind when examining studies in this area:
Home schooling participants in studies are often self-selected.
Reliable demographic information about home schooled students is largely unavailable, and
random sampling has proven impossible to obtain. Different countries, and different states
within countries, have varying rules and arrangements regarding home schooling, therefore
comparisons become difficult.
For the most part, home schooling research is qualitative and anecdotal. Interviews may be
the sole source of data collection.
Academic Outcomes of Home Schooling
3
Research in some cases appears to be politically motivated. Kunzman and Gaither report
that in the USA a large number of studies have been performed under the auspices of the
prominent home schooling advocacy organisation, the Home School Legal Defense
Association (HSLDA).
There are many aspects to home schooling or home education, and an enormous variety of
delivery methods, motivations and beliefs among families who choose to educate their
children at home. Individual studies, while valid, may concentrate on a single narrow focus,
and there may be little other material to consolidate the findings.
2.3 Academic Outcomes of Home Schooled Students
Kunzman and Gaither are critical of the body of data about USA home schooler academic
achievement. Although from 1990 to 2010 five large scale studies of academic achievement were
conducted, this research was done under the auspices of the home schooling advocacy organisation,
HSDLA. Kunzman and Gaither consider that the research methodology was extremely dubious.
This casts doubt on the results: that in every case home schooled students consistently scored in the
80th
percentile or above on nearly every measure when compared against the national average.
However, Kunzman and Gaither state that some tentative conclusions about academic achievement
of home schooled students can be drawn based on persistently corroborating evidence over two
decades. These findings are:
Home schooling does not have much of an effect at all once family background variables are
controlled for.
Parental background matters very much in home schooler academic achievement.
Home schooling tends to result in above-average verbal capacities but below-average maths
capacities.
Jackson’s Summary of Australian Research on Home Education (2014) states that “while there are
no specific major studies on the academic success of home educated students, a couple of small
studies show and most other research indicates that Australian home educated children have
achieved an equal or higher than average result to their formally educated peers”.
Her earlier (2010) article Fundamental Elements in Examining a Child’s Right to Education: a
Study of Home Education Research and Regulation in Australia amplifies this information in
relation to academic achievements in a broader sense. She reports that home schooled students are
entering tertiary institutions with ease.
She also notes that home schooled students who do have problems academically usually have
identifiable learning difficulties.
3 NAPLAN Results – Home Schooled Students
Home schooled students are eligible to sit for the National Assessment Program Literacy and
Numeracy (NAPLAN) tests conducted annually for Years 3, 5, 7 and 9. Participation in the tests is
voluntary, with a fee of about $40 and the tests are administered by parents using the NAPLAN
administration protocols. In the six-year period from 2008 (when NAPLAN commenced) until 2013,
a total of about 500 home schooled students in NSW have undertaken the tests, representing about
10% of home schooled students in the relevant age groups over that period.
NAPLAN results are reported using five national achievement scales, one for each of the NAPLAN
assessment domains of reading, writing, spelling, grammar and punctuation, and numeracy. Student
raw scores on tests are converted to a NAPLAN ‘scale score’ so that those scores can be located on
the national scale for each domain. The NAPLAN reporting scales are constructed so that any given
Academic Outcomes of Home Schooling
4
scale score represents the same level of achievement over time. For example, a score of 700 in
reading in one year represents the same level of achievement in other testing years.
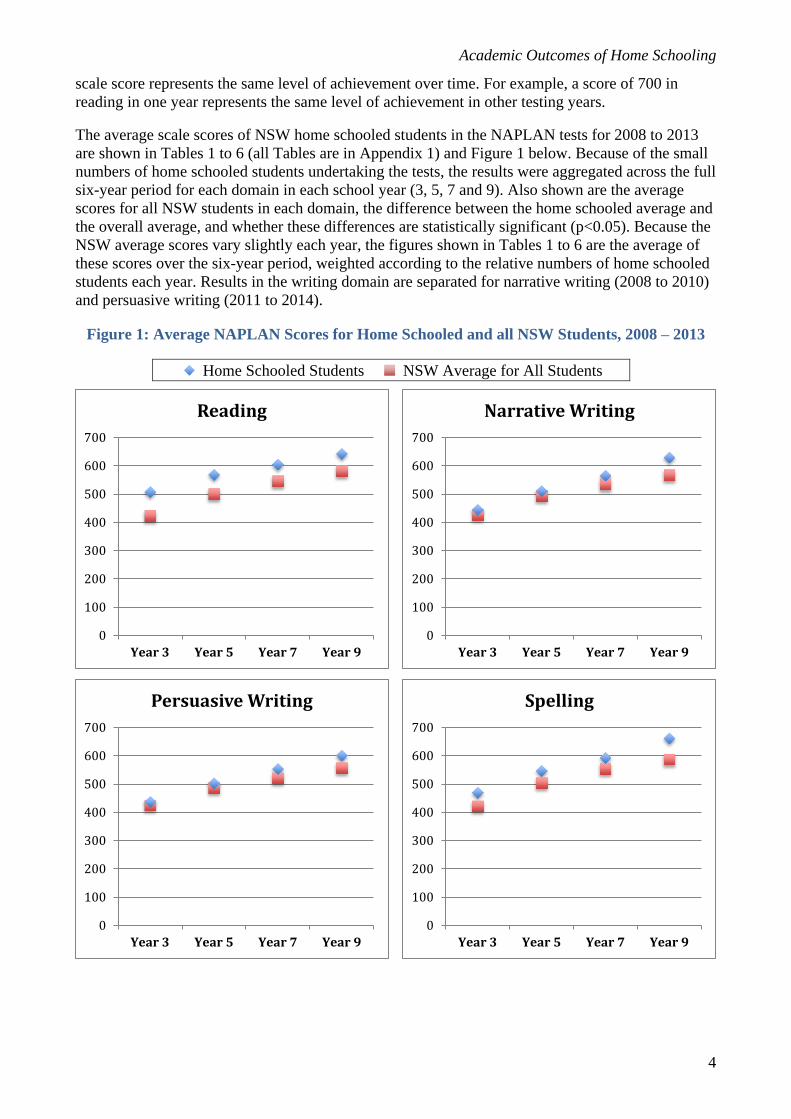
The average scale scores of NSW home schooled students in the NAPLAN tests for 2008 to 2013
are shown in Tables 1 to 6 (all Tables are in Appendix 1) and Figure 1 below. Because of the small
numbers of home schooled students undertaking the tests, the results were aggregated across the full
six-year period for each domain in each school year (3, 5, 7 and 9). Also shown are the average
scores for all NSW students in each domain, the difference between the home schooled average and
the overall average, and whether these differences are statistically significant (p<0.05). Because the
NSW average scores vary slightly each year, the figures shown in Tables 1 to 6 are the average of
these scores over the six-year period, weighted according to the relative numbers of home schooled
students each year. Results in the writing domain are separated for narrative writing (2008 to 2010)
and persuasive writing (2011 to 2014).
Figure 1: Average NAPLAN Scores for Home Schooled and all NSW Students, 2008 – 2013
Home Schooled Students NSW Average for All Students
0
100
200
300
400
500
600
700
Year 3 Year 5 Year 7 Year 9
Reading
0
100
200
300
400
500
600
700
Year 3 Year 5 Year 7 Year 9
Narrative Writing
0
100
200
300
400
500
600
700
Year 3 Year 5 Year 7 Year 9
Persuasive Writing
0
100
200
300
400
500
600
700
Year 3 Year 5 Year 7 Year 9
Spelling
Academic Outcomes of Home Schooling
5
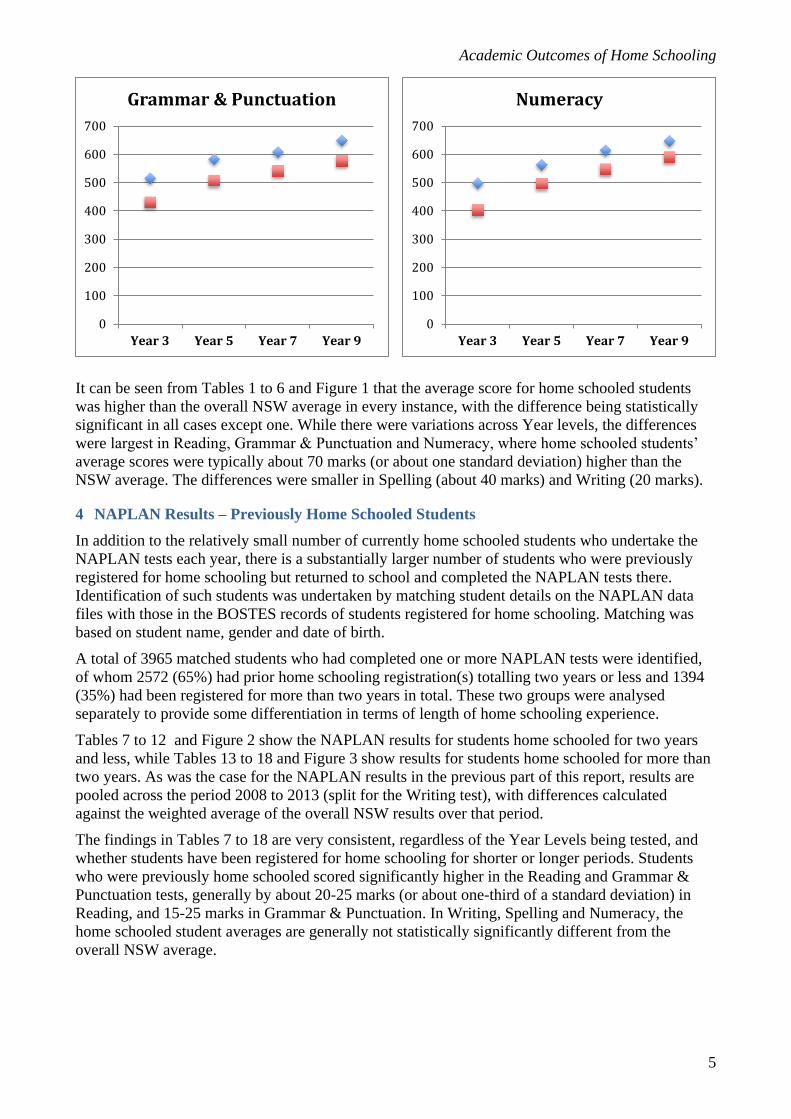
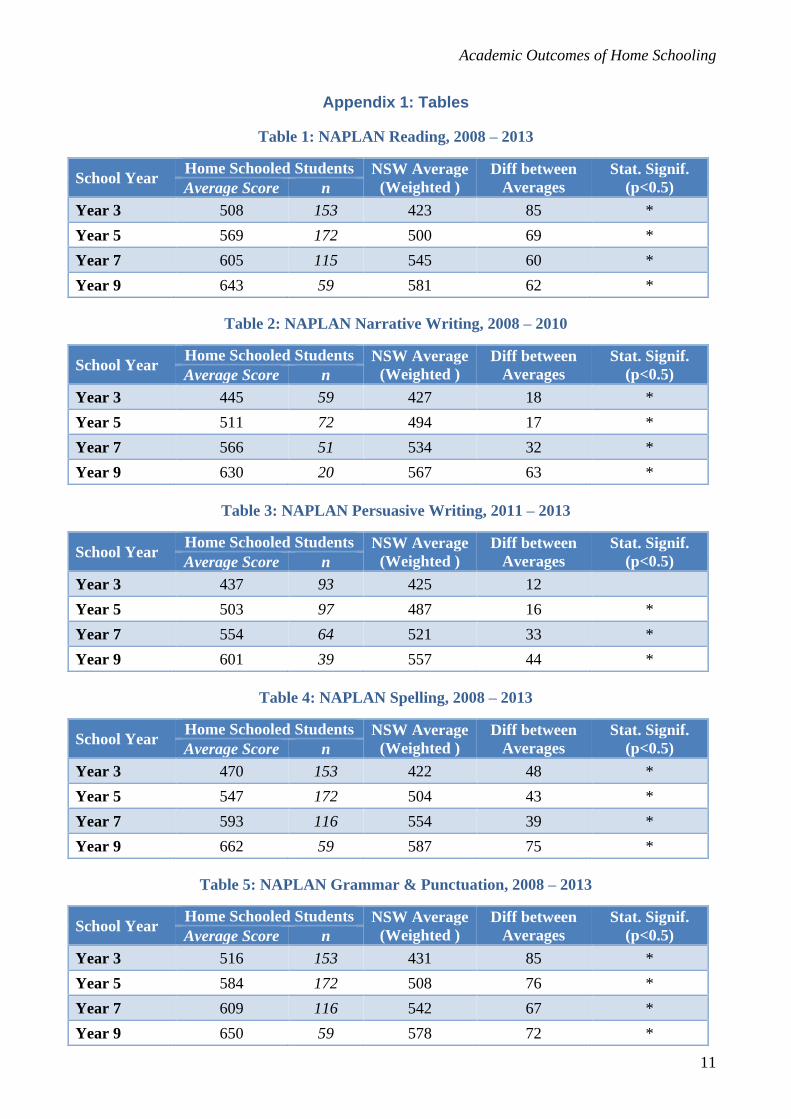
It can be seen from Tables 1 to 6 and Figure 1 that the average score for home schooled students
was higher than the overall NSW average in every instance, with the difference being statistically
significant in all cases except one. While there were variations across Year levels, the differences
were largest in Reading, Grammar & Punctuation and Numeracy, where home schooled students’
average scores were typically about 70 marks (or about one standard deviation) higher than the
NSW average. The differences were smaller in Spelling (about 40 marks) and Writing (20 marks).
4 NAPLAN Results – Previously Home Schooled Students
In addition to the relatively small number of currently home schooled students who undertake the
NAPLAN tests each year, there is a substantially larger number of students who were previously
registered for home schooling but returned to school and completed the NAPLAN tests there.
Identification of such students was undertaken by matching student details on the NAPLAN data
files with those in the BOSTES records of students registered for home schooling. Matching was
based on student name, gender and date of birth.
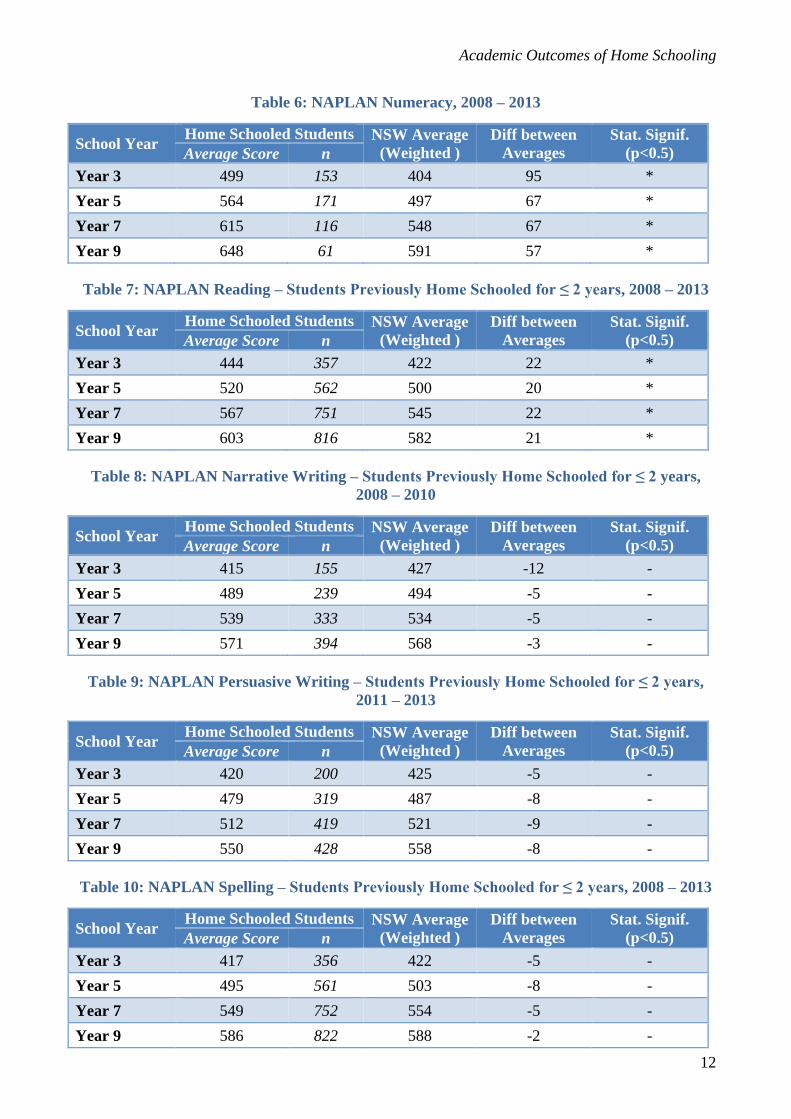
A total of 3965 matched students who had completed one or more NAPLAN tests were identified,
of whom 2572 (65%) had prior home schooling registration(s) totalling two years or less and 1394
(35%) had been registered for more than two years in total. These two groups were analysed
separately to provide some differentiation in terms of length of home schooling experience.
Tables 7 to 12 and Figure 2 show the NAPLAN results for students home schooled for two years
and less, while Tables 13 to 18 and Figure 3 show results for students home schooled for more than
two years. As was the case for the NAPLAN results in the previous part of this report, results are
pooled across the period 2008 to 2013 (split for the Writing test), with differences calculated
against the weighted average of the overall NSW results over that period.
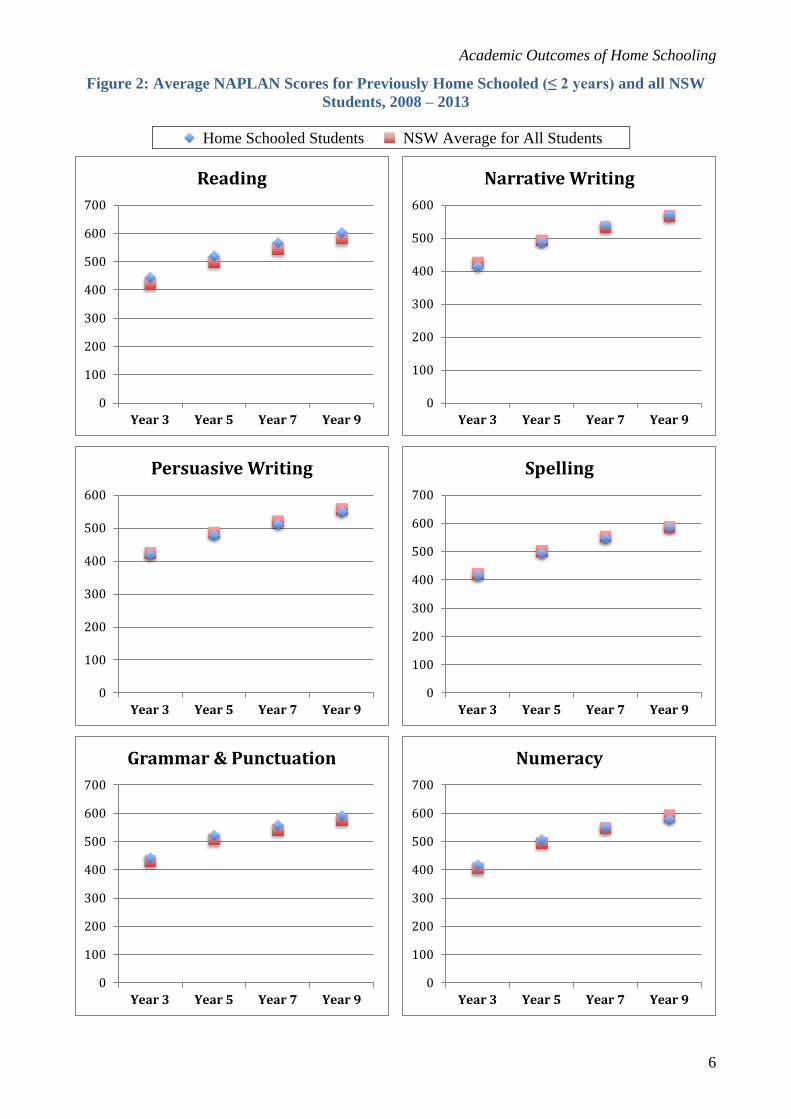
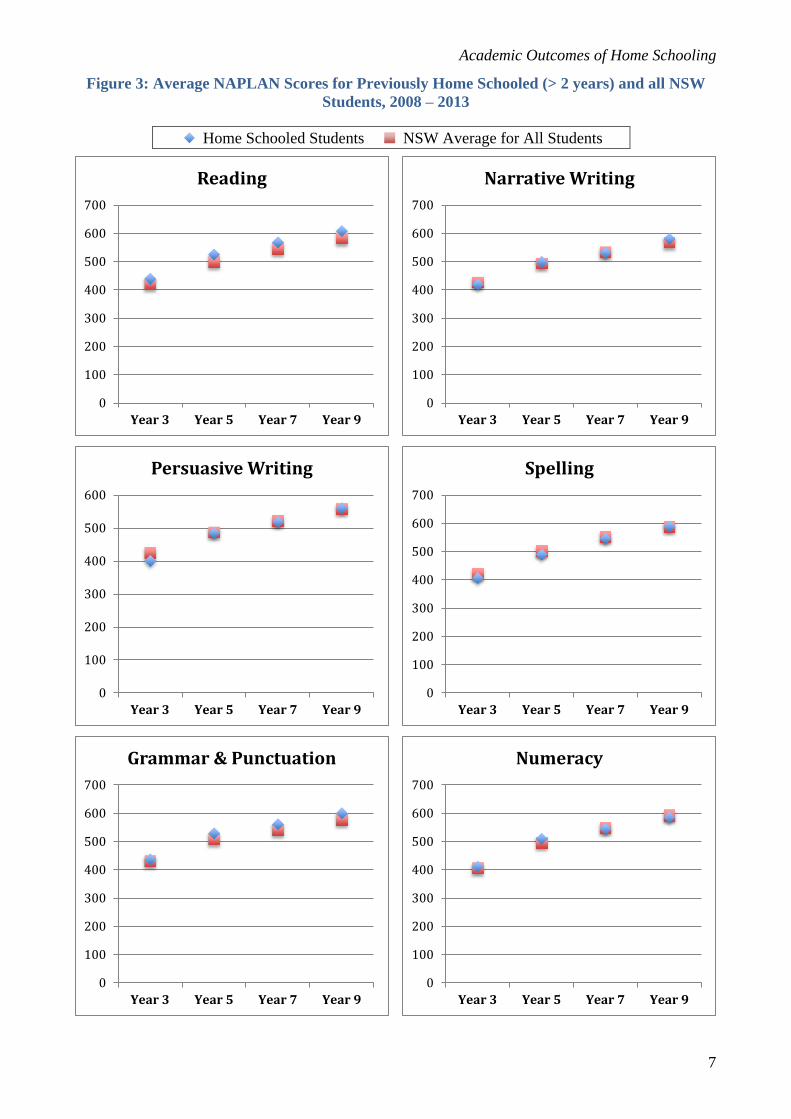
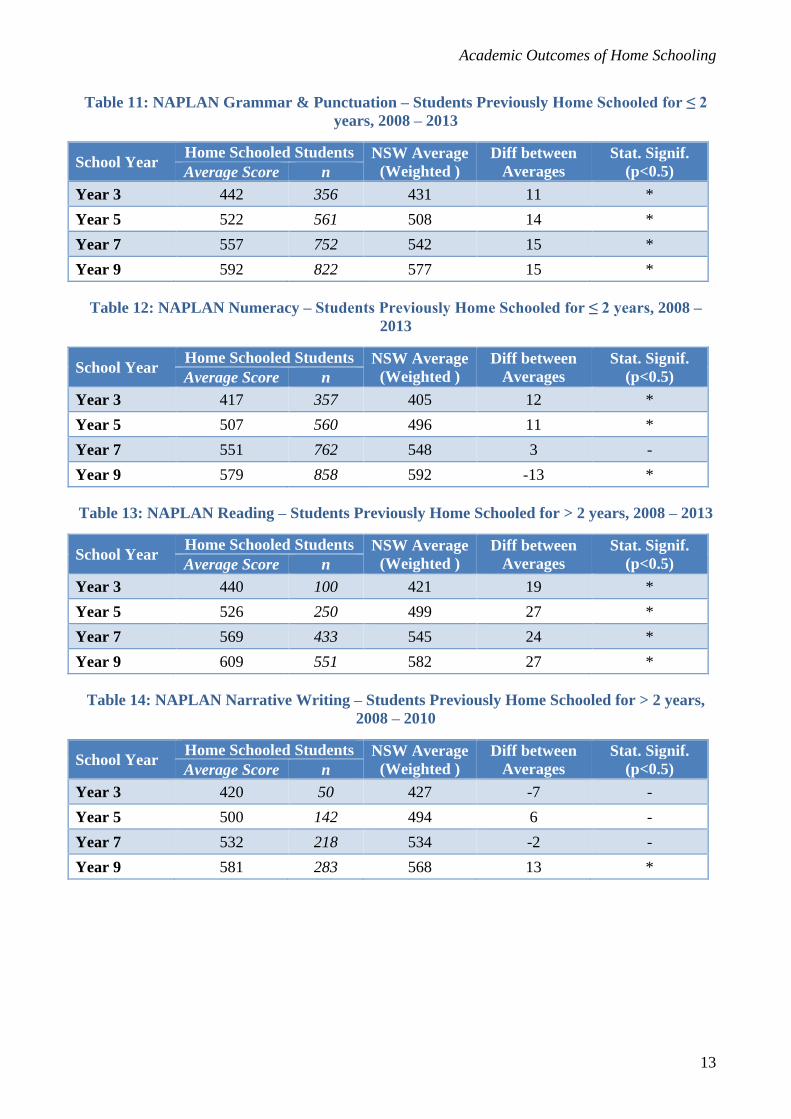
The findings in Tables 7 to 18 are very consistent, regardless of the Year Levels being tested, and
whether students have been registered for home schooling for shorter or longer periods. Students
who were previously home schooled scored significantly higher in the Reading and Grammar &
Punctuation tests, generally by about 20-25 marks (or about one-third of a standard deviation) in
Reading, and 15-25 marks in Grammar & Punctuation. In Writing, Spelling and Numeracy, the
home schooled student averages are generally not statistically significantly different from the
overall NSW average.
0
100
200
300
400
500
600
700
Year 3 Year 5 Year 7 Year 9
Grammar & Punctuation
0
100
200
300
400
500
600
700
Year 3 Year 5 Year 7 Year 9
Numeracy
Academic Outcomes of Home Schooling
6
Figure 2: Average NAPLAN Scores for Previously Home Schooled (≤ 2 years) and all NSW
Students, 2008 – 2013
Home Schooled Students NSW Average for All Students
0
100
200
300
400
500
600
700
Year 3 Year 5 Year 7 Year 9
Reading
0
100
200
300
400
500
600
Year 3 Year 5 Year 7 Year 9
Narrative Writing
0
100
200
300
400
500
600
Year 3 Year 5 Year 7 Year 9
Persuasive Writing
0
100
200
300
400
500
600
700
Year 3 Year 5 Year 7 Year 9
Spelling
0
100
200
300
400
500
600
700
Year 3 Year 5 Year 7 Year 9
Grammar & Punctuation
0
100
200
300
400
500
600
700
Year 3 Year 5 Year 7 Year 9
Numeracy
Academic Outcomes of Home Schooling
7
Figure 3: Average NAPLAN Scores for Previously Home Schooled (> 2 years) and all NSW
Students, 2008 – 2013
Home Schooled Students NSW Average for All Students
0
100
200
300
400
500
600
700
Year 3 Year 5 Year 7 Year 9
Reading
0
100
200
300
400
500
600
700
Year 3 Year 5 Year 7 Year 9
Narrative Writing
0
100
200
300
400
500
600
Year 3 Year 5 Year 7 Year 9
Persuasive Writing
0
100
200
300
400
500
600
700
Year 3 Year 5 Year 7 Year 9
Spelling
0
100
200
300
400
500
600
700
Year 3 Year 5 Year 7 Year 9
Grammar & Punctuation
0
100
200
300
400
500
600
700
Year 3 Year 5 Year 7 Year 9
Numeracy
Academic Outcomes of Home Schooling
8
5 School Certificate Test Results – Previously Home Schooled Students
The NSW School Certificate was a credential awarded to eligible students after four years of
secondary schooling (Years 7–10). The School Certificate required students to undertake mandatory
statewide tests of foundation knowledge and skills at the end of Year 10. The tests were each of two
hours duration with students receiving a standards-aligned mark out of 100 for each test.
Nearly all NSW secondary school students undertook the School Certificate, with nearly 85,000
students undertaking the tests in 2011, the last year in which the School Certificate was offered. The
School Certificate and the associated tests were only available to students attending school, not to
home schooled students.
Data matching (on name, gender and date of birth) was used to identify students who undertook the
School Certificate tests and had been previously registered for home schooling. These students were
further subdivided into those with total home schooling registration of two years or less, and those
with more than two years registration. The results of these students were compared to those for the
entire cohort in the English-literacy, Mathematics and Science tests for the last five years of the
School Certificate (2007 – 2011). The results are shown in Tables 19 to 24.
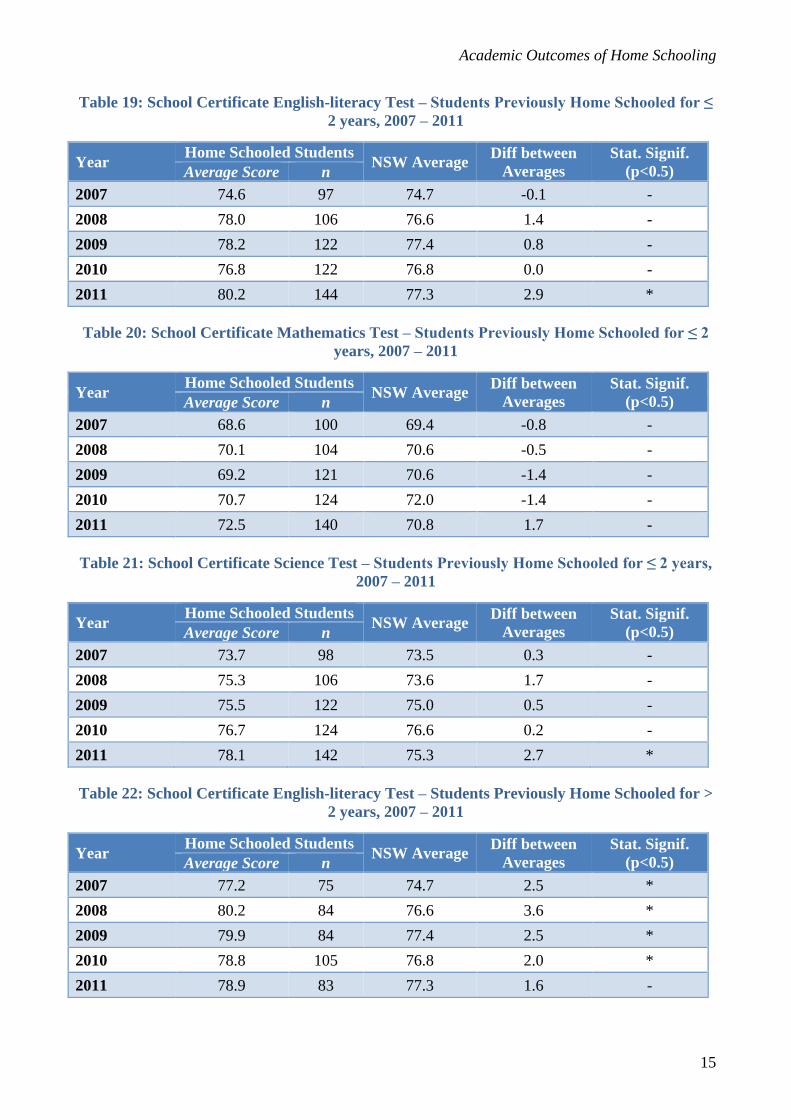
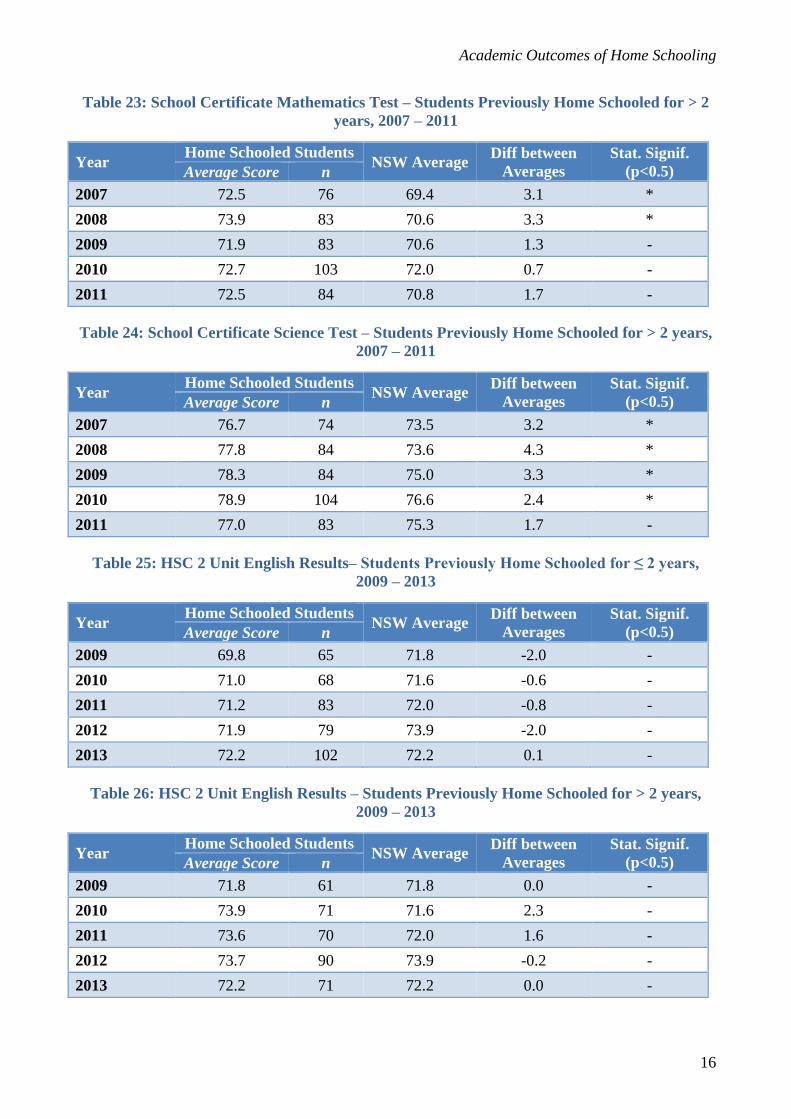
It can be seen from Tables 19 to 24 that the pattern of results was very consistent from year to year.
For students who had been home schooled for two years or less, average scores were generally
within one or two marks of the State average, and differences were not statistically significant. The
exception was in 2011, where previously-home schooled students’ average scores were statistically
significantly higher then the NSW average for English and Science, although the differences were
less than 3 marks.
Differences were generally larger for students who had been home schooled for more than two
years, with the average marks for these students being significantly higher than the NSW average
on the majority of occasions. While these differences were statistically significant, their magnitude
was fairly small, being generally about 3 marks.
6 Higher School Certificate English Results – Previously Home Schooled Students
To qualify for the NSW Higher School Certificate (HSC), students must satisfactorily complete a
pattern of study that includes at least two units of a Board Developed Course in English. The great
majority of students complete the 2 Unit English (Advanced) or English (Standard) courses. Results
in these two courses are reported on a common standards-aligned scale as marks out of 100,
comprised in equal part of moderated school assessment and statewide examination results.
Data matching (on name, gender and date of birth) was used to identify students who completed
HSC English (Advanced) or English (Standard) and had been previously registered for home
schooling. These students were further subdivided into those with total home schooling registration
of two years or less, and those with more than two years registration. The results of these students
were compared to those for the entire HSC cohort in English (Advanced) and English (Standard) for
the last five years (2009 – 2013). The results are shown in Tables 25 and 26.
It can be seen from Tables 25 and 26 that the pattern of results was very consistent from year to
year. There were no statistically significant differences between the average results of students who
had been previously home schooled and the average results for the whole HSC cohort. Averages for
the two groups generally differed by less than two marks, regardless of the length of time that
students had been previously home schooled.
Academic Outcomes of Home Schooling
9
7 Demographic Characteristics
7.1 Gender
Table 27 shows the percentages of male and female home schooled and previously home schooled
students who undertook NAPLAN tests in the period 2008 – 2013, and provides comparative
information on the gender composition of all home schooled students, and of all students
undertaking NAPLAN. It can be seen from Table 27 that about 46% of home schooled and
previously home schooled students undertaking NAPLAN were female, very similar to the overall
percentage of female home schooled students (46%) and slightly below the percentage of females in
the overall NAPLAN test cohort (49%).
Table 28 shows the percentages of male and female previously home schooled students who
undertook School Certificate tests in 2007 – 2011, and comparative information for the entire
School certificate test candidature over the same period. Table 28 also shows similar information
relating to HSC English (Advanced and Standard) over the period 2009 – 2013. It can be seen from
Table 28 that the gender composition of previously home schooled students closely matched the
composition for the overall candidature in both the School Certificate tests (49% female) and HSC
English (53% female).
7.2 Socio-Economic Status (SES)
Where possible, the addresses of home schooled students were geocoded to enable matching with
relevant Australian Bureau of Statistics (ABS) local area statistics. The socio-economic status of the
localities in which home schooled students reside was estimated using the ABS Statistical Area
Level 1 (SA1) Index of Relative Socio-economic Advantage and Disadvantage, 2011. This measure
provides a SES measure and percentile rank for each of the approximately 50,000 SA1 locations in
Australia. These percentiles were converted into four quartiles, each encompassing 25% of the
population.
Data on SES is reported below, separated for the four groups of students analysed in this study:
Home schooled students – NAPLAN
Previously home schooled students – NAPLAN
Previously home schooled students – School Certificate tests
Previously home schooled students – HSC English 2 Unit
For the School Certificate and HSC, comparative information is provided for the entire candidature
(this information is not available for NAPLAN students).
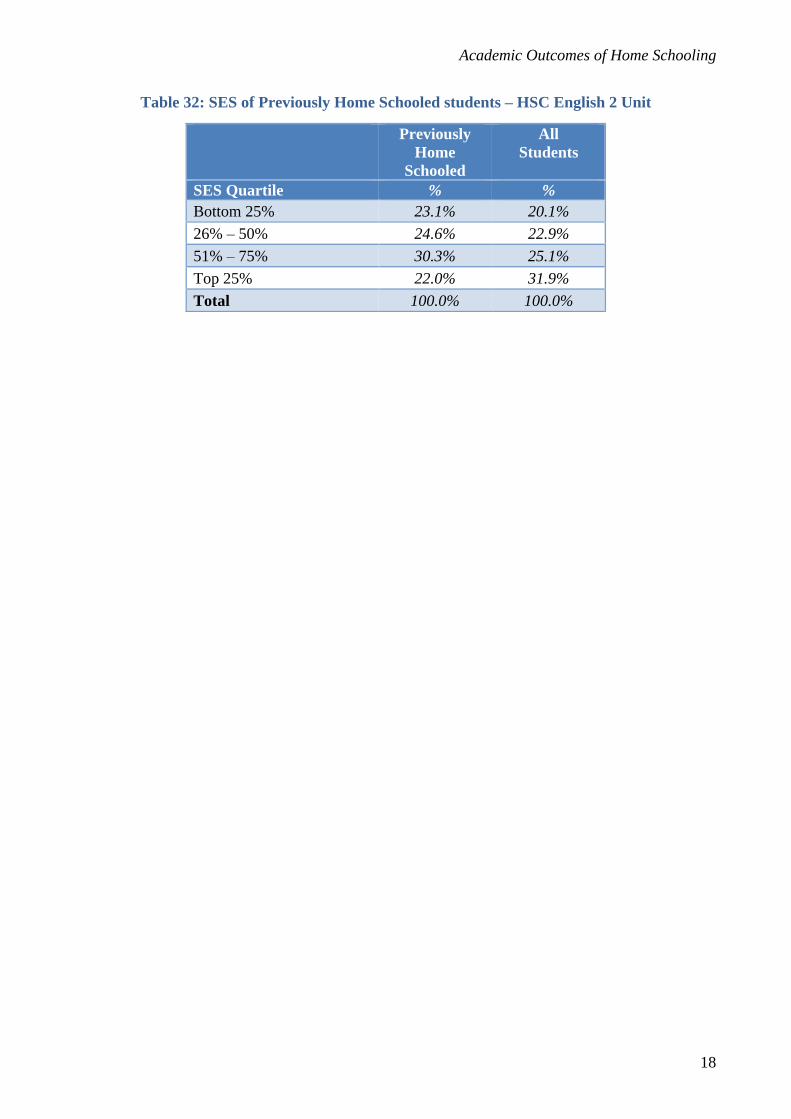
It can be seen from Tables 29 to 32 that the socio-economic status of students was spread fairly
evenly across the four quartiles, but that in each case, the smallest proportion was in the high-SES
group (top 25%). This was the case even in the HSC English group, where the total student
population is skewed towards higher SES (32% in top quartile).
8 Conclusion
There is a paucity of research evidence on the academic outcomes of home schooled students. The
major reviews of the research literature note major shortcomings, including the lack of quantitative
studies and the self-selection of participants. These reviews have tentatively concluded that home
educated children have achieved at a level at least equivalent to the average achievement of students
who attend school.
The research reported in this paper shares similar shortcomings. The only achievement data
available for currently home schooled students is that arising from students who voluntarily

Academic Outcomes of Home Schooling
10
undertake the NAPLAN tests. Only a small minority of home schooled students (about 10%)
choose to undertake the tests, and thus any results must be treated with extreme caution. The results
indicate that this group of students scored significantly above the overall NSW average in nearly
every test. The differences were largest in Reading, Grammar & Punctuation and Numeracy, where
home schooled students’ average scores were typically about 70 marks (or about one standard
deviation) higher than the NSW average. The differences were smaller in Spelling (about 40 marks)
and Writing (about 20 marks).
The other groups for whom data was available were students who had been previously home
schooled and had subsequently attended school and participated in statewide tests (NAPLAN,
School Certificate and HSC). While these groups were larger than the small group of current home
schooled students in NAPLAN, they still suffer from sampling issues, as it is impossible to know to
what extent they represent home schooled students as a whole. In addition, all of these students had
some part (in some cases the great part) of their education delivered at school rather than at home.
In relation to NAPLAN tests, the analysis showed that students who were previously home
schooled scored significantly higher in the Reading and Grammar & Punctuation tests, generally by
about 20-25 marks (or about one-third of a standard deviation) in Reading, and 15-25 marks in
Grammar & Punctuation. In Writing, Spelling and Numeracy, the home schooled student averages
are generally not statistically significantly different from the overall NSW average. These results
were consistent, regardless of the Year Levels being tested, and whether students have been
registered for home schooling for shorter or longer periods.
In the School Certificate tests (English, Mathematics and Science) the average results of students
who had been previously home schooled were similar to the state averages for all students,
particularly for those who had been home schooled for two years or less. For those who had been
home schooled for more than two years, average scores were slightly higher than the state average.
In HSC 2 Unit English (Advanced and Standard), there were no statistically significant differences
between the average results of students who had been previously home schooled and the average
results for the whole HSC cohort,. Averages for the two groups generally differed by less than two
marks, regardless of the length of time that students had been previously home schooled.
In summary, the research reported in this paper provides no strong evidence to indicate that home
schooling is associated with substantially different academic outcomes. The shortcomings in the
research, in particular the very limited representation of home schooled students in the samples,
prevent any firm conclusions being drawn.
Academic Outcomes of Home Schooling
11
Appendix 1: Tables
Table 1: NAPLAN Reading, 2008 – 2013
School Year Home Schooled Students NSW Average
(Weighted )
Diff between
Averages
Stat. Signif.
(p<0.5) Average Score n
Year 3 508 153 423 85 *
Year 5 569 172 500 69 *
Year 7 605 115 545 60 *
Year 9 643 59 581 62 *
Table 2: NAPLAN Narrative Writing, 2008 – 2010
School Year Home Schooled Students NSW Average
(Weighted )
Diff between
Averages
Stat. Signif.
(p<0.5) Average Score n
Year 3 445 59 427 18 *
Year 5 511 72 494 17 *
Year 7 566 51 534 32 *
Year 9 630 20 567 63 *
Table 3: NAPLAN Persuasive Writing, 2011 – 2013
School Year Home Schooled Students NSW Average
(Weighted )
Diff between
Averages
Stat. Signif.
(p<0.5) Average Score n
Year 3 437 93 425 12
Year 5 503 97 487 16 *
Year 7 554 64 521 33 *
Year 9 601 39 557 44 *
Table 4: NAPLAN Spelling, 2008 – 2013
School Year Home Schooled Students NSW Average
(Weighted )
Diff between
Averages
Stat. Signif.
(p<0.5) Average Score n
Year 3 470 153 422 48 *
Year 5 547 172 504 43 *
Year 7 593 116 554 39 *
Year 9 662 59 587 75 *
Table 5: NAPLAN Grammar & Punctuation, 2008 – 2013
School Year Home Schooled Students NSW Average
(Weighted )
Diff between
Averages
Stat. Signif.
(p<0.5) Average Score n
Year 3 516 153 431 85 *
Year 5 584 172 508 76 *
Year 7 609 116 542 67 *
Year 9 650 59 578 72 *
Academic Outcomes of Home Schooling
12
Table 6: NAPLAN Numeracy, 2008 – 2013
School Year Home Schooled Students NSW Average
(Weighted )
Diff between
Averages
Stat. Signif.
(p<0.5) Average Score n
Year 3 499 153 404 95 *
Year 5 564 171 497 67 *
Year 7 615 116 548 67 *
Year 9 648 61 591 57 *
Table 7: NAPLAN Reading – Students Previously Home Schooled for ≤ 2 years, 2008 – 2013
School Year Home Schooled Students NSW Average
(Weighted )
Diff between
Averages
Stat. Signif.
(p<0.5) Average Score n
Year 3 444 357 422 22 *
Year 5 520 562 500 20 *
Year 7 567 751 545 22 *
Year 9 603 816 582 21 *
Table 8: NAPLAN Narrative Writing – Students Previously Home Schooled for ≤ 2 years,
2008 – 2010
School Year Home Schooled Students NSW Average
(Weighted )
Diff between
Averages
Stat. Signif.
(p<0.5) Average Score n
Year 3 415 155 427 -12 -
Year 5 489 239 494 -5 -
Year 7 539 333 534 -5 -
Year 9 571 394 568 -3 -
Table 9: NAPLAN Persuasive Writing – Students Previously Home Schooled for ≤ 2 years,
2011 – 2013
School Year Home Schooled Students NSW Average
(Weighted )
Diff between
Averages
Stat. Signif.
(p<0.5) Average Score n
Year 3 420 200 425 -5 -
Year 5 479 319 487 -8 -
Year 7 512 419 521 -9 -
Year 9 550 428 558 -8 -
Table 10: NAPLAN Spelling – Students Previously Home Schooled for ≤ 2 years, 2008 – 2013
School Year Home Schooled Students NSW Average
(Weighted )
Diff between
Averages
Stat. Signif.
(p<0.5) Average Score n
Year 3 417 356 422 -5 -
Year 5 495 561 503 -8 -
Year 7 549 752 554 -5 -
Year 9 586 822 588 -2 -
Academic Outcomes of Home Schooling
13
Table 11: NAPLAN Grammar & Punctuation – Students Previously Home Schooled for ≤ 2
years, 2008 – 2013
School Year Home Schooled Students NSW Average
(Weighted )
Diff between
Averages
Stat. Signif.
(p<0.5) Average Score n
Year 3 442 356 431 11 *
Year 5 522 561 508 14 *
Year 7 557 752 542 15 *
Year 9 592 822 577 15 *
Table 12: NAPLAN Numeracy – Students Previously Home Schooled for ≤ 2 years, 2008 –
2013
School Year Home Schooled Students NSW Average
(Weighted )
Diff between
Averages
Stat. Signif.
(p<0.5) Average Score n
Year 3 417 357 405 12 *
Year 5 507 560 496 11 *
Year 7 551 762 548 3 -
Year 9 579 858 592 -13 *
Table 13: NAPLAN Reading – Students Previously Home Schooled for > 2 years, 2008 – 2013
School Year Home Schooled Students NSW Average
(Weighted )
Diff between
Averages
Stat. Signif.
(p<0.5) Average Score n
Year 3 440 100 421 19 *
Year 5 526 250 499 27 *
Year 7 569 433 545 24 *
Year 9 609 551 582 27 *
Table 14: NAPLAN Narrative Writing – Students Previously Home Schooled for > 2 years,
2008 – 2010
School Year Home Schooled Students NSW Average
(Weighted )
Diff between
Averages
Stat. Signif.
(p<0.5) Average Score n
Year 3 420 50 427 -7 -
Year 5 500 142 494 6 -
Year 7 532 218 534 -2 -
Year 9 581 283 568 13 *

Academic Outcomes of Home Schooling
14
Table 15: NAPLAN Persuasive Writing – Students Previously Home Schooled for > 2 years,
2011 – 2013
School Year Home Schooled Students NSW Average
(Weighted )
Diff between
Averages
Stat. Signif.
(p<0.5) Average Score n
Year 3 401 52 425 -24 -
Year 5 486 107 487 -1 -
Year 7 519 216 522 -3 -
Year 9 561 273 558 3 -
Table 16: NAPLAN Spelling – Students Previously Home Schooled for > 2 years, 2008 – 2013
School Year Home Schooled Students NSW Average
(Weighted )
Diff between
Averages
Stat. Signif.
(p<0.5) Average Score n
Year 3 407 102 422 -15 -
Year 5 490 251 503 -13 -
Year 7 547 432 553 -6 -
Year 9 590 557 588 2 -
Table 17: NAPLAN Grammar & Punctuation – Students Previously Home Schooled for > 2
years, 2008 – 2013
School Year Home Schooled Students NSW Average
(Weighted )
Diff between
Averages
Stat. Signif.
(p<0.5) Average Score n
Year 3 438 102 430 8 -
Year 5 530 251 508 22 *
Year 7 562 432 541 21 *
Year 9 601 557 577 24 *
Table 18: NAPLAN Numeracy – Students Previously Home Schooled for > 2 years, 2008 –
2013
School Year Home Schooled Students NSW Average
(Weighted )
Diff between
Averages
Stat. Signif.
(p<0.5) Average Score n
Year 3 412 102 405 7 -
Year 5 510 250 496 14 *
Year 7 545 447 548 -3 -
Year 9 586 569 592 -6 -
Academic Outcomes of Home Schooling
15
Table 19: School Certificate English-literacy Test – Students Previously Home Schooled for ≤
2 years, 2007 – 2011
Year Home Schooled Students
NSW Average Diff between
Averages
Stat. Signif.
(p<0.5) Average Score n
2007 74.6 97 74.7 -0.1 -
2008 78.0 106 76.6 1.4 -
2009 78.2 122 77.4 0.8 -
2010 76.8 122 76.8 0.0 -
2011 80.2 144 77.3 2.9 *
Table 20: School Certificate Mathematics Test – Students Previously Home Schooled for ≤ 2
years, 2007 – 2011
Year Home Schooled Students
NSW Average Diff between
Averages
Stat. Signif.
(p<0.5) Average Score n
2007 68.6 100 69.4 -0.8 -
2008 70.1 104 70.6 -0.5 -
2009 69.2 121 70.6 -1.4 -
2010 70.7 124 72.0 -1.4 -
2011 72.5 140 70.8 1.7 -
Table 21: School Certificate Science Test – Students Previously Home Schooled for ≤ 2 years,
2007 – 2011
Year Home Schooled Students
NSW Average Diff between
Averages
Stat. Signif.
(p<0.5) Average Score n
2007 73.7 98 73.5 0.3 -
2008 75.3 106 73.6 1.7 -
2009 75.5 122 75.0 0.5 -
2010 76.7 124 76.6 0.2 -
2011 78.1 142 75.3 2.7 *
Table 22: School Certificate English-literacy Test – Students Previously Home Schooled for >
2 years, 2007 – 2011
Year Home Schooled Students
NSW Average Diff between
Averages
Stat. Signif.
(p<0.5) Average Score n
2007 77.2 75 74.7 2.5 *
2008 80.2 84 76.6 3.6 *
2009 79.9 84 77.4 2.5 *
2010 78.8 105 76.8 2.0 *
2011 78.9 83 77.3 1.6 -
Academic Outcomes of Home Schooling
16
Table 23: School Certificate Mathematics Test – Students Previously Home Schooled for > 2
years, 2007 – 2011
Year Home Schooled Students
NSW Average Diff between
Averages
Stat. Signif.
(p<0.5) Average Score n
2007 72.5 76 69.4 3.1 *
2008 73.9 83 70.6 3.3 *
2009 71.9 83 70.6 1.3 -
2010 72.7 103 72.0 0.7 -
2011 72.5 84 70.8 1.7 -
Table 24: School Certificate Science Test – Students Previously Home Schooled for > 2 years,
2007 – 2011
Year Home Schooled Students
NSW Average Diff between
Averages
Stat. Signif.
(p<0.5) Average Score n
2007 76.7 74 73.5 3.2 *
2008 77.8 84 73.6 4.3 *
2009 78.3 84 75.0 3.3 *
2010 78.9 104 76.6 2.4 *
2011 77.0 83 75.3 1.7 -
Table 25: HSC 2 Unit English Results– Students Previously Home Schooled for ≤ 2 years,
2009 – 2013
Year Home Schooled Students
NSW Average Diff between
Averages
Stat. Signif.
(p<0.5) Average Score n
2009 69.8 65 71.8 -2.0 -
2010 71.0 68 71.6 -0.6 -
2011 71.2 83 72.0 -0.8 -
2012 71.9 79 73.9 -2.0 -
2013 72.2 102 72.2 0.1 -
Table 26: HSC 2 Unit English Results – Students Previously Home Schooled for > 2 years,
2009 – 2013
Year Home Schooled Students
NSW Average Diff between
Averages
Stat. Signif.
(p<0.5) Average Score n
2009 71.8 61 71.8 0.0 -
2010 73.9 71 71.6 2.3 -
2011 73.6 70 72.0 1.6 -
2012 73.7 90 73.9 -0.2 -
2013 72.2 71 72.2 0.0 -
Academic Outcomes of Home Schooling
17
Table 27: Gender Composition: NAPLAN, 2008 – 2013
Gender Homeschooled
- NAPLAN
Previous
Homeschooled
– NAPLAN
All Home
Schooled All NAPLAN
Female 45.9% 45.6% 46.4% 48.7%
Male 54.1% 54.4% 53.6% 51.3%
Table 28: Gender Composition: School Certificate Tests and HSC English
Gender
School Certificate Tests HSC English
Previous
Homeschooled All Students
Previous
Homeschooled All Students
Female 48.9% 49.2% 53.6%% 52.8%
Male 51.1% 50.8% 46.4% 47.2%
Table 29: SES of Home Schooled students - NAPLAN
SES Quartile %
Bottom 25% 24.1%
26% – 50% 23.7%
51% – 75% 31.7%
Top 25% 20.5%
Total 100.0%
Table 30: SES of Previously Home Schooled students - NAPLAN
SES Quartile %
Bottom 25% 25.0%
26% – 50% 29.5%
51% – 75% 24.1%
Top 25% 21.4%
Total 100.0%
Table 31: SES of Previously Home Schooled students – School Certificate Tests
Previously
Home
Schooled
All
Students
SES Quartile % %
Bottom 25% 26.4% 24.0%
26% – 50% 26.7% 24.5%
51% – 75% 27.7% 24.4%
Top 25% 19.2% 27.1%
Total 100.0% 100.0%
Academic Outcomes of Home Schooling
18
Table 32: SES of Previously Home Schooled students – HSC English 2 Unit
Previously
Home
Schooled
All
Students
SES Quartile % %
Bottom 25% 23.1% 20.1%
26% – 50% 24.6% 22.9%
51% – 75% 30.3% 25.1%
Top 25% 22.0% 31.9%
Total 100.0% 100.0%
Related Documents