I ' t f' Journal of Plankton Research Vo1.14 no.1 pp.137-156, 1992 Y3 Effect of El Niño Southern Oscillation events on the distribution and abundance of phytoplankton in the Western Pacific Tropical Ocean along 165"E Jean Blanchot, Martine Rodier and Aubert Le Bouteiller Groupe PROPPAC, Centre ORSTOM BP A5 " m e a Cedex, New Caledonia Abstract. The distribution of physical and chemical parameters and their impact on the biomass and abundance of phytoplankton in the Western Pacific Ocean were compared in two opposing situations: the El Niño Southern Oscillation (ENSO) event of 1987 and the non-ENS0 period of 1988. During El Niño conditions (September 1987), maximum cell abundance was recorded at 10"s at the boundary between the South Equatorial Current (SEC) and the South Equatorial Countercurrent (SECC). In September 1988, after the return of non-ENSO conditions, a well- established equatorial upwelling produced an increaseb the surface layer nutrient supply over 7" of latitude. This in turn caused an increase in phytoplankton populations in the upper layer, with chlorophyll concentrations >0.2 mg mb3 and cyanobacteria and microalgae populations X.0 X lo6 1-' and >1.2 X lo6 I-' respectively. Integrated over 120 m, the cyanobacteria and microalgae populations were respectively 4.7 and 3.2 times larger than the year before. On the other hand, transient nutrient inputs such as those observed at 10"s in September 1987 caused a large increase in cyanobacteria populations (4.4 times), compared with those in neighbouring zones, and a somewhat smaller increase in microalgae populations (1.3 times). Cyanobacteria populations were much larger than those of microalgae in the 80-100 m upper layer, whereas the latter were more numerous at that depth and below the chorophyll maximum. Population variations in cyanobacteria were accom- panied by changes in form, size and fluorescence of the cells. The analysis of the 52 profiles of depth distribution of cyanobacteria and microalgae shows how the communitv structure is related to the depth and gradient of the nitracline. L> .:Fot -taire Introduction The importance of small phytoplankton has only recently been recognized thanks to the introduction of indirect methods of measurement. In the tropical Pacific Ocean, Wauthy et al. (1967) determined that the Utermöhl inverted- microscope method (cell counts of phytoplankton >10 pm) accounted for only 5-15% of the phytoplankton biomass, whereas there was a good correlation between chlorophyll concentration and chloroplast counts under blue-violet light. They concluded that the bulk of the biomass was made up of ultraphytoplankton. In the 1 9 8 0 ~ ~ the use of new techniques such as epi- fluorescence microscopy allowed for the identification and enumeration of cyanobacteria in many temperate and tropical seas (Johnson and Sieburth, 1979; Waterbury et al. , 1979). Their presence was shown in the North Atlantic up to high latitudes (Murphy and Haugen, 1985). They were also identified in environments as diverse as marine and freshwater ecosystems (Stockner and Antia, 1986; Stockner, 1988). Meanwhile, many studies confirmed the importance of small phytoplankton (<5, <3, <2, <1 pm) in various oceans (Bienfang and Szyper, 1981; Bienfang and Takahashi, 1983; Herbland et al., 1985; Platt and Li, 1986; Chavez, 1989; Peiia et al., 1990). Researchers also calculated the contribution total primary production of picoplankton ( 4 pm) in @Oxford University Press 137 :4 JUL. 1992 y &b 356% tut &fl

Welcome message from author
This document is posted to help you gain knowledge. Please leave a comment to let me know what you think about it! Share it to your friends and learn new things together.
Transcript

I ' t f'
Journal of Plankton Research Vo1.14 no.1 pp.137-156, 1992 Y3 Effect of El Niño Southern Oscillation events on the distribution and abundance of phytoplankton in the Western Pacific Tropical Ocean along 165"E
Jean Blanchot, Martine Rodier and Aubert Le Bouteiller Groupe PROPPAC, Centre ORSTOM BP A5 " m e a Cedex, New Caledonia
Abstract. The distribution of physical and chemical parameters and their impact on the biomass and abundance of phytoplankton in the Western Pacific Ocean were compared in two opposing situations: the El Niño Southern Oscillation (ENSO) event of 1987 and the non-ENS0 period of 1988. During El Niño conditions (September 1987), maximum cell abundance was recorded at 10"s at the boundary between the South Equatorial Current (SEC) and the South Equatorial Countercurrent (SECC). In September 1988, after the return of non-ENSO conditions, a well- established equatorial upwelling produced an increaseb the surface layer nutrient supply over 7" of latitude. This in turn caused an increase in phytoplankton populations in the upper layer, with chlorophyll concentrations >0.2 mg mb3 and cyanobacteria and microalgae populations X . 0 X lo6 1-' and >1.2 X lo6 I-' respectively. Integrated over 120 m, the cyanobacteria and microalgae populations were respectively 4.7 and 3.2 times larger than the year before. On the other hand, transient nutrient inputs such as those observed at 10"s in September 1987 caused a large increase in cyanobacteria populations (4.4 times), compared with those in neighbouring zones, and a somewhat smaller increase in microalgae populations (1.3 times). Cyanobacteria populations were much larger than those of microalgae in the 80-100 m upper layer, whereas the latter were more numerous at that depth and below the chorophyll maximum. Population variations in cyanobacteria were accom- panied by changes in form, size and fluorescence of the cells. The analysis of the 52 profiles of depth distribution of cyanobacteria and microalgae shows how the communitv structure is related to the depth and gradient of the nitracline.
L> .:Fot -taire
Introduction
The importance of small phytoplankton has only recently been recognized thanks to the introduction of indirect methods of measurement. In the tropical Pacific Ocean, Wauthy et al. (1967) determined that the Utermöhl inverted- microscope method (cell counts of phytoplankton >10 pm) accounted for only 5-15% of the phytoplankton biomass, whereas there was a good correlation between chlorophyll concentration and chloroplast counts under blue-violet light. They concluded that the bulk of the biomass was made up of ultraphytoplankton. In the 1 9 8 0 ~ ~ the use of new techniques such as epi- fluorescence microscopy allowed for the identification and enumeration of cyanobacteria in many temperate and tropical seas (Johnson and Sieburth, 1979; Waterbury et al. , 1979). Their presence was shown in the North Atlantic up to high latitudes (Murphy and Haugen, 1985). They were also identified in environments as diverse as marine and freshwater ecosystems (Stockner and Antia, 1986; Stockner, 1988). Meanwhile, many studies confirmed the importance of small phytoplankton (<5, <3, <2, <1 pm) in various oceans (Bienfang and Szyper, 1981; Bienfang and Takahashi, 1983; Herbland et al., 1985; Platt and Li, 1986; Chavez, 1989; Peiia et al. , 1990). Researchers also calculated the contribution total primary production of picoplankton ( 4 pm) in
@Oxford University Press 137 :4 JUL. 1992 y &b 356% tut &fl

J.Blanchot, M.Rodier and A.Le Bouteiller
tropical waters, which was estimated at 20-80% in the Eastern Pacific (Li et al., 1983) and at 60% in the Western Atlantic (Platt et al. , 1983). In the Celtic Sea in summer, plankton (<5 pm) accounts for 70-80% of total primary production (Joint and Pomroy, 1983; Joint et al., 1986). Finally, in the Sargasso Sea, Synechococcus accounts for 7344% of primary production (Prézelin et al. , 1989).
In the Western Equatorial Pacific Ocean, climate changes affect the hydrological structure of the marine ecosystem and determine in particular the presence or absence of upwelling. Their influence on the structure of phytoplankton populations and primary production is important. The vertical distribution of cyanobactleria and microalgae between 20"s and 6"N in the Western Pacific Ocean was studied in two transects visited at a 12 month interval, the first in 1987, when El Niño conditions prevented any equatorial upwelling, and the second in 1988, after the return of normal upwelling conditions.
Temperature, salinity, nutrients and chlorophyll concentration data were compared in order to understand better the ecological significance of the vertical and horizontal distribution of phytoplankton. This is, to our knowledge, the first description of the influence of those events on the pico- and nanoplankton populations in this region.
Method
Two similar cruises were carried out on F W Coriolis in the western tropical Pacific (Figure l ) , in September 1987 (PROPPAC 1) and September 1988 (PROPPAC 3). The studies were conducted from south to north transects along 165"E, with stations at every degree from 20"s to 6"N. Twelve levels were sampled with 5 1 Niskin bottles on a rosette sampler coupled with a CTDO system.
Chemical analysis
Nutrient concentrations (nitrate, nitrite and phosphate) were determined upon collection with a Technicon AutoAnalyzer II using the methods described by Strickland and Parsons (1972). The detection limit for phosphate was 20 nM, with a good accuracy above 50 nM. Nitrate concentrations <2 pM were estimated using the method described by Oudot and Montel (1988) within f 50 nM. Briefly, this method is an improvement over the classical automated method using a Technicon AutoAnalyzer II and consists in lowering the dilution of samples with reagents and in amplifying the output signal of the colorimeter. Chlorophyll concentrations were recorded on collection with a Turner 112 fluorometer using the Herbland et al. (1985) method. In short, 100 ml samples were filtered through GFLF filters using <30 mm Hg vacuum and extracted with 95% methanol for a period of 15-90 min. ICalibration was made using Sigma pure chlorophyll a. Nuclepore polycarbonate filters (1 pm) were used for size fractionation, on duplicates.
138

Effect of EI N ~ o on the phytoplankton in the Pacific Ocean
165.E I
\ =a I -
Fig. 1. Location of sampling stations along 165"E.
Enumeration of cells
Samples for cell counts under the microscope were fixed by adding buffered formaldehyde (pH 8.2) 4 % during the PROPPAC 1 cruise but no preservative was used during the PROPPAC 3 cruise. This change was made in response to laboratory results confirming the ineffectiveness of fixation and to the suggestion by several authors that this process may destroy some of the material under study (Furuya and Marumo, 1983; Bloem and Bär-Gilissen, 1986; Booth, 1987). During both cruises, 50-100 ml of seawater were filtered through a 0.2 ym Nuclepore membrane, pre-dyed with Irgalan Black. Vacuum pressure never exceeded 125 mm Hg, as prescribed by Murphy and Haugen (1985). The vacuum was turned off before the filter completely dried to prevent destruction of the more delicate cells. Filters were frozen immediately at -20°C. Given the water-repelling properties of the Nuclepore filter, drying of the samples was not deemed necessary (Geider, 1987). Routine rough counts were performed on collection in order to determine the volume of seawater needed to obtain -20 cells field-'. All remaining cell counts were performed back at the laboratory,
139
Ø
J.Blanchot, M.Rodier and A.Le Bouteiller
within the following 2 months. To this end, filters were thawed and immediately placed between two drops of Sigma mounting medium. They were then placed under a Leitz Dialux 20 microscope equipped with a HBO 50 light source, a Ploemopak 2.4 fluorescence vertical illuminator, containing a BP 450-490 exciting filter, a RKP 510 beam-splitting mirror and a LP 515 suppression filter (filter block I.). A Zeiss 100/125 oil immersion objective was used. The orange fluorescence of the phycoerythrin-containing cyanobacteria could be distin- guished easily from the red fluorescence of the chlorophyll-fluorescing plankton. The chlorophyll-fluorescing plankton could actually incorporate some cyano- bacteria, but the bulk consists of eukaryotic microalgae: here, in a wider sense all red fluorescing cells are called microalgae. The cell-count methold was a variation of that used by Hobbie et al. (1977). For each sample, 200-800 cells were counted on 20-80 fields. The coefficient of variation never exceeded 8% (n = 3) for cell counts performed on the same filter and 12% (n = 3) for counts on different filters. When populations did not allow for the minimum of 200 cells
cases was equal to 22% (n = 3). The size of the cells was determined with an eyepiece micrometer; mensurations were checked with a micrometer slide.
Results
Environmental properties
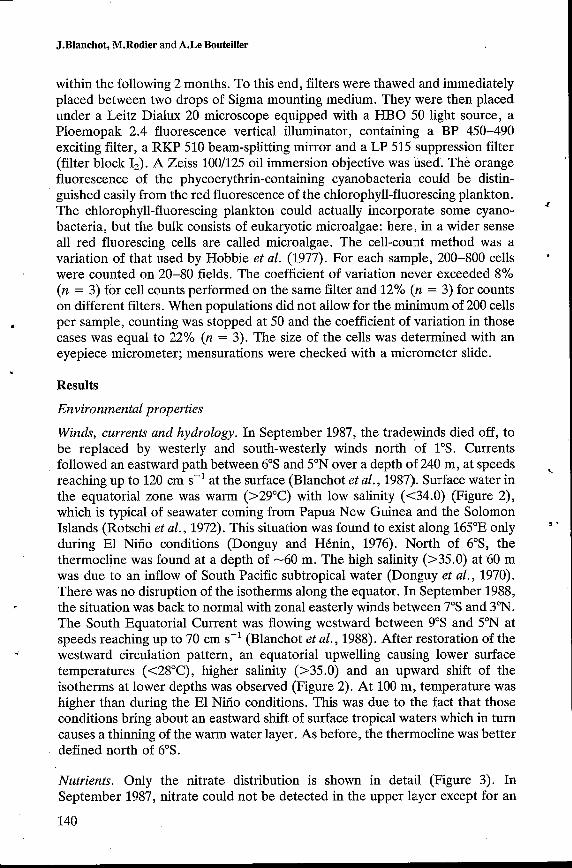
Winds, currents and hydrology. In September 1987, the tradewinds died off, to be replaced by westerly and south-westerly winds north of 1"s. Currents followed an eastward path between 6"s and 5"N over a depth of 240 m, at speeds reaching up to 120 cm s-' at the surface (Blanchot et al. , 1987) Surface water in the equatorial zone was warm (>29"C) with low salinity (C34.0) (Figure 2), which is typical of seawater coming from Papua New Guinea and the Solomon Islands (Rotschi et al., 1972). This situation was found to exist along 165"E only during El Niño conditions (Donguy and Hénin, 1976). North of 6"S, the thermocline was found at a depth of -60 m. The high salinity (>35.0)1 at 60 m was due to an inflow of South Pacific subtropical water (Donguy et al., 1970). There was no disruption of the isotherms along the equator. In September 1988, the situation was back to normal with zonal easterly winds between 7"s and 3"N. The South Equatorial Current was flowing westward between 9"s and 5"N at speeds reaching up to 70 cm s-l (Blanchot et al. , 1988). After restoration of the westward circulation pattern, an equatorial upwelling causing lower surface temperatures (<28"C), higher salinity (>35.0) and an upward shift of the isotherms at lower depths was observed (Figure 2). At 100 m, temperature was higher than during the El Niño conditions. This was due to the fact that those conditions bring about an eastward shift of surface tropical waters which in turn causes a thinning of the warm water layer. As before, the thermocline was better defined north of 6"s.
. per sample, counting was stopped at 50 and the coefficient of variation in those
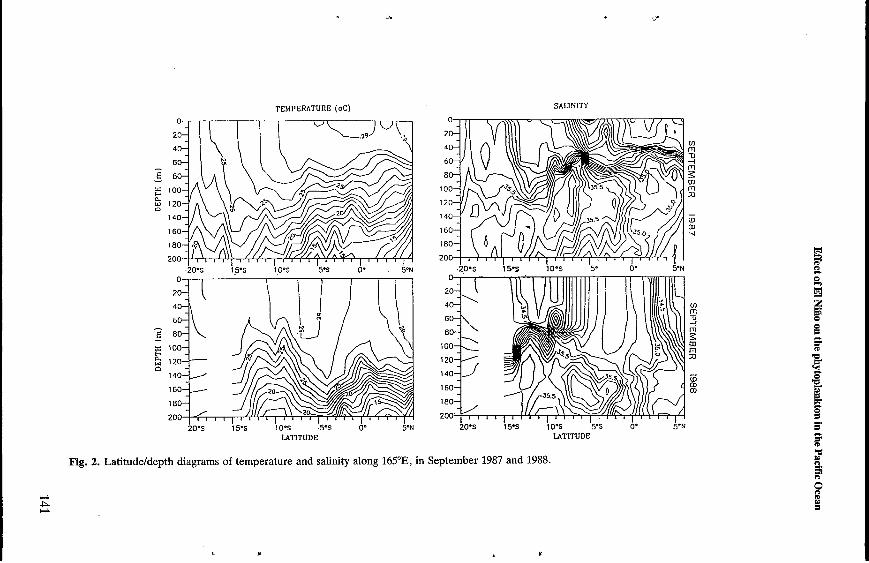
Nutrients. Only the nitrate distribution is shown in detail (Figure 3). In September 1987, nitrate could not be detected in the upper layer except for an
140
TEMPERATURE (OC)
ffl m D -I m E m m a - u)
W m
i0.s i 5 5 io-s 'ss 6. LATITUDE
Fig. 2. Latitudeldepth diagrams of temperature and salinity along 165"E, in September 1987 and 1988.
SACINITY
O a 2 m æ Y
õ
5' 2 w R
O P B
J.Blanchot, M.Rodier and A.Le Bouteiller
enrichment area between 10"s and SOS, at the boundary between the South Equatorial Current (SEC) and the South Equatorial Countercurrent (SECC). The maximum concentration in the surface layer was 0.6 pM at 10"s. The lack of nitrate at the surface 2 weeks later pointed to the transient character of this phenomenon. In that zone, winds affect the water column via the Eckman pumping effect and promote the vertical transfer of water (Delcroix and Hénin, 1989). The top of the nitracline defined by the 0.1 pM isoline was -90 m deep south of 11"s and -40 m deep north of that latitude. In September 1988, the
5"s and 2"N (2.1 pM at 1"s). An area of subsurface enrichment was also observed at the boundary between the SEC and the SECC. The upward shift of the isolines culminated at 11"s. This doming effect was described earlier by Oudot and Wauthy (1976) and Donguy and Hénin (1976).
The distribution of phosphate followed that of nitrate (data not shown). In September 1987, concentrations were low in the surface layer except for an enrichment area at 10"s. In September 1988, surface concentrations >0.2 pM marked the extent of the upwelling zone. During both cruises, a nitrite storage
equatorial upwelling caused nitrate to be present in the surface layer between i
NITRATE (pM)
2 o 0 1 , , I , " , ' , , ' , ' 1 , , ' , , ' , ' , 1 1 ea's IA., lo's 5 3 O" 5"
LATITUDE
Fig. 3. Latitudeldepth diagrams of nitrate along 165"E, in September 1987 and 1988.
142
Effect of El Niño on the phytoplankton in the Pacific Ocean
180-
200
zone was observed between 100 and 140 my with concentrations sometimes reaching 0.8 pM (nitrite pockets, data not shown). In 1988, the upwelling induced an upward shift of the 0.2 pM isolines up to the surface.
V
I , , , , , , , , , , , 1 , , , , , , , , , 1 ,
Meridian distribution of phytoplankton
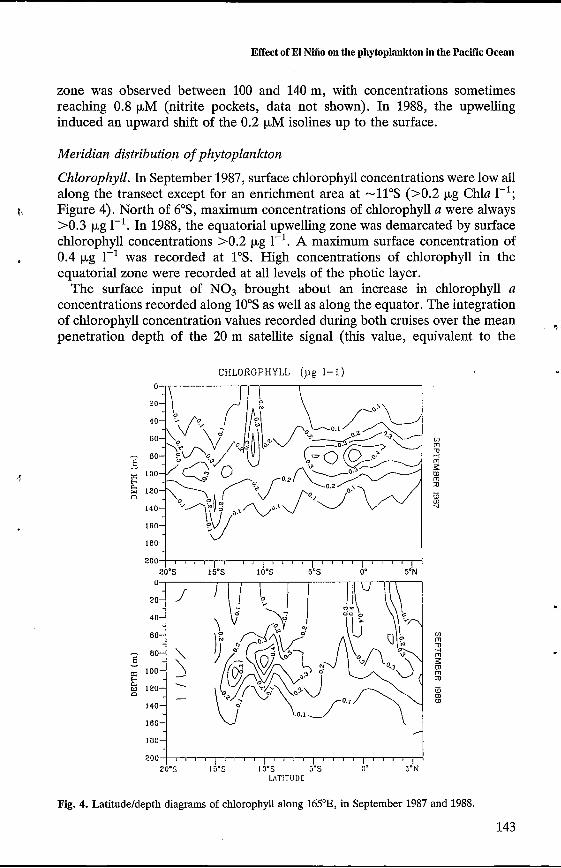
Chlorophyll. In September 1987, surface chlorophyll concentrations were low all along the transect except for an enrichment area at -11"s (>0.2 pg Chla 1-I; Figure 4). North of 6"S, maximum concentrations of chlorophyll a were always >0.3 pg 1-l. In 1988, the equatorial upwelling zone was demarcated by surface chlorophyll concentrations >0.2 pg 1-l. A maximum surface concentration of 0.4 pg 1-l was recorded at 1"s. High concentrations of chlorophyll in the equatorial zone were recorded at all levels of the photic layer.
The surface input of NO3 brought about an increase in chlorophyll a concentrations recorded along 10"s as well as along the equator. The integration of chlorophyll concentration values recorded during both cruises over the mean penetration depth of the 20 m satellite signal (this value, equivalent to the
t,
CHLOROPHYLL (pg 1-1)
zoo I 8 O 8 20'5 15"s I O'S 5's O" 5" N
LATITUDE
Fig. 4. Latitudeldepth diagrams of chlorophyll along 165"E, in September 1987 and 1988.
143

J.Blanchot, M.Rodier and A.Le Bouteiller
reverse of extinction, varied during the PROPPAC cruises from 16 to 24 m; data not shown) produced a value of 1.82 k 0.24 mg m-' (n = 41) in the absence of nitrate (<0.1 pM), and a value of 5.17 4 1.38 mg m-2 (n = 10) in the presence of nitrate (>0.1 pM), with a 95% confidence level.
Cyanobncteria ,and microalgae. In the western Pacifie intertropical zone, the observed range of cell abundance was 4 x 10⁵-2 x lo7 cells 1-1 for cyano- bacteria and 1 X 10⁴-2 x lo7 cells 1-1 for microalgae. In September 1987, maximum surfdce concentrations of cyanobacteria were recorded at 11"s and 7"s l(315-16 x lo6 cells I-'), in an enrichment area at the boundary between SEC and SECC (Figure 5). Outside that area, surface concentrations were low ( 4 . 5 X lo6 cells 1-l) all along the transect, except for a limited enrichment area at 20"S, off the coast of New Caledonia. Between 11"s and 7"S, the maximum concentration of cyanobacteria (>7 X lo6 cells 1-I) was higher than at 70-80 m; it then decreased sharply downwards. Outside that area, high cell concentrations of cyanobacteria and microalgae were not observed until at 3"N and 5"N.
,
CYANOEACTERIA IO6 cells I-!)
m m D -i m I m m a d
u) m u
U T I W O L
CYANOBACTERIA ( 106 cells 1-11
Fig. 5. Latitude/depth diagrams of cyanobacteria abundance along 165"E, in September 1987 and 19.88.
144

Effect of El Niño on the phytoplankton in the Pacific Ocean
Microalgae concentrations were low in the surface layer (<2 X lo5 cells 1-'), except for two slight enrichment areas at 11"s and 73, as was the case with cyanobacteria (Figure 6). Under the surface layer, microalgae distribution was characterized by maximum abundances >1.2 X lo6 cells 1-' at depths ranging from 60 to 100 m. In September 1988, cyanobacteria were abundant in two zones of unequal size. The main one extended over 7" of latitude along the equatorial upwelling, between 5"s and 2"N, showing concentrations >7 X lo6 cells I-' between the surface and 70-80 m (Figure 5). The second one was restricted to 11"s with concentrations >7 X lo6 cells 1-' in the first 20 m. For microalgae, the zone of maximum abundance was related to the equatorial upwelling, where concentrations >1.1 x lo6 cells 1-1 were recorded over 7" of latitude, between 5"s and 2"N, from the surface to 120-150 m (Figure 6). Unlike cyanobacteria, microalgae did not show a second area of enrichment at 11"s. A comparison of the superficial layer in the upwelling zone to that of the zones north and south of it showed that the increase in concentration per litre was somewhat higher with cyanobacteria (X 12) than with microalgae (X 10).
''
MICROALGAE ( 106 cells 1 - 1 1
20-
160-
5.N 200 , , , , , , , , , , , , , , , , I
20.5 I54 10-5 !e, O. UTITUDE
,Fig. 6. Latitude/depth diagrams of microalgae abundance along 165"E, in September 1987 and 1988.
145

J.Blanchot, M.Rodier and A.Le Bouteiller
Concentration data integrated over the first 120 m (the zone where the two fluorescing groups coexist) showed that between YS and 2"N, cyanobacteria and microalgae were respectively 4.7 and 3.2 times more numerous than in September 1987. In comparison, chlorophyll concentration integrated over 120 m between 5"s and 2"N was only 1.4 times higher than in September 1987.
Vertical profiles and distribution of cyanobacteria and microalgae
The vertical distribution pattern af the two fluorescing groups varied according to the hydrological structure (Figure 7). In stable zones where nutrients were depleted in the surface layer, therle were four possible alternatives: (i) when the top of the nitracline was deep (100 m) and the nutrient concentration gradient not clearly defined, populations of the two fluorescing groups remained low over the whole layer (Figure 7a); (ii) when the top of the nitracline was deep (100 m)
CYANOBACTERIA ( IO6 cells I-'
Fig. 7. Typical depth distributions of cyanobacteria (-) and microalgae (- - -) along 165"E in September 1987 and 1988. Horizontal broken lines show the 0.1 pM NO, depth.
146

Effect of El Niño on the phytoplankton in the Pacific Ocean
and the gradient clearly defined or when the top of the nitracline lay between 60 and 80 m and the gradient was poorly defined, a deep concentration peak existed at nitracline level with microalgae only (Figure 7e and h); (iii) when the top of the nitracline lay between 50 and 80 m and the gradient was clearly defined, both fluorescing groups exhibited a concentration peak increasing as the top of the nitracline rose from 80 to 50 m and the gradient became better defined (Figure 7d); (iv) when the top of the nitracline lay at -40 m, both fluorescing groups were more numerous at the surface (Figure 7c) and their numbers gradually decreased with depth. In the zone of temporarily enhanced nutrient supply described around 10"s , cyanobacterial populations clearly increased in the first 80 m, contrary to microalgal populations (Figure 7b and f). Finally, along the equatorial upwelling, populations of both fluorescing groups were very large at the surface and gradually diminished with depth (Figure 7g).
Data from both cruises were combined in order to compare the overall abundance distribution of cyanobacteria and microalgae in relation to depth and nitrate concentration at the 0.1 pM threshold (Figure 8). When the surface nitrate concentration was >O. 1 pM, cyanobacteria populations were large from the surface down to 70 m and those of'microalgae were large from the surface
'down to 120 m. When the nitrate concentration was <0.1 pM, cyanobacterial populations varied in the 0-80 m layer, sometimes attaining levels as high as when nitrate was present. High concentrations ('8 X lo6 cells 1-l) were found in the 1O0S-1loS zone, where a limited and transient enrichment had been described in 1987 and again in the same zone in 1988. Conversely, microalgal populations were always low ( 4 . 2 x lo6 cells 1-') in nitrate-depleted waters.
B
~
Relationship between the microalgae and the deep chlorophyll nzaximum (DCM)
In both cruises, there was a significant correlation (P < 0.01) (Figure 9) between the depth of the maximum concentration of microalgae and that of the DCM. Microalgae accounted for 70% of the variance in the depth of the DCM, whereas cyanobacteria were responsible for only 22% of the variance in the depth of the DCM. On the other hand, there was no significant correlation (P > 0.05) between the populations of each of the two fluorescing groups and the concentration of chlorophyll integrated over the first 20 m, with or without nitrate. This was probably due to variations in cell pigment concentrations.
Size structure of chlorophyll in the equatorial area in presence and in absence of nitrate
During the EI Niño events, when oligotrophic conditions predominated in the upper layer, chlorophyll a <1 pm represented >6O% of the total chlorophyll content. When nitrate was present (NO3 > O. 1 pM) , below the nitracline during El Nirio events and within the entire water column in the upwelling a year later, chlorophyll a > 1 pm predominated (Figure 10). Results on the general pattern of chlorophyll will be presented elsewhere (Le Bouteiller et al., 1991). These results disagree with the few results reported in the central and eastern Pacific by
147
.

J.Blanchot, M.Rodier and A.Le Bouteiller
o
E v
=
, I I ( , r l , , ( , , o ( , ( I , ( ( ( ( , I I ( ( { I ( , , I - - - - ........ -. . . . .- - -
- - - - . . . . . . . . . . . . . . .
. . . . . . . . . . . . XI- - 50- - - .......... ., . . - - ..... ...... - -...... -.. - . . . . . . . . . . . . . - ".."I.._ .. - - . ...- ... ..--- * .." - -e. -... .. - ........ . . . . . .
(001' ...... - lm--".. -. ....... - ... - - . . - .... I.". . - .I---.--. *I .-. . L - - - - f.-- -
- 150- - N O , r O . l y M -
I I I 1 I I I , I l I I I I I , I l , I _
N 0 3 > O , I p M - - - ." . 150-
- - - lo 15 m o o5 u) 15 20 2.5
¿ i l 1 I ' " " " I I I 1 ' I I l 1
Fig. 8. Comparison of depth distribution of cyanobacteria and microalgae at the 0.1 pM nitrate threshold (all data combined).
o'I , I , I , ' I , ( 1 1 , I ' ' ( ( 1 o - - - -- . " . . . - W
- - n -.. ... . . - e-. . . - --. . . . . * - . - ...... -
- u- .. . . -, ..-
loo.-' . - - .. * . - - -
Eo- - 150-
- NO3 d O . I y M - - - - I I I 1 1 1 1 1 1 1 1 1 I l I I
O 5 0 15 m o
Chavez (1989) but are in agreement with some observations in the central Pacific (Pefia et al., 1990) and in the equatorial Atlantic (Herbland et al., 1985).
1 1 , ' 1 ' 1 1 1 ( ( ( ( ( ( ( (
- . . . * . . ' I ....
m-.- ... - -...... . . . - -. -. . -.--. -. - -.. ...
loo-".. . . . - -. . - - , -
- - -
- N O 1 -=O,I) lM -
I I I , I I I 1 I I I ! I I , , I I I ! o5 u) 15 ZD 25
Cell shape and fluorescence
In September 1987, cyanobacteria in the surface layer were rod-shaped (2 x 1 pm) with low fluorescence all over the transect except between 11"s and 7"s.
148

Effect of EI Niño on the phytoplankton in the Pacific Ocean
i
Fig. 9. Linear regression between depth of microalgae maximum and depth of chlorophyll maximum; broken lines limit 95 and 99% confidence intervals.
SEPTEMBER 1987 % chlorophyll cl p m
O 10 20 30 40 50 60 70 80
20
40
60
E - 80 r
100
120
140
160
180
h
+ c3
SEPTEMBER 1988 % chlorophyll
O 10 20 30 40
c
e1 p m 0 y 7p 8p
2°S.1650E
Fig. 10. Comparison of vertical distribution of chlorophyll a <1 pm (in YO of total) at stations 3% 165"E in September 1987 and 2"s 165"E in September 1988. Horizontal broken line shows the 0.1 p.M NO3 depth. Open circles NO3 <0.1 pM, full circles NO3 >0.1 pM.
b
In deeper waters, they were all spherical, larger (>1 pm) and highly fluorescent. Between those two levels, a transition zone of smaller (<1 km) ellipsoid or spherical moderately fluorescent cells was sometimes present. Those transition zones were almost always observed north of 6"S, where the nitracline was clearly defined. In the surface layer, between 11"s and 7"S, there was a mix of shapes and sizes with variable fluorescence. In deeper waters, larger (>1 pm) spherical highly fluorescent cyanobacterial cells were again present. In September 1988,
149

J.Blanchot, M.Rodier and A.Le Bouteiller
rod-shaped (2 x 1 pm) cells dominated in the surface layer south and north of the upwelling zone. Along the upwelling zone, cells in the surface layer were spherical or ellipsoid, small (<1 pm) or (>1 pm) spherical cells as well as ellipsoid cells with high fluorescence. Microalgae were difficult to classify according to their shape and fluorescence, because many cells had indistinct shapes and margins. Variations of shape of red fluorescing particles are difficult to detect under a microscope. Such studies require comparisons with flow cytometer results (Li and Wood, 1988).
Finally, in some stations (in September 1987 at O", between 120 and 140 m and at 3"N, 120 m; in September 1988 at 3"N, between 120 and 140 m and at 5"N, between 140 and 160 m), a very thick and unstable "red dust" was observed at the base of the euphotic zone. However, that phenomenon did not last long enough to allow for counting. Experiments on size fractions performed at 5"N have shown a large increase of the relative percentage of chlorophyll b at those depths (Le Bouteiller et al., 1991) which could indicate the presence of
identified by way of flow cytometry (Chisholm et al. , 1988; Olson et al. , 1990a, Vaulot et al., 1990).
I
'
U significant numbers of prochlorophytes (Neveux et al. , 1989), organisms recently
, Discussion
In the Western Pacific intertropical zone, cyanobacteria were numerically dominant and generally exceeded the microalgae by a factor of 10 up to 100 in the 80-100 m upper layer. Cyanobacteria tended tio concentrate higher in the surface water column than microalgae. The maximum concentration of ~
cyanobacteria was recorded above the maximum of microalgae for 84% of sampled stations, and for the remaining 16% both were observed at the same depth. Below the maximum concentration level, cyanobacteria populations decreased at a much faster rate than those of microalgae. These results are in accordance with those of Murphy and Haugen (1985), Makeyeva (1988) and Glover et al., (1988a,b). Microalgae are better adapted than cyanobacteria to a deep water environment (with the possible exception of deep water Synecho- coccus) because they can use the blue-violet light at the base of the euphotic zone for photosynthesis (Wood, 1985; Glover et al., 1986a, 1987).
As observed on the vertical distribution pattern described here, cyanobacteria can play an important role not only at the base of the euphotic layer but also above. If the former descriptions by several authors (Murphy and Haugen, 1985; Glover et al. , 1985,1986b; Iturriaga and Marra, 1988) of an abundance peak of cyanobacteria at the 1% light level in the natural environment are correct (without underestimates in surface), those were only peculiar cases of surface oligotrophic conditions (Figure 7d). Furthermore, cyanobacteria can thrive in the surface layer (Figur'e 7b, f and g). The subsurface maxima in cyanobacteria concentrations were only observed at -50% of cases at various locations in the coastal Pacific and coastal and open Atlantic ocean (Olson et al., 1990b). This is in agreement with results obtained in the Sargasso Sea, where maximum concentrations were observed in the surface layer (Prézelin et al., 1989;
150
'
"
,.

Effect of El Nifio on the phytoplankton in the Pacific Ocean
Fuhrman et al., 1989). These observations suggest that cyanobacteria can become physiologically adapted to high light intensity. Kana and Glibert (1987a,b) have observed, on Syizeclzococcus cultures, that the growth rate of cyanobacteria was the highest (1.4 day-') when cells were preadapted to high light intensity (200-2000 pE m-2 s-'). However, Morris and Glover (1981) have reported the existence of a photoinhibitory effect in laboratory-grown cyano- bacteria.
In fact , the distribution of cyanobacteria in a tropical environment without any low temperature limitation depends on the available light, which itself varies with depth, and on the abundance of nutrients. Generally, maximum cell abundances of cyanobacteria were reported in enrichment areas, but high concentrations of cyanobacteria (>8 x lo6 cells I-') were also observed in poor nitrate waters (Figures 7b and f and 8). This may be related to the presence in those cells of phycoerythrin, which is typical of this group. This pigment enables the cell to capture energy and a storage of nitrogen is likely (Wyman et al. , 1985; Yeh et al., 1986). One consequence of this ability could explain a bloom of cyanobacteria without increase of microalgae in an area where a nutrient input occurred. In the 10"s zone of instability, transient inputs have been observed. In 1987, nutrients were observed within the entire water column (Figure 3) and the combination of a strong northward flowing meridian current (20 cm s-l up to 7"s) with the SEC caused a north-westward shift in plankton populations (Blanchot et al. , 1987) which could explain the presence of high concentrations of cyanobacteria up to 7"s (Figure 5). In 1988 the input of nutrients probably occurred earlier, but it may be assumed that many days had gone by from the time of this temporary nutrient increase to the time of collection, since sampling at 11"s (September 1988) and north of 10"s (September 1987) was carried out in waters with low nutrient content but with high cyanobacteria (Figure 5) and, to a lesser extent, microalgal concentrations (Figure 6). The presence of microalgae is restricted to high nitrate zones, since microalgae are unable to store as much nitrogen as cyanobacteria. Therefore, in the zone lying between 10"s and 7"S, the concentration integrated over 120 m (September 1987, 10"s-7"s zone, compared with neighbouring zones) was increased by a factor of 4.4 for cyanobacteria and 1.4 for microalgae. In comparison, when the enrichment was more important and sustained (as in the equatorial upwelling) , the concentration (1988 versus 1987) was multiplied by 4.7 for cyanobacteria, 3.2 for microalgae and 1.4 for integrated chlorophyll.
In this latter case, chlorophyll did not increase much for either cyanobacteria or microalgae. This could be due to three major factors: (i) a miscounting in oligotrophic waters, where cells could be too ill-defined to be observed with a classical epifluorescent microscope, leading to an over-estimate of the increase in cell numbers; (ii) a decrease in the cellular pigment concentrations as cell numbers increased; (iii) changes in the unobserved prochlorophyte cell numbers which could be very numerous in oligotrophic areas and scarce in upwelling waters. We have no obvious proof that our counts were underestimated. The second possibility is the most probable: a similar decrease in cellular pigment concentration was observed during a bloom of cyanobacteria (Glover et al.,
151
' '
II
5
.
. *
J.Blanchot, M.Rodier and A.Le Bouteiller
1988b). The third factor is very unlikely since Synechococcus seems better adapted to a low-nutrient level than are prochlorophytes (Vaulot et al., 1990). In fact, to elucidate this important question other methods must be used, such as flow cytometry (for prochlorophyte abundance) or flow analyser and sorter (for pigment cell contents).
The visual estimation method used in this study is quantitatively poor for the fluorescence intensity and supports only qualitative distinctions between dirn or bright Synechococcus. Even so, in rich zones we observed a bright fluorescemce from the surface down to the deepest layers, a phenomenon which does not seem to depend solely on the amount of light available. However, Barlow and Alberte (1985) have reported that the fluorescence level in clones WH7803 and WH8018 was greater in high-light grown cells than in low-light cells. Cyano- bacteria exhibit a high level of fluorescence in or near the nitrate-rich zones. The fluorescence level slowly decreases with increasing distance from the enrichment zones. These observations are consistent with the results of laboratory studies on
depleted environment, exhibited a slow decrease in fluorescence (Glibert et al., 1986). Nevertheless, using more quantitative methods of fluorescence measure-
phycoerythrin fluorescence is not only a function of nitrogen level but, more directly, of light level, i.e. in most cases fluorescence increases with depth (Olson et al., 1990b). This mean increase in fluorescence was also reported earlier (Li and Wood, 1988; Olson et al., 1988). Fluorescence changes could also be due to varying phycourobilin content (Olson et al., 1988, 1990b).
Since the fluorescent halo is not considered as a source of measurement error (Booth, 1987), the separation of cyanobacteria into two groups (large and small cells) at the 1 pm threshold is presumed to be accurate. In a natural environment where the top layer was nitrate deficient, large rod-shaped cyanobacteria (2 X 1 pm) were observed, but rod-shaped cyanobacteria were rarely observed where nitrate was present; when nutrients were present in the surface layer along the upwelling zone, the cells had various shapes (spherical or ellipsoid) and various sizes (large >1 pm or small <1 pm), whereas when nitrate was present at depth the cells were large (>1 pm) and spherical. The cells described in the literature are usually spherical. However, rod-shaped cells have already been described in the Pacific (Takahashi et al., 1985; Makeyeva, 1988), in the surface water of the Atlantic (Li and Wood, 1988), and in the Baltic Sea (Jochem, 1988). The presence of rod-like cells could be related to an interruption of cell division concomitant to an enlargement in size, as observed under culture in nutrient starvation conditions by Glibert et al. (1986). In fact, cyanobacteria can exhibit large variations in size even when they belong to the same strain. Their size increases with depth (Glover et al., 1985; Mikaleyan, 1987; Li and Wood, 1988; Olson et al., 1990b) or during nitrogen starvation (Glover et d., 1986a). Their size decreases in response to nutrilent replenish- ment (Glibert et al., 1986). In the field the smallest of cyanobacteria were observed in regions of maximum cyanobacteria abundance (Vaulot and Xiuren, 1988).
152
c WH7803 cells isolated in the open ocean which, when placed in a nitrate-
ment (flow cytometry), it has been clearly established that Synechococcus
I
.
Effect of El Niño on the phytoplankton in the Pacific Ocean
Hydrological conditions prevailing during the two cruises were very different: EI Niño conditions were present in September 1987 and normal westward flowing currents with equatorial upwelling in September 1988. The results of this study have allowed us to describe the effect of these interannual variations linked to the ENS0 cycle on the distribution and biomass of phytoplankton in the Western Pacific Ocean. In general, with EI Niño conditions prevailing and preventing an equatorial upwelling, chlorophyll concentrations and cyano- bacteria and microalgae populations are low. Conversely, when conditions are back to normal, the return of the equatorial upwelling induces an increase in the surface nutrient concentration, producing increases in chlorophyll concentration and cyanobacteria and microalgae abundances (integrated over 120 m) of 1.4, 4.7 and 3.2 respectively. These changes affect the size structure of the cells in such a way that the <1 pm fraction contains 60% of the total chlorophyll in the absence of nitrate (Figure lo), and 40% when present (Le Bouteiller et al., 1991). It has also been shown that these changes can affect primary production and biomass of zooplankton (Blanchot et al., 1989). As reported by these authors, the integrated primary production over 120 m and the mesozooplank- ton biomass are greater by a factor of 2.5 in conditions of equatorial upwelling. This is consistent with the results of studies carried out in the eastern tropical Pacific Ocean, where a fast drop in copepod populations was observed during EI Niño conditions in 1982-83 (Dessier and Donguy, 1987).
4
"
Acknowledgements
We thank S.Bonnet and P.Gérard for chemical analyses and Y.Penvern and M.Le Corre for help with the graphics. C.Dupouy, G.Eldin and M.H.Radenac suggested many improvements to the manuscript. We would also like to thank the crew of R/V Coriolis for their assistance during operations at sea. Finally, we are also grateful to R.Le Borgne and two anonymous reviewers for their most valuable comments and helpful criticisms.
Y
References . Barlow,R.G. and Alberte,R.S. (1985) Photosynthetic characteristics of phycoerythrin-containing
marine Syneclzococcus spp. I. Responses to growth photon flux density. Mar. Biol., 86, 63-74. Bienfang,P.K. and Szyper,J.P. (1981) Phytoplankton dynamics in the subtropical Pacific Ocean off
Hawaii. Deep-sea Res., 28A, 981-1000. Bienfang,P.K. and Takahashi,M.(1983) Ultraplankton growth rates in a subtropical ecosystem.
Mar. Biol., 76, 213-218. Blanchot,J., Le Borgne,R., Le Bouteiller,A. and Radenac,M.-H. (1987) Rapport de la campagne
PROPPAC O 1 du N.O. Coriolis (9 septembre4 octobre 1987). Rapports de mission. Sciences de la mer, Centre de Nouméa, pp. 1-13.
Blanchot,J., Le Borgne,R., Le Bouteiller,A., Radenac,M.-H. and Rodier,M. (1988) Rapport de la campagne PROPPAC 03 du N.O. Coriolis (11 septembre-11 octobre 1988). Rapports de mission. Sciences de la nier, Centre de Nouméa, pp. 1-54.
BlanchotJ., Le Borgne,R., Le Bouteiller,A and Rodier,M. (1989) Enso events and consequences on the nutrient planktonic biomass and production in the Western Pacific Tropical Ocean. Proceedings of TOGA-COARE meeting Mai 1989, Nouméa, pp 785-790.
153
.
J.Blanchot, M.Rodier and A.Le Bouteiller
Bloem,J. and Bär-Gilissen,M.J. (1986) Fixation, counting and manipulation of heterotrophic
Booth,B.C. (1987) The use of autofluorescence for analyzing oceanic phytoplankton communities.
Chave2,F.P. (1989) Size distributions of phytoplankton in the central and eastern tropical Pacific. Global Biogeochem. Cycles, 3, 27-35.
Chisholm,S.W., Olson,R.J., Zettler,E.R., Goericke,R., Waterbury,J.B. and Welschmeyer,N.A. (1988) A novel free-living prochlorophyte abundant in the oceanic euphotic zone. Nature, 334,
Delcroix,T. and Hénin,C. (1989) Mechanisms of subsurface thermal structure and sea surface thermo-haline variabilities in the south western tropical Pacific during 1975-1985. J. Mar. Res.,
Donguy,J.R. and Hénin,C. (1976) Anomalous navifacial salinities in the tropical Pacific Ocean. J. Mar. Res., 54, 335-364.
Donguy,J.R., Oudot,C. and Rougerie,F. (1970) Circulation superficielhe en Mer du Corail et à 170"E. Cah. ORSTOM, Sér Océanogr., 8-1, 1-20.
Dessier,A. and Donguy,J.R. (1987) Response to El Niño signals of the epiplanktonic copepod populations in the eastern tropical Pacific. J. Geophys. Res., 92, 14, 393-14, 403.
Fuhrman,J.A., Sleeter,T.D., Carlson,C.A. and Proctor,L.M. (1989) Dominance of bacterial biomass in the Sargasso Sea and its ecological implications. Mar. Ecol. Prog. Ser., 57, 207-217.
chlorophyll maxima in the western North Pacific Ocean. J. Plankton Res., 5 , 393-406. Geider,R.J. (1987) An improved method for the observation and enumeration of heterotrophic and
photoautotrophic microplankton. J. Exp. Mar. Biol. Ecol., 110, 19-25. Glibert,P.M., Kana,T.M., Olson,R.J., Kirchman,D.L. and Alberte,R.S. (1986) Clonal com-
parisons of growth and photosynthetic responses to nitrogen availability in marine Synechococcus spp. J. Exp. Mar. Biol. Ecol., 101, 199-208.
Glover,H.E., Smith,A.E. and Shapiro,L. (1985) Diurnal variations in photosynthetic rates: comparisons of ultraphytoplankton with a larger phytoplankton size fraction. J. Plankton Res., 7,
Glover,H.E., Campbel1,L. and Prézelin,B.B. (1986a) Contribution of Synechococcus spp. to size- fractionated primary productivity in three water masses in the Northwest Atlantic Ocean. Mar. Biol., 91, 196-203.
Glover,H.E., Keller,M.D. and Guillard,R.R.L. (1986b) Light quality and oceanic ultraphyto- plankters. Nnture, 319, 142-143.
Glover,H.E., Keller,M.D. and Spinrad,R.W. (1987) The effects of light quality and intensity on photosynthesis and growth of marine eukaryotic and prokaryotic phytoplankton clones. J. Exp. Mar. Biol. Ecol., 105, 137-159.
Glover,H.E., Prézelin,B.B., Campbel1,L. and Wyman,M. (1988a) Pico- and ultraplankton Sargasso Sea communities: variability and comparative distributions of Synechococczls spp. and algae. Mar. Ecol. Prog. rSer., 49, 127-139.
Glover,H.E., Prézelin,B.B., Campbell,L., Wyman,M. and Garside,C. (1988b) A nitrate-dependant Synechococcus bloom in surface Sargasso Sea water. Nature, 331, 161-163.
Herbland,A., Le Bouteiller,A. and Raimbault,P. (1985) Size structure of phytoplankton biomass in the equatorial Atlantic Ocean. Deep-sea Res., 32, 819-836.
Hobbie,J.E., Daley,R.E. and Jasper$. (1977) Use of nuclepore filters for counting bacteria by fluorescence microscopy. Appl. Environ. Microbiol., 33, 1225-1228.
Synechococcus spp. specific growth rates and their contribution to primary production in the Sargasso sea. Mar. Ecol. Prog. Ser., 44, 175-181.
Jochem,R. (1988) On the distribution and importance of picocyanobacteria in a boreal inshore area (Kiel Bight, Western Baltic). J. Plankton Res., 5 , 1009-1022.
Johnson,P.W. and Sieburth,J.McN. (1979) Chroococcoid cyanobacteria in the sea: a ubiquitous and diverse phototropic biomass. Limnol. Oceanogr., 24, 928-935.
Joint,I.R. and Pomroy,A.J. (1983) Ptoduction of picoplankton and small nanoplankton in the Celtic Sea. Mar. Bbl . , 77, 19-27.
Joint,I.R., Owens,N.J.P. and Pomroy,A.J. (1986) Seasonal production of photosynthetic pico- plankton and nanoplankton in the Celtic Sea. Mar. Ecol. Prog. Ser., 28,251-258.
Kana,T.M. and Glibert,P.M. (1987a) Effects of irradiances up to 2000 pE m-'s-' on marine synechococcus WH7803-I. Growth, pigmentation, and cell composition. Deep-sea Res., 34, 479- 495.
nanoflagellates. Appl. Environ. Microbiol., 52, 1266-1272.
Bot. Mar., 30, 101-108.
340-343.
47,777-812.
L' Furuya,K. and Marumo,R. (1983) The structure of the phytoplankton community in the subsurface
?'
519-535.
L
. Iturriaga,R. and Marra,J. (1988) Temporal and spatial variability of chroococcoid cyanobacteria
154
Effect of El Niiïo on the phytoplankton in the Pacific Ocean
Kana,T.M. and Glibert,P.M. (1987b) Effects of irradiances up to 2000 FE m-* s-' on marine Synechococcus WH7803-II. Photosynthetic responses and mechanisms. Deep-sea Res., 34, 497- 516.
le Bouteiller,A., Blanchot,J. and Rodier,M. (1991) Size distribution pattern of phytoplancton in the western Pacific: towards a generalization for the tropical open ocean. Deep-Seu Res., in press.
Li,W.K.W., Subba Rao,D.V., Harrison,W.G., Smith,J.C., Cullen,J.J., Irwin,B. and Platt,T. (1983) Autotrophic picoplankton in the Tropical ocean. Science, 219, 292-295.
Li,W.K.W. and Wood,A.M. (1988) Vertical distribution of North Atlantic ultra-phytoplankton: analysis by flow cytometry and epifluorescence microscopy. Deep-sea Res., 35, 1615-1638.
Makeyeua,N.P. (1988) Autotrophic picoplankton in the Northeastern Tropical Pacific. Oceanology,
Mikaelyan,A.S. (1987) Picophytoplankton of subantarctic waters of the Pacific Ocean. Oceanology,
MorrisJ. and Glover,H.(1981) Physiology of photosynthesis by marine coccoïd cyanobacteria- some ecological implications. Limnol. Oceanogr., 26, 957-961.
Murphy,L.S. and Haugen,E.M. (1985) The distribution and abundance of phototrophic ultra- plankton in the North Atlantic. Limnol. Oceanogr., 30, 47-58.
Neveux,J., Vaulot,D., Courties,C. and Fukai,E. (1989) Green photosynthetic bacteria associated with the deep chlorophyll maximum of the Sargasso Sea. C. R. Hebd. Seances Acad. Sci., Paris,
Olson,R.J., Chisholm,S.W., Zettler,E.R. and Armbrust,E.V. (1988) Analysis of Synechococcus pigment types in the sea using single and dual beam cytometry. Deep-sea Res., 35,425-440.
Olson,R.J., Chisholm,S.W., Zettler,E.R., Atlabet,M.A. and Dusenberry,J.A. (1990a) Spatial and temporal distributions of prochlorophyte picoplankton in the North Atlantic Ocean. Deep-sea Res., 37, 1033-1051.
Olson,R.J., Chisholm,S.W., Zettler,E.R. and Armbrust,E.V. (1990b) Pigments, size, and distribution of Synechococcus in the North Atlantic and Pacific Oceans. Limnol. Oceanogr., 35,
Oudot$. and Monte1,Y. (1988) A high sensitivity method for the determination of nanomolar concentrations of nitrate and nitrite in seawater with a technicon AutoAnalyzer II. Mar. Chenz.,
Oudot,C. and Wauthy,B. (1976) Upwelling et dôme dans le Pacifique tropical occidental: distributions physicochimiques et biomasse végétale. Cah. ORSTOM Sér. Océanogr., 15, 27-48.
Peña,A., Lewis,M. and Harrison,G. (1990) Primary productivity and size structure of phytoplank- ton biomass on a transect of the equator at 135"W in the Pacific Ocean. Deep-Seu Res., 37, 295- 315.
Platt,T., Subba Ra0,D.V. and Irwin,B. (1983) Photosynthesis of picoplankton in the oligotrophic ocean. Nature, 300, 702-704.
Platt,T. and Li,K.W. (eds) (1986) Photosynthetic picoplankton. Can. Bull. Fish. Aquat. Sci., 214,l- 583.
Prézelin,B.B., Glover,H.E., Ver Hoven,B., Steinberg,D., Matlick,H.A., Schofield,O., Nelson,N., Wyman,M. and Campbel1,L. (1989) Blue-green light effects on light limited rates of photosyn- thesis: relationship to pigmentation and productivity estimates for Synechococcus populations from the Sargasso Sea. Mar. Ecol. Prog. Ser., 54, 121-136.
Rotschi,H.P., Hisard,P. and Jarrige,F. (1972) Les eaux du Pacifique Occidental à 170"E entre 20% et 4"N. Travaux et Documents de l'ORSTOM N. 19, ORSTOM-PARIS, pp. 1-113.
Stockner,J.G. (1988) Phototrophic picoplankton: an overview from marine and freshwater ecosystems. Lininol. Oceanogr., 33, 765-775.
Stockner,J.G. and Antia,N.J. (1986) Algal picoplankton from marine and freshwater ecosystems: a multidisciplinary perspective. Can. J. Fish. Aquat. Sci., 43, 2472-2503.
Strickland,J.D.H. and Parsons,T.R. (1972) A practical handbook of seawater analysis, 2nd edn. Bull. Fish. Res. Bd Can., 167, 1-310.
Takahashi,M., Kikuchi,K. and Hara,Y. (1985) Importance of picocyanobacteria biomass (unicellu- lar, blue-green algae) in the phytoplankton population of the coastal waters off Japan. Mar. Biol.,
Vaulot,D. and Xiuren,N. (1988) Abundance and cellular characteristics of marine Synechococcus spp. in the dilution zone of the Changjiand (Yangtze River, China). Cont. Shelf Res., 8, 1171- 1186.
Vaulot,D., Partensky,F., NeveuxJ., Mantoura,R.F.C. and Llewellyn,C.A. (1990) Winter presence of prochlorophytes in surface waters of the northwestern Mediterranean Sea. Limnol. Oceunogr.,
155
28,371-374.
27, 615-620.
308, 9-14.
45-58.
24,239-252.
89,63-69.
35, 1156-1164.

J.Blanchot, M.Rodier and A.Le Bouteiller
Waterbury,J.B., Watson,S.W., Guillard,R.R.L. and Brand,L.E. (1979) Widespread occurrence of
Wauthy,B., Desrosieres,R. and Le Bourhis,J. (1967) Importance présumée de l'ultraplancton dans
Wood,A.M. (1985) Adaptation of photosynthetic apparatus of marine ultraphytoplankton to natural
\Nymaii,M., Gregory,R.P.F. and Carr,N.G. (1985) Novel role for phycoerythrin in a marine
Veh,S.W., Ong,L.J., Glazer,A.N., Wyman,M., Gregory,R.P.F. and Carr,N.G. (1986) Role of
Receivcd on May 13, 1990; accepted on June 25, 1991
a unicellular, marine planktonic, cyanobacterium. Nature, 277, 293-294.
les eaux oligotrophes du Pacifique central sud. Cuh. ORSTOM Sér. Oc-!unogr., 5 , 109-113.
light fields. Nufure, 316, 253-255.
cyanobacterium Synechococcrls strain DC2. Science, 230, 818-820.
phycoerythrin in marine picoplankton Synechococcus spp. Science, 234, 1422-1423. i I
i l
156
Related Documents