CAREER AND TECHNICAL EDUCATION AND WORKPLACE READINESS OF HIGH SCHOOL STUDENTS by AMY JOHNSON PARKER (Under the Direction of Wanda L. Stitt-Gohdes) Abstract For generations, legislation has supported the use of vocational (now termed CTE) education as a means of preparing students for the labor markets. Educators have followed suit by making pathways available to students, giving them an option to select training to prepare for college or workforce while in high school. However, in order to ensure that students are prepared to support the growing workforce demands of the economy, legislators and educators alike must understand the type of programming, experiences, and training necessary to provide students with these skills. If neither CTE nor CP programs support this cause, additional, non-traditional avenues must be chartered to ensure a viable workforce for the 21 st century. The purpose of this causal-comparative study was to determine if the workplace readiness level of high school seniors, based upon student performance on the ACT WorkKeys® assessment, is different between students pursuing a Career, Technical, and Agricultural Education (CTAE) diploma endorsement and those pursuing a College Preparatory (CP) endorsement. A CTAE endorsement may be termed as Career and Technical Education (CTE), Tech Prep, or Vocational, depending upon the state and/or school district granting the diploma.

Welcome message from author
This document is posted to help you gain knowledge. Please leave a comment to let me know what you think about it! Share it to your friends and learn new things together.
Transcript

CAREER AND TECHNICAL EDUCATION AND WORKPLACE READINESS OF HIGH
SCHOOL STUDENTS
by
AMY JOHNSON PARKER
(Under the Direction of Wanda L. Stitt-Gohdes)
Abstract
For generations, legislation has supported the use of vocational (now termed CTE)
education as a means of preparing students for the labor markets. Educators have followed suit
by making pathways available to students, giving them an option to select training to prepare for
college or workforce while in high school. However, in order to ensure that students are prepared
to support the growing workforce demands of the economy, legislators and educators alike must
understand the type of programming, experiences, and training necessary to provide students
with these skills. If neither CTE nor CP programs support this cause, additional, non-traditional
avenues must be chartered to ensure a viable workforce for the 21st century.
The purpose of this causal-comparative study was to determine if the workplace readiness
level of high school seniors, based upon student performance on the ACT WorkKeys®
assessment, is different between students pursuing a Career, Technical, and Agricultural
Education (CTAE) diploma endorsement and those pursuing a College Preparatory (CP)
endorsement. A CTAE endorsement may be termed as Career and Technical Education (CTE),
Tech Prep, or Vocational, depending upon the state and/or school district granting the diploma.

While the results of this study are not indicative of findings to support CTE as a path for
increasing students’ workplace readiness, CP also was not discovered to be a superior method.
Based upon the findings of this study, neither students who complete CTE coursework or those
who complete a CP diploma track score significantly higher on WorkKeys® assessments. This
comparison also holds true when evaluating the number of certificates earned by students in the
two categories.
INDEX WORDS: Workplace Readiness, WorkKeys®, Career and Technical Education, Tech prep, Career Education, Carl D. Perkins, Vocational Education, Work Ready, and Career Development

CAREER AND TECHNICAL EDUCATION AND WORKPLACE READINESS OF HIGH
SCHOOL STUDENTS
by
AMY JOHNSON PARKER
B.S., The University of Georgia, 1997
M.Ed., State University of West Georgia, 2001
A Dissertation Submitted to the Graduate Faculty of The University of Georgia in Partial
Fulfillment of the Requirements for the Degree
DOCTOR OF EDUCATION
ATHENS, GEORGIA
2011

© 2011
Amy Johnson Parker
All Rights Reserved

CAREER AND TECHNICAL EDUCATION AND WORKPLACE READINESS OF HIGH
SCHOOL STUDENTS
by
AMY JOHNSON PARKER
Major Professor: Wanda L. Stitt-Gohdes Committee: Elaine Adams Myra N. Womble Electronic Version Approved: Maureen Grasso Dean of the Graduate School The University of Georgia December 2011

iv
DEDICATION
This dissertation is dedicated to my daughter, Anna Caroline Parker. Before she came into
my life, I was known for saying that I would be called “Doctor” before anyone called me
“Mommy.” Little did I know that God had other plans for me, and for that I am so grateful. This
beautiful little girl and her daddy are the center of my world, and it is my sincere hope that the
sacrifices we have all made to allow me to complete this journey will inspire her to pursue her
dreams and accomplish her goals, no matter what they may be.

v
ACKNOWLEDGEMENTS
As difficult as the completion of this degree has been, being able to properly thank all of
those who helped me along the way is as great a challenge. In an humble attempt to do so, I’d
first like to thank my husband, Jonathan Parker, for his love, support, patience, and
encouragement throughout this process. We began this journey together as newlyweds, and we
are ending it with all the things nearly 11 years of matrimony bring with it. Through it all, he has
been my strength and my perseverance. My father and mother, Tom and Dot Johnson, instilled
in me the value of hard work, always making sure that I had all of my needs met, no matter what
sacrifices they had to make along the way. My in-laws, Michael and Carol Parker, have been a
blessed presence in my life, from the celebrations of success to the babysitting detail to allow me
time to work. My dear friends, Danny and Sandra Swords, have been caring for me on my trips
to and from Athens since I began my undergraduate student teaching experience many years ago.
My friends and colleagues in the Gordon County School District have been my cheerleaders
throughout the writing of my dissertation, and I am so glad to have had the opportunity to work
with all of them. Additional gratitude goes to my dissertation committee for their patience,
understanding and advice. A special thank you to my major professor, Dr. Wanda Stitt-Gohdes,
for helping me get back on track after taking several years off to have a child and care for sick
family members. I’d also like to thank Dr. Stitt-Gohdes, as well as Drs. Elaine Adams and Myra
N. Womble for agreeing to be a part of my reorganized committee without really knowing me.
Their stellar reputations led to my asking for their assistance, and I am grateful that they gave me
a chance to work with them. I would especially like to thank all of those people who prayed for

vi
me along the way, because it is only through God that all of this is possible, and I thank Him for
blessing me with such wonderful family, friends, and colleagues with whom I plan to celebrate.

vii
TABLE OF CONTENTS
Page
Acknowledgements …………………………………………………………………… v
List of Tables …………………………………………………………………………… ix
List of Figures ……………………………………………………………………........... x
Chapter
I. Introduction ……..……...….………………………..………………………… 1
Purpose of Study………………………..……………………….. 6
Research Questions………………………..…………………….. 7
Theoretical Framework.……………………………..…………… 7
Significance of Study..….…………………….….……….…….. 8
II. Review of Literature ……….………………………….………………………. 11
Career Development Theories……………………...……………. 12
Workplace Readiness……………………………………………. 16
Influences on CTE Curriculum………………………………….. 17
Secondary Curriculum Changes and Development……………… 20
Georgia Work Ready Measurement……………………………… 24
III. Method ………………………………………………………………………… 26
Purpose Statement………………………………………………... 26
Research Questions………………………………………..……… 27
Research Design…………………………………………….…….. 27

viii
Instrumentation………………………………………….………… 32
Selection of Sample……………………………………………….. 42
Procedure……………………………………………….…………. 43
Data Analysis………………………………….…………………… 45
IV. Data Analysis .………………………………………………………………… 48
Research Question 1……………………………………………….. 49
Research Question 2……………………………………………….. 51
Research Question 3……………………………………………….. 52
Research Question 4……………………………………………….. 53
V. Summary, Conclusions, and Recommendations ………………..……………. 55
Rationale…………………………………………………………… 55
Purpose…………………………………………………………….. 56
Limitations of the Study…………………………………………... 57
Summary of Findings and Conclusions…………………………… 57
Implications for Practice and Research…………………………… 60
Recommendations for Future Research………………………….. 60
Summary…………………………………………………………... 61
References …...……………………………………………………………………………. 63
Appendices ……………………………………………………………………………….. 72
Appendix A: IRB Approval Letter ..............……………………... 73
Appendix B: Permission Letter from Participating District……...... 75
ix
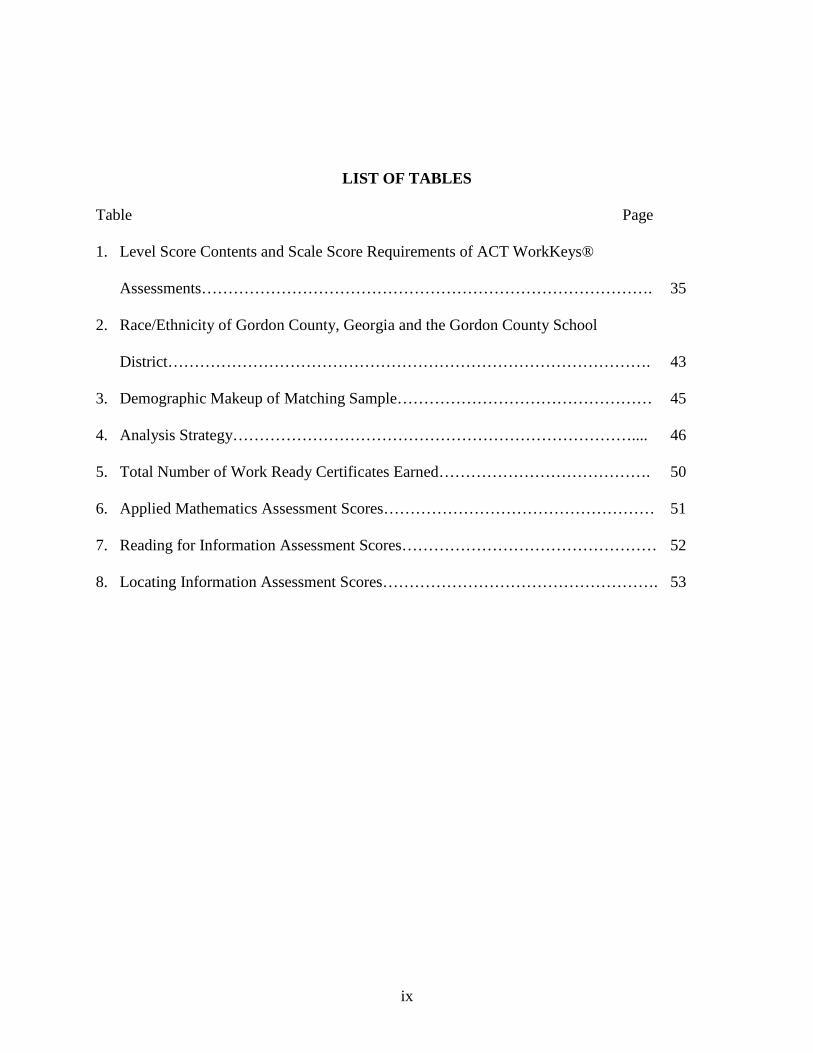
LIST OF TABLES
Table Page
1. Level Score Contents and Scale Score Requirements of ACT WorkKeys®
Assessments…………………………………………………………………………. 35
2. Race/Ethnicity of Gordon County, Georgia and the Gordon County School
District………………………………………………………………………………. 43
3. Demographic Makeup of Matching Sample………………………………………… 45
4. Analysis Strategy………………………………………………………………….... 46
5. Total Number of Work Ready Certificates Earned…………………………………. 50
6. Applied Mathematics Assessment Scores…………………………………………… 51
7. Reading for Information Assessment Scores………………………………………… 52
8. Locating Information Assessment Scores……………………………………………. 53

x
LIST OF FIGURES
Figure Page
1. Work readiness key competencies as compared to CTAE foundation standards……… 22

1
CHAPTER I
INTRODUCTION
Historically much negative stigma has been attached to career and technical education
(CTE) in the United States. This negative stigma has provoked articles such as Gray’s (2004) “Is
High School Career and Technical Education Obsolete?” and Gray’s (2002) article “The Role of
Career and Technical Education in the American High School: A Student Centered Analysis,” as
well as Flowers’ (2000) “High Schools that Work and Tech Prep: Improving Student
Performance in Basic Skills.” However, CTE has remained at the forefront of educational reform
for several decades, beginning with the Smith-Hughes Act of 1917 and continuing through
current Carl D. Perkins federal legislation (Smith 1999; Ruhland, Jurgens, & Ballard, 2003).
The Smith-Hughes Act provided the basis for the exploration of CTE in the United
States. Also known as the Vocational Act of 1917, it granted the first national approval for
vocational education in the public school. Under the commission of President Woodrow Wilson,
Senator Hoke Smith and Congressman Dudley Hughes, both of Georgia, authored the act to
establish vocational education in the areas of agriculture, trades and industry, and home
economics. The act allotted $7 million in Federal money for vocational programs across the
nation that provided training below the baccalaureate level. Funding was also made available to
states for the purpose of teacher training and to pay half of vocational teachers’ salaries. Targeted
at students over the age of 14, the legislation was aimed at workforce education, not
postsecondary education preparation. (Scott & Sarkees-Wircenski, 1996).

2
One interpretation of the Smith-Hughes Act was responsible for the Act to become
known as the 50-25-25 Rule. This was because the interpretation required 50% of time a student
spent in school to be doing shop work, 25 % of the time was to be spent in classes related to
vocational study, and 25 % was to be spent in academic courses (Vocational Education Act of
1917, n.d.). The Act was later expanded to include federal assistance for teacher education and
construction of vocational education facilities. However, the most significant changes came with
the adoption of the Carl D. Perkins Vocational and Applied Technology Act of 1984, the first of
several versions of what is current Perkins legislation. Carl D. Perkins Vocational and Applied
Technology Act of 1998 (also known as Perkins III) was the official piece of legislation to repeal
the Smith-Hughes Act, providing new direction to vocational education that would encourage
integration of academic and vocational content, rather than the explicit separation outlined in the
Smith-Hughes Act (Vocational Education Act of 1917, n.d.).
Since its inception in 1984, Perkins legislation has gone through several reauthorizations.
The latest revision in 2006 was authorized for six years and was expected to allocate
approximately $1.3 billion in federal aid to CTE programs in all 50 states (ACTE, 2006). This
legislation, termed Perkins IV, places an even greater emphasis on accountability in terms of
integration of academic standards, a focus which was aligned directly with “No Child Left
Behind” (NCLB) legislation of 2001.
The ultimate intent of Perkins IV was to strengthen the focus on competitiveness in a
global economy, while increasing integration of academics and technical standards and holding
state educational entities accountable for the performance of their students. (Threeton, 2007).
Under Perkins IV, student academic achievement must be measured by the academic
assessments a state has approved under No Child Left Behind. These may vary from state to

3
state; however, most come in some sort of a standardized graduation assessment. Not only are
these standards to be used as benchmarks against which to measure student academic
achievement, but states also are to develop a means of measuring technical proficiency in order
to meet the requirements of the law. For those local programs and states whose past
accountability measures fail to meet the law’s requirements, major revisions have been put in
place to make the accountability measures more specific (ACTE, 2006).
Other legislation, such as the School-to-Work Opportunities Act of 1994 (U.S.
Department of Education & U.S. Department of Labor) and Goals 2000: Educate America Act
(1994), along with publications such as Secretary’s Commission on Achieving Necessary Skills
(1991) and A Nation at Risk (National Commission on Excellence in Education, 1983), have
given focus to career and technical education throughout the United States over the last several
decades.
Even with all of the changes to Perkins legislation in an effort to ensure accountability, a
disconnect remains among stakeholders in career and technical education. Tech Prep, as a
subsidiary of Perkins legislation, addressed, to a great extent, the communication and
partnerships between the secondary and postsecondary educational institutes. However, the
stakeholder with only a minimal role in the process was business and industry. Without the
presence of this major player, the process was still incomplete. In an effort to address this issue,
the Georgia Work Ready initiative was launched in August 2006 by then-Georgia Governor
Sonny Perdue and the Georgia Chamber of Commerce.
The purpose of the development of Georgia Work Ready was to link education and the
workforce and align [these two sectors] to the economic development needs of the state, its
regions and communities. Work Ready Certificates and job profiles provide a common

4
language for industry and education to ensure the emerging workforce graduates with the
critical thinking skills needed in the 21st
This credentialing program, like others of its kind throughout the country, utilizes the
WorkKeys® system, produced by ACT. Known to most as a testing company that produces
testing materials for college entrance requirements, ACT is a well-respected company in
education and recognizable to the general population. According to ACT’s website (ACT,
2010a),
century workforce. (D. Lyons, email
communication, June 15, 2010)
Originally, ‘ACT’ stood for American College Testing. In 1996, however, the official
name of the organization was shortened to simply ‘ACT.’ This change in the official
company name was made to better reflect the broad array of programs and services we
now offer beyond college entrance testing. [The WorkKeys® system is one such product].
(para. 1)
Consisting of two separate key components, job profiling and the WorkKeys®
assessment, ACT WorkKeys® is available to employers as a method of determining the level of
proficiency in a given skill area at which an individual could perform and to identify pools of
applicants who have achieved the levels of proficiency and are qualified to perform the tasks
required by a job (ACT, 2008d). Job profiling allows companies to work with an authorized job
profiler to identify the required job tasks and skill levels for each position. The WorkKeys®
assessment is a criterion-referenced exam, which tests both core skills and work habits and
reflects what individuals can do relative to the job requirements. The scores from these
assessments are placed in a category, or pre-determined level, and correspond with a skill level
set forth in job profiles. By comparing job profiles with individuals' Work Ready Certificates,

5
companies can make reliable decisions about hiring, training and program development (ACT,
2008d). As of May 31, 2010, a reported 181,070 Georgians had taken the WorkKeys®
assessment through the Georgia Work Ready program; and more than 330 companies have
completed job profiles and use the WorkKeys® system in the hiring process (Georgia Work
Ready, 2010).
A focus on bringing business and industry to the table does not, however, deemphasize
secondary education’s role in workforce education. According to ACTE (2011), “States and
localities are working within the updated accountability system to develop effective methods to
improve programs and measure student progress and success” (para. 6). The Georgia
Department of Education communicated this mandate back to local boards of education by
requiring that students show increases and meet minimum standards as measured by several
performance indicators. Among those indicators are graduation rates, scores on the mathematics
and language arts sections of the Georgia High School Graduation Tests, and technical skill
attainment as measured by the implementation of end-of-pathway assessments, which in some
cases are industry certification tests (Hansen, 2010). Most recently the Georgia Department of
Education has been working on a new instrument, the College and Career Ready Performance
Index, for meeting the accountability requirements. This new instrument puts a stronger
emphasis on career readiness by measuring the number of CTAE pathway courses that are
completed by students in local high schools, the number of students earning a CTAE industry-
recognized credential, and most noteably for the study at hand, the number of students receiveing
a silver certificate or higher on the Georgia Work Ready Assessment. While this has not been
approved by the Federal government as Georgia’s replacement for AYP, it has been vetted at the

6
State level and expected to be sent, with minor revisions, for approval by the end of 2011.
Georgia’s model is well-poised to be a pilot for such an index (Barge, 2011).
What does this mean for students who are graduating from high school and entering the
job market via postsecondary education and/or training, on-the-job training, military, etc.? How
will these students and the employers who will hire them determine if these students are truly
workforce ready? No matter what postsecondary path they choose, high school students need to
be prepared at a comparable level of readiness in reading and mathematics. The question
remains: how will these students be able to communicate to employers their level of workforce
readiness? (ACT, 2006a) If the Georgia Work Ready initiative is indeed the mechanism for
establishing a common language, then it can be surmised that the WorkKeys® system is the tool.
As a way to encourage a large sector of potential workforce candidates, high school students, to
participate in the Georgia Work Ready program, the Governor’s Office of Workforce
Development launched the Get Work Ready initiative. Released as a pilot in March 2009, this
project was designed to give high school seniors the opportunity to be tested at their respective
high schools. Schools throughout the state have adopted this initiative as a means of assessing
skills of students as they make final preparations for their postsecondary plans (Governor’s
Office of Workforce Development, 2009). As a result, nearly 40,000 high school seniors earned
a Work Ready certificate by May 31, 2010 (Georgia Work Ready, 2010). With a common
language established, educational entities have a tool for monitoring progress to see if students
are truly prepared for work outside the educational institution.
Purpose of Study
The purpose of this study was to determine if the workplace readiness level of high school
seniors, based upon student performance on the ACT WorkKeys® assessment, is different

7
between students pursuing a Career, Technical, and Agricultural Education (CTAE) diploma
endorsement and those pursuing a College Preparatory (CP) endorsement. A CTAE endorsement
may be termed as Career and Technical Education (CTE), Tech Prep, or Vocational, depending
upon the state and/or school district granting the diploma.
Research Questions
1. What are the levels of workplace readiness of high school seniors based on descriptive
properties of certificate levels prescribed by ACT WorkKeys® scores on Applied
Mathematics, Reading for Information, and Locating Information assessments?
2. Is there a statistically significant difference in the scores on the ACT WorkKeys®
assessment in Applied Mathematics between high school seniors completing a Career and
Technical Education endorsement and those completing a College Preparatory
endorsement?
3. Is there a statistically significant difference in the scores on the ACT WorkKeys®
assessment in Reading for Information between high school seniors completing a Career
and Technical Education endorsement and those completing a College Preparatory
endorsement?
4. Is there a statistically significant difference in the scores on the ACT WorkKeys®
assessment in Locating Information between high school seniors completing a Career and
Technical Education endorsement and those completing a College Preparatory
endorsement?
Theoretical Framework
While many of the theories dealing with career development may shed light on the study of
workplace readiness of high school students, the Social Cognitive Career Theory (SCCT), with a

8
basis in Bandura’s Social Cognitive Theory, will be the theoretical framework for this study. The
SCCT describes the reciprocal interaction of personal attributes, external environmental factors,
and behavior as an influence on career decision-making, supporting the possibility that career
choice may be influenced by experience brought about by a student’s home life and personal
experiences (e.g., educational experiences at the secondary level).
With this in mind, CTE classes, which are designed to give students secondary career
training, can be seen as a vital tool in increasing career development awareness. Additionally,
“CTE plays a central role in the development of work readiness skills and the ability for students
to exit high school with certain transferable basic skills,” which are invaluable to employers
(Hall, 2010, p. 9). Furthermore, Hyslop (2008) noted that students may not be receiving
necessary workplace readiness skills unless they are exposed to CTE opportunities.
Significance of Study
This study attempted to show that the perceived negative stigma of CTE courses is
actually contradictory to the fact that students who concentrate in CTE areas leave high school
more work ready than those who do not take these courses. Bragg (2000) found that CTE
graduates, without regard to postsecondary attendance, were more likely to work during high
school and immediately afterward than their college-prep counterparts. Additionally, Smith,
Henry, and Munro (2002) found that a focused program of study, such as those found in CTE,
supports transitions to work, apprenticeship, and/or further study. This research, among a
plethora of information from various studies to be explored in later sections, supports the thought
that students who complete a CTE endorsement are more likely to be labeled “work ready” than
those who do not.

9
Additionally, an analysis of research gives credence to the fact that students who are
deemed work ready also are prepared to make decisions about postsecondary training needed to
prepare them for their career goals, thus the study of workplace readiness can be a reliable tool in
predicting student success in postsecondary education. One such source comes from a look at
the movement by federal and state entities to promote college and career readiness for all
students through a common set of standards and assessments. Miller (2009) brought about the
idea of teaching the same skills no matter the pathway a student chooses:
Today, the overwhelming percentage of new jobs that offer a wage sufficient to support a
family and provide opportunity for career advancement require some postsecondary
education, and evidence shows that the skill level required to enter college or a work-
training program are the same. In order to ensure a sustainable future for all Americans,
teachers must be able to prepare all of their students for college and careers. (p. 2)
Both academic and nonacademic elements are a necessity in both college and workplace
readiness; and without both types of elements, students’ ability to be successful beyond high
school is negatively impacted (Pinkus, 2009).
Through further examination, it was discovered that ACT (2009) completed research to
show that students who have some level of certainty about their occupational choice and achieve
higher Composite scores on the ACT will perform academically better in college. These
students also will be more likely to persist to college graduation and attain degrees in their
chosen career fields of study. ACT’s research goes further to correlate the two types of readiness
through a comparison of their ACT college entrance exam and their WorkKeys® assessment,
which was the instrument used in this study. The two assessments are unique in what they
measure and how the scores are reported; however, the level of readiness is maintained between

10
the two assessments. The empirical data included in this research showed a direct correlation
between a college-readiness composite score on the ACT of 20-23 and a level 5 on the ACT
WorkKeys® assessment meant to illustrate workplace readiness. Given the previous research,
the goal of this study was to determine if a relationship existed between workplace readiness and
CTE endorsements (ACT, 2008b).

11
CHAPTER II
REVIEW OF LITERATURE
Following is a review of pertinent literature in the study of workplace readiness. The
review begins with a look at major research in career development to establish a theoretical
frame of reference for defining workplace readiness. Following sections discussing theory are
those that highlight the historical context of workplace readiness. Finally, the review provides
background on the response from secondary education to address the deficiencies in workplace
readiness that are called out in the literature and how Georgia is measuring the outcomes.
Many researchers (e.g., Lent, Brown, & Hackett, 1996a, b; Bandura, 1986; Holland, 1985;
Bright & Pryor, 2005) have produced work that supports the implementation of career
intervention programs as a basis for increasing students’ workplace readiness with the work
experiences gained through participation in these programs. Theories such as Super, Savicas, and
Super’s Life Span, Life Space Theory of Career Development (1996), Holland’s Career
Typology Theory of 1959 and his Theory of Vocational Choice (Holland, 1985) and Bandura’s
Social Learning Theory of 1977 and 1986 (Social Learning Theory of Albert Bandura, 1999),
and Lent, Brown, and Hackett’s (1996a, 1996b) Social Cognitive Career Theory (SCCT)
produced substantial support for many of these programs; and they have been revised in recent
years as more research has come available. Many of the theories have built off one another, and
most recent theories appear to have added more components to the traditional schools of thought.
In the paragraphs to follow, a discussion of relevant career development theories will be
followed by a look at literature related to workplace readiness. It is from this literature that the

12
relationship between the workplace readiness construct and career and technical education will
be established.
Career Development Theories
The literature available on career development is vast; and given the new emphasis on
workplace readiness of students in the United States and employers seeking new ways to
measure their skills, the pool will most likely grow over the next several years (ACTE, 2008).
However, there are several career development theories that will most likely give the basis for
additional research: Life span theory of career development (Super, Savicas, & Super 1996),
Holland’s career typology theory of 1959 (Holland, 1985), Social Learning Theory (Social
Learning Theory of Albert Bandura, 1999), and Lent, Brown & Hackett’s Social Cognitive
Career Theory (1996a).
Life span, life space theory of career development. Super created the life span, life
space theory of career development, the oldest career development theories in existence. The
life-span component of his theory explained an individual’s career development process over a
lifetime, illustrated through six life and career development stages: crystallization (ages 14-18),
specification (ages 18-21), implementation (ages 21-24), stabilization (24-35), consolidation (age
35), and readiness for retirement (age 55) (Super, Savicas, & Super 1996).
One of his greatest contributions was the emphasis placed upon the role of self-concept
development when discussing career development. In this role Super believed that people use
their chosen occupations as a means of self-expression. Not only is self-concept an issue, but
Super also explored the fact that self-concept is an ever-changing, evolutionary process that
emerges from one’s experience; and career development is not limited to occupational choice,
but it includes other life roles.

13
Career typology. Holland’s career typology theory of 1959 (Holland, 1985) is the next on
the chronological list that seems to hold value for the study at hand. As one of the most widely
accepted career development theories, Holland’s typology theory is also labeled as one of the
easiest to use because the six personality types he identified are easy to match up with a
corresponding environment. Holland’s belief was that individuals are attracted to a particular
occupation because it is what is most closely associated with their own life stories and
personality traits. Holland based his original theory on four assumptions:
1. In our culture, people can be categorized as one of the following: realistic,
investigative, artistic, social, enterprising, or conventional.
2. There are six modal environments: realistic, investigative, artistic, social,
enterprising and conventional.
3. People search for environments that will let them exercise their skills and abilities,
express their attitudes and values, and take on agreeable problems and roles.
4. Behavior is determined by an interaction between personality and environment.
(Holland, 1985, pp. 2-5)
Social learning theory. The 1977 and 1986 versions of Bandura’s social learning theory
emphasize that career development is a learned process which comes from watching others in the
surrounding environment. Bandura considered vicarious experience to be the typical way that
human beings change, while emphasizing the importance of observing and modeling the
behaviors, attitudes, and emotional reactions of others (Social learning theory of Albert Bandura,
1996; Kearsley, 2005).
An example of how social learning theory works comes from students seeking role models.
Role models typically originate from those whom they see will predict the outcome of their own

14
chosen career paths. For this reason students will tend to choose role models of their own race.
Karunanayake and Nauta (2004) supported this premise in their study conducted on college
students in regard to their use of role models in career development. While some role models
may come from the realm of professional athletics, famous television or movie personalities, or
musical tributes, the majority of role models come from those who are involved in students’
everyday lives, e.g., parents, older siblings, teachers, etc. (Flouri & Buchanan, 2002). This
would account for the number of students who follow in their parents’ footsteps and duplicate
their career choices. It also gives merit to the concept of teachers sharing their own career
experiences with students as a means of vocational instruction (Prideaux, 2003). A collective
look at the aforementioned theories illustrates a distinction that can be made between two
groups: content-focused theories and developmental process theories. For this reason the social
cognitive career theory, which aimed to incorporate both of these perspectives, is the theoretical
framework selected for this study.
Social cognitive career theory. In 2000, Ireh discussed the fact that students become
aware of career choices through interaction in everyday activities. Because many factors
influence these activities, it is important to look at these issues in the pursuit of career research.
The social cognitive career theory (SCCT), which grew out of Bandura’s (1986) social cognitive
theory [social learning theory], attempted to address issues of culture, genetics, social context
and unforeseen life events that may interrelate with and supplant the effects of career-related
choices. The SCCT focuses on the connection between self-efficacy, outcome, expectations and
personal goals that influence an individual’s career choice (Beale, 2001), while emphasizing “the
importance of personal agency in the career decision-making process and attempts to explain the
manner in which both internal and external factors serve to enhance or constrain that agency”

15
(Albert & Luzzo, 1999, p. 431). Unlike other theorists in the career development arena, Lent,
Brown, and Hackett (1996a) did not set out to produce another model; on the contrary, they set
out to account for a more organized and coherent model of career behavior. Their goals were
simply to “(1) bring together conceptually related constructs (e.g., self-concept, self-efficacy),
(2) more fully explain outcomes that are common to a number of career theories (e.g.,
satisfaction, stability), and (3) account for the relations amongst seemingly diverse constructs
(e.g., self-efficacy, interests, abilities, needs)” (pg. 443).
Keeping these goals in mind, the SCCT proposes that career choice is influenced by the
beliefs that the individual develops and refines through personal performance accomplishments,
vicarious learning, social persuasion, and physiological states and reactions (Lent, Brown, &
Hackett, 1996b). The culmination of these four areas comes when a successful attempt is made at
a particular endeavor. The feeling of success and reward reinforces one’s goals for continuing
the activity. Through trial and error, the scope of successful endeavors is narrowed by the time
adulthood has been reached, and the focus takes the shape of an intended career goal. What is
critical to the success of this process is the extent to which one considers himself/herself
successful and valued and where adequate compensation for the achievement is obtained,
whether through monetary gain, acceptance, or praise. The contextual factors come into play by
influencing the individual’s perception of the probability of success; however, if barriers are
viewed as significant, there will be a weaker interest. Some of these barriers may come in the
form of monetary needs, limited educational opportunities and/or skills, lack of support from
family, peers, or educators, etc., all of which contribute to the conditions under which career
choices are made (Albert & Luzzo, 1999).

16
Once these barriers have been evaluated and interest is determined or suppressed, options
are narrowed (Albert & Luzzo, 1999). This is contrary to the goals set forth by most parents and
educators who deal with students’ career development, and SCCT addresses this issue. SCCT
supports the notion that career counseling is most effective when all reasonable options are
explored as possible occupational choices (Stitt-Gohdes, 1997). While this is not always
possible, it is important to note that the SCCT recognizes it as a necessity. The process of the
Social Cognitive Career Theory as presented by Lent, Brown, and Hackett (1996a), allows that
the first level of evidence comes from the four components described in the theory. Depending
upon the success or failure of the intended endeavor, a potential career choice may emerge.
However, no matter the outcome, the endeavor recycles into the initial four components of the
SCCT, all of which work together for continued attempts at unexplored activities. Lent, Brown,
and Hackett also state that helping to eliminate the barriers that prevent success in a particular
endeavor, such as a job-related task, is essential in bringing about success that leads to satisfying
career choice.
Career-focused curriculum and opportunities made possible through CTE coursework may
not be the answer to addressing the needs of all secondary students’ transitional needs; however,
SCCT lends support to CTE’s implementation as another piece of the career development puzzle
as it increases awareness and available opportunities to all students, making this type of career
intervention a strong topic for future studies (Roberts, 2008).
Workplace Readiness
Workplace readiness is characterized as “students being prepared for and able to adjust to
the culture and demands of the workplace. Methods for ensuring workplace readiness among
students include: a formal orientation to the program's goals and expectations workshops or
17
courses on basic job-related skills; job-shadowing or visits to different workplaces; and school-
based enterprises in which students develop job skills by running real businesses” (“Workplace
readiness”, 2010). However, research shows that education in general is not preparing students to
enter the workplace (e.g., Lippman & Keith, 2009; U.S. Chamber of Commerce, 2010; Pittman
2010).
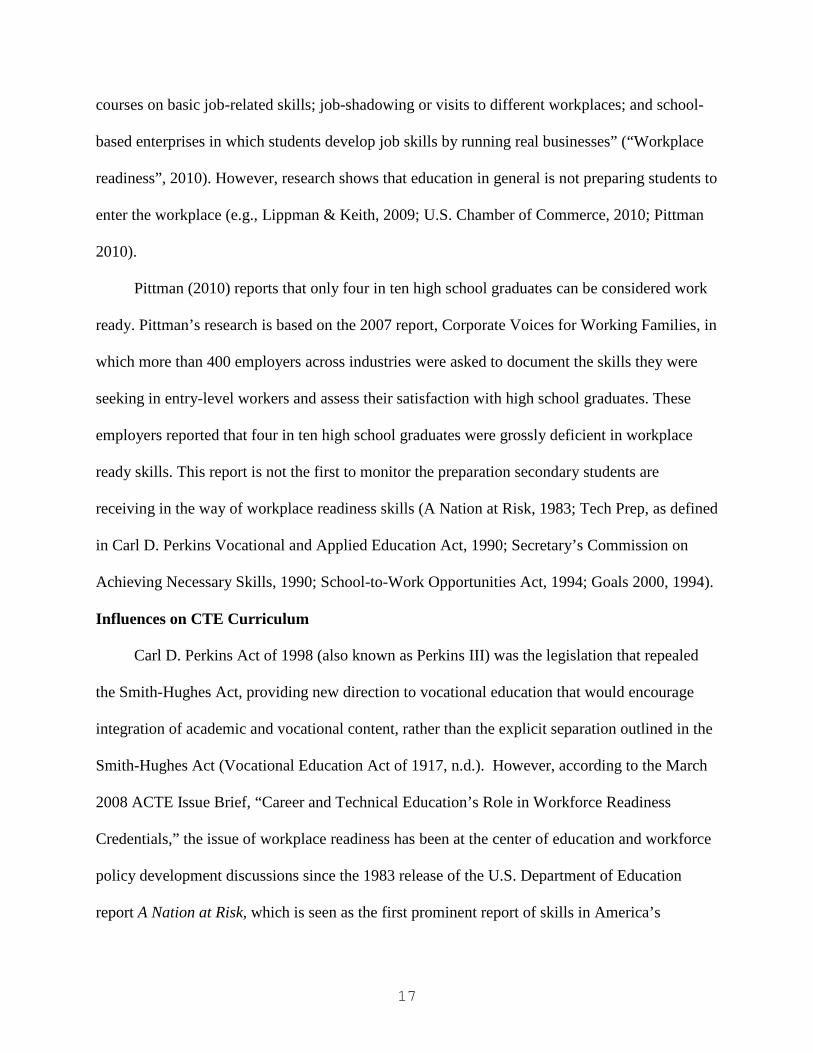
Pittman (2010) reports that only four in ten high school graduates can be considered work
ready. Pittman’s research is based on the 2007 report, Corporate Voices for Working Families, in
which more than 400 employers across industries were asked to document the skills they were
seeking in entry-level workers and assess their satisfaction with high school graduates. These
employers reported that four in ten high school graduates were grossly deficient in workplace
ready skills. This report is not the first to monitor the preparation secondary students are
receiving in the way of workplace readiness skills (A Nation at Risk, 1983; Tech Prep, as defined
in Carl D. Perkins Vocational and Applied Education Act, 1990; Secretary’s Commission on
Achieving Necessary Skills, 1990; School-to-Work Opportunities Act, 1994; Goals 2000, 1994).
Influences on CTE Curriculum
Carl D. Perkins Act of 1998 (also known as Perkins III) was the legislation that repealed
the Smith-Hughes Act, providing new direction to vocational education that would encourage
integration of academic and vocational content, rather than the explicit separation outlined in the
Smith-Hughes Act (Vocational Education Act of 1917, n.d.). However, according to the March
2008 ACTE Issue Brief, “Career and Technical Education’s Role in Workforce Readiness
Credentials,” the issue of workplace readiness has been at the center of education and workforce
policy development discussions since the 1983 release of the U.S. Department of Education
report A Nation at Risk, which is seen as the first prominent report of skills in America’s

18
educational system (p. 1). It was followed by other pieces of legislation and publications that
have played a pivotal role in shaping CTE curriculum.
A Nation at Risk. The 1983 publication, A Nation at Risk, addressed the concern over the
common observation that the United States' educational system was failing to provide graduates
who would make up a competitive national workforce. The report did not focus strictly on public
school or upon secondary education. Rather, it analyzed teaching and learning at the primary,
elementary, and secondary levels, as well as in public and private schools alike. Furthermore, it
sought to compare American schools and colleges with those of other advanced nations. Overall,
the commission made 38 recommendations that called for, among other things, a standardized
curriculum in academics, computer science, and foreign language, higher admissions standards
for four-year colleges, a minimum length of school days and school years, professionally
competitive teacher salaries, and federal leadership and funding (National Commission on
Excellence in Education, 1983).
Tech Prep. From the inception of Perkins II, the Tech Prep Education Act placed an
emphasis on the commingling of academics and career and technical programs to prepare for the
next step beyond secondary education (Carl D. Perkins Vocational and Applied Technology
Education Act Amendments of 1990, 1989). Tech Prep called for a change in the traditional
vocational courses that did not allow for high academic standards, pointing out that these kinds
of classes would not hold up to the changing need for strong “academic foundations” in the
changing workforce (Hull & Grevelle, 1998, p. 34-35). One of the major steps taken in an effort
to achieve this goal was the creation and implementation of applied academics. The thought
process behind these types of secondary classes was that students would be able to connect
academic concepts with real-world applications (Flowers, 2000). Other tenants of the Act
19
provided for a seamless transition of vocational education courses to articulate to postsecondary
education, giving students a head start on career-related programs of study (Hull & Grevelle,
1998).
Secretary’s Commission on Achieving Necessary Skills (SCANS). In 1990, the
Secretary’s Commission on Achieving Necessary Skills developed a report that outlined
challenges facing the nation’s business and educational communities. As a means to combat
these challenges, the SCANS report vocalized the need for better communication and a common
language to facilitate conversations between business and education. Secondly, it called for clear
and relevant standards as a means of motivating students to put forth the effort so that they will
be able to perform more highly when they reach the world of work. Lastly, it called for an
assessment of workplace readiness skills of students, providing a credential that would give
parents and employers a picture of the level at which a student should be expected to perform.
The SCANS report put into place a prescribed set of workplace readiness criteria that
would guide the appropriate educational experiences. It was the belief of the commission that,
given the right experiences, the appropriate workplace skills could be taught, and that learning
through experience is only appropriate if all students and workers are exposed to the right
experiences. This put the burden to provide opportunities for acquiring these experiences on
both schools and workplaces (Secretary’s Commission on Achieving Necessary Skills, 1990).
School-to-Work Opportunities Act. The School-to-Work Opportunities Act of 1994 was
developed by the U.S. Department of Education and the U.S. Department of Labor to address the
national concern over the gap between the skills and education required to be competitive in a
global economy. The Act, signed into law in 1994 as Public Law 103-239, required systems to
incorporate work-based learning, school-based learning, and connecting activities into the

20
educational experiences made available to students in public high schools. The purpose was to
integrate workplace concepts with school-based learning, while building stronger relationships
between education and industry to address workforce education needs (U.S. Department of
Education & U.S. Department of Labor, 1994).
Goals 2000. With the passing of Goals 2000: Educate America Act (1994) came the
creation of the National Skill Standards Board. The purpose of this entity was to facilitate the
development of rigorous occupational standards. The Board was charged with identifying broad,
nation-wide occupational clusters and creating a system of standards, assessments, and
certification for each of these national clusters. The certification would be that described in the
School-to-Work Opportunities Act to indicate mastery of skills in specific occupational areas.
While the School-to-Work Opportunities Act provided legislation to cover school-based
initiatives such as connecting activities for schools and businesses, work-based learning, and
school-based learning, the Goals 2000: Educate America Act was intended to provide a
framework within which to organize all state and federally funded education programs, including
academia and workplace readiness.
Secondary Curriculum Changes and Development
Guiding the development of state-level standards for CTE across the nation, the principles
put forth in A Nation at Risk, along with the Secretary’s Commission on Achieving Necessary
Skills (SCANS), School To Work Opportunities Act (1994), and Goals 2000 support the need for
students to be workplace ready. Beginning in 2003, the state of Georgia underwent an extensive
curriculum revision, implementing performance standards to guide student learning and
emphasizing the same rigor and student outcomes present in standardized curricula already in
practice in other parts of the nation. One area of transformation for Georgia’s curriculum was

21
that of Career, Technical, and Agriculture Education (CTAE), known as CTE for the purposes of
this study. Curriculum committee members were urged to write standards and correlate any of
those standards that were deemed appropriate with standards already in place for academic areas
such as English/ language arts, math, social studies, and science (M. Williams, personal
communication, October 8, 2005). The result of this work was a standards-based curriculum that
provided specialized career training, as well as academic rigor, tethered by a focus on
foundational work-ready skills. When comparing this work to educational research supporting
workplace readiness, it can be summarized that the CTE curriculum in Georgia can be viewed as
a support mechanism for instilling workplace readiness skills in students who complete
coursework in this area.
Figure 1 is a derivation of a chart published in Lippman and Keith’s (2009) research brief
entitled “A Developmental Perspective on Workplace Readiness: Preparing High School
Students for Success.” The original information from the research report explored not only
workforce readiness, but also college readiness and healthy youth development and how critical
workforce readiness is to each of these areas. For the purposes of this study, only the
information on workforce readiness is included. The other portion of Figure 1 is derived from a
study of foundational skills present in the current Georgia CTE curriculum.

22
Workforce Readiness Key Competency
(Lippman & Keith, 2009)
CT(A)E Foundation Skill
(Georgia Department of Education, 2005) • Understanding Research and Technical Material CTAE-FS-1 Technical Skills: Learners achieve technical content skills
necessary to pursue the full range of careers for all pathways in the program concentration.
• Language, Grammar Skills • Rigorous Coursework • 4 Years High School Math including Algebra II,
Geometry, Statistics • 4 Years of High School English • Attaining a High School Diploma or Other
Credential
CTAE-FS-2 Academic Foundations: Learners achieve state academic standards at or above grade level.
• Communication Skills • Oral Communication Skills • Quantitative Communication Skills • Listening Skills • Effective Written Communication • Using Communication Tools Effectively • Language, Grammar Skills
CTAE-FS-3 Communications: Learners use various communication skills in expressing and interpreting information.
• Analysis, Evaluative, and Critical Thinking • Problem-solving Skills
CTAE-FS-4 Problem Solving and Critical Thinking: Learners define and solve problems, and use problem-solving and improvement methods and tools.
• Use Knowledge, Information, and Technology
Interactively
CTAE-FS-5 Information Technology Applications: Learners use multiple information technology devices to access, organize, process, transmit, and communicate information.
CTAE-FS-6 Systems: Learners understand a variety of organizational
structures and functions.
• Avoiding Risk Behavior • Workplace Safety
CTAE-FS-7 Safety, Health and Environment: Learners employ safety, health and environmental management systems in corporations and comprehend their importance to organizational performance and regulatory compliance.
• Persuasiveness, Appropriately Contributing to a
Group • Ability to Assist, Teach Others • Conflict Resolution, Cooperation
CTAE-FS-8 Leadership and Teamwork: Learners apply leadership and teamwork skills in collaborating with others to accomplish organizational goals and objectives.
• Decision Making, Good Work Ethic • Integrity • Understand US Norms, Democracy, and Race
Discrimination
CTAE-FS-9 Ethics and Legal Responsibilities: Learners commit to work ethics, behavior, and legal responsibilities in the workplace.
• Career Planning and Job Search Skills • Lifelong Learning Skills
CTAE-FS-10 Career Development: Learners plan and manage academic-career plans and employment relations.
CTAE-FS-11 Entrepreneurship: Learners demonstrate understanding of concepts, processes, and behaviors associated with successful entrepreneurial performance.
Figure 1. Work readiness key competencies as compared to CTAE foundation standards. Note: The key competencies on the left side are taken from Lippman and Keith’s (2009) A developmental perspective on workplace readiness: Preparing high school students for success (Research Report No. 2009-24). The CTAE Foundation Skills, developed by committees under the directions of the CTAE Division of the Georgia Department of Education in 2005, are utilized in CTAE classrooms, regardless of the program area concentration.

23
While the majority of the skills listed as key competencies in the area of workforce
readiness by Lippman and Keith (2009) are found to parallel the CTAE Foundation Skills as
determined by the Georgia Department of Education, a few are not addressed in this rudimentary
comparison. However, a deeper look at specific course curriculum draws a more comprehensive
match. Examples of these additional overlaps are in the area of physical development. In the
Georgia Performance Standards for healthcare, “managing one’s health,” an additional key
competency not addressed in the previous comparison, is explicitly addressed in the standard
labeled HS-IHS-10: “The student will practice preventive health behaviors personally and
professionally with clients.” (“Introduction to Healthcare Science,” Georgia Department of
Education, 2007b, p. 5).
Another area where key competencies were not addressed in the CTE Foundations Skills
was “social development.” Many of these are the focus of standards in the business essentials
performance standards (“Business Essentials,” Georgia Department of Education, 2007a).
Additionally, the competencies dealing with “previous work experience” and “quality of past
employment” are addressed through student participation in work-based learning, a key
component of CTE. All in all, a majority of the key competencies that Lippman and Keith
gleaned from their research as essential to workforce readiness are present in CTE in Georgia. It
is this comparison and a look at the previously discussed research that would lead an educator to
surmise that students who participate in CTE courses are more likely to be both college and work
ready than those who do not. Stone and Aliaga (n.d.) believe that CTE provides youth with an
introduction to the workplace and develops generalizable skills students can carry into the
workplace. Furthermore, CTE prepares youth by giving them occupation-specific workplace
skills and a context through which academic skills in math, science, and reading can be more

24
fully developed and applied. Data supporting this hypothesis was also gathered from a
longitudinal study conducted by Castello, Stone, Stringfield, Farley, and Wayman (2004). In the
study, researchers learned that students participating in CTE showed higher levels of
achievement in both reading and mathematics than those not participating in CTE. Soft skills,
another highly valued skill set to employers, were also increased when students participated in
CTE activities (Castello, Stringfield, Stone, & Wayman, 2003).
Georgia Work Ready Measurement
In order to provide a way for educators and industry to communicate effectively with
each other about the need for a skilled workforce and what that looks like to the respective
entities, Georgia’s Governor’s Office of Workforce Development adopted the ACT WorkKeys®
system as it launched the Georgia Work Ready Program in August 2006 under the direction of
Georgia Governor Sonny Perdue and the Georgia Chamber of Commerce. High schools and
communities across the state have since joined the initiative through involvement in programs
such as Georgia Certified Work Ready Communities and Get Work Ready, targeted at reaching
recent and soon-to-be high school graduates. At the core of the Georgia Work Ready program is
the Georgia Work Ready Certificate. The certificate is awarded to those who complete a series
of three assessments: Reading for Information, Locating Information, and Applied Mathematics.
Scores on each of these tests determine the level of certificate the individual receives. Once the
scores have been calculated, business and industry, as well as educators and individual certificate
holders, can compare levels of competencies gauged by the assessments with levels of
competencies determined by a specified job-profiling process to be necessary for success in
certain employment roles. If a deficiency is determined, a certificate holder can benefit from
additional general employment skills education- referred to by WorkKeys® as SkillsGap

25
training. As of December 31, 2010, more than 195,000 certificates have been awarded through
the Georgia Work Ready program, nearly 60,000 of which were awarded to students graduating
from Georgia high schools (Georgia Work Ready, 2010).
For the purposes of aligning the well-known college entrance test, the ACT, with the
ACT WorkKeys® assessments to determine both college and career readiness of a student, ACT
conducted a study to determine at which level the assessments meet the same requirements.
Because the function of the tests differ in most of the areas tested with WorkKeys®, only
Reading for Information and Applied Mathematics were studied. In “Ready for College and
Ready for Work: Same or Different?” (2006a), the process for making this determination was
explained:
To determine how workforce training readiness compares to college readiness, we
analyzed data from 476,847 high school juniors in Illinois who took the ACT, the
WorkKeys® Reading for Information Test, and the WorkKeys® Applied Mathematics
Test between 2001 and 2004…We statistically aligned the scores on the two WorkKeys®
Tests (which represent workforce training readiness) to the scores on the ACT Reading
and Mathematics Tests (which represent college readiness). (p. 10)
Through this process, it was determined that it is at level 5 on the WorkKeys® Reading for
Information and Applied Mathematics assessments that the ACT’s scores for college ready
students intersect. The WorkKeys® Locating Information assessment reveals the employers’
need for work ready students (p.10).

26
CHAPTER III
METHOD
Following the lead of career readiness credentialing programs across the United States,
Georgia Work Ready utilizes the ACT WorkKeys® assessment to measure the skills of its
existing and potential workforce in an effort to improve economic development in the state. As
one of the educational entities in this equation, high schools must make the most of the
educational experience for students, allowing for the development of career readiness skills as
early as possible. Previously referenced research suggests that career-related education provides
relevance to learning; therefore, students who enroll in the career and technical education
curriculum could be expected to possess more workplace readiness skills than those who do not.
Unlike previous studies, where students were involved in some aspect of CTE, students who are
deemed CTE students for the purposes of this study (those pursuing a CTAE diploma
endorsement) were involved in a series of CTE coursework, requiring a minimum of three units
in CTE courses.
Purpose Statement
The purpose of this study was to determine if the workplace readiness level of high school
seniors, based upon the ACT WorkKeys® assessment, was different between students pursuing a
Career, Technical, and Agricultural Education (CTAE) diploma endorsement and those pursuing
a College Predatory (CP) endorsement. A CTAE endorsement may be termed Career and
Technical Education (CTE), Tech Prep, or Vocational, depending upon the state and/or school
district granting the diploma.

27
Research Questions
The following research questions guided this study:
1. What are the levels of workplace readiness of high school seniors based on descriptive
properties of certificate levels prescribed by ACT WorkKeys® scores on Applied
Mathematics, Reading for Information, and Locating Information assessments?
2. Is there a statistically significant difference in the scores on the ACT WorkKeys®
assessment in Mathematics between high school seniors completing a Career and
Technical Education endorsement and those completing a College Preparatory
endorsement?
3. Is there a statistically significant difference in the scores on the ACT WorkKeys®
assessment in Reading for Information between high school seniors completing a Career
and Technical Education endorsement and those completing a College Preparatory
endorsement?
4. Is there a statistically significant difference in the scores on the ACT WorkKeys®
assessment in Locating Information between high school seniors completing a Career and
Technical Education endorsement and those completing a College Preparatory
endorsement?
Research Design
The research design for this study was causal comparative. This research design focused
on independent variables (IV) and dependent variables (DV). Gall, Gall, and Borg (2003) define
these two terms by stating that the independent variable is what the researcher thinks occurred
before the study was conducted, and that it had an influence on the dependent variable. In this
study, the independent and dependent variables will be as follows, where all variables are

28
categorical, where the independent variable consists of the type of diploma endorsement sought
by students, and the dependent variable is the level score for the assessment addressed in the
research question.
In this study, chi square was used for all research questions to determine if a significant
difference exists between the data sets presented. Chi square (𝑋𝑋2) is used to determine if two
categorical variables differ in their distributions (Hartman, 2000). The data used in this study
provides the level scores- presented categorically, rather than the scale scores with a numerical
value, for students taking the WorkKeys® assessments; therefore, the categorical analysis
provided by a chi square statistic is appropriate.
Causal-comparative research. The literature suggests that causal-comparative research
designs fall somewhere in the middle of experimental designs and correlational designs (Agresti,
1996; Cropley & Harris, 2004; Gall, Gall, & Borg, 2003; Gay & Airasian, 2000; Gribbons &
Herman, 1997; Johnson, B., 2001; Kelley, Clark, Brown, & Sitzia, 2003; Kravitz, 1994;
Schenker & Rumrill, 2004; Stevens, 1999). While experimental research is the most persuasive
form of analysis, correlational research is able to make fewer statements concerning definite
causal relationships. Causal-comparative designs also are placed in the middle of the continuum
when dealing with constraint levels; this is due to the lack of control the researcher holds with
these types of studies. The literature further explains, however, that each type of design has its
place in the realm of educational research.
A causal-comparative study is also referred to as ex post facto research because the
research is conducted after the relationship between the dependent and independent variable has
been formed (Gall et al, 2003). This is an advantage to an educational researcher who does not
have the authority to impose a particular program or manipulation on students. Programs that are

29
put in place by educational entities, such as CTE programs, are an excellent source of valuable
information concerning the worth of the program.
Once the relationship has been established, Gall et al. (2003) point out that a causal-
comparative design can be reworked into a correlational research design by analyzing variables
in a different way, i.e., using correlation coefficients in lieu of group means comparison. The
reasons behind this possibility stem from several similarities between these two types of studies.
First, both are considered associational research in that they attempt to establish conclusions
based on existing relationships. Both studies attempt to explain phenomena without manipulating
variables. However, some very important differences also exist. Causal-comparative research
designs compare groups, while correlational designs compare individual participants.
Correlational studies also investigate two or more quantitative variables; and causal-comparative,
as alluded to in earlier comparisons, involves one or more categorical variables.
Gall et al. (2003) explain further that most educational researchers prefer to stay with the
causal-comparative method versus the experimental or correlational methods of study because
forming groups to measure the independent variable often is more practical for educational
practitioners, and the statistical results typically are easier to comprehend and interpret.
Advantages and disadvantages. Advantages of a causal-comparative design begin with the
design itself. While an experimental design calls for manipulation of a control group, causal-
comparative studies compare naturally formed groups. This advantage is especially important in
situations where experimental manipulation is not possible due to the practicality, which is the
case in this study, or ethical issues involved in the possible manipulation of the groups, which
could again play a role in the manipulation of student groups (Schenker & Rumrill, 2004).

30
Another advantage is that many researchers see the groups that are naturally formed and
studied through this method to be more consistent with how the world is viewed by stakeholders,
especially those in the realm of educational research. This design also gives the option of
including one or several variables, either independent or dependent, leaving the researcher the
flexibility to explore many different relationships with one study. Furthermore, the results
typically are easier to interpret and mean more to the average educational researcher (Gall, Gall,
& Borg, 2003).
The major disadvantage of a causal-comparative design is that it is difficult to make
definite or permanent statements about causal patterns. Because there is not a way to account for
all possible independent variables or outside influences on the dependent variable, there is
always the possibility that something other than the variables considered in the study influenced
the results. In this case it is necessary for researchers to decide if they are looking at univariate or
multivariate relationships. Many causal-comparative studies will use a multivariate analysis to
take into account the relationships among all of the independent variables as an explanation for
change to the dependent variable. Once this determination has been made, steps can be taken to
help account for extraneous variables’ effect on the outcome of the study (Cropley & Harris,
2004; Gall et al., 2003; Gibbons & Herman, 1997; Wainer, Holland, Swinton, & Wang, 1985).
Methods for controlling the effect of extraneous variables on the dependent variable in a
causal-comparative study include matching. Matching necessitates the presence of a participant
from each group to represent levels of the control variable. Another way to combat extraneous
variables’ effect on a causal-comparative study is to compare homogeneous groups. While this
method may limit the number of participants, it would help to control extraneous variables
(Schenker & Rumrill, 2004). For the purposes of this study, matching was used to account for

31
the effect of extraneous variables. The sample was matched based upon gender, race, semester,
and diploma track.
Internal and external validity. Schenker and Rumrill (2004) report that the internal
validity of causal-comparative designs cannot be guaranteed, due to the fact that the independent
variables are not manipulated. Because the groups already existed and had established inherent
differences, other variables may be the actual causes of the changes in the dependent variable;
therefore, some other areas of consideration are necessary to support internal validity of the
study. In order to help eliminate some of the threat when considering other variables of
influence, the researcher should consider alternative hypotheses that take into account “strong
inference,” selected variables that are considered plausible causes for the effect (Gall, Gall, &
Borg, 2003). Much of this can be accomplished by studying past theories that may explain or
pinpoint extraneous variables that cause such an effect.
Experimental designs normally demonstrate stronger internal validity; however, most
causal-comparative designs can claim to produce more external validity, which is of more value
for the overall significance of the study when internal validity is not as strong. As with other
types of research, causal-comparative studies increase external validity in various ways, but the
strongest establishment comes from the random selection of participants included in the research
sample from the larger population and by securing the largest sample possible (Schenker &
Rumrill, 2004). However, this still may not be possible due to legal, ethical, or practical
restraints; this does not mean that external validity is lost to the study. Another method for
increasing external validity is to choose groups that are as similar in as many demographic
categories as possible (Kravitz, 1994). External validity is also increased due the fact that there is
no manipulation to the natural settings.

32
Instrumentation
Known to most as a testing company that produces testing materials for college entrance
requirements, ACT is a well-respected company in education and recognizable to the general
population. According to ACT’s website (2010a), “originally, ‘ACT’ stood for American
College Testing. In 1996, however, the official name of the organization was shortened to simply
‘ACT.’ This change in the official company name was made to better reflect the broad array of
programs and services we now offer beyond college entrance testing” (para. 2). The instrument
for this study, ACT’s WorkKeys® assessment, has been tested by ACT, as well as independent
researchers for validity and reliability. ACT produced a White Paper on WorkKeys® Validation
in 2002. The use of content validity and procedures for establishing validity of the WorkKeys®
system (including both the assessments and the job profiling component) contain the following
criteria:
1. The way in which the generic skill is assessed is generally congruent with the way the
skill is used in the workplace.
2. The lowest level assessed is at approximately the lowest level for which an employer
would be interested in setting a standard.
3. The highest level assessed is at approximately the level beyond which specialized
training would be required.
4. The steps between the lowest and highest levels are large enough to be distinguished
and small enough to have a practical value in documenting workplace skills.
5. The assessments are sufficiently reliable for high stakes decision making.
6. The assessments can be validated against empirical criteria.

33
7. The assessments are feasible with respect to administration time and complexity, as
well as cost. (ACT White Paper, 2002, p. 9)
Validity and reliability of this instrument are discussed fully later in this chapter.
The ACT's WorkKeys® program measures employability skills in these eight areas:
Applied Mathematics, Applied Technology, Listening, Locating Information, Observation,
Reading for Information, Teamwork, and Writing (ACT, 2010b). Students in Georgia’s Get
Work Ready program are tested in three of the eight areas: Applied Mathematics, Locating
Information, and Reading for Information. These are the three tests necessary for examinees to
earn a National Career Readiness Certificate from ACT, as well as a Georgia Work Ready
Certificate. The test is available in two formats: pencil/paper and WorkKeys® Internet Version
(WKIV). The scoring of the WorkKeys® assessments is determined by the number of questions
answered correctly. For each correct response, scores are calculated based upon the level score
that the skill in the question demonstrates. Overall, there are five levels involved in the scoring
of the WorkKeys® assessments. Level 3 is the least complex. The levels build on each other,
each incorporating the skills assessed in the previous levels, until Level 7 is obtained (ACT,
2010b). Each assessment also includes a scale score, with a range of 25 points, beginning at 65
and reaching its maximum at 90 (ACT, 2010b). The scale scores for the WorkKeys® tests were
developed using the equal standard of measurement methodology developed by Kolen (1988)
and arcsine transformation developed by Freeman and Tukey (1950) to stabilize error variance. It
is based upon the number-correct scores, which put examinees in order with respect to ability;
however, the differences in scale scores do not necessarily demonstrate equal differences in
ability (ACT, 2006b)

34
After being assigned to a computer lab at their base high schools, participants in this study
were given the WKIV of the assessment. Participants were tested in the originally assigned lab
each day during the class period during fall semester in which they were scheduled to take their
senior English class. Students completed one assessment each day over a consecutive three-day
period: 50 minutes to complete each section of the exam, for a total of 150 minutes. Applied
Mathematics and Reading for Information contain 33 multiple-choice items each and provide a
range of level scores from 3-7. Locating Information contains 38 multiple-choice items and
provides for a level score of 3-6.
As referenced above, the two types of WorkKeys® Scores are level scores and scale
scores. A level score in each of the assessments is for use in selection, promotion, or other
individual high-stakes situations. Level scores are used by employers to decide who to hire and
promote. They are based on WorkKeys® job profiles—a snapshot of the skills needed for a
particular job. The scale scores are used to show growth over time, to provide group
comparisons in outcome measurement, or to show evidence of ability to benefit. Both the scale
score and the level score are functions of the raw score based upon correct responses. The
number-correct scores put the examinees in order with respect to ability, but the differences
between the values do not necessarily represent differences in ability. An examinee is given both
of these scores in his/her score report once the assessment is complete. Both sets of scores hold
valuable information; however, the most precise of these is the scale score. The same method
used to scale the ACT Assessment tests, the equal standard error of measurement methodology
developed by Kolen (1988), was used to develop the Scale Scores for the WorkKeys® tests. In
order to ensure maximum measurement precision, ACT researchers chose for the total number of
Scale Score points to be less than the total number-correct score points in the each of the

35
WorkKeys® tests (ACT, 2006b). As a matter of comparison, Table 1 represents the skills
illustrated in each level score and its corresponding scale score for each assessment.
Table 1
Level Score Contents and Scale Score Requirements of ACT WorkKeys® Assessments
Applied Mathematics Reading for Information Locating Information
Level 3 (Bronze)
Scale Score= 71-74
Solve problems that require a single type of mathematics operation (addition, subtraction, multiplication, and division) using whole numbers
Add or subtract negative numbers
Change numbers from one form to another using whole numbers, fractions, decimals, or percentages
Convert simple money and time units (e.g., hours to minutes)
Scale Score= 73-74
Identify main ideas and clearly stated details
Choose the correct meaning of a word that is clearly defined in the reading
Choose the correct meaning of common, everyday workplace words
Choose when to perform each step in a short series of steps
Apply instructions to a situation that is the same as the one in the reading materials
Scale Score= 72-74
Find one or two pieces of information in a graphic
Fill in one or two pieces of information that are missing from a graphic
Level 4 (Silver)
Scale Score= 75-77 Solve problems that require one or two operations Multiply negative numbers Calculate averages, simple ratios, simple proportions, or rates using whole numbers and decimals Add commonly known fractions, decimals, or percentages (e.g., 1/2, .75, 25%) Add up to three fractions that share a common
Scale Score= 75-78
Identify important details that may not be clearly stated
Use the reading material to figure out the meaning of words that are not defined
Apply instructions with several steps to a situation that is the same as the situation in the reading materials
Choose what to do when changing conditions call for a different action (follow directions that include "if-then" statements)
Scale Score= 75-79
Find several pieces of information in one or two graphics
Understand how graphics are related to each other
Summarize information from one or two straightforward graphics
Identify trends shown in one or two straightforward graphics
Compare information and trends shown in one
(continued)

36
denominator Multiply a mixed number by a whole number or decimal Put the information in the right order before performing calculations
or two straightforward graphics
Level 5 (Gold) Level at which one is deemed college or career ready in both Applied Mathematics and Reading for Information assessments
Scale Score= 78-81
Decide what information, calculations, or unit conversions to use to solve the problem
Look up a formula and perform single-step conversions within or between systems of measurement
Calculate using mixed units (e.g., 3.5 hours and 4 hours 30 minutes)
Divide negative numbers
Find the best deal using one- and two-step calculations and then compare results
Calculate perimeters and areas of basic shapes (rectangles and circles)
Calculate percent discounts or markups
Scale Score= 79-81
Figure out the correct meaning of a word based on how the word is used
Identify the correct meaning of an acronym that is defined in the document
Identify the paraphrased definition of a technical term or jargon that is defined in the document
Apply technical terms and jargon and relate them to stated situations
Apply straightforward instructions to a new situation that is similar to the one described in the material
Apply complex instructions that include conditionals to situations described in the materials
Scale Score= 80-86
Sort through distracting information
Summarize information from one or more detailed graphics Identify trends shown in one or more detailed or complicated graphics
Compare information and trends from one or more complicated graphics
Level 6 (Platinum)
Scale Score= 82-86
Use fractions, negative numbers, ratios, percentages, or mixed numbers
Rearrange a formula before solving a problem
Use two formulas to change from one unit to another within the same system of measurement
Use two formulas to change from one unit in one system of
Scale Score= 82-84
Identify implied details
Use technical terms and jargon in new situations
Figure out the less common meaning of a word based on the context
Apply complicated instructions to new situations
Figure out the principles behind policies, rules, and procedures
Scale Score= 87-90
Draw conclusions based on one complicated graphic or several related graphics
Apply information from one or more complicated graphics to specific situations
Use the information to make decisions
(continued)

37
measurement to a unit in another system of measurement
Find mistakes in questions that belong at Levels 3, 4, and 5
Find the best deal and use the result for another calculation
Find areas of basic shapes when it may be necessary to rearrange the formula, convert units of measurement in the calculations, or use the result in further calculations
Find the volume of rectangular solids
Calculate multiple rates
Apply general principles from the materials to similar and new situations
Explain the rationale behind a procedure, policy, or communication
Level 7 (Platinum)
Scale Score= 87-90
Solve problems that include nonlinear functions and/or that involve more than one unknown
Find mistakes in Level 6 questions
Convert between systems of measurement that involve fractions, mixed numbers, decimals, and/or percentages
Calculate multiple areas and volumes of spheres, cylinders, or cones
Set up and manipulate complex ratios or proportions
Find the best deal when there are several choices
Apply basic statistical concepts
Scale Score= 85-90
Figure out the definitions of difficult, uncommon words based on how they are used
Figure out the meaning of jargon or technical terms based on how they are used
Figure out the general principles behind policies and apply them to situations that are quite different from any described in the materials
-
Table 1. Level Score Contents and Scale Score Requirements for Each WorkKeys® Level Score. ACT. (2006). Scale Score Interpretation Guide, p. 9 and ACT. (2010b).WorkKeys®. Note. The maximum score is reached at level 6 in the Locating Information assessment; therefore, no scale score or requirements are listed for level 7 of this assessment.

38
Validity. Each of the three assessments utilized in determining certificate levels was
developed through a multi-faceted approach to validity. The technical manuals for each of the
assessments published by ACT in 2008 name three types of validity evidence to justify the use of
each of the assessments: construct-related validity, criterion-related validity, and content-related
validity. Evidence was accumulated through both validity studies and student and employee data
collections.
Reading for information. Construct-related validity of Reading for Information (RfI) test
scores was supported through an examination of this assessment and the ACT reading and
English tests used to measure prerequisite language skills identified as necessary for success in
entry-level college courses. The process began with test development and continued until a
pattern of relationships between test scores and other relevant variables indicated what the test
scores meant. Implications of these results are that the tests are moderately correlated at the .62
level when comparing RfI and ACT Reading and the .66 level when comparing RfI with ACT
English and share many similarities (ACT, 2008c).
ACT gathered support for criterion-related validity of Reading for Information test scores
through a study of these test scores and the job performance ratings of employees. Performance
ratings in these studies ranged from .12 to .86, illustrating favorable correlations between the
two, given that typical research literature on criterion-related validity establishes correlations at
.20 to .30. Additionally, ACT conducted classification consistency studies to compare the
incumbent employees’ job performance classification to their classification determined by
Reading for Information skill level. The outcome of these studies found that 79 % of employees
were categorized the same way by both measures (ACT, 2008c).

39
Content-related validity was supported through an analysis of WorkKeys® Job Profiling
and the SkillMap Job Inventory, both of which meet federal standards for content validity of
employment tests used for high-stakes personnel decisions (ACT, 2008c). The conclusion from
this study indicated that, “The WorkKeys® system, when used appropriately, provides evidence
that there is a relationship between the content of the WorkKeys® assessments and the content of
a specified job, occupation or curriculum” (p. 61).
Applied mathematics. Like in the Reading for Information assessment’s comparison with
the ACT reading and English tests, construct-related validity was developed through a study
correlating scores on the Applied Mathematics assessment and the ACT Mathematics test. The
correlations indicated that Applied Mathematics scores were highly correlated with ACT
Mathematics test scores, showing correlation coefficients between .71 and .81. ACT found
evidence of construct validity through a strong relationship between Applied Mathematics and
ACT Mathematics scores (ACT, 2008a).
Criterion-related evidence for the validity of the Applied Mathematics assessment was
garnered through a study of the test scores and job performance ratings of job incumbents.
Correlations compared favorable, ranging from .23 to .41, to general research correlations of .20
to.30 to support criterion-related validity. As with the Reading for Information test, criterion-
related validity was measured through classification consistency, examining the percentage of
employees correctly classified by the test. In the study, supervisor ratings were used as the
second measure of classification, while WorkKeys® assessments were the first. The comparison
of the two measures yielded a range of 57 % to 90 % of employees who were classified the same
way by both measures (ACT, 2008a).

40
Finally, as with the other WorkKeys® assessments, ACT utilized content-related validity
evidence in the Applied Mathematics test through job analysis using WorkKeys® Job Profiling
and SkillMap procedures. By linking test scores to the set of job behaviors or job outcomes of
interest, content-related validity in employment settings was established. The conclusion of this
study was much the same as the previously described assessment in that evidence supports the
relationship between job profiling and the WorkKeys® assessment (ACT, 2008a).
Locating information. ACT collected criterion-related and content-related evidence of
validity to justify the use of Locating Information scores as part of the WorkKeys® system. To
support the criterion-related validity of the assessment, ACT studied data from various
organizations. This data illustrated the correlation between test scores and job performance.
These correlation coefficient ratings ranged from .14 to .42, which compares favorably with the
correlations found in general research literature on criterion-related validity of employment tests.
ACT also conducted classification consistency studies. These studies were used to compare the
employees’ job performance classification to their classification by skill level as indicated by the
Locating Information assessment. The percentage of employees classified the same way by both
measures ranged from 37 % to 100 % (ACT, 2008b).
Content-related validity of Locating Information test scores was supported through the use
of two job analysis procedures, WorkKeys® Job Profiling and the SkillMap Job Inventory.
These procedures are used to link skill levels to relevant job behaviors and are both designed to
meet federal standards and other industry guidelines for content validation of employment tests
used for high-stakes decisions. Both procedures were used to ultimately define the skill needed
for accomplishing job tasks (ACT, 2008b).

41
Reliability. Reliability, while not the sole component, is a necessity of a valid instrument
(Lee, 2004). Gall et al.’s (2003) glossary defines two sectors of reliability. In case study research,
[it is] the extent to which other researchers would arrive at similar results if they studied the
same case using exactly the same procedures as the first researcher. In classical test theory, [it is]
the amount of measurement error in the scores yielded by a test (p. 635).
The authors further describe the measurement error as the “difference between an individual’s
true score on a test and the scores that she actually obtains on it over a variety of conditions” (p.
196). Since the instrument being used in this study has been used in a variety of settings and
within a variety of studies, measurement error in this regard is not an issue.
Reliability and consistency of data collection go hand-in-hand. One type of measurement
error comes from the people who are administering or scoring the test. If rules are not followed
exactly, error can occur. In this research study, students were tested under very similar
conditions, and the tests were administered by the same ACT-trained test administrators (Lee,
2004). Because WorkKeys® tests are considered high-stakes, anyone who administers the
assessments or operates a testing center is required to complete a training program (ACT,
2010b).
ACT utilized a variety of estimation techniques to evaluate the reliability of test scores in
each of the assessments utilized in the WorkKeys® system. The first of these measures is that of
internal consistency, which measures the consistency within a test by comparing all items with
each other. ACT utilized two data sets with a collective sample size of 244,124 high school
students. The reliability coefficient for the two forms of the Reading for Information assessment
was .82 for Form A and .90 for Form B (ACT, 2008c). Applied Mathematics produced a
reliability coefficient of .92 on both forms. Locating Information was computed utilizing data
42
sets obtained in a scaling study (ACT, 2008a). The resulting reliability coefficients on the three
forms of the assessment were .79, .83, and .79 (ACT, 2008b).
Selection of Sample
Gordon County is the only remaining non-metropolitan county along the I-75 corridor
between Atlanta, GA, and Chattanooga, TN. According to the 2010 Census, 79.8% of the
residents responded they were white, non-Hispanic; and 3.8% of Gordon County’s citizens
responded they were black. Hispanics made up 14.6% of the county’s population. Gordon
County’s 2009 estimated population was 53,292, which is an increase of 10.4% in five years
(Gordon County Board of Commissioners, 2009). The two high schools within the Gordon
County School district provided the participants in this study. The current enrollment for
Gordon Central High School is 862, and Sonoraville High School enrolls 1052 students. As is
reflective of the demographics of the county itself, the fastest growing population at Gordon
Central High School and Sonoraville High School is the Hispanic population, which has
increased 5.2% since 1999-2000 (J. Clance, personal communication, November 2010). This is
attributed to the large number of manufacturing jobs available in this area. While the current
recession has lowered the number significantly from most recent reports, 2010 numbers support
this statement. Table 2 reflects a comparison of the demographics of both the school system and
the county at large (Governor’s Office of Student Achievement, 2008-09 & Gordon County
Board of Commissioners, 2009).

43
Table 2
Race/Ethnicity of Gordon County, Georgia and the Gordon County School District
Race/Ethnicity Gordon County (2009)
Gordon County School District
(2008-2009) Asian 0.9% 1%
Black 3.8% 2%
Hispanic 14.6% 13%
Native American/ Alaskan Native
0.6% 0%
White 79.8% 83%
Multiracial 0.9% 2%
The sample mirrored the population of the school and, in turn, the population of Gordon County.
In order to accommodate the variance in population within the school, a matching participant
selection was used for sample selection. All participants were drawn from the 2010-2011 senior
classes of both Sonoraville High School and Gordon Central High School, and accessible data
from school officials provided necessary information on diploma track. All seniors who were
enrolled in a senior English class during fall semester of their senior year in 2010-11 took the
WorkKeys® assessment. In comparing attendance records for this date, it was discovered that
11 students did not test on one or more sections of the WorkKeys® assessment. The matching
sample began with the 172 students who completed all three assessments during the same
semester, leading to an increased homogeneity of the two groups (Gall, Gall, & Borg, 2003).
Procedure
Seniors from both district high schools were tested utilizing the ACT WorkKeys®
Assessment during the fall or spring of their senior year, dependent upon when their senior

44
English class was scheduled. All students in this study were tested during the fall 2011 semester.
The student information coordinator for Gordon County Schools provided scores from these tests
for each student, along with each student’s graduation track. The students were identified
through the use of a computer-generated identification number assigned through SchoolMax®,
Gordon County School’s student information system. The list also included ethnicity and gender
for each student to be utilized for matching criteria.
Once the list was generated, the students were divided into two categories: students who
completed a CTE concentration, thus earning a tech prep or dual diploma, and students who
earned a college preparatory diploma and did not complete a CTE program of study. Each
category was randomly sorted by the students’ SchoolMax® ID number. The two categories
were compared and matched in number and demographics to obtain the highest matching sample
possible with the participants available through this study. Once the categories were established,
analysis was conducted to determine the maximum number of participants to represent each
category. Because there were 84 students in the CP endorsement category and 89 representing
CTE endorsement, 84 was determined to be the maximum number of participants in either group.
This led to the matching step of the selection process.
Within each category, students were separated into subcategories by gender. After these
sub-categories were established, the participant groups were analyzed for representation of
ethnicity. This process eliminated two additional participants from the category representing the
independent variable of the CP diploma track, yielding a maximum sample size n= 164, where
84 participants are assigned to either category. Table 3 details the make-up of the two categories
after the matching process was completed.

45
Table 3
Demographic Makeup of Matching Sample
N=164 Black Females
Black Males
Hispanic Females
Hispanic Males
White Females
White Males
CTE (n=82) 1 2 6 3 40 30
CP (n=82) 1 2 6 3 40 30
From the 172 participants who took all three assessments, only .046% were eliminated
from the sample through the matching process. Those eliminated were students that did not have
a match in the adjacent category. Matching was based upon numerical ordering of participants in
each of the sub categories as determined by SchoolMax® ID. The makeup of the sample closely
mirrors the make up of the total population of both Gordon County and the Gordon County
school system.
Data Analysis
In the study at hand, an analysis of the descriptive statistics of the workplace readiness
levels of high school students who pursue a CTE endorsement was completed. The research
questions in this study dealt with categorical data with the inclusion of scores on the ACT
WorkKeys® assessment.
All questions were stated as difference hypotheses, and sample selections were considered
correlated samples due to the pre-determined placement of the students into groups and the
matching sample that was collected. The sample included two categories of students: the students
who chose a CTE concentration, thus earning a technical preparatory or dual diploma, and
students who earned a college preparatory diploma and did not complete a CTE program of
study. The data obtained from the ACT WorkKeys® Assessment included the following for
each the sample: the type of Certificate earned and Applied Mathematics, Reading for

46
Information, and Locating Information assessment scores for each participant. The two
categories, CTE track and CP track were compared within each of the three samples, based on
the type of Certificate earned, and level scores on Applied Mathematics, Reading for
Information, and Locating Information assessments.
Table 4 depicts the statistical procedure utilized for each of the research questions in this
study. The independent and dependent variables are also noted. The data collected was
categorical, therefore, chi-square statistical tests were performed to evaluate if the student
academic performance on the ACT WorkKeys® assessments was related to whether the students
were enrolled in CTE or CP tracks. The significance level chosen is 0.05.
Table 4
Research Questions and Analysis Strategy Research Question Independent
Variable(s) Dependent Variable
Statistical Procedure
What are the levels of workplace readiness of high school seniors based on descriptive properties of certificate levels prescribed by ACT WorkKeys® scores on Applied Mathematics, Reading for Information, and Locating Information assessments?
Diploma Endorsement
Descriptive Statistics
Is there a statistically significant difference in the scores on the ACT WorkKeys® assessment in Mathematics between high school seniors completing a Career and Technical Education endorsement and those completing a College Preparatory endorsement?
Diploma Endorsement
ACT WorkKeys® Applied Mathematics Level Scores
Chi Square
Is there a statistically significant difference in the scores on the ACT WorkKeys® assessment in Reading for Information between high school seniors completing a Career and Technical Education endorsement and those completing a College Preparatory endorsement?
Diploma Endorsement
ACT WorkKeys® Reading for Information Level Scores
Chi Square
Is there a statistically significant difference in the scores on the ACT WorkKeys® assessment in Locating Information between high school seniors completing a Career and Technical Education endorsement and those completing a College Preparatory endorsement?
Diploma Endorsement
ACT WorkKeys® Locating Information Level Scores
Chi Square

47
Chi square analysis. In this study, chi square was used for all research questions to
determine if a significant difference existed between the data sets presented. Chi square (𝑋𝑋2) is
used to determine if two categorical variables differ in their distributions. It is calculated
utilizing the formula 𝑋𝑋2 = ∑ (𝑂𝑂𝑂𝑂𝑂𝑂𝑂𝑂𝑂𝑂𝑂𝑂𝑂𝑂𝑂𝑂 𝐹𝐹𝑂𝑂𝑂𝑂𝐹𝐹𝐹𝐹𝑂𝑂𝐹𝐹𝐹𝐹𝐹𝐹 −𝐸𝐸𝐸𝐸𝐸𝐸𝑂𝑂𝐹𝐹𝐸𝐸𝑂𝑂𝑂𝑂 𝐹𝐹𝑂𝑂𝑂𝑂𝐹𝐹𝐹𝐹𝑂𝑂𝐹𝐹𝐹𝐹𝐹𝐹 )²𝐸𝐸𝐸𝐸𝐸𝐸𝑂𝑂𝐹𝐹𝐸𝐸𝑂𝑂𝑂𝑂 𝐹𝐹𝑂𝑂𝑂𝑂𝐹𝐹𝐹𝐹𝑂𝑂𝐹𝐹𝐹𝐹𝐹𝐹
(Hartman, 2000). The data
used in this study provides the level scores- presented categorically, rather than the scale scores
with a numerical value, for students taking the WorkKeys® assessments; therefore, the
categorical analysis provided by a chi square statistic is appropriate.
Effect size. Effect size measures the size of the difference that exists between the two
groups that are measured. It can be applied to any outcome in studies of education or social
science. Instead of allowing for an answer to whether or not an intervention works, it answers
how well the intervention works. The use of an effect size with a confidence interval gives the
same information as a test of statistical significance. When the information is given this way,
however, it emphasizes the significance of the effect, rather than the size of the sample as would
occur with other significance testing (Coe, 2002) In the case of chi-square analysis, Cohen’s w
or phi is used to determine effect size. Cohen’s w can be derived utilizing the following formula:
𝑤𝑤 = �∑ (𝑃𝑃𝑂𝑂𝑃𝑃𝐸𝐸 𝑃𝑃𝑂𝑂𝐸𝐸𝑜𝑜𝑃𝑃𝐹𝐹 𝐸𝐸𝐸𝐸𝐸𝐸𝑂𝑂𝐹𝐹𝐸𝐸𝑂𝑂𝑂𝑂 −𝑃𝑃𝑂𝑂𝑃𝑃𝐸𝐸𝑃𝑃𝑂𝑂𝐸𝐸𝑜𝑜𝑃𝑃𝐹𝐹 𝑂𝑂𝑂𝑂𝑂𝑂𝑂𝑂𝑂𝑂𝑂𝑂𝑂𝑂𝑂𝑂 )²𝑃𝑃𝑂𝑂𝑃𝑃𝐸𝐸𝑃𝑃𝑂𝑂𝐸𝐸𝑜𝑜𝑃𝑃𝐹𝐹 𝐸𝐸𝐸𝐸𝐸𝐸𝑂𝑂𝐹𝐹𝐸𝐸𝑂𝑂𝑂𝑂
. Phi can be calculated ∅ = �X²N
. For both
Cohen’s w and phi, .10 illustrates a small effect size, .30, a medium effect size, and .50, a large
effect size (Hartman, 2000). Because no significant difference was found in this study, however,
no effect size was established.

48
CHAPTER IV
DATA ANALYSIS
The purpose of this study was to determine if the workplace readiness level of high school
seniors based upon the ACT WorkKeys® assessment was different between students pursuing a
Career, Technical, and Agricultural Education (CTAE) diploma endorsement and those who
were not. To obtain the data for this study, a matching random sample was taken from available
data in the school system database. In order to obtain the sample used, students were divided
into two categories: students who completed a CTE concentration, thus earning a tech prep or
dual diploma, and students who earned a college preparatory diploma and did not complete a
CTE program of study. Each category was randomly sorted by the students’ SchoolMax® ID
number. The two categories were compared and matched in number and demographics to obtain
the highest matching sample possible with the participants available through this study. Once the
categories were established, analysis was conducted to determine the maximum number of
participants to represent each category. Because there were 84 students in the CP endorsement
category and 89 representing CTE endorsement, 84 was determined to be the maximum number
of participants in either group. This led to the matching step of the selection process.
Within each category, students were separated into subcategories by gender. After these
sub-categories were established, the participant groups were analyzed for representation of
ethnicity. This process eliminated two additional participants from the category representing the
independent variable of the CP diploma track, yielding a maximum sample size n= 82 for either
category, where N=164.

49
Upon obtaining the matching sample, an analysis of the available data established that only
level scores were available on each participant in each of the data sets, along with the certificate
level earned by each student. Scale scores are not made available by the participating testing
agency to students who test in a high school environment (Patty Hart, personal communication,
April 14, 2011). Through further analysis of the available data set, level scores are not
represented at the 1 or 2 level, instead scores are represented as <3, which is a common
representation and function of the WorkKeys® assessments. The sample included two
categories of students: the students who chose a CTE concentration, thus earning a technical
preparatory or dual diploma, and students who earned a college preparatory diploma and did not
complete a CTE program of study. The data obtained from the ACT WorkKeys® Assessments
included the following for the sample: the type of Certificate earned and the scale scores for
Applied Mathematics, Reading for Information, and Locating Information assessments. The two
categories, CTE track and a college preparatory track, were compared within each of the three
samples, based on the type of Certificate earned and scores on Applied Mathematics, Reading for
Information, and Locating Information assessments.
The research hypothesis stated: there is a relationship between the track chosen, CTE or
CP, and the performance on the ACT WorkKeys® Assessment. The data collected is categorical;
therefore, chi-square statistical tests were performed to evaluate if the student academic
performance on the ACT WorkKeys® Assessment is related to whether the students are enrolled
in CTE or CP tracks.
Research Question 1
What are the levels of workplace readiness of high school seniors based on descriptive
properties of certificate levels prescribed by ACT WorkKeys® scores on Applied Mathematics,

50
Reading for Information, and Locating Information assessments? Each certificate level is based
upon the lowest level score in each of the three assessments: Applied Mathematics, Reading for
Information, and Locating Information. Those who score a minimum of 6 on each of the three
areas earn a platinum certificate and are considered to possess the foundational skills for 95% of
the jobs in the WorkKeys® database. Gold certificate holders had a minimum level score of 5
on each o the three assessments and have the necessary foundational skills for 90% of jobs in the
WorkKeys® database. Silver certificates represent a minimum score of level 4 and foundational
skills for 65% of jobs in the WorkKeys® database, while Bronze represents a minimum level
score of 3 on all 3 assessments and foundational skills for 35% of jobs in the WorkKeys®
database (ACT, 2010c, p. 4).
Table 5 illustrates the data related to the number of Work Ready Certificates earned by
participants in the study based upon the level scores of the participants on the three WorkKeys®
assessments collectively.
Table 5 Total Number of Work Ready Certificates Earned
n None Bronze Silver Gold Platinum
Total Certificates
Earned CTE 82 8 22 40 10 2 74 9.8% 26.8% 48.8% 12.2% 2.4% 90.2%
CP 82 5 16 45 16 0 77 6.1% 19.5% 54.9% 19.5% 0.0% 93.9%
As demonstrated in Table 5, 74 students on the CTE track earned a WorkKeys®
certificate, while 77 students on CP track earned a certificate. However, two students, or 2.4%,
on the CTE track earned the highest certificate possible with this assessment – platinum, while
no students on CP track earned a platinum certificate.

51
Research Question 2
Is there a statistically significant difference in the scores on the ACT WorkKeys®
assessment in Mathematics between high school seniors completing a Career and Technical
Education endorsement and those completing a College Preparatory endorsement?
As illustrated in Table 6, 164 participants’ scores on this assessment were analyzed.
Table 6
Applied Mathematics Assessment Scores
n <3 3 4 5 6 7
CTE Track 82 3 8 20 25 24 2
3.7% 9.8% 24.4% 30.5% 29.3% 2.4%
CP Track 82 2 10 14 37 16 3
2.4% 12.2% 17.1% 45.1% 19.5% 3.7%
Note. A score of 5 or higher on this assessment is what ACT deems as the level at which a student is college ready in the area of mathematics.
In Table 6, <3 is a representation of a level score that was less than level 3. Any examinee
in this category would not earn a certificate; this is due to the fact that the minimum level score
requirements would not have been met in all three areas. The calculated chi-square is 5.6 (n =
164). A chi-square of 5.6 with five degrees of freedom corresponds to the probability level of
0.347 (p = 0.347, n = 164), which is greater than the specified alpha level of 0.05. Therefore, the
null hypothesis that there is no relationship between the track chosen and the work readiness of
high school students based upon performance on the ACT WorkKeys® Applied Mathematics
Assessment taken by the participants from the sample cannot be rejected. Because no significant
findings were presented here, no effect size was established.

52
Research Question 3
Is there a statistically significant difference in the scores on the ACT WorkKeys®
assessment in Reading for Information between high school seniors completing a Career and
Technical Education endorsement and those completing a College Preparatory endorsement?
Table 7 Reading for Information Assessment Scores
N <3 3 4 5 6 7
CTE Track 82 0 0 29 32 16 5
0.0% 0.0% 35.4% 39.0% 19.5% 6.1%
CP Track 82 1 1 20 32 22 4
1.2% 1.2% 24.4% 41.5% 26.8% 4.9%
Note. A score of 5 or higher on this assessment is what ACT deems as the level at which as student is college ready in the area of reading/ELA.
In Table 7, <3 is a representation of a level score that was less than level 3. Any examinee
in this category would not earn a certificate; this is due to the fact that the minimum level score
requirements would not have been met in all three areas. Analysis of the descriptive properties
for the data set in Table 7 found the median and mode of the data for the participants on both
tracks was level five. However, 100% of the participants on CTE track scored on the levels three
and higher (passing levels) on this assessment; while 98.8 % of the participants on CP track
scored on the levels of three and above. Five participants on CTE track scored on the highest
possible level of seven. Four participants on CP track performed on level seven. Sixty-four and
six tenths percent of the participants on CTE track performed on the levels of five and up.
Seventy-three and two tenths percent of the participants on CP track scored on the levels of five
and up.

53
The computed chi-square for the data is 4.77 (N=82). This chi-square with the five degrees
of freedom corresponds to the probability level of 0.444 (p = 0.444, N = 82), which is greater
than the alpha level of 0.05, as specified in this research. Therefore, the probability level does not
fall into the null hypothesis rejection region. The null hypothesis that there is no relationship
between the track chosen and the performance on the ACT WorkKeys® Reading for Information
Assessment taken by participants in the sample cannot be rejected. Because no significant
findings were presented here, no effect size was established.
Research Question 4
Is there a statistically significant difference in the scores on the ACT WorkKeys®
assessment in Locating Information between high school seniors completing a Career and
Technical Education endorsement and those completing a College Preparatory endorsement?
Results are presented in Table 8.
Table 8
Locating Information Assessment Scores
N <3 3 4 5 6
CTE Track 82 6 21 42 11 2
7.3% 25.6% 51.2% 13.4% 2.4%
CP Track 82 4 13 50 15 0
4.9% 15.9% 61.0% 18.3% 0
Note. The Locating Information assessment does not score above a level 6; therefore, level 7 is omitted from this Table. The Locating Information assessment is not paralleled to college ready data. In Table 8, <3 is a representation of a level score that was less than level 3. Any examinee
in this category would not earn a certificate; this is due to the fact that the minimum level score
requirements would not have been met in all three areas. Table 8 reflects that 92.7% of the
participants on the CTE track scored on the levels three and higher (passing levels) on the

54
assessment. Ninety-five and one tenth percent of the participants on CP track scored three and
higher (passing scores) on the assessment. Two participants on CTE track scored on the highest
possible level of six. No participants on CP track performed on the highest level of six.
The chi-square for the data is 5.59. This chi-square with four degrees of freedom
corresponds to the probability level of 0.232 (p = 0.232, N = 82), which is greater than the alpha
level of 0.05. Therefore, the null hypothesis that there is no relationship between the track chosen
and the performance on the ACT WorkKeys® Locating Information Assessment as shown by the
data in the sample cannot be rejected. Because no significant findings were presented here, no
effect size was established.

55
CHAPTER V
SUMMARY, CONCLUSIONS, AND RECOMMENDATIONS
This chapter contains a recap of the background and purposes of the study, beginning with
a restatement of the research questions and findings for each. Also included are the conclusions
that can be drawn from the research, as supported by the theoretical framework provided in
Chapter II. This section also provides recommendations of practice and continued research that
should be considered.
Rationale
Historically much negative stigma has been attached to career and technical education
(CTE) in the United States. The Smith-Hughes Act provided the basis for the exploration of CTE
in the United States. Also known as the Vocational Act of 1917, it granted the first national
approval for vocational education in the public school. Targeted at students over the age of 14,
the legislation was aimed at workforce education, not postsecondary education preparation. The
Act was later expanded to include federal assistance for teacher education and construction of
vocational education facilities. Carl D. Perkins Act of 1997 (also known as Perkins III) was the
official piece of legislation to repeal the Smith-Hughes Act, providing new direction to
vocational education that would encourage integration of academic and vocational content, rather
than the explicit separation outlined in the Smith-Hughes Act (Vocational Education Act of
1917, n.d.). Under its reauthorization, Carl D. Perkins legislation, deemed Perkins IV, student
academic achievement was to be measured by the academic assessments a state has approved
under No Child Left Behind. Even with all of the changes to Perkins legislation in an effort to

56
ensure accountability, a disconnect remains among stakeholders in career and technical
education. It is for this reason that a common language to discuss the level of workplace
readiness among all stakeholders becomes a necessity.
Purpose
The purpose of this causal-comparative study was to determine if the workplace readiness
level of high school seniors, based upon student performance on the ACT WorkKeys®
assessment, is different between students pursuing a Career, Technical, and Agricultural
Education (CTAE) diploma endorsement and those pursuing a College Preparatory (CP)
endorsement. A CTAE endorsement may be termed as Career and Technical Education (CTE),
Tech Prep, or Vocational, depending upon the state and/or school district granting the diploma.
The study addressed the following research questions:
1. What are the levels of workplace readiness of high school seniors based on descriptive
properties of certificate levels prescribed by ACT WorkKeys® scores on Applied
Mathematics, Reading for Information, and Locating Information assessments?
2. Is there a statistically significant difference in the scores on the ACT WorkKeys®
assessment in Applied Mathematics between high school seniors completing a Career and
Technical Education endorsement and those completing a College Preparatory
endorsement?
3. Is there a statistically significant difference in the scores on the ACT WorkKeys®
assessment in Reading for Information between high school seniors completing a Career
and Technical Education endorsement and those completing a College Preparatory
endorsement?

57
4. Is there a statistically significant difference in the scores on the ACT WorkKeys®
assessment in Locating Information between high school seniors completing a Career and
Technical Education endorsement and those completing a College Preparatory
endorsement?
Limitations of the Study
This study engaged a causal-comparative design, analyzing two pre-existing groups to
determine CTE’s effect on workplace readiness of high school students. The major disadvantage
of a causal-comparative design is that it is difficult to make definite or permanent statements
about causal patterns (Schenker & Rumrill, 2004). Because there is not a way to account for all
possible independent variables or outside influences on the dependent variable, there is always
the possibility that something other than the variables considered in the study influenced the
results. While attempts were made to address outside variables through the matching of the
sample, no generalizable conclusions can be made regarding the independent variables effect on
the dependent variable. Furthermore, this study was limited to one school system within the
Northwest Georgia area. This also limited the number of participants eligible for the study.
Another limitation of the causal-comparative design is in the existing groups when there is
self-selection into those groups. Due to the nature of CTE and the stigma that is related to this
type of coursework (Gray, 2002; 2004), many more affluent students may not self-select to be a
part of the CTE environment.
Summary of Findings and Conclusions
All participants were drawn from the 2010-2011 senior classes of the two Northwest
Georgia high schools within the Gordon County Schools district, and accessible data from school
officials provided necessary information on diploma track. The student information coordinator

58
provided scores from these tests for each student, along with each student’s graduation track.
The students were identified through the use of a computer-generated identification number
assigned through Gordon County Schools’ student information system. The matching sample
began with the 172 students who completed all three assessments during the same semester.
Once the students were sorted into two categories, CTE and college preparatory completers, they
were compared and matched in number and demographics to obtain the highest matching sample
possible with the participants available through this study. This process yielded a maximum
sample of 82 students for either category, where n=164.
Upon obtaining the matching sample, an analysis of the available data established that only
level scores were available on each participant in each of the data sets, along with the certificate
level earned by each student. Through further analysis of the available data set, level scores were
not represented at the 1 or 2 level, instead scores were represented as <3, which is a common
representation and function of the WorkKeys® assessments. The data obtained from the ACT
WorkKeys® Assessments included the following for the sample: the type of Certificate earned
and the scale scores for Applied Mathematics, Reading for Information, and Locating
Information assessments. The two categories, CTE track and a college preparatory track, were
compared within each of the four samples, based on the type of Certificate earned and scores on
Applied Mathematics, Reading for Information, and Locating Information assessments.
The results of the study yielded no significant findings to support the research hypothesis
that there is a relationship between the track chosen, CTE or CP, and the performance on the
ACT WorkKeys® Assessment. The overall attainment of the Work Ready certificates only
differed by 3 certificates, with CP students earning 77 certificates and CTE students earning 74.

59
A chi-square analysis of the categorical data presented in the subsequent research questions
discovered probability levels above the set alpha levels of .05. In research question 2, p=.347;
therefore, the null hypothesis that there is no relationship between the track chosen and the work
readiness of high school students based upon performance on the ACT WorkKeys® Applied
Mathematics Assessment taken by the participants from the sample would be accepted.
Research question 3 yielded a p=.444. The null hypothesis that there is no relationship between
the track chosen and the performance on the ACT WorkKeys® Reading for Information
Assessment taken by participants in the sample was accepted. A similar scenario plays out in
research question 4 with a p=.232; therefore, the null hypothesis that there is no relationship
between the track chosen and the performance on the ACT WorkKeys® Locating Information
Assessment as shown by the data in the sample could not be rejected.
In the data set displayed for research question one, 74 students on the CTE track earned a
WorkKeys® certificate, while 77 students on CP track earned a certificate. However, two
students, or 2.4%, on the CTE track earned the highest certificate possible with this assessment –
platinum, while no students on CP track earned a platinum certificate. Additionally, research
questions two and four demonstrated that a larger percentage of CTE students scored in the
platinum range (level 6 and/or 7) than did those students on the CP track. In applied
mathematics, a combined total of levels 6 and 7 yielded 31.7% of CTE track students, while only
23.2% of CP students scored in the same range on the assessment. On the locating information
assessment, 2 (2.4%) students on the CTE track scored in the platinum range (level 6), while no
CP students scored at this level. The same two students earned platinum certificates overall.
Hall (2010) noted that the locating information section of the assessment is often recognized as

60
the most advanced of the three WorkKeys assessments, because it requires students to apply the
workplace skills addressed in the other two sections.
While no significant differences were found in the data to support CTE as a better method
for providing students with workplace readiness skills, it should be noted that the data also did
not support CP as a superior method, which the literature suggests might be a popular summation
among critics of CTE (Gray, 2002, 2004; Flowers, 2000).
Implications for Practice and Research
Lent, Brown, and Hackett (1996 a,b) laid the foundation for CTE as a method for
promoting workplace readiness with their Social Cognitive Career Theory, observing that
experiences affect choices for those forming career options, and that social persuasion and role
models are a major influence on those decisions. This model, along with Holland’s (1959, 1985)
theory of behaviors being determined by interaction between personality and environment,
supports the hands-on, workplace experiences that students gain by being a part of CTE courses.
Lippman and Keith’s (2009) workforce readiness key competencies are primarily related to those
presented in CTE course curriculum in Georgia. Hall (2010) stated that CTE plays a central role
in the development of work readiness skills, a statement confirmed by others in this area of
research (Hyslop, 2008; Lippman & Keith, 2009; Stone & Aliaga, n.d.; Castello, et. al., 2004).
While this study does not significantly support this research, additional studies should be
considered.
Recommendations for Future Research
While no significance can be derived from the chi-square analysis, the data provided in this
study provides a basis for future inquiry.

61
1. An in-depth analysis of platinum Work Ready certificate holders’ career paths and
educational training would provide insight into the necessary experiences needed to
score at the maximum levels on the WorkKeys® assessments.
2. A replication of this study should be conducted to include all high schools in Georgia
that administer the WorkKeys® assessment to allow for fewer limitations of the study
and make the results more generalizable.
3. Flouri and Buchanan (2002) and Prideaux (2003) suggest that teacher work experience
may affect the student levels of workplace readiness. A study to answer the following
question should be considered: Are students who are trained by teachers with business
and industry experience more workplace ready than those who receive instruction from
those teachers who only have experience in the classroom setting?
4. Given the emphasis on soft skills in the workplace (Castello, Stringfield, Stone, &
Wayman, 2003), a study should be conducted to determine the soft skills attainment of
CTE vs. CP students.
Summary
While the results of this study are not indicative of findings to support CTE as a path for
increasing students’ workplace readiness, CP also was not discovered to be a superior method.
Based upon the findings of this study, neither students who complete CTE coursework nor those
who complete a CP diploma track score significantly higher on WorkKeys® assessments. This
comparison also holds true when evaluating the number of certificates earned by students in the
two categories. For generations, legislation has supported the use of vocational (now termed
CTE) education as a means of preparing students for the labor markets. Educators have followed
suit by making pathways available to students, giving them an option to select training to prepare

62
for college or workforce while in high school. However, in order to ensure that students are
prepared to support the growing workforce demands of the economy, legislators and educators
alike must understand the type of programming, experiences, and training necessary to provide
students with these skills. If neither CTE nor CP programs support this cause, additional, non-
traditional avenues must be chartered to ensure a viable workforce for the 21st century.

63
REFERENCES
ACT, Inc. (2002). ACT white paper: WorkKeys® validation. Iowa City, IA: Author.
ACT, Inc. (2006a). Ready for college and ready for work: Same or different? Iowa City, IA:
Author.
ACT, Inc. (2006b). WorkKeys®: Scale score interpretation guide. Iowa City, IA: Author.
ACT, Inc. (2008a). WorkKeys® applied mathematics technical manual. Iowa City, IA:
Author.
ACT, Inc. (2008b). WorkKeys® locating information technical manual. Iowa City, IA:
Author.
ACT, Inc. (2008c). WorkKeys® reading for information technical manual. Iowa City, IA:
Author.
ACT, Inc. (2008d). WorkKeys® job profiling training program: Week IV activities. Iowa City,
IA: Author.
ACT, Inc. (2009). The path to career success: High school achievement, certainty of career
choice, and college readiness make a difference. Iowa City, IA: Author.
ACT, Inc. (2010a). About ACT. Retrieved from http://www.act.org/aboutact/faq.html
ACT, Inc. (2010b). WorkKeys®. Retrieved from http://www.act.org/workforce
ACT, Inc. (2010c). Using your WorkKeys® scores. Iowa City, IA: Author.
ACTE. (2006). Perkins Act 2006: The official guide. Alexandria, VA: Author.
ACTE. (2008, March). Career and Technical Education’s Role in Workforce
Readiness. Issue Brief. Retrieved from

64
http://www.acteonline.org/uploadedFiles/Publications_and_Online_Media/files/WorkRead
inessCredentials.pdf
ACTE. (2011). Carl D. Perkins Act implementation. Retrieved from
http://www.acteonline.org/perkins.aspx
Agresti, A. (1996). Introduction to categorical data analysis. New York, NY: Wiley.
Albert, K. A., & Luzzo, D. A. (1999). The role of perceived barriers in career development: A
social cognitive perspective. Journal of Counseling & Development, 77, 431-436.
Bandura, A. (1986). Social foundations of thought and action: A social cognitive theory.
Englewood Cliffs, NJ: Prentice-Hall.
Barge, J. D. (2011, July). College and career ready performance index, high school model
grades 9-12. Paper session presented at the Summer Conference of Georgia Association
of Career and Technical Education, Atlanta, GA.
Beale, A. V. (2001). Emerging career development theories: A test for school counselors.
Professional School Counseling, 5(1), 1-5. Retrieved from Academic Search Premier
database (5461175).
Bragg, D. D. (2000). Maximizing the benefits of Tech-Prep initiatives for high school students.
New Directions for Community Colleges, (111), 23-30.
Bright, J. E. H., & Pryor, R.G. L. (2005). The Chaos Theory of Careers: A user's guide. Career
Development Quarterly, 53, 291-305.
Carl D. Perkins Vocational and Applied Technology Education Act, H.R. 5164, 98 Cong. (1984).
Carl D. Perkins Vocational and Applied Technology Education Act Amendments of 1990, H.R.
7, 101 Cong. (1990).

65
Carl D. Perkins Vocational and Applied Technology Education Act Amendments of 1998, H.R.
1853, 105 Cong. (1998).
Castello, M., Stone, J. R., III, Stringfield, S., Farley, E. M., & Wayman, J. C. (2004). The effect
of CTE-enhanced whole-school reform on student course taking and performance in
English and science. St. Paul, MN: National Research Center for Career and Technical
Education.
Castello, M., Stringfield, S., Stone, J. R., III, & Wayman, J. C. (2003). Early measures of student
progress in schools with CTE-enhanced whole-school reform: Math course taking patters
and student progress to graduation. St. Paul, MN: National Research Center for Career
and Technical Education.
Coe, R. (2002, September). It’s the effect size, stupid. Paper presented at the annual meeting of
British Educational Research Association, Oxford, UK.
Cropley, D. H., & Harris, M. B. (2004). Too hard, too soft, just right... Goldilocks and three
research paradigms in SE. Paper presented at the 14th annual International Symposium of
the International Council on Systems Engineering and the 4th European Systems
Engineering Conference. SA 5095, Australia.
Flouri, E. & Buchanan, A. (2002). The role of work-related skills and career role models in
adolescent career maturity. Career Development Quarterly, 51(1), 36-43.
Flowers, J. (2000). High schools that work and tech prep: Improving student performance in
basic skills. Journal of Vocational Education Research, 25(3), 333-345.
Freeman, M. F. & Tukey, J. W. (1950). Transformations related to the angular and the square
root. Annals of Mathematical Statistics. 21 (4), 607-611. doi:10.1214/aoms/1177729756

66
Gall, M. D., Gall, J. P., & Borg, W. R. (2003). Non-experimental research: Descriptive and
causal-comparative designs. In A. Burvikovs, M. Kriener, & C. Tridente (Eds.),
Educational research: An introduction (7th ed., pp. 288-318). Boston, MA: Pearson
Education, Inc.
Gay, L. R., & Airasian, P. (2000). Educational research: Competencies for analysis and
application (6th ed., pp. 349-357). Engelwood Cliffs, NJ: Merrill, Prentice- Hall.
Georgia Department of Education. (2007a). Business Essentials. Program concentration:
Business and Computer Science. from
http://www.gadoe.org/ci_cta.aspx?PageReq=CICTAPathways3
Georgia Department of Education. (2007b). Introduction to Healthcare Science. Program
concentration: Healthcare Science. Retrieved from
http://www.gadoe.org/ci_cta.aspx?PageReq=CICTAPathways9
Georgia Work Ready. (2010). Certificates earned by county. Georgia Work Ready certification
overview fact sheet. Retrieved September 30, 2010 from http://www.gaworkready.org
Goals 2000: Educate America Act. (1994). In GovTrack.us (database of federal legislation).
Retrieved from http://www.govtrack.us/congress/bill.xpd?bill=h103-1804
Gordon County Board of Commissioners. (2009). Gordon County Online. Retrieved February
28, 2010, from http://www.gordoncounty.org/
Governor’s Office of Student Achievement. (2009). Annual report cards on public schools K-12.
Retrieved September 24, 2010, from http://www.gaosa.org/
Governor’s Office of Workforce Development. (2009, March 6). Georgia high school seniors get
work ready. Dalton Daily Citizen. Retrieved from http://daltondailycitizen.com

67
Gray, K. (2002, April). The role of career and technical education in the American high school:
A student-centered analysis. Paper commissioned for Preparing America’s future: A high
school symposium, Washington, DC. Retrieved from
http://www.eric.ed.gov/PDFS/ED465093.pdf
Gray, K. (2004). Is high school career and technical education obsolete? In Phi Delta Kappa
International. Retrieved from http://www.kappanmagazine.org
Gribbons, B., & Herman, J. (1997). True and quasi-experimental designs. Retrieved from ERIC
Clearinghouse on Assessment and Evaluation database (ED421483).
Hall, V. L. (2010). Work readiness of career and technical education high school students.
(Unpublished doctoral dissertation). University of Georgia, Athens, GA.
Hansen, M. (2010, February). CTAE - Perkins Technical Skill Attainment Inventory Listing;
National Student Credentialing Opportunities. Paper presented at the Georgia Department
of Education Winter 2010 CTAE Regional Update, Macon, Georgia.
Hartman, J. (2000). Choosing the correct statistical test. University of Alabama. Retrieved June
16, 2011 from http://bama.ua.edu/~jleeper/627/choosestat.html
Holland, J. L. (1985). Making vocational choices. 2nd
Hull, D. & Grevelle, J. H. (1998). Tech Prep: the next generation. Waco, TX: Center for
Occupational Research and Development, Inc.
ed. Englewood Cliffs, NJ: Prentice-Hall.
Hyslop, A. (2008). CTE’s role in workforce readiness credentialing.
http://www.acteonline.org/uploadedFiles/Publications_and_Online_Media/files/files-
techniques-2008/sept08_workforce_readiness.pdf

68
Ireh, M. (2000). Career development theories and their implications for high school career
guidance and counseling. High School Journal, 83(2), 28-40. Retrieved from Academic
Search Premier database (2742797).
Johnson, B. (2001). Toward a new classification of non-experimental quantitative research.
Educational Researcher, 30(2), 3-13.
Karunanayake, D., & Nauta, M. M. (2004). The relationship between race and students'
identified career role models and perceived role model influence. Career Development
Quarterly, 52, 225-234.
Kearsley, G. (2005). Social Learning Theory (A. Bandura). Retrieved from
http://tip.psychology.org/bandura.html
Kelley, K., Clark, B., Brown, V., & Sitzia, J. (2003). Good practice in the conduct and reporting
of survey research. International Journal for Quality in Health Care, 15(3), 261-266.
Kolen, M. J. (1988). Defining score scales in relation to measurement error. Journal of
Educational Measurement, 25: 97–110. doi: 10.1111/j.1745-3984.1988.tb00295.x
Kravitz, L. (1994). Understanding and enjoying research. IDEA today, 12(9), 34-36. Retrieved
from http://www.unm.edu/~lkravitz/Article%20folder/understandres.html
Lee, D. (2004). Survey research: Reliability and validity. Library Administration &
Management, 18(4), 211-213.
Lent, R. W., Brown, S. D., & Hackett, G. (1996a). A social cognitive framework for studying
career choice and transition to work. Journal of Vocational Education Research, 21(4), 3-
31. Retrieved from ERIC database (EJ543955).

69
Lent, R. W., Brown, S. D., & Hackett, G. (1996b). Career development from a social cognitive
perspective. In D. Brown & L. Brooks (Eds.), Career choice and development (3rd
Lippman, L. & Keith, J. (2009). A developmental perspective on workplace readiness: Preparing
high school students for success. Retrieved from
http://www.childtrends.org/Files/Child_Trends-2009_04_28_RB_WorkReady.pdf
ed.,
pp. 373-422). San Francisco, CA: Jossey-Bass.
Miller, M. (2009). Teaching for a new world: Preparing high school educators to deliver
college- and career- ready instruction. Retrieved from http://www.all4ed.org/files/
TeachingForANewWorld.pdf
National Commission on Excellence in Education. (1983). A nation at risk. Washington, D.C.:
U.S. Department of Education.
No Child Left Behind Act of 2001, H.R. 1, 107 Cong. (2001).
Pinkus, L. M. (Ed.) (2009). Meaningful measurement: The role of assessments in improving high
school education in the twenty-first century. Washington, DC: Alliance for Excellent
Education.
Pittman, K. (2010, June). College and career readiness: Co-founder of the Ready by 21
National Partnership asks: Even if students graduate, are they really equipped for
the next stage? The School Administrator, 6(67). Retrieved from
http://www.aasa.org/SchoolAdministratorArticle.aspx?id=13536
Prideaux, L. (2003). A longitudinal evaluation of a theoretically derived adolescent career
education intervention (Unpublished doctoral dissertation). Griffith University,
Queensland, AU.

70
Roberts, M. (2008). School to career transitions: Career awareness and CTE students (Doctoral
dissertation). Retrieved from Dissertations & Theses: A & I. (Publication No. AAT
3313465).
Ruhland, S., Jurgens, C. & Ballard, D. (2003). Tech Prep's role in education reform: Perceptions
from state tech prep directors. Journal of Career and Technical Education, 20(1).
Schenker, J. D., & Rumrill, P. D., Jr. (2004). Causal-comparative research designs. Journal of
Vocational Rehabilitation, 21, 117-121.
Scott, J. L. & Sarkees-Wircenski, M. (1996). Overview of vocational and applied technology
education. Homewood, IL: American Technical Publishers.
Secretary’s Commission on Achieving Necessary Skills. (1991). What work requires of schools:
A SCANS report for America. Washington, D.C.: U.S. Department of Labor. Retrieved
from http://wdr.doleta.gov
Smith, N. B. (1999, Fall). A tribute to the visionaries, prime movers and pioneers of
vocational education. Journal of Vocational and Technical Education, 16(1).
Smith, P. J., Henry, J., & Munro, G. (2002) Training young people through a school/enterprise
partnership: a longitudinal study. Education + Training, 44 (6), 281 – 289. doi:
10.1108/00400910210441419
Social Learning Theory of Albert Bandura. (1999). McGraw-Hill Higher Education. New York,
NY: McGraw-Hill. Retrieved from http://www.mhhe.com/socscience/comm/bandur-
s.mhtml
Stevens, J. (1999). Intermediate statistics: A modern approach (2nd ed.). Mahwah, NJ:
Lawrence Erlbaum Associates.

71
Stitt-Gohdes, W. L. (1997). Career development: Issues of gender, race, and class. Retrieved
from ERIC Clearinghouse on Adult, Career, and Vocational Education database
(ED413533).
Stone, J. R. III & Aliaga, O. A. (n.d.). Helping low achieving youth acquire work readiness: The
role of career and technical education. St. Paul, MN: National Center for Career and
Technical Education, University of Minnesota.
Super, D. E. Savicas, M. L., & Super, C. M. (1996). The life-span, life-space approach to
careers. In D. Brown & Associates (Eds.) Career choice and development. (pp. 121-178).
San Francisco, CA: Jossey-Bass.
Threeton, M. D. (2007). The Carl D. Perkins career and technical education (CTE) act of 2006
and the roles and responsibilities of CTE teachers and faculty members. Retrieved from
http://scholar.lib.vt.edu/ejournals/JITE/v44n1/pdf/threeton.pdf
U.S. Chamber of Commerce. (2010). Jobs agenda: Education. Washington, DC: U.S. Chamber
of Commerce. Retrieved from http://www.uschamber.com/workforce
U.S. Department of Education & U.S. Department of Labor. (1994). School-to-Work
Opportunities Act. Washington, D.C.: Author.
Vocational Education Act of 1917. (n.d.). Major Acts of Congress. Retrieved from
http://www.answers.com/topic/vocational-education-act-of-1917
Wainer, H., Holland, P. W., Swinton, S., & Wang, M. H. (1985). On state education statistics.
Journal of Educational Statistics, 10(4), 293-325.
Workplace readiness. (2010). In Career Education: Glossary. Retrieved from
http://www.aboutcareereducation.com/pages/career-glossary.php

72
APPENDICES

73
Appendix A IRB Approval Letter

74

75
Appendix B Permission Letter from Participating District

76
Related Documents