ABSTRACT TRIVEDI, SHWETA. Host cytokines and immune responses in pregnancy associated transmission of arrested hookworm larvae (Under the direction of Dr. Prema Arasu) Over one billion people worldwide are infected with the hookworms, Necator and Ancylostoma spp. Upon entry into the host, infective larvae (third stage L3 which are free-living and non-feeding) typically mature into blood-feeding adults in the small intestines. An important aspect of the life cycle for A. duodenale (humans) and A. caninum (dogs) is the propensity for L3 to undergo a temporary state of developmental arrest in the host. In female hosts, these tissue-arrested L3 reactivate during pregnancy and are transmitted to the neonates through milk. During pregnancy transforming growth factor (TGF)-β is apparently upregulated in host tissues including the mammary gland. Studies from the free-living nematode Caenorhabditis elegans show that TGF-β and insulin-like signaling pathways regulate larval arrest and resumption of development. Similar signaling pathways are proposed in the pregnancy-associated reactivation of arrested Ancylostoma larvae. We have previously used an in vitro assay to demonstrate that recombinant human TGF-β can stimulate a feeding response in tissue-arrested A. caninum L3 larvae. We speculate that host factors like TGF-β and pregnancy hormones such as estrogen and prolactin signal arrested L3 larvae to resume development. To facilitate analyses of mechanisms of reactivation and transmission in vivo, we have utilized a mouse model of A. caninum infection; mice serve as an excellent model because infective L3 do not develop into adults but migrate to different somatic tissues

Welcome message from author
This document is posted to help you gain knowledge. Please leave a comment to let me know what you think about it! Share it to your friends and learn new things together.
Transcript

ABSTRACT
TRIVEDI, SHWETA. Host cytokines and immune responses in pregnancy
associated transmission of arrested hookworm larvae (Under the direction of
Dr. Prema Arasu)
Over one billion people worldwide are infected with the hookworms, Necator and
Ancylostoma spp. Upon entry into the host, infective larvae (third stage L3 which are
free-living and non-feeding) typically mature into blood-feeding adults in the small
intestines. An important aspect of the life cycle for A. duodenale (humans) and A.
caninum (dogs) is the propensity for L3 to undergo a temporary state of developmental
arrest in the host. In female hosts, these tissue-arrested L3 reactivate during pregnancy
and are transmitted to the neonates through milk. During pregnancy transforming growth
factor (TGF)-β is apparently upregulated in host tissues including the mammary gland.
Studies from the free-living nematode Caenorhabditis elegans show that TGF-β and
insulin-like signaling pathways regulate larval arrest and resumption of development.
Similar signaling pathways are proposed in the pregnancy-associated reactivation of
arrested Ancylostoma larvae. We have previously used an in vitro assay to demonstrate
that recombinant human TGF-β can stimulate a feeding response in tissue-arrested A.
caninum L3 larvae. We speculate that host factors like TGF-β and pregnancy hormones
such as estrogen and prolactin signal arrested L3 larvae to resume development. To
facilitate analyses of mechanisms of reactivation and transmission in vivo, we have
utilized a mouse model of A. caninum infection; mice serve as an excellent model
because infective L3 do not develop into adults but migrate to different somatic tissues

and arrest, later reactivating during the periparturient period to transmit through milk.
Skeletal muscle and mammary gland are the major tissues of interest during this process
of arrest, reactivation and transmission. We investigated TGF-β1, TGF-β2 and IGF-1
serum and transcript cytokine profiles during late pregnancy, early lactation and mid-
lactation in mice infected with A. caninum to correlate their levels with the
transmammary transmission of the larvae to the nursing pups. An in vitro co-culture
system was also developed in an attempt to mimic in vivo conditions for assessing the
effects of TGF-β and, estrogen and prolactin on larval reactivation. A. caninum L3 were
co-incubated with primary skeletal muscle and mammary epithelial cells in a Transwell®
setup and larval reactivation was measured utilizing the in vitro feeding assay.
Additionally, the immune responses during concurrent pregnancy and helminthic
infection were assessed given that both conditions are known to be biased towards a T
helper (Th)-2 type of response. Serum and transcript levels of IFN-γ (representative of
the Th1 arm of the immune response) and IL-4 (for Th2) were measured in skeletal
muscle, mammary gland and spleen during pregnancy and A. caninum infection in the
mouse. These findings which are based upon serum and transcript levels suggest that
host-derived TGF- β1 and IGF-1 may play roles in the reactivation and transmission of
arrested A. caninum larvae; levels of TGF- β2 did not however, show a correlation with
the timepoints of pregnancy and lactation associated with larval reactivation and transfer.
Also, a Th2-like response characterized by elevation in IL-4 transcript levels was
observed in skeletal muscle while a mixed Th1/Th2 profile was observed in mammary
gland when comparing the different permutations of infection with A. caninum versus
pregnancy/lactation in BALB/c mice.


ii
Dedication
To my parents: Dr. Amresh Kumar and Mrs. Mridula Trivedi Thanks to you, I never needed to search for other role models in life.
iii
BIOGRAPHY
Shweta Trivedi was born on 10th June, 1975 in Moradabad, Uttar Pradesh, India. She
finished her primary schooling until high school from Campus School, Pantnagar in
1993. It was her ambition to become a veterinary surgeon like her father. She joined the
College of Veterinary Medicine at Gobind Ballabh Pant University of Agriculture and
Technology, Pantnagar in 1993 and graduated with a degree in Bachelor of Veterinary
Science and Animal Husbandry in 1998. She successfully competed in a national exam
for Junior Research Fellowship awarded by the Indian Council of Agricultural Research
and joined Indian Veterinary Research Institute, Izatnagar in 1998. For her Master’s
work, she characterized and tested the short-term culture filtrate proteins from
Mycobacterium bovis as potential diagnostic reagents for tuberculosis testing. After
completing her postgraduate degree in Master’s of Veterinary Immunology in 2000, she
got admission in the Immunology Program at College of Veterinary Medicine, North
Carolina State University and in the Microbiology department at University of
Tennessee, Knoxville. She joined the Immunology program at CVM, NCSU in 2001
where she worked on her PhD under the direction of Dr Prema Arasu. The major focus of
her graduate work was on host-parasite interactions involved in arrest and reactivation in
canine hookworm, Ancylostoma caninum. She will join the National Institute of Allergy
and Infectious Diseases at Rockville, Maryland as a visiting fellow in the lab of Dr.
Andrea Keane-Myers studying the role of T regulatory cell in the development of allergic
diseases.

iv
ACKNOWLEDGEMENTS
I express sincere gratitude to my major advisor, Dr Prema Arasu, for giving me
the opportunity to pursue my cherished desire of getting a higher education in the United
States. Her support, thoughtful comments and guidance along the way helped in timely
completion of this project. I am very thankful to my advisory committee members, Dr
Scott Laster, Dr Bill Miller and Dr Paul Mozdziak for their encouragement and valuable
suggestions through the course of my dissertation research. I would like to specially
thank Dr Miller for being an excellent mentor during my training in `Preparing the
Professoriate’ program. I gratefully acknowledge my graduate program coordinator, Dr
Wayne Tompkins for constantly pushing me to think critically in Immunology Journal
Club.
I thank the past and present members of Arasu lab, Cortney Cowan, Tori Freitas,
and Rita Simoes for being wonderful colleagues as well as friends to me. I am extremely
indebted to Dr. Susan Lankford for introducing me to the real-time PCR technology. I
heartily thank Dr. Barb Sherry for an unending supply of mice for cell culture studies. I
would also like to thank Derek Coombs for helping me with statistical analysis. I greatly
appreciate Paula Delong, Mary Jane, Toni Grenther and LAR staff who took excellent
care of beagle dogs and my experimental mice. I always enjoyed scientific deliberations
with my friend Dr. Kristina Howard, who has been very supportive of me all these years.
Additionally, I would like to thank all my friends who have been there for me through
thick and thin. Big thanks to Gregg Cowan for printing my dissertation. Finally, I feel
blessed to have such a caring and loving life-partner in Siddhartha who has always
encouraged me to keep moving forward and helped me realize my dreams.

v
TABLE OF CONTENTS
List of Tables……………………………………………………………………….. vii
List of Figures………………………………………………………………………. viii
1. Introduction ……………………………………………………………………… 1
2. Literature Review…………………………………………………………………… 5
2.1 Life cycle of Ancylostoma caninum………………………………………… 5 2.2 Developmental Arrest and Reactivation in Hookworms……………………. 7 2.3 Host Response to Arrest and Reactivation of Parasites…………………….. 17 2.4 Helminthic infection and Host Immune Responses………………………… 19 2.5 Immune responses during pregnancy………………………………………..24 3. Transcript and serum levels of TGF-β and IGF-1 during pregnancy and Ancylostoma caninum infection in BALB/c mice
3.1 Introduction………………………………………………………………… 31 3.2 Materials and Methods…………………………………………………….. 34 3.3 Results……………………………………………………………………… 42
3.4 Discussion………………………………………………………………….. 48 4. Development of an in vitro co-culture system to study the effects of TGF-β and pregnancy hormones on reactivation of hookworm larvae
4.1 Introduction………………………………………… ……………………… 79 4.2 Materials and Methods……………………………………………………… 81 4.3 Results………………………………………………………………………. 87 4.4 Discussion…………………………………………………………………... 89
5. IL-4 and IFN-γ serum protein and transcript levels during pregnancy and Ancylostoma caninum infection in BALB/c mice
5.1 Introduction………………………………………… ……………………... 110 5.2 Materials and Methods……………………………………………………... 113 5.3 Results…………………………………………………………………….... 118 5.4 Discussion………………………………………………………………….. 121
6. Evaluation of endogenous reference genes for real-time PCR quantification of gene expression in Ancylostoma caninum……………………………………….... 131

vi
7. References………………………………………………………………………….. 146 8. Appendix ………………………………………………………………………........ 162

vii
LIST OF TABLES
Page
Table 3.1 Primer sequences used for cytokine and reference gene transcript
quantification by real-time RT-PCR……………………………………………………..55
Table 5.1 Primer sequences used for cytokine and reference gene transcript
quantification by real-time RT-PCR……………………………………………………125

viii
LIST OF FIGURES
Figure 2.1 Life cycle of Ancylostoma caninum in the host and environment……… 29
Figure 2.2 Model of larval arrest and reactivation…………………………………. 30
Figure 3.1 Experimental design…………………………………………………….. 56
Figure 3.2 Comparison of total larval burden in unbred versus bred BALB/c mice
infected at times corresponding to day 19 gestation, day 1 and day 10 of postpartum
lactation……………………………………………………………………………… 57
Figure 3.3 Comparison of serum TGF-β1 levels in UN, IN, UB and IB mouse. …… 58
Figure 3.4 Comparison of serum TGF-β2 levels in UN, IN, UB and IB mouse. …… 59
Figure 3.5 Comparison of serum TGF-β1 levels in UN, IN, UB and IB mouse …… 60
Figure 3.6a-c TGF-β1 transcript levels in skeletal muscle of IN, UB and IB mice… 61
Figure 3.6d-f TGF-β1 transcript levels in mammary gland of IN, UB and IB mice .. 62
Figure 3.6g-i TGF-β1 transcript levels in spleen of IN, UB and IB mice. …………... 63
Figure 3.7a-c TGF-β2 transcript levels in skeletal muscle of IN, UB and IB mice. … 64
Figure 3.7d-f TGF-β2 transcript levels in mammary gland of IN, UB and IB mice. ... 65
Figure 3.7g-i TGF-β2 transcript levels in spleen of IN, UB and IB mice.…………... 66
Figure 3.8a-c IGF-1 transcript levels in skeletal muscle of IN, UB and IB mice. …… 67
Figure 3.8d-f IGF-1 transcript levels in mammary gland of IN, UB and IB mice. ….. 68
Figure 3.8g-i IGF-1 transcript levels in spleen of IN, UB and IB mice. ……………. 69
Figure 3.9a, b, c Comparison of TGF-β1 transcript levels in skeletal muscle of IN (a),
UB (b) and IB (c) mice over time……………………………………………………... 70

ix
Figure 3.9d, e, f Comparison of TGF-β1 transcript levels in mammary gland of IN (d),
UB (e) and IB (f) mice over time……………………………………………………. 71
Figure 3.9g, h, i Comparison of TGF-β1 transcript levels in spleen of IN (g), UB (h) and
IB (i) mice over time…………………………………………………………………. 72
Figure 3.10a, b, c Comparison of TGF-β2 transcript levels in skeletal muscle of IN (a),
UB (b) and IB (c) mice over time……………………………………………………. 73
Figure 3.10d, e, f Comparison of TGF-β2 transcript levels in mammary gland of IN (d),
UB (e) and IB (f) mice over time…………………………………………………….. 74
Figure 3.10g, h, i Comparison of TGF-β2 transcript levels in spleen of IN (g), UB (h)
and IB (i) mice over time……………………………………………………………… 75
Figure 3.11a, b, c Comparison of IGF-1 transcript levels in skeletal muscle of IN (a), UB
(b) and IB (c) mice over time………………………………………………………….. 76
Figure 3.11d, e, f Comparison of IGF-1 transcript levels in mammary gland of IN (d),
UB (e) and IB (f) mice over time………………………………………………………. 77
Figure 3.11g, h, i Comparison of IGF-1 transcript levels in spleen of IN (g), UB (h) and
IB (i) mice over time………………………………………………………………….. 78
Figure 4.1a-f Immunohistochemistry slides of skeletal muscle and mammary epithelial
cells…………………………………………………………………………………….. 93
Figure 4.2a Effect on percent feeding response of L3 larvae co-cultured in the
presence or absence of primary skeletal muscle cells………………………………….. 95
Figure 4.2b Effect of serum on percent feeding response of L3 larvae co-cultured
with primary skeletal muscle cells. …………………………………………………… 96
Figure 4.2c Effect of serum on percent feeding response of L3 larvae co-cultured

x
with primary mammary epithelial cells. ………………………………………………. 97
Figure 4.3a Effect of TGF-β2 on feeding response of L3 larvae co-cultured
with primary skeletal muscle cells for 24 h. …………………………………………. 98
Figure 4.3b Effect of TGF-β2 on feeding response of L3 larvae co-cultured
with primary skeletal muscle cells for 48 h.. …………………………………………. 99
Figure 4.3c Effect of TGF-β2 on feeding response of L3 larvae co-cultured
with primary skeletal muscle cells for 72 h.. …………………………………………. 100
Figure 4.4a Effect of TGF-β2 on feeding response of L3 larvae co-cultured
with primary mammary epithelial cells for 24 h. ……………………………………… 101
Figure 4.4b Effect of TGF-β2 on feeding response of L3 larvae co-cultured
with primary mammary epithelial cells for 48 h. ……………………………………… 102
Figure 4.4c Effect of TGF-β2 on feeding response of L3 larvae co-cultured
with primary mammary epithelial cells for 72 h. ……………………………………… 103
Figure 4.5a Effect of pregnancy-associated hormones on feeding response of L3 larvae
co-cultured with primary skeletal muscle cells for 24 h………………………………. 104
Figure 4.5b Effect of pregnancy-associated hormones on feeding response of L3 larvae
co-cultured with primary skeletal muscle cells for 48 h……………………………… 105
Figure 4.5c Effect of pregnancy-associated hormones on feeding response of L3
larvae co-cultured with primary skeletal muscle cells for 72 h………………………. 106
Figure 4.6a Effect of pregnancy-associated hormones on feeding response of L3 larvae
co-cultured with primary mammary epithelial cells for 24 h………………………... 107
Figure 4.6b Effect of pregnancy-associated hormones on feeding response of L3 larvae
co-cultured with primary mammary epithelial cells for 48 h………………………… 108

xi
Figure 4.6c Effect of pregnancy-associated hormones on feeding response of L3 larvae
co-cultured with primary mammary epithelial cells for 72 h………………………… 109
Figure 5.1 Comparison of total larval burden in unbred versus bred BALB/c mice
infected at times corresponding to day 19 gestation, day 1 and day 10 of postpartum
lactation……………………………………………………………………………… 126
Figure 5.2a. IL-4 transcript levels in skeletal muscle of infected bred mice……….. 127
Figure 5.2b. IL-4 transcript levels in mammary gland of infected unbred mice..….. 128
Figure 5.2c. IL-4 transcript levels in mammary gland of infected bred mice………. 129
Figure 5.3. IFN-γ transcript levels in mammary gland of infected unbred mice. ….. 130
Figure 6.1 Expression levels of candidate reference genes across different
developmental stages of A. caninum. ……………………………………………….. 143
Figure 6.2 Expression levels of candidate reference genes in two different strains
of A. caninum………………………………………………………………………… 144
Figure 6.3 Effect of combination of serum treatment and strain of A. caninum
on expression levels of candidate reference genes…………………………………… 145

1
1. Introduction
The World Health Organization estimates that over one billion people in most tropical
and subtropical regions of the world are infected with blood-feeding intestinal hookworms,
predominantly Necator americanus and Ancylostoma duodenale (Chan, et al., 1997). In
addition, approximately 44 million women are infected with hookworms during pregnancy
with the potential for transmammary transmission of A. duodenale to their nursing infants
(Bundy, et al., 1995; Schad and Page, 1982). Studies have correlated retarded physical and
cognitive development with early childhood parasitic diseases (Watkins and Pollitt, 1997;
Drake, et al., 2000; Dickson, et al., 2000). Hookworms are also prevalent in other hosts; A.
caninum is a major parasite of dogs in the U.S. and other parts of the world (Blaghburn, et
al., 1996) and can cause moderate to severe iron deficiency anemia, hypoproteinemia and
bloody diarrhea that can be fatal to puppies and immunosuppressed dogs (Georgi and Georgi,
1991). A. caninum is also a zoonosis to humans due to skin penetration by the soil-dwelling
infective larvae resulting in cutaneous larva migrans (Miller, et al., 1991) and eosinophilic
enteritis due to the potential, albeit rare, of larval development to the adult stage in the human
gut (Prociv and Croese, 1990; Croese et al., 1994).
The lifecycle of nematodes is relatively simple involving development from egg,
through different larval stages to reach adulthood. With parasitic nematodes, the later stages
of development have an obligate requirement of a host. Interestingly, A. duodenale and A.
caninum, like a number of other parasitic nematodes, also have the capacity to infect a host,
abort their normal maturation pathway and undergo developmental arrest in somatic tissues.
Tissue-arrested larvae are metabolically quiescent and resilient to host immune responses as
well as the chemotherapeutic agents typically used to eliminate the intestinal adult stage

2
(Lee, et al., 1975; Schad, 1991; Arasu, 1998). This reservoir of larvae can however respond
to host signals and reactivate during pregnancy or stress (Stone and Girardeau, 1968). Once
reactivated, the third stage larvae (L3) either resume development to become egg-producing
adults in the intestines or are transmitted to the newborns via milk. Vertical transmission of
infection is a relatively common route of passage of parasites to a new generation of hosts
but little is understood about the molecular or immuno-physiological mechanisms facilitating
the process in the host/pathogen relationship. While a generalized immunosuppressive state
is associated with gestation, previous studies have shown no correlation between the immune
responses and reactivation/transmission of A. caninum larvae (Arasu and Heller, 1999). In
separate studies, the hormonal fluxes during pregnancy have been implicated to directly or
indirectly mediate the reactivation of the arrested larval population (Stoye and Krause, 1976);
in the proposed 'indirect' role, estrogen and prolactin are known to regulate the expression of
various developmental and immunomodulatory cytokines such as transforming growth factor
beta (TGF-β) and insulin-like growth factor (IGF). Recent studies have shown that these
mammalian signaling molecules are also present and critical to the development of
nematodes (Crook, et al., 2005; Brand and Hawdon, 2004).
The free-living nematode, Caenorhabditis elegans, has been used as a model to draw
parallels for understanding the signaling mechanisms responsible for the phenomena of arrest
and reactivation in parasitic nematodes (Hotez, et al., 1993). At least three signaling
pathways, the TGF-β pathway, insulin-like pathway and a cGMP pathway, have been
implicated to control the dauer or arrested form in C. elegans (Riddle and Albert, 1998). C.
elegans and hookworms fall in Clade V of Phylum Nematoda (Blaxter, 1998). Given their
close phylogenetic relationship, it is likely that signaling pathways involved in regulating

3
development might be commonly shared. We and others have hypothesized that tissue-
arrested L3 larvae of A. caninum could receive signals from the host resulting in similar
signaling through these known pathways in C. elegans eventually leading to reactivation
(Hawdon and Schad, 1991).
One objective of this study was to use an in vivo system to examine the host's
circulating and tissue-specific profile of expression of TGF-β and IGF during different
phases of pregnancy and lactation in the presence and absence of A. caninum infection, and
to correlate these levels with larval transmission. The second objective of this study was to
establish an in vitro system to examine the direct effects of TGF-β and IGF on A. caninum
larvae cultivated in the environment of muscle (site of larval arrest) versus mammary cells
(site of larval transmission).
Using mice, an experimental model for studies of tissue-arrest, reactivation and
transmammary transmission of A. caninum larvae was previously established (Arasu and
Kwak 1998). Mice serve as a paratenic host for A. caninum in that the L3 larvae enter the
host (by ingestion or skin penetration) and persist in various somatic tissues but are unable to
mature into adults (Arasu and Kwak, 1999). These tissue-arrested L3 larvae however, display
pregnancy-associated transmammary transmission of infection to the nursing pups providing
an encapsulated model for studies of this process of vertical transmission.
For the in vitro analyses, primary skeletal and mammary epithelial murine cell
cultures were established and the conditions were defined for propagation of A. caninum L3s.
The co-culture system was used to examine the effect of normal dog serum and recombinant
mammalian TGF-β as well as the indirect effects of estrogen and prolactin on larval
reactivation using an established feeding/reactivation assay.

4
The third objective of this study was to examine the immunological effects of A.
caninum infection on the viability of pregnancy. Pregnancy and helminthic infection are
both known to evoke Th2-biased immune responses (Wegmann, et al., 1993; Pearce and
Reiner, 1995). However, there are no reports to date on the concurrent effects of pregnancy
and helminthic infection or the inflammatory responses associated with larval arrest and
reactivation.
The fourth aspect of this thesis concerns a relatively new and powerful analytical tool.
Real time polymerase chain reaction (PCR) analysis is extensively used, including in the
above described studies, to compare gene expression levels between different treatments and
experimental groups. The validity of relative comparisons is however highly dependent on
the use of a suitable endogenous reference gene for normalization of the measured transcript
levels. This section describes the validation of six different commonly used endogenous
reference genes in real time PCR analyses of gene expression in different developmental
stages, strains and treatments of A. caninum. These studies also serve as a template for
validation studies in any given experimental system of relative expression using real time
PCR analyses.

5
2. Literature Review
Despite their health significance and global importance, little is known about how
hookworm parasites interact with their hosts to establish a chronic infection. The review will
outline the biology, normal lifecycle and public health significance of hookworm infection.
Additionally, hookworms undergo developmental arrest during one of their environmental
life-stages (as free-living infective larvae) as well as inside the host (hypobiosis). Hypobiotic
hookworm larvae can reactivate in response to host signals received during pregnancy /
lactation and resume their development resulting in the transmammary transmission of
infection to the newborns. This phenomenon of arrest and reactivation has been well studied
in Caenorhabditis elegans, a free-living nematode in which distinct signaling pathways have
been discovered. The immuno-physiological changes occurring during pregnancy have also
been implicated in facilitating the reactivation process and is also addressed below, followed
by a discussion of the host immune responses during acute and chronic parasitic infections
and during pregnancy.
2.1 Life cycle of Ancylostoma caninum
Ancylostoma caninum is one of the two most common parasitic infections of
domestic dogs (Blaghburn, et al., 1996) and is a good model for studies on human hookworm
disease. The life cycle of A. caninum is similar to that for A. duodenale and begins with
shedding of embryonated eggs in the feces of an infected host (Kassai, 1999). The hatched
first-stage larva develops through two molts to the infective third-stage (L3), which is still
ensheathed in the outer cuticle from the second larval stage. By positioning itself on top of a
grass blade or other objects, this non-feeding L3 maximizes its chances of penetrating the
6
skin of a host. Infective L3s can persist in the environment under warm moist conditions for
extended periods of time (~6 months or more). While infection by skin penetration is
prevalent, larvae can also be orally ingested. After entering the host through skin the
maturing fourth stage larvae find their way to the lungs via blood vessels or lymphatics
where they are coughed up and swallowed. They become blood feeding adults in the
intestines by 14-21 days post-infection. In contrast, larvae that enter by ingestion may either
follow the above mentioned path or bypass the lungs and mature directly in the intestines to
become sexually mature male and female worms (Figure 1). While attached to the intestinal
mucosa, adult worms secrete a range of molecules including proteases and anti-coagulants to
prevent clotting in order to receive a blood meal (Williamson, et al., 2003; Stassens, et al.,
1996). A single female worm can produce about 10,000 eggs per day resulting in large
numbers of infective larvae in the environment; by contrast, only 50-100 adult worms are
sufficient to cause life threatening anemia in a neonatal puppy (Loukas, et al., 2005).
The currently available approach for controlling hookworm infection in humans or
animals is targeted at elimination of the intestinal adult stages of the parasite with various
classes of anthelmintics such as the macrolides (e.g. ivermectin) and benzimidazoles
(Bungiro and Cappello, 2004). However, the requirement of repeated doses, the development
of drug-resistant strains and the risk of reinfection are the main limitations of
chemotherapeutic intervention (Quinnell et al., 1993; Hotez and Pritchard, 1995). Besides the
use of anthelminthics, other factors like sanitation, use of footwear and health education can
prevent or reduce the burden of infection (Burke and Roberson, 1979a,b) as occurred in the
hookworm eradication era of the 1920s-40s in many parts of the southern U.S. (Ciesielski et

7
al., 1992). Efforts are also underway to develop an effective vaccine against hookworms
(Brooker, et al., 2005; Goud, et al., 2005).
2.2 Developmental Arrest and Reactivation in Hookworms
An interesting aspect of the A. caninum and A. duodenale life cycles is the capacity of
the parasite to undergo developmental arrest at two stages (Figure 2). The first one occurs
when the non-feeding third larval stage is in the environment waiting to infect a suitable host.
Unless it infects the host, further development cannot occur as it only reactivates upon
receiving host cues and resumes development within the host. The second stage occurs when
the infecting third stage larvae enter a host; instead of continuing to develop into a blood-
feeding adult in the intestines, a portion of the entering larvae remain within the somatic
tissues as developmentally arrested L3s; these L3s have been found throughout the body in
different organs and especially in skeletal muscle (Lee, et al., 1975; Schad, 1990). The
developmentally arrested larvae can persist in the tissues for long periods of time. They
display reduced susceptibility to drugs that effectively eliminate adult stage infections
(Schad, 1991; Arasu, 1998). These arrested larvae possess the capacity to reactivate and
resume normal development thereby serving as a reservoir of infection in the same host i.e.
being able to reactivate and re-establish an active infection (Schad and Page, 1982).
Secondly, in a female host during pregnancy/lactation, the arrested larvae apparently receive
specific cues to reactivate and get transmitted through the mammary glands to the newborn
pups via milk (Stone and Smith, 1975; Burke and Roberson, 1985).
Vertical transmission has been also observed in other helminths including Toxocara
canis, the other major intestinal parasite of dogs (Shoop, 1991; Swerczek et al., 1971). The

8
mechanisms by which developmentally arrested parasitic stages are cued to reactivate during
pregnancy and transmit to a new generation of hosts, either via milk or the uterus (as in the
case of Toxocara), are unknown but serve as a major route of transmission of infection.
Previous studies have shown that host humoral responses (Arasu and Heller, 1999) and the
generalized immunosuppression associated with pregnancy are not directly involved in the
process of parasite reactivation.
2.2.1 Developmental arrest/reactivation and signaling pathways in Caenorhabditis
elegans
Caenorhabditis elegans, the free-living soil nematode, is a valuable model system for
parasitic nematodes of both plants and animals. C. elegans has a relatively short life cycle
(~4 days) which also involves development through four larval stages (L1-L4) to the adult
stage. Normal development and hermaphroditic reproduction occurs in the presence of
adequate food (soil bacteria), optimal temperatures and low population density (Riddle and
Albert, 1998). However, when the population density or temperatures are very high and food
resources are limited, an alternate developmental pathway occurs resulting in a non-feeding
dauer larva which can persist for several weeks without feeding (but also with the capacity
for motility, albeit only when necessary e.g. prodding). With the return of favorable
environmental and food conditions, the dauer larva begins feeding and resumes development
to an adult. C. elegans perceives the environmental signals via chemosensory neurons located
in its head, namely ASI, ASJ, ADF and ASG (Riddle and Albert, 1998). From extensive
genetic and molecular studies, at least three signaling pathways have been shown to regulate

9
the entry and exit from the dauer stage, namely, a TGF-β-like, an insulin-like, and a cGMP-
regulated pathway (Massague, et al., 2000; Braeckmann, et al., 2001; Birnby, et al., 2000).
TGF-β pathway
The TGF-β pathway in C. elegans comprises a series of genes including a ligand
encoding daf-7, and the type I and type II receptors (daf-1 and daf-4 respectively). By
analogy to TGF-β signaling in the mammalian system, it was hypothesized that daf-7 binds
to and activates the receptor daf-1/daf-4 complex. Genetic analysis has shown that daf-1 acts
as the type I receptor in the signaling cascade and has been localized to the amphidial
chemosensory neurons in the head of the worm (Gunther, et al., 2000). The second receptor
is encoded by daf-4 and shows 30% amino acid identity with the conserved kinase domain in
daf-1, and 40% and 34% identity to the mouse activin type II receptor and human type II
TGF-beta receptor, respectively (Estevez, et al., 1993). It was also shown by the authors that
DAF-4 binds to the mammalian bone morphogenetic protein BMP-2 and its expression at the
L1 stage is enough to rescue the dauer constitutive phenotype (Estevez, et al., 1993). Since
DAF-4 can act in a cell non-autonomous way (Inoue and Thomas, 2000), it has been
suggested that DAF-7 might be binding to DAF-4 on neurons to generate a secondary signal
that acts to promote differentiation of tissue involved in development to the adult stage (Beall
and Pearce, 2002).
A second TGF-β pathway, involving the dbl-1 TGF-β like ligand, and the receptors
sma-6 (another Type I receptor) and daf-4, has been shown to be involved in the regulation
of body size and male tail formation (Patterson and Padgett, 2000). Other genes with
10
homology to the TGF-β ligands have been identified in C. elegans but have not been
characterized.
Insulin-like growth factor pathway
The insulin-like daf-2 receptor associated pathway acts synergistically with the
pathway activated by the daf-7 TGF-β-type signal (Ogg, et al., 1997) in dauer
arrest/reactivation. There are 38 insulin-like proteins that have been identified in C. elegans
and can act as potential ligands (Pierce, et al., 2001; Li, et al., 2003). Of these, DAF-28 is
expressed in the ASI and ASJ chemosensory neurons and its expression is downregulated by
dauer-inducing conditions (Li, et al., 2003). These findings suggest that DAF-28 is the
functional ligand for DAF-2 and necessary for prevention of dauer formation. The
transmembrane DAF-2 receptor is a tyrosine kinase that facilitates the formation of a dauer
under favorable conditions (Kimura, et al., 1997). Upon ligand binding, DAF-2 gets
autophosphorylated and activates AGE-1, a phosphatidylinositol-3-OH kinase (Morris, et al.,
1996; Malone et al., 1996). Subsequently, activated AGE-1 produces secondary messengers
phosphatidylinositol bis and tris- phosphate phospholipids, PIP2 and PIP3. These secondary
messengers activate other kinases like Protein kinase B (PKB/Akt) and 3-phosphoinositide-
dependent kinase (PDK). Two PKB/Akt kinases, AKT-1 and AKT-2 have been found to
mediate this signaling in C. elegans (Paradis and Ruvkun, 1998). Later, PDK-1 was
identified and shown to be involved in DAF-2 signaling (Paradis, et al., 1999). These
activated kinases phosphorylate DAF-16, a forkhead transcription factor, which presumably
regulates long-lived dauer larva (McElwee, et al., 2003).
11
Cyclic GMP signaling pathway
The cGMP pathway includes a membrane guanylyl cyclase that binds an undefined
ligand and catalyses the synthesis of the secondary messenger cGMP from GTP. ‘Loss-of-
function’ mutants of the membrane guanylyl cyclase constitutively enter the dauer stage and
have been shown to be rescued by membrane permeable analogues of cGMP (Birnby, et al.,
2000). It appears that the cGMP signaling pathway might be involved in dauer development
upstream of daf-7 pathway. There is evidence that a guanylyl cyclase, DAF-11, is necessary
to stimulate expression of DAF-7 (Murakami, et al., 2001). Expression of daf-11 cDNA by
cell specific promoters suggests that daf-11 acts cell autonomously in ASI chemosensory
neurons for daf-7 expression (Murakami, et al., 2001).
2.2.2 Signaling Pathways in Parasitic Nematodes
Over the years evidence has emerged that similar signaling pathways might be
present in parasitic helminths for the purpose of regulating the resumption of development
upon receiving the appropriate signals from the host. Components of both the TGF-β and
insulin-like pathways have been investigated in several different parasites to understand how
they may regulate the entry into and exit from the arrested state. In parasitic nematodes
components of the TGF-β signaling pathway were first identified in the filarial nematodes,
Brugia malayi and Brugia pahangi, which cause lymphatic filariasis and elephantiasis in
humans and domestic pets like cats and dogs.
The first type I TGF-beta receptor, Bp-trk-1, from a parasitic helminth was cloned
from Brugia using degenerate primers (Gomez-Escobar, et al., 1997). EST sequencing efforts
of the Washington University Nematode Sequencing Project subsequently showed the

12
presence of TGF-β receptor homologs in both animal and plant parasitic nematodes
Identification of the Type II receptor daf-4-like gene has been more difficult; to date it has
been identified only by random EST sequence analyses of Strongyloides stercoralis
(GenBank Accession number BE029357).
Two genes, tgh-1 and tgh-2, encoding ligands from the TGF-beta superfamily
have been also identified in Brugia malayi (Gomez-Escobar, et al., 1998; Gomez-Escobar, et
al., 2000). The tgh-1 gene shows greatest homology to the bone morphogenetic protein
subfamily of BMP1 and has been shown to be maximally expressed at the first (L1 to L2)
and second (L2 to L3) molts, and is completely absent in the stages associated with
developmental arrest, i.e. microfilaria (similar to an L1) (Gomez-Escobar, et al., 1998).
Expression of tgh-1 at a time when the parasites are maturing and molting and its homology
to BMP subfamily is suggestive of a role in growth and development of the parasite. The
second ligand encoding gene, tgh-2, was identified the B. malayi EST database (Washington
University Nematode Sequencing Project) and is most similar to the C. elegans daf-7 gene.
Expression of tgh-2 is greatest in microfilariae (L1 larvae) and also in adult male and female
parasites (Gomez-Escobar, et al., 2000), therefore, coinciding with developmental arrest as
well as terminal development of the parasite.
Components of the TGF-β signaling pathway have also been identified in other
classes of helminthic parasites including Schistosoma mansoni which is a trematode or
flatworm. The type I TGF-β receptor, Smrk-1, shares up to 58% homology with the
conserved kinase domain of other type I TGF-β receptors but is considered a divergent
member of this family as it has an atypical GS domain that is involved in regulation of type I
receptor kinase activity (Davies, et al., 1998). A chimeric receptor containing the

13
extracellular domain of SmRK1 joined to the intracellular domain of the human type I TGF-β
receptor. The chimeric receptor bound radiolabeled TGF-β and activated a luciferase reporter
gene in response to both TGF-β1 and TGF-β3 but not BMP7 (Beall and Pearce, 2001). This
study suggests that a host ligand may directly stimulate parasite-associated receptors of the
TGF-β pathway. Recently, a type II TGF-β receptor was isolated from S. mansoni and was
found to be most closely related to the Activin type II receptor family (Forrester, et al.,
2004).
In 2001, an insulin-like homolog was cloned and sequenced in Strongyloides
stercoralis (GenBank Accession number BG224639) but a daf-2 like insulin receptor has not
been identified. Regardless, a forkhead transcription factor gene, fktf-1, proposed to be
orthologous to the C. elegans dauer-regulatory gene daf-16 was discovered in S. stercoralis.
Discovery of fktf-1 indicates the presence of an insulin-like signaling pathway in S.
stercoralis similar to that known to regulate dauer development in C. elegans (Massey, et al.,
2003). Ablation of neuron pairs ASF and ASI in S. stercoralis larvae, an intestinal nematode
of humans and dogs, caused the larvae to develop directly into the dauer-like infective resting
stage and prevented development of the soil-dwelling adult worms (Ashton, et al., 1998).
Loss of the sensory neurons presumably interfered with generation of signals needed for
normal development from a larva to an adult.
2.2.3 Signaling Pathways in Hookworms
The hookworm parasites and C. elegans fall within the same clade in the phylum
Nematoda ie Clade V (Blaxter, 1998). It is therefore plausible to speculate that many
developmental control mechanisms are shared between A. caninum and C. elegans. Recently,

14
two A. caninum TGF-β-like ligands, Ac-dbl-1 and Ac-daf-7 were cloned and characterized
(Freitas and Arasu, 2005). Ac-dbl-1 showed 60% amino acid identity to the C. elegans dbl-1
while Ac-daf-7 showed 46% amino acid identity to C. elegans daf-7. Since C. elegans daf-7
mutants are constitutive dauers, Rajan (1998) hypothesized that parasitic nematodes behave
as if they were daf-7 mutants to ensure developmental arrest at the L3 stage. He proposed
that these parasites then utilize the daf-7 gene product from their host to reenter the
developmental pathway.
In support of this hypothesis, an in vitro assay was used to show that physiological
concentrations of recombinant mammalian TGF-β isoforms, TGF-β1 and TGF-β2, had
significant stimulatory effects on tissue-arrested larvae resulting in the resumption of a
feeding response; additionally, the stimulatory effect of normal dog serum could be blocked
by preincubation with anti-TGF-β antibodies (Arasu, 2001). These in vitro
feeding/reactivation analyses also showed that the pregnancy/lactation associated hormones
estrogen and prolactin did not have a stimulatory effect on infective or tissue-arrested A.
caninum larvae (Arasu, 2001); insulin was also shown to not have a direct effect but as
mentioned above, TGF- β isoforms 1 as well as 2 had a direct effect on the feeding or
reactivation response of tissue-arrested larvae.
To further investigate the role of insulin signaling in hookworm larval activation, the
phosphatidylinositol-3-OH kinase inhibitor LY294002 was tested for its effect on in vitro
activation using the resumption of feeding as a marker for activation. LY294002 prevented
feeding in A. caninum infective larvae stimulated with host serum filtrate and a glutathione-
analogue, the muscarinic agonist arecoline, or the cell permeable cGMP-analogue 8-bromo-
cGMP (Brand and Hawdon, 2004). Similar results were seen with the congeneric hookworm

15
A. ceylanicum. These data suggest that an insulin-signaling pathway mediates activation in
hookworm larvae, as in C. elegans, and that the phosphatidylinositol-3-OH kinase inhibitor
acts downstream of the cGMP and muscarinic signaling steps in the pathway. In A. caninum,
LY294002 had no effect on the release of excretory/secretory products associated with
activation, suggesting that the secretory pathway diverges from the activation pathway
upstream of the phosphatidylinositol-3-OH kinase step (Brand and Hawdon, 2004). These
results provide additional support for the insulin-signaling pathway as one of the primary
pathway for activation to parasitism in hookworm larvae.
The in vitro feeding assay has been used in several studies above as a direct
method to evaluate the activation status of larval stages with feeding being equated to
resumption of development (Hawdon and Schad, 1990, 1992; Hawdon, et al., 1993). Over
the years many factors such as 10% normal canine serum (Hawdon and Schad, 1990),
reduced glutathione (Hawdon and Schad, 1992), muscarinic antagonists (Tissenbaum, et al.,
2000) and cyclic GMP (Hawdon and Datu, 2003) have been shown to stimulate similar
feeding behavior in A. caninum iL3. Using flourescein isothiocyanate (FITC)-labeled bovine
serum albumin it was shown that in the presence of 10% normal canine serum A. caninum
iL3 displayed significant feeding behavior (a classic C. elegans dauer reactivation response)
at 37ºC in presence of 5% CO2 (Hawdon and Schad, 1990). Reduced glutathione stimulated
larval feeding in greater than 90% of the iL3 population, in a specific and concentration-
dependent manner with highest at 5-10 mM, and reaching a plateau at 25-50 mM (Hawdon
and Schad, 1992). Using increasing concentrations of oxotremorine and other muscarinic
agonists, it was shown that muscarinic pathway regulates the recovery of A. caninum
developmental arrest (Tissenbaum, et al., 2000). Recently, a membrane permeable analogue

16
of cyclic GMP, 8-bromo-cyclic GMP, was tested for its ability to stimulate feeding in iL3.
Populations of iL3 reached maximum feeding at 3.5-5.0 mM and secreted Ancylostoma
secreted protein 1 suggesting reactivation (Hawdon and Datu, 2003).
2.2.4 TGF-β and insulin in the mammalian system
Different isoforms of mammalian TGF-β are closely related structurally and
functionally but have diverse tissue-specific signaling effects on growth and differentiation.
TGF- β1 isoform predominates in many tissue locations including skeletal muscle which is
the preferred site of arrest for the A. caninum larvae (Lee, et al., 1975). It is known to be
released by major inflammatory cells like eosinophils and mast cells that respond to parasitic
infections (Wong, et al., 1991; Baumgartner, et al., 1996). TGF- β1 has also been suggested
to play a role in the regeneration of skeletal muscle tissue (Husmann, et al., 1996). TGF- β2
is the dominant isoform in the uterus and mammary gland and has been shown to be
specifically upregulated by estrogen and prolactin, the hormones associated with
pregnancy/lactation (Cheng, et al., 1993; Schneider, et al., 1996). Plasma levels of TGF- β2
show a transient increase during the peri-parturient period as compared to levels during
normal non-pregnant state (Schneider, et al., 1996). IGF-1 has been shown to be present in
myoepithelial cells of mammary gland of non-pregnant, pregnant and lactating rats. IGF-1
synthesized in mammary gland is reported to play a role in development of this organ during
pregnancy as mammary epithelial cells also express specific IGF-1 receptors (Marcotty, et
al., 1994). During lactation, IGF-1 can be transferred from serum into milk (Marcotty, et al.,
1994).

17
2.3 Host Response to Arrest and Reactivation of Parasites
During developmental arrest or hypobiosis parasites persist inside the host in a
quiescent manner and reactivate in response to unknown stimuli. Upon reactivation the
parasite resumes development thereby leading to reinfection of the host, spread into the
environment and transmission into the newborn (Schad and Page, 1982; Schad, 1990; Shoop,
1991). It has been well documented in A. caninum infection of dogs that developmentally
arrested L3 larvae reactivate during pregnancy and are transmitted to the neonatal puppies
via suckling of milk from infected dams (Stone and Girardeau, 1968; Stoye, 1973; Burke and
Roberson, 1985). A similar phenomenon of arrest and reactivation has been suggested for A.
duodenale infection of humans (Arasu and Kwak, 1999). Reactivation of arrested larvae has
been hypothesized to occur, directly or indirectly, due to influence of maternal hormones
during pregnancy and lactation (Stone and Smith, 1973; Stoye and Krause, 1976). It was
shown that repeated exogenous administration of pregnancy-associated hormones, such as
estrogen, progesterone and prolactin, to ovariectomized post-partum A. caninum infected
dogs harboring tissue arrested L3 led to gradual resurgence of L3 larvae in milk by induction
with oxytocin for milk let down (Stoye and Krause, 1976).
Previous work has shown that expression and secretion of TGF-β2 is tightly regulated
by estrogen and prolactin which are critical factors in the tissue-specific regulation of the
local production of TGF-β2 in the mammary gland and uterine tissues (Schneider, et al.,
1996). Furthermore, elevated levels of TGF-β2 were detected in late pregnant maternal
plasmas (> 100 pM), and in the milk (> 500 pM) during early lactation (Schneider, et al.,
1996) whereas normal endogenous levels of TGF-β1 and TGF-β2 in sera of mouse are 125

18
ng/ml and 5 ng/ml (Emax Immunoassay kit, Promega, Madison, WI). These findings suggest
that host-derived TGF-β might play a role in reactivation of tissue-arrested larvae.
Furthermore, studies in rats and pigs have demonstrated that IGF-1 is also
upregulated during pregnancy (Marcotty, et al., 1994; Lee, et al., 1993). In rats, maternal
serum IGF-I concentration rose during the first half of pregnancy while in the second half of
pregnancy, the mean serum IGF-I concentration fell sharply from 1140 +/- 150 ng/ml at
seven days of pregnancy to 470 +/- 85 ng/ml at 20 days. Using RNase protection assay it was
determined that from the onset of pregnancy to term, IGF-I gene expression in the mammary
gland diminished (Marcotty, et al., 1994). Similarly in mammary tissue of pregnant pigs,
steady-state levels of the mRNAs encoding IGF-I, IGF-II and type-I IGF receptor as well as
the levels of the membrane-associated type-II IGF receptor were higher during the early
phase of mammogenesis (< or = day 45) than during the subsequent stages of mammary
development. Mammary IGF-I, IGF-II and type-I receptor mRNAs were expressed at their
lowest levels around day 90 of pregnancy (20-40% of those for day 30 of pregnancy) (Lee, et
al., 1993).
To understand the underlying mechanisms of tissue-arrest and subsequent
reactivation, a murine model of infection was developed (Stoye and Krause, 1976; Arasu and
Kwak, 1999). The mouse serves as a paratenic host for A. caninum in that infective larva
does not develop into mature adults but instead distributes throughout the body persisting for
extended periods in a developmentally arrested state (Lee, et al., 1975). These tissue-arrested
larvae do however have the capacity to reactivate and display the same transmammary
transmission as seen in dogs and humans. In previous studies, 2-4 % (Steffe and Stoye, 1984)
19
and up to 8% (Arasu and Kwak, 1999) of tissue-arrested larvae in the dam reactivated and
got transmitted to the nursing pups during post-partum lactation.
From an immunological perspective, BALB/c and C57BL/6 mice are known to
typically display divergent immune responses to infection with BALB/c displaying a Th2
biased response and C57BL/6 mice predominantly produce Th1 cytokines (Brenner, et al.,
1994; Nabors, et al., 1995; Honore, et al., 1998). However, when these two strains were
compared there was no difference in tissue larval burden or in numbers transferred to pups
(Arasu and Kwak, 1999). Initial comparisons of BALB/c versus C57BL/6 mice showed that
both the strains mounted strong Th2 biased IgG1 and IgE antibody responses to A. caninum
infection (Arasu and Heller, 1998) and that the immune response was not directly correlated
with the phenomenon of larval reactivation/transmission.
2.4 Helminthic infection and Host Immune Responses
Mosmann and others defined the two distinct CD4+ T cell subsets by differential
secretion of cytokines (Mosmann et al., 1986), which has revolutionized the understanding of
regulatory mechanisms underlying resistance and susceptibility to helminth infection. The T
helper type 1 (Th1) cells produce type 1 cytokines IFN-γ, lymphotoxin, and IL-2 stimulating
immunoglobulin (Ig) G2a production and cell mediated effector responses. The T helper 2
(Th2) secrete type 2 cytokines IL-4, IL-5, IL-6, IL-9 and IL-13 and promote mastocytosis,
eosinophilia, and the production of IgE and IgG1 (Mosmann and Sad, 1996; O` Garra, 1998).
Traditionally, immune responses to extracellular helminth parasites have been considered to
be Th2 in nature (Pearce and Reiner, 1995). This inference is based primarily on animal
models of helminthic infections. Human studies also suggest that Th2 cytokines dominate the

20
immune responses seen in chronic, longstanding helminth infections (King and Nutman,
1991). Where helminths inhabit a tissue environment, the situation is considerably more
complex. One explanation for this is that, although Th1 responses may be more effective at
parasite clearance, they are also more likely to cause more pathology (Pearce, et al., 1996).
The skew to a Th2 response may reflect the classic compromise of minimizing host
pathology at the expense of accepting some level of continuing infection.
2.4.1 Immune Responses to Parasitic Helminths
Recently an in vitro system was used to study the early immune responses to infective
L3 from Brugia malayi by co-culturing with peripheral blood mononuclear cells (PBMCs)
from previously unexposed individuals. After 24 h of culture, the frequency of T cells
expressing Th1 cytokines (IFN-γ, TNF-α) was significantly increased in comparison to ones
expressing Th2 cytokines (IL-4, IL-5, IL-10) (Babu and Nutman, 2003). This data suggests
that the initial primary immune response to infective L3s of B. malayi is not predominantly
Th2 but rather dominated by a proinflammatory Th1 response. This finding in conjunction
with similar findings from study of immune responses in the schistosome trematodes reveals
an emerging pattern of dominant Th1 responses during the early phase of helminthic
infections (Pearce, et al., 1991). The main adaptive immune response against Schistosomes is
mediated by CD4 T cells (Hernandez, et al., 1997a). An initial pro-inflammatory Th1-
polarized response lasts around five weeks post-infection, at which point granulomatous
inflammation gets underway. However, within the next one or two weeks, granuloma
formation rises amid a dramatic change in the cytokine environment which become
dominated by anti-inflammatory Th2-type cytokine (Pearce, et al., 1991). IL-4 along with T-

21
cell co-stimulatory systems (B7-CD28, CD40-CD40L) contribute to this conversion (Brunet,
et al., 1997; Hernandez, et al., 1999; MacDonald, et al., 2002). The evolving cellular
response is gradually accompanied by abundant production of mainly non-complement fixing
IgG and IgE antibodies (Hernandez, et al., 1997b). A Th1 to Th2 conversion is vital for the
host because it has been demonstrated that failure to convert is associated with a lethal
disease characterized by severe hepatic inflammation with hepatocellular injury and necrosis
(Hernandez, et al., 1999; MacDonald, et al., 2002).
A spectrum of responses develops against Trichuris muris, whipworm nematode
infection in genetically different strains of mice. Cellular responses range from a strong Th2
response associated with worm expulsion (BALB/c mouse), to a mixed Th1 and Th2
response and delayed expulsion (C57BL/6 mouse), to finally a Th1 response resulting in a
chronic infection (AKR mouse) (Deschoolmeester, et al., 2002; Anderson, 2000). Additional
studies demonstrated that blockade of the IL-4 receptor in the C57BL/6 resistant mouse
strain resulted in the production of a Th1 response with the development of a chronic
unresolving infection (Else, et al., 1994). Conversely, administration of IL-4 to susceptible
mouse strain BALB/c resulted in the expansion of Th2 response and clearance of infection
(Else, et al., 1994). The T. muris system provides clear evidence that it is the interplay
between host response and parasite survival strategies that lead to the observed infection
levels. It is clear that a host genotype that leads to development of a strong and dominant Th2
response infection will lead to resistance (Grencis, 2001).

22
2.4.2 Immune Responses to Hookworms
The complexity of the hookworm life cycle offers numerous opportunities for the
parasite and host to interact at the molecular level. Extensive antibody responses are mounted
against larval and adult hookworms, but their effect on the parasite remains unclear.
Furthermore, it is difficult to distinguish between anti-larval and anti-adult responses, given
that L3s and adults share many antigens (Carr and Pritchard, 1987; Behnke J, 1991). In many
respects, hookworms are typical gastrointestinal nematodes in the types of immune responses
they generate in their definitive hosts (hosts in which the life cycle is completed i.e. infective
larvae can mature to reach the adult stage). Antibody isotypes and subclasses as well as
cellular responses loosely fit within the framework of a Th2 immune response. The common
features of helminth-induced Th2 responses have long been noted as IgE production,
eosinophilia and mastocytosis. While much of the IgE response in helminth infection is not
directed against the parasite, the detection of IgE antibodies against Necator hookworm L3s
proved to be highly specific and sensitive in diagnosing infections and, furthermore, IgE was
observed to be the least cross-reactive isotype (Ganguly et al., 1988; Pritchard and Walsh,
1995).
Humoral responses (antibody production) to hookworms have been well documented;
little is known about the role of adaptive T cell responses (Loukas and Prociv, 2001). While
hookworm infection exhibits some of the hallmarks of a Th2 response (IgE and local and
systemic eosinophilia), the immune responses clearly fail to protect most infected
individuals. Recently, several studies have described T helper cell responses and
susceptibility to hookworm infection (Quinnell et al., 2004; Pit, et al., 2000 and 2001).
Observations from endemic regions in China and Brazil have shown profound cellular

23
hyporesponsiveness induced by chronic hookworm infection (Loukas et al., 2005). In a re-
infection study in Papua New Guinea, cytokine and proliferative responses to Necator were
measured. Most subjects produced detectable Th1 (IFN-γ) and Th2 (IL-4 and IL-5) cytokines
in response to crude adult worm extract before anthelminthic treatment. Pre-treatment IFN-γ
responses were negatively associated with hookworm burden and increased significantly
after anthelminthic treatment (Quinnell et al., 2004). In a separate study, peripheral blood
mononuclear cells (PBMCs) from N. americanus infected school children, who had recently
received chemotherapy, had reduced proliferative capacity against the phytohemagglutinin
mitogen and adult worm antigen extract compared to controls (Geiger et al., 2004). These
individuals also produced higher levels of IL-10 and lower levels of both Th1 (IL-12 and
IFN- γ) and Th2 (IL-5 and IL-13) cytokines. Such mixed Thl-type and Th2-type immune
responsiveness associated with persisting gastrointestinal parasitic nematodes may reflect a
state of infection where a permissive Th1-type cytokine profile favors parasite persistence
and the chronicity of infection (Pit, et al., 2001).
Over the years immune responses to hookworms have been well-studied in animal
models as well. The Syrian Golden hamster (Mesocricetus auratus) has been used to model
infections with the Ancylostoma ceylanicum hookworm (Garside and Behnke, et al., 1989).
To determine the impact of A. ceylanicum hookworm infection on host cellular responses,
cytokine production and lymphoproliferation were measured (Mendez, et al., 2005). Initial
larval infection with 100 third-stage A. ceylanicum larvae resulted predominantly in Th1
responses characterized by upregulation of IL-2, IFN-γ and TNF-α mRNA levels which
occurred during larval migration and continued up to 14 days postinfection or prepatency
(period before production of eggs). Subsequently, development of larvae into egg-laying

24
adult hookworms or patency coincided with a switch to Th2 predominant responses with a
marked increase in IL-4 and IL-10 production. This switch also concurred with reduced host
lymphoproliferative responses to hookworm antigens (Mendez, et al, 2005).
2.5 Immune responses during pregnancy
It is well-understood that pregnancy is associated with changes in local and peripheral
immune responses which appear necessary for a successful implantation of a semiallogeneic
graft, which is the fetus. Tom Wegmann and others suggested that there was a bidirectional
cytokine interaction between the maternal immune system and reproductive system during
pregnancy and, it appeared that successful pregnancy was a Th2 phenomenon (Wegmann, et
al., 1993). Based on different studies it has been a generally accepted idea that Th1 cytokines
involved in cellular responses are deleterious to pregnancy whereas Th2 cytokines involved
in humoral responses are protective for the fetus (Wegmann, et al., 1993; Nieuwenhoven, et
al., 2002). However, in the light of evidence from studies showing the requirement of IFN-γ
for implantation of blastocyst this would be an oversimplification (Ashkar and Croy, 2001).
Uterine natural killer (uNK) cells were shown to produce 90% of pregnancy-induced uterine
IFN-γ. Implantation sites in uNK cell-deficient and IFN-γ signal-disrupted mice displayed
anomalies in decidua and its spiral arteries which could adversely affect the establishment of
pregnancy (Ashkar and Croy, 2001).
It has also been shown in humans that during pregnancy the ratio of production of
Th1 and Th2 cytokines from peripheral lymphocytes and natural killer cells was decreased
(Nieuwenhoven, et al., 2002). It was previously demonstrated in rats that peripheral
lymphocytes, monocytes and granulocytes shown an activated phenotype in the last week of

25
pregnancy (Faas, et al., 2000). A recent study evaluated the species difference between
humans and rats for lymphocyte cytokine production during pregnancy (Faas, et al., 2005).
The study revealed that during human pregnancy, the percentage of lymphocytes producing
IFN-γ was decreased but the percentage of IL-4 producing lymphocytes was not affected. In
contrast, the rat immune system adapted to pregnancy by decreasing the total number of
various lymphocytic populations but not by affecting the percentage of IFN-γ and IL-4
producing lymphocytes (Faas, et al., 2005).
2.5.1 Effect of Pregnancy Hormones on Immune Responses
There is a large body of data implicating the effect of pregnancy levels of estrogen on
the Th1/Th2 cytokines. Previously published data suggests that female hormones may act to
bias T cells towards a Th2 phenotype (Krishnan, et al., 1996a and b). Support for estrogen’s
role in enhancement of Th2 responses is provided by studies in experimentally-induced
allergic encephalomyelitis (EAE) and collagen induced arthritis (CIA) models; which are
believed to be instructive models for multiple sclerosis (Kim, et al., 1999; Gilmore, et al.,
1997). Treatment of EAE mice with estrogen led to reduction of IFN-γ- dependent anti-
myelin basic protein IgG2a and increased production of IL-10 (Kim, et al., 1999). In the CIA
model, estradiol caused a reduction in IFN-γ expression whereas Th2 cytokine production
was not increased (Gilmore, et al., 1997). Clinical signs in both the diseases improved after
estrogen treatment.
Besides estrogen, progesterone is also likely to contribute to pregnancy being a Th2-
dominant effect (Kidd, 2003). When mice made arthritic with Borrelia burgdorferi, the
causative agent for Lyme disease, were either impregnated or injected with progesterone,

26
arthritic signs ameliorated and IL-4 was markedly increased (Moro, et al., 2001). Joachim
and others showed that dydrogesterone (6-dehydro-retroprogesterone), a progesterone
derivative, dramatically increased the percentage of IL-4 positive decidual immune cells in
stressed mice. Their data suggested that dydrogesterone abrogated stress-triggered abortion
by inducing a Th2 biased local immune response (Joachim, et al., 2003).
Very little data is available to implicate prolactin, the pituitary-derived hormone
responsible for milk letdown after parturition, as a factor affecting Th1/Th2 responses during
pregnancy. It is well known that prolactin has an immunoregulatory function and receptors
for prolactin are present on T and B lymphocytes (Gunes and Mastro, 1997). Prolactin
production increases 10-fold at full-term pregnancy and 30-fold during suckling in the post-
partum period (Ostensen, 1999). Prolactin has also been found elevated in Systemic Lupus
Erythematosus (SLE) patients of both sexes and correlated to disease activity in several
studies (Ostensen, 1999).
2.5.2 Effect of Parasitic Infection on Pregnancy
Relatively few studies have been focused on the effect of infection concurrent with
pregnancy. Infection with apicomplexan parasite Plasmodium falciparum, which causes
malaria, has been recognized to have adverse effects on pregnancy (Brabin and Brabin,
1992). Pregnant women suffer higher incidences of infection, more severe pathology and
higher mortality than any other group of the population (Menendez, 1995). In a report on
cytokine concentrations in placentas collected from women delivering in urban hospitals in
malaria-holoendemic or nonendemic areas of Kenya, normal placentas displayed a bias
toward Th2 cytokines; Th1 cytokines IFN-γ and IL-2 were absent in placentas not exposed to

27
malaria but present in a large proportion of placentas from the holoendemic areas. TNF-α and
TGF-β concentrations were significantly higher in placentas from the holoendemic area
(Fried, et al., 1998). Other studies have also suggested that malaria infection induces a
potentially harmful proinflammatory response in the placenta with a significantly increased
mRNA expression of IL-1β, IL-8, and TNFα (Moormann, et al., 1999).
The protozoal parasite, Neospora caninum, causes neuromuscular disease, abortion,
stillbirth and congenital infection in livestock and companion animals (Dubey and Lindsay,
1996). Reactivation of latent N. caninum is often associated with pregnancy (Quinn, et al.,
2002a). Numerous studies in mice and cattle have shown that immunity to N. caninum
infection involves a predominantly Th1-type immune response as would be expected for
single-celled parasites (Khan, et al, 1997; Lunden, et al., 1998; Tanaka, et al., 2000).
However, a variety of studies on the immune system during pregnancy along with a
concurrent N. caninum infection have demonstrated that immunity during pregnancy is
biased towards a Th2 type response and away from a Th1 response (Quinn, et al., 2002b;
Kano, et al., 2005). Spleen cells from both infected/non-pregnant and infected/pregnant mice
produced IFN-γ, TNF-α and IL-12 (Th1) and IL-10 (Th2); however the levels of Th1 (IFN-γ,
TNF-α and IL-12) cytokines were significantly lower. Infected/pregnant mice exclusively
produced higher levels of IL-4 and it appeared to be responsible for decline in Th1 cytokine
production (Quinn, et al., 2004). Another study conducted in BALB/c mice to examine the
relationship between occurrence of vertical transmission and Th1 /Th2 type of immune
responses suggested that mice infected during pregnancy may acquire a weaker immune
response against N. caninum than mice infected before pregnancy (Kano, et al., 2005).
28
Results also suggested that mice infected during pregnancy may show an enhanced Th2
immune response during recurrence of infection (Kano, et al., 2005).
Leishmania major infection in mice is an excellent model for illustrating the
importance of Th1 response for the control of intracellular protozoan infections (Louis, et al.,
1998; Scott and Farrell, 1998). C3H and C57BL/6 strains of mice mount a strong Th1
response to L. major, which controls parasite multiplication, whereas BALB/c mount a
strong Th2 response and are incapable of resolving the infection (Sadick, et al., 1986;
Heinzel, et al., 1989; Locksley and Louis, 1992). The combination of pregnancy and L. major
infection in resistant mice (C57BL/6) can be predicted to have two outcomes. Firstly,
pregnancy may compromise resistance to L. major infection and secondly, a dominant Th1
response to the parasite may in turn compromise pregnancy (Krishnan, et al., 1996a;
Krishnan, et al., 1996b). In the first scenario where pregnancy was suggested to compromise
resistance to infection, parasite burden was increased when compared with non-pregnant
infected mice. This was seen in association with enhanced expression of cytokines such as
IL-4, IL-5 and IL-10 as well as reduced production of IFN-γ by lymph node and spleen cells
(Krishnan, et al., 1996a). In the second scenario where a Th1 response was implicated for
compromising pregnancy, frequency of viable pregnancies in infected mice was much less
than in pregnant non-infected mice. This corresponded with a relatively low placental
production of IL-4 and IL-10, and an increase in IFN-γ and TNF-α production by placental
cell (Krishnan, et al., 1996b). It was suggested that increased implantation failure or fetal
resorption was probably due to beneficial anti-parasite Th1 responses which were adversely
affecting the pregnancy outcome (Krishnan, et al., 1996b).

29
Figure 2.1 Life cycle of Ancylostoma caninum in the host and environment.
Host
Environment
Larval arrest
EEgggg -- LL11//LL22 -- LL33 -- LL44 -- AAdduulltt ((mmaallee aanndd ffeemmaallee))
30
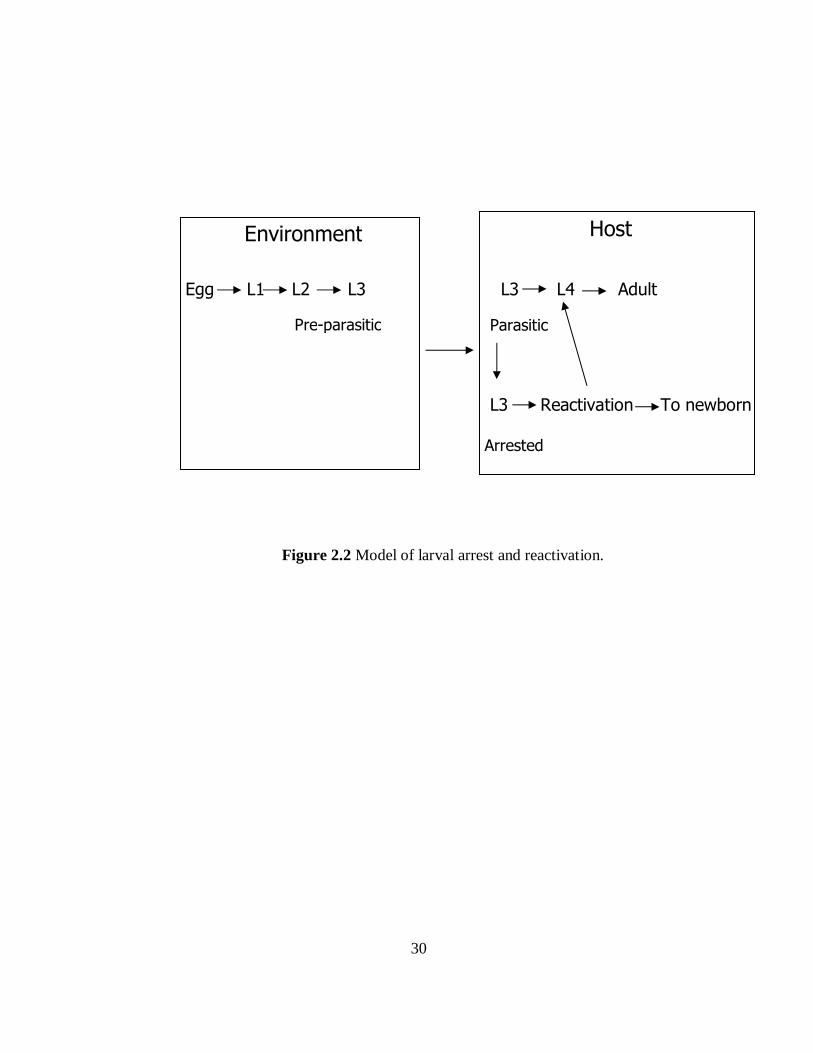
Figure 2.2 Model of larval arrest and reactivation.
Environment
Egg L1 L2 L3
Pre-parasitic
L3 L4 Adult
Parasitic
L3 Reactivation To newborn Arrested
Host

31
3. Transcript and serum levels of TGF-β and IGF-1 during pregnancy and Ancylostoma
caninum infection in BALB/c mice
3.1 Introduction
Ancylostoma caninum is a blood feeding intestinal nematode found in dogs and is one
of the major parasitic infections in the US pet population (Blaghburn, et al., 1996). It is
closely related to human hookworms, A. duodenale and Necator americanus, which are
estimated to infect over 1.2 billion people worldwide (De Silva, et al., 2003). Like several
other parasitic nematodes, A. caninum also has the capacity to undergo developmental arrest
within the infected host (Schad, 1979, 1990; Schad and Page, 1982). Developmental arrest or
hypobiosis is a strategy used by parasites to evade the host responses, persist for long periods
and subsequently reactivate upon receiving appropriate but unknown stimuli for resuming
development. Reactivation of this latent reservoir of infection can lead to reinfection as well
as transmission of relevant parasitic stages to the surrounding environment or to the neonates
(Shoop, 1991). It has been well documented in dogs that developmentally arrested third-stage
larvae of Ancylostoma sp. reactivate during pregnancy and get transmammarily transmitted to
the suckling newborn puppies via milk (Stone and Girardeau, 1968; Burke and Roberson,
1985). A similar phenomena has been suggested for A. duodenale infection in humans and is
of considerable importance as of the 1.2 billion people infected worldwide with hookworm
disease (A. duodenale and N. americanus), 44 million are pregnant women (Wang, 1988;
Schad, 1991; Bundy, et al., 1995). The reactivation of arrested larvae during pregnancy has
long been hypothesized to be under the influence of hormonal fluctuations associated with
different stages of pregnancy and lactation (Stoye and Krause, 1976). Experiments in which

32
pregnancy associated hormones- estrogen, progesterone and prolactin- were administered
exogenously into ovariectomized, post-partum bitches, a gradual resurgence of L3 stage
larvae were observed in oxytocin-induced milk (Stoye and Krause, 1976).
Caenorhabditis elegans, a well-studied free-living nematode, undergoes similar
arrested development in response to environmental cues like food, temperature and
pheromones. Extensive studies in C. elegans have identified genes that control entry into and
exit from the arrested larval state (Georgi, et al., 1990; Estevez, et al., 1993; Ren, et al.,
1996). One of these genes is daf-7 which has sequence homology to members of the TGF-β
superfamily and is expressed on one of the chemosensory neurons located in the amphidial
region at the anterior end of the worm. Environmental cues such as food exposure triggers
daf-7 expression and correlate with larval recovery from the arrested state (Ren, et al., 1996).
Recently, two TGF-β-like genes, Ac-dbl-1 and Ac-daf-7, were cloned and characterized from
A. caninum suggesting the existence of similar signaling machinery (Freitas and Arasu,
2005). Additionally an in vitro assay was used to show that at physiological concentrations,
recombinant mammalian TGF-β isoforms, TGF-β1 and TGF-β2, had significant stimulatory
effects on tissue-arrested larvae which could be blocked by preincubation with anti-TGF-β
antibodies (Arasu, 2001). However, in vitro analyses also showed that estrogen, prolactin and
insulin did not have a direct effect on the feeding/reactivation response of infective or tissue-
arrested A. caninum larvae (Arasu, 2001). Other studies have shown that expression and
secretion of TGF-β2 is regulated by estrogen and prolactin which are critical factors in the
tissue-specific regulation of the local production of TGF-β2 in the mammary gland and
uterine tissues (Schneider, et al., 1996). These findings suggest host-derived TGF-β might

33
play a role in reactivation of tissue-arrested larvae during pregnancy resulting in
transmammary transmission of infection to the newborn mice puppies.
Another signaling mechanism that has been shown to regulate dauer formation in C.
elegans is daf-2 which is an insulin-like receptor gene (Kimura, et al., 1997). IGF-1 which is
also upregulated during pregnancy might mediate a separate signaling pathway in larval
reactivation (Lee, et al., 1993). Since phosphatidylinositol-3-OH kinase (PI3K) is component
of the insulin-like signaling pathway, role of insulin-like signaling in hookworm larval
activation was investigated in vitro using the PI3K inhibitor, LY294002, and resumption of
feeding was considered as a marker for activation (Brand and Hawdon, 2004). Muscarinic
agonists like arecoline have been shown to initiate dauer recovery in C. elegans and A.
caninum (Tissenbaum, et al., 2000). LY294002 prevented feeding in A. caninum infective
larvae stimulated with host serum filtrate, a glutathione-analogue and the muscarinic agonist
arecoline. These results suggest that an insulin-like signaling pathway mediates the
reactivation of hookworm larvae similar to C. elegans. However, it has been shown that
direct stimulation of A. caninum larvae with physiological concentrations of insulin did not
elicit a stimulatory response (Arasu, 1999).
A third signaling pathway in C. elegans for dauer arrest and reactivation involves
cGMP. The cGMP pathway includes a membrane associated guanylyl cyclase and loss-of-
function mutants of this guanylyl cyclase enter into the dauer stage constitutively (Birnby, et
al., 2000). The cell permeable cGMP-analogue, 8-bromo-cGMP, has been shown to mediate
recovery of C. elegans dauers as well as A. caninum L3 larvae from arrested state to feeding
state (Birnby, et al., 2000; Hawdon and Datu, 2003; Brad and Hawdon, 2004). Similar results
were seen with the congeneric hookworm A. ceylanicum (Brand and Hawdon, 2004). Taken

34
together, these studies suggest that several signaling pathways may be similarly relevant
during post-partum lactation in the reactivation and transmission of hookworm larvae.
To facilitate in vivo analyses of mechanisms mediating the pregnancy-induced
reactivation and transmammary transmission, our lab has defined the mouse as an
experimental model of infection. Mice serve as normal paratenic hosts for A. caninum as it
has been previously shown that the larvae distribute and arrest in different tissues throughout
the body without maturing into the adult intestinal stage (Nichols, 1956; Lee, et al., 1975;
Arasu and Kwak, 1999). Furthermore, we along with others have shown that similar to dogs,
pregnancy in mice triggers the reactivation and transmammary transmission of larvae to the
neonatal pups (Steffe and Stoye, 1984; Burke and Roberson, 1985; Arasu and Kwak, 1999).
In this study we investigated TGF-β1, TGF-β2 and IGF-1 cytokine profiles during late
pregnancy, early lactation and mid-lactation in the mouse model of A. caninum infection to
correlate their levels with the transmammary transmission of the larvae to the nursing pups.
We measured the changes in serum levels of TGF-β1, TGF-β2 and IGF-1 as well as mRNA
transcript levels in skeletal muscle (site of arrest), mammary gland (site of transmammary
transmission) and spleen as the indicator organ of immune responses to the parasitic
infection.
3.2 Materials and Methods
3.2.1 Larval Parasite cultures
Infective A. caninum L3 were harvested from charcoal co-cultures of feces from male
laboratory beagle dogs (Marshal Farms, North Rose, NY) orally infected at 8-10 weeks of
age with 150 L3 as previously described (Burke and Roberson, 1979; Arasu, 1997). The use

35
of dogs in this study was approved by the Institutional Animal Care and Use Committee at
North Carolina State University. Feces containing A. caninum eggs (range of 500-3000
eggs/g depending on stage of infection) were mixed with activated charcoal and deionized
water in Pyrex® baking trays and placed in a humidified incubator, in the dark, at 25ºC for 7-
10 days. The L3 were harvested utilizing a modified Baermann funnel assembly (Garcia and
Ash, 1979), repeatedly washed in phosphate-buffered saline (PBS) medicated with 20 mg/L
gentamicin (Sigma Chemical Co., Missouri) and 20mg/L lincomycin (Sigma Chemical Co.,
Missouri) and maintained at room temperature for 5-7 days prior to use.
3.2.2 Mice breeding
Nine to ten-week-old female BALB/c mice were purchased from Charles River
Laboratories, and maintained at the Laboratory Animal Resources facility in accordance with
Institutional Animal Care and Use Committee guidelines. Mice were mated at a ratio of 2
females: 1male for a period of 7 days and examined twice daily for the presence of a vaginal
impregnation plug. Observation of a plug was designated as day 0 of the pregnancy. On day
5 post-impregnation (observation of vaginal plug), the female mice were injected sub-
cutaneously in the dorsal cervical interscapular region with PBS (control) or with 1000 larvae
in PBS. Mice were killed by decapitation at three different time points: time point 1
corresponding to day 19 of gestation or day 14 post-infection (pi), and time points 2 and 3
corresponding to day 1 and 10 of postpartum lactation or day 15-16 pi and day 25-26 pi,
respectively (Figure 3.1). The tissue samples collected immediately after killing were
sections of the gastrocnemius skeletal muscle, mammary gland, and spleen as well as blood.
Approximately 200mg of muscle, mammary tissue or spleen was stored in RNA-STAT 60
36
(Tel-Test, Texas) at -80ºC for RNA extraction. From the blood, serum was collected after
incubation at 37ºC for 1 h, 4ºC for 4 h and subsequently stored at -20ºC until further use. The
female mice were grouped as infected or not infected and bred or not bred (n = 5 mice per
group). The resulting four groups were uninfected/unbred (UN or normal controls),
infected/unbred (IN), uninfected/bred (UB) and infected/bred (IB).
3.2.3 Harvesting tissue L3
For harvesting tissue-arrested larvae, carcasses were skinned, minced, wrapped in
eight layers of cheesecloth and incubated in a modified Baermann assembly for 4 h at 37ºC
in medicated PBS (Arasu, 1998). Migrating larvae that collected at the bottom of the cups
were repeatedly washed with medicated PBS and gently spun at 2000 rpm for 10 minutes.
Larval numbers in dams versus each litter of pups were counted with the aid of a dissecting
microscope.
3.2.4 TGF-β1 and –β2 ELISA
Biologically active TGF-β1 and β2 levels were determined using the TGF-β1 and β2
Emax® Immunoassay system (Promega, Madison, WI), a sandwich enzyme linked
immunosorbent assay (ELISA) kit. The assays were performed by coating flat-bottom 96-
well ELISA plates (Corning Costar® Acton, MA) with 100 µl of TGF- β1 and TGF- β2 coat
antibody dissolved in carbonate coating buffer. The plates were incubated at 4ºC overnight.
Non-specific binding sites were blocked using 270 µl of TGF- β1 and TGF –β2 blocking
buffer at 37ºC for 35 minutes. Serum samples diluted 1:4 using PBS and for each 50 µl of
diluted sample, 1µl of 1N HCl was added and the pH was verified to be 3.0 or lower. Serum

37
samples were mixed, incubated for 15-20 minutes at room temperature and neutralized by
adding 1µl of 1N NaOH; the pH was verified to be approximately 7.6. According to the
manufacturer, TGF-β1 standard curve was linear between 15.6 and 1000 pg/ml of the TGF-
β1 standard whereas the TGF-β2 standard curve was linear between 32 and 1000 pg/ml. The
TGF-β1 and TGF-β2 standard were supplied at the concentration of 1µg/ml and were diluted
1:1000 in TGF-β sample buffer. For each plate (100µl/well), six 1:2 serial dilutions of the
standards (starting with 1 ng/ml) and acidified serum samples (starting with 1:20) were
analyzed. The TGF-β1 and TGF –β2 controls were set at 100 pg/ml and 500 pg/ml for each
plate. The 96-well plate was incubated on a plate shaker at 500 rpm for 1.5 hours at room
temperature. After washing five times with TBST (20 mM Tris-HCl, pH 7.6, 150 mM NaCl,
0.05% Tween-20) wash buffer, anti-TGF-β1 and TGF-β2 polyclonal antibody were
respectively added at 1:1000 and 1:2000 dilutions and incubated with shaking for an
additional 2 hours at room temperature. The plates were washed five times with TBST buffer
followed by 100 ul of the TGF-β/horseradish peroxidase (HRP) conjugates diluted 1:100
with sample buffer. The plates were incubated with shaking for 2 hours at room temperature
and subsequently washed five times at the end of the incubation. For color development
100µl of 3, 3', 5, 5'-Tetramethylbenzidine (TMB) One was added to each well using a
multichannel pipettor and the plates were incubated for 15 minutes without shaking. The
color reaction was stopped by adding 100µl of 1N HCl in the same order in which substrate
was added to the wells. The blue color changed to yellow as the pH decreased. The
absorbance was recorded at 450nm on a plate reader within 30 minutes of stopping the
reaction.
38
3.2.5 IGF-1 Enzyme ImmunoAssay (EIA)
IGF-1 levels in mouse sera were determined using the Active® Mouse/Rat IGF-1 EIA
kit based on a competitive binding enzyme immunoassay (Diagnostic Systems Laboratory,
Inc., Webster, Texas). The kit contains microtitration strips coated with rabbit anti-goat
gamma globulin immobilized on the inside of each well. Pretreatment of samples involved
addition of 140 µl of the provided Sample Buffer I to 10 µl of mouse serum and incubation at
room temperature (~25ºC) for 30 minutes. Subsequently, 150 µl of Sample Buffer II was
added and mixed thoroughly. The mouse/rat IGF-1 standards were used at 0, 150, 300, 650,
1250 and 3600 ng/ml. The two controls, Level I and Level II, contained low (600 ± 175
ng/ml) and high (1100 ± 325 ng/ml) levels of mouse/rat IGF-1 in a protein-based buffer,
respectively. In the assay, 50 µl of standards, controls and pretreated sera samples were
incubated on an orbital microplate shaker at 500 rpm for 1 h at room temperature with 100 µl
of biotin-labeled mouse/rat IGF-1 and 100 µl of goat anti-mouse/rat IGF-1 antiserum in
microtitration wells allowing the unlabeled and biotin-labeled antigens to compete for the
limited number of anti-mouse/rat IGF-1 binding sites. Wells were washed five times with the
wash solution and incubated with streptavidin-horseradish peroxidase (HRPO), which binds
to the biotinylated mouse/rat IGF-1. The unbound streptavidin-HRPO was washed, followed
by incubation with 100 µl of substrate TMB chromogen solution. An acidic stopping solution
was then added to each well with a multichannel pipettor and the plate was shaken by hand
for 5-10 seconds. The degree of enzymatic turnover of the substrate was determined by dual
wavelength absorbance measurement at 450 with background wavelength correction set at
600 or 620 nm.

39
3.2.6 RNA extraction and cDNA synthesis
Total RNA from all the tissues (skeletal muscle, mammary gland and spleen) was
extracted using RNA-STAT (Tel-Test, Inc., Friendswood, TX) according to Chomczynski
and Sacchi method (Chomczynski and Sacchi, 1987). Residual genomic DNA was removed
from RNA by treating with DNase (20U per 100 µg of RNA). RNA quantity and quality was
checked by spectrophotometric measurements at 260 and 280 nm (Pharmacia) and by
analyzing 1µg RNA for rRNA bands on a 1% ethidium bromide agarose gel.
For reverse transcription, first strand cDNA was synthesized by adding 10µg of total
RNA to a 40µl reaction mix containing a final concentration of 2.5nM dNTPs, 0.1M,
dithiothreitol, 1ug Oligo d (T) primer (Promega, Madison, WI), 24U RNase inhibitor and
incubation with 200U Superscript II reverse transcriptase (Invitrogen, Carlsbad, CA) at 37°C
for 1 hour. To confirm absence of contaminating genomic DNA, RT negative reactions with
5µg total RNA were setup. RT-plus (cDNA)/minus reactions were subjected to RT-PCR
(reverse transcription-polymerase chain reaction) using GAPDH primers as it was abundantly
expressed in all tissues of interest. PCR reactions were run on a 2% agarose gels to check for
product formation.
3.2.7 Primer design
Primer sets for genes of interest, TGF-β1, -β2, IGF-1, IL-4 and IFN-γ, and reference
gene 60S acidic ribosomal protein were designed from mouse-specific Genbank sequences
listed in Table 3.1 using Primer 3 software (Rozen and Skaletzky, 2000) (http://www-
genome.-wi.mit.edu/cgi-bin/primer/primer3_www.cgi). In order to minimize primer-dimer
formation, the maximum self-complementarity was 6 and the maximum 3’ self-

40
complementarity was 0. The targets amplified by primer pairs were characterized using the
Mfold program (SantaLucia, 1998) (http://bioinfo.math.rpi.edu/~mfold/dna/form1.cgi) for
predicting the nature of any secondary structures which may form at the site of primer
binding. Primer pairs that bound at the site of predicted loop were discarded. Primer sets
were synthesized by Integrated DNA Technologies (Coralville, IA) and primers were
reconstituted at100 pM/ul in nuclease-free water prior to use.
3.2.8 Real-time PCR
The real-time PCR reactions were carried out using the iCyclerTM iQ PCR detection
system (Bio-Rad Laboratories, Hercules, CA, USA). In each 25µl reaction, 12.5µl of iQTM
SYBR green supermix (Bio-Rad) was added to 300nM of each primer along with 250ng of
cDNA. PCR amplification was performed in duplicate for each sample using the following
cycle conditions: 3 min at 95°C followed by 45 repeats of 1 min at 95°C, 30s at 55°C and 30s
at 72°C. Temperature optimization was carried out for all the primer sets to be amplified
simultaneously. Annealing temperatures were tested from the 50-65ºC range; all the primer
sets amplified optimally at 55ºC. A melt curve analysis step was included at the end of cycles
to check for primer-dimer and non-specific product formation. Efficiency of the PCR
reactions was derived by doing a standard curve of 10-fold serially diluted mouse spleen
cDNA and was consistently in the 95-98% range. Non-template controls were used to detect
any genomic DNA contamination and amplified products were also examined on a 2%
agarose gel to verify that the amplified products were of the expected sizes. Raw Ct values
were analyzed using Relative Expression Software Tool-384 (REST-384) to generate a fold
increase or decrease in the transcript levels (Pfaffl, et al., 2002). The 60S acidic ribosomal

41
protein was used as the endogenous reference gene for normalizing transcript levels among
tissues of interest. 60S ribosomal protein was previously shown to be the least variable from
comparative analyses of various genes including β-actin, cyclophilin and glyceraldehyde-3-
phosphate dehydrogenase (GAPDH) all of which were tested as potential candidate reference
genes similar to the ones described in Chapter 6.
3.2.9 Statistics
Data reported for larval burden and serum levels of cytokines as mean ± standard
deviation was analyzed by two-way ANOVA using the General Linear Models (GLM)
procedure in SAS (Cary, North Carolina) and p< 0.05 was considered significant. For
adjustment of multiple comparisons, Tukey`s test was used to detect significant differences
between uninfected controls, infected, not bred and bred groups of mice. For comparing
variation in transcript levels of cytokine genes, Pair-Wise Fixed Reallocation Randomization
Test© in the REST-384 was used (Pfaffl, et al., 2002). The mathematical model used to
compute the relative expression ratio of a target gene relies on its real-time PCR efficiencies
(E) and the threshold cycle difference (∆Ct) of an unknown sample versus a control
(∆Ct control - sample). The target gene expression is normalized to a reference gene (ref) in the
Equation I mentioned below:
Ratio = (E target) ∆Ct target (control - sample) / (E ref)
∆Ct ref (control - sample)
In our experimental setup control was the uninfected/unbred (UN) mice and samples were
the infected/unbred, uninfected bred (UB) and infected/bred (IB). For evaluating fold
changes in transcript levels, analyses were also done by comparing IN, UB and IB group

42
each to the UN at respective timepoints. For example, Equation II mentioned below shows
calculations for changes in transcript levels of IN when compared to UN:
Ratio = (E target) ∆Ct target (UN - IN) / (E ref)
∆Ct ref (UN - IN)
For evaluating fold upregulation or downregulation of transcripts between timepoints, early-
lactation (timepoint II) and mid-lactation (timepoint III) were compared to late-gestation
(timepoint I). For example, Equation III mentioned below shows calculations for changes in
transcript levels of early lactation (timepoint II) when compared to late-gestation (timepoint
I):
Ratio = (E target) ∆Ct target (timepoint I - timepoint II) / (E ref)
∆Ct ref (timepoint I - timepoint II)
3.3 Results
3.3.1 Assessment of larval burden
For comparing larval distribution in dams, eight week old female BALB/c mice were
subcutaneously injected with 1000 A. caninum L3 larvae. A comparison of larval burden
during the course of A. caninum infection was made between infected/not bred (IN) and
infected/bred (IB) mice at the three different timepoints corresponding to late gestation and
early to mid lactation (Figure 3.2). The total number of larvae recovered from IN mice was
not significantly different from the IB mice at late gestation or mid lactation. However, there
was a significant difference (p< 0.005) in the larval burden of IN mice (368 ± 64) and IB
mice (249 ± 31) at timepoint II, during the initial 24 hours of post-partum lactation.
To correlate the level of transmammary transmission from dam to pups, larval counts
were also assessed in pup litters from IB dams: 5 ± 4 and 9 ± 2 larvae were respectively
obtained during the timepoints for early and mid lactation (for timepoints II and III,

43
respectively). The larval burden in the feti (timepoint I) was not assessed as previous studies
have shown that there is no in utero transmission of A. caninum larvae from dam to fetus
during pregnancy (Steffe and Stoye, 1984; Arasu and Kwak, 1998).
3.3.2 Serum levels of TGF-β1, TGF-β2 and IGF-1 during A. caninum infection and breeding
TGF- β1 serum levels
To compare the TGF- β1 levels during different phases of breeding, sera was
collected at the three time points indicated above spanning gestation and post-partum
lactation. TGF-β1 levels were assessed in uninfected/not bred (UN) controls and compared to
the levels in infected/not bred (IN), uninfected/bred (UB) and infected/bred (IB) group of
mice. At timepoint I (late gestation), the circulating levels of TGF-β1 were not significantly
different between UN, IN and UB groups; however, there was a significantly higher level in
IB mice when compared with normal controls (p< 0.0001) (Figure 3.3a). At timepoint II,
TGF-β1 levels were significantly lower among bred groups, UB (p< 0.0001) and IB (p<
0.05), when compared to normal (Figure 3.3b). At timepoint III, all three IN, UB and IB
groups were significantly different from controls; TGF-β1 levels were significantly elevated
in IN mice (p< 0.0001) whereas the levels were significantly lower in both UB (p< 0.0001)
and IB (p< 0.0001) (Figure 3.3c). In figure 3.3d, comparison of TGF-β1 levels among
different mouse groups was done over 3 timepoints of interest (I, II and III). In summary,
TGF-β1 dropped significantly at timepoints II and III in the UB and IB groups as compared
to controls suggesting that TGF- β1 levels decline after parturition and remains so until mid-
lactation. Also, the significant increase in TGF-β1 levels at timepoint III in the IN groups
suggests a time-dependent role for TGF-β1 during A. caninum infection.

44
TGF- β2 serum levels
Circulating TGF- β2 levels remained unchanged and did not vary significantly
between IN, UB and IB when compared to the UN controls at timepoint I (Figure 3.4a). At
timepoint II, TGF-β2 levels decreased significantly in UB (p≤ 0.0001) and IB (p≤ 0.0001)
when compared to the UN mice. However, TGF-β2 levels did not vary significantly in the IN
mice compared to the UN mice (Figure 3.4b). At timepoint III, significantly lower TGF- β2
levels were observed in all the groups (IN, UB, IB) when compared to UN mice (p< 0.0001)
(Figure 3.4c). In figure 3.4d, comparison of TGF-β2 levels among different mouse groups
was done over 3 timepoints of interest (I, II and III). Therefore, an overall significant drop in
TGF-β2 levels was observed at timepoints II and III in the UB and IB groups when compared
to UN mice corroborating with previous findings where higher TGF-β2 levels were
documented during pregnancy and significantly lower levels after parturition and beginning
of lactation (Schneider, et al., 1996).
IGF-1 serum levels
Serum IGF-1 levels decreased significantly in IN (p< 0.0001) and UB (p< 0.0001)
compared to UN at timepoint I (Figure 3.5a). IGF-1 levels in all groups were similar at
timepoint II (Figure 3.5b). At timepoint III, IGF-1 levels were significantly lower in IN (p<
0.0001), UB (p< 0.0001) and IB (p< 0.0001) groups when compared to UN mice (Figure
3.5c). In figure 3.5d, comparison of IGF-1 levels among different mouse groups was done
over 3 timepoints of interest (I, II and III). In summary, a significant drop in IGF-1 levels in
the IN group was observed at two weeks and continued to remained so at the later timepoint

45
of A. caninum infection (timepoint III). Similarly, serum IGF-1 levels decreased below
normal levels at the end of gestation (timepoint I) and during mid-lactation (timepoint III) in
bred and infected/bred groups.
3.3.3 Transcript levels of TGF-β1, TGF-β2 and IGF-1 in muscle, mammary gland and spleen
TGF-β1 transcript levels
TGF-β1 transcripts levels were evaluated during the course of pregnancy and
infection with A. caninum using real-time PCR. REST software was used to analyze the fold
changes in expression of transcript levels (Pfaffl, et al., 2002) in skeletal muscle, mammary
tissue and spleen. Transcript levels of TGF-β1 were evaluated using equation II and III
(Materials and Methods). Data presented in Figures 3.6 a-i mentioned in the discussion
section of this chapter was calculated by comparing IN, UB and IB with UN controls
(Equation II). Data presented in Figures 3.9 a-i was calculated by comparing timepoint II and
III with timepoint I (Equation III) as discussed in this section in more detail. In skeletal
muscle, TGF-β1 transcripts levels were significantly downregulated at timepoint III in IN (p<
0.001), UB (p< 0.01) and IB (p< 0.05) groups with 37, 13 and 22-fold decrease compared to
timepoint I (Figure 3.9a, 3.9b and 3.9c). In mammary gland, TGF-β1 transcripts levels were
significantly upregulated by 11-fold at timepoint III in the IN (p< 0.05) group compared to
timepoint I (Figure 3.9d). A significant upregulation by 29 and 17-fold in TGF-β1 transcripts
levels was observed in the mammary gland of UB (p< 0.001) and IB (p< 0.01) mice
respectively during early lactation i.e. timepoint II (Figure 3.9e and 3.9f). In spleen, TGF-β1
transcripts levels were significantly downregulated at timepoint II in IN (p< 0.05) (Figure
3.9g). However, TGF-β1 transcripts levels were not significantly different in UB and IB

46
groups in spleen (Figure 3.9h and 3.9i). In summary, an overall downregulation of TGF-β1
transcripts was observed in skeletal muscle 24 days into A. caninum infection in the IN group
and during mid-lactation in UB and IB groups. However, in mammary gland significant
upregulation of TGF-β1 transcripts was detected 24 days into A. caninum infection in IN
group and during early lactation in UB and IB groups.
TGF-β2 transcripts levels
TGF-β2 transcripts levels were evaluated during the course of A. caninum infection
and different stages of pregnancy and lactation in skeletal muscle, mammary gland and
spleen. Previous studies have documented the upregulation of TGF-β2 in mammary gland
during late pregnancy and this level of expression is maintained during the lactational phase
(Schneider, et al., 1996). Transcript levels of TGF-β2 were evaluated using equation II and
III (Materials and Methods). Data presented in Figures 3.7 a-i mentioned in the discussion
section of this chapter was calculated by comparing IN, UB and IB with UN controls
(Equation II). Data presented in Figures 3.10 a-i was calculated by comparing timepoint II
and III with timepoint I (Equation III) as discussed in this section in more detail. In skeletal
muscle, TGF-β2 transcripts levels were significantly downregulated at timepoint III in IN (p<
0.001), UB (p< 0.001) and IB (p< 0.001) groups with 18, 5 and 61-fold decrease compared to
timepoint I (Figure 3.10a, 3.10b and 3.10c). In mammary gland, there was a significant
downregulation of TGF-β2 transcripts in the IN groups at timepoint I (p< 0.01), II (p< 0.001)
and III (p< 0.01) (Figure 3.10d). During early lactation, there was a significant upregulation
of TGF-β2 transcripts in mammary gland with an 85 -fold increase in the UB group (p< 0.05)
at timepoint II (Figure 3.10e). There was no significant change in TGF-β2 transcripts in

47
mammary gland of IB group (Figure 3.10f). In spleen, TGF-β2 transcripts were significantly
upregulated with a 35 -fold increase at timepoint I (p< 0.01) in the IN group (Figure 3.10g).
Similarly, at timepoint I (p< 0.05) significant upregulation with a 37 -fold increase was also
observed in the UB group (Figure 3.10h) but no significant changes were observed in spleen
of IB group (Figure 3.10i). In summary, TGF-β2 transcripts levels were significantly
downregulated in the skeletal muscle at 24 days of A. caninum infection in the IN group and
mid-lactation in the UB and IB bred groups. In mammary gland, there was a significant
downregulation in TGF-β2 transcripts levels at all the timepoints of A. caninum infection in
the IN group. A significant upregulation observed in TGF-β2 transcripts during early
lactation in the UB group was similar to previously published studies done in mammary
gland (Schneider, et al., 1996). However, no upregulation of TGF-β2 transcripts was
observed in the IB group at any of the timepoints during pregnancy or lactation.
IGF-1 transcripts levels
IGF-I mRNA content in mammary glands has been shown to be upregulated during
pregnancy (Lee, et al., 1993). Transcript levels of IGF-1 were evaluated using equation II and
III (Materials and Methods). Data presented in Figures 3.8 a-i mentioned in the discussion
section of this chapter was calculated by comparing IN, UB and IB with UN controls
(Equation II). Data presented in Figures 3.11 a-i was calculated by comparing timepoint II
and III with timepoint I (Equation III) as discussed in this section in more detail. In skeletal
muscle, IGF-1 transcript levels were significantly upregulated at timepoint III (p< 0.05) in
the IN groups compared to timepoint I (Figure 3.11a). No significant changes were observed
in skeletal muscle of UB group (Figure 3.11b). IGF-1 transcript levels were also significantly

48
upregulated in skeletal muscle at timepoint II in the IB group compared to timepoint I (p<
0.05) (Figure 3.11c). In mammary gland, IGF-1 transcript levels were significantly
downregulated at the timepoints I (p< 0.01) and II (p< 0.001) but upregulated at timepoint III
(p< 0.01) in the IN groups (Figure 3.11d). No significant changes were observed in IGF-1
transcript levels in mammary gland of UB group (Figure 3.11e). However, in the IB group
IGF-1 transcript levels were significantly upregulated in the mammary gland at timepoint II
(p< 0.01) and timepoint III (p< 0.01) with a 9 and 112- fold increase compared to timepoint
I(Figure 3.11f). IGF-1 transcript levels did not vary significantly in spleen of IN, UB and IB
mice at the timepoints of interest (Figures 3.11g, 3.11h and 3.11h). In summary, IGF-1
transcript levels were upregulated in skeletal muscle and mammary gland at 24 days of A.
caninum infection. IGF-1 transcript was upregulated in skeletal muscle and mammary gland
of IB mice during early to mid-lactation.
3.4 Discussion
Mice serve as an excellent model to study host-parasite interactions of A. caninum as
they are paratenic hosts and encapsulate the phenomena of arrest and pregnancy-associated
reactivation leading to subsequent transmammary transmission as observed in dog and
human Ancylostoma hookworm infection. As reported previously, infection of mice with A.
caninum results in the gradual migration of L3s throughout the body particularly to the
skeletal muscles (Arasu and Kwak, 1999) with stable distribution by 10-14 days post-
infection (Lee, et al., 1975; Steffe and Stoye, 1984). Due to previously observed low
breeding efficiencies with early infection (Arasu and Kwak, 1999), we followed the infection
protocol of sub-cutaneous injection of 1000 L3 at 5 days post-impregnation which allows for

49
larval migration/distribution during the remaining time of the 19-21 day gestational period.
In the studies reported here, the total number of tissue larvae harvested was not significantly
different at day 19 of gestation between bred and unbred groups of infected mice which is
consistent with the absence of pre-partum transmission of infection. However, there were
significant differences observed in the total number of larvae between bred and unbred
infected groups at the timepoint corresponding to day 1 of lactation suggesting that
transmammary transmission starts within the first 24 hours of suckling. At day 10 of
lactation, even though the total number of larvae was lower in bred versus unbred infected
mice, no significant difference was observed. Previous studies have shown that in
experimentally infected dogs, only a subpopulation of arrested larvae are transmitted during
lactation leaving a residual population (re-entering a phase of arrest) and available for
transmission in following pregnancies (Stoye, 1973).
Host factors that facilitate the transition of arrested larval stages to a reactivated state
for transmammary transmission during hookworm infection have not yet been clearly
defined. Though the precise nature of these host factors remains unknown, it appears to
involve specific components of serum (Hawdon and Schad, 1990, 1991, 1992). Parallels have
also been drawn between the arrested dauer larval stage of C. elegans and the third-stage
larvae from parasitic nematodes (Hotez, et al., 1993; Rajan, 1998). TGF-β and insulin-like
signaling have been shown to regulate dauer formation in C. elegans (Georgi, et al., 1990;
Estevez, et al., 1993; Ren, et al., 1996; Kimura, et al., 1997). Studies utilizing an in vitro
feeding assay have shown that both TGF-β1 and TGF-β2 are able to stimulate tissue-arrested
A. caninum larvae (Arasu, 1999). In the host, TGF-β1 appears to be required for
regeneration of skeletal muscle tissue and is produced by eosinophils and mast cells

50
associated with the inflammatory response to parasites (Wong, et al., 1991; Baumgartner, et
al., 1996; Maizels, et al., 1993; Cooper, et al., 1991). It is also an important cytokine
detectable at high levels in feto-placental tissues during pregnancy (Thompson, et al., 1989).
In these studies, TGF- β1 serum levels were significantly higher in the infected bred IB group
(Fig. 3.3a) group at day 19 of gestation relative to all other groups, and immediately after
parturition relative to the uninfected bred group (Fig. 3.3b), suggesting that infection as well
as pregnancy/lactation may play a role in sustained production of TGF- β1 and a potential
role in reactivation of arrested larvae in muscle sites. Differences in circulating level of TGF-
β1 were found in UN control mouse during 3 timepoints (Fig. 3.3d). At present, we are
unable to explain such changes in serum levels. However, it is possible that TGF- β1levels
fluctuate during stress which can be caused by loud noise or change in environment in the
housing facility. With infection, an increase in TGF- β1 levels was seen at timepoint III in the
IN group which could suggest an increase in cells secreting TGF- β1 that respond to infection
such as eosinophils and mast cells (Figure 3.3d). Comparison of mRNA levels revealed that
TGF- β1 transcripts were significantly downregulated in skeletal muscle at ~24 days of A.
caninum infection in both IN and IB groups (timepoint III) which would be consistent with
the period of stabilized dispersion and diminished migration of the larvae; however, a similar
decline was also seen in uninfected bred UB mice (Fig. 3.9b). When UB was compared to
UN, TGF- β1 transcripts were significantly downregulated at timepoint III in skeletal muscle
(Figure 3.6b). In mammary gland, TGF- β1 mRNA levels were significantly elevated during
early lactation but eventually declined during mid-lactation in both uninfected and infected
bred groups of mice (Fig. 3.9e and 3.9f). When UB and IB were compared to UN, TGF- β1
transcripts showed a significant downregulation it was not as dramatic as observed during IN

51
and UN comparison during timepoint II (Fig. 3.6d, e and f). Also, during timepoint III there
was a significant upregulation in TGF-β1 transcript when IN was compared to UN (Fig.
3.6d). These findings suggest that dramatic suppression of TGF-β1 transcript seen during
early infection is overcome by ~24d of infection and pregnancy appears to offset such
suppression as observed by less dramatic downregulation in UB and IB groups (Fig. 3.6 e
and f). Similarly, a significant downregulation is also observed in spleen of IN mice during
timepoint II (Fig. 3.6g).
In these studies, the infected bred IB group of mice is of greatest interest when
assessing the fluctuations in TGF-β isoforms as this group encompasses the phenomena of
larval arrest and transmission in arrested A. caninum larvae. We expected TGF-β1 levels to
be elevated during the peri-parturient period as this is the timepoint when arrested larvae are
assumed to `awaken’ to resume migration. Serum levels were indeed elevated in the IB group
of mice compared to all other groups at late gestation (Fig. 3.3a). However, TGF- β1
transcript levels in skeletal muscle were generally not elevated (Figs. 3.9a, 3.9b and 3.9c)
except for showing a slight increase at timepoint II (day 16-17 pi/day 1 lactation) of the
infected groups, IN and IB (Fig. 3.9a and 3.9c). Taken together with previous in vitro
feeding/reactivation results on tissue-arrested larvae (Arasu, 1999), these results suggest that
TGF- β1 may potentially be playing a role in larval reactivation in the in vivo situation but
would require further confirmatory analyses.
With TGF β2, elevated levels were detected in late pregnant maternal plasma in the
rat model which declined immediately after parturition (Schneider, et al., 1996). In contrast
to TGF-β1, TGF-β2 levels in the UN groups remained constant over time. Our results from
the mouse show a similar trend with no significant differences in serum levels amongst any

52
of the groups at late gestation followed by a significant decrease in UB and IB groups
relative to UN subsequent to parturition (Fig. 3.4a). TGF-β2 levels declined sharply in the
IN group at timepoint III during which larvae are expected to undergo arrest (Figure 3.4d).
This decline suggests the possibility that initiation of arrest might lead of secretion of a TGF-
β2 receptor or cells making TGF- β2 in response to A. caninum infection get inhibited. With
the TGF-β2 transcripts, levels were significantly elevated in the mammary gland and uterine
tissues during late gestation and lactation in rats (Schneider, et al., 1996). Our findings
corroborate these studies as a similarly significant upregulation was observed in TGF-β2
transcripts in mammary gland during early lactation in the uninfected bred group (Fig.
3.10e). TGF-β2 transcript levels were significantly downregulated in skeletal muscle at
timepoint III ie mid-lactation in UB mice when compared to UN controls which correlate
with decline in circulating levels also (Fig. 3.7b and 3.4d). However, it should also be noted
that numerous studies have shown that mRNA transcript levels are not always reflective of
protein levels (Anderson and Seilhamer, 1997; Gygi, et al., 1999). Hence, there was a
significant upregulation of TGF-β2 transcript in the in mammary gland of UB group at
timepoint II coinciding with sustained expression of TGF- β2 during early lactation whereas
serum levels had started to decline sharply (Fig. 3.7e). In the IB group relative to other
groups, we had accordingly expected TGF-β2 transcript levels to be elevated in mammary
gland during the lactational period as reflective of high localized levels of the expressed
cytokine in order to sustain a state of larval reactivation and facilitate transmission of larvae
via milk. Serum levels of TGF- β2 were not remarkable (as mentioned above) and consistent
with the well-documented tissue-specific localization of TGF- β2 (Cheng, et al., 1993;
Schneider, et al., 1996). Transcript levels of TGF- β2 were also not significantly different in

53
the IB group. From these observations, there does not appear to be a correlation between
host-derived TGF-β2 and larval reactivation.
In studies from rats and pigs, IGF-1 mRNA and protein levels are differentially
regulated during pregnancy (Marcotty, et al., 1994; Lee, et al., 1993); in rats, maternal serum
IGF-I levels were high during the first half of pregnancy and fell sharply during the second
half of pregnancy (Marcotty, et al., 1994). Using RNase protection assay, IGF-I gene
expression in the mammary gland diminished during the course of pregnancy (Marcotty, et
al., 1994). In our studies, serum IGF-1 levels in IB mice were not significantly different from
normal UN mice during the peri-parturient period (timepoints I and II; Figures 3.5a, 3.5b) but
showed a gradual decrease from ~800 pg/ml at late gestation to ~100 pg/ml at day 10
lactation. Infection at timepoint II ie early lactation had an effect on IGF-1 serum levels as
observed by an increase in IN and IB groups (Figure 3.5d). No significant differences were
observed in IGF-1 levels in skeletal muscle of any group of mice when compared with the
UN (Fig. 3.8a, b, c). However, there was a significant upregulation in IGF-1 transcript in the
IB group at parturition when comparing day 19 gestation and day 1 lactation timepoints in
both skeletal muscle (Fig. 3.11c) and mammary gland (Fig. 3.11f). These in vivo analyses of
IGF-1 levels show a potential correlation between infection and pregnancy/lactation with a
potential role in the reactivation/transmission of arrested larvae. In previous in vitro studies
to identify factors associated with signaling and reactivation of tissue-arrested A. caninum
larvae, insulin did not appear to have a direct effect on the feeding response (Arasu, 1999);
IGF-1 was not assessed in these studies. However, the IGF-1 signaling inhibitor LY294002
was shown to prevent a feeding response in A. caninum infective larvae stimulated with dog

54
serum (Hawdon and Datu, 2003) supporting the hypothesis that an insulin-like signaling
pathway involving IGF-1 may be involved in larval reactivation during pregnancy.
In order to directly implicate the involvement of host-derived TGF-β and IGF-1
signaling in larval reactivation and transmission, binding kinetics studies between the
parasite encoded TGF- β receptors with mammalian TGF-β should be performed as have
been done with C. elegans and the parasitic fluke, Schistosoma (Ren et al., 1996; Davies and
Pearce, 1999). A. caninum TGF- β like receptor sequences as well as two TGF-β like
ligands have been cloned in our laboratory (Freitas and Arasu, 2005; data not shown).
It is well known that anthelminthic drugs are inefficacious in eradicating tissue-arrested
larval stages (Burke and Roberson, 1983; Arasu, 1998). Therefore, elucidating the host
responses during different phases of pregnancy and lactation during a concurrent A. caninum
infection may help in a better understanding of the phenomenon of tissue-arrest, reactivation
and subsequent transmammary transmission of the parasite. Effective control strategies can
be aimed at triggering the reactivation of arrested larvae followed by anthelminthic therapy.

55
Table 3.1 Primer sequences used for cytokine and reference gene transcript quantification by real-time RT-PCR
Primer pairs Gene Accession # Forward primer Reverse primer Product size 1 GAPDH BC098095 ccactacatggtctacatggttc ctcgctcctggaagatg 122 2 60S ribosomal protein BC011291 gattcgggatatgctgttgg aaagcctggaagaaggaggt 132 3 TGF-β1 NM_011577 tgcttcagctccacagagaa tggttgtagagggcaaggac 182 4 TGF-β2 NM_009367 aatgacaacgatgacgacca gatgcagactaacgccttcc 198 5 IGF-1 AF440690 tggatgctcttcagttcgtg tctgagtcttgggcatgtca 225

56
Mouse Groups evaluated at: Time Points Groups
I = day 19 gestation/14d pi UN = Uninfected / not bred II = day 1 lactation/15-16d pi IN = Infected / not bred
III = day 10 Lactation/25-26d pi UB = Uninfected / bred IB = Infected / bred
0 5 19-21 1 10 Days
I II III
Breed Mice
Late Gestation
Infect Mice
Early Lactation
Mid Lactation
Timepoints
Figure 3.1 Experimental design. Nine to ten week old BALB/c female mice were mated and injected with 1000 A. caninum L3 larvae on day 5 post-impregnation. Mice were sacrificed at three different timepoints during pregnancy and lactation and divided into four groups based on infection and breeding. Serum, skeletal muscle, mammary gland and spleen were collected from each timepoint in each group for ELISA and real-time PCR analyses.
Pregnancy Lactation

57
Larval counts
050
100150200250300350400450
IN IB IN IB IN IB
I II III
Num
ber
of la
rvae
Figure 3.2 Comparison of total larval burden in unbred versus bred BALB/c mice infected at times corresponding to day 19 gestation, day 1 and day 10 of postpartum lactation. Mice were infected with 1000 A. caninum L3 larvae subcutaneously. n = 5 mice per group. * indicates significant difference at p< 0.005 between unbred and bred groups.
*

58
Figure 3.3 Comparison of serum TGF-β1 levels in UN, IN, UB and IB mouse. Mice were sacrificed at three different timepoints during pregnancy and lactation (I= late gestation, II= early lactation and III= mid-lactation). a. TGF-β1 levels at Timepoint I * indicates significant difference at p< 0.0001 between uninfected unbred and infected bred groups. b. TGF-β1 levels at Timepoint II * indicates significant difference at p< 0.0001 between uninfected unbred and uninfected bred groups. ** indicates significant difference at p< 0.05 between uninfected unbred and infected bred groups. c. TGF-β1 levels at Timepoint III * indicates significant difference at p< 0.0001 between uninfected unbred and infected unbred, uninfected bred and infected bred groups. d. Comparison of TGF-β1 levels in UN, IN, UB and IB groups over time
0
200
400
600
800
1000
1200
I II III
TGF-
bet
a1 p
g/m
l
UN
IN
UB
IB
Figure 3.3a Figure 3.3b
Figure 3.3c Figure 3.3d
0
200
400
600
800
1000
1200
I II III
TGF-
bet
a1 p
g/m
l
UN
IN
UB
IB
Figure 3.3a Figure 3.3b
Figure 3.3c Figure 3.3d
*
***
*
* *

59
Figure 3.4 Comparison of serum TGF-β2 levels in UN, IN, UB and IB mouse. Mice were sacrificed at three different timepoints during pregnancy and lactation (I= late gestation, II= early lactation and III= mid-lactation). a. TGF-β2 levels at Timepoint I b. TGF-β2 levels at Timepoint II * indicates significant difference at p< 0.0001 between uninfected unbred and uninfected bred and between uninfected unbred and infected bred groups. c. TGF-β2 levels at Timepoint III * indicates significant difference at p< 0.0001 between uninfected unbred and infected unbred, uninfected bred and infected bred groups. d. Comparison of TGF-β2 levels in UN, IN, UB and IB groups over time
0
200
400
600
800
1000
1200
I II III
TG
F-b
eta2
pg
/ml
UN
IN
UB
IB
Figure 3.4a Figure 3.4b
Figure 3.4c Figure 3.4d
0
200
400
600
800
1000
1200
I II III
TG
F-b
eta2
pg
/ml
UN
IN
UB
IB
Figure 3.4a Figure 3.4b
Figure 3.4c Figure 3.4d
* *
* * *

60
Figure 3.5 Comparison of serum IGF-1 levels in UN, IN, UB and IB mouse. Mice were sacrificed at three different timepoints during pregnancy and lactation (I= late gestation, II= early lactation and III= mid-lactation). a. IGF-1 levels at Timepoint I * indicates significant difference at p< 0.0001 between uninfected unbred and infected unbred and uninfected bred groups. b. IGF-1 levels at Timepoint II c. IGF-1 levels at Timepoint III * indicates significant difference at p< 0.0001 between uninfected unbred and infected unbred, uninfected bred and infected bred groups. d. Comparison of IGF-1 levels in UN, IN, UB and IB groups over time
0
200
400
600
800
1000
1200
I II III
IGF
-1 p
g/m
l UN
IN
UB
IB
Figure 3.5a Figure 3.5b
Figure 3.5c Figure 3.5d
*
*
**
*
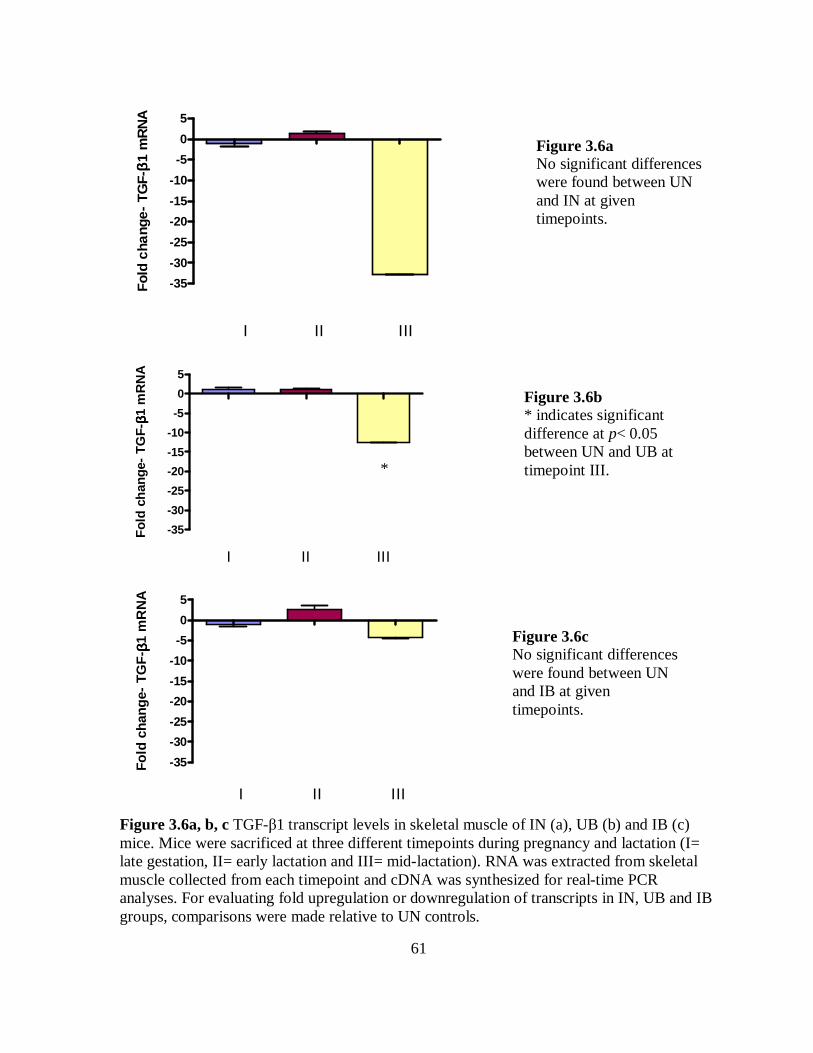
61
-35
-30
-25
-20
-15
-10
-5
0
5
I II III
Fol
d c
hang
e- T
GF-
ββ ββ1
mR
NA
-35
-30
-25
-20
-15
-10
-5
0
5
I II III
Fol
d ch
ange
- TG
F-ββ ββ1
mR
NA
-35
-30
-25
-20
-15
-10
-5
0
5
I II III
Fold
cha
nge-
TG
F- ββ ββ
1 m
RN
A
Figure 3.6a, b, c TGF-β1 transcript levels in skeletal muscle of IN (a), UB (b) and IB (c) mice. Mice were sacrificed at three different timepoints during pregnancy and lactation (I= late gestation, II= early lactation and III= mid-lactation). RNA was extracted from skeletal muscle collected from each timepoint and cDNA was synthesized for real-time PCR analyses. For evaluating fold upregulation or downregulation of transcripts in IN, UB and IB groups, comparisons were made relative to UN controls.
Figure 3.6a No significant differences were found between UN and IN at given timepoints.
Figure 3.6b * indicates significant difference at p< 0.05 between UN and UB at timepoint III.
Figure 3.6c No significant differences were found between UN and IB at given timepoints.
*

62
-5000
-2500
-50-40-30-20-10
010
I II III
Fold
cha
nge
- T
GF-
ββ ββ1
mR
NA
-20
-10
0
10
20
I II III
Fold
cha
ng
e- T
GF
- ββ ββ1
mR
NA
-20
-10
0
10
20
I II III
Fol
d c
han
ge-
TG
F- ββ ββ
1 m
RN
A
Figure 3.6d, e, f TGF-β1 transcript levels in mammary gland of IN (d), UB (e) and IB (f) mice. Mice were sacrificed at three different timepoints during pregnancy and lactation (I= late gestation, II= early lactation and III= mid-lactation). RNA was extracted from mammary gland collected from each timepoint and cDNA was synthesized for real-time PCR analyses. For evaluating fold upregulation or downregulation of transcripts in IN, UB and IB groups, comparisons were made relative to UN controls.
Figure 3.6e * indicates significant difference at p< 0.01 between UN and UB at timepoint II.
Figure 3.6d * indicates significant difference at p< 0.01 between UN and IN at timepoint I, II and III.
Figure 3.6f * indicates significant difference at p< 0.01 between UN and IB at timepoint II.
*
*
*
*
*
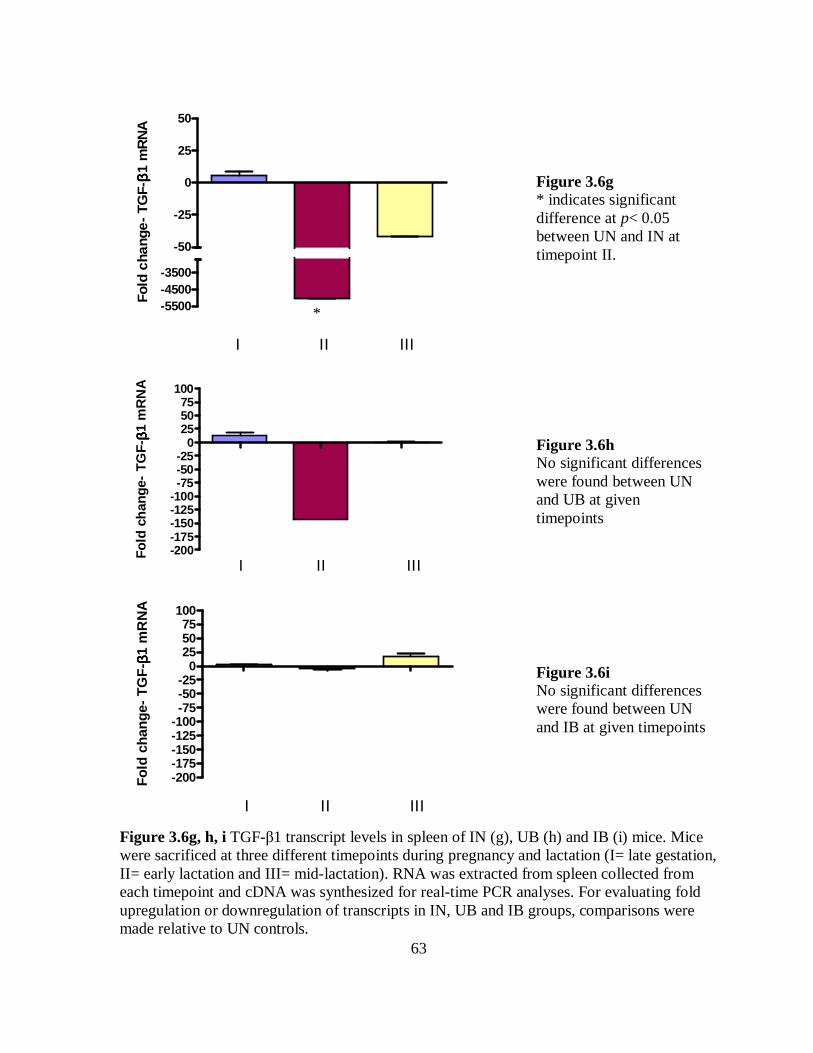
63
-5500-4500-3500
-50
-25
0
25
50
I II III
Fold
cha
nge
- TG
F-ββ ββ
1 m
RN
A
-200-175-150-125-100-75-50-25
0255075
100
I II III
Fold
ch
ange
- TG
F-ββ ββ1
mR
NA
-200-175-150-125-100-75-50-25
0255075
100
I II III
Fo
ld c
han
ge-
TG
F- ββ ββ
1 m
RN
A
Figure 3.6g, h, i TGF-β1 transcript levels in spleen of IN (g), UB (h) and IB (i) mice. Mice were sacrificed at three different timepoints during pregnancy and lactation (I= late gestation, II= early lactation and III= mid-lactation). RNA was extracted from spleen collected from each timepoint and cDNA was synthesized for real-time PCR analyses. For evaluating fold upregulation or downregulation of transcripts in IN, UB and IB groups, comparisons were made relative to UN controls.
Figure 3.6g * indicates significant difference at p< 0.05 between UN and IN at timepoint II.
Figure 3.6h No significant differences were found between UN and UB at given timepoints
Figure 3.6i No significant differences were found between UN and IB at given timepoints
*

64
-10
-5
0
5
10
I II III
Fold
cha
nge-
TG
F-ββ ββ
2 m
RN
A
-10
-5
0
5
10
I II III
Fold
cha
nge
- T
GF-
ββ ββ2
mR
NA
-10
-5
0
5
10
I II III
Fold
cha
nge-
TG
F-ββ ββ
2 m
RN
A
Figure 3.7a, b, c TGF-β2 transcript levels in skeletal muscle of IN (a), UB (b) and IB (c) mice. Mice were sacrificed at three different timepoints during pregnancy and lactation (I= late gestation, II= early lactation and III= mid-lactation). RNA was extracted from skeletal muscle collected from each timepoint and cDNA was synthesized for real-time PCR analyses. For evaluating fold upregulation or downregulation of transcripts in IN, UB and IB groups, comparisons were made relative to UN controls.
Figure 3.7a No significant differences were found between UN and IN at given timepoints
Figure 3.7b * indicates significant difference at p< 0.005 between UN and UB at timepoint III.
Figure 3.7c No significant differences were found between UN and IB at given timepoints.
*
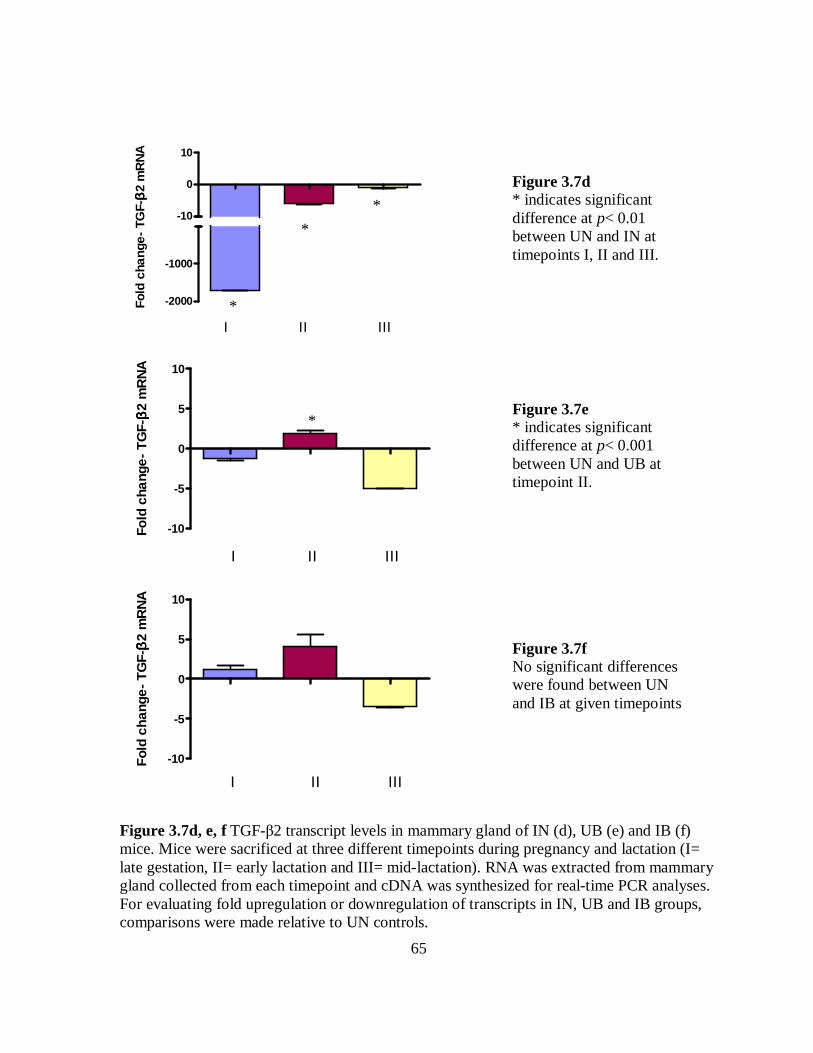
65
-2000
-1000
-10
0
10
I II III
Fold
cha
nge-
TG
F-ββ ββ
2 m
RN
A
-10
-5
0
5
10
I II III
Fold
cha
nge
- T
GF-
ββ ββ2
mR
NA
-10
-5
0
5
10
I II III
Fol
d ch
ange
- T
GF-
ββ ββ2
mR
NA
Figure 3.7d, e, f TGF-β2 transcript levels in mammary gland of IN (d), UB (e) and IB (f) mice. Mice were sacrificed at three different timepoints during pregnancy and lactation (I= late gestation, II= early lactation and III= mid-lactation). RNA was extracted from mammary gland collected from each timepoint and cDNA was synthesized for real-time PCR analyses. For evaluating fold upregulation or downregulation of transcripts in IN, UB and IB groups, comparisons were made relative to UN controls.
Figure 3.7d * indicates significant difference at p< 0.01 between UN and IN at timepoints I, II and III.
Figure 3.7e * indicates significant difference at p< 0.001 between UN and UB at timepoint II.
Figure 3.7f No significant differences were found between UN and IB at given timepoints
*
*
*
*
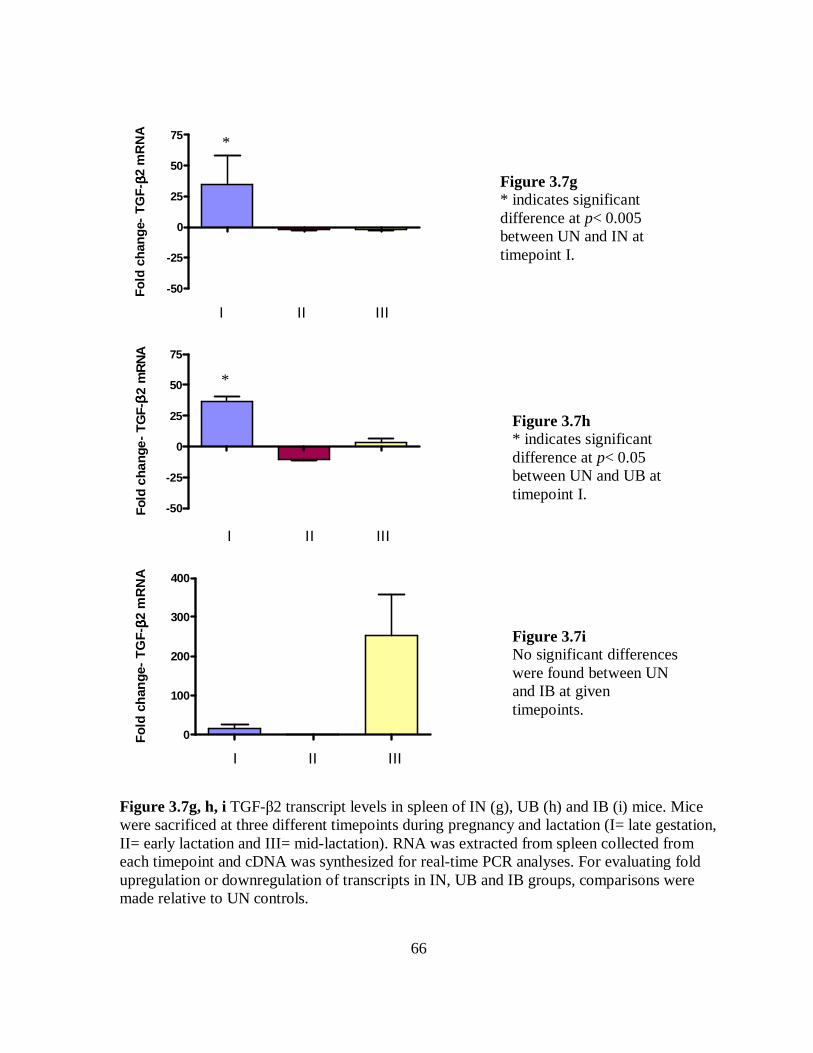
66
-50
-25
0
25
50
75
I II III
Fo
ld c
han
ge-
TG
F- ββ ββ
2 m
RN
A
-50
-25
0
25
50
75
I II III
Fol
d ch
ange
- T
GF-
ββ ββ2
mR
NA
0
100
200
300
400
I II III
Fol
d c
han
ge-
TG
F-ββ ββ2
mR
NA
Figure 3.7g, h, i TGF-β2 transcript levels in spleen of IN (g), UB (h) and IB (i) mice. Mice were sacrificed at three different timepoints during pregnancy and lactation (I= late gestation, II= early lactation and III= mid-lactation). RNA was extracted from spleen collected from each timepoint and cDNA was synthesized for real-time PCR analyses. For evaluating fold upregulation or downregulation of transcripts in IN, UB and IB groups, comparisons were made relative to UN controls.
Figure 3.7g * indicates significant difference at p< 0.005 between UN and IN at timepoint I.
Figure 3.7h * indicates significant difference at p< 0.05 between UN and UB at timepoint I.
Figure 3.7i No significant differences were found between UN and IB at given timepoints.
*
*
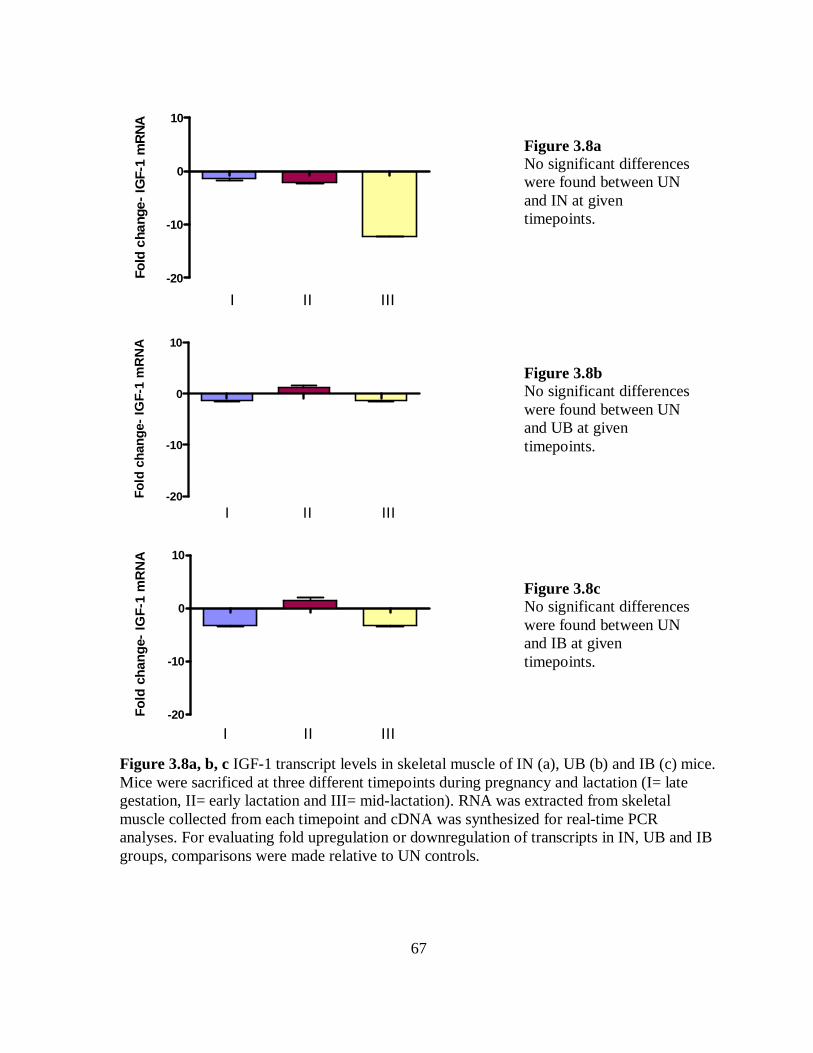
67
-20
-10
0
10
I II III
Fold
cha
nge-
IGF-
1 m
RN
A
-20
-10
0
10
I II III
Fo
ld c
han
ge-
IG
F-1
mR
NA
-20
-10
0
10
I II III
Fo
ld c
han
ge-
IG
F-1
mR
NA
Figure 3.8a, b, c IGF-1 transcript levels in skeletal muscle of IN (a), UB (b) and IB (c) mice. Mice were sacrificed at three different timepoints during pregnancy and lactation (I= late gestation, II= early lactation and III= mid-lactation). RNA was extracted from skeletal muscle collected from each timepoint and cDNA was synthesized for real-time PCR analyses. For evaluating fold upregulation or downregulation of transcripts in IN, UB and IB groups, comparisons were made relative to UN controls.
Figure 3.8a No significant differences were found between UN and IN at given timepoints.
Figure 3.8b No significant differences were found between UN and UB at given timepoints.
Figure 3.8c No significant differences were found between UN and IB at given timepoints.

68
-125
-100
-75
-50
-25
0
25
I II III
Fold
cha
nge-
IGF-
1 m
RN
A
-125
-100
-75
-50
-25
0
25
I II III
Fo
ld c
han
ge-
IGF
-1 m
RN
A
-125
-100
-75
-50
-25
0
25
I II III
Fol
d ch
ange
- IG
F-1
mR
NA
Figure 3.8d, e, f IGF-1 transcript levels in mammary gland of IN (d), UB (e) and IB (f) mice. Mice were sacrificed at three different timepoints during pregnancy and lactation (I= late gestation, II= early lactation and III= mid-lactation). RNA was extracted from mammary gland collected from each timepoint and cDNA was synthesized for real-time PCR analyses. For evaluating fold upregulation or downregulation of transcripts in IN, UB and IB groups, comparisons were made relative to UN controls.
Figure 3.8d * indicates significant difference at p< 0.01 between UN and IN at timepoints I and II.
Figure 3.8e No significant differences were found between UN and UB at given timepoints.
Figure 3.8f * indicates significant difference at p< 0.01 between UN and IB at timepoint II.
*
*
*

69
-700-600-500-400-300-200-100
0100200
I II III
Fold
ch
ange
- IG
F-1
mR
NA
-700-600-500-400-300-200-100
0100200
I II III
Fold
ch
ang
e- IG
F-1
mR
NA
-700-600-500-400-300-200-100
0100200
I II III
Fold
ch
ange
- IG
F-1
mR
NA
Figure 3.8g, h, i IGF-1 transcript levels in spleen of IN (g), UB (h) and IB (i) mice. Mice were sacrificed at three different timepoints during pregnancy and lactation (I= late gestation, II= early lactation and III= mid-lactation). RNA was extracted from spleen collected from each timepoint and cDNA was synthesized for real-time PCR analyses. For evaluating fold upregulation or downregulation of transcripts in IN, UB and IB groups, comparisons were made relative to UN controls.
Figure 3.8g No significant differences were found between UN and IN at given timepoints.
Figure 3.8h No significant differences were found between UN and UB at given timepoints.
Figure 3.8i No significant differences were found between UN and IB at given timepoints.

70
-40-35-30-25-20-15-10-505
II III
Fold
cha
nge-
TG
Fββ ββ1
mR
NA
-40-35-30-25-20-15-10-505
II III
Fold
cha
nge-
TG
F-ββ ββ
1 m
RN
A
-40-35-30-25-20-15-10-505
II III
Fold
cha
nge-
TG
F-ββ ββ
1 m
RN
A
Figure 3.9a, b, c Comparison of TGF-β1 transcript levels in skeletal muscle of IN (a), UB (b) and IB (c) mice over time. Mice were sacrificed at three different timepoints during pregnancy and lactation (I= late gestation, II= early lactation and III= mid-lactation). RNA was extracted from skeletal muscle collected from each timepoint and cDNA was synthesized for real-time PCR analyses. For evaluating fold upregulation or downregulation of transcripts between timepoints, timepoint II and timepoint III were compared to timepoint I using equation III.
Figure 3.9a * indicates significant difference at p< 0.001 between timepoint I and timepoint III.
Figure 3.9b * indicates significant difference at p< 0.01 between timepoint I and timepoint III.
Figure 3.9c * indicates significant difference at p< 0.05 between timepoint I and timepoint III.
*
*
*

71
0
10
20
30
40
II III
Fold
cha
nge-
TG
F-ββ ββ
1 m
RN
A
0
10
20
30
40
II III
Fold
cha
nge-
TG
F-ββ ββ
1 m
RN
A
-10
0
10
20
30
40
II III
Fold
cha
nge-
TG
F-ββ ββ
1 m
RN
A
Figure 3.9d, e, f Comparison of TGF-β1 transcript levels in mammary gland of IN (d), UB (e) and IB (f) mice over time. Mice were sacrificed at three different timepoints during pregnancy and lactation (I= late gestation, II= early lactation and III= mid-lactation). RNA was extracted from mammary gland collected from each timepoint and cDNA was synthesized for real-time PCR analyses. For evaluating fold upregulation or downregulation of transcripts between timepoints, timepoint II and timepoint III were compared to timepoint I using equation III.
Figure 3.9d * indicates significant difference at p< 0.05 between timepoint I and timepoint III.
Figure 3.9e * indicates significant difference at p< 0.001 between timepoint I and timepoint II.
Figure 3.9f * indicates significant difference at p< 0.01 between timepoint I and timepoint II.
*
*
*

72
-5500-4500-3500
-50
-25
0
25
50
II III
Fol
d c
ha
nge
- TG
F-ββ ββ
1 m
RN
A
-10
0
10
20
II III
Fold
cha
nge-
TG
F-ββ ββ
1 m
RN
A
-10
0
10
20
II III
Fold
cha
nge-
TG
F-ββ ββ
1 m
RN
A
Figure 3.9g, h, i Comparison of TGF-β1 transcript levels in spleen of IN (g), UB (h) and IB (i) mice over time. Mice were sacrificed at three different timepoints during pregnancy and lactation (I= late gestation, II= early lactation and III= mid-lactation). RNA was extracted from spleen collected from each timepoint and cDNA was synthesized for real-time PCR analyses. For evaluating fold upregulation or downregulation of transcripts between timepoints, timepoint II and timepoint III were compared to timepoint I using equation III.
Figure 3.9g * indicates significant difference at p< 0.05 between timepoint I and timepoint II.
Figure 3.9h No significant differences were found between timepoints.
Figure 3.9i No significant differences were found between timepoints
*

73
-70
-60
-50
-40
-30
-20
-10
0
II III
Fold
cha
nge-
TG
F-ββ ββ
2 m
RN
A
-70
-60
-50
-40
-30
-20
-10
0
II III
Fold
cha
nge-
TG
F-ββ ββ
2 m
RN
A
-70
-60
-50
-40
-30
-20
-10
0
II III
Fold
cha
nge-
TG
Fββ ββ
2 m
RN
A
Figure 3.10a, b, c Comparison of TGF-β2 transcript levels in skeletal muscle of IN (a), UB (b) and IB (c) mice over time. Mice were sacrificed at three different timepoints during pregnancy and lactation (I= late gestation, II= early lactation and III= mid-lactation). RNA was extracted from skeletal muscle collected from each timepoint and cDNA was synthesized for real-time PCR analyses. For evaluating fold upregulation or downregulation of transcripts between timepoints, timepoint II and timepoint III were compared to timepoint I using equation III.
Figure 3.10c * indicates significant difference at p< 0.001 between timepoint I and timepoint III.
Figure 3.10b * indicates significant difference at p< 0.001 between timepoint I and timepoint III.
Figure 3.10a * indicates significant difference at p< 0.001 between timepoint I and timepoint III.
*
*
*

74
-75
-50
-25
0
25
50
75
100
125
II III
Fold
cha
nge-
TG
F-ββ ββ
2 m
RN
A
-75
-50
-25
050
75
100
125
II III
Fol
d ch
ang
e- T
GF
-ββ ββ2
mR
NA
-75
-50
-25
0
II III
Fol
d ch
ange
- TG
F-ββ ββ
2 m
RN
A
Figure 3.10d, e, f Comparison of TGF-β2 transcript levels in mammary gland of IN (d), UB (e) and IB (f) mice over time. Mice were sacrificed at three different timepoints during pregnancy and lactation (I= late gestation, II= early lactation and III= mid-lactation). RNA was extracted from mammary gland collected from each timepoint and cDNA was synthesized for real-time PCR analyses. For evaluating fold upregulation or downregulation of transcripts between timepoints, timepoint II and timepoint III were compared to timepoint I using equation III.
Figure 3.10e * indicates significant difference at p< 0.05 between timepoint I and timepoint II.
Figure 3.10d * indicates significant difference at p< 0.001 between timepoint I and timepoint III.
Figure 3.10f No significant differences were found between timepoints
*
*

75
-10
0
10
20
30
40
50
60
70
II III
Fold
cha
nge-
TG
F-ββ ββ
2 m
RN
A
-10
0
10
20
30
40
50
60
70
II III
Fold
cha
nge-
TG
F-ββ ββ
2 m
RN
A
-10
0
10
20
30
40
50
60
70
II III
Fold
cha
nge-
TG
F-ββ ββ
2 m
RN
A
Figure 3.10g, h, i Comparison of TGF-β2 transcript levels in spleen of IN (g), UB (h) and IB (i) mice over time. Mice were sacrificed at three different timepoints during pregnancy and lactation (I= late gestation, II= early lactation and III= mid-lactation). RNA was extracted from spleen collected from each timepoint and cDNA was synthesized for real-time PCR analyses. For evaluating fold upregulation or downregulation of transcripts between timepoints, timepoint II and timepoint III were compared to timepoint I using equation III.
Figure 3.10g No significant differences were found between timepoints
Figure 3.10h No significant differences were found between timepoints
Figure 3.10i No significant differences were found between timepoints

76
-25
-20
-15
-10
-5
0
5
10
15
II III
Fold
cha
nge-
IGF-
1 m
RN
A
-15
-10
-5
0
5
10
15
20
25
II III
Fold
cha
nge-
IGF-
1 m
RN
A
-15
-10
-5
0
5
10
15
20
25
II III
Fold
cha
nge-
IGF-
1 m
RN
A
Figure 3.11a, b, c Comparison of IGF-1 transcript levels in skeletal muscle of IN (a), UB (b) and IB (c) mice over time. Mice were sacrificed at three different timepoints during pregnancy and lactation (I= late gestation, II= early lactation and III= mid-lactation). RNA was extracted from skeletal muscle collected from each timepoint and cDNA was synthesized for real-time PCR analyses. For evaluating fold upregulation or downregulation of transcripts between timepoints, timepoint II and timepoint III were compared to timepoint I using equation III.
Figure 3.11c * indicates significant difference at p< 0.05 between timepoint I and timepoint II.
Figure 3.11b No significant differences were found between timepoints.
Figure 3.11a * indicates significant difference at p< 0.05 between timepoint I and timepoint III. *
*
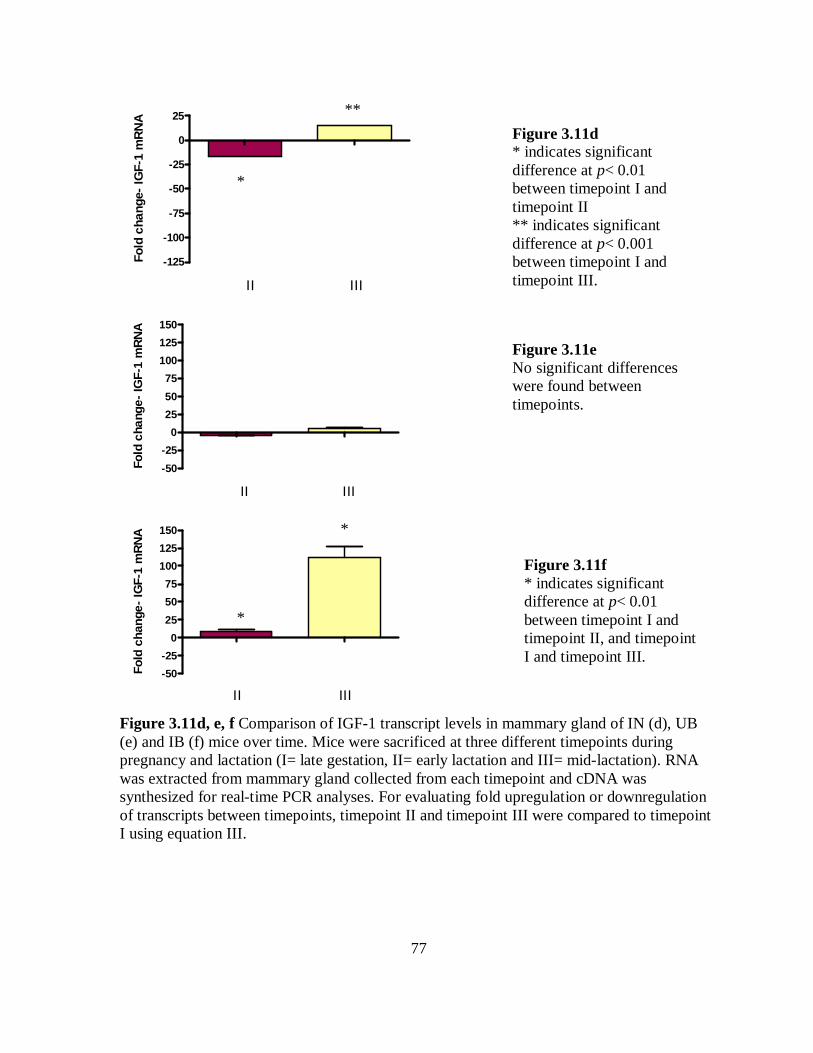
77
-125
-100
-75
-50
-25
0
25
II III
Fold
cha
nge-
IGF-
1 m
RN
A
-50
-25
0
25
50
75
100
125
150
II III
Fold
cha
nge-
IGF-
1 m
RN
A
-50
-25
0
25
50
75
100
125
150
II III
Fold
cha
nge-
IGF-
1 m
RN
A
Figure 3.11d, e, f Comparison of IGF-1 transcript levels in mammary gland of IN (d), UB (e) and IB (f) mice over time. Mice were sacrificed at three different timepoints during pregnancy and lactation (I= late gestation, II= early lactation and III= mid-lactation). RNA was extracted from mammary gland collected from each timepoint and cDNA was synthesized for real-time PCR analyses. For evaluating fold upregulation or downregulation of transcripts between timepoints, timepoint II and timepoint III were compared to timepoint I using equation III.
Figure 3.11e No significant differences were found between timepoints.
Figure 3.11d * indicates significant difference at p< 0.01 between timepoint I and timepoint II ** indicates significant difference at p< 0.001 between timepoint I and timepoint III.
Figure 3.11f * indicates significant difference at p< 0.01 between timepoint I and timepoint II, and timepoint I and timepoint III.
*
**
*
*
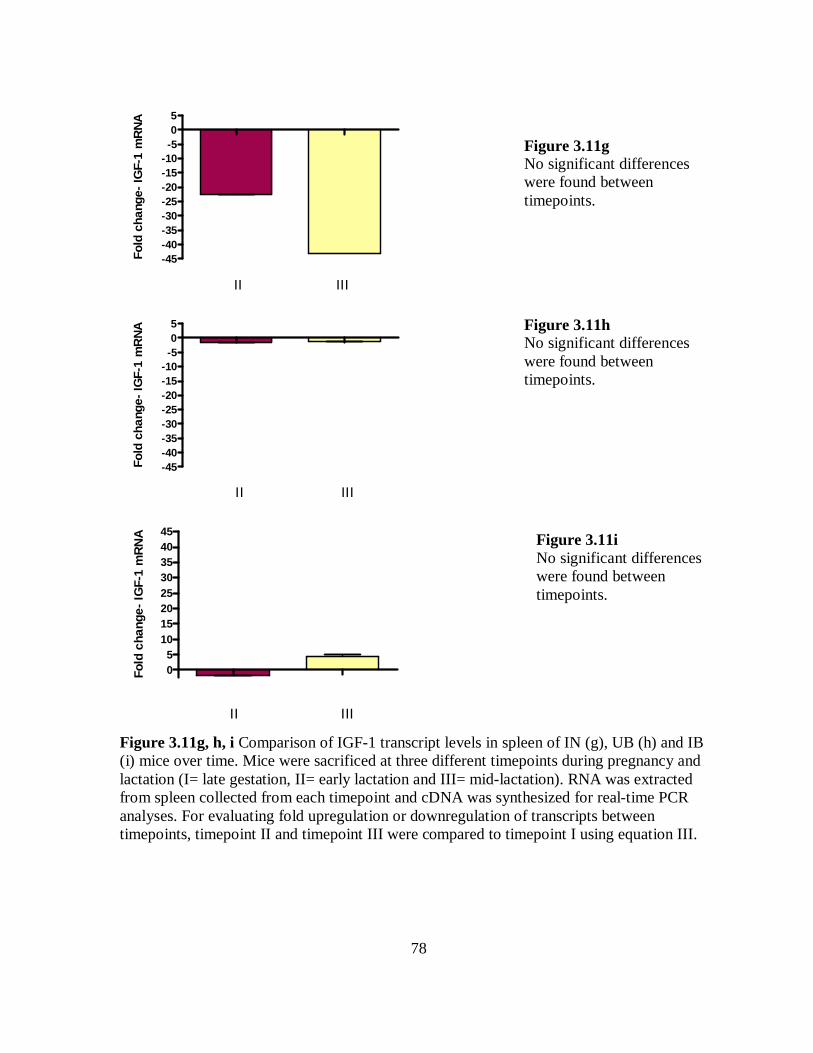
78
-45-40-35-30-25-20-15-10-505
II III
Fold
cha
nge-
IGF-
1 m
RN
A
-45-40-35-30-25-20-15-10-505
II III
Fold
cha
nge-
IGF-
1 m
RN
A
05
1015202530354045
II III
Fold
cha
nge-
IG
F-1
mR
NA
Figure 3.11g, h, i Comparison of IGF-1 transcript levels in spleen of IN (g), UB (h) and IB (i) mice over time. Mice were sacrificed at three different timepoints during pregnancy and lactation (I= late gestation, II= early lactation and III= mid-lactation). RNA was extracted from spleen collected from each timepoint and cDNA was synthesized for real-time PCR analyses. For evaluating fold upregulation or downregulation of transcripts between timepoints, timepoint II and timepoint III were compared to timepoint I using equation III.
Figure 3.11h No significant differences were found between timepoints.
Figure 3.11g No significant differences were found between timepoints.
Figure 3.11i No significant differences were found between timepoints.
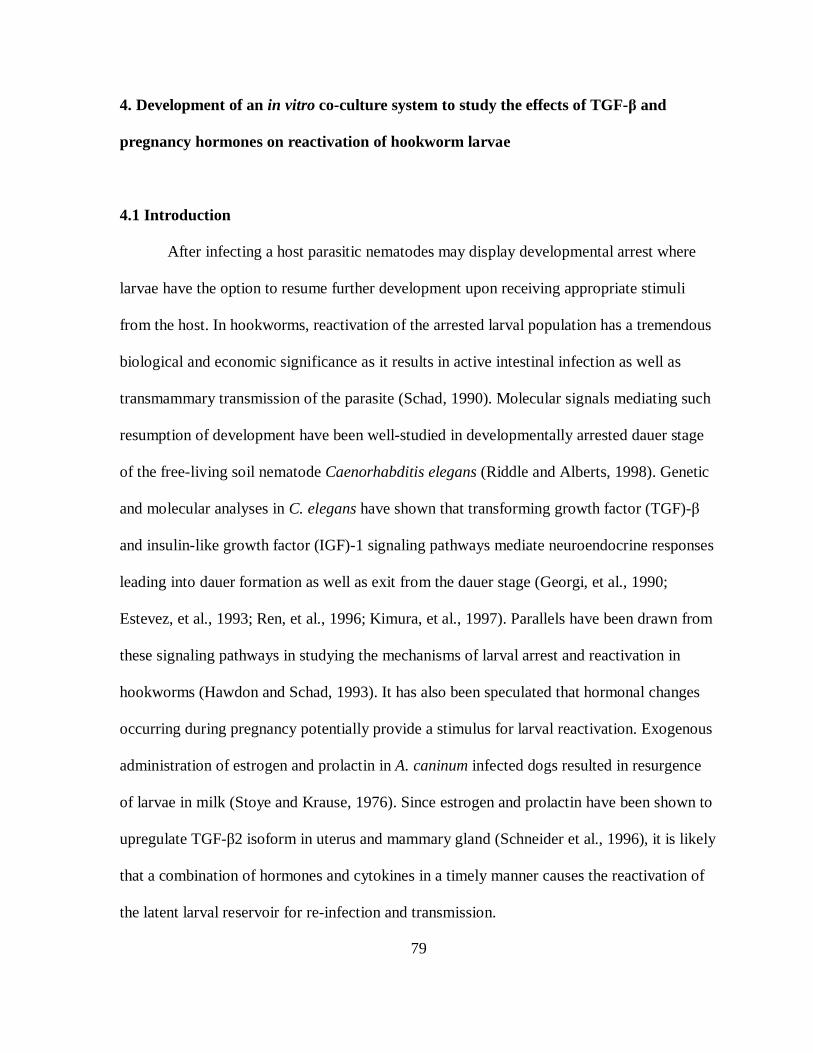
79
4. Development of an in vitro co-culture system to study the effects of TGF-β and
pregnancy hormones on reactivation of hookworm larvae
4.1 Introduction
After infecting a host parasitic nematodes may display developmental arrest where
larvae have the option to resume further development upon receiving appropriate stimuli
from the host. In hookworms, reactivation of the arrested larval population has a tremendous
biological and economic significance as it results in active intestinal infection as well as
transmammary transmission of the parasite (Schad, 1990). Molecular signals mediating such
resumption of development have been well-studied in developmentally arrested dauer stage
of the free-living soil nematode Caenorhabditis elegans (Riddle and Alberts, 1998). Genetic
and molecular analyses in C. elegans have shown that transforming growth factor (TGF)-β
and insulin-like growth factor (IGF)-1 signaling pathways mediate neuroendocrine responses
leading into dauer formation as well as exit from the dauer stage (Georgi, et al., 1990;
Estevez, et al., 1993; Ren, et al., 1996; Kimura, et al., 1997). Parallels have been drawn from
these signaling pathways in studying the mechanisms of larval arrest and reactivation in
hookworms (Hawdon and Schad, 1993). It has also been speculated that hormonal changes
occurring during pregnancy potentially provide a stimulus for larval reactivation. Exogenous
administration of estrogen and prolactin in A. caninum infected dogs resulted in resurgence
of larvae in milk (Stoye and Krause, 1976). Since estrogen and prolactin have been shown to
upregulate TGF-β2 isoform in uterus and mammary gland (Schneider et al., 1996), it is likely
that a combination of hormones and cytokines in a timely manner causes the reactivation of
the latent larval reservoir for re-infection and transmission.

80
Cell culture systems have been previously used in studies on helminth biology
mainly, to culture the infective-stage L3 larvae to promote molting into the fourth stage in
Brugia (Smith, et al., 2000), develop a cell line derived from viable L3 to evaluate antigen-
specific humoral immune response in Haemonchus (Coyne and Brake, 2001), and nematode
establishment, molting and reproduction in intestinal epithelial cells by Trichinella
(ManWarren, et al., 1997; Gagliardo, et al., 2002). One of the primary goals of in vitro
culture systems is to mimic the in vivo environment, thus providing the parasite with host-
like conditions.
In vivo, the reactivation of arrested larvae leads to resumption of development with
growth and morphological changes which require energy and therefore, intake of food. In C.
elegans, dauer larvae start to feed within 2-3 hours of exposure to bacterial food and exit
from the arrested stage (Ren, et al., 1996). In hookworms, a simple in vitro assay was
developed in which larval reactivation results in activation of the feeding response and the
ingestion of flourescein-labeled albumin leading to fluorescent intestinal tracts in the larvae
that can be easily scored under a fluorescent microscope (Hawdon, et al., 1993; Kumar and
Pritchard, 1994). Besides hookworms, the in vitro feeding assay has been used as a direct
method for measuring the reactivation of larvae in other parasitic nematodes also as it is
speculated that resumption of feeding is associated with resumption of development
(Hawdon, et al., 1992, 1993; Gamble and Mansfield, 1996). It was used in the present study
to evaluate the candidate cytokines and hormones that may be responsible for triggering
reactivation of A. caninum larvae. It appears that the amphids which contain axon endings of
chemosensory neurons at the anterior end of the larvae are exposed to the environment and
are therefore, critical for signaling during entry into and exit from the arrested stage

81
(Bargmann and Horvitz, 1991; Ashton, et al., 1998, 1999). Using immunofluorescence
studies, it was recently shown that anti-TGH-2 (A. caninum TGF-β isoform) antibodies
identified native protein in the anterior region of the larvae resembling areas corresponding
to the chemosensory region of the amphidial pores in C. elegans (Freitas and Arasu, 2005).
With the objective to compliment our in vivo studies on the influence of pregnancy
hormones and cytokines associated with reactivation of tissue-arrested hookworm larvae, an
in vitro cell culture system was developed. We focused on establishing primary skeletal and
mammary epithelial cell cultures as upon reactivation larvae migrate from skeletal muscle,
which is the favored site of arrest, to mammary gland leading to transmammary transmission
to the newborn. We successfully established both types of primary cell cultures in our
laboratory and co-cultured these cells with infective A. caninum L3 larvae. Previous in vitro
feeding/reactivation assays had shown that A. caninum infective L3 were not susceptible to
the effects of TGF-β while ‘tissue arrested’ L3s recovered from the carcasses of infected
mice were stimulated to resume feeding (albeit with no evidence of morphological change or
development to the 4th larval stage; Arasu, 2001). This experimental setup was designed to
pre-condition or transform infective L3 larvae by the mammalian cell co-culture to mimic
‘tissue-arrested’ larvae and to then test the hypothesis that mammalian host-derived TGF-β
and pregnancy hormones result in reactivation and resumption of development.
4.2 Materials and Methods 4.2.1 Primary skeletal muscle cell culture
For starting a primary culture of skeletal muscle, 4-5 of <1 day-old neonatal Cr:NIH (S)
mouse pups (National Cancer Institute, Frederick, MD) were killed. After skinning,

82
hindlimbs and forelimbs were collected in Hank`s Balanced Salt Solution (HBSS)
(Mediatech, Herndon, VA) and minced finely with scissors. The minced muscle mass was
subjected to digestion using an enzymatic solution of 0.17% Trypsin (T-8128, Sigma-
Aldrich, St. Louis, Missouri) and 0.085% Collagenase (C-6885, Sigma-Aldrich, St. Louis,
Missouri) in a beaker incubated at 37ºC for 25 minutes to obtain a free cell suspension . After
incubation the contents in the beaker were transferred into a 15 ml sterile disposable tube and
centrifuged at 2500 rpm for 5 minutes. Supernatant was removed by a Pasteur pipette and the
digested muscle mass along with cells were resuspended in 5 ml of complete Dulbecco`s
Modified Eagles Medium (cDMEM) containing 5% Fetal Bovine Serum (FBS) (Mediatech,
Herndon, VA) and 1% antibiotic/antimycotic solution (Mediatech, Herndon, VA) to
neutralize Trypsin. The muscle mass was washed 3 times as mentioned above and then
filtered through a NytexTM (TETKO, Kansas City, MO) membrane filter into a fresh tube.
The cell suspension was diluted to 5 ml of cDMEM and cell concentration was determined
with a hemocytometer. Cells were plated at a density of 100,000 cells per well in a 24-well
cell culture plate (Costar). The monolayer typically became 75-80% confluent after 72 hours.
4.2.2 Primary mammary epithelial cell culture
Timed pregnant full-term Cr:NIH (S) female mice (National Cancer Institute, Frederick,
MD) were killed by cervical dislocation. Mammary glands were excised, collected in HBSS
and minced into a fine paste with scissors and scalpel. The minced mammary gland tissue
was subjected to digestion using an enzymatic solution of 0.35% Collagenase Type 3 (C-
6885, Sigma-Aldrich, St. Louis, Missouri) and 0.65% Hyaluronidase (H-3506, Sigma-
Aldrich, St. Louis, Missouri) in a beaker shaking at 200 rpm at 37ºC for 2 hours for a free

83
cell suspension. After incubation the mammary gland was mixed well with the help of a 10
ml pipette and filtered through a Nytex membrane into a 15 ml sterile disposable tube and
centrifuged at 1500 rpm for 5 minutes. The supernatant containing milk, fat globules and
tissue debris was removed carefully without disturbing the cell pellet. The cell pellet was
resuspended in cDMEM and washed three times at 2500 rpm for 5 minutes each at room
temperature. After the final washing the cell pellet was resuspended in cDMEM, filtered
again through the Nytex membrane and collected in 5 ml cDMEM for cell enumeration using
a hemocytometer. Cell were plated at a density of 50,000 cells per well in a 24-well Collagen
I -coated cell-culture plate (Greiner Bio-One, Kremsmünster, Austria). The monolayer
typically became 75-80% confluent around 72 hours.
4.2.3 Immunohistochemistry
Immunohistochemistry was performed on primary skeletal muscle cells and
mammary epithelial cells to confirm the presence/prevalence of the respective cells of
interest. For preparing a cytospin, cells were detached using 50 µl trypsin/EDTA at 37ºC for
4 minutes and suspended in trypsin inhibitor (DMEM with 10% FBS). Cells were dissociated
by pipetting up and down ten times. After adding cytospin fluid, the cell suspension was
attached to the glass slides by centrifuging at 1000 rpm for 1 minute in Shandon cytospin-3
(Labtics, Helsinborg, Sweden). Cytospins were fixed using 2% ice-cold paraformaldehyde
for 10 minutes and rinsed well with PBS. Histostain®-SP kit (Zymed, San Francisco, CA)
was used for immuno-histological staining. Peroxidase quenching solution consisting of 30%
hydrogen peroxide and 9 parts of absolute methanol was used to flood the whole slide for 10
minutes. After rinsing the slide with PBS, one drop of serum blocking solution was applied

84
per cytospin for 10 minutes. Anti-rabbit c-met (Receptor tyrosine kinase) antibody (Zymed,
San Francisco, CA) was used at a 1:100 dilution for staining skeletal muscle cells overnight
at 4ºC. Anti-rabbit cytokeratin antibody (Novocastra, NewCastele, UK) was used at 1:50
dilution for staining mammary epithelial cells for 1 hour and incubated in a moist chamber.
After rinsing the slides with PBS, 100 µl of biotinylated secondary antibody was added to
each slide and incubated for 10 minutes. After the incubation step, the rinsing step was
repeated to remove any remaining biotinylated secondary antibody. Two drops or 100 µl of
enzyme-conjugate solution was added to each slide for 10 minutes and rinsed off with PBS.
Two drops or 100 µl of substrate-chromogen mixture was added to each slide and incubated
for 15 minutes and rinsed well with distilled water. The slide were counterstained with two
drops or 100 µl of hematoxylin for 3 minutes and washed under tap water. Two drops of
mounting solution was put on the slides before applying the coverslip over the cell pellet.
The slide was observed under microscope for the development of a red color indicating
positive staining. For negative controls, primary antibody was not added and C2C12 cells
served as a positive control for skeletal muscle cells whereas HC11 cells served as a positive
control for mammary epithelial cells.
4.2.4 L3 larvae
Infective A. caninum L3 were harvested from charcoal co-cultures of feces from male
laboratory beagle dogs (Marshal Farms, North Rose, NY) orally infected at 8-10 weeks of
age with 150 L3 as previously described (Burke and Roberson, 1979a; Arasu, 1998). The use
of dogs in this study was approved by the Institutional Animal Care and Use Committee at
North Carolina State University. Feces containing A. caninum eggs (range of 500-3000

85
eggs/g depending on stage of infection) were mixed with activated charcoal and deionized
water in Pyrex® baking trays and placed in a humidified incubator, in the dark, at 25ºC for 7-
10 days. The L3 were harvested utilizing a modified Baermann assembly (Garcia and Ash,
1979), repeatedly washed in phosphate-buffered saline (PBS) medicated with 20 mg/L
gentamicin (Sigma Chemical Co., Missouri) and 20mg/L lincomycin (Sigma Chemical Co.,
Missouri) and maintained at room temperature for 5-7 days prior to use.
To prepare the larvae for co-culture, infective L3 were exsheathed using 0.1% Clorox
bleach (Oakland, CA) to 5000 L3 larvae suspended in 10 ml of PBS in a 50 ml
polypropylene tube and kept on a shaker (Fisher Scientific, Pittsburgh, PA) at 150 pm for 5
minutes. After filling the tube with excess PBS up to 45 ml, the larvae were washed at 1000
rpm for 3 minutes by centrifugation. The washing step was repeated 4-5 times prior to use.
4.2.5 Primary cells and Larval Co-culture
The monolayer of cells was washed 3 times with 750 µl of cDMEM to remove media
and residual serum as serum can activate a feeding response in the L3 larvae. DMEM-Serum
Replacement II (SRII) (Sigma Aldrich, St. Louis, Missouri) was prepared the same way as
cDMEM but by replacing serum with 1% SRII. After adding 1000 µl of DMEM-SRII to each
well, Transwell© polycarbonate membrane with 3.0 µm pore size (Costar, Corning Inc.,
Corning, NY) were placed into each well. The Transwell© membranes split the cell culture
wells into a lower well and an upper well. Negative controls were setup in triplicate by
adding 5% SRII to the final volume of 1.25 ml. Similarly, positive controls were setup in
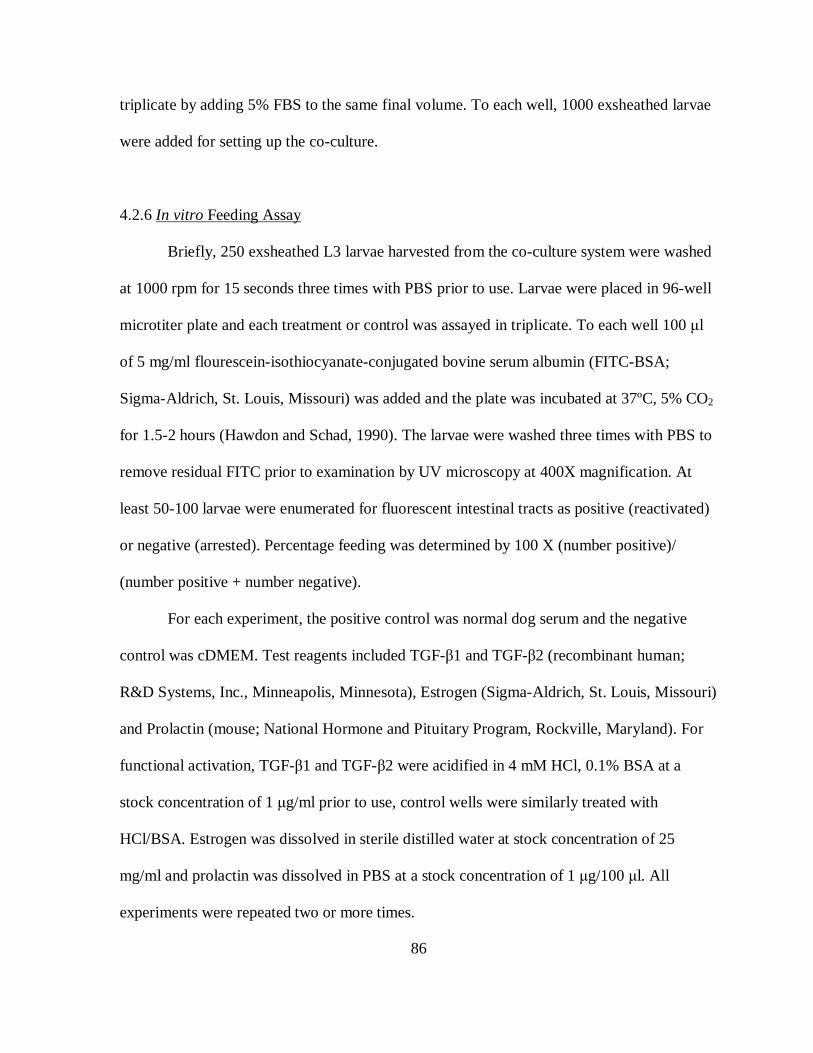
86
triplicate by adding 5% FBS to the same final volume. To each well, 1000 exsheathed larvae
were added for setting up the co-culture.
4.2.6 In vitro Feeding Assay
Briefly, 250 exsheathed L3 larvae harvested from the co-culture system were washed
at 1000 rpm for 15 seconds three times with PBS prior to use. Larvae were placed in 96-well
microtiter plate and each treatment or control was assayed in triplicate. To each well 100 µl
of 5 mg/ml flourescein-isothiocyanate-conjugated bovine serum albumin (FITC-BSA;
Sigma-Aldrich, St. Louis, Missouri) was added and the plate was incubated at 37ºC, 5% CO2
for 1.5-2 hours (Hawdon and Schad, 1990). The larvae were washed three times with PBS to
remove residual FITC prior to examination by UV microscopy at 400X magnification. At
least 50-100 larvae were enumerated for fluorescent intestinal tracts as positive (reactivated)
or negative (arrested). Percentage feeding was determined by 100 X (number positive)/
(number positive + number negative).
For each experiment, the positive control was normal dog serum and the negative
control was cDMEM. Test reagents included TGF-β1 and TGF-β2 (recombinant human;
R&D Systems, Inc., Minneapolis, Minnesota), Estrogen (Sigma-Aldrich, St. Louis, Missouri)
and Prolactin (mouse; National Hormone and Pituitary Program, Rockville, Maryland). For
functional activation, TGF-β1 and TGF-β2 were acidified in 4 mM HCl, 0.1% BSA at a
stock concentration of 1 µg/ml prior to use, control wells were similarly treated with
HCl/BSA. Estrogen was dissolved in sterile distilled water at stock concentration of 25
mg/ml and prolactin was dissolved in PBS at a stock concentration of 1 µg/100 µl. All
experiments were repeated two or more times.

87
4.3 Results
4.3.1 Staining of primary cell cultures
Primary skeletal muscle cells and primary mammary epithelial cells showed positive
staining with anti-c-met antibody and anti-cytokeratin antibody respectively, using the
Histostain kit (Zymed laboratories, San Francisco, CA). After evaluating the stained cells
under the microscope it was found that more than 80% of the cells in the primary skeletal
muscle cell culture were of skeletal muscle origin (Figure 4.1a, 4.1b, 4.1c). The other major
cell type was fibroblast which did not stain with anti-c-met antibody. Based on staining with
anti-cytokeratin, more than 90% of the cells in the primary culture were mammary epithelial
cells (Figure 4.1d, 4.1e, 4.1f). Negative controls stained blue indicating absence of antigen
recognition by the primary antibody. Positive controls (C2C12, skeletal muscle cells and
HC11, mammary epithelial cells) for respective cultures stained and were used for
comparison when identifying positive staining in test cells.
4.3.2 Effect of serum on larval feeding
Preparasitic A. caninum L3 larvae were co-incubated in the presence or absence of
primary skeletal muscle cells to test the effect of DMEM media supplemented with 5% SRII
instead of serum. No differences were observed in the basal levels of reactivation between
the larvae that were co-incubated with cells or in the absence of cells (Figure 4.2a). Normal
dog serum had previously been shown to stimulate feeding behavior in infective A. caninum
L3 larvae (Schad, 1991; Arasu, 2001). Based on these findings, 5% normal dog serum was
used as positive control and absence of serum served as a negative control. As shown in Fig.
4.2a, L3s co-cultured with primary skeletal muscle cells showed a significant

88
reactivation/feeding response when exposed to serum (Figure 4.2b). Similar results were
observed with L3 obtained from co-cultures with mammary epithelial cells (Figure 4.2c).
4.3.3 Effect of TGF-β on larval feeding
TGF-β has been shown to be exhibit a dose-dependent stimulatory effect on the
tissue-arrested larvae that were harvested from the carcass of infected BALB/c mice but not
on infective, pre-parasitic L3 (Arasu, 2001). In these analyses, TGF-β had no stimulatory
effect on the A. caninum L3 larvae co-incubated with primary skeletal muscle cells for 24 h,
48 h and 72 h; the background levels of percent reactivated L3 larvae were similar to the
negative control (Figure 4.3a, 4.3b, 4.3c, respectively). Similar results were obtained with co-
incubation of A. caninum larvae with primary mammary epithelial cells (Figure 4.4a, 4.4b
and 4.4c). The experiment was repeated three times.
4.3.4 Effect of pregnancy hormones on larval feeding
In a previously published report, pregnancy-associated hormones, estrogen and
prolactin, had no effect on the tissue-arrested L3 or infective larvae at physiological (0.1-1
µg/ml) or at high concentrations of 1 mg/ml (Arasu, 2001). To determine if hormones might
have a modulatory effect on the mammalian cells with subsequent excretion of stimulatory
cytokines such as TGF-beta, estrogen (100 ng/ml) and/or prolactin (100 ng/ml) were added to
the co-cultures for 24 h, 48 h and 72 h (Figure 4.5a, 4.5b and 4.5c). There was no effect on
the percentage feeding response of L3 larvae co-cultured with primary skeletal muscle cells
as compared to that of serum alone (positive control). Similarly, no effect of hormones was
observed on the L3 larvae co-cultured with primary mammary epithelial cells (Figure 4.6a,

89
4.6b and 4.6c). Supernatants were not tested to evaluate if TGF-β was released by exposure
of the cells to the hormones.
4.4 Discussion
Mice have been used as normal paratenic hosts for in vivo studies on A. caninum
larval arrest and reactivation (Arasu and Kwak, 1999). Similar to the dog,
pregnancy/lactation in the mouse triggers the transmammary transmission of larvae to the
nursing neonates (Steffe and Stoye, 1984; Arasu and Kwak, 1999). It is known from studies
in C. elegans that TGF-β signaling is one of the pathways involved in arrest and reactivation
(Georgi, et al., 1990; Ren, et al., 1996). In mammals, TGF-β2 is apparently upregulated in
uterine and mammary tissue during pregnancy (Schneider, e al., 1996). It was therefore
hypothesized that A. caninum larvae have evolved to utilize signaling via host-derived TGF-β
resulting in reactivation, migration through somatic tissues and subsequent transmission to
the newborn. In a previously published report, physiological concentrations of TGF-β
stimulated a feeding response which was comparable to the stimulatory effect induced by
10% normal dog serum on tissue-arrested A. caninum L3 larvae (Arasu, 2001).
Pregnancy-associated hormones such as estrogen and prolactin have been implicated
in larval reactivation and transmission. When estrogen and prolactin were administered
exogenously to post-partum dogs with latent (arrested) infections of A. caninum, a resurgence
of larvae was seen in their milk if let-down was induced by administration of oxytocin (Stoye
and Krause, 1976). However, hormones did not have any direct stimulatory effect on tissue-
arrested larvae as mentioned above. There might be indirect effects of hormonal fluctuations
observed during pregnancy. TGF-β2 tissue mRNA and serum levels were elevated during

90
late pregnancy (Schneider, et al., 1996). It was further shown that TGF-β2 mRNA levels
were elevated in the same tissues (uterine and mammary gland) as a result of exogenous
estrogen treatments in ovariectomized rats (Das, et al., 1992; Cheng, et al., 1993; Schneider,
et al., 1996). Taken together, these findings suggest that host-derived cytokine and hormonal
cues may be involved in specific reactivation of tissue-arrested A. caninum larval stages
during pregnancy and lactation.
In an attempt to test our hypothesis that host factors like cytokines and hormones
stimulate reactivation of tissue-arrested A. caninum larvae, we developed a primary
cell/larvae co-culture system. Our major focus was to use the primary skeletal muscle and
mammary epithelial cell cultures for co-incubation with pre-parasitic A. caninum L3 to
mimic tissue-arrest outside the body of the host. As mentioned before, skeletal muscle is the
favored site of larval arrest and mammary gland is the site where the larvae get transmitted to
the neonates via suckling. Larvae were co-incubated with cells for 24 hours before adding the
cytokines (TGF-β1 and TGF-β2) and hormones (estrogen and prolactin) of interest. We did
not observe any significant feeding behavior in the co-cultured L3 larvae that were treated
with TGF-β isoforms and hormones. One of the reasons for such observations could be the
inability of the co-culture setup to induce tissue-arrest as it occurs inside a host.
In order to closely match the in vivo conditions, a variety of host factors and
molecules have been added to parasitic cultures in different studies. Certain factors like
ascorbic acid are critical in the morphogenesis and development of parasitic helminths like
Brugia (Rajan, et al., 2003). Similarly, a simple reproducible method has been developed for
protozoa i.e. short-term ex-vivo Plasmodium vivax culture in which glucose, ascorbic acid,
thiamine, hypoxanthine, and 50% human AB+ serum are added to the standard P. falciparum

91
in vitro culture medium (Chotivanich, et al., 2001). This simple method of culturing P. vivax
ex vivo is suitable for anti-malarial susceptibility and immunoparasitology studies. It is
therefore possible that besides the supplementation of media with serum replacement media
II (Sigma Aldrich), we would have to add other factors to simulate in vivo conditions closely.
Since host molecules important in A. caninum larval arrest are not known, it would laborious
and time-consuming to test candidate reagents. Transwell® filters keep the L3 larvae
physically separate from the cell monolayer. It is possible that the larvae have to be in close
physical contact with the cells to receive signals for undergoing arrest. However, it is very
difficult to do so in case of A. caninum L3 larvae as they are constantly moving thereby,
disrupting the cell monolayer within hours of physical contact.
We have proposed that larval reactivation can be assessed in independent ways
besides the in vitro co-culture setup. Firstly, PCR amplification can be used to evaluate the
upregulation of Ac-daf-7, which is the C. elegans daf-7 homologue recently cloned and
characterized in A. caninum, in reactivated versus arrested L3 larvae. However, recent studies
by Freitas and Arasu (2005) show that expression of daf-7 is maximal at the arrested
infective L3 as well as reactivated (serum-stimulated) L3 larval stages which differs from
that of Ce-daf-7 expression and may be unique to parasitic nematodes that have an obligate
requirement to undergo developmental arrest (Freitas and Arasu, 2005). Secondly,
reactivation status can be tested by using protein binding studies i.e. whether Ac-DAF-7 can
bind to and stimulate signaling from mammalian TGF-β receptors. Similar studies in
Schistosoma mansoni have shown that a chimeric receptor containing the extracellular
domain of type I TGF-β receptor, SmRK1, that is joined to the intracellular domain of the
human type I TGF-β receptor, could activate a luciferase reporter gene in response to TGF-β

92
(Beall and Pearce, 2001). The efforts to express Ac-DAF-7 are under way in our lab. Similar
studies of B. malayi have suggested an immunomodulatory role for recombinant Bm-TGH-2
which can bind to and stimulate signaling from mammalian TGF-β receptors (Gomez-
Escobar et al., 2000). Further studies are required to examine the host-parasite interaction in
A. caninum infection utilizing ligand and receptor interaction studies. Finally, larval
reactivation status can be checked by utilizing antibodies to Ancylostoma secreted protein
(ASP). It has been previously demonstrated that preparasitic L3 larvae stimulated by serum
start releasing excretory-secretory products such as ASPs which appear to facilitate in larval
penetration and migration (Hawdon, et al., 1996b). A better understanding of the mechanisms
associated with larval arrest and reactivation in A. caninum can contribute to development of
chemotherapeutic and vaccine-based strategies for elimination of latent infections.

93
A B
C
Figure 4.1 Immunohistochemistry. Cytospins of primary skeletal muscle were stained with c-met antibody overnight. A, C2C12 skeletal muscle cell line, positive control; B, no primary antibody, negative control; C, skeletal muscle cells stained positive with c-met antibody (20X).

94
D E
F
Figure 4.1 Immunohistochemistry. Cytospins of primary mammary epithelial cells were stained with anti-cytokeratin antibody overnight. A, HC11 mammary epithelial cell line, positive control; B, no primary antibody, negative control; C, mammary epithelial cells stained positive with anti-cytokeratin antibody (20X).

95
No cells Cells0
10
20
30
% F
eedi
ng L
3 la
rvae
Figure 4.2a Effect on percent feeding response of L3 larvae co-cultured in the presence or absence of primary skeletal muscle cells. L3 larvae were co-incubated in DMEM supplemented with 5% Serum Replacement media II in Transwells©.

96
Media ctrl 5% Serum0
10
20
30
40
50
60
% F
eedi
ng L
3 La
rvae
Figure 4.2b Effect of serum on percent feeding response of L3 larvae co-cultured with primary skeletal muscle cells. L3 larvae were co-incubated in DMEM supplemented with 5% Serum Replacement media II as negative control and larvae were stimulated with 5% normal dog serum as positive control. The asterisk indicates significant difference at p< 0.05.
*

97
Media ctrl 5% Serum0
10
20
30
40
50
60
% F
eedi
ng L
3 La
rvae
Figure 4.2c Effect of serum on percent feeding response of L3 larvae co-cultured with primary mammary epithelial cells. L3 larvae were co-incubated in DMEM supplemented with 5% Serum Replacement media II as negative control and larvae were stimulated with 5% normal dog serum as positive control. The asterisk indicates significant difference at p< 0.05.
*
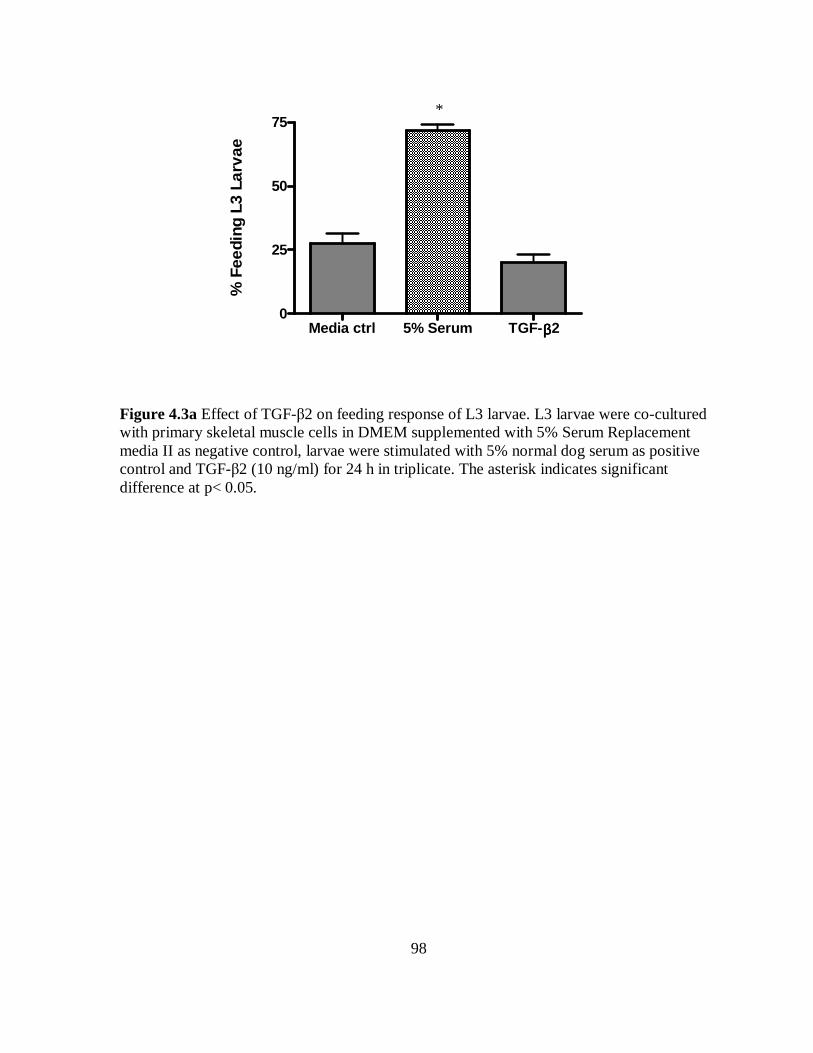
98
Media ctrl 5% Serum TGF-ββββ20
25
50
75
% F
eedi
ng L
3 La
rvae
Figure 4.3a Effect of TGF-β2 on feeding response of L3 larvae. L3 larvae were co-cultured with primary skeletal muscle cells in DMEM supplemented with 5% Serum Replacement media II as negative control, larvae were stimulated with 5% normal dog serum as positive control and TGF-β2 (10 ng/ml) for 24 h in triplicate. The asterisk indicates significant difference at p< 0.05.
*

99
Media ctrl 5% Serum TGF-ββββ20
10
20
30
40
50
60
70
80
% F
eedi
ng L
3 La
rvae
Figure 4.3b Effect of TGF-β2 on feeding response of L3 larvae. L3 larvae were co-cultured with primary skeletal muscle cells in DMEM supplemented with 5% Serum Replacement media II as negative control, larvae were stimulated with 5% normal dog serum as positive control and TGF-β2 (10 ng/ml) for 48 h in triplicate. The asterisk indicates significant difference at p< 0.05.
*

100
Media ctrl 5% Serum TGF-ββββ20
102030405060708090
% F
eedi
ng L
3 La
rvae
Figure 4.3c Effect of TGF-β2 on feeding response of L3 larvae. L3 larvae were co-cultured with primary skeletal muscle cells in DMEM supplemented with 5% Serum Replacement media II as negative control, larvae were stimulated with 5% normal dog serum as positive control and TGF-β2 (10 ng/ml) for 72 h in triplicate. The asterisk indicates significant difference at p< 0.05.
*

101
Media ctrl 5% Serum TGF-ββββ20
10
20
30
40
50
60
70
% F
eedi
ng L
3 La
rvae
Figure 4.4a Effect of TGF-β2 on feeding response of L3 larvae. L3 larvae were co-cultured with primary mammary epithelial cells in DMEM supplemented with 5% Serum Replacement media II as negative control, larvae were stimulated with 5% normal dog serum as positive control and TGF-β2 (10 ng/ml) for 24 h in triplicate. The asterisk indicates significant difference at p< 0.05.
*

102
Media ctrl 5% Serum TGF-ββββ20
102030405060708090
% F
eedi
ng L
3 La
rvae
Figure 4.4b Effect of TGF-β2 on feeding response of L3 larvae. L3 larvae were co-cultured with primary mammary epithelial cells in DMEM supplemented with 5% Serum Replacement media II as negative control, larvae were stimulated with 5% normal dog serum as positive control and TGF-β2 (10 ng/ml) for 48 h in triplicate. The asterisk indicates significant difference at p< 0.05.
*

103
Media ctrl 5% Serum TGF-ββββ20
10
20
30
40
50
60
70
80
% F
eedi
ng L
3 La
rvae
Figure 4.4c Effect of TGF-β2 on feeding response of L3 larvae. L3 larvae were co-cultured with primary mammary epithelial cells in DMEM supplemented with 5% Serum Replacement media II as negative control, larvae were stimulated with 5% normal dog serum as positive control and TGF-β2 (10 ng/ml) for 72 h in triplicate. The asterisk indicates significant difference at p< 0.05.
*

104
Media
ctrl
5% S
erum
Estro
gen
Prolac
tin
Estro
gen/P
rolac
tin0
10
20
30
40
50
60
70
% F
eedi
ng L
3 la
rvae
Figure 4.5a Effect of pregnancy-associated hormones on feeding response of L3 larvae. L3 larvae were co-cultured with primary skeletal muscle cells in DMEM supplemented with 5% Serum Replacement media II as negative control, larvae were stimulated with 5% normal dog serum as positive control and estrogen (100 ng/ml), prolactin (100 ng/ml) and estrogen/prolactin for 24 h in triplicate. The asterisk indicates significant difference at p< 0.05.
*
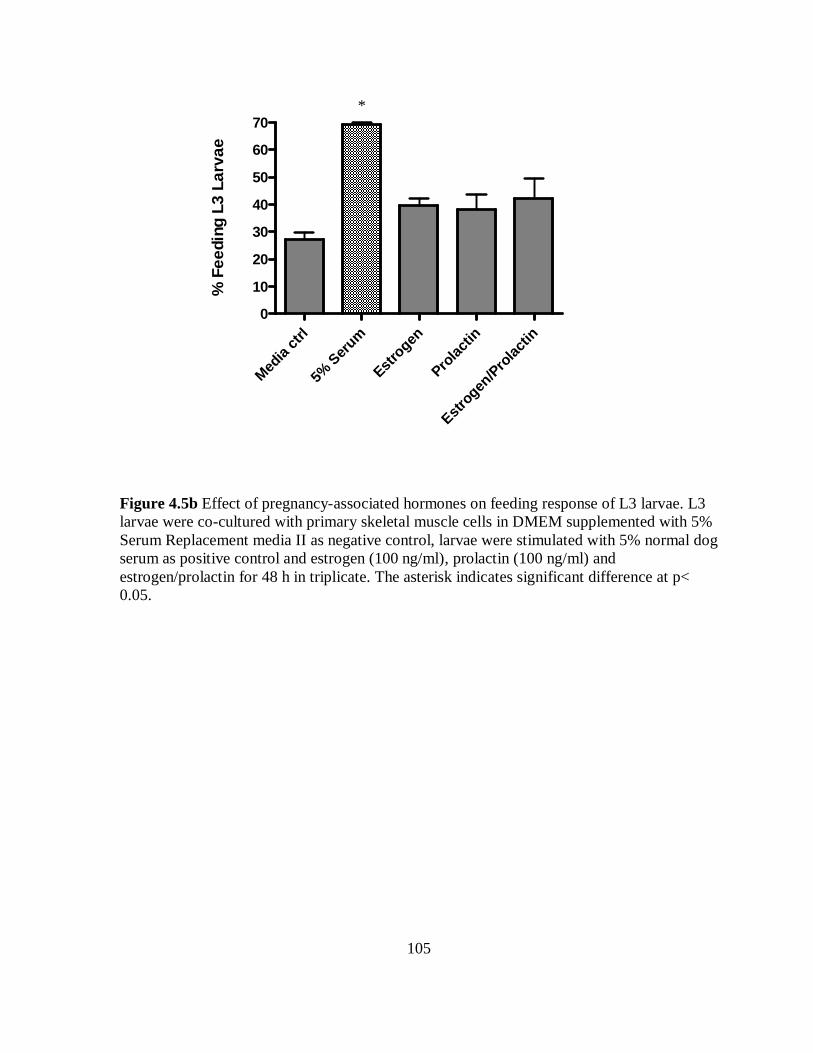
105
Media
ctrl
5% S
erum
Estro
gen
Prolac
tin
Estro
gen/P
rolac
tin0
10
20
30
40
50
60
70
% F
eedi
ng L
3 La
rvae
Figure 4.5b Effect of pregnancy-associated hormones on feeding response of L3 larvae. L3 larvae were co-cultured with primary skeletal muscle cells in DMEM supplemented with 5% Serum Replacement media II as negative control, larvae were stimulated with 5% normal dog serum as positive control and estrogen (100 ng/ml), prolactin (100 ng/ml) and estrogen/prolactin for 48 h in triplicate. The asterisk indicates significant difference at p< 0.05.
*

106
Media
ctrl
5% S
erum
Estro
gen
Prolac
tin
Estro
gen/P
rolac
tin0
10
20
30
40
50
60
70
80
% F
eedi
ng L
3 La
rvae
Figure 4.5c Effect of pregnancy-associated hormones on feeding response of L3 larvae. L3 larvae were co-cultured with primary skeletal muscle cells in DMEM supplemented with 5% Serum Replacement media II as negative control, larvae were stimulated with 5% normal dog serum as positive control and estrogen (100 ng/ml), prolactin (100 ng/ml) and estrogen/prolactin for 72 h in triplicate. The asterisk indicates significant difference at p< 0.05.
*

107
Media
ctrl
5% S
erum
Estro
gen
Prolac
tin
Estro
gen/P
rolac
tin0
10
20
30
40
50
60
70
80
% F
eedi
ng L
3 La
rvae
Figure 4.6a Effect of pregnancy-associated hormones on feeding response of L3 larvae. L3 larvae were co-cultured with primary mammary epithelial cells in DMEM supplemented with 5% Serum Replacement media II as negative control, larvae were stimulated with 5% normal dog serum as positive control and estrogen (100 ng/ml), prolactin (100 ng/ml) and estrogen/prolactin for 24 h in triplicate. The asterisk indicates significant difference at p< 0.05.
*
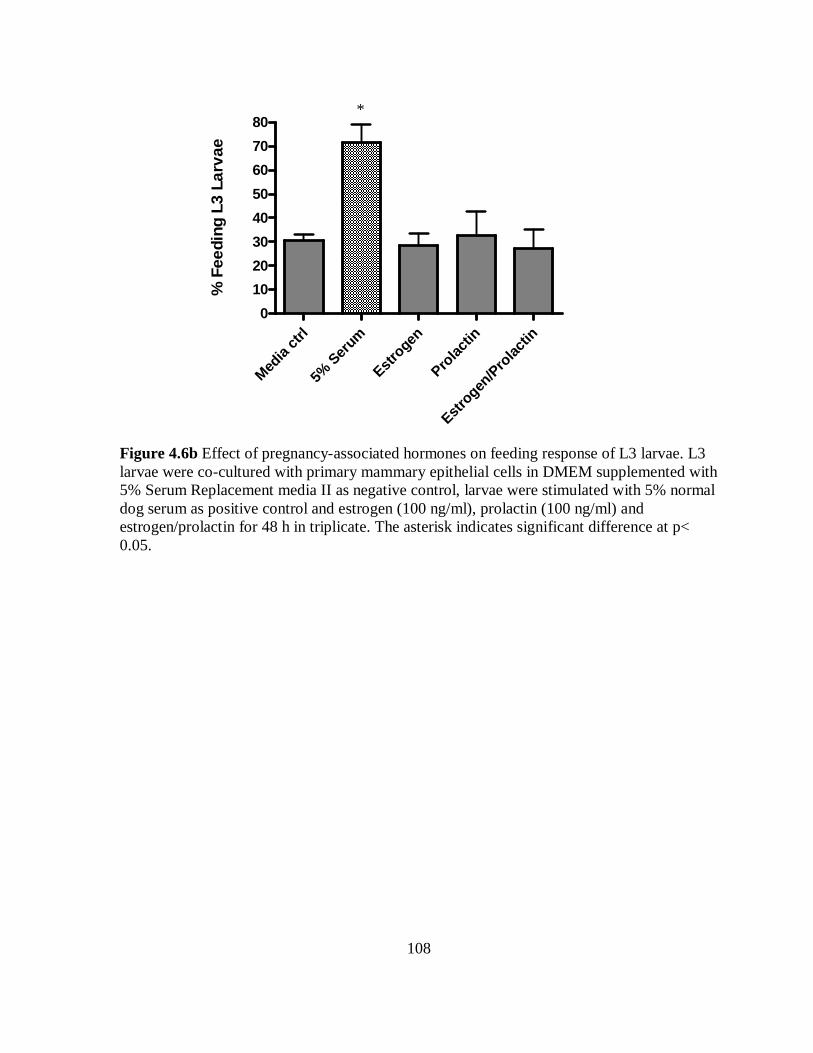
108
Figure 4.6b Effect of pregnancy-associated hormones on feeding response of L3 larvae. L3 larvae were co-cultured with primary mammary epithelial cells in DMEM supplemented with 5% Serum Replacement media II as negative control, larvae were stimulated with 5% normal dog serum as positive control and estrogen (100 ng/ml), prolactin (100 ng/ml) and estrogen/prolactin for 48 h in triplicate. The asterisk indicates significant difference at p< 0.05.
Media
ctrl
5% S
erum
Estro
gen
Prolac
tin
Estro
gen/P
rolac
tin
0
10
20
30
40
50
60
70
80
% F
eedi
ng L
3 La
rvae
*

109
Media
ctrl
5% S
erum
Estro
gen
Prolac
tin
Estro
gen/P
rolac
tin0
10
20
30
40
50
60
70
80
% F
eedi
ng L
3 La
rvae
Figure 4.6c Effect of pregnancy-associated hormones on feeding response of L3 larvae. L3 larvae were co-cultured with primary mammary epithelial cells in DMEM supplemented with 5% Serum Replacement media II as negative control, larvae were stimulated with 5% normal dog serum as positive control and estrogen (100 ng/ml), prolactin (100 ng/ml) and estrogen/prolactin for 72 h in triplicate. The asterisk indicates significant difference at p< 0.05.
*

110
5. IL-4 and IFN-γ serum protein and transcript levels during pregnancy and
Ancylostoma caninum infection in BALB/c mice
5.1 Introduction
More than one billion people in the tropics and sub-tropics are known to be infected
with hookworms (Chan, 1997). Thus, hookworm infection remains a major contributor to
iron-deficiency anemia as adult parasites feed on blood from the intestines. Since hookworms
are known to exhibit latency and reactivation, they interact with their hosts at an intimate
level and have been reported to 'counter' the complex immune responses generated against
them (Behnke, 1991; Loukas and Prociv, 2001). Immune responses to hookworms have been
studied in both humans and experimental animal hosts in attempts to understand host
protection as well as parasite survival particularly with regard to the development of
hookworm vaccines. Eosinophilia, mastocytosis and IgE production are the most prominent
immune alterations observed during a hookworm infection (Loukas and Prociv, 2001). In
many ways, hookworms are typical gastrointestinal nematodes based on types of immune
responses generated in definitive hosts. Humoral and cellular responses fit loosely within the
framework of a T helper 2 (Th2) type of response (Loukas, et al., 2005). Humans infected
with Necator hookworms produce high levels of parasite-specific and total IgE (Pritchard
and Walsh, 1995; Pritchard, et al., 1995) which is accompanied by peripheral and local
eosinophilia (White, et al., 1986; Maxwell, et al., 1987). While humoral responses to
hookworms have been well documented; little was known about the role of adaptive T cell
response until recently (Quinnell et al., 2004; Pit, et al., 2000 and 2001).

111
There is a notable lack of suitable animal models for human hookworm infection, and
extrapolating from immunological models of an abnormal host can be unreliable. N.
americanus matures in hamsters; however, there is wide variability in the number of L3 that
develop into intestinal adult worms (Rose and Behnke, 1990; Jian, et al., 2003). Similarly, A.
duodenale has been shown to develop in dogs, but only with exogenous administration of
steroids (Leiby, et al., 1987). Syrian Golden hamsters (Mesocricetus auratus) have also been
used to model infections with Ancylostoma ceylanicum (Garside, et al., 1990). In a recent
study, impact of A. ceylanicum hookworm infection on host cellular responses, cytokine
production and lymphoproliferation were measured (Mendez, et al., 2005). Initial larval
infection with 100 third-stage A. ceylanicum larvae resulted predominantly in Th1 responses
(upregulation of proinflammatory cytokines such as IFN-γ and TNF-α) which occurred
during larval migration and continued up to 14 days post-infection or prepatency.
Subsequently, development of larvae into egg-laying adult hookworms or patency coincided
with a switch to Th2 predominant responses with a marked increase in IL-4 and IL-10
production. This switch also concurred with reduced host lymphoproliferative responses to
hookworm antigens (Mendez, et al, 2005).
A. caninum infection in dogs serves as a good model for understanding the host-
parasite interactions occurring during human hookworm infection. However, canines are not
a realistic option due to high animal costs as well as ethical concerns with euthanasia for
these types of studies. Our lab has utilized the mouse as a circumscribed model for
specifically assessing pregnancy-associated transmammary transmission of A. caninum
infection in the neonate (Arasu and Heller, 1999; Arasu and Kwak, 1999). The murine model
was used to compare the responses of infected versus uninfected animals that were either

112
bred or not bred to ascertain whether suppression of A. caninum-specific antibody responses
during pregnancy facilitated the reactivation and transmammary transfer of hookworm
larvae. Initial comparisons of genetically divergent BALB/c versus C57BL/6 mice showed
that both the strains mounted strong Th2 biased IgG1 and IgE antibody responses to A.
caninum infection (Arasu and Heller, 1999). It was also confirmed that larval transfer to the
mouse pups occurred during the post-partum lactational period as there was only one
previously published report using mice to assess the transmammary transmission of A.
caninum larvae (Steffe and Stoye, 1984). In dams, levels of total and antigen-specific IgG1
and total IgE (Th2 response) were highly correlated with parasite burden (Arasu and Heller,
1999). During most phases of pregnancy and lactation, infected dams had lower total IgG1,
IgG2a and IgE levels as compared to unbred mice at comparable times post-infection which
supported the established dogma of a generalized immunosuppression associated with
pregnancy (Arasu and Heller, 1999). However, correlative studies showed that the parasite-
specific antibody responses did not play a major role in the pregnancy-associated
transmammary transmission of A. caninum larvae (Arasu and Heller, 1999). These studies do
not rule out the possibility of underlying fluctuations in the levels of Th1 and Th2 cytokines
associated with pregnancy and infection that may be involved in the process of larval
reactivation and transmission.
We report here the immunological profile of IL-4 and IFN-γ mRNA transcripts
during pregnancy and A. caninum infection in skeletal muscle (the favored site of latent
infection), mammary gland (where the larvae get transmitted) and spleen (major site to
monitor immune responses during parasitic infections). Interestingly, in our model of
breeding and infection we found that during early lactation IL-4 transcript levels predominate

113
over IFN-γ in skeletal muscle but were concurrently downregulated in mammary gland in
infected bred mice. We also found that both IL-4 and IFN-γ transcripts were upregulated at
14 days post-infection in mammary gland of infected unbred mice which support the findings
that acute helminthic infections are often associated with mixed Th1/Th2 responses. We were
unable to correlate mRNA transcript levels with serum levels as IL-4 was undetectable in the
sera of majority of the mice.
5.2 Materials and Methods
5.2.1 Mice breeding and infection
Nine to ten-week-old female BALB/c mice were purchased from Charles River
Laboratories, and maintained at the Laboratory Animal Resources facility in accordance with
Institutional Animal Care and Use Committee guidelines. Mice were mated at a ratio of 2
females: 1male for a period of 7 days and examined twice daily for the presence of a vaginal
impregnation plug. Observation of a plug was designated as day 0 of the pregnancy. On day
5 post-impregnation (observation of vaginal plug), the female mice were injected sub-
cutaneously in the dorsal cervical interscapular region with 100 ul PBS (control) or with
1000 larvae in PBS. Mice were killed by decapitation at three different time points: time
point I corresponding to day 19 of gestation or day 14 post-infection (pi), and time points II
and III corresponding to day 1 and 10 of postpartum lactation or day 15-16 pi and day 25-26
pi, respectively. The tissue samples collected were sections of the gastrocnemius skeletal
muscle, mammary gland, and spleen as well as blood. Approximately 200mg of each tissue
sample (except blood) was stored in RNA-STAT 60 (Tel-Test, Texas) at -80ºC for RNA
extraction. Serum was collected after incubating whole blood at 37ºC for 1 h and

114
subsequently at 4ºC for 4 h and subsequently stored at -20ºC until further use. The female
mice were grouped as infected or not infected and bred or not bred (n = 5 per group). The
resulting four groups were uninfected/ unbred (UN or normal controls), infected/ unbred
(IN), uninfected/ bred (UB) and infected/ bred (IB).
5.2.2 Harvesting tissue L3
For harvesting tissue-arrested larvae, carcasses were skinned, minced, wrapped in
eight layers of cheesecloth and incubated in a modified Baermann assembly for 4 h at 37ºC
in PBS medicated with 20 mg/L gentamicin (Sigma Chemical Co., Missouri) and 20mg/L
lincomycin (Sigma Chemical Co., Missouri). Migrating larvae that collected at the bottom of
the cups were repeatedly washed at 2000 rpm for 10 minutes with medicated PBS. Larval
numbers in dams versus each litter of pups were counted with the aid of a dissecting
microscope.
5.2.3 Mouse IL-4 ELISA
IL-4 levels were determined using a Mouse IL-4 ELISA kit (Pierce Endogen,
Rockford, IL) which is based on the principle of an indirect ELISA. The assays were
performed using anti-mouse IL-4 pre-coated 96-well strip plates. The standards (0, 15, 75
and 375 pg/ml) were prepared according to the manufacturer’s protocol. Using a
multichannel pipettor 50 µl of plate reagent was added to each well before adding 50 µl of
reconstituted standards and test sera samples from different groups of mice. The plate was
covered with an adhesive tape and incubated for 3 hours at 37ºC in a humidified incubator.
After washing five times with wash buffer, 100 µl prediluted conjugate reagent was added to
115
each well and the plate was incubated for 1 hour 37ºC in a humidified incubator. After
repeating the washing step five times, 100 µl of TMB substrate solution was added to each
well. Enzymatic color reaction was allowed to develop at room temperature in the dark for 30
minutes. The substrate reaction yielded a blue solution that turned yellow when Stop Solution
containing hydrochloric acid was added. Absorbance was measured on an ELISA plate
reader set at 450 nm and 550 nm. The standard curve was used to determine IL-4 in pg/ml in
the unknown samples.
5.2.4 RNA extraction and cDNA synthesis
Total RNA from all the tissues (skeletal muscle, mammary gland and spleen) was
extracted using RNA-STAT (Tel-Test, Inc., Friendswood, TX) according to Chomczynski
and Sacchi (1987). Residual genomic DNA was removed from RNA by treating with DNase
(20U per 100 µg of RNA). RNA quantity and quality was checked by spectrophotometric
measurements at 260 and 280 nm (Pharmacia) and by analyzing 1µg RNA for rRNA bands
and integrity on a 1% ethidium bromide agarose gel.
For reverse transcription, first strand cDNA was synthesized by adding 10µg of total
RNA to a 40µl reaction mix containing a final concentration of 2.5nM dNTPs, 0.1M
dithiothreitol, 1 µg Oligo d (T) primer (Promega, Madison, WI), 24U RNase inhibitor and
incubation with 200U Superscript II reverse transcriptase (Invitrogen, Carlsbad, CA) at 37°C
for 1 hour. To confirm absence of contaminating genomic DNA, RT negative reactions with
5µg total RNA were setup. RT-plus (cDNA)/minus reactions were subjected to RT-PCR
(reverse transcription-polymerase chain reaction) using GAPDH primers. PCR reactions
were run on a 2% agarose gels to check for product formation and DNA contamination. The

116
thermal cycler program was one cycle of 94ºC for 5 min, 40 cycles of 94ºC for 1 min, 56ºC
for 1 min and 72ºC for 1 min, followed by one cycle of 72ºC for 1 min.
5.2.5 Primer design
Primer sets for genes of interest, IL-4 and IFN-γ and reference gene 60S acidic
ribosomal protein were designed from mouse-specific Genbank sequences listed in Table 1
using Primer 3 software (Rozen and Skaletzky, 2000) (http://www-genome.-wi.mit.edu/cgi-
bin/primer/primer3_www.cgi). In order to minimize primer-dimer formation, the maximum
self-complementarity was 6 and the maximum 3’ self-complementarity was 0. The targets
amplified by primer pairs were characterized using the Mfold program (SantaLucia, 1998)
(http://bioinfo.math.rpi.edu/~mfold/dna/form1.cgi) for predicting the nature of any secondary
structures which may form at the site of primer binding. Primer pairs that bound at the site of
a predicted loop were discarded. Primer sets were synthesized by Integrated DNA
Technologies (Coralville, IA) and primers were reconstituted at100 pM/ul in nuclease-free
water prior to use.
5.2.6 Real-time PCR
The real-time PCR reactions were carried out using the iCyclerTM iQ PCR detection
system (Bio-Rad Laboratories, Hercules, CA, USA). In each 25µl reaction, 12.5µl of iQTM
SYBR green supermix (Bio-Rad) was added to 300nM of each primer along with 250ng of
cDNA. PCR amplification was performed in duplicate for each sample using the following
cycle conditions: 3 min at 95°C followed by 45 repeats of 1 min at 95°C, 30s at 55°C and 30s
at 72°C. Temperature optimization was carried out for all the primer sets to be amplified
117
simultaneously. Annealing temperatures were tested from the 50-65ºC range; all the primer
sets amplified optimally at 55ºC. A melt curve analysis step was included at the end of cycles
to check for primer-dimer and non-specific product formation. Efficiency of the PCR
reactions was derived by doing a standard curve of 10-fold serially diluted mouse spleen
cDNA and was consistently in the 95-98% range. Non-template controls were used to detect
any genomic DNA contamination and amplified products were also examined on a 2%
agarose gel to verify that the amplified products were of the expected sizes. Raw Ct values
were analyzed using Relative Expression Software Tool-384 (REST-384) to generate a fold
increase or decrease in the transcript levels (Pfaffl, et al., 2002). The 60S acidic ribosomal
protein was used as the endogenous reference gene for normalizing transcript levels among
tissues of interest. 60S ribosomal protein was previously shown to be the least variable from
comparative analyses of various genes including β-actin, cyclophilin and glyceraldehyde-3-
phosphate dehydrogenase (GAPDH) all of which were tested as potential candidate reference
genes (using methodology as described in Chapter 6 of this dissertation).
5.2.7 Statistical analysis
Data reported for larval burden as mean ± standard deviation was analyzed by two-
way ANOVA using the General Linear Models (GLM) procedure in SAS (Cary, North
Carolina) and p<0.05 was considered significant. For comparing variation in transcript levels
of cytokine genes, Pair-Wise Fixed Reallocation Randomization Test© in the REST-384 was
used (Pfaffl, et al., 2002). The mathematical model used to compute the relative expression
ratio of a target gene relies on its real-time PCR efficiencies (E) and the threshold cycle

118
difference (∆Ct) of an unknown sample versus a control (∆Ct control - sample). The target gene
expression is normalized to a reference gene (ref) in the equation mentioned below:
Ratio = (E target) ∆Ct target (control - sample) / (E ref)
∆Ct ref (control - sample)
In our experimental setup control was the uninfected/unbred (UN) mice and samples were
the infected/unbred, uninfected bred (UB) and infected/bred (IB). For evaluating fold
upregulation or downregulation of transcripts between timepoints, early-lactation (timepoint
II) and mid-lactation (timepoint III) were compared to late-gestation (timepoint I) expression
of which was relative to control (UN). For evaluating fold changes in transcript levels,
analyses were also done by comparing IN, UB and IB group each to the UN at respective
timepoints (See Appendix II).
5.3 Results
5.3.1 Breeding efficiency and larval burden assessment
Breeding efficiency, measured by dividing bred mice by total number of mice mated,
was used to evaluate the effect of A. caninum infection on the outcome of pregnancy. A total
of 82 female BALB/c mice were infected with 1000 A. caninum larvae post-impregnation, of
which 16 gave birth to live pups. Thus, breeding efficiency was 20% in the infected/bred (IB)
mice. Compared to the IB group, uninfected/bred (UB) mice had breeding efficiency of 45%
as 22 of 49 resulted in live litters. These results suggest that A. caninum infection has an
adverse effect on pregnancy, as shown by lower breeding efficiencies.
To compare larval distribution in dams, eight week old female BALB/c mice were
subcutaneously injected with 1000 A. caninum L3 larvae. A comparison of larval burden
during the course of A. caninum infection was made between infected/not bred (IN) and IB
119
mice at the three different timepoints corresponding to late gestation and early to mid
lactation (Figure 5.1). The total number of larvae recovered from IN mice was not
significantly different from the IB mice at late gestation or mid lactation. However, there was
a significant difference (p< 0.005) in the larval burden of IN mice (368 ± 64) and IB mice
(249 ± 31) at timepoint II, immediately postpartum.
To correlate the level of transmammary transmission from dam to pups, larval counts
were also assessed in litters from IB dams: 5 ± 4 and 9 ± 2 larvae were respectively obtained
during the timepoints for early and mid lactation, for timepoints II and III, respectively. The
larval burden in the feti (timepoint I) was not assessed as previous studies have shown that
there is no in utero transmission of A. caninum larvae from dam to fetus during pregnancy
(Steffe and Stoye, 1984; Arasu and Kwak, 1999).
5.3.2 Serum IL-4 levels
To compare the IL-4 levels during different phases of breeding, serum was collected
at late gestation (timepoint I), early lactation (timepoint II) and mid-lactation (timepoint III).
IL-4 levels were assessed in uninfected/not bred (UN) controls and compared to IL-4 levels
from IN, UB and IB mice at timepoints I, II and III. IL- 4 was not detectable in serum
samples from any group except for two individual mice in the IN group. Mouse # 4 and
mouse #5 had serum IL-4 levels of 210 pg/ml and 302 pg/ml respectively at timepoint III,
which is the last timepoint included in this study. Serum levels of IFN-γ could not evaluated
due to insufficient quantities of serum remaining as 50µl/well was required for the IFN-γ
ELISA (Pierce Endogen, Rockford, IL).

120
5.3.3 Transcript levels of IL-4 and IFN-γ in skeletal muscle and mammary gland
IL-4 mRNA transcripts levels were evaluated during the course of A. caninum
infection at different stages of pregnancy and lactation in skeletal muscle, mammary gland
and spleen using real-time PCR. REST software was used to analyze the fold changes in
expression of transcripts (Pfaffl, et al., 2002). Skeletal muscle was assessed as it is the
favored site of arrest for L3 larvae.
In skeletal muscle, IL-4 transcript levels were significantly upregulated during early
lactation at timepoint II (p< 0.05) in the IB group compared to the timepoint I (Figure 5.2a).
No significant changes in IL-4 levels were observed skeletal muscle of IN and UB groups
(Figures 9.3a, 9.3b in Appendix II). In mammary gland, IL-4 transcript levels were
significantly upregulated at timepoint I (p< 0.005) corresponding to two weeks (timepoint II
for IN group) of A. caninum infection in the IN group when compared to UN (Figure 5.2b).
However, IL-4 transcript levels were significantly downregulated at timepoint II (p< 0.05) in
the mammary gland of IB group as compared to timepoint I (Figure 5.2c). No significant
changes were observed in IL-4 transcripts in the UB group (Figure 9.3c in Appendix II). In
the spleen, no significant changes in expression of IL-4 were identified in the IN, UB or IB
groups (Figures 9.3d, 9.3e, 9.3f in Appendix II). In summary, IL-4 was predominantly
expressed in skeletal muscle but downregulated in mammary gland of the IB group.
IFN-γ transcript levels were also evaluated during the course of A. caninum infection
and different stages of pregnancy and lactation in skeletal muscle, mammary gland and
spleen using real-time PCR. No significant changes in IFN-γ transcripts were observed in any
of the groups in skeletal muscle (Figures 9.4a, 9.4b, 9.4c in Appendix II). In mammary gland,
IFN-γ transcript levels were significantly upregulated at timepoint I (p< 0.05) in the IN group

121
compared to the UN controls (Figure 5.3). This is consistent with the recent reports that
during the early phase of hookworm infection Th1 responses predominate over Th2. No
significant changes in IFN-γ transcripts were observed in mammary gland of UB and IB
groups. Similarly, no significant differences were noted in IFN-γ transcript levels in skeletal
muscle or spleen of the IN, UB and IB groups at the three timepoints of interest (Figures
9.4d-h in Appendix II).
Discussion
Hookworm infection has been globally recognized as one of the most common
persistent infections of humans, with majority of cases occurring in the tropics and subtropics
(de Silva, et al., 2003). Clinical symptoms of hookworm infection include anemia,
eosinophilic gastroenteritis, weight loss and retardation of growth. Latency and reactivation
is a common phenomenon in the life cycle of the hookworm which leads to chronicity of
infection that is well documented in dogs (Stoye and Krause, 1976). Developmentally
arrested third stage larvae (L3) of Ancylostoma species of hookworms have the capacity to
reactivate and mobilize during pregnancy which leads to transmission of L3 to the
immunologically naïve offspring via milk (Stone and Smith, 1973; Schad, 1979). We have
developed a mouse model of A. caninum infection that includes arrest and reactivation to
study the immunological changes occurring inside somatic tissues where larvae arrest and
migrate after reactivation, i.e. skeletal muscle and mammary gland, respectively. Classically,
a helminth infection generates a Th2 dominant response in the host defined by the production
of interleukin-4 (IL-4), IL-5, IL-9, IL-10 and IL-13 and consequently the development of

122
strong IgE, eosinophil and mast cell responses. Similarly, pregnancy has also been suggested
to model the parameters of a Th2 response (Wegmann, et al., 1993).
In this report we show that infected mice have a breeding efficiency of 20% as
compared to 45% in normal uninfected mice. It was also observed that some female mice had
a post-implantation vaginal plug but did not become pregnant. In those cases scarring in the
uterus was observed (personal observation, S. Trivedi), which suggested that fetal resorption
might have occurred. Immune responses generated against parasitic infections have been
implicated to have deleterious effects on pregnancy ultimately leading into its termination.
Studies in the protozoal parasite, Leishmania major, suggest that although a Th1 response is
protective against the parasitic infection, it can adversely affect pregnancy outcome. Th1
cytokines may be deleterious not only for placental maintenance but also for preimplantation
events (Krishnan, et al., 1996b).
Since little is known about cytokine patterns associated with hookworm infection;
especially at the site of larval arrest (skeletal muscle) and the site to which larvae migrate
after resuming development (mammary gland), we chose to evaluate two characteristic
cytokines which promote Th1 (IFN-γ) and Th2 (IL-4) cell expansion, respectively. We
measured IL-4 levels in serum because it was not feasible to isolate peripheral blood
mononuclear cells (PBMCs) or T cells from a relatively large sampling group of small
animals We utilized serum samples collected for measuring TGF-β and IGF-1 levels (S.
Trivedi Dissertation, Chapter 3) to detect IL-4 levels from the different groups. However, we
were unable to detect IL-4 levels in the majority of the serum samples except for two A.
caninum infected mice. Cytokine production is measured directly by either isolating PBMCs

123
or specific immune cells such as T helper (CD4+) and T cytotoxic (CD8+), and comparing
cytokine production between basal and mitogen-stimulated levels.
Since larvae arrest more commonly in skeletal muscle one would expect an ensuing
inflammatory response against the parasite. Using histochemistry we have previously
demonstrated a zone of eosinophils surrounding the larvae in the skeletal muscle (Arasu and
Kwak, 1999). It is likely that once the larvae have reactivated during pregnancy, a similar
inflammation would be caused by the traversing of the larvae during migration from skeletal
muscle to other parts of the body. Using real-time RT-PCR, we found that IL-4 was
prominently expressed in skeletal muscle (Figure 5.2a) but downregulated in mammary gland
of the infected bred mice immediately after parturition i.e. the early lactation (timepoint II)
(Figure 5.2c). Establishment of a Th2 response by an increase in IL-4 production has been
reported to favor worm expulsion in other gastrointestinal helminths (Finkelmann, et al.,
1997).
We also found that both IL-4 and IFN-γ transcripts were upregulated at two weeks
post-infection with A. caninum L3 (timepoint I) in mammary gland of infected mice (Figure
5.2b and 5.3). This mixed Th1/Th2 response, which could be caused by larvae traversing
throughout the body before arrest, has also been shown to occur in filarial nematodes.
Immune responses to larval stages during acute infections in residents of filarial-endemic
areas, travelers and transmigrants from a non-endemic to an endemic have been found to be
associated with a mixed Th1/Th2 cytokine profile (Klion, et al., 1991; Elson, et al., 1995;
Cooper, et al., 2001; Henry, et al., 2001). Observations from human subjects in endemic
regions in China and Brazil have shown profound cellular hyporesponsiveness induced by
chronic hookworm infection (Loukas et al., 2005). In a re-infection study in Papua New

124
Guinea, cytokine and proliferative responses to Necator were measured. Most subjects
produced detectable Th1 (IFN-γ) and Th2 (IL-4 and IL-5) cytokines in response to crude
adult worm antigen extract before anthelminthic treatment. Pre-treatment IFN-γ responses
were negatively associated with hookworm burden and increased significantly after
anthelminthic treatment (Quinnell et al., 2004). In a separate study, peripheral blood
mononuclear cells (PBMCs) from N. americanus infected school children, who had recently
received chemotherapy, had reduced proliferative capacity against phytohemagglutinin and
adult worm antigen extract compared to controls (Geiger et al., 2004). These individuals also
produced higher levels of IL-10 and lower levels of both Th1 (IL-12 and IFN-γ) and Th2 (IL-
5 and IL-13) cytokines. Such mixed Th1-type and Th2-type immune responsiveness
associated with chronic gastrointestinal parasitic nematode infections may reflect a state of
infection where a permissive Th1-type cytokine profile favors parasite persistence (Pit, et al.,
2001). These reports suggest that the mixed cytokine profile observed in mammary gland of
A. caninum infected mice may represent a typical cytokine profile associated with hookworm
infection. In conclusion, our results indicate that a Th2-like response characterized by
elevation in IL-4 levels predominates at the site of larval arrest in the infection and
pregnancy model. However, a mixed Th1/Th2 profile is observed in mammary gland of the
A. caninum infection mouse model.
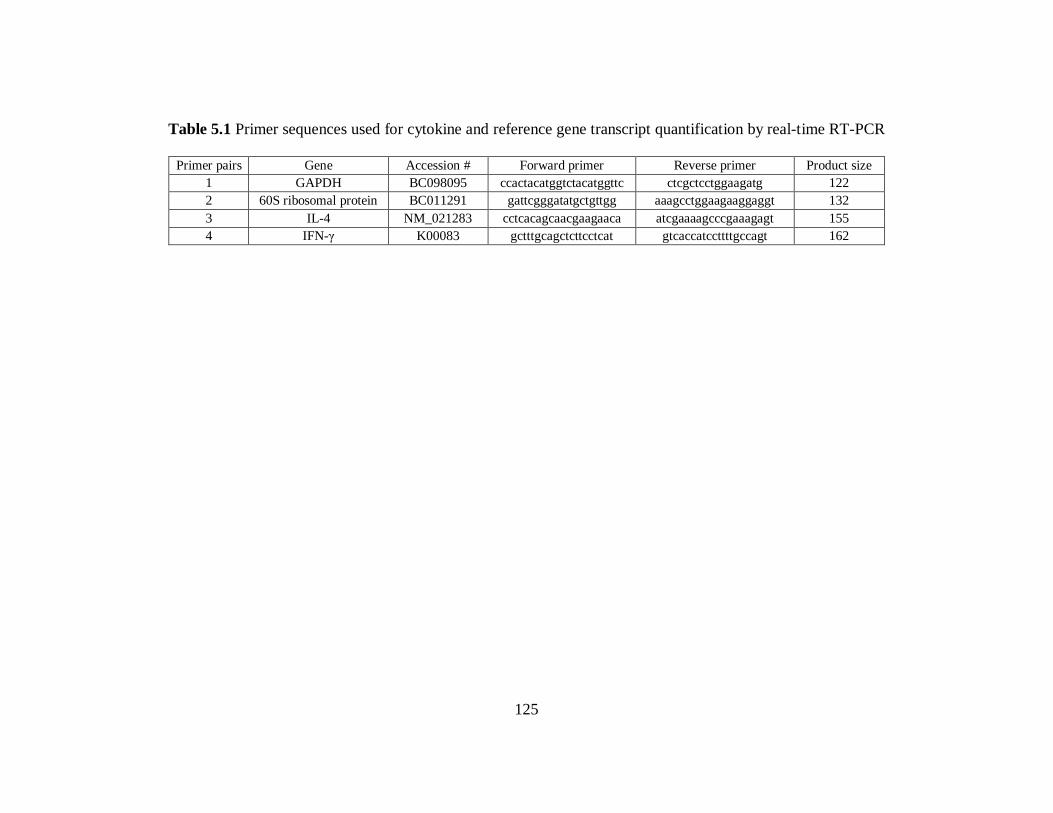
125
Table 5.1 Primer sequences used for cytokine and reference gene transcript quantification by real-time RT-PCR
Primer pairs Gene Accession # Forward primer Reverse primer Product size 1 GAPDH BC098095 ccactacatggtctacatggttc ctcgctcctggaagatg 122 2 60S ribosomal protein BC011291 gattcgggatatgctgttgg aaagcctggaagaaggaggt 132 3 IL-4 NM_021283 cctcacagcaacgaagaaca atcgaaaagcccgaaagagt 155 4 IFN-γ K00083 gctttgcagctcttcctcat gtcaccatccttttgccagt 162

126
Larval counts
050
100150200250300350400450
IN IB IN IB IN IB
I II III
Num
ber
of la
rvae
Figure 5.1 Comparison of total larval burden in unbred versus bred BALB/c mice infected at times corresponding to day 19 gestation, day 1 and day 10 of postpartum lactation. Mice were infected with 1000 A. caninum L3 larvae subcutaneously. n = 5 mice per group. * indicates significant difference at p< 0.005 between unbred and bred groups.
*

127
0102030405060708090
100
I II III
Fold
cha
nge-
IL-4
mR
NA
Figure 5.2a IL-4 transcript levels in skeletal muscle of infected bred mice. Mice were sacrificed at three different timepoints during pregnancy and lactation (I= late gestation, II= early lactation and III= mid-lactation). RNA was extracted from skeletal muscle collected from each timepoint and cDNA was synthesized for real-time PCR analyses. * indicates significant difference at p< 0.05 between uninfected unbred and infected bred groups.
*

128
-10
0
10
20
I II III
Fold
cha
nge-
IL-4
mR
NA
Figure 5.2b IL-4 transcript levels in mammary gland of infected unbred mice. Mice were sacrificed at three different timepoints during pregnancy and lactation (I= late gestation, II= early lactation and III= mid-lactation). RNA was extracted from mammary gland collected from each timepoint and cDNA was synthesized for real-time PCR analyses. * indicates significant difference at p< 0.005 between uninfected unbred and infected unbred groups.
*

129
-20
-15
-10
-5
0
5
10
15
20
I II III
Fold
cha
nge-
IL-4
mR
NA
Figure 5.2c IL-4 transcript levels in mammary gland of infected bred mice. Mice were sacrificed at three different timepoints during pregnancy and lactation (I= late gestation, II= early lactation and III= mid-lactation). RNA was extracted from mammary gland collected from each timepoint and cDNA was synthesized for real-time PCR analyses. * indicates significant difference at p< 0.05 between uninfected unbred and infected bred groups.
*
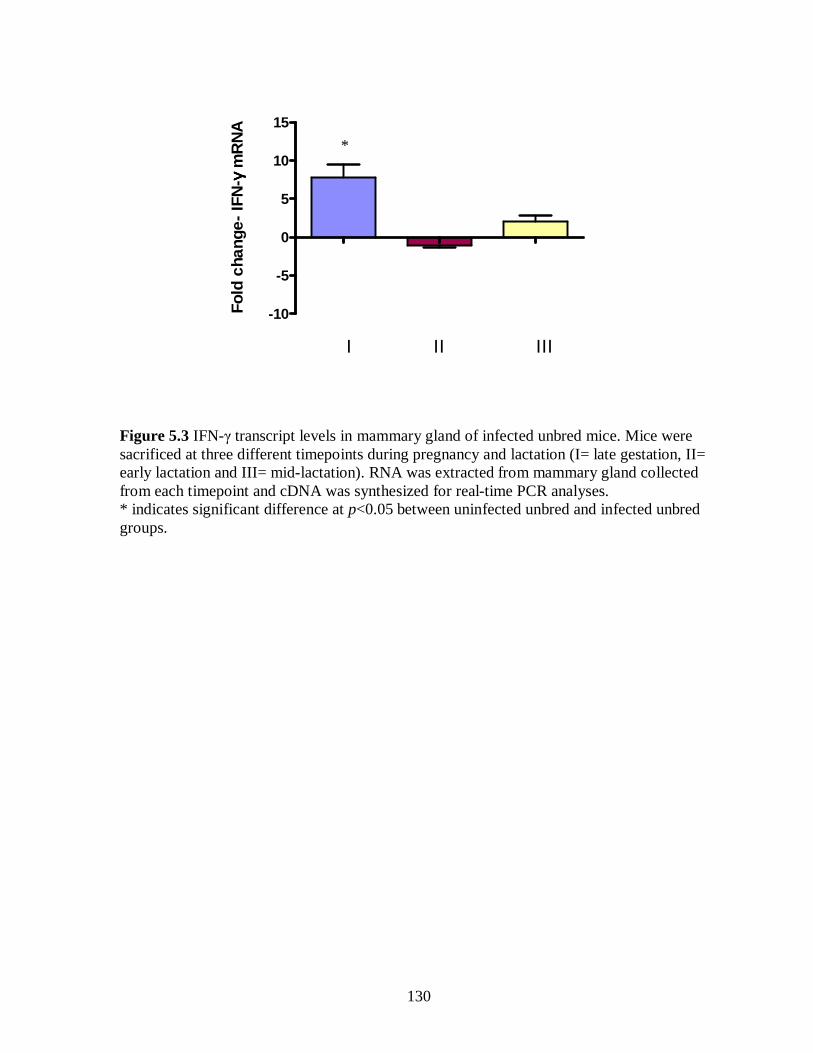
130
-10
-5
0
5
10
15
I II III
Fold
cha
nge-
IFN
-γγ γγ m
RN
A
Figure 5.3 IFN-γ transcript levels in mammary gland of infected unbred mice. Mice were sacrificed at three different timepoints during pregnancy and lactation (I= late gestation, II= early lactation and III= mid-lactation). RNA was extracted from mammary gland collected from each timepoint and cDNA was synthesized for real-time PCR analyses. * indicates significant difference at p<0.05 between uninfected unbred and infected unbred groups.
*

131
6. Evaluation of endogenous reference genes for real-time PCR quantification of
gene expression in Ancylostoma caninum
Shweta Trivedi, Prema Arasu*
Department of Molecular Biomedical Sciences, North Carolina State University, 4700
Hillsborough Street, Raleigh, NC 27606, USA.
Keywords: Ancylostoma hookworms, real-time PCR, validation, reference gene
*Corresponding author:
Prema Arasu
NC State University, 4700 Hillsborough Street, Raleigh, NC 27606, USA.
Tel: 1-919-513-6530; Fax: 1-919-513-6465; Email: [email protected]

132
Real-time PCR is a powerful technique for analyzing gene expression especially in parasitic
systems where samples are typically limited. As compared to conventional PCR, it provides a
dynamic range of absolute and relative quantification, greater precision, technical sensitivity,
and lower risk of sample contamination [1]. In relative quantification, expression levels are
normalized to endogenous reference genes or housekeeping genes which must be carefully
selected since high variability has been noted with commonly used genes such as actin and
glyceraldehyde-3-phosphate dehydrogenase [2-4]. The aim of this report was to identify a
reference gene(s) that showed minimal variability for gene expression analyses across
various life stages, strains and experimental conditions of the intestinal blood feeding
hookworm, Ancylostoma caninum. A. caninum is a major parasite of dogs and can cause
moderate to severe iron deficiency anemia, hypoproteinemia and bloody diarrhea that can be
fatal to puppies and immunosuppressed dogs [5]. A. caninum can also contribute to
cutaneous larva migrans and eosinophilic enteritis in man [6]. Related hookworms in tropical
and subtropical regions of the world also cause malnutrition and anemia in humans; in fact
children infected as infants show retarded cognitive and physical development [7]. For this
study, egg, larval stages 1 and 2 (L1/L2 combined), and infective larval stage 3 (iL3) were
derived from an A. caninum strain from a naturally infected dog in North Carolina (strain
‘N’) that has been passaged in laboratory Beagles since 2000 [ 8]. Adult worms were
recovered from the intestines of infected dogs that had been euthanized by the local animal
shelter and from each batch, intact male and female worms were separately picked and stored
at -70C. For inter-strain comparisons, A. caninum iL3s were obtained from T. Nolan,
University of Pennsylvania, from a strain that has been propagated since the early 1970s by
infecting steroid immuno-suppressed dogs (strain ‘P’). For the studies reported here, both A.

133
caninum strains were maintained in non-steroid treated Beagles. To study the effect of
treatment, L3s from N and P strains were incubated in the absence or presence of normal dog
serum which stimulates the infective pre-parasitic larvae to resume feeding, thereby
simulating the early phases of transition to the parasitic mode of development [9]. Total
RNA was extracted from the parasites using RNA Stat-60 as per manufacturer’s instructions
(TelTest, Friendswood, TX) and residual genomic DNA was removed by DNase I treatment.
Reverse transcription was done using oligo-d(T) priming and RT-PCR was performed with
intron-spanning actin primers to confirm the absence of contaminating genomic DNA (data
not shown). Based on previous reports [10 -12], genes for actin, 18S rRNA, 60S acidic
ribosomal protein, cAMP-dependent protein kinase A (cAMP), β-tubulin and RNA
polymerase II subunit (RNA pol II) were selected as candidate references from the A.
caninum database. While 18S rRNA does not have a polyA tail, it was included in the
analyses because sufficient internal priming by oligo d(T) can apparently occur [13]. The 5’
and 3’ gene-specific primers (presented 5’ to 3’) designed using the Primer3 software [ 14]
were respectively: Actin, GenBank Accession Number BQ667158, GAT CTG GCA CCA
CAC CTT CT and TCT CTG TTG CTC TTG GGG TTC (99 bp product), 18S rRNA,
BI773318, GCC CTC CAA TAG ATC CTC GT and CGC GCA AAT TAC CCA CTC (125
bp), 60S acidic ribosomal protein, BF250585, GTC GGA ATC GTC GGA AAG TA and
GTC TTG TTG CAT TTC GAG CA (167 bp), cAMP, U15983, ATG GGA GAA TCC AGC
AGA and TCC AAA ATC TTC ATG GCA AA (138 bp), β-tubulin, AF077870, CTG TTG
TCC CCT CAC CAA AG and TTT CAA GGT TCG GAA GCA AA (146 bp), and RNA pol
II, AW588389, TCT TGG TAC TCG TGC GCT TC and AGC GGA TCC GTC TCT CCT T
(75 bp). Primer design with the Primer 3 software was based on melting temperatures in the

134
57-63ºC range; actual optimization by test runs in the 50-65ºC range showed optimal
amplification at 55ºC. Conventional RT-PCR confirmed that none of the primer sets
amplified products from dog or E. coli (data not shown). The real-time PCR reactions were
carried out simultaneously on all candidate genes using the iCyclerTM iQ PCR detection
system (Bio-Rad Laboratories, Hercules, CA). Amplified product was detected with the
SYBR Green I DNA binding dye which has been shown to provide similar sensitivity and
reproducibility as sequence-specific fluorescent probes [15, 16]. In each 25µl reaction,
12.5µl of iQTM SYBR green supermix (Bio-Rad) was added to 300nM of each primer with
250ng of cDNA. PCR amplification was performed in duplicate for each sample using the
following cycle conditions: 3 min at 95°C followed by 45 repeats of 1 min at 95°C, 30s at
55°C and 30s at 72°C. A melt curve analysis step, included at the end of each run, verified
the absence of primer-dimers and non-specific products. Efficiency of the reactions, derived
from a standard curve of 10-fold serially diluted iL3 cDNA, was consistently in the 95-98%
range. For variation across stages, cDNAs from egg, L1/L2, iL3, and adult worms were
assessed and for variation among N and P strains, iL3 cDNA was used. The effect of serum
treatment was tested with iL3 and ssL3 cDNA from both strains. Non-template controls were
used to verify the absence of genomic DNA contamination. Each cDNA was analyzed in
duplicate and each experiment was repeated twice. The amplified products were also
examined on a 2% agarose gel for verification of the expected sizes (data not shown). In
real-time PCR, the threshold cycle number (Ct) at which the amplification-associated
fluorescence exceeds a specific threshold level of detection (background noise) is inversely
correlated with the amount of nucleic acid present in the sample [17]; Ct values were
therefore used to compare the variability in transcript levels of the reference genes and are

135
displayed as "box and whisker" plots with medians (as lines), 25th percentile to the 75th
percentile (as boxes) and ranges (as whiskers). Determination of coefficients of variation
(CV) and one-way ANOVA were performed using the Prism 4.0 software (GraphPad
Software Inc., San Diego, CA). For stage-specific analyses across egg, L1/L2, iL3, and
adult male and female worms, actin and cAMP showed the highest variability with CV of
27.4% and 16.4%, respectively, as compared to CV of 12.4%, 6.6% and 6.6% for the 60S, β-
tubulin and RNA pol II genes (Figure 6.1). The highest transcript levels were noted for 60S
(median Ct = 15.3) followed by β-tubulin (median Ct = 17.6) and RNA pol II (median Ct =
19.1). For comparison between the N and P geographical strains (Figure 6.2), actin, β-
tubulin and RNA pol II showed highest variability with CVs > 10% as compared to CVs of
3.5% and 1.5% for 60S and cAMP respectively. As with the analyses across stages, the 60S
transcript level was the most abundant with median Ct = 15.9. Finally, to assess the effect of
serum treatment on transcript levels of the reference genes, evaluations were done with iL3
and ssL3 from the N as well as the P strain of A. caninum. With the N strain, all reference
genes had CVs < 5% except for actin (CV of 17.6%); with the P strain, CVs were <7% for all
genes except for actin and 18S with CVs of 13.2% and 17% respectively. From a combined
analysis of the threshold cycle values from amplifications with iL3 and ssL3 cDNAs from
both N and P strains (Figure 6.3), the 60S (median Ct =15.9) and cAMP (median Ct =21)
genes emerged as the most suitable references with the lowest CVs of 4.3% and 3.4%,
respectively, as compared to CV > 10% for all the other genes. From these results, RNA pol
II and β-tubulin are suitable reference genes for analysis of transcript differences across
developmental stages of A. caninum but are highly unsuitable for comparisons between
different strains or treatment effects. Similarly, cAMP-dependent protein kinase A would be

136
an appropriate reference for less abundantly expressed genes in analyses of strains and
treatments but showed a high CV in stage-specific analyses. Overall, the 60S acidic
ribosomal protein was the best reference gene for analyses across stages, strains and
treatments especially for genes that are expressed at equally high abundance [4, 11].
Interestingly, the 18S rRNA non-polyadenylated transcript which is not expected to be
reproducibly reverse transcribed by oligo-d(T) primers showed lower CVs than the more
commonly used actin (Figure 6.1) or β-tubulin (Figures 6.2, 6.3) cytoskeletal proteins.
While this might suggest using the 18S rRNA as a reference gene for templates generated by
reverse transcription with random primers, randomly primed cDNA has been reported to
overestimate mRNA copy number in real time PCR analyses by up to 19-fold [18]. In a
recent report of gene expression in adult male and female worms of the Brugia malayi filarial
nematode, actin 2B, histone H3 and NADH dehydrogenase subunit I were all shown to be at
approximately equivalent transcript levels resulting in the use of actin-2B as the reference
gene for real-time PCR analyses [21]. In this study with A. caninum adult worms, Ct levels
for actin-1 were 29+/-1 and 16+/-0.3 for adult male and females, respectively, indicating a
wide discrepancy and its unsuitability as a reference gene. In conclusion, this study
confirms that reference genes should always be validated for real time gene expression
analyses and that the 60S acidic ribosomal protein is a suitable choice for studies on A.
caninum and related nematodes.

137
Acknowledgements
This work was supported by a grant from the National Institutes of Health (AI42908). We
thank Tori C. Freitas for helpful comments on the manuscript and Maria Correa for
assistance with the statistical analyses.
References
[1] Bustin, SA. Quantification of mRNA using real-time reverse transcription PCR
(RT-PCR): trends and problems. J Mol Endocrinol 2002; 29(1): 23-39.
[2] Gao B, Allen R, Davis EL, Baum TJ, and Hussey RS. Molecular characterization and
developmental expression of a cellulose-binding protein gene in the soybean cyst
nematode Heterodera glycines.Int J Parasitol. 2004;34 (12):1377-83.
[3] Schmittgen TD, Zakrajeck. B. Effect of experimental treatment on housekeeping gene
expression: validation by real-time, quantitative RT-PCR. J Biochem Biophys Methods
2002;46(1-2): 69-81.
[4] Thellin O, Zorzi W, Lakaye B, De Borman B, Coumans B, Hennen G, Grisar T, Igout
A, Heinen E. Housekeeping genes as internal standards: use and limits. J Biotechnol
1999;75(2-3): 291-5. [5] Georgi JR, Georgi, JR. Helminths. In: Georgi, J.R., Georgi, M.E.
(Eds.), Parasitology for Veterinarians, vol. V. WB Saunders Company,
Philadelphia, 1991;pp. 171–177.
[6] Croese J, Loukas A, Opdebeeck J, Prociv P. Occult enteric infection
by Ancylostoma caninum: a previously unrecognised zoonosis. Gastroenterology
1994;106, 3–12.

138
[7] Lozoff B, Jimenez E, Wolf AW. Long-term developmental outcome of infants with iron
deficiency. New Engl. J. Med. 1991 Sep 5;235, 687-694.
[8]Arasu P, Kwak D. Developmental arrest and pregnancy-induced transmammary
transmission of Ancylostoma caninum larvae in the murine model. Parasitol. 1999
Oct;85(5):779-84.
[9] Hawdon JM, Jones BF, Hoffman DR, Hotez PJ. Cloning and characterization of
Ancylostoma-secreted protein. A novel protein associated with the transition to parasitism
by infective hookworm larvae. J. Biol. Chem. 1996 Mar 22;271, 6672-8.
[10] Stepek G, Houston KM, Goodridge HS, Devaney E, Harnett W. Stage-specific and
species-specific differences in the production of the mRNA and protein for the filarial
nematode secreted product, ES-62. Parasitology. 2004 Jan;128(Pt.1): 91-98.
[11] Dheda K, Huggett JF, Bustin SA, Johnson MA, Rook G, Zumla A. Validation of
housekeeping genes for normalizing RNA expression in real-time PCR. Biotechniques
2004 Jul;37(1):112-4, 116, 118-9.
[12] Aboobaker AA, Blaxter, ML. Use of RNA interference to investigate gene function in
the human filarial nematode parasite Brugia malayi. Mol Biochem Parasitol 2003
Jun;129(1):41-51.
[13] Perrin R, Lange H, Grienenberger JM, Gagliardi D. AtmtPNPase is required for
multiple aspects of the 18S rRNA metabolism in Arabidopsis thaliana mitochondria.
Nucleic Acids Res. 2004 Sep 30;32(17):5174-82.

139
[14] Rosen S and Skaletsky HJ. Primer3 on the WWW for general users and for
biologist programmers. In: Krawetz S, Misener S (eds) Bioinformatics Methods and
Protocols: Methods in Molecular Biology. Humana Press, Totowa, NJ. 2000. pp 365-
386.
[15] Simon A, Labalette P, Ordinaire I, Frealle E, Dei-Cas E, Camus D and Delhaes L. Use
of fluorescence resonance energy transfer hybridization probes to evaluate quantitative
real-time PCR for diagnosis of ocular toxoplasmosis. J Clin Microbiol. 2004
Aug;42(8):3681-5.
[16] Maeda H, Fujimoto C, Haruki Y, Maeda T, Kokeguchi S, Petelin M, Arai H, Tanimoto
I, Nishimura F, Takashiba S. Quantitative real-time PCR using TaqMan and SYBR
Green for Actinobacillus actinomycetemcomitans, Porphyromonas gingivalis, Prevotella
intermedia, tetQ gene and total bacteria. FEMS Immunol Med Microbiol. 2003 Oct
24;39(1):81-6.
[17] Walker NJ. Tech.Sight. A technique whose time has come. Science. 2002
296(5567):557-9.
[18] Zhang G and Byrne CD. Differential priming of RNA templates during cDNA
synthesis markedly affects both accuracy and reproducibility of quantitative
competitive reverse-transcriptase PCR. Biochem J. 1999 Jan 15; 337 ( Pt 2):231-41.
[19] Nolan TJ, Bhopale VM, Megyeri Z, Schad GA. Cryopreservation of human
hookworms. J Parasitol. 1994 Aug;80(4):648-50.
[20] Arasu P. In vitro reactivation of Ancylostoma caninum tissue-arrested third-stage
larvae by transforming growth factor-beta. J Parasitol 2001; 87: 733-8.

140
[21] Li BW, Rush AC, Tan J, Weil GJ. Quantitative analysis of gender-regulated
transcripts in the filarial nematode Brugia malayi by real-time RT-PCR. Mol Biochem
Parasitol. 2004 Oct;137(2):329-37
[22] Hawdon JM, Schad GA. Serum-stimulated feeding in vitro by third-stage infective
larvae of the canine hookworm Ancylostoma caninum.
J Parasitol. 1990 Jun;76(3):394-8.

141
Figure Legends
Figure 6.1 Expression levels of candidate reference genes across different developmental
stages of A. caninum. Box plots for each reference gene represent a compilation of the
threshold cycles (Ct) for cDNAs from egg, L1/L2, iL3, and adult male and female worms (n
= 20 from duplicate analyses of each cDNA in 2 independent experiments). Eggs were
harvested via sucrose flotation as previous described [19]. L1/L2 stage larvae were obtained
by hatching eggs on agar plates for 24-36 hrs, sucrose centrifugation to remove remaining
eggs and repeated washing of the larvae in medicated PBS before freezing at -70C. L3
stage larvae were harvested from fecal/charcoal co-cultures [20] and adult worms were
recovered from the intestines of infected dogs at necropsy.
Figure 6.2 Expression levels of candidate reference genes in two different strains of A.
caninum. The ‘N’ strain was derived from a naturally infected dog in North Carolina and the
‘P’ strain was originally derived from Maryland and has been propagated in laboratory dogs
for more than 25 years. Box plots for each reference gene include threshold cycles (Ct) for
cDNAs from infective iL3 (n = 8).
Figure 6.3 Effect of combination of serum treatment and strain of A. caninum on expression
levels of candidate reference genes. Box plots for each reference gene include threshold
cycles (Ct) for cDNAs from infective L3 (n = 4) and serum-stimulated L3 (n = 4). Infective
iL3 from N and P strains of A. caninum were incubated for 20-24 hrs at 37C, 5% CO2 with or
without 5% normal dog serum; larvae were then incubated with an equal volume of 5 mg/ml

142
flourescein isothiocyanate-labeled bovine serum albumin (Sigma). Serum-stimulated larvae
(80-90% positive) were scored for reactivation by examination for fluorescent intestinal
tracts using UV microscopy [22].

143
Figure 6.1
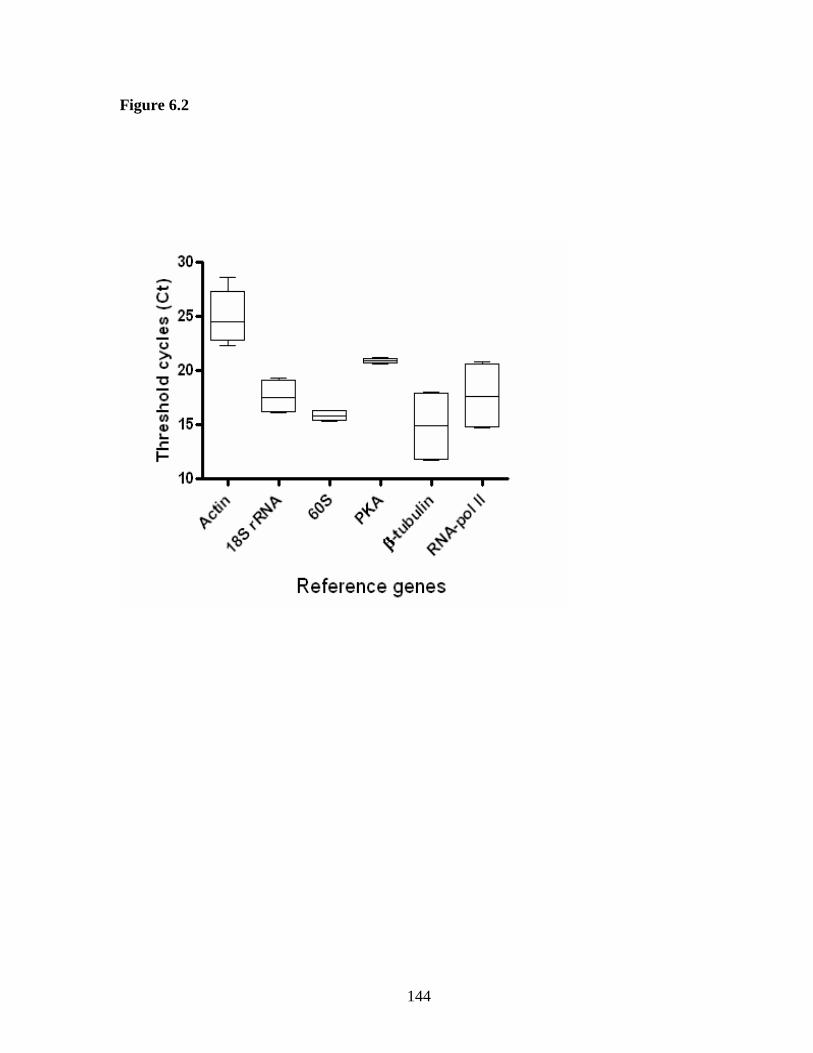
144
Figure 6.2

145
Figure 6.3

146
7. References Anderson, L., and J. Seilhamer. (1997). A comparison of selected mRNA and protein abundances in human liver. Electrophoresis. 18(3-4):533-7. Anderson, R. C. (2000). Nematode Parasites of Vertebrates: Their development and Transmission, edn 2, CABI Publishing, CAB International, Wallingford Oxon, UK. Arasu, P. (1998). Anthelmintic efficacy against tissue-arrested larvae of Ancylostoma caninum in murine hosts. J. Parasitol. 84(6):1263-7. Arasu, P., and A. Heller. (1999). Antibody responses in pregnancy-induced transmammary transmission of Ancylostoma caninum hookworm larvae. Vet. Immunol. Immunopathol. 70(3-4):289-98. Arasu, P. (2001). In vitro reactivation of Ancylostoma caninum tissue-arrested third-stage larvae by transforming growth factor-beta. J. Parasitol. 87(4):733-8. Arasu, P., and D. Kwak. (1999). Developmental arrest and pregnancy-induced transmammary transmission of Ancylostoma caninum larvae in the murine model. J. Parasitol. 85(5):779-84. Ashkar, A. A., and B. K. Croy. (2001). Functions of uterine natural killer cells are mediated by interferon gamma production during murine pregnancy. Semin. Immunol. 13(4):235-41. Ashton, F. T., V. M. Bhopale, D. Holt, G. Smith, and G. A. Schad. (1998). Developmental switching in the parasitic nematode Strongyloides stercoralis is controlled by the ASF and ASI amphidial neurons. J. Parasitol. 84(4):691-5. Ashton, F. T., J. Li, and G. A. Schad. (1999). Chemo- and thermosensory neurons: structure and function in animal parasitic nematodes. Vet. Parasitol. 84(3-4):297-316. Babu, S., and T. B. Nutman. (2003). Proinflammatory cytokines dominate the early immune response to filarial parasites. J. Immunol. 171(12):6723-32. Banerjee, D., O. Prakash, and M. G. Deo. (1970). Studies on the early stage of infection of Ancylostoma caninum in mice. Indian J. Med. Res. 58(10):1321-7. Bargmann, C. I., and H. R. Horowitz. (1991). Control of larval development by chemosensory neurons in Caenorhabditis elegans. Science. 251(4998):1243-6. Baumgartner, R. A., V. A. Derama, and M. A. Beaven. (1996). Constitutive and inducible mechanisms for synthesis and release of cytokines in immune cell lines. J. Immunol. 157(9):4087-93.

147
Beall, M. J., and E. J. Pearce. (2001). Human transforming growth factor-beta activates a receptor serine/threonine kinase from the intravascular parasite Schistosoma mansoni. J. Biol. Chem. 276(34):31613-9. Beall, M. J., and E. J. Pearce. (2002). "Transforming growth factor-beta and insulin-like signalling pathways in parasitic helminths." Int. J. Parasitol. Apr;32(4):399-404. Bhopale, V. M., E. K. Kupprion, F. T. Ashton, R. Boston, and G. A. Schad. (2001). Ancylostoma caninum: the finger cell neurons mediate thermotactic behavior by infective larvae of the dog hookworm. Exp. Parasitol. 97(2):70-6. Behnke, J. (1991). Human parasitic diseases: hookworm infections. In: Immunology (HM. Gilles and P. Ball, eds), pp. 93-155. Amsterdam: Elsevier. Birnby, D.A., E. M. Link, J. J. Vowels, H. Tian, P. L. Colacurcio, and J. H. Thomas. (2000). A transmembrane guanylyl cyclase (DAF-11) and Hsp90 (DAF-21) regulate a common set of chemosensory behaviors in Caenorhabditis elegans. Genetics. 155(1):85-104. Blagburn, G.L., D. S. Lindsay, J. L. Vaughan, N. S. Rippey, J. C. Wright, R. C. Lynn, W.G. Kelch, G.C., Ritchie, and D.I. Hepler. (1996). Prevalence of canine parasites based on fecal flotation examination. Comp. Cont. Edu. Pract. Veter. 18:483-489. Blaxter, M. (1998). Caenorhabditis elegans is a nematode. Science. 282(5396):2041-6. Boag, P. R., J. C. Parsons, P. J. Presidente T. W. Spithill, and J. L. Sexton. (2003). Characterisation of humoral immune responses in dogs vaccinated with irradiated Ancylostoma caninum. Vet. Immunol. Immunopathol. 92(1-2):87-94. Brabin, L., and B. Brabin. (1992). Parasitic infections in women and their consequences. Adv. Parasitol. 31:1-81. Braeckman, B. P., K. Houthoofd, and J. R.Vanfleteren. (2001). Insulin-like signaling, metabolism, stress resistance and aging in Caenorhabditis elegans. Mech. Ageing Dev. 122(7):673-93. Brand, A., and J. Hawdon. (2004). Phosphoinositide-3-OH-kinase inhibitor LY294002 prevents activation of Ancylostoma caninum and Ancylostoma ceylanicum third-stage infective larvae. Int. J. Parasitol. 34(8):909-14. Brenner, G. J., C. Nohan, and J. A. Moynihan. (1994). Similar immune response to nonlethal infection with herpes simplex virus-1 in sensitive (BALB/c) and resistant (C57BL/6) strains of mice. Cell. Immunol. 157(2):510-24. Brooker, S., J. M. Bethony, L. C. Rodrigues, N. Alexander, S. M. Geiger, and P. J. Hotez. (2005). Epidemiologic, immunologic and practical considerations in developing and evaluating a human hookworm vaccine. Expert Rev. Vaccines. 4(1):35-50.

148
Brunet, L. R., F. Finkelman, A. W. Cheever, M. A. Kopf, and E. J. Pearce. (1997). IL-4 protects against TNF-alpha-mediated cachexia and death during acute schistosomiasis. J. Immunol. 159(2):777-85. Bundy, D. A., M. S. Chan, and L. Savioli. (1995). Hookworm infection in pregnancy. Trans. R. Soc. Trop. Med. 89(5):521-2. Bungiro, R., and M. Cappello. (2004). Hookworm infection: new developments and prospects for control. Curr. Opin. Infect. Dis. 17(5):421-6. Burke, T. M., and E. L. Roberson. (1979a). Critical studies of fenbendazole suspension (10%) against naturally occurring helminth infections in dogs. Am. J. Vet. Res. 39(11):1799-1801. Burke, T. M., and E. L. Roberson. (1979b). Use of fenbendazole suspension (10%) against experimental infections of Toxocara canis and Ancylostoma caninum in beagle pups. Am. J. Vet. Res. 40(4):552-54. Burke, T. M., and E. L. Roberson. (1985). Prenatal and lactational transmission of Toxocara canis and Ancylostoma caninum: experimental infection of the bitch before pregnancy. Int. J. Parasitol. 15(1):71-5. Carr, A., and D. I. Pritchard. (1987). Antigen expression during development of the human hookworm, Necator americanus. Parasite Immunol. 9:219-234. Chan, M. S. (1997). The global burden of intestinal nematode infections--fifty years on. Parasitol. Today. 13(11):438-43. Cheng, H. L., S. L.Schneider, C. M. Kane, S. O. Gollnick, C. Grande, D. Thompson, E. Pietrzak, and T. B. Tomasi. (1993). TGF-beta 2 gene and protein expression in maternal and fetal tissues at various stages of murine development. J. Reprod. Immunol. 25(2):133-48. Chomczynski, P., and N. Sacchi. (1987). Single-step method of RNA isolation by acid guanidinium isothiocyanate-phenol-chloroform extraction. Anal. Biochem. 162(1): 156-59 Chotivanich, K., K. Sialmut, R. Udomsangpetch, K. A. Stepniewska, S. Pukrittayakamee, S. Looareesuwan, and N. J. White. (2001). Ex-vivo short-term culture and developmental assessment of Plasmodium vivax. Trans. R. Soc. Trop. Med. Hyg. 95(6):677-80. Ciesielski, S. D., J. R. Seed, J. C. Ortiz, and J. Metts. (1992). Intestinal parasites among North Carolina migrant farm workers. Am. J. Public Health. 82(9):1258-62. Cooper, P. J., T. Mancero, M. Espinel, C. Sandoval, R. Lovato, R. H. Guderian, and T. B. Nutman. (2001). Early human infection with Onchocerca volvulus is associated with an enhanced parasite-specific cellular immune response. J. Infect. Dis. 183(11):1662-8.

149
Coyne, C. P., and D. Brake. (2001). Characterisation of Haemonchus contortus-derived cell populations propagated in vitro in a tissue culture environment and their potential to induce protective immunity in sheep. Int. J. Parasitol. 31(4):359-76. Croese, J., A. Loukas, J. Opdebeeck, and P. Prociv. (1994). Occult enteric infection by Ancylostoma caninum: a previously unrecognized zoonosis. Gastroenterology. 106(1):3-12. Crompton, D.W. (1989). Hookworm disease: Current status and new directions. Parasitol. Today. 5: 1-2 Crompton, D. W. (2000). The public health importance of hookworm disease. Parasitology. 121 Suppl: S: 39-50. Crook, M., F. J. Thompson, W. N. Grant, and M. E. Viney. (2005). daf-7 and the development of Strongyloides ratti and Parastrongyloides trichosuri." Mol. Biochem. Parasitol. 139(2):213-23. Das, S. K., K. C. Flanders, G. K. Andrews, and S. K. Dey. (1992). Expression of transforming growth factor-beta isoforms (beta 2 and beta 3) in the mouse uterus: analysis of the periimplantation period and effects of ovarian steroids. Endocrinology. 130(6):3459-66 Davies, S. J., C. B. Shoemaker, and E. J. Pearce. (1998). A divergent member of the transforming growth factor beta receptor family from Schistosoma mansoni is expressed on the parasite surface membrane. J. Biol. Chem. 273(18):11234-40. De Clercq, D., M. Sacko, J. Behnke, F. Gilbert, P. Dorny, and J. Vercruysse. (1997). Failure of mebendazole in treatment of human hookworm infections in the southern region of Mali. Am. J. Trop. Med. Hyg. 57(1):25-30. de Silva, N. R., S. Brooker, P. J. Hotez, A. Montresor, D. Engels, and L. Savioli. (2003). Soil-transmitted helminth infections: updating the global picture. Trends Parasitol. 19(12):547-51. Deschoolmeester, M. L., and K. J. Else. (2002). Cytokine and chemokine responses underlying acute and chronic Trichuris muris infection. Int. Rev. Immunol. 21(4-5):439-67. Dickson, R., S. Awasthi, P. Williamson, C. Demellweek, and P. Garner. (2000). Effects of treatment for intestinal helminth infection on growth and cognitive performance in children: systematic review of randomised trials. B.M.J. 320(7251):1697-701. Drake, L. J., M. C. H. Jukes, R. J. Sternberg, and D. A. P.Bundy. (2000). Geohelminth Infections (Ascariasis, Trichuriasis and Hookworm): cognitive and developmental impacts. Seminars in Pediatric Infectious diseases. 11, 245-251. Dubey, J. P., and D. Lindsay. (1996). A review of Neospora caninum and neosporosis. Vet. Parasitol. 67(1-2):1-59.

150
Else, K. J., F. D. Finkelman, C. R. Maliszewski, and R. K.Grencis. (1994). Cytokine-mediated regulation of chronic intestinal helminth infection. J. Exp. Med. 179(1):347-51. Elson, L. H., M. Calvopina, W. Paredes, E. Araujo, J. E. Bradley, R. H. Guderian, and T. B. Nutman. (1995). Immunity to onchocerciasis: putative immune persons produce a Th1-like response to Onchocerca volvulus. J. Infect. Dis. 171(3):652-8. Estevez, M., L. Attisano, J. L. Wrana, P. S. Albert, J. Massague, and D. L. Riddle. (1993). The daf-4 gene encodes a bone morphogenetic protein receptor controlling C. elegans dauer larva development. Nature. 365(6447):644-9. Faas, M. M., A. Bouman, A. L. Veenstra van Nieuwenhoven, G. van der Schaaf, H. Moes,M. J. Heineman, and P. de Vos. (2005). Species differences in the effect of pregnancy on lymphocyte cytokine production between human and rat. J. Leukoc. Biol. (July Epub). Faas, M. M., G. A. Schuiling, E. A. Linton, I. L. Sargent, and C. W. Redman. (2000). Activation of peripheral leukocytes in rat pregnancy and experimental preeclampsia. Am. J. Obstet. Gynecol. 182(2):351-7. Finkelman, F. D., T. Shea-Donohue, J. Goldhill, C. A.Sullivan, S. C. Morris, K. B. Madden, W. C. Gause, and J. F. Urban Jr. (1997). Cytokine regulation of host defense against parasitic gastrointestinal nematodes: lessons from studies with rodent models. Annu. Rev. Immunol. 15:505-33. Forrester, S. G., P. W. Warfel, and E. J. Pearce. (2004). Tegumental expression of a novel type II receptor serine/threonine kinase (SmRK2) in Schistosoma mansoni. Mol. Biochem. Parasitol. 136(2):149-56.
Freitas, T. C., and P. Arasu (2005). Cloning and characterization of genes encoding two Transforming Growth Factor-beta-like ligands from the hookworm, Ancylostoma caninum. Int. J. Parasitol. (In Press).
Fried, M., R. O. Muga, A. O. Misore, and P. E. Duffy. (1998). Malaria elicits type 1 cytokines in the human placenta: IFN-gamma and TNF-alpha associated with pregnancy outcomes. J. Immunol. 160(5):2523-30. Gagliardo, L. F., C. McVay, and J. A. Appleton. (2002). Molting, ecdysis, and reproduction of Trichinella spiralis are supported in vitro by intestinal epithelial cells. Infect. Immun. 70(4):1853-9. Gamble, H. R., and L. S. Mansfield. (1996). Characterization of excretory-secretory products from larval stages of Haemonchus contortus cultured in vitro. Vet. Parasitol. 62(3-4):291-305.

151
Ganguly, N. K., R. C. Mahajan, R. Sehgal, P. Shetty, and J. B. Dilawari. (1988). Role of specific immunoglobulin E to excretory-secretory antigen in diagnosis and prognosis of hookworm infection. J. Clin. Microbiol. 26(4):739-42. Garcia, L. S. and L.R. Ash. (1979). Diagnostic parasitology: clinical laboratory manual. C. V. Mosby Co., St. Louis, Missouri, 46p. Garside, P., and J. M. Behnke. (1989). Ancylostoma ceylanicum in the hamster: observations on the host-parasite relationship during primary infection. Parasitology. 98 Pt 2:283-9. Gause, W. C., J. F. Urban Jr, and M. J. Stadecker. (2003). The immune response to parasitic helminths: insights from murine models. Trends Immunol. 24(5):269-77. Geiger, S. M., C. L. Messara, J. Bethony, P. T. Soboslay, and R. Correa-Oliveira. (2004). Cellular responses and cytokine production in post-treatment hookworm patients from an endemic area in Brazil. Clin. Exp. Immunol. 136(2):334-40. Georgi, J. R., and M. E. Georgi. (1991). Helminths. In: Georgi JR, Georgi ME, editors. Parasitology for veterinarians, vol. V. Philadelphia: WB Saunders Company; 1991. p. 171-7. Georgi, L. L., P. S. Albert, and D. L. Riddle. (1990). daf-1, a C. elegans gene controlling dauer larva development, encodes a novel receptor protein kinase. Cell. 61: 635-645. Gilmore, W., L. P. Weiner, and J. Correale. (1997). Effect of estradiol on cytokine secretion by proteolipid protein-specific T cell clones isolated from multiple sclerosis patients and normal control subjects. J. Immunol. 158(1):446-51. Gomez-Escobar, N., A. van den Biggelaar, and R. M. Maizels. (1997). A member of the TGF-beta receptor gene family in the parasitic nematode Brugia pahangi. Gene.199(1-2):101-9. Gomez-Escobar, N., E. Lewis, and R. M. Maizels. (1998). A novel member of the transforming growth factor-beta (TGF-beta) superfamily from the filarial nematodes Brugia malayi and B. pahangi. Exp. Parasitol. 88(3):200-9. Gomez-Escobar, N., W. F. Gregory, and R. M. Maizels. (2000). Identification of tgh-2, a filarial nematode homolog of Caenorhabditis elegans daf-7 and human transforming growth factor beta, expressed in microfilarial and adult stages of Brugia malayi. Infect. Immun. 68(11):6402-10. Goud, G. N., M. Bottazzi, B. Zhan, S. Mendez, V. Deumic, J. Plieskatt, S. Liu, Y. Wang, L. Bueno, R. Fujiwara, A. Samuel, S. Y. Ahn, M. Solanki, O. A. Asojo, J. Wang, J. M. Bethony, A. Loukas, M. Roy, and P. J. Hotez. (2005). Expression of the Necator americanus hookworm larval antigen Na-ASP-2 in Pichia pastoris and purification of the recombinant protein for use in human clinical trials. Vaccine (September Epub).

152
Granzer, M., and W. Haas. (1991). Host-finding and host recognition of infective Ancylostoma caninum larvae. Int. J. Parasitol. 21(4):429-40. Grencis, R. K. (2001). Cytokine regulation of resistance and susceptibility to intestinal nematode infection - from host to parasite. Vet. Parasitol. 100(1-2):45-50. Gunes, H., and A. Maestro. (1997). Prolactin receptor gene expression in rat splenocytes and thymocytes during oestrous cycle, pregnancy and lactation. Cell Prolif. 30(5):219-35. Gunther, C.V., L. L. Georgi, and D. L. Riddle. (2000). A Caenorhabditis elegans type I TGF beta receptor can function in the absence of type II kinase to promote larval development. Development. 127(15):3337-47. Gygi, S. P., Y. Rochon, B. R. Franza, and R. Aebersold. (1999). Correlation between protein and mRNA abundance in yeast. Mol. Cell Biol. 19(3):1720-30. Hawdon, J. M., and G. A. Schad. (1990). Serum-stimulated feeding in vitro by third-stage infective larvae of the canine hookworm Ancylostoma caninum. J. Parasitol. 76(3):394-8. Hawdon, J. M., and G. A. Schad. (1991). "Developmental adaptations in nematodes. In Parasitism-conflict or co-existence. C. Toft (ed.) Oxford University Press, Oxford, U.K., p274-298." Hawdon, J. M., and G. A. Schad. (1992). Ancylostoma caninum: reduced glutathione stimulates feeding by third-stage infective larvae. Exp. Parasitol. 75(1):40-6. Hawdon, J. M., S. W. Volk, D. I. Pritchard, and G. A. Schad. (1992). Resumption of feeding in vitro by hookworm third-stage larvae: a comparative study. J. Parasitol. 78(6): 1036-40. Hawdon, J. M., and G. A. Schad. (1993). Ancylostoma caninum: glutathione stimulates feeding in third-stage larvae by a sulfhydryl-independent mechanism. Exp. Parasitol. 77(4):489-91. Hawdon, J. M., S. W. Volk, R. Rose, D. I. Pritchard, J. M. Behnke, and G. A. Schad. (1993). Observations on the feeding behaviour of parasitic third-stage hookworm larvae. Parasitology. 106 (Pt 2):163-9. Hawdon, J. M., and S. A. Johnston. (1996a). Hookworms in the Americas: An alternative to trans-Pacific contact. Parasitol. Today. 12(2):72-4. Hawdon, J. M., B. F. Jones, D. R. Hoffman, and P. J. Hotez. (1996b). Cloning and characterization of Ancylostoma-secreted protein. A novel protein associated with the transition to parasitism by infective hookworm larvae. J. Biol. Chem. 271(12):6672-8. Hawdon, J. M., and B. Datu. (2003). The second messenger cyclic GMP mediates activation in Ancylostoma caninum infective larvae. Int. J. Parasitol. 33(8):787-93.

153
Heinzel, F. P., M. D. Sadick, B. J. Holaday , R. L. Coffman, and R. M. Locksley. (1989). Reciprocal expression of interferon gamma or interleukin 4 during the resolution or progression of murine leishmaniasis. Evidence for expansion of distinct helper T cell subsets. J. Exp. Med. 169(1):59-72. Henry, N. L., M. Law, T. B. Nutman, and A. D. Klion. (2001). Onchocerciasis in a nonendemic population: clinical and immunologic assessment before treatment and at the time of presumed cure. J. Infect. Dis.183(3):512-6. Hernandez, H. J., Y. Wang, and M. J. Stadecker. (1997). In infection with Schistosoma mansoni, B cells are required for T helper type 2 cell responses but not for granuloma formation. J. Immunol. 158(10):4832-7. Hernandez, H. J., Y. Wang, N. Tzellas, and M. J. Stadecker. (1997). Expression of class II, but not class I, major histocompatibility complex molecules is required for granuloma formation in infection with Schistosoma mansoni. Eur. J.Immunol. 27(5):1170-6. Hernandez, H. J., A. H. Sharpe, and M. J. Stadecker. (1999). Experimental murine schistosomiasis in the absence of B7 costimulatory molecules: reversal of elicited T cell cytokine profile and partial inhibition of egg granuloma formation. J. Immunol. 162(5):2884-9. Honore, S., Y. J. Garin, A. Sulahian, J. P. Gangneux, and F. Derouin. (1998). Influence of the host and parasite strain in a mouse model of visceral Leishmania infantum infection. FEMS Immunol. Med. Microbiol. 21(3):231-9. Hotez, P., J. Hawdon, and G. A. Schad. (1993). Hookworm larval infectivity, arrest and amphiparatenesis: the Caenorhabditis elegans Daf-c paradigm. Parasitol. Today. 9(1): 23-6. Hotez, P. J., S. Brooker, J. M. Bethony, M. E. Bottazzi, A. Loukas, and S. Xiao. (2004). Hookworm infection. N. Engl. J. Med. 351(8):799-807. Hotez, P. J., and D. I. Pritchard. (1995). Hookworm infection. Sci Am. 272(6):68-74. Husmann, I., L. Soulet, J. Gautron, I. Martelly, and D. Barritault. (1996). Growth factors in skeletal muscle regeneration. Cytokine Growth Factor Rev. 7(3):249-58. Inoue, T., and J. H. Thomas. (2000). Targets of TGF-beta signaling in Caenorhabditis elegans dauer formation. Dev. Biol. 217(1):192-204. Jian, X., L. Sen, Q. Hui-Qin, R. Hai-Nan, L. Tie-Hua, X. Hai-Chou, P. J. Hotez ,and X. Shu-Hua. (2003). Necator americanus: maintenance through one hundred generations in golden hamsters (Mesocricetus auratus). I. Host sex-associated differences in hookworm burden and fecundity." Exp. Parasitol. 104(1-2):62-6.

154
Joachim, R., A. C. Zenclussen, B. Polgar, A. J. Douglas, S. Fest, M. Knackstedt, B. F. Klapp, and P. C. Arck. (2003). The progesterone derivative dydrogesterone abrogates murine stress-triggered abortion by inducing a Th2 biased local immune response. Steroids. 68(10-13):931-40. Kano, R., Y. Masukata, Y. Omata, Y. Kobayashi, R. Maeda, and A. Saito. (2005). Relationship between type 1/type 2 immune responses and occurrence of vertical transmission in BALB/c mice infected with Neospora caninum. Vet. Parasitol. 129(1-2):159-64. Kassai, T. (1999). Ancylostomatidosis: Hookworm disease. In Veterinary Helminthology. Kassai T Eds Butterworth Heinmann, Oxford. Khan, I. A., J. D. Schwartzaman, S. Fonseka, and L. H. Kasper. (1997). Neospora caninum: role for immune cytokines in host immunity. Exp. Parasitol. 85(1):24-34. Kidd, P. (2003). Th1/Th2 balance: the hypothesis, its limitations, and implications for health and disease. Altern. Med. Rev. 8(3):223-46. Kim, S., and R. R. Voskuhl. (1999). Decreased IL-12 production underlies the decreased ability of male lymph node cells to induce experimental autoimmune encephalomyelitis. J. Immunol. 162(9):5561-8. Kimura, K. D., H. A. Kissenbaum, Y. Liu, and G. Ruvkun. (1997). daf-2, an insulin receptor-like gene that regulates longevity and diapause in Caenorhabditis elegans. Science. 277(5328):942-6. King, C. L., and T. B. Nutman. (1991). Regulation of the immune response in lymphatic filariasis and onchocerciasis. Immunol. Today. 12(3):A54-8. Klion, A. D., A. Massougbodji, B. C. Sadeler, E. A. Ottesen, and T. B.Nutman. (1991). Loiasis in endemic and nonendemic populations: immunologically mediated differences in clinical presentation. J. Infect.Dis. 163(6):1318-25. Krishnan, L., L. J. Guilbert, A. S. Russell, T. G. Wegmann, T. R. Mosmann, and M. Belosevic. (1996a). Pregnancy impairs resistance of C57BL/6 mice to Leishmania major infection and causes decreased antigen-specific IFN-gamma response and increased production of T helper 2 cytokines. J. Immunol. 156(2):644-52. Krishnan, L., L. J. Guilbert, T. G. Wegmann, M. Belosevic, and T. R. Mosmann. (1996b). T helper 1 response against Leishmania major in pregnant C57BL/6 mice increases implantation failure and fetal resorptions. Correlation with increased IFN-gamma and TNF and reduced IL-10 production by placental cells. J. Immunol. 156(2):653-62. Kumar, S., and D. I. Pritchard. (1994). Apparent feeding behaviour of ensheathed third-stage infective larvae of human hookworms. Int. J. Parasitol. 24(1):133-6.

155
Landmann, J. K., and P. Prociv. (2003). Experimental human infection with the dog hookworm, Ancylostoma caninum. Med. J. Aust. 178(2):69-71. Lee, C.Y., F. W. Bazer, and F. A. Simmen. (1993). Expression of components of the insulin-like growth factor system in pig mammary glands and serum during pregnancy and pseudopregnancy: effects of oestrogen. J, Endocrinol. 137(3):473-83. Lee, K. T., M. D. Little, and P. C. Beaver PC. (1975). Intracellular (muscle-fiber) habitat of Ancylostoma caninum in some mammalian hosts. J. Parasitol. 61(4):585-98. Leiby, D. A., H. M. el Nagger, and G. A. Schad. (1987). Thirty generations of Ancylostoma duodenale in laboratory-reared beagles. J. Parasitol. 73(4):844-8. Li, W., S. G. Kennedy, and G. Ruvkun. (2003). daf-28 encodes a C. elegans insulin superfamily member that is regulated by environmental cues and acts in the DAF-2 signaling pathway. Genes Dev. 17(7):844-58. Locksley, R. M., and J. A. Louis. (1992). Immunology of leishmaniasis. Curr. Opin. Immunol. 4(4):413-8. Louis, J., H. Himmelrich, C. Parra-Lopez, F. Tacchini-Cottier, and P. Launois. (1998). Regulation of protective immunity against Leishmania major in mice. Curr. Opin. Immunol. 10(4):459-64. Loukas, A., S. L. Constant, and J. M. Bethony. (2005). Immunobiology of hookworm infection. FEMS Immunol. Med. Microbiol. 43(2):115-24. Loukas, A., and P. Prociv. (2001). Immune responses in hookworm infections. Clin. Microbiol. Rev. 14(4):689-703. Lunden, A., J. Mark, S. W. Maley, and E. A. Innes. (1998). Cellular immune responses in cattle experimentally infected with Neospora caninum. Parasite Immunol. 20(11):519-26. MacDonald, A. S., and E. J. Pearce. (2002). Cutting edge: polarized Th cell response induction by transferred antigen-pulsed dendritic cells is dependent on IL-4 or IL-12 production by recipient cells. J. Immunol. 168(7):3127-30. Maizels, R. M., D. A. Bundy, M. E. Selkirk, D. F. Smith, and R. M. Andersen. (1993). Immunological modulation and evasion by helminth parasites in human populations. Nature. 365(6449):797-805. Malone, E. A., T. Inoue, and J. H. Thomas. (1996). Genetic analysis of the roles of daf-28 and age-1 in regulating Caenorhabditis elegans dauer formation. Genetics. 143(3):1193-205.

156
ManWarren, T., L. F. Gagliardo, J. Geyer, C. McVay, S. Pearce-Kelling, and J. Appleton. (1997). Invasion of intestinal epithelia in vitro by the parasitic nematode Trichinella spiralis. Infect. Immun. 65(11):4806-12. Marcotty, C., F. Frankenne, S. Meuris, and G. Hennen. (1994). Immunolocalization and expression of insulin-like growth factor I (IGF-I) in the mammary gland during rat gestation and lactation. Mol. Cell Endocrinol. 99(2):237-43. Massague, J., S. W. Blain, and R. S. Low. (2000). TGF-beta signaling in growth control, cancer, and heritable disorders. Cell. 103(2):295-309. Massey, H. C. Jr., M. Nishi, K. Chaudhary, N. Pakpour, and J. B. Lok . (2003). Structure and developmental expression of Strongyloides stercoralis fktf-1, a proposed ortholog of daf-16 in Caenorhabditis elegans. Int. J. Parasitol. 33(13):1537-44. Maxwell, C., R. Hussain, T. B. Nutman, R. W. Poindexter, M. D. Little, G. A. Schad, and E. A. Ottesen. (1987). The clinical and immunologic responses of normal human volunteers to low dose hookworm (Necator americanus) infection. Am. J. Trop. Med. Hyg. 37(1):126-34. McElwee, J., K. Bubb, and J. H. Thomas. (2003). Transcriptional outputs of the Caenorhabditis elegans forkhead protein DAF-16. Aging Cell. 2(2):111-21. Mendez, S., J. Valenzuela, W. Wu, and P. J. Hotez. (2005). Host cytokine production, lymphoproliferation, and antibody responses during the course of Ancylostoma ceylanicum infection in the Golden Syrian hamster. Infect. Immun. 73(6):3402-7. Menendez, C. (1995). "Malaria during pregnancy: a priority area of malaria research and control." Parasitol Today. 11(5):178-83. Miller, A C., J. Walker, R. Jaworski, W. de Launey, and R. Paver. (1991). Hookworm folliculitis. Arch. Dermatol. 127(4):547-9. Moormann, A. M., A. D. Sullivan, R. A. Rochford, S. W. Chensue, P. J. Bock, T. Nyirenda, and S. R. Meshnick. (1999). Malaria and pregnancy: placental cytokine expression and its relationship to intrauterine growth retardation. J. Infect. Dis. 180(6):1987-93. Moro, M. H., J. Bjornson, E. V. Marietta, E. K. Hofmeister, J. J. Germer, E. Bruinsma, C. S. David, and D. H. Persing. (2001). Gestational attenuation of Lyme arthritis is mediated by progesterone and IL-4. J. Immunol. 166(12):7404-9. Morris, J. Z, H. A. Tissenbaum, and G. Ruvkun. (1996). A phosphatidylinositol-3-OH kinase family member regulating longevity and diapause in Caenorhabditis elegans. Nature. 382(6591):536-9.

157
Mosmann, T. R., H. Cherwinski, M. W. Bond, M. A. Giedlin, and R. L. Coffman. (1986). Two types of murine helper T cell clone. I. Definition according to profiles of lymphokine activities and secreted proteins. J. Immunol. 136(7):2348-57. Mosmann, T. R, S. Sad. (1996). The expanding universe of T-cell subsets: Th1, Th2 and more. Immunol. Today. 17(3):138-46. Murakami, M., M. Koga, and Y. Ohshima. (2001). DAF-7/TGF-beta expression required for the normal larval development in C. elegans is controlled by a presumed guanylyl cyclase DAF-11. Mech. Dev. 109(1):27-35. Nabors, G. S., T. Nolan, W. Croop, J. Li, and J. P. Farrell. (1995). The influence of the site of parasite inoculation on the development of Th1 and Th2 type immune responses in (BALB/c x C57BL/6) F1 mice infected with Leishmania major. Parasite Immunol. 17(11):569-79. Nichols, R. L. (1956). The etiology of visceral larva migrans. II. Comparative larval morphology of Ascaris lumbricoides, Necator americanus, Strongyloides stercoralis and Ancylostoma caninum. J. Parasitol. 42: 363-99. Norris, D. E. (1971). The migratory behavior of the infective-stage larvae of Ancylostoma braziliense and Ancylostoma tubaeforme in rodent paratenic hosts. J. Parasitol. 57(5):998-1009. O’Gara, A. (1998). Cytokines induce the development of functionally heterogeneous T helper cell subsets. Immunity. 8(3):275-83. Ogg, S., S. Paradis, S. Gottlieb, G. I. Patterson, L. Lee, H. A. Tissenbaum, and G. Ruvkun. (1997). The Fork head transcription factor DAF-16 transduces insulin-like metabolic and longevity signals in C. elegans. Nature. 389(6654):994-9. Ostensen, M. (1999). Sex hormones and pregnancy in rheumatoid arthritis and systemic lupus erythematosus. Ann. N. Y. Acad. Sci. 876:131-43; discussion 144. Paradis, S., M. Ailion, A. Toker, J. H. Thomas, and G. Ruvkun. (1999). A PDK1 homolog is necessary and sufficient to transduce AGE-1 PI3 kinase signals that regulate diapause in Caenorhabditis elegans. Genes Dev. 13(11):1438-52. Paradis, S., and G. Ruvkun. (1998). Caenorhabditis elegans Akt/PKB transduces insulin receptor-like signals from AGE-1 PI3 kinase to the DAF-16 transcription factor. Genes Dev. 12(16):2488-98. Patterson, G. I., and R. W. Padgett. (2000). "TGF beta-related pathways. Roles in Caenorhabditis elegans development." Trends Genet. 16(1):27-33.

158
Pearce, E. J., P. Caspar, J. M. Grzych, F. A. Lewis, and A. Sher. (1991). Downregulation of Th1 cytokine production accompanies induction of Th2 responses by a parasitic helminth, Schistosoma mansoni. J. Exp. Med. 173(1):159-66. Pearce, E. J., and S. L. Reiner. (1995). Induction of Th2 responses in infectious diseases. Curr. Opin. Immunol. 7(4):497-504. Pearce, E. J., J. P. Vasconselos, L. R. Brunet, and E. A. Sabin. (1996). IL-4 in schistosomiasis. Exp. Parasitol. 84(2):295-9. Pfaffl, M. W., G. W. Horgan and L. Dempfle. (2002). Realtive Expression Software Tool (REST) for group-wise comparison and statistical analysis of relative expression results in real-time PCR. Nucleic Acids Res. 30(9): e36 Pierce, S. B., M. Costa, R. Wisotzkey, S. Devadhar, S. A. Homburger, A. R. Buchman, K. C. Ferguson, J. Heller, D. M. Platt, A. A. Pasquinelli, L. X. Liu, S. K. Doberstein, and Pit, D. S., A. M. Polderman, S. Baeta, H. Schulz-Key, and P. T. Soboslay. (2001). Parasite-specific antibody and cellular immune responses in human infected with Necator americanus and Oesophagostomum bifurcum. Parasitol. Res. 87(9):722-9. Pit, D. S., A. M. Polderman, H. Schulz-Key, and P. T. Soboslay. (2000). Prenatal immune priming with helminth infections: parasite-specific cellular reactivity and Th1 and Th2 cytokine responses in neonates. Allergy. 55(8):732-9. Pritchard, D. I., and E. A. Walsh. (1995). The specificity of the human IgE response to Necator americanus. Parasite Immunol. 17(11):605-7. Pritchard, D. I., R. J. Quinnell, and E. A. Walsh. (1995). Immunity in humans to Necator americanus: IgE, parasite weight and fecundity Parasite Immunol. 17(2):71-5. Prociv, P., and J. Croese. (1990). Human eosinophilic enteritis caused by dog hookworm Ancylostoma caninum. Lancet. 335(8701):1299-302. Quinn, H. E., C. M. Miller, P. A. Windsor, and J. T.Ellis. (2002a). Characterization of an outbred pregnant mouse model of Neospora caninum infection. J. Parasitol. 88(4):691-6. Quinn, H. E., J. T. Ellis, and N. C. Smith. (2002b). Neospora caninum: a cause of immune-mediated failure of pregnancy? Trends Parasitol. 18(9):391-4. Quinn, H. E., C. M. Miller, and J. T.Ellis. (2004).The cell-mediated immune response to Neospora caninum during pregnancy in the mouse is associated with a bias towards production of interleukin-4. Int. J. Parasitol. 34(6):723-32. Quinnell, R. J., D. I. Pritchard, A. Raiko, A. P. Brown, and M. A. Shaw. (2004). Immune responses in human necatoriasis: association between interleukin-5 responses and resistance to reinfection. J. Infect. Dis. 190(3):430-8.
159
Quinnell, R. J., A. F. Slater, P. Tighe, E. A. Walsh, A. E. Keymer, and D. I. Pritchard. (1993). Reinfection with hookworm after chemotherapy in Papua New Guinea. Parasitology. 106 ( Pt 4):379-85. Rajan, T. V. (1998). A hypothesis for the tissue specificity of nematode parasites. Exp. Parasitol. 89(1):140-2. Rajan, T. V., N. Paciorkowski, I. Kalajzic, and C. McGuiness. (2003). Ascorbic acid is a requirement for the morphogenesis of the human filarial parasite Brugia malayi. J Parasitol. 89(4):868-70. Ren P, C. S. Lim, R. Johnsen, P. S. Albert, D. Pilgrim, and D. L. Riddle. (1996). Control of C. elegans larval development by neuronal expression of a TGF-beta homolog. Science. 274 (5291):1389-91. Riddle, D., and P. Albert. (1998). Regulation of dauer larva development. In “C. elegans II.” Ridle D, Blumental T, Meyer BJ, and Priess JR. Eds. Cold Spring Harbor Laboratory Press. Rose R. A., and J. Behnke (1990). "Necator americanus in the DSN hamster: density-dependent expulsion of adult worms during primary infection." Parasitology. 100 Pt 3:469-78. Rozen, S., and H. Skaletsky (2000). Primer3 on the WWW for general users and for biologist programmers. Methods Mol. Biol. 132:365-86. Ruvkun, G. (2001). Regulation of DAF-2 receptor signaling by human insulin and ins-1, a member of the unusually large and diverse C. elegans insulin gene family. Genes Dev. 15(6):672-86. Sadick, M. D., R. M. Locksley, C. Tubbs, and H. V. Raff. (1986). Murine cutaneous leishmaniasis: resistance correlates with the capacity to generate interferon-gamma in response to Leishmania antigens in vitro. J. Immunol. 136(2):655-61. SantaLucia, J. Jr. (1998). A unified view of polymer, dumbbell, and oligonucleotide DNA nearest-neighbor thermodynamics. Proc. Natl. Acad. Sc. USA. 95(4):1460-5. Schad, G. A. (1979). Ancylostoma duodenale: Maintenance through six generations in helminth-naïve pups. Exp. Parasitol. 47, 246-53. Schad, G. A., and M. R. Page. (1982). Ancylostoma caninum: adult worm removal, corticosteroid treatment, and resumed development of arrested larvae in dogs. Exp. Parasitol. 54(3):303-9.

160
Schad, G. A. (1990). Hypobiosis and related phenomena in hookworm infection. In “Hookworm Disease: Current Status and New Direction” Schad GA and Warren KS, Eds. Taylor and Francis, London. Schad, G. A. (1991). Presidential address. Hooked on hookworm: 25 years of attachment. J. Parasitol. 77(2):176-86. Schneider, S. L., S. O. Gollnick, C. Grande, J. E. Pazik, and T. B. Tomasi. (1996). Differential regulation of TGF-beta 2 by hormones in rat uterus and mammary gland. J. Reprod. Immunol. 32(2):125-44. Sciacca, J., W. M. Forbes, F. T. Ashton, E. Lombardini, H. R. Gamble, and G. A. Schad. (2002). Response to carbon dioxide by the infective larvae of three species of parasitic nematodes. Parasitol. Int. 51(1):53-62. Scott, P., and J. P. Farrell. (1998). Experimental cutaneous leishmaniasis: induction and regulation of T cells following infection of mice with Leishmania major. Chem. Immunol. 70:60-80. Shoop, W. L. (1990). Vertical transmission of helminths: Hypobiosis and amphiparatenesis. Parasitol. Today. Feb;7(2):51-4. Smith, H. L., N. Paciorkowski, S. Babu, and T. V. Rajan. (2000). Development of a serum-free system for the in vitro cultivation of Brugia malayi infective-stage larvae. Exp. Parasitol. 95(4):253-64. Stassens, P., P. W. Bergum, Y. Gansemans, L. Jespers, Y. Laroche, S. Huang, S. Maki, J. Messens, M. Lauwereys, M. Cappello, P. J. Hotez, I. Lasters, and G. P. Vlasuk. (1996). Anticoagulant repertoire of the hookworm Ancylostoma caninum. Proc. Natl. Acad. Sci. USA. (93(5):2149-54. Steffe, G. A., and M. Stoye. (1984). [Behavior of galactogen-transmitted larvae of parasitic nematodes in the mouse]. Zentralbl Veterinarmed B. 31(4):248-60. Stone, W., and F. Smith. (1973). Infection of mammalian hosts by milk-borne nematode larvae: a review. Exp. Parasitol. 34(2):306-12. Stone, W. M., and M. R.Girardeau. (1968). Transmammary passage of Ancylostoma caninum larvae in dogs. J. Parasit. 54: 426-429. Stoye, M. (1973). [Studies on the possibility of prenatal and galactogenic infections with Ancylostoma caninum Ercolani 1859 (Ancylostomidae) in the dog]. Zentralbl Veterinarmed B. 20(1):1-39. Stoye, M., and J. Krause. (1976). [Reactivation of inhibited larvae of Ancylostoma caninum. Effect of estradiol and progesterone]. Zentralbl Veterinarmed B. 23(10):822-39.

161
Swerczek, T. W., S. W. Nielsen, and C. F. Helmboldt. (1971). Transmammary passage of Toxocara cati in the cat. Am. J. Vet. Res. 32, 89-92. Tanaka, T., T. Hamada, N. Inoue, H. Nagasawa, K. Fujisaki, N. Suzuki, and T. Mikami. (2000). The role of CD4(+) or CD8(+) T cells in the protective immune response of BALB/c mice to Neospora caninum infection. Vet. Parasitol. 90(3):183-91. Thompson, N. L., K. C. Flanders, J. M. Smith, L. R. Ellingsworth, A. R. Roberts and M. B. Sporn. (1989). Expression of transforming growth factor-β1 in specific cells and tissues of adult and neonatal mice. J. Cell. Biol. 108:661-669. Tissenbaum, H.A., J. Handon, M. Perregaux, P. Hotez, L. Guarente, and G. Ruvkun. (2000). A common muscarinic pathway for diapause recovery in the distantly related nematode species Caenorhabditis elegans and Ancylostoma caninum. Proc. Natl. Acad. Sci. USA. 97(1): 460-5. Traub, R. J., I. D. Robertson, P. Irwin, N. Mencke, and R. C. Thompson. (2004). Application of a species-specific PCR-RFLP to identify Ancylostoma eggs directly from canine faeces. Vet. Parasitol. 123(3-4):245-55. Veenstra van Nieuwenhoven, A. L., A. Bowman, H. Moes, M. J. Heineman, L. F. de Leij, J. Santema, and M. M. Faas. (2002). Cytokine production in natural killer cells and lymphocytes in pregnant women compared with women in the follicular phase of the ovarian cycle. Fertil. Steril. 77(5):1032-7. Wang, C. I. (1988). Parasitic diarrheas in China. Parasitol. Today. 4: 284-87. Watkins, W. E., and E. Pollitt. (1997). Stupidity or Worms: do intestinal worms impair mental performance? Psychological Bulletin 121: 171-191. Wegmann, T. G., H. Lin, L. Guilbert, and T. R. Mosmann. (1993). Bidirectional cytokine interactions in the maternal-fetal relationship: is successful pregnancy a TH2 phenomenon? Immunol. Today. 14(7):53-6. White CJ, C. Maxwell, and J. I. Gallin. (1986). Changes in the structural and functional properties of human eosinophils during experimental hookworm infection. J Infect Dis. 154(5):778-83. Williamson, A. L., P. J. Brindley, D. P. Knox, P. J. Hotez, and A. Loukas. (2003). Digestive proteases of blood-feeding nematodes. Trends Parasitol. 19(9):417-23. Wong, D. T., A. Elovic, K. Matossian, N. Nagura, J. McBride, M. Y. Chou, J. R.Gordon, T. H. Rand, S. J. Galli, and P. F. Weller. (1991). Eosinophils from patients with blood eosinophilia express transforming growth factor beta 1. Blood. 78(10):2702-7.
162
8. APPENDIX
For comparing variation in transcript levels of cytokine genes, Pair-Wise Fixed
Reallocation Randomization Test© in the REST-384 was used (Pfaffl, et al., 2002).The
mathematical model used to compute the relative expression ratio of a target gene relies on
its real-time PCR efficiencies (E) and the threshold cycle difference (∆Ct) of an unknown
sample versus a control
(∆Ct control - sample). The target gene expression is normalized to a reference gene (ref) in the
equation mentioned below:
Ratio = (E target) ∆Ct target (control - sample) / (E ref)
∆Ct ref (control - sample)
In our experimental setup control was the uninfected/unbred (UN) mice and samples were
the infected/unbred, uninfected bred (UB) and infected/bred (IB). For evaluating fold
upregulation or downregulation of transcripts between timepoints, early-lactation (timepoint
II) and mid-lactation (timepoint III) were compared to late-gestation (timepoint I) expression
of which was relative to control (UN). For fold upregulation or downregulation of TGF-β
isoforms and IGF-1 in IN, UB and IB groups, comparisons were also made relative to UN
controls during early-lactation (timepoint II) and mid-lactation (timepoint III) were compared
to late-gestation (timepoint I).

163
Figure legends Figure 8.1a IL-4 transcript levels in skeletal muscle of infected unbred mice. Mice were sacrificed at three different timepoints during pregnancy and lactation (I= late gestation, II= early lactation and III= mid-lactation). RNA was extracted from skeletal muscle collected from each timepoint and cDNA was synthesized for real-time PCR analyses. Comparisons were made relative to UN. Figure 8.1b IL-4 transcript levels in skeletal muscle of uninfected bred mice. Mice were sacrificed at three different timepoints during pregnancy and lactation (I= late gestation, II= early lactation and III= mid-lactation). RNA was extracted from skeletal muscle collected from each timepoint and cDNA was synthesized for real-time PCR analyses. Comparisons were made relative to UN. Figure 8.1c IL-4 transcript levels in skeletal muscle of infected bred mice. Mice were sacrificed at three different timepoints during pregnancy and lactation (I= late gestation, II= early lactation and III= mid-lactation). RNA was extracted from skeletal muscle collected from each timepoint and cDNA was synthesized for real-time PCR analyses. Comparisons were made relative to UN. Figure 8.1d IL-4 transcript levels in mammary gland of infected unbred mice. Mice were sacrificed at three different timepoints during pregnancy and lactation (I= late gestation, II= early lactation and III= mid-lactation). RNA was extracted from mammary gland collected from each timepoint and cDNA was synthesized for real-time PCR analyses. Comparisons were made relative to UN. Figure 8.1e IL-4 transcript levels in mammary gland of uninfected bred mice. Mice were sacrificed at three different timepoints during pregnancy and lactation (I= late gestation, II= early lactation and III= mid-lactation). RNA was extracted from mammary gland collected from each timepoint and cDNA was synthesized for real-time PCR analyses. Comparisons were made relative to UN. Figure 8.1f IL-4 transcript levels in mammary gland of infected bred mice. Mice were sacrificed at three different timepoints during pregnancy and lactation (I= late gestation, II= early lactation and III= mid-lactation). RNA was extracted from mammary gland collected from each timepoint and cDNA was synthesized for real-time PCR analyses. Comparisons were made relative to UN. Figure 8.1g IL-4 transcript levels in spleen of infected unbred mice. Mice were sacrificed at three different timepoints during pregnancy and lactation (I= late gestation, II= early lactation and III= mid-lactation). RNA was extracted from spleen collected from each timepoint and cDNA was synthesized for real-time PCR analyses. Comparisons were made relative to UN. Figure 8.1h IL-4 transcript levels in spleen of uninfected bred mice. Mice were sacrificed at three different timepoints during pregnancy and lactation (I= late gestation, II= early

164
lactation and III= mid-lactation). RNA was extracted from spleen collected from each timepoint and cDNA was synthesized for real-time PCR analyses. Comparisons were made relative to UN. Figure 8.1i IL-4 transcript levels in spleen of infected bred mice. Mice were sacrificed at three different timepoints during pregnancy and lactation (I= late gestation, II= early lactation and III= mid-lactation). RNA was extracted from spleen collected from each timepoint and cDNA was synthesized for real-time PCR analyses. Comparisons were made relative to UN. Figure 8.2a IFN-γ transcript levels in skeletal muscle of infected unbred mice. Mice were sacrificed at three different timepoints during pregnancy and lactation (I= late gestation, II= early lactation and III= mid-lactation). RNA was extracted from skeletal muscle collected from each timepoint and cDNA was synthesized for real-time PCR analyses. Comparisons were made relative to UN. Figure 8.2b IFN-γ transcript levels in skeletal muscle of uninfected bred mice. Mice were sacrificed at three different timepoints during pregnancy and lactation (I= late gestation, II= early lactation and III= mid-lactation). RNA was extracted from skeletal muscle collected from each timepoint and cDNA was synthesized for real-time PCR analyses. Comparisons were made relative to UN. Figure 8.2c IFN-γ transcript levels in skeletal muscle of infected bred mice. Mice were sacrificed at three different timepoints during pregnancy and lactation (I= late gestation, II= early lactation and III= mid-lactation). RNA was extracted from skeletal muscle collected from each timepoint and cDNA was synthesized for real-time PCR analyses. Comparisons were made relative to UN. Figure 8.2d IFN-γ transcript levels in mammary gland of infected unbred mice. Mice were sacrificed at three different timepoints during pregnancy and lactation (I= late gestation, II= early lactation and III= mid-lactation). RNA was extracted from mammary gland collected from each timepoint and cDNA was synthesized for real-time PCR analyses. Comparisons were made relative to UN. Figure 8.2e IFN-γ transcript levels in mammary gland of uninfected bred mice. Mice were sacrificed at three different timepoints during pregnancy and lactation (I= late gestation, II= early lactation and III= mid-lactation). RNA was extracted from mammary gland collected from each timepoint and cDNA was synthesized for real-time PCR analyses. Comparisons were made relative to UN. Figure 8.2f IFN-γ transcript levels in mammary gland of infected bred mice. Mice were sacrificed at three different timepoints during pregnancy and lactation (I= late gestation, II= early lactation and III= mid-lactation). RNA was extracted from mammary gland collected from each timepoint and cDNA was synthesized for real-time PCR analyses. Comparisons were made relative to UN.
165
Figure 8.2g IFN-γ transcript levels in spleen of infected unbred mice. Mice were sacrificed at three different timepoints during pregnancy and lactation (I= late gestation, II= early lactation and III= mid-lactation). RNA was extracted from spleen collected from each timepoint and cDNA was synthesized for real-time PCR analyses. Comparisons were made relative to UN. Figure 8.2h IFN-γ transcript levels in spleen of uninfected bred mice. Mice were sacrificed at three different timepoints during pregnancy and lactation (I= late gestation, II= early lactation and III= mid-lactation). RNA was extracted from spleen collected from each timepoint and cDNA was synthesized for real-time PCR analyses. Comparisons were made relative to UN. Figure 8.2i IFN-γ transcript levels in spleen of infected bred mice. Mice were sacrificed at three different timepoints during pregnancy and lactation (I= late gestation, II= early lactation and III= mid-lactation). RNA was extracted from spleen collected from each timepoint and cDNA was synthesized for real-time PCR analyses. Comparisons were made relative to UN. Figure 8.3a IL-4 transcript levels in skeletal muscle of infected unbred mice. Comparisons were made relative to timepoint I. Figure 8.3b IL-4 transcript levels in skeletal muscle of uninfected bred mice. Comparisons were made relative to timepoint I. Figure 8.3c IL-4 transcript levels in mammary gland of uninfected bred mice. Comparisons were made relative to timepoint I. Figure 8.3d IL-4 transcript levels in spleen of infected unbred mice. Comparisons were made relative to timepoint I. Figure 8.3e IL-4 transcript levels in spleen muscle of uninfected bred mice. Comparisons were made relative to timepoint I. Figure 8.3f IL-4 transcript levels in spleen muscle of infected bred mice. Comparisons were made relative to timepoint I. Figure 8.4a IFN-γ transcript levels in skeletal muscle of infected unbred mice. Comparisons were made relative to timepoint I. Figure 8.4b IFN-γ transcript levels in skeletal muscle of uninfected bred mice. Comparisons were made relative to timepoint I. Figure 8.4c IFN-γ transcript levels in skeletal muscle of infected bred mice. Comparisons were made relative to timepoint I.

166
Figure 8.4d IFN-γ transcript levels in mammary gland of uninfected unbred mice. Comparisons were made relative to timepoint I. Figure 8.4e IFN-γ transcript levels in mammary gland of uninfected bred mice. Comparisons were made relative to timepoint I. Figure 8.4f IFN-γ transcript levels in mammary gland of infected bred mice. Comparisons were made relative to timepoint I. Figure 8.4g IFN-γ transcript levels in spleen of infected unbred mice. Comparisons were made relative to timepoint I. Figure 8.4h IFN-γ transcript levels in spleen of uninfected bred mice. Comparisons were made relative to timepoint I. Figure 8.4i IFN-γ transcript levels in spleen of infected bred mice. Comparisons were made relative to timepoint I.

167
0
10
20
I II III
Fold
cha
nge-
IL-4
mR
NA
Figure 8.1a
-5
0
5
10
15
20
25
30
I II III
Fold
cha
nge-
IL-4
mR
NA
Figure 8.1b
0102030405060708090
100
I II III
Fold
cha
nge-
IL-4
mR
NA
Figure 8.1c

168
-10
0
10
20
I II III
Fold
cha
nge-
IL-4
mR
NA
Figure 8.1d
-5
0
5
10
15
20
25
30
35
I II III
Fold
cha
nge-
IL-4
mR
NA
Figure 8.1e
-20
-15
-10
-5
0
5
10
15
20
I II III
Fold
cha
nge-
IL-4
mR
NA
Figure 8.1f

169
-10
0
10
20
I II III
Fold
cha
nge-
IL-4
mR
NA
Figure 8.1g
-5
0
5
10
15
20
25
30
35
I II III
Fold
cha
nge-
IL-4
mR
NA
Figure 8.1h
-5
-4
-3
-2
-1
0
1
2
3
I II III
Fold
cha
nge
- TG
F-ββ ββ
1 m
RN
A
Figure 8.1i
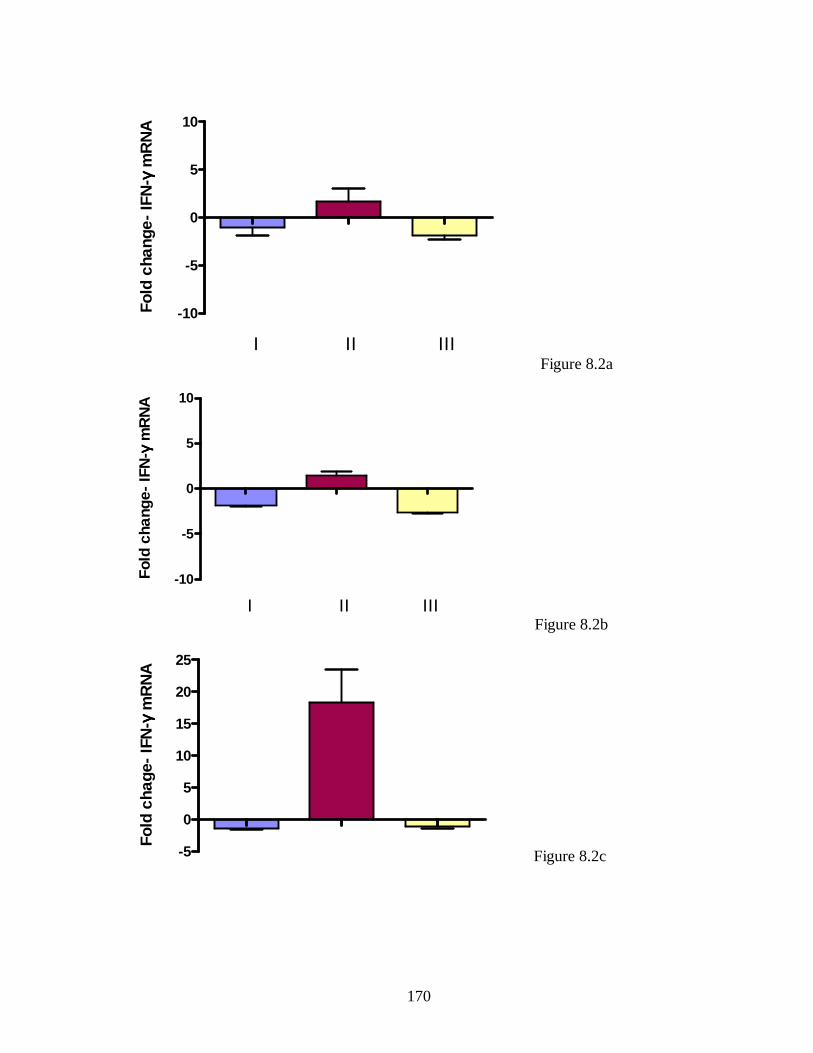
170
-10
-5
0
5
10
I II III
Fold
cha
nge-
IFN
-γγ γγ m
RN
A
Figure 8.2a
-10
-5
0
5
10
I II III
Fold
cha
nge-
IFN
- γγ γγ m
RN
A
Figure 8.2b
-5
0
5
10
15
20
25
Fold
cha
ge-
IFN
-γγ γγ m
RN
A
Figure 8.2c

171
-10
-5
0
5
10
15
I II III
Fold
cha
nge-
IFN
-γγ γγ m
RN
A
Figure 8.2d
-10-505
101520253035
I II III
Fold
cha
nge-
IFN
- γγ γγ m
RN
A
Figure 8.2e
-10
0
10
20
30
I II III
Fold
cha
nge-
IFN
mR
NA
Figure 8.2f

172
-60
-50
-40
-30
-20
-10
0
10
I I I I I I
Fold
cha
nge-
IFN
-γγ γγ m
RN
A
Figure 8.2g
-5
0
5
10
15
20
25
30
I II III
Fold
cha
nge-
IFN
-γγ γγ m
RN
A
Figure 8.2h
-10
0
10
20
30
I II III
Fold
cha
nge
IFN
-γγ γγ m
RN
A
Figure 8.2i

173
-5-4-3-2-101234
I II III
Fold
cha
nge-
IL-4
mR
NA
Figure 8.3a
-4
-3
-2
-1
0
I II III
Fold
cha
nge-
IL-4
mR
NA
Figure 8.3b
0
1
2
3
4
5
6
7
I II III
Fold
cha
nge-
IL-4
mR
NA
Figure 8.3c
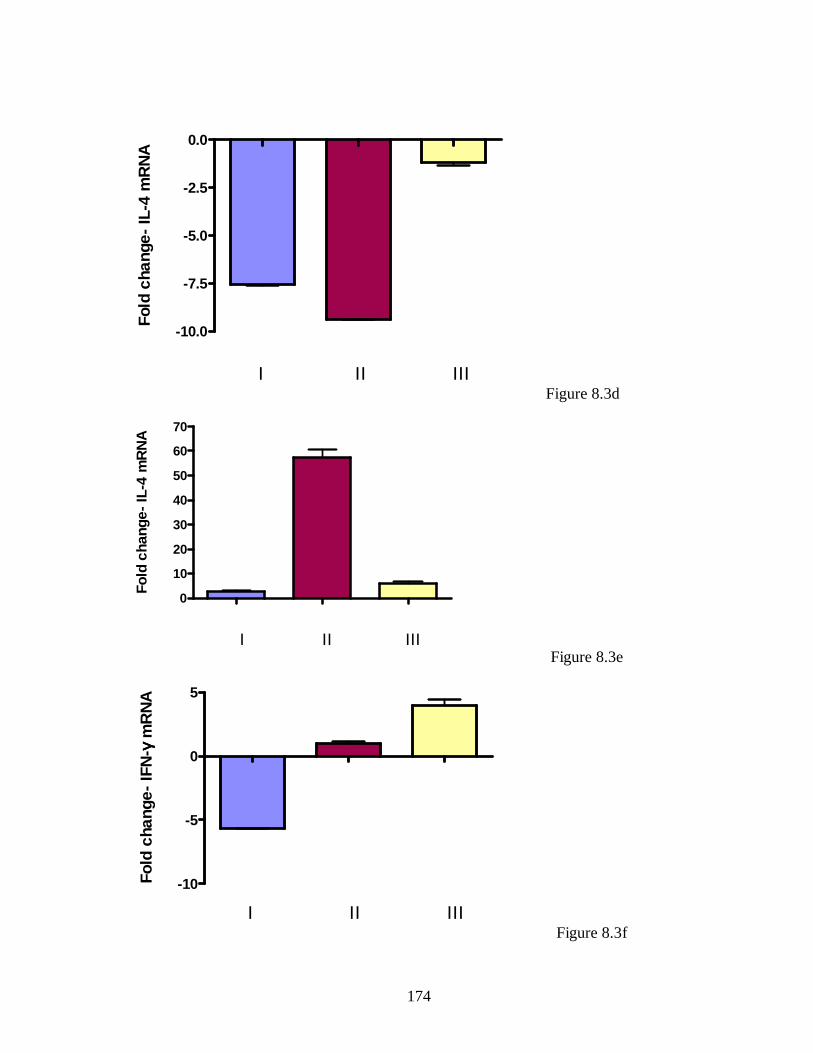
174
-10.0
-7.5
-5.0
-2.5
0.0
I II III
Fold
cha
nge-
IL-4
mR
NA
Figure 8.3d
0
10
20
30
40
50
60
70
I II III
Fold
cha
nge-
IL-4
mR
NA
Figure 8.3e
-10
-5
0
5
I II III
Fold
cha
nge-
IFN
-γγ γγ m
RN
A
Figure 8.3f
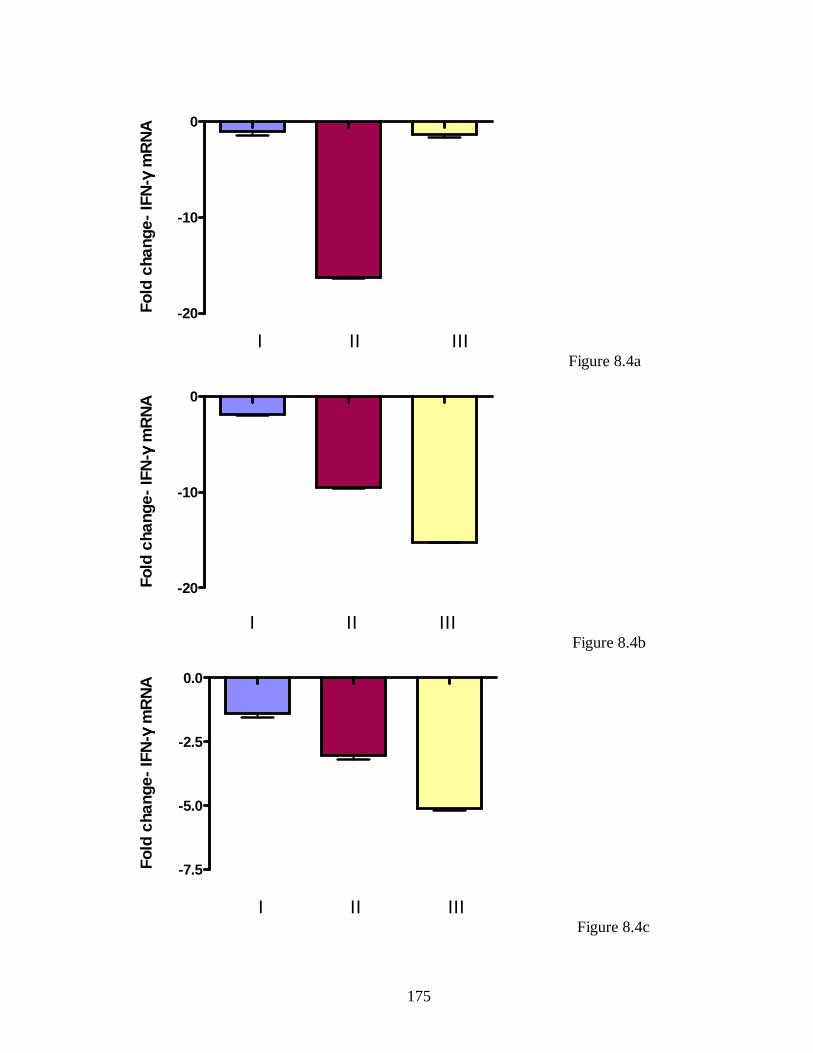
175
-20
-10
0
I II III
Fold
cha
nge-
IFN
-γγ γγ m
RN
A
Figure 8.4a
-20
-10
0
I II III
Fold
cha
nge-
IFN
-γγ γγ m
RN
A
Figure 8.4b
-7.5
-5.0
-2.5
0.0
I II III
Fold
cha
nge-
IFN
-γγ γγ m
RN
A
Figure 8.4c
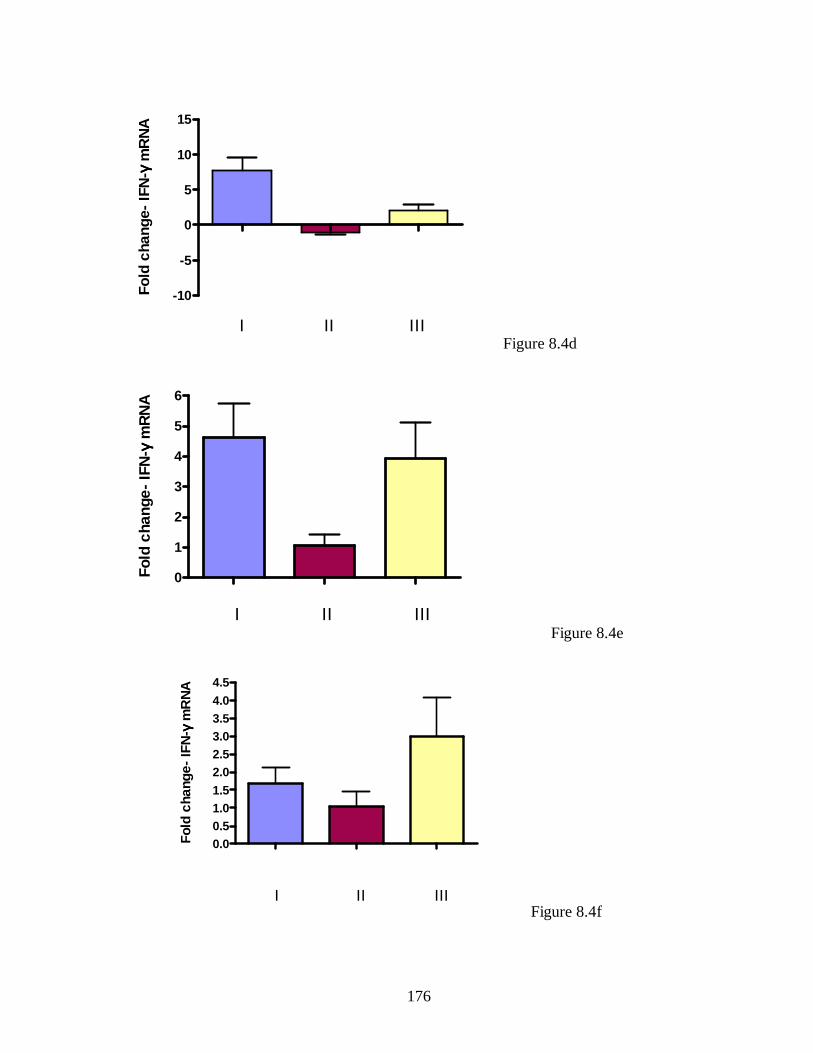
176
-10
-5
0
5
10
15
I II III
Fold
cha
nge-
IFN
-γγ γγ m
RN
A
Figure 8.4d
0
1
2
3
4
5
6
I II III
Fold
cha
nge-
IFN
- γγ γγ m
RN
A
Figure 8.4e
0.00.51.01.52.02.53.03.54.04.5
I II III
Fold
cha
nge-
IFN
- γγ γγ m
RN
A
Figure 8.4f

177
-20
-10
0
10
I II III
Fold
cha
nge-
IFN
-γγ γγ m
RN
A
Figure 8.4g
0.0
2.5
5.0
7.5
I II III
Fold
cha
nge-
IFN
-γγ γγ m
RN
A
Figure 8.4h
-10
-5
0
5
I II III
Fold
cha
nge-
IFN
-γγ γγ m
RN
A
Figure 8.4i
Related Documents