ABSTRACT TIRADO-ACEVEDO, OSCAR. Production of Bioethanol from Synthesis Gas Using Clostridium ljungdahlii as a Microbial Catalyst. (Under the direction of Dr. Amy M. Grunden). As world energy consumption increases, the main sources of energy, which are fossil fuels, are declining. Biofuels are a promising source of sustainable energy. Nevertheless, feedstocks for biofuels need to be inexpensive and separate from the human food network. Lignocellulosic biomass has been identified as one such feedstock. An innovative way to convert lignocellulosic biomass to biofuels is through a process called gasification- fermentation. There are known microorganisms that can convert synthesis gas components to biofuels. One such organism is Clostridium ljungdahlii which can utilize CO and H 2 and produce ethanol. The purpose of the research described herein was to identify and describe fermentation conditions that support higher ethanol production from synthesis gas by C. ljungdahlii. Earlier reports had shown that certain acetogens could divert electrons and carbon flux away from acetate and towards a number of reductant sinks including ethanol. In the present study, we describe a laboratory-isolated C. ljungdahlii strain (strain OTA1). This strain produces approximately 2-fold more ethanol than the wild-type (WT) strain. Furthermore, we demonstrate that addition of oxygen to the cultures improves ethanol to acetate ratios, as well as total ethanol yields in both C. ljungdahlii WT and OTA1 cultures grown in media with and without reducing agents. In addition, we demonstrate that pre- adapting C. ljungdahlii cultures in a medium containing fructose also improves ethanol formation by this bacterium.

Welcome message from author
This document is posted to help you gain knowledge. Please leave a comment to let me know what you think about it! Share it to your friends and learn new things together.
Transcript

ABSTRACT
TIRADO-ACEVEDO, OSCAR. Production of Bioethanol from Synthesis Gas Using
Clostridium ljungdahlii as a Microbial Catalyst. (Under the direction of Dr. Amy M.
Grunden).
As world energy consumption increases, the main sources of energy, which are fossil fuels,
are declining. Biofuels are a promising source of sustainable energy. Nevertheless,
feedstocks for biofuels need to be inexpensive and separate from the human food network.
Lignocellulosic biomass has been identified as one such feedstock. An innovative way to
convert lignocellulosic biomass to biofuels is through a process called gasification-
fermentation. There are known microorganisms that can convert synthesis gas components to
biofuels. One such organism is Clostridium ljungdahlii which can utilize CO and H2 and
produce ethanol. The purpose of the research described herein was to identify and describe
fermentation conditions that support higher ethanol production from synthesis gas by C.
ljungdahlii. Earlier reports had shown that certain acetogens could divert electrons and
carbon flux away from acetate and towards a number of reductant sinks including ethanol. In
the present study, we describe a laboratory-isolated C. ljungdahlii strain (strain OTA1). This
strain produces approximately 2-fold more ethanol than the wild-type (WT) strain.
Furthermore, we demonstrate that addition of oxygen to the cultures improves ethanol to
acetate ratios, as well as total ethanol yields in both C. ljungdahlii WT and OTA1 cultures
grown in media with and without reducing agents. In addition, we demonstrate that pre-
adapting C. ljungdahlii cultures in a medium containing fructose also improves ethanol
formation by this bacterium.

Production of Bioethanol from Synthesis Gas Using Clostridium ljungdahlii
as a Microbial Catalyst
by
Oscar Tirado-Acevedo
A dissertation submitted to the Graduate Faculty of
North Carolina State University
in partial fulfillment of the
requirements for the degree of
Doctor of Philosophy
Microbiology
Raleigh, North Carolina
2010
APPROVED BY:
_______________________________ ______________________________
Dr. Amy M. Grunden Dr. Mari S. Chinn
Committee Chair
________________________________ ________________________________
Dr. Jonathan W. Olson Dr. Eric S. Miller

ii
DEDICATION
To God.
To my wife Johanna, for being there for me, loving me unconditionally and standing next to
me through these years as a PhD student even if she did not understand what my research
was about.
To my parents, for giving me a foundation to build my future on. For giving me everything
when they did not have much.
To my kids, all I do, I will do it for you guys.
iii
BIOGRAPHY
Oscar Tirado-Acevedo was born in Rincón, Puerto Rico to Oscar Tirado-Hernández and
Blanca I. Acevedo-Lorenzo. He is the oldest of three children and had a happy childhood
with a very supportive and united family. Growing up in a coastal town he was interested in
marine sciences since the time he was very little. He completed his Bachelors’ and Masters’
degrees from the University of Puerto Rico. Somewhere along the way, he got married to
Johanna M. Crespo-Torres. Because of a lack of employment opportunities in Puerto Rico
and a desire to experience new opportunities abroad, he and his wife moved to the United
States. After a year working at a microbial pathogenesis laboratory in Nashville TN, they
moved to Raleigh NC, to attend NCSU in the Graduate Program in the Microbiology
Department. He received his PhD degree in Microbiology, has a beautiful daughter, is
expecting a son and is moving on to keep searching for even better things in the future.
iv
ACKNOWLEDGEMENTS
I would like to thank my thesis committee members, Dr. Mari S. Chinn, Dr. Jonathan Olson,
Dr. Eric Miller and especially my thesis advisor Dr. Amy M. Grunden for being a source of
ideas, support and knowledge.
I would also like to thank my laboratory colleagues, Dr. Casey M. Theriot, Dr. Alice
M. Lee, Dr. Jimmy L. Gosse, Dr. Anthony A. Devine, and Rushyannah Killens for ideas,
support and laughs, as well as Drs. Julie Du and Mikyoung Ji. Dr. Flickinger for ideas,
technical discussions and letting me use the GC. I also appreciate the training Dr. Gosse
provided me for the GC operation. I do not know if I would have made it without that
instrument.
I offer my thanks to the NCSU Microbiology Department faculty who would open
their office doors for me any time I had a question, especially Dr. Hassan and Dr. Bruno-
Barcena. Also, I would like to thank Cindy Whitehead for keeping me up to date on forms to
fill-out, datelines, registration, etc. Thank you, Cindy.

v
TABLE OF CONTENTS
LIST OF TABLES ..................................................................................................................vii
LIST OF FIGURES................................................................................................................viii
PRODUCTION OF BIOFUELS FROM SYNTHESIS GAS USING MICROBIAL
CATALYSTS............................................................................................................................1
Abstract....................................................................................................................2
Introduction..............................................................................................................3
Syngas Chemical Catalytic Conversion.................................................................16
Syngas Biotransformation......................................................................................19
Metabolic Engineering of Syngas Biotransformation Processes...........................33
Acetogens and Oxidative Stress Response............................................................35
Conclusions............................................................................................................37
References Cited....................................................................................................46
METABOLIC RESPONSE OF CLOSTRIDIUM LJU GDAHLII STRAINS TO OXYGEN
EXPOSURE.............................................................................................................................64
Abstract..................................................................................................................65
Introduction............................................................................................................66
Materials and Methods...........................................................................................68
Results....................................................................................................................74
Discussion..............................................................................................................82
References Cited..................................................................................................101
INFLUENCE OF CARBON SOURCE PRE-ADAPTATION ON CLOSTRIDIUM
LJU GDAHLII GROWTH AND PRODUCT FORMATION.............................................107
Abstract................................................................................................................108
Introduction..........................................................................................................109

vi
Methods................................................................................................................110
Results and Discussion........................................................................................112
Conclusion...........................................................................................................115
References Cited..................................................................................................121
STUDY CONCLUSIONS...............................................................................................123
APPENDIX......................................................................................................................126

vii
LIST OF TABLES
Table 1-1 Composition of synthesis gas derived from various lignocellulosic biomass
sources.................................................................................................................43
Table 1-2 Summary of microbial catalysts capable of producing biofuels from synthesis
gas........................................................................................................................44
Table 1-3 Thermochemical reactions that occur during gasification of biomass.................45
Table 2-1 Effect of O2 on product profiles in C. ljungdahlii strains at maximum
production............................................................................................................96
Table 2-2 Oxidative stress enzyme activities in C. ljungdahlii WT and OTA1..................97
Table 2-3 Pentose Phosphate Pathway enzyme activities in C. ljungdahlii WT and
OTA1...................................................................................................................98
Table 2-4 Ethanol forming enzyme activities in C. ljungdahlii WT and OTA1..................99
Table 2-5 Intracellular pyridine nucleotide pools of C. ljungdahlii WT and OTA1..........100

viii
LIST OF FIGURES
Figure 1-1. Biofuel production from biomass: (A) hydrolysis-fermentation (B1)
gasification-chemical synthesis and (B2) gasification biosynthesis................39
Figure 1-2. Fuel products obtained from synthesis gas transformation..............................40
Figure 1-3. Diagrams of gasification reactors: A) updraft gasifier; B) downdraft gasifier;
C) fluid-bed gasifier.........................................................................................41
Figure 1-4. Actetyl-CoA or Wood-Ljungdahl pathway used in autotrophic growth by
anaerobes..........................................................................................................42
Figure 2-1. C. ljungdahlii cell growth. A) WT reduced, B) OTA1 reduced, C) WT
unreduced, D) OTA1 unreduced.....................................................................87
Figure 2-2. C. ljungdahlii ethanol production. A) WT reduced, B) OTA1 reduced, C) WT
unreduced, D) OTA1 unreduced.....................................................................88
Figure 2-3. C. ljungdahlii acetate production. A) WT reduced, B) OTA1 reduced, C) WT
unreduced, D) OTA1 unreduced.....................................................................89
Figure 2-4. C. ljungdahlii WT syngas utilization when grown in reduced medium; A) 0%
O2, B) 8% O2, C) 12% O2................................................................................90
Figure 2-5. C. ljungdahlii OTA1 syngas utilization when grown in reduced medium; A)
0% O2, B) 8% O2, C) 12% O2.........................................................................91
Figure 2-6. C. ljungdahlii WT syngas utilization when grown in unreduced medium; A)
0% O2, B) 6% O2, C) 10% O2 ........................................................................92
Figure 2-7. C. ljungdahlii OTA1 syngas utilization when grown in unreduced medium;
A) 0% O2, B) 6% O2, C) 8% O2 .....................................................................93
Figure 2-8. C. ljungdahlii fructose utilization. A) WT reduced, B) OTA1 reduced, C) WT
unreduced, D) OTA1 unreduced.....................................................................94
Figure 2-9. Model for the C. ljungdahlii oxidative stress detoxification system. SOD
(superoxide dismutase), Cat (catalase), Rr (rubrerythrin), Trx (thioredoxin)..95

ix
Figure 3-1. Synthesis gas fermentation reactor..................................................................117
Figure 3-2. C. ljungdahlii culture density in the syngas reactor (A) and syngas-fructose
reactor (B) inoculated with cells pre-grown on fructose (circles), syngas-
fructose (squares), or syngas (triangles)........................................................118
Figure 3-3. C. ljungdahlii production of ethanol (A and B) and acetate (C and D) in the
syngas reactor (A and C) and in the syngas-fructose reactor (B and D)
inoculated with cells pre-grown on fructose (circles), syngas-fructose
(squares), or syngas (triangles).......................................................................119
Figure 3-4. C. ljungdahlii fructose utilization (A) in the syngas-fructose reactor inoculated
with cells pre-grown on fructose (circles), syngas-fructose (squares), or
syngas (triangles) and syngas utilization (B) in the syngas reactor inoculated
with cells pre-grown on syngas.....................................................................120
Figure A-1. C. ljungdahlii-WT metabolism in reduced medium. A) Growth, B) fructose
utilization, C) ethanol production, D) acetate production..............................127
Figure A-2. C. ljungdahlii-WT growing in reduced medium headspace, analysis at
different O2 concentrations. A) 0 % O2 B) 4 % O2 C) 6 % O2 D) 8 % O2
E) 12 % O2 ....................................................................................................128
Figure A-3. C. ljungdahlii-WT metabolism in unreduced medium. A) Growth, B) fructose
utilization, C) ethanol production, D) acetate production.............................131
Figure A-4. C. ljungdahlii-WT growing in unreduced medium headspace analysis at
different O2 concentrations. A) 0 % O2 B) 4 % O2 C) 6 % O2 D) 8 % O2
E) 10 % O2.....................................................................................................132
Figure A-5. C. ljungdahlii-OTA1 metabolism in reduced medium. A) Growth, B) fructose
utilization, C) ethanol production, D) acetate production.............................135
Figure A-6. C. ljungdahlii-OTA1 growing in reduced medium headspace analysis at
different O2 concentrations. A) 0 % O2 B) 4 % O2 C) 6 % O2 D) 8 % O2
E) 12 % O2.....................................................................................................136
Figure A-7 C. ljungdahlii-OTA1 metabolism in unreduced medium. A) Growth, B)

1
CHAPTER 1
Literature Review
Production of Biofuels from Synthesis Gas Using Microbial Catalysts*
Oscar Tirado-Acevedo1, Mari S. Chinn2, Amy M. Grunden1
1Department of Microbiology, North Carolina State University, 4548 Thomas Hall, Campus Box 7615, Raleigh, NC 27695-7615; 2Department of Biological and Agricultural Engineering North Carolina State University D S, Weaver Labs 277, Box 7625 Raleigh, NC 27695-7626
*Published in: Advances in Applied Microbiology, 2010 (70) 57-92.
2
ABSTRACT
World energy consumption is expected to increase 44% in the next twenty years.
Today, the main sources of energy are oil, coal and natural gas, all fossil fuels. These fuels
are unsustainable and contribute to environmental pollution. Biofuels are a promising source
of sustainable energy. Feedstocks for biofuels used today such as grain starch are expensive
and compete with food markets. Lignocellulosic biomass is abundant and readily available
from a variety of sources, for example energy crops and agricultural/industrial waste.
Conversion of these materials to biofuels by microorganisms through direct hydrolysis and
fermentation can be challenging. Alternatively, biomass can be converted to synthesis gas
through gasification and transformed to fuels using chemical catalysts. Chemical conversion
of synthesis gas components can be expensive and highly susceptible to catalyst poisoning,
limiting biofuel yields. However, there are microorganisms that can convert the CO, H2 and
CO2 in synthesis gas to fuels such as ethanol, butanol and hydrogen. Biomass gasification-
biosynthesis processing systems have shown promise as some companies have already been
exploiting capable organisms for commercial purposes. The discovery of novel organisms
capable of higher product yield, as well as metabolic engineering of existing microbial
catalysts, make this technology a viable option for reducing our dependency on fossil fuels.

3
1.1 Introduction
There are three main sources of non-renewable fuels: oil, natural gas, and coal. The
oil market is the largest commodity market in the world (Driesprong et al., 2008). However,
in recent years there have been concerns about uncertainty in gasoline prices, oil production
peaking, environmental damage caused by oil spills and emissions from oil combustion as
well as political instability in many major oil producing nations (Basher and Sadorsky, 2006;
Bentley et al., 2007; Sheehan and Himmel, 1999; Wirl, 2008). Coal is an abundant source of
fuel. Nevertheless, coal burning has been linked to environmental pollution and human
health problems including arsenic poisoning (Liu et al., 2002; Ng et al., 2003; Popovic et al.,
2001). Natural gas is the third most used fossil fuel after oil and coal. In addition it is more
efficient and less carbon intensive than any other fossil fuel
(http://www.eia.doe.gov/oiaf/ieo/world.html, 2009; Lochner and Bothe, 2009). Still, natural
gas reserves in the US and Europe are declining rapidly, the gas is difficult to transport, and
the liquefied natural gas market is only 9% of the total natural gas market (Dresselhaus and
Thomas, 2001; Lochner and Bothe, 2009; Yepes Rodríguez, 2008) For these reasons,
countries around the world are exploring different ways to minimize their dependency on
fossil fuels (Barnwal and Sharma, 2005; Vicente et al., 2005; Zhao and Melaina, 2006).
Biomass has been identified among the renewable energy sources to have the highest
potential to minimize some of these problems (Maniatis and Millich, 1998). Biofuels, fuels
(liquid or gas) that can be produced from biomass (organic material produced by plants,
animals or microbes), can help meet energy demands. Biofuels have the advantage that they
4
can be produced from renewable agronomic raw materials using existing farm machinery and
grain distribution systems independent of global location (Herrera, 2006). Biofuels have the
potential to be sustainable, abundant and environmentally friendly energy sources.
With an annual production of approximately 17.3 billion US gallons, ethanol is
currently the biofuel produced in the greatest quantity world-wide, with the majority of
production in Brazil and the United States (Demirbas and Balat, 2006;
http://www.ethanolrfa.org/resource/facts/trade/, 2009). The first automobiles designed by
Henry Ford were fueled by ethanol (Al-Hasan, 2003). Ethanol is produced commercially in
the US and Brazil from corn and sugar cane, respectively (Herrera, 2006). Some other
countries produce it from wheat, and palm oil (Herrera, 2006). This biofuel has been used
(10% blend) as a replacement for methyl-tert-butyl ether (MTBE) as a fuel oxygenate in
gasoline for the last thirty years (Mackay et al., 2006; Sheehan and Himmel, 1999). In
Brazil, all cars run on a 20-26% ethanol blend up to 100% ethanol in flex-fuel vehicles
(Goldemberg et al., 2008). In today’s US market, ethanol can be used in flexible fuel
vehicles as a blend of 85% ethanol and 15% gasoline (E85). Nevertheless, with less than
2000 E85 refueling stations in the whole nation (most states with less than 100 stations total),
presently there is insufficient infrastructure to make this feasible
(http://www.afdc.energy.gov/afdc/fuels/stations_counts.html, 2009; Sheehan and Himmel,
1999).
Butanol is considered a promising biofuel. Biobutanol is part of the widely known
acetone-butanol-ethanol (ABE) fermentation and can be produced from corn, whey permeate
and molasses (Ezeji et al., 2007; Qureshi and Ezeji, 2008). Its production from fermentation

5
was first described by Pasteur in 1869, and it has been produced commercially since the
beginning of the 20th century as part of the ABE fermentation. This process played a crucial
part in both World War I and II (Jones and Woods, 1986). Production of butanol by
fermentation ended in the 1950’s due to lower production cost from petrochemical sources.
Today, annual production of butanol is estimated to be around 350 million gallons
(Shapovalov and Ashkinazi, 2008). Butanol is used mainly as an industrial intermediate to
make chemicals; primarily butyl acrylate, but also butyl acetate, ethylene glycol, and butyl
xanthate among others. Butanol has the possibility of being used in car engines up to 100%
without need for any modifications (Ramey, 2007). The two major drawbacks of butanol
fermentation are the production of side-products (acetone and ethanol) and product inhibition
at low concentrations (Maddox, 1980). Ongoing research is focused on identifying solutions
to these obstacles (Ezeji et al., 2007; Qureshi and Ezeji, 2008).
Hydrogen is viewed as an ideal fuel for future transportation because it can be
converted to energy without production of CO2; the only byproduct of its combustion is
water (Antoni et al., 2007; Schlapbach and Zuttel, 2001). It can be used in fuel cells as well
as in combustion engines (Schlapbach and Zuttel, 2001). To date, hydrogen is produced by
chemical processes such as methane steam reforming (MSR), where steam reacts with
methane over a nickel catalyst to yield H2 and CO, and electrolysis of water. These
techniques are energy intensive and could be detrimental to the environment (Nath and Das,
2004). Other disadvantages are that it is difficult to transport and store, and would require
the development of a new distribution infrastructure (Antoni et al., 2007). Nevertheless, great
improvements have been achieved in these areas (Chalk and Miller, 2006). A more

6
environmentally friendly way of obtaining hydrogen is by microbial production (biohydrogen
generation). However, biohydrogen production is currently still at a laboratory scale, but
recent work has shown that it can be produced from a number of biomass feedstocks
including sugars, and new microbes with improved hydrogen production capabilities are
being isolated and characterized in laboratories around the world (Akhtar and Jones, 2008;
Davila-Vazquez et al., 2008; Maeda et al., 2008b).
The United States government’s Biomass Program adopted a plan to make biofuels
production cost competitive by 2012 and to reduce gasoline consumption in the US by 30%
by 2030 (http://www1.eere.energy.gov/biomass/biofuels_initiative.html, 2007). The Energy
Independence and Security Act of 2007 requests a production of 36 billion gallons of
renewable fuels by 2022 (Sastri and Lee, 2008), three times higher than current production
(Gura, 2009). To help meet this goal, the US government and federal agencies are planning
to spend more than $2 billion to support research and development of advanced biofuel
technologies (Akhtar and Jones, 2008; http://www1.eere.energy.gov/biomass/pdfs/nbap.pdf,
2008). To date, most first generation biofuels are produced from starch. Nevertheless,
research and industry efforts are moving toward production of biofuels from lignocellulosic
biomass.
Starch is the most abundant storage carbohydrate in plants. Starch contained in grains
or plants is a mixture of amylose (10-30%), and amylopectin (70-90%) (Peters, 2006), both
containing alpha-1,4-linked glucose polymers. These polymers differ in that amylose is a
linear glucose chain and amylopectin contains alpha-1,6-side chains. Grain starch
conversion to biofuels via fermentation is well established and is also the most mature

7
technology today (http://www.nrel.gov/biomass/pdfs/39436.pdf, 2006). In the case of corn,
ethanol is produced by either one of two processes, dry grind or wet mill. Most of the
ethanol is produced by dry grind (Bothast and Schlicher, 2005). In this process, grain is
mixed with water, a thermostable alpha-amylase, ammonia, and lime, and the mixture is
heated in a reactor at temperatures at approximately 88°C. This is where the liquefaction
(starch gelatinization and hydrolysis) step occurs. The mixture is then transferred to the
saccharification tank where sulfuric acid is added to lower the pH of the slurry.
Subsequently, glucoamylase is added and the temperature held at 61°C. This process
releases glucose, which in turn can be converted to biofuels such as ethanol and butanol
through fermentation. The entire process is described in detail in (Kwiatkowski et al., 2006).
The feedstock for this process is the most significant cost input (Bothast and Schlicher,
2005); therefore, biofuel production cost is proportionally affected by the feedstock market
price (Kwiatkowski et al., 2006). For example, corn price average ranges from $1.94 to
$3.24 per bushel (McAloon et al., 2002), but have more than doubled in 2008 (Pimentel et
al., 2009). In turn, corn ethanol has doubled as well (O'brien and Wolverton, 2009).
Feedstocks most used in commercial production of biofuels (mostly ethanol) are
sugar cane, corn, and wheat. This process still relies on economic subsidies as high as $8.7
billion per year (Datar et al., 2004; Kowplow, 2006), and there is evidence that ethanol
production from grains gives a negative net energy balance (Patzek et al., 2005; Pimentel et
al., 2007; Pimentel and Patzek, 2005), which results in a non-ideal process. The use of crop
products for biofuels production has also raised some concerns. For example, the use of corn
for ethanol production has increased the prices of US beef, chicken, pork, eggs, breads,

8
cereals, and milk by 10% to 20% (Pimentel et al., 2009) and has been linked with recent food
shortages and riots around the world (Solomon and Johnson, 2009).
Scientists have been investigating the use of more sustainable, accessible and
economic feedstocks, namely lignocellulosic biomass. Sources for these feedstocks can be of
agricultural, forestry, industrial or municipal residue origin as well as dedicated energy crops
such as switchgrass, miscanthus and poplar among others (Clifton-Brown et al., 2004;
Demirbas and Balat, 2006; Kim et al., 2009; Schmer et al., 2008). Lignocellulosic
(cellulosic) biomass is composed of cellulose (14-70%), hemicellulose (9-22%), and lignin
(8-30%). Cellulose, the most abundant biopolymer on Earth (O'Sullivan, 1997), is a fibrous,
hard, impermeable homopolysaccharide composed of glucose units. Hemicellulose, the
second most common biopolymer in nature (Saha, 2003), is a mixture of pentoses (xylan and
arabinan) and hexoses (mannose, glucose and galactose). Hemicellulose is essential for cell
wall integrity (Saha, 2003). Lignin, a biopolymer that is considered to be the most
recalcitrant of known biopolymers to degradation, (Steffen et al., 2007) forms a matrix with
hemicelluloses around the cellulose forming a rigid polymeric network (Kirk and Farrell,
1987). Lignin is made up of the precursor alcohols coumaryl, coniferyl and sinapyl.
The application of lignocellulosic biomass for biofuels production though hydrolysis-
fermentation is very attractive because of its abundance and higher sugar yield compared to
corn starch (Hamelinck et al., 2005). Nevertheless, this technology is not currently
commercially available since this process is still not cost effective (Himmel et al., 2007;
Mosier et al., 2005). A diagram illustrating the basic hydrolysis-fermentation procedure is
shown in Fig. 1-1A. In this process, feedstocks require a chemical pretreatment in which the

9
carbohydrates-lignin network is broken. This pretreatment hydrolyzes hemicelluloses and
also makes cellulose more accessible for enzymatic hydrolysis (Hamelinck et al., 2005).
Briefly, biomass is generally treated at elevated temperatures with chemicals such as dilute
sulfuric acid, sulfur dioxide, ammonia, and lime (Yang and Wyman, 2008). Cellulose is then
converted to glucose monomers by further hydrolyzing with acids or cellulases. The resulting
liquor needs to be treated to remove unwanted components such as acids and degradation
products of C5 and C6 sugars, such as furfural and hydroxymethyl furfural. The liquor is
separated into solid and liquid fractions and the liquid fraction pH is neutralized. Then the
resulting liquid portion is collected and fermented with either yeast or bacteria. Furthermore,
the product is purified by distillation, and dehydration. This topic has been extensively
reviewed previously (Hamelinck et al., 2005; McMillan, 1992; Mosier et al., 2005; Sun and
Cheng, 2002; Yang and Wyman, 2008).
Although extensive work has been done to develop the hydrolysis-fermentation
process for conversion of biomass to biofuels, there are still significant challenges that need
to be addressed before this process can be commercially viable. These challenges include
slow kinetics of breaking down cellulose to glucose, low yields of individual sugars from
hemicelluloses, and removal of lignin (Himmel et al., 2007). To provide adequate rates of
production and total sugar yields, high enzyme concentrations are required for cellulose
hydrolysis. Furthermore, enzyme recovery and recycling, which is necessary to mitigate the
cost of the hydrolysis-fermentation process, is a complicating factor since the enzymes used
for cellulose degradation have a tendency to bind to the residual lignocellulose, and can,
therefore, be lost during the solid-liquid separation (Eriksson et al., 2002). In addition, the

10
lignin released during biomass hydrolysis can be biocidal and its presence often causes
bioreactor failure (Maness and Weaver, 2002), and since this lignin cannot be broken down
into fermentable sugars, 8-30% of the original biomass is not utilized for product formation.
Also, there is the formation of waste streams such as acid pretreatment materials and toxic
compounds found in acidic hydrolysates of biomass (Datar et al., 2004). Moreover, the
biochemical composition and structure of the biomass (cellulose, hemicellulose, and lignin)
dictates the process performance since this influences the final ethanol yield (Hamelinck et
al., 2005). Unlike the sugar-intermediate biosynthesis technology, in synthesis gas-
intermediate biosynthesis, feedstock biochemical composition does not materially affect the
outcome of the process.
Synthesis gas (syngas) is a product of the gasification of biomass. Gasification is a
well established technology where carbonaceous material (usually coal, wood and charcoal)
is cracked at extreme temperatures (700-1000°C). If pure oxygen is used as the oxidant in
the gasifier, then the resulting synthesis gas is rich in CO and H2. If air is used, then the
resulting gas (producer gas) is a mixture of CO, CO2, H2, CH4, N2, some light hydrocarbons
such as C2H2 and C2H4 as well as heavy hydrocarbons known as tars (Do et al., 2007). The
partial oxidation reactions with oxygen that take place within a gasifier are exothermic.
Steam can also be used as an oxidant in indirect gasification. The result of these
thermochemical reactions is an endothermic and often heat transfer limited, but
thermodynamically efficient process (Sipma et al., 2006). The ratio of the components of
synthesis gas varies depending on the biomass source and the gasification conditions
employed (see Table 1-1).

11
Gasification of biomass to provide vehicles with fuel has been in use since the early
1930’s (McKendry, 2002). Due to a petroleum products shortage during World War II, this
technology flourished in some European countries providing fuel for both civilians and
militaries (Dasappa et al., 2004). More recently, in the 1980’s and 1990’s, synthesis gas was
successfully used in the US and Europe for heat and electricity (Faaij, 2006;
http://fossil.energy.gov/programs/powersystems/gasification/gasificationpioneer.html, 2008
). In 2007, the US Department of Defense released plans to use synthesis gas in its
military bases and vehicles
(http://newsblaze.com/story/2006020806383900003.mwir/topstory.html, 2006). Synthesis
gas can also be transformed into a number of different products such as methanol, ethanol,
hydrogen, dimethylether and others via chemical catalysts (Fig. 1-2). This idea is not new
and has been developed in the past few decades (Wilhelm et al., 2001). Nevertheless, these
are expensive processes subjected to high pressures and temperatures (Quinn et al., 2004;
Takeguchi et al., 2000). Furthermore, syngas coming out of the gasifier has many
contaminants leading to catalyst poisoning (Leibold et al., 2008). Some synthesis gas
transformations to biofuels such as ethanol, butanol and hydrogen can be performed using
chemical as well as biological catalysts (Fig. 1-1B.1 and 1-1B.2). Biological processes, while
slower than chemical reactions, have a number of advantages such as higher yields (even
similar to direct fermentation of biomass (Spath and Dayton, 2003)), specificity, and
generally greater potential for decreased catalyst poisoning (Younesi et al., 2008). Some key
biological transformations related to end product formation are irreversible, these also occur
at ambient temperatures and pressures, therefore requiring minimum energy and lower cost

12
(Klasson et al., 1992a; Klasson et al., 1992b). Pioneering work by Dr. Clausen’s group
focused on production of biofuels from synthesis gas using microbial catalysts, and they
proposed methane production from synthesis gas using a mixed culture of methanogens and
hydogenotrophic bacteria (Barik et al., 1988b; Klasson et al., 1990). They also suggested the
possibility of biological production of ethanol from synthesis gas when there was no known
organism that could perform that reaction (Barik et al., 1988a). The number of investigations
on methane production from syngas has declined during the last decade. However, a number
of new organisms capable of producing biofuels from synthesis gas components have been
isolated (Table 1-2). In addition, microbial ethanol production from synthesis gas has
flourished to the point that Coskata, Inc. has a developed a commercial demonstration unit
this year (http://www.cleantech.com/news/4995/coskata-leaks-word-demo-plant-and-r, 2009)
and has plans to have a full commercial plant operating by 2011. INEOS Bio has a pilot
syngas to ethanol production plant in operation (http://www.ineosbio.com/57-
Welcome_to_INEOS_Bio.htm, 2009) and Syngas Biofuels Energy, Inc. is making efforts for
commercialization of biological conversion of syngas to butanol
(http://www.syngasbiofuelsenergy.com/, 2009). Plans and research to make microbial
biohydrogen production from biomass cost competitive by 2020 are also in progress.
Hyvolution, a multi-country effort funded by the European Union is working on the
development of a bioprocess for cost-effective production of hydrogen from biomass
(http://www.biohydrogen.nl/hyvolution, 2009). Also, Sapporo Breweries, Ltd. in
collaboration with the Brazilian government announced plans to operate a plant for
production of hydrogen from industry waste
13
(http://www.tradingmarkets.com/.site/news/Stock%20News/2239395/, 2009). None of these
biohydrogen projects are planning to utilize synthesis gas from biomass as their feedstock;
however, recent published research described briefly in this work (see Section IV. C) appear
very promising in regards to the development of industrial biohydrogen production from
synthesis gas.
1.2 Biomass gasification
Carbonaceous material can be used as feedstocks for gasification to produce syngas
streams. Researchers have experimented (Table 1-1) with feedstocks as diverse as wood,
sawdust, grass straw, nut and cacao shells, olive husks, even meat and bone meal (a by-
product of rendering industries) (Soni et al., 2009). This is important since synthesis gas can
then be produced from local biomass resources providing energy independence to both
developed and developing countries. The gasification of solid waste and biomass is
generally more complex than coal gasification due to the diversity of the carbon based
materials. Biomass gasification also needs to occur at lower temperatures since biomass is
more reactive than coal (Huber et al., 2006).
Synthesis gas produced from biomass contains contaminants such as alkali
compounds, H2S, HCl, NH3, HCN, potassium, sodium, and tars that are detrimental to the
gasifier equipment as well as catalysts for Fischer-Tropsch (F-T) reactions (Tijmensen et al.,
2002). Gasification occurs through a combination of complex reactions that include drying,
pyrolysis, combustion and finally reduction. Pyrolysis occurs in the absence of oxygen and
releases volatiles and gases from the biomass and produces char (solid carbonaceous

14
material). Combustion occurs when the oxidant reacts with carbon and water from the
biomass, producing CO2 and H2O. In the reduction reaction, oxidant as well as CO2 and H2O
produced in the combustion step react with the carbon in char producing CO as well as H2.
Two other important reactions occurring in the gasifier are the water-gas shift reaction in
which water reacts with CO to form H2 and CO2 and methanation, where CO reacts with H2
to form CH4 and H2O. If the combustion to provide heat to the process is generated in a
separate reactor, the process is called indirect gasification. Table 1-3 shows some of the
reactions that take place in gasifiers.
1.2.1. Gasifiers
Although there are many different gasifier designs in use, the three main types are the
updraft, the downdraft and fluidized-bed gasifiers. In the updraft gasifier (Fig. 1-3A), the
feedstock enters from the top of the chamber where it is dried by the syngas leaving the
chamber. Simultaneously, the gas leaving the chamber is cooled by the feedstock. The dried
feedstock travels down the vessel where pyrolysis to char occurs. The char that is generated
continues moving down the gasifier vessel where it is reduced and also interacts with the
oxidant for combustion. Ashes fall through a grate to the bottom of the gasifier. Some of the
advantages of updraft gasifiers are their simple construction, low cost, ability to handle high
moisture and inorganic content, and their high energy efficiency due to the low temperature
of the gas leaving the chamber. Some of the disadvantages are that the resulting syngas can
contain high levels of tars and hydrocarbons. Therefore if this gas will be used for F-T

15
conversion, extensive cleanup is required. Furthermore, updraft gasifiers have a feed size
limit, and slagging (molten residual ash that can be recycled for many applications) potential.
Downdraft gasifiers are very similar to updraft gasifiers (Fig. 1-3B), except that the
feedstock and oxidizer in downdraft gasifiers both enter from the top of the gasifier. The gas
passes though the hot zone combusting the tars and leaving the reactor from the bottom.
Some of the advantages of this design are that it has a fairly simple design and is low cost,
and it produces a relatively cleaner gas with very low tar formation. Some of the
disadvantages are that the system requires low moisture and ash feedstock, can only use
feedstocks within a limited particle size range (between 1-30 cm), and it has low efficiency
because the product gas leaves the gasifier at higher temperatures, which requires an
additional cooling system as compared to an updraft gasifier.
The third type of gasifier is the fluidized bed gasifier (Fig. 1-3C) This is a more
recent configuration, but it is also the most popular type (Bricka, 2007). In this design, the
feedstock size is reduced to a powder, and is mixed with the fluidizing material, which is
usually silica sand, ceramic or alumina. The oxidizer and mixed feedstock enter the reactor
from the bottom, where they form a bed of hot fluid, where most of the conversion to
synthesis gas occurs. One of the biggest advantages of this type of gasifier is the uniform
temperature distribution in the fluid bed. Also, carbon conversion could be up to 100%, and
it is a good design for large scale applications. Some of the problems with this type of
gasifier are that it produces a gas with high suspended particulates that need to be pre-heated
prior to introduction to the fluidized bed and there can be a loss of bed fluidization due to
feedstocks’ ash contents.

16
Gasification technology is significant to chemical or microbial catalytic syngas
conversion process development as quality of the gaseous feedstock influences application,
product formation and system efficiency. Optimization of the gasification unit operation in
combination with downstream catalytic conversion will improve the application of this
thermochemcial approach to bioenergy production.
1.3 Syngas chemical catalytic conversion
Fischer-Tropsch (F-T) is a surface catalyzed polymerization process that uses CHx
monomers formed by hydrogenation of adsorbed CO in order to obtain hydrocarbons with a
broad chain length and functionality (Iglesia, 1997). This process utilizes metal catalysts such
as Co, Ru, Rh and Fe catalysts. F-T plants have been operated around the world since 1938
(Dry, 2002). Syngas can be chemically converted to ethanol and butanol by F-T chemistry
and to hydrogen by the water-gas-shift reaction (WGS) (see Fig. 1-2). A successful chemical
transformation of syngas requires a purified syngas and a fixed CO/H2 ratio for maximum
conversion. Therefore, removal of H2S and organic sulfur compounds as well as excess CO2
is necessary. This cleanup process typically accounts for 60-70% of capital costs for plant
operation (Dry, 2002).
1.3.1. Ethanol Synthesis
In this process synthesis gas is heated to 210-350°C and compressed up to 1-7 MPa.
The gas is converted to alcohol across a fixed bed catalyst as described by Eq. (1). The

17
reaction rate is high, and completion takes seconds to minutes, with up to 60% CO
conversion to ethanol (Wei et al., 2009). Next the gas is cooled, this allows the alcohols to
condense and separate from the unconverted syngas. The liquid alcohols are then further
refined by alcohol separation and purification steps. Some of the catalysts that have been
historically used contain rhodium (Rh), cobalt, molybdenum and others including multi-
component catalysts (Takeuchi et al., 1985). Rh seems to be the best catalytic metal for
synthesis gas to ethanol conversion for its ability to perform all of the four specific functions
that a catalyst should perform. These include: dissociation of the adsorbed CO to carbon and
oxygen, hydrogenation of the adsorbed carbon to methyl species, insertion of non-dissociated
CO into the methyl species to form an adsorbed acyl species, and hydrogenation of the acyl
species to form the ethanol product (Haider et al., 2009). Some of the problems with these
chemical catalysts are their non-selectivity (i.e. a mix of alcohols is produced) and low
conversion yields (Subramani and Gangwal, 2008). Also the high cost of Rh may affect
commercialization of this technique. The reader is referred to references (He and Zhang,
2008; Spivey and Egbebi, 2007) for a full review of syngas to ethanol chemical catalysts.
2CO + 4H2 catalyst CH3CH2OH + H2O (1)
1.3.2 Hydrogen Synthesis
Synthesis gas produced from biomass can also be enriched thermochemically for
hydrogen production. Although hydrogen production yield from biomass is relatively low
(12-14% based on biomass weight), this technology has been viewed as very promising
(Asadullah et al., 2002; Demirbas, 2005). Subjection of synthesis gas to the water-gas shift

18
(WGS) reaction is the most widely used process (Nath and Das, 2003). This reaction
produces H2 and CO. In this process, syngas coming from the gasifier is transferred to a
WGS reactor where the H2 concentration is increased. In this reactor, steam and CO react to
produce H2 and CO2 (Eq. 2). Usually, the operating temperatures for the WGS reaction
range from 330 to 530°C (Tonkovich et al., 1999).
Hydrogen from syngas can also be produced by steam methane reforming (SMR).
Similar to natural gas SMR, in synthesis gas SMR, CH4 and other light hydrocarbons in the
gas are reacted with steam over a catalyst, usually nickel (Eq. 3). This reaction is carried out
at temperatures ranging from 700 to 1100 °C and pressures up to 2.5 MPa (Demirbas, 2007).
Out of all chemical production to hydrogen, production from synthesis gas SMR gives the
highest conversion efficiency and concentration of hydrogen (Ciambelli et al., 2009).
However, again, tars, dust, sulfur alkali compounds and other impurities can cause catalyst
block or poisoning in this process (Ciambelli et al., 2009). Still the cost of hydrogen
production from biomass gasification is three times higher than the current price of hydrogen
from steam methane or natural gas reforming (Balat et al., 2009; Demirbas, 2005).
CO+ H2O catalyst H2 + CO2 (2)
CH4 + H2O catalyst 3H2 + CO (3)
1.3.3 Butanol Synthesis
Over the last several decades, chemical catalytic systems for synthesis of higher
weight alcohols such as butanol, through CO hydrogenation have been developed (the overall

19
reaction is described in Eq. 4). Catalysis for higher alcohol synthesis can be achieved in
two ways. One is to produce methanol and branched alcohols, using modified methanol
synthesis with Cu/ZnO based catalysts (Christensen et al., 2009). These reactions generally
take place at temperatures around 400°C and pressures of 20.0 MPa (Smith and Anderson,
1983). The other process to produce higher weight alcohols is to form straight-chain
alcohols, using MoS2 and Co/Cu-based catalysts (Christensen et al., 2009; Surisetty et al.,
2009). These catalysts usually operate at temperatures of 275–325°C, and pressures of 7.5–
10MPa (Herman, 2000). The biggest disadvantage of these methods is, like with the ethanol
process, low selectivity. This in turn adds cost to the process due to the need for alcohol
separation. A maximum butanol selectivity of 4% of total alcohol was achieved when a
Cu/ZnO catalyst promoted with 0.5% K2CO3 was used (Smith and Anderson, 1983). Sun and
colleagues (Xu et al., 2004) showed that use of a Fe–CuMnZrO2 catalyst resulted in butanol
formation selectivity as CO conversion increased, but the butanol yield was only 7.5%
alcohol by weight.
4CO + 8H2 catalyst C4H9OH + 3H2O (4)
1.4 Syngas Biotransformation
1.4.1 Acetyl-CoA Pathway and Carbon Monoxide Dehydrogenase
Scientists have suggested that before an O2 atmosphere appeared, the first autotrophs
on Earth, organisms able to use CO or CO2 as their sole source of carbon, utilized the acetyl-

20
CoA pathway (Pereto et al., 1999; Ragsdale and Wood, 1991b; Russell and Martin, 2004).
Apparently, this pathway is still exclusively used by anaerobes (Henstra et al., 2007). The
acetyl-CoA or Wood-Ljungdahl pathway (see Fig. 1-4) was first described in the acetogen
Moorella thermoacetica (formerly known as Clostridium thermoaceticum), a heterotroph
capable of producing 3 moles of acetate from one mole of glucose. The pathway, which is
not cyclic like the Calvin cycle or the reverse TCA cycle, is formed by two branches. These
branches have been called the Eastern and Western branches and were the research focus of
Lars Ljungdahl and Harland Wood, respectively (Ragsdale, 1997). The Eastern branch
produces the methyl group of acetyl-CoA and the Western produces the carbonyl group. The
methyl group is formed from the reduction of CO2 to formate which is converted to
formyltetrahydrofolate and is reduced to methyltetrahydrofolate. These steps involve
formate dehydrogenase, and a series of tetrahydrofolate dependent enzymes (Drake, 1994;
Ragsdale and Wood, 1991b). Even though the pathway was described in a heterotroph, it has
been a model for autotrophic growth from CO2 or CO. Briefly, the organism can synthesize
acetyl-CoA by reducing CO2 with electrons produced by a hydrogenase from H2 (Eq. 5). If
CO is used, it acts as both a source of carbon and electrons (Eq. 6) (Drake, 1994). These
reactions are exergonic and therefore allow ATP formation and energy conservation through
both substrate-level phosphorylation and the electron transport chain (Ragsdale and Wood,
1991b).
Carbon monoxide dehydrogenase (CODH) is the central enzyme in this pathway
(Wood et al., 1986), and it has also been characterized in a diverse group of organisms. In
acetogens, this enzyme is responsible for reducing CO2 to CO yielding the carbonyl group of

21
acetyl-CoA and it also catalyzes the final step in synthesizing acetyl-CoA from CH3, CO and
S-CoA. Acetogens convert acetyl-CoA to acetate gaining an ATP. Some of these organisms
can also reduce acetyl-CoA to acetaldehyde and ethanol using electron donors such as
NAD(H) and NADP(H). This results in a net ATP consumption (Klasson et al., 1992b). In
chemolithoautotrophs, this enzyme also enables the utilization of CO as the sole carbon and
electron source by catalyzing the oxidation of CO to CO2 (Eq. 7). In these organisms, energy
is conserved through an electron transport chain. In hydrogenogenic carboxydotrophs, the
CODH reaction is the same as Eq. 7. However, the electrons are transferred to a membrane
associated hydrogenase that combines the generation of hydrogen with the translocation of
protons. This generates the proton gradient needed for ATP formation by ATP synthase. In
aceticlastic archaea, the CODH works in a reverse manner (Eq. 8) in which acetyl-CoA is
formed from acetate. Acetyl-CoA is cleaved and the methyl group is reduced to CH4 and CO
is oxidized to CO2. Energy in this system is also generated through an electron transport
chain. In methanogens able to grow on CO2/H2 or CO, CODH drives the formation of
acetyl-CoA from methyltetrahydrosarcinapterin and CO as well as the oxidation of CO to
CO2.
In Methanosarcina barkeri a hydrogenase couples generation of hydrogen with the
translocation of protons much like the process that occurs in hydrogenogenic
carboxydotrophs. In sulfate reducing bacteria, CODH functions very similarly to the reverse
acetyl-CoA pathway in methanogens. More recently, there has been evidence of a CODH
enzyme in hyperthermophilic archaea able to grow on CO. These CODHs are very similar to
counterparts in methanogens, such as Methanosarcina acetivorans C2A and Methanosarcina

22
mazei Gö1(Lee et al., 2008a). There has even been found a hyperthermophilic bacterium,
Carboxydothermus hydrogenoformans, containing five different forms of this enzyme (Wu et
al., 2005). For a complete review on CODH the reader is referred to (Ferry, 2003).
As is shown in sections IV. A, IV. B and IV. C, microbial production of ethanol,
hydrogen and/or butanol from synthesis gas components depends on CODH, the acetyl-coA
pathway or both. Therefore, we can expect the acetyl-CoA pathway and Carbon Monoxide
dehydrogenase to be critical not only for microorganisms surviving in a CO or CO2
atmosphere, but to the whole biofuels production from synthesis gas process.
2CO2 + 4H2 CH3COOH + 2H2O (5)
4CO + 2H2O CH3COOH + 2CO2 (6)
CO + H2O CO2 + 2H+ + 2e- (7)
CH3COOH CH4 + CO2 (8)
1.4.2 Ethanol from Syngas
Ethanol, butanol, hydrogen, biodiesel and methanol are all currently being evaluated
as next generation biofuels. Of these, ethanol is by far the biofuel produced in the greatest
quantities world-wide (Demirbas and Balat, 2006). Brazil is the number one ethanol
producer in the world with 41% of the total production, followed very closely by the United
States (Herrera, 2006). Most of this ethanol is produced by microbial fermentation of sugars
from either sugar-cane or corn starch. To make ethanol a commercial fuel contender, the
feedstock has to be switched to lignocellulosic biomass. Hydrolysis-fermentation technology

23
has proven to be expensive and labor intensive. Up to 40% of the carbon present in the
biomass is lost in the form of lignin and most microorganisms used in this process are unable
to utilize 5-carbon sugars in the hydrolysates. Plus, ethanol produced this way has not been
able to compete with fossil fuel derivatives like gasoline and diesel. Biomass gasification
can yield up to 100% carbon conversion to gas components and fermentation of syngas to
ethanol has been shown to be commercially feasible
(http://www.cleantech.com/news/4995/coskata-leaks-word-demo-plant-and-r, 2009).
The first microorganism shown to catalyze conversion of synthesis gas components to
ethanol (Eq. 9 and 10) was the acetogen Clostridium ljungdahlii (Barik et al., 1988a) named
after Dr. Lars Ljungdahl to honor his work on clostridia and acetogens. Even though ethanol
production from synthesis gas was detected, the main product was acetate. Initially, a molar
ratio of ethanol to acetate of 1:9 and an ethanol concentration of less than 1 g/L was obtained
in batch cultures (Vega et al., 1989). It was quickly learned that yeast extract had an
influence on the product ratio and that the ethanol production was non-growth related.
Therefore, yeast extract concentration was greatly reduced or eliminated completely and
replaced by cellobiose. This increased both ethanol and cell concentrations. Adding
reducing agents to the media seemed to alter electron flow to NADH formation and in turn,
increasing ethanol production. These first experiments where done in batch cultures. By
applying the culture performance information acquired through experimentation and
operating two continuously stirred tank reactors (CSTR) in series (the first to promote growth
and the second one for increased ethanol production), they were able to improve ethanol
production by 30 fold (Klasson et al., 1991b). A cell recycle apparatus was added to the

24
CSTR and pH was held at 4.5, agitation was set at 450 rpm, gas flow rate was 30 ml/min and
liquid flow rate ranged from 3.5 to 12 ml/h. These modifications increased the cell
concentration from 800 mg/L to 4000 mg/L, and increased ethanol production to 50 g/L with
an ethanol to acetate molar ratio of 21:1 and CO and H2 conversions of 90% and 70%
respectively (Klasson et al., 1993; Phillips et al., 1993a). Investigations also showed that C.
ljungdahlii is quite tolerant of sulfur gases. It is able to grow and uptake CO and H2 in the
presence of up to 2.7% H2S or 5% carbonyl sulfide (Klasson et al., 1993; Smith et al., 1991).
This is relevant since syngas contains a considerable amount of these gases.
Work by Ghasem Najafpour and colleagues has investigated the effect of gas
pressures in ethanol and acetate production by C. ljungdahlii in batch cultures (Najafpour and
Younesi, 2006; Younesi et al., 2005). CO consumption and CO2 production was the highest
when syngas was applied at 1.6 and 1.8 atm, showing that CO uptake is not inhibited by
synthesis gas at high pressures. H2 and CO2 consumption occurred after 72 h of incubation
time in cultures with 1.6 and 1.8 atm of syngas, by which time CO had already been
exhausted. This shows that CO was the preferred substrate for cell growth. This was
expected since free energy is higher when CO is used as a substrate as compared to CO2
(Barik et al., 1988a). Growth and acetate formation were not affected by the higher syngas
pressures. On the contrary, ethanol production was enhanced at syngas pressures of 1.6 and
1.8 atm by four fold. For their system, ethanol yield was only 0.6 g/L and the ethanol to
acetate molar ratio was 0.54.
More recently, different synthesis gas compositions as well as different agitation
speeds and gas flow rates were compared for their effect on ethanol production by C.

25
ljungdahlii (Younesi et al., 2006). Using synthesis gas with a composition of (volume %)
55% CO, 20% H2, 10% CO2 and 15% Ar, a bioreactor agitation speed of 300 rpm and a gas
flow rate of 10 ml/min, CO utilization was only 14% (by volume). When agitation was
increased to 400 rpm, CO utilization only increased to 18%. When pure CO or a CO rich gas
mix (70% CO, 15% H2 and 15% Ar) was used, cell concentration increased by 28%, but CO
utilization remained low. Throughout the experiment a maximum of 6g/L ethanol and 7g/L
acetate was produced.
Since ethanol production by C. ljungdahlii is assumed to be non-growth related, the
effects of nitrogen limitation and low pH on ethanol and acetate production under a nitrogen
atmosphere were investigated (Cotter et al., 2009a). Results showed that C. ljungdahlii
requires vitamins and trace elements to maintain high cell viability in media lacking a
nitrogen source. Also, ethanol and acetate production were significantly lower in resting cells
as compared to growing cultures. Cultures were stable when initial pH of the non-growth
media was lowered to 4.5. Nevertheless, cell viability dropped from 100% in the control pH
(6.8) to 11.1%. Ethanol production was also significantly lower in cultures at low pH as
compared to the control cultures.
The effects of pH and gas flow on growing batch cultures have also been studied,
under a synthesis gas atmosphere (Cotter et al., 2009b). The gas flow rates tested were 5, 7.5
and 10 ml/min and culture pHs were 6.8 and 5.5. It was reported that initial lower pH
conditions resulted in lower cell densities and end product formation. The greatest ethanol
formation occurred during cell growth, which is not in agreement with the theory that ethanol
production is non-growth associated. Higher ethanol yields were obtained at gas flows of 7.5

26
ml/min with an ethanol to acetate ratio of 1:8. CO2 concentration coming out of the reactor
increased in all treatments tested. CO and H2 were consumed with CO2 consumption
occurring at the later stages of the culture growth.
A few years after C. ljungdahlii was described, Clostridium autoethanogenum,
another acetogen able to produce ethanol from CO was isolated from rabbit feces (Abrini et
al., 1994). Synthesis gas fermentation studies with C. autoethanogenum are limited.
However, ethanol production from syngas components has been shown to be only a fraction
of the molar yield of C. ljungdahlii, and the ethanol to acetate molar ratio was around 1:1or
less (Abrini et al., 1994; Cotter et al., 2009a; Cotter et al., 2009b). In their non-growing
experiments Chinn and colleagues, (Cotter et al., 2009a) observed that C. autoethanogenum
culture densities decreased substantially, but were 100% viable. The C. autoethanogenum
cells also consumed xylose, meaning that cells were metabolically active even under nitrogen
limitation conditions. Nevertheless, ethanol and acetate production were lower than when
cells were grown in the presence of a nitrogen source. In batch cultures with constant
synthesis gas flow, higher ethanol yields were achieved at a gas flow rate of 10 ml/min with
an ethanol to acetate molar ratio of 1:16. CO and H2 were consumed and CO2 was produced
in similar quantities across all flow rates (Cotter et al., 2009b).
The only published research showing growth and ethanol production from actual
biomass producer gas has been done with the acetogen Clostridium carboxidivorans P7
(Datar et al., 2004; Liou et al., 2005). This organism (originally named bacterium P7) was
isolated from an agricultural settling lagoon and was extensively studied because of its ability
to produce six times more ethanol than acetate (Rajagopalan et al., 2002). In these studies,
27
the researchers operated the reactor by switching from bottled gas to producer gas. In the first
stages, the culture cells were grown in batch liquid with continuous bottled synthesis gas
flow at 180 ml/min and pH was controlled at 5.9. When cell growth plateaued, continuous
liquid flow at 1.5 ml/min was initiated. Acid production was shown to be growth associated
and ethanol production was minimal at this stage. Both H2 and CO were consumed during
cell growth. When the reactor was operated with producer gas, cell growth and H2 uptake
stopped, CO consumption decreased, and cells began to wash out. Nevertheless, ethanol
production increased and acid production decreased, indicating that ethanol production was
non-growth associated. When the reactor was returned to bottled syngas and liquid batch
mode, cells began to grow again indicating that the cells had not lost viability. CO uptake
started again, but not H2 consumption. The group reported that this H2 uptake inhibition
could be caused by nitric oxide (NO) and acetylene present in the producer gas used (Ahmed
et al., 2006; Ahmed and Lewis, 2007). NO is a known hydrogenase inhibitor, and in this
organism, it affects H2 uptake at concentrations above 40 ppm (Ahmed and Lewis, 2007).
Therefore, the producer gas used may need to be processed to remove NO to concentrations
below 40 ppm. Nevertheless, their results seem promising for the development of
commercial processes.
Yet another bacterium has been isolated for its ethanol production from synthesis gas.
In this case a thermophile, Moorella sp. HUC22-1 (Sakai et al., 2004). Even though
lowering pH and cell recycle have improved ethanol production from 1mM to 15 mM, the
ethanol to acetate molar ratio obtained was 1:45 (Sakai et al., 2005). An acetaldehyde
dehydrogenase (Aldh) and three alcohol dehydrogenases (AdhA, AdhB, and AdhC) have

28
been described from this organism (Inokuma et al., 2007; Sakai et al., 2004). Aldh was
shown to catalyze the thioester cleavage of acetyl-CoA, as well as the thioester condensation
from CoASH and acetaldehyde. It also was shown to have activity towards both NADP(H)
and NAD(H), but activity towards NAD(H) was determined to be eight fold higher. AdhA
was observed to catalyze the NADP(H)-dependent reduction of acetaldehyde as well as the
oxidation of ethanol. This enzyme can also use NAD(H) as a cofactor but with decreased
activity. AdhB was active only when NADP(H) was used as a cofactor. AdhC showed no
activity with any of the cofactors used. Both AdhA and AdhB were active towards reduction
of a variety of aldehydes. Surprisingly, the highest activities were toward n-butylaldehyde
and isobutylaldehyde, even though this organism has not been shown to produce butanol.
Finally the study reported higher aldh gene expression when cells were grown on H2/CO2,
but lower adhABC expression in cells grown on H2/CO2 than cells grown on fructose.
Another possible use for the discussed autotrophic microorganisms is the conversion
of CO2 emitted from industrial operations such as fossil-fueled power plants. This CO2 can
be converted to ethanol with a suitable electron donor. Shu and Wiesner (Shu and Wiesner,
2008) ran a simulation using either C. ljungdahlii or Moorella sp. HUC22-1 for conversion
of CO2 from a power plant to ethanol. They determined that H2 was the most favorable
electron donor when compared to acetate or methane since the reaction occurs at near
ambient temperatures. Hydrogen can be produced by microorganisms (Section IV. C), or
with current technologies like steam methane reforming. They propose to use an aerated
membrane reactor (AMR) as the bioconversion vessel. As described by Shu and Weiner
(2008), inside the AMR there is a membrane bundle that liquid media and gases pass
29
through. Bacteria are attached to the membranes as well as suspended in the medium. This
reactor does not require agitation like the others, thus reducing operational costs. In their
simulation, the ethanol yield was significantly lower than yields obtained by the Clausen
group (Klasson et al., 1993). Nevertheless, when C. ljungdahlii conversion was modeled,
ethanol production costs by this method appeared to be less than the current ethanol market
price. These findings appear very promising by themselves; imagine if even higher ethanol
yields were reached.
2CO2 + 6H2 bacteria CH3CH2OH +3H2O (9)
6CO + 3H2O bacteria CH3CH2OH + 4CO2 (10)
1.4.3 Hydrogen from Syngas
Hydrogen is a versatile fuel as it can be used for power generation as well as a
transportation fuel (in association with fuel cells). It is considered to be a clean fuel since
water is the only byproduct when it is burned. It has been proposed that hydrogen will likely
be the most common alternative fuel used for automotive consumption in the next 25 years
(Demirbas, 2007). Natural gas and coal SMR are the least expensive known technologies for
H2 production. This process results in a gas mixture of mainly CO and H2. Subsequently, CO
is chemically converted to CO2 by the water-gas shift (WGS) reaction producing additional
H2. Syngas may also be converted to hydrogen via the WGS reaction. At a production cost
of up to $50/GJH2 (www.iea.org/Textbase/techno/essentials.htm, 2007), these processes do
not make hydrogen a viable replacement for fossil fuels at present (Ismail et al., 2008).
30
Hydrogen can also be produced by biological systems. Biological hydrogen
production is environmentally friendly and requires less energy input compared to chemical
processes (Ismail et al., 2008). Rhodospirillum rubrum, Rhodopseudomonas palustris P4,
Citrobacter sp. and Rubrivivax gelatinosus CBS are photoautotrophic and
chemoheterotrophic microorganisms capable of performing the gas-water shift (GWS)
reaction (Ismail et al., 2008; Jung et al., 1999; Klasson et al., 1992b; Maness and Weaver,
2002; Markov and Weaver, 2008; Najafpour et al., 2003; Najafpour et al., 2004). Two
enzymes that mainly contribute to the GWS reaction in these organisms are CODH and
hydrogenase. The former catalyses the oxidation of CO, and hydrogenase mediates the
reduction of protons to H2 (Maness et al., 2005; Najafpour et al., 2004). Biological GWS is
thermodynamically favorable at room temperature, (CO + H2O �H2 + CO2 ∆G= - 20
kJ/mol) and atmospheric pressure, compared to the chemical catalysis where a two-stage
process is required as well as high temperature (>200°C) (Benemann, 1999). Therefore,
minimum energy requirements and low process cost are expected (Ismail et al., 2008).
R. rubrum grows quickly and reaches high cell concentrations that uptake CO more
rapidly than other similar organisms capable of performing the GWS reaction (Klasson et al.,
1992b; Najafpour et al., 2003; Najafpour et al., 2004). It also tolerates small amounts of O2
and sulfur often present in syngas (Klasson et al., 1992b). As a result, this strain is the
favorite organism for studies investigating biohydrogen production from syngas. R. rubrum
requires a light source for growth; however, H2 production is independent of light intensity
(Najafpour et al., 2004). An organic carbon source is needed for this organism to efficiently
consume CO. The highest CO consumption (90-97 %) has been determined to occur when

31
R. rubrum is provided with acetate as the organic carbon substrate (1-2 g/l), resulting in a
98% hydrogen production yield (Najafpour and Younesi, 2007; Najafpour et al., 2004).
Investigations involving continuously stirred tank reactors (CSTR) of R. rubrum and with
continuous CO flow resulted in hydrogen yields and CO conversions of 87% and 95%
theoretical values, respectively (Younesi et al., 2008). This type of bioreactor was stable
for continuous operation for 27 days (Ismail et al., 2008). Most hydrogen production from
syngas research has been done using artificial syngas. A mixture of pure gases is normally
present in synthesis gas at a fixed concentration (e.g. 56.0% N2, 17.2% CO, 16.3% CO2, and
8.8% H2). In a study by DiSpirito and colleagues, R. rubrum growing on artificial syngas and
on “real” producer syngas was compared. It was determined that producer syngas had no
negative effect on growth rates, biomass production, hydrogen production or carbon
monoxide consumption (Do et al., 2007).
R. gelatinosus CBS is another promising strain for its use in syngas-to-hydrogen
conversion. In the presence of CO, this organism carries out the WGS reaction in both light
and dark conditions (Maness and Weaver, 2002). These cells are capable of converting
100% of CO in the gas phase to H2 in the dark (Markov and Weaver, 2008). Its tolerance for
oxygen (Maness and Weaver, 2002) and its capacity to use CO as the sole carbon and energy
source (Maness et al., 2005; Markov and Weaver, 2008) make it an attractive biocatalyst.
32
1.4.4 Butanol from Syngas
Butanol, like ethanol, can be produced from fermentable sugars, synthesis gas and
glycerol. Butanol has a number of notable qualities that make it a suitable alternative fuel. Its
energy content is 30% more than ethanol (Qureshi and Ezeji, 2008). It can be mixed with
gasoline in any proportion or be used as the sole fuel component (100% butanol) in
unmodified car engines (Ramey, 2007). It carries less water; and therefore, it can be
transported through existing gasoline pipelines (Dürre, 2007). Reports of biological butanol
formation date back to Louis Pasteur. He reported an alcohol product from a clostridial
culture (Dürre, 2007). The acetone-butanol-ethanol (ABE) fermentation was essential during
World War I. Acetone was needed to prepare munitions, and it was in great shortage at the
time. Production of acetone by fermentation meant a constant supply of acetone to Britain
and its allies (Dürre, 2007). C. acetobutylicum has been the model organism for research in
ABE fermentation from sugars, but other species have also been extensively investigated.
Some of the most studied are Clostridium beijerinckii, Clostridium
saccharoperbutylacetonicum, and Clostridium saccharobutylicum. Butyribacterium
methylotrophicum is an anaerobe capable of using 1-carbon compounds such as CO2 (in the
presence of H2), CH4, and formate as carbon sources in addition to fermentable substrates
like glucose, sucrose and glycerol (Zeikus et al., 1980). It also possesses the advantageous
ability to produce butanol from synthesis gas (Grethlein et al., 1990; Lynd et al., 1982;
Zeikus et al., 1980). It is one of the most versatile CO utilizing bacteria (Grethlein et al.,
1991). Other fermentation products are ethanol, acetate and butyrate. The first attempts at

33
investigating this strain for butanol production from CO yielded concentrations of 1.4 g/L
(Worden et al., 1991). After some changes in fermentation set up, such as operation at pH
5.5 and continuous cell cycle, butanol production from CO was improved by more than
200% (Grethlein et al., 1991). Nevertheless, with classic ABE strains producing butanol at
more than 400 g/l (Lee et al., 2008b), B. methylotrophicum is not yet a contender for
commercial biobutanol production. Another interesting, but less studied strain for butanol
production, is C. carboxidivorans P7. Being able to produce up to 4 times more ethanol than
butanol from CO or producer gas, this strain has mostly been studied for its ethanol
production capabilities (Section IV. B) (Datar et al., 2004; Liou et al., 2005; Rajagopalan et
al., 2002).
1.5 Metabolic Engineering of Syngas Biotransformation Processes
Escherichia coli strain KO11 is the classic example of metabolic engineering for
improved biofuels production in a microorganism. In this organism, Ingram and colleagues
successfully integrated the pyruvate decarboxylase and alcohol dehydrogenase II genes from
Zymomonas mobilis (Ohta et al., 1991). This strain has been the foundation of a significant
number of studies (Underwood et al., 2002; Yomano et al., 2008; Yomano et al., 1998).
After genetic tools were developed and its genome sequenced, Z. mobilis has become an
important part of recent bioethanol production research. Since this organism can only utilize
simple C6 sugars, research has been focused on providing it pathways for xylose and
arabinose utilization (Rogers et al., 2007).

34
Metabolic engineering in E. coli has also been applied for enhanced hydrogen
production. Over-expression of the native formate hydrogen lyase (FHL) in E. coli resulted
in about three times more hydrogen production than the wild type strain (Yoshida et al.,
2005). Through a series of deletions and mutations, Wood and colleagues successfully un-
regulated FHL, inhibited hydrogen uptake and redirected glucose metabolism towards
formate resulting in around a five-fold hydrogen production increase (Maeda et al., 2007).
They also randomly bioengineered the HycE hydrogenase (produces hydrogen from formate)
to obtain a 23-fold increase in hydrogen production from E. coli (Maeda et al., 2008a). It
was recently shown that similar to E. coli, Citrobacter amalonaticus Y19 possess a FHL
complex (Kim et al., 2008). This finding potentially provides many opportunities for
engineering this bacterium. Some work has also been done in an effort to redirect metabolism
towards H2 production in R. palustris (Rey et al., 2007).
To date, metabolic engineering studies focused on butanol producing bacteria have
targeted enhancing butanol production, increasing tolerance to solvents and selecting for
butanol over other products. Findings from these studies have provided insight into how to
meet some of the challenges of using metabolic engineering strategies to improve
biotransformation of synthesis gas. For example, regular plasmid vectors are degraded in
ABE Clostridia due to DNA restriction patterns in these bacteria. Also genetic tools for these
strains are not as developed as with E. coli or Bacillus subtilis. Some of these hurdles have
been overcome (Heap et al., 2007; Mermelstein et al., 1992) and to date, some of the aims
have been met by inactivating acetate and butyrate kinases, the solvent formation repressor
35
gene solR, and over-expression of heat shock proteins among other approaches (Green et al.,
1996; Harris et al., 2001; Tomas et al., 2003).
Just recently, attention has been given to modifying or introducing butanol (or its
isomers) production pathways in E. coli. Yukawa and colleagues (Inui et al., 2008)
successfully cloned and expressed butanol production genes from C. acetobutylicum ATCC
824. Similar approaches have been taken with yeast (Steen et al., 2008). Also, higher
isobutanol production has been observed in E. coli cells over-expressing Alcohol
Dehydrogenase A from Lactococcus lactis (Atsumi et al., In press).Throughout the literature,
many microorganisms have been genetically manipulated for enhance biofuel production.
However, synthesis gas has not been the source of energy or growth for organisms in these
experiments. This is probably due to the lack of genetic information and tools for syngas
utilizing organisms. The work of Nishio and colleagues (Inokuma et al., 2007) is a good start
on identifying what enzymes are more active under syngas fermentation and which ones are
not, helping to identify good candidate genes for genetic modifications. Metabolic
engineering of these microorganisms may further facilitate biomass conversion to biofuels as
well as lowering the cost of these processes.
1.6. Acetogens and oxidative stress response
The acetyl-CoA pathway used by acetogens relies on enzymes that are highly
susceptible to O2 (Ljungdhal, 1986; Ragsdale and Wood, 1991b). Some of these enzymes
are: formate dehydrogenase, methylene-H4folate reductase, disulfide reductase, and carbon
monoxide dehydrogenase (Ljungdhal, 1986). Therefore, acetogens have been classified as

36
anaerobes, even obligate anaerobes (Drake et al., 2008). Nevertheless, acetogens have been
isolated from environments that experience transient O2 exposure such as leaf litter, forest
soil, termite guts, and plant roots (Brioukhanov and Netrusov, 2007; Kusel et al., 2001).
Thus, it is not surprising that an array of different Reactive Oxygen Species (ROS) protecting
enzymes have also been detected in acetogens and characterized.
Moorella thermoacetica (Clostridium thermoaceticum), the model “obligately”
anaerobic homoacetogen, studied for the elucidation of the acetyl-CoA pathway contains a
five-gene cluster encoding for rubrerythrin (Rbr), rubredoxin oxidoreductase (Rbo), two
rubredoxins (Rub) and a type A flavoprotein suggested to protect this bacterium from ROS
(Das et al., 2001). In a study by Drake and colleagues, M. thermoacetica, Sporomusa
silvacetica and Clostridium magnum were able to grow and reduce O2 concentrations up to
1.9 % (v/v) in the gas phase (Karnholz et al., 2002). These three organisms exhibited NADH
oxidase as well as peroxidase activities. However, superoxide dismutase and catalase
activities were not detected. Sporomusa termitida and Sporomusa sp. strain TmAO3, both
isolated from termite guts and Acetobacterium woodii, isolated from estuarine sediments
show H2-dependent O2 reduction. An NADH oxidase was recently isolated and
characterized from Clostridium aminovalericum. This was the first enzyme of this type
characterized from the genus Clostridium (Kawasaki et al., 2005). In this the same study,
genes encoding for ROS protecting enzymes such as glutathione peroxidase, thioredoxin,
Rbr, peroxidase, various SODs and thioredoxin reductase were found in the genome of both
Clostridium aminovalericum and C. acetobutylicum.

37
It has been shown that acetogens can divert electrons from acetate formation routes
to alternative terminal electron-accepting processes when exposed to O2 (Drake et al., 2008).
For example M. thermoacetica can use nitrate as e- acceptor. Additionally, Clostridium
glycolicum RD-1 is capable of diverting e- for the formation of H2 and lactate. Furthermore,
this organism shows a 2-fold increase in ethanol formation concomitant with approximately
2-fold reduction in acetate production. These results are encouraging as researchers might be
able to increase ethanol production from synthesis gas at the expense of acetate formation by
exposing these acetogens to certain amounts of O2. This would be beneficial especially for
improving biofuel production from organisms where genetic systems are not available. On
the other hand, it could also be used in combination with metabolic engineering of organisms
where genetic systems are already developed.
1.7. Conclusions
Current US ethanol production from corn starch is not sustainable. It directly impacts
food and feed markets, depends on subsidies, and has questionable energy balances. Biofuels
from cellulosic biomass have promise to be a renewable alternative to fossil fuels. Industry
can take advantage of feedstocks such as energy crops, agricultural residues as well as
industrial and municipal waste. Developing technologies around lignocellulosic biomass
feedtsocks can make biofuels cost competitive without negatively altering global food and
environmental affairs.
38
Fermentation of synthesis gas obtained from biomass has proven to be a viable
approach to produce biofuels. When compared to lignocellulose hydrolysis-fermentation,
gasification-fermentation has higher product yields and lower energy input (Piccolo and
Bezzo, 2009; Wei et al., 2009). Microbial catalysts generally can manage synthesis gas
contaminants making them more robust than some chemical catalysts. Nevertheless, quality
of the synthesis gas coming out of the gasifier has to be closely monitored since
contaminants such as NO, acetylene and O2 can inhibit activities from these microbes.
Seemingly most of these problems have been overcome since a commercial demonstration
plant utilizing this process is already in operation, with possibilities of several other
companies opening new plants in the near future. Furthermore, microbial ethanol production
from CO2 emitted from power plants seems promising and would support value-added,
environmentally-conscious fuel production.
Even though a number of microorganisms have been isolated with abilities to convert
synthesis gas to biofuels, the list is still small and extensive physiological and metabolic
research is limited for most of these isolates. Consequently, metabolic tools and techniques
are non-existent for many of these microbes. The fact that some acetogens produce higher
ethanol concentration as a response to O2 exposure opens up new possibilities for
improvement of biofuels production. Furthermore, the combination of new and better
isolates with advancement in metabolic engineering would improve gasification-fermentation
process costs, product yields, and overall performance.
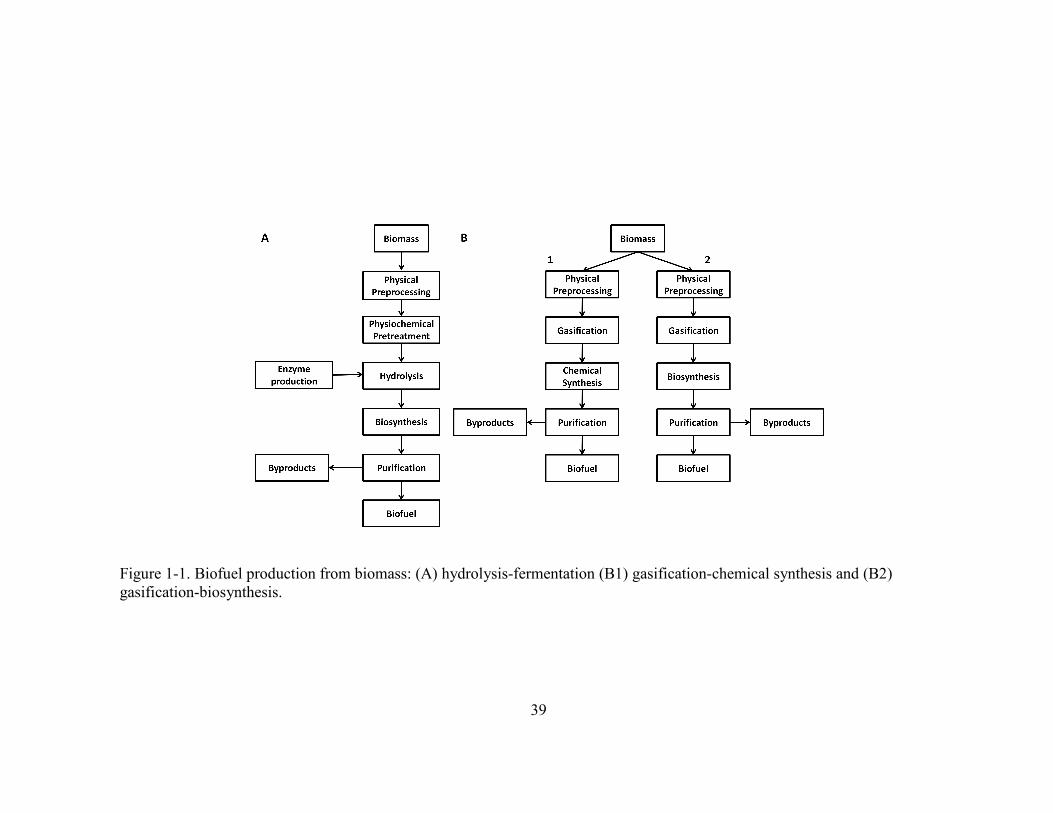
39
Figure 1-1. Biofuel production from biomass: (A) hydrolysis-fermentation (B1) gasification-chemical synthesis and (B2) gasification-biosynthesis.

40
Figure 1-2. Fuel products obtained from synthesis gas transformation, modified from Spath and Dayton (2003).

41
Figure 1-3. Diagrams of gasification reactors: A) updraft gasifier; B) downdraft gasifier; C) fluid-bed gasifier.
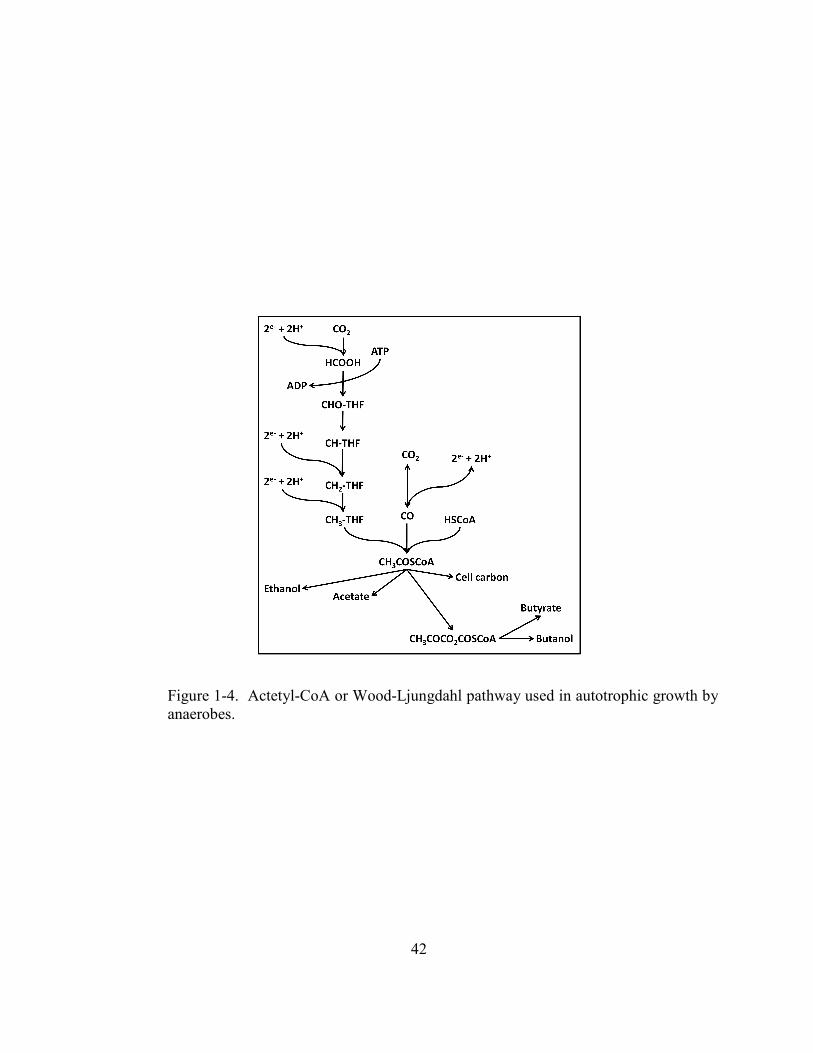
42
Figure 1-4. Actetyl-CoA or Wood-Ljungdahl pathway used in autotrophic growth by anaerobes.

43
Table 1-1. Composition of synthesis gas derived from various lignocellulosic biomass sources.
Composition vol %
Source CO CO2 H2 N2 CH4 Other
Switchgrass1 14.7 16.5 4.4 56.8 4.2 3.4
Pine wood chips2 16.1 13.6 16.6 37.6 2.7 13.4
Willow3 9.4 17.1 7.2 60.5 3.3 2.5
Cacao shells3 8 16 9 61.5 2.3 3.2
Dairy biomass4 8.7 15.7 18.6 56 0.6 0.4
Kentucky bluegrass straw5 12.9 17.4 2.6 64.2 2.1 0.8
Demolition wood/paper residue3 9.2 16.1 6.1 63.2 2.8 2.6 1- (Datar et al., 2004) 2- (Corella et al., 1998), 3- (van der Drift et al., 2001), 4- (Gordillo and Annamalai, In press, doi:10.1016/j.fuel.2009.07.018 ), 5- (Boateng et al., 2007).

44
Table 1-2. Summary of microbial catalysts capable of producing biofuels from synthesis gas
Microorganism Source of isolation Growth temperature Biofuel Reference
Acetobacterium woodii Estuary sediment Mesophilic Ethanol (Balch et al. 1977; Buschhorn et al. 1989)
Butyribacterium methylotrophicum Sewage digester Mesophilic Ethanol, butanol (Zeikus et al. 1980)
Caldanaerobacter subterraneus subsp. pacificus Marine hot vent Thermophilic H2 (Sokolova et al. 2001)
Carboxydocella themoautotrophica Hot spring Thermophilic H2 (Sokolova et al. 2002)
Carboxydothermus hydrogenoformans Hot swamp Thermophilic H2 (Gerhardt et al. 1991)
Citrobacter sp. Y9 Wastewater sludge digester Mesophilic H2 (Oh et al. 2003)
Clostridium autoethanogenum Rabbit feces Mesophilic Ethanol (Abrini et al. 1994)
Clostridium glycolicum RD-1 Sea grass roots Mesophilic Ethanol (Kusel et al. 2001)
Clostridium ljungdahlii Chicken waste Mesophilic Ethanol (Barik et al. 1988; Tanner et al. 1993)
Clostridium carboxidivorans Lagoon sediment Mesophilic Ethanol, butanol (Liou et al. 2005)
Moorella sp. HUC22-1 Mud Thermophilic Ethanol (Sakai et al. 2004)
Rhodopseudomonas palustris P4 Wastewater sludge digester Mesophilic H2 (Jung et al. 1999)
Rhodospirillum rubrum Dead mouse residue Mesophilic H2 (Zurrer and Bachofen 1979; Gest 1995)
Rubrivivax gelatinosus Lake sediment Mesophilic H2 (Uffen 1976)
Thermincola carboxydiphila Hot spring Thermophilic H2 (Sokolova et al. 2005)
Thermococcus strain AM4 Hydrothermal vent Thermophilic H2 (Sokolova et al. 2004b)
Thermolithobacter carboxidivorans Hot spring Thermophilic H2 (Sokolova et al. 2007)
Thermosinus carboxidivorans Hot spring Thermophilic H2 (Sokolova et al. 2004a)

45
Table 1-3. Thermochemcial reactions that occur during gasification of biomass
Reaction Chemistry Enthalpy change
Partial Oxidation C + 1/2O2 CO -268 MJ/kg mole
Complete Oxidation C + O2 CO2 -406 MJ/kg mole
Water Gas Reaction C + H2O CO + H2 +118 MJ/kg mole
Water Gas Shift Reaction CO + H2O CO2 + H2 -42 MJ/kg mole
Methane Formation CO + 3H2 CH4 + H2O -88 MJ/kg mole

46
REFERE-CES
Abrini, J., Naveau, H., and Nyns, E.-J., 1994. Clostridium autoethanogenum, sp. nov., an anaerobic bacterium that produces ethanol from carbon monoxide. Archives of Microbiology. 161, 345-351. Ahmed, A., Cateni, B. G., Huhnke, R. L., and Lewis, R. S., 2006. Effects of biomass-generated producer gas constituents on cell growth, product distribution and hydrogenase activity of Clostridium carboxidivorans P7T. Biomass and Bioenergy. 30, 665-672. Ahmed, A., and Lewis, R. S., 2007. Fermentation of biomass-generated synthesis gas: effects of nitric oxide. Biotechnology and Bioengineering. 97, 1080-1086. Akhtar, M. K., and Jones, P. R., 2008. Engineering of a synthetic hydF-hydE-hydG-hydA operon for biohydrogen production. Analytical Biochemistry. 373, 170-172. Al-Hasan, M., 2003. Effect of ethanol-unleaded gasoline blends on engine performance and exhaust emission. Energy Conversion and Management. 44, 1547-1561. Antoni, D., Zverlov, V., and Schwarz, W., 2007. Biofuels from microbes. Applied Microbiology and Biotechnology. 77, 23-35. Asadullah, M., Ito, S.-i., Kunimori, K., Yamada, M., and Tomishige, K., 2002. Biomass gasification to hydrogen and syngas at low temperature: novel catalytic system using fluidized-bed reactor. Journal of Catalysis. 208, 255-259. Atsumi, S., Wu, T.-Y., Eckl, E.-M., Hawkins, S., Buelter, T., and Liao, J., In press. Engineering the isobutanol biosynthetic pathway in Escherichia coli by comparison of three aldehyde reductase/alcohol dehydrogenase genes. Applied Microbiology and Biotechnology. Balat, M., Balat, M., Kirtay, E., and Balat, H., 2009. Main routes for the thermo-conversion of biomass into fuels and chemicals. Part 2: Gasification systems. Energy Conversion and Management. 50, 3158-3168. Balch, W. E., Schoberth, S., Tanner, R. S., and Wolfe, R. S., 1977. Acetobacterium, a New Genus of Hydrogen-Oxidizing, Carbon Dioxide-Reducing, Anaerobic Bacteria. International Journal of Systematic Bacteriology. 27, 355-361. Barik, S., Prieto, S., Harrison, S., Clausen, E., and Gaddy, J., 1988a. Biological production of alcohols from coal through indirect liquefaction. Applied Biochemistry and Biotechnology. 18, 363-378.

47
Barik, S., Vega, J., Clausen, E., and Gaddy, J., 1988b. Biological conversion of coal gas to methane. Applied Biochemistry and Biotechnology. 18, 379-392. Barnwal, B. K., and Sharma, M. P., 2005. Prospects of biodiesel production from vegetable oils in India. Renewable and Sustainable Energy Reviews. 9, 363-378. Basher, S. A., and Sadorsky, P., 2006. Oil price risk and emerging stock markets. Global Finance Journal. 17, 224-251. Benemann, J. R., The Technology of Biohydrogen. BioHydrogen, 1999, pp. 19-30. Bentley, R. W., Mannan, S. A., and Wheeler, S. J., 2007. Assessing the date of the global oil peak: The need to use 2P reserves. Energy Policy. 35, 6364-6382. Boateng, A. A., Banowetz, G. M., Steiner, J. J., Barton, T. F., Taylor, D. G., Hicks, K. B., El-Nashaar, H., and Sethi, V. K., 2007. Gasification of Kentucky bluegrass (Poa pratensis l.) straw in a farm-scale reactor. Biomass and Bioenergy. 31, 153-161. Bothast, R. J., and Schlicher, M. A., 2005. Biotechnological processes for conversion of corn into ethanol. Applied Microbiology and Biotechnology. 67, 19-25. Bricka, R. M., Energy crop gasification. In: A. Eaglesham, R. W. F. Hardy, Eds.), Agricultural Biofuels: Technology, Sustainability and Profitability, 2007. Brioukhanov, A., and Netrusov, A., 2007. Aerotolerance of strictly anaerobic microorganisms and factors of defense against oxidative stress: A review. Applied Biochemistry and Microbiology. 43, 567-582. Buschhorn, H., Durre, P., and Gottschalk, G., 1989. Production and utilization of ethanol by the homoacetogen Acetobacterium woodii. Applied and Environmental Microbiology. 55, 1835-1840. Chalk, S. G., and Miller, J. F., 2006. Key challenges and recent progress in batteries, fuel cells, and hydrogen storage for clean energy systems. Journal of Power Sources. 159, 73-80. Christensen, J. M., Mortensen, P. M., Trane, R., Jensen, P. A., and Jensen, A. D., 2009. Effects of H2S and process conditions in the synthesis of mixed alcohols from syngas over alkali promoted cobalt-molybdenum sulfide. Applied Catalysis A: General. 366, 29-43. Ciambelli, P., Palma, V., Palo, E., and Iaquaniello, G., 2009. Natural gas autothermal reforming: an effective option for a sustainable distributed production of hydrogen in Catalysis for Sustainable Energy Production (eds P. Barbaro and C. Bianchini), Wiley-VCH Verlag GmbH & Co. KGaA, Weinheim, Germany.

48
Clifton-Brown, J. C., Stampfl, P. F., and Jones, M. B., 2004. Miscanthus biomass production for energy in Europe and its potential contribution to decreasing fossil fuel carbon emissions. Global Change Biology. 10, 509-518. Corella, J., Orio, A., and Aznar, P., 1998. Biomass gasification with air in fluidized bed: reforming of the gas composition with commercial steam reforming catalysts. Industrial & Engineering Chemistry Research. 37, 4617-4624. Cotter, J., Chinn, M., and Grunden, A., 2009a. Ethanol and acetate production by Clostridium ljungdahlii and Clostridium autoethanogenum using resting cells. Bioprocess and Biosystems Engineering. 32, 369-380. Cotter, J. L., Chinn, M. S., and Grunden, A. M., 2009b. Influence of process parameters on growth of Clostridium ljungdahlii and Clostridium autoethanogenum on synthesis gas. Enzyme and Microbial Technology. 44, 281-288. Das, A., Coulter, E. D., Kurtz, D. M., Jr., and Ljungdahl, L. G., 2001. Five-Gene Cluster in Clostridium thermoaceticum Consisting of Two Divergent Operons Encoding Rubredoxin Oxidoreductase- Rubredoxin and Rubrerythrin-Type A Flavoprotein- High-Molecular-Weight Rubredoxin. J. Bacteriol. 183, 1560-1567. Dasappa, S., Paul, P. J., Mukunda, H. S., Rajan, N. K. S., Sridhar, G., and Sridhar, H. V., 2004. Biomass gasification technology–a route to meet energy needs. Current Science. 87, 908-916. Datar, R. P., Shenkman, R. M., Cateni, B. G., Huhnke, R. L., and Lewis, R. S., 2004. Fermentation of biomass-generated producer gas to ethanol. Biotechnology and Bioengineering. 86, 587-594. Davila-Vazquez, G., Arriaga, S., Alatriste-Mondragón, F., de León-Rodríguez, A., Rosales-Colunga, L., and Razo-Flores, E., 2008. Fermentative biohydrogen production: trends and perspectives. Reviews in Environmental Science and Biotechnology. 7, 27-45. Demirbas, A., 2005. Hydrogen Production from Biomass via Supercritical Water Extraction. Energy Sources. 27, 1409-1417. Demirbas, A., 2007. Progress and recent trends in biofuels. Progress in Energy and Combustion Science. 33, 1-18. Demirbas, M. F., and Balat, M., 2006. Recent advances on the production and utilization trends of bio-fuels: A global perspective. Energy Conversion and Management. 47, 2371-2381.
49
Do, Y. S., Smeenk, J., Broer, K. M., Kisting, C. J., Brown, R., Heindel, T. J., Bobik, T. A., and DiSpirito, A. A., 2007. Growth of Rhodospirillum rubrum on synthesis gas: Conversion of CO to H2 and poly-beta-hydroxyalkanoate. Biotechnology and Bioengineering. 97, 279-286. Drake, H. L., Acetogenesis, acetogenic bacteria, and the acetyl-CoA "Wood/Ljungdahl" pathway: past and current perspectives. In: H. L. Drake, (Ed.), Acetogenesis, 1994, pp. 3-60. Drake, H. L., Gößner, A. S., and Daniel, S. L., 2008. Old Acetogens, New Light. Annals of the New York Academy of Sciences. 1125, 100-128. Dresselhaus, M. S., and Thomas, I. L., 2001. Alternative energy technologies. Nature. 414, 332-337. Driesprong, G., Jacobsen, B., and Maat, B., 2008. Striking oil: Another puzzle? Journal of Financial Economics. 89, 307-327. Dry, M. E., 2002. The Fischer-Tropsch process: 1950-2000. Catalysis Today. 71, 227-241. Dürre, P., 2007. Biobutanol: An attractive biofuel. Biotechnology Journal. 2, 1525-1534. Eriksson, T., Börjesson, J., and Tjerneld, F., 2002. Mechanism of surfactant effect in enzymatic hydrolysis of lignocellulose. Enzyme and Microbial Technology. 31, 353-364. Ezeji, T. C., Qureshi, N., and Blaschek, H. P., 2007. Bioproduction of butanol from biomass: from genes to bioreactors. Current Opinion in Biotechnology. 18, 220-227. Faaij, A. P. C., 2006. Bio-energy in Europe: changing technology choices. Energy Policy. 34, 322-342. Ferry, J. G., 2003. CO Dehydrogenase. Annual Review of Microbiology. 49, 305-333. Gerhardt, M., Svetlichny, V., Sokolova, T. G., Zavarzin, G. A., and Ringpfeil, M., 1991. Bacterial CO utilization with H2 production by the strictly anaerobic lithoautotrophic thermophilic bacterium Carboxydothermus hydrogenus DSM 6008 isolated from a hot swamp. FEMS Microbiology Letters. 83, 267-271. Gest, H., 1995. A serendipic legacy: Erwin Esmarch's isolation of the first photosynthetic bacterium in pure culture. Photosynthesis Research. 46, 473-478. Goldemberg, J., Coelho, S. T., and Guardabassi, P., 2008. The sustainability of ethanol production from sugarcane. Energy Policy. 36, 2086-2097.

50
Gordillo, G., and Annamalai, K., In press, doi:10.1016/j.fuel.2009.07.018 Adiabatic fixed bed gasification of dairy biomass with air and steam. Fuel. Green, E. M., Boynton, Z. L., Harris, L. M., Rudolph, F. B., Papoutsakis, E. T., and Bennett, G. N., 1996. Genetic manipulation of acid formation pathways by gene inactivation in Clostridium acetobutylicum ATCC 824. Microbiology. 142, 2079-2086. Grethlein, A., Worden, R., Jain, M., and Datta, R., 1990. Continuous production of mixed alcohols and acids from carbon monoxide. Applied Biochemistry and Biotechnology. 24-25, 875-884. Grethlein, A. J., Worden, R. M., Jain, M. K., and Datta, R., 1991. Evidence for production of n-butanol from carbon monoxide by Butyribacterium methylotrophicum. Journal of Fermentation and Bioengineering. 72, 58-60. Gura, T., 2009. Driving biofuels from field to fuel tank. Cell. 138, 9-12. Haider, M. A., Gogate, M. R., and Davis, R. J., 2009. Fe-promotion of supported Rh catalysts for direct conversion of syngas to ethanol. Journal of Catalysis. 261, 9-16. Hamelinck, C. N., Hooijdonk, G. v., and Faaij, A. P. C., 2005. Ethanol from lignocellulosic biomass: techno-economic performance in short-, middle- and long-term. Biomass and Bioenergy. 28, 384-410. Harris, L. M., Blank, L., Desai, R. P., Welker, N. E., and Papoutsakis, E. T., 2001. Fermentation characterization and flux analysis of recombinant strains of Clostridium acetobutylicum with an inactivated solR gene. Journal of Industrial Microbiology and Biotechnology. 27, 322-328. He, J., and Zhang, W.-n., 2008. Research on ethanol synthesis from syngas. Journal of Zhejiang University - Science A. 9, 714-719. Heap, J. T., Pennington, O. J., Cartman, S. T., Carter, G. P., and Minton, N. P., 2007. The ClosTron: A universal gene knock-out system for the genus Clostridium. Journal of Microbiological Methods. 70, 452-464. Henstra, A. M., Sipma, J., Rinzema, A., and Stams, A. J., 2007. Microbiology of synthesis gas fermentation for biofuel production. Current Opinion in Biotechnology. 18, 200-206. Herman, R. G., 2000. Advances in catalytic synthesis and utilization of higher alcohols. Catalysis Today. 55, 233-245.

51
Herrera, S., 2006. Bonkers about biofuels. Nature Biotechnology. 24, 755-760. Himmel, M. E., Ding, S.-Y., Johnson, D. K., Adney, W. S., Nimlos, M. R., Brady, J. W., and Foust, T. D., 2007. Biomass recalcitrance: engineering plants and enzymes for biofuels production. Science. 315, 804-807. http://fossil.energy.gov/programs/powersystems/gasification/gasificationpioneer.html, Pioneering gasification plants. U. S. Department of Energy, 2008 http://newsblaze.com/story/2006020806383900003.mwir/topstory.html, Syngas International Corp. (OTC BB: SYNI) -- Alterative energy big winner in state of union address. News Blaze, 2006. http://www1.eere.energy.gov/biomass/biofuels_initiative.html, Biofuels initiative. U.S. Department of Energy, 2007. http://www1.eere.energy.gov/biomass/pdfs/nbap.pdf, National biofuels action plan. Biomass research and development board, 2008, pp. 24. http://www.afdc.energy.gov/afdc/fuels/stations_counts.html, Alternative fuels and advance vehicles data center. 2009. http://www.biohydrogen.nl/hyvolution, Latest news from Hyvolution. 2009. http://www.cleantech.com/news/4995/coskata-leaks-word-demo-plant-and-r, Coskata leaks word that demo plant is up and running. 2009. http://www.eia.doe.gov/oiaf/ieo/world.html, International energy outlook 2009. http://www.ethanolrfa.org/resource/facts/trade/, Ethanol facts: Trade. 2009. http://www.ineosbio.com/57-Welcome_to_INEOS_Bio.htm, 2009. Pilot plant. http://www.nrel.gov/biomass/pdfs/39436.pdf, From biomass to biofuels: NREL leads the way. In: N. R. E. Laboratory, (Ed.), 2006. http://www.syngasbiofuelsenergy.com/, 2009. http://www.tradingmarkets.com/.site/news/Stock%20News/2239395/, Sapporo breweries, Petrobras to tap biomass for hydrogen fuel 2009.

52
Huber, G. W., Iborra, S., and Corma, A., 2006. Synthesis of transportation fuels from biomass: Chemistry, catalysts, and engineering. Chemical Reviews. 106, 4044-4098. Iglesia, E., 1997. Design, synthesis, and use of cobalt-based Fischer-Tropsch synthesis catalysts. Applied Catalysis A: General. 161, 59-78. Inokuma, K., Nakashimada, Y., Akahoshi, T., and Nishio, N., 2007. Characterization of enzymes involved in the ethanol production of Moorella sp. HUC22-1. Archives of Microbiology. 188, 37-45. Inui, M., Suda, M., Kimura, S., Yasuda, K., Suzuki, H., Toda, H., Yamamoto, S., Okino, S., Suzuki, N., and Yukawa, H., 2008. Expression of Clostridium acetobutylicum butanol synthetic genes in Escherichia coli. Applied Microbiology and Biotechnology. 77, 1305-1316. Ismail, K. S. K., Najafpour, G., Younesi, H., Mohamed, A. R., and Kamaruddin, A. H., 2008. Biological hydrogen production from CO: Bioreactor performance. Biochemical Engineering Journal. 39, 468-477. Jones, D. T., and Woods, D. R., 1986. Acetone-butanol fermentation revisited. Microbiology and Molecular Biology Reviews. 50, 484-524. Jung, G. Y., Jung, H. O., Kim, J. R., Ahn, Y., and Park, S., 1999. Isolation and characterization of Rhodopseudomonas palustris P4 which utilizes CO with the production of H2. Biotechnology Letters. 21, 525-529. Karnholz, A., Küsel, K., Goner, A., Schramm, A., and Drake, H. L., 2002. Tolerance and Metabolic Response of Acetogenic Bacteria toward Oxygen. Appl. Environ. Microbiol. 68, 1005-1009. Kawasaki, S., Watamura, Y., Ono, M., Watanabe, T., Takeda, K., and Niimura, Y., 2005. Adaptive Responses to Oxygen Stress in Obligatory Anaerobes Clostridium acetobutylicum and Clostridium aminovalericum. Appl. Environ. Microbiol. 71, 8442-8450. Kim, S., Seol, E., Mohan Raj, S., Park, S., Oh, Y.-K., and Ryu, D. D. Y., 2008. Various hydrogenases and formate-dependent hydrogen production in Citrobacter amalonaticus Y19. International Journal of Hydrogen Energy. 33, 1509-1515. Kim, Y., Mosier, N. S., and Ladisch, M. R., 2009. Enzymatic digestion of liquid hot water pretreated hybrid poplar. Biotechnology Progress. 25, 340-348. Kirk, T. K., and Farrell, R. L., 1987. Enzymatic "combustion": The microbial degradation of lignin. Annual Review of Microbiology. 41, 465-501.

53
Klasson, K., Cowger, J., Ko, C., Vega, J., Clausen, E., and Gaddy, J., 1990. Methane production from synthesis gas using a mixed culture of R. rubrum, M. barkeri, and M. formicicum. Applied Biochemistry and Biotechnology. 24-25, 317-328. Klasson, K. T., Ackerson, C. M. D., Clausen, E. C., and Gaddy, J. L., 1992a. Biological conversion of synthesis gas into fuels. International Journal of Hydrogen Energy. 17, 281-288. Klasson, K. T., Ackerson, M. D., Clausen, E. C., and Gaddy, J. L., 1991. Bioreactors from synthesis gas fermentations. Resources, Conservation and Recycling. 5, 145-165. Klasson, K. T., Ackerson, M. D., Clausen, E. C., and Gaddy, J. L., 1992b. Bioconverion of synthesis gas into liquid or gaseous fuels. Enzyme and Microbial Technology. 14, 602-608. Klasson, K. T., Ackerson, M. D., Clausen, E. C., and Gaddy, J. L., 1993. Biological conversion of coal and coal-derived synthesis gas. Fuel. 72, 1673-1678. Kowplow, D., Biofuels-at what cost? Government support for ethanol and biodiesel in the United States. The Global Subsidies Initiative (GSI) of the International Institute for Sustainable Development (IISD), Geneva, Swtzerland, 2006. Kusel, K., Karnholz, A., Trinkwalter, T., Devereux, R., Acker, G., and Drake, H. L., 2001. Physiological Ecology of Clostridium glycolicum RD-1, an Aerotolerant Acetogen Isolated from Sea Grass Roots. Appl. Environ. Microbiol. 67, 4734-4741. Kwiatkowski, J. R., McAloon, A. J., Taylor, F., and Johnston, D. B., 2006. Modeling the process and costs of fuel ethanol production by the corn dry-grind process. Industrial Crops and Products. 23, 288-296. Lee, H. S., Kang, S. G., Bae, S. S., Lim, J. K., Cho, Y., Kim, Y. J., Jeon, J. H., Cha, S.-S., Kwon, K. K., Kim, H.-T., Park, C.-J., Lee, H.-W., Kim, S. I., Chun, J., Colwell, R. R., Kim, S.-J., and Lee, J.-H., 2008a. The complete genome sequence of Thermococcus onnurineus NA1 reveals a mixed heterotrophic and carboxydotrophic metabolism. Journal of Bacteriology. 190, 7491-7499. Lee, S. Y., Park, J. H., Jang, S. H., Nielsen, L. K., Kim, J., and Jung, K. S., 2008b. Fermentative butanol production by clostridia. Biotechnology and Bioengineering. 101, 209-228. Leibold, H., Hornung, A., and Seifert, H., 2008. HTHP syngas cleaning concept of two stage biomass gasification for FT synthesis. Powder Technology. 180, 265-270.

54
Liou, J. S.-C., Balkwill, D. L., Drake, G. R., and Tanner, R. S., 2005. Clostridium carboxidivorans sp. nov., a solvent-producing clostridium isolated from an agricultural settling lagoon, and reclassification of the acetogen Clostridium scatologenes strain SL1 as Clostridium drakei sp. nov. International Journal of Systematic and Evolutionary Microbiology. 55, 2085-2091. Liu, J., Zheng, B., Aposhian, H., Zhou, Y., Chen, M., Zhang, A., and Waalkes, M., 2002. Chronic Arsenic Poisoning From Burning High-Arsenic-Containing Coal In Guizhou, China. Journal of the Peripheral Nervous System. 7, 208-208. Ljungdhal, L. G., 1986. The Autotrophic Pathway of Acetate Synthesis in Acetogenic Bacteria. Annual Review of Microbiology. 40, 415-450. Lochner, S., and Bothe, D., 2009. The development of natural gas supply costs to Europe, the United States and Japan in a globalizing gas market--Model-based analysis until 2030. Energy Policy. 37, 1518-1528. Lynd, L., Kerby, R., and Zeikus, J. G., 1982. Carbon monoxide metabolism of the methylotrophic acidogen Butyribacterium methylotrophicum. Journal of bacteriology. 149, 255-263. Mackay, D. M., de Sieyes, N. R., Einarson, M. D., Feris, K. P., Pappas, A. A., Wood, I. A., Jacobson, L., Justice, L. G., Noske, M. N., Scow, K. M., and Wilson, J. T., 2006. Impact of ethanol on the natural attenuation of benzene, toluene, and o-xylene in a normally sulfate-reducing aquifer. Environmental Science & Technology. 40, 6123-6130. Maddox, I. S., 1980. Production of n-butanol from whey filtrate using Clostridium acetobutylicum N.C.I.B. 2951. Biotechnology Letters. 2, 493-498. Maeda, T., Sanchez-Torres, V., and Wood, T., 2007. Enhanced hydrogen production from glucose by metabolically engineered Escherichia coli. Applied Microbiology and Biotechnology. 77, 879-890. Maeda, T., Sanchez-Torres, V., and Wood, T., 2008a. Protein engineering of hydrogenase 3 to enhance hydrogen production. Applied Microbiology and Biotechnology. 79, 77-86. Maeda, T., Sanchez-Torres, V., and Wood, T. K., 2008b. Metabolic engineering to enhance bacterial hydrogen production. Microbial Biotechnology. 1, 30-39. Maness, P. C., Huang, J., Smolinski, S., Tek, V., and Vanzin, G., 2005. Energy generation from the CO oxidation-hydrogen production pathway in Rubrivivax gelatinosus. Applied and Environmental Microbiology. 71, 2870-2074.

55
Maness, P. C., and Weaver, P., 2002. Hydrogen production from a carbon-monoxide oxidation pathway in Rubrivivax gelatinosus. International Journal of Hydrogen Energy. 27, 1407-1411. Maniatis, K., and Millich, E., 1998. Energy from biomass and waste: The contribution of utility scale biomass gasification plants. Biomass and Bioenergy. 15, 195-200. Markov, S., and Weaver, P., 2008. Bioreactors for H2 Production by Purple Nonsulfur Bacteria. Applied Biochemistry and Biotechnology. 145, 79-86. McAloon, A., Taylor, F., Yee, W., Ibsen, K., and Wooley, R., Determining the cost of producing ethanol from corn starch and lignocellulosic feedstocks. In: NREL, (Ed.), Golden, Colorado, 2002. McKendry, P., 2002. Energy production from biomass (part 3): gasification technologies. Bioresource Technology. 83, 55-63. McMillan, J. D., Processes for pretreating lignocellulosic biomass: A review. 1992, pp. Medium: ED; Size: Pages: (45 p). Mermelstein, L. D., Welker, N. E., Bennett, G. N., and Papoutsakis, E. T., 1992. Expression of cloned homologous fermentative genes in Clostridium acetobutylicum ATCC 824. Biotechnology (N Y). 10, 190-195. Mosier, N., Wyman, C., Dale, B., Elander, R., Lee, Y. Y., Holtzapple, M., and Ladisch, M., 2005. Features of promising technologies for pretreatment of lignocellulosic biomass. Bioresource Technology. 96, 673-686. Najafpour, G., and Younesi, H., 2006. Ethanol and acetate synthesis from waste gas using batch culture of Clostridium ljungdahlii. Enzyme and Microbial Technology. 38, 223-228. Najafpour, G., and Younesi, H., 2007. Bioconversion of synthesis gas to hydrogen using a light-dependent photosynthetic bacterium, Rhodospirillum rubrum. World Journal of Microbiology and Biotechnology. 23, 275-284. Najafpour, G., Younesi, H., and Mohamed, A. R., 2003. Continuous hydrogen production via fermentation of synthesis gas. Petroleum and Coal. 45, 154-158. Najafpour, G., Younesi, H., and Mohamed, A. R., 2004. Effect of organic substrate on hydrogen production from synthesis gas using Rhodospirillum rubrum, in batch culture. Biochemical Engineering Journal. 21, 123-130.

56
Nath, K., and Das, D., 2003. Hydrogen from biomass. Current Science. 85, 265-271. Nath, K., and Das, D., 2004. Improvement of fermentative hydrogen production: various approaches. Applied Microbiology and Biotechnology. 65, 520-529. Ng, J. C., Wang, J., and Shraim, A., 2003. A global health problem caused by arsenic from natural sources. Chemosphere. 52, 1353-1359. O'brien, D., and Wolverton, M., 2009. The relationship of ethanol, gasoline and oil prices. AgMRC Renewable Energy Newsletter. Agricultural Marketing Resource Letter. O'Sullivan, A., 1997. Cellulose: the structure slowly unravels. Cellulose. 4, 173-207. Oh, Y.-K., Seol, E.-H., Kim, J. R., and Park, S., 2003. Fermentative biohydrogen production by a new chemoheterotrophic bacterium Citrobacter sp. Y19. International Journal of Hydrogen Energy. 28, 1353-1359. Ohta, K., Beall, D. S., Mejia, J. P., Shanmugam, K. T., and Ingram, L. O., 1991. Genetic improvement of Escherichia coli for ethanol production: chromosomal integration of Zymomonas mobilis genes encoding pyruvate decarboxylase and alcohol dehydrogenase II. Applied and Environmental Microbiology. 57, 893-900. Patzek, T., Anti, S. M., Campos, R., ha, K., Lee, J., Li, B., Padnick, J., and Yee, S. A., 2005. Ethanol from corn: clean renewable fuel for the future, or drain on our resources and pockets? Environment, Development and Sustainability. 7, 319-336. Pereto, J. G., Velasco, A. M., Becerra, A., and Lazcano, A., 1999. Comparative biochemistry of CO2 fixation and the evolution of autotrophy. International Microbiology. 2, 3-10. Peters, D., 2006. Carbohydrates for fermentation. Biotechnology Journal. 1, 806-814. Phillips, J., Klasson, K., Clausen, E., and Gaddy, J., 1993. Biological production of ethanol from coal synthesis gas. Applied Biochemistry and Biotechnology. 39-40, 559-571. Piccolo, C., and Bezzo, F., 2009. A techno-economic comparison between two technologies for bioethanol production from lignocellulose. Biomass and Bioenergy. 33, 478-491. Pimentel, D., Marklein, A., Toth, M., Karpoff, M., Paul, G., McCormack, R., Kyriazis, J., and Krueger, T., 2009. Food Versus Biofuels: Environmental and Economic Costs. Human Ecology. 37, 1-12.
57
Pimentel, D., Patzek, T., and Cecil, G., Ethanol production: Energy, economic, and environmental losses. Reviews of Environmental Contamination and Toxicology, 2007, pp. 25-41. Pimentel, D., and Patzek, T. W., 2005. Ethanol production using corn, switchgrass, and wood; biodiesel production using soybean and sunflower. Natural Resources Research. 14, 65-76. Popovic, A., Dragana, D., and Poloc, P., 2001. Trace and major element pollution originating from coal ash suspension and transport processes. Environment International. 26, 251-255. Quinn, R., Mebrahtu, T., Dahl, T. A., Lucrezi, F. A., and Toseland, B. A., 2004. The role of arsine in the deactivation of methanol synthesis catalysts. Applied Catalysis A: General. 264, 103-109. Qureshi, N., and Ezeji, T. C., 2008. Butanol 'a superior biofuel', production from agricultural residues (renewable biomass): recent progress in technology. Biofuels, Bioproducts and Biorefining. 2, 319-330. Ragsdale, S. W., 1997. The Eastern and Western branches of the Wood/Ljungdahl pathway. Biofactors. 6, 3. Ragsdale, S. W., and Wood, H. G., 1991. Enzymology of the acetyl-CoA pathway of CO2 fixation. Critical Reviews in Biochemistry and Molecular Biology. 26, 261-300. Rajagopalan, S., P. Datar, R., and Lewis, R. S., 2002. Formation of ethanol from carbon monoxide via a new microbial catalyst. Biomass and Bioenergy. 23, 487-493. Ramey, D. E., Butanol: the other alternative fuel. In: A. Eaglesham, R. W. F. Hardy, Eds.), Agricultural Biofuels: Technology, sustainability and Profitability, Vol. NABC Report 19, 2007, pp. 264. Rey, F. E., Heiniger, E. K., and Harwood, C. S., 2007. Redirection of metabolism for biological hydrogen production. Applied and Environmental Microbiology. 73, 1665-1671. Rogers, P., Jeon, Y., Lee, K., and Lawford, H., Zymomonas mobilis for Fuel Ethanol and Higher Value Products. Biofuels, 2007, pp. 263-288. Russell, M. J., and Martin, W., 2004. The rocky roots of the acetyl-CoA pathway. Trends in Biochemical Sciences. 29, 358-363. Saha, B., 2003. Hemicellulose bioconversion. Journal of Industrial Microbiology and Biotechnology. 30, 279-291.
58
Sakai, S., Nakashimada, Y., Inokuma, K., Kita, M., Okada, H., and Nishio, N., 2005. Acetate and ethanol production from H2 and CO2 by Moorella sp. using a repeated batch culture. Journal of Bioscience and Bioengineering. 99, 252-258. Sakai, S., Nakashimada, Y., Yoshimoto, H., Watanabe, S., Okada, H., and Nishio, N., 2004. Ethanol production from H2 and CO2 by a newly isolated thermophilic bacterium, Moorella sp. HUC22-1. Biotechnology Letters. 26, 1607-1612. Sastri, B., and Lee, A., World biofuels production potential understanding the challenges to meeting the U.S. renewable fuel standard. 2008, pp. Medium: ED. Schlapbach, L., and Zuttel, A., 2001. Hydrogen-storage materials for mobile applications. Nature. 414, 353-358. Schmer, M. R., Vogel, K. P., Mitchell, R. B., and Perrin, R. K., 2008. Net energy of cellulosic ethanol from switchgrass. Proceedings of the National Academy of Sciences. 105, 464-469. Shapovalov, O., and Ashkinazi, L., 2008. Biobutanol: Biofuel of second generation. Russian Journal of Applied Chemistry. 81, 2232-2236. Sheehan, J., and Himmel, M., 1999. Enzymes, energy, and the environment: A strategic perspective on the U.S. Department of Energy's research and development activities for Bioethanol. Biotechnology Progress. 15, 817-827. Shu, X., and Wiesner, T. F., Biological production of ethanol from CO2 produced by a fossil-fueled power plant. Industrial Electronics and Applications, 2008. ICIEA 2008. 3rd IEEE Conference on, 2008, pp. 1814-1819. Sipma, J., Henstra, A. M., Parshina, S. N., Lens, P. N. L., Lettinga, G., and Stams, A. J. M., 2006. Microbial CO Conversions with Applications in Synthesis Gas Purification and Bio-Desulfurization. Critical Reviews in Biotechnology. 26, 41-65. Smith, K. D., T., K. K., Ackerson, M. D., Clausen, E. C., and GADDY, J. L., 1991. COS degradation by selected CO-utilizing bacteria. Applied Biochemistry and Biotechnology. 28/29, 787-796. Smith, K. J., and Anderson, R. B., 1983. The higher alcohol synthesis over promoted Cu/ZnO catalysts. The Canadian Journal of Chemical Engineering. 61, 40-45. Sokolova, T., Gonzalez, J., Kostrikina, N., Chernyh, N., Tourova, T., Kato, C., Bonch-Osmolovskaya, E., and Robb, F., 2001. Carboxydobrachium pacificum gen. nov., sp. nov., a
59
new anaerobic, thermophilic, CO-utilizing marine bacterium from Okinawa Trough. International Journal of Systematic and Evolutionary Microbiology. 51, 141-149. Sokolova, T. G., Kostrikina, N. A., Chernyh, N. A., Tourova, T. P., Kolganova, T. V., and Bonch-Osmolovskaya, E. A., 2002. Carboxydocella thermautotrophica gen. nov., sp. nov., a novel anaerobic, CO-utilizing thermophile from a Kamchatkan hot spring. International Journal of Systematic and Evolutionary Microbiology. 52, 1961-1967. Sokolova, T. G., Gonzalez, J. M., Kostrikina, N. A., Chernyh, N. A., Slepova, T. V., Bonch-Osmolovskaya, E. A., and Robb, F. T., 2004a. Thermosinus carboxydivorans gen. nov., sp. nov., a new anaerobic, thermophilic, carbon-monoxide-oxidizing, hydrogenogenic bacterium from a hot pool of Yellowstone National Park. International Journal of Systematic and Evolutionary Microbiology. 54, 2353-2359. Sokolova, T. G., Jeanthon, C., Kostrikina, N. A., Chernyh, N. A., Lebedinsky, A. V., Stackebrandt, E., and Bonch-Osmolovskaya, E. A., 2004b. The first evidence of anaerobic CO oxidation coupled with H2 production by a hyperthermophilic archaeon isolated from a deep-sea hydrothermal vent. Extremophiles. 8, 317-323. Sokolova, T. G., Kostrikina, N. A., Chernyh, N. A., Kolganova, T. V., Tourova, T. P., and Bonch-Osmolovskaya, E. A., 2005. Thermincola carboxydiphila gen. nov., sp. nov., a novel anaerobic, carboxydotrophic, hydrogenogenic bacterium from a hot spring of the Lake Baikal area. International Journal of Systematic and Evolutionary Microbiology. 55, 2069-2073. Sokolova, T., Hanel, J., Onyenwoke, R., Reysenbach, A. L., Banta, A., Geyer, R., González, J., Whitman, W., and Wiegel, J., 2007. Novel chemolithotrophic, thermophilic, anaerobic bacteria Thermolithobacter ferrireducens gen. nov., sp. nov. and Thermolithobacter carboxydivorans sp. nov. Extremophiles. 11, 145-157. Solomon, B. D., and Johnson, N. H., 2009. Valuing climate protection through willingness to pay for biomass ethanol. Ecological Economics. 68, 2137-2144. Soni, C. G., Wang, Z., Dalai, A. K., Pugsley, T., and Fonstad, T., 2009. Hydrogen production via gasification of meat and bone meal in two-stage fixed bed reactor system. Fuel. 88, 920-925. Spath, P. L., and Dayton, D. C., Preliminary screening: Technical and economic assessment of synthesis gas to fuels and chemicals with emphasis on the potential for biomass-derived syngas. Other Information: PBD: 1 Dec 2003, 2003, pp. Medium: ED; Size: 160 pages. Spivey, J. J., and Egbebi, A., 2007. Heterogeneous catalytic synthesis of ethanol from biomass-derived syngas. Chemical Society Reviews. 30.

60
Steen, E., Chan, R., Prasad, N., Myers, S., Petzold, C., Redding, A., Ouellet, M., and Keasling, J., 2008. Metabolic engineering of Saccharomyces cerevisiae for the production of n-butanol. Microbial Cell Factories. 7, 36. Steffen, K. T., Cajthaml, T., Snajdr, J., and Baldrian, P., 2007. Differential degradation of oak (Quercus petraea) leaf litter by litter-decomposing basidiomycetes. Research in Microbiology. 158, 447-455. Subramani, V., and Gangwal, S. K., 2008. A review of recent literature to search for an efficient catalytic process for the conversion of syngas to ethanol. Energy & Fuels. 22, 814-839. Sun, Y., and Cheng, J., 2002. Hydrolysis of lignocellulosic materials for ethanol production: a review. Bioresource Technology. 83, 1-11. Surisetty, V. R., Tavasoli, A., and Dalai, A. K., 2009. Synthesis of higher alcohols from syngas over alkali promoted MoS2 catalysts supported on multi-walled carbon nanotubes. Applied Catalysis A: General. 365, 243-251. Tanner, R. S., Miller, L. M., and Yang, D., 1993. Clostridium ljungdahlii sp. nov., an Acetogenic Species in Clostridial rRNA Homology Group I. International Journal of Systematic Bacteriology. 43, 232-236. Takeguchi, T., Yanagisawa, K.-i., Inui, T., and Inoue, M., 2000. Effect of the property of solid acid upon syngas-to-dimethyl ether conversion on the hybrid catalysts composed of Cu-Zn-Ga and solid acids. Applied Catalysis A: General. 192, 201-209. Takeuchi, K., Matsukaki, T., Arakawa, H., and Sugi, Y., 1985. Synthesis of ethanol from syngas over Co-Re-Sr/SiO2 Catalysts. Applied Catalysis. 18, 325-334. Tijmensen, M. J. A., Faaij, A. P. C., Hamelinck, C. N., and van Hardeveld, M. R. M., 2002. Exploration of the possibilities for production of Fischer Tropsch liquids and power via biomass gasification. Biomass and Bioenergy. 23, 129-152. Tomas, C. A., Welker, N. E., and Papoutsakis, E. T., 2003. Overexpression of groESL in Clostridium acetobutylicum results in increased solvent production and tolerance, prolonged metabolism, and changes in the cell's transcriptional program. Applied and Environmental Microbiology. 69, 4951-4965. Tonkovich, A. Y., Zilka, J. L., LaMont, M. J., Wang, Y., and Wegeng, R. S., 1999. Microchannel reactors for fuel processing applications. I. Water gas shift reactor. Chemical Engineering Science. 54, 2947-2951.

61
Uffen, R. L., 1976. Anaerobic growth of a Rhodopseudomonas species in the dark with carbon monoxide as sole carbon and energy substrate. Proceedings of the National Academy of Sciences. 73, 3298-302. Underwood, S. A., Buszko, M. L., Shanmugam, K. T., and Ingram, L. O., 2002. Flux through citrate synthase limits the growth of ethanologenic Escherichia coli KO11 during xylose fermentation. Applied and Environmental Microbiology. 68, 1071-1081. van der Drift, A., van Doorn, J., and Vermeulen, J. W., 2001. Ten residual biomass fuels for circulating fluidized-bed gasification. Biomass and Bioenergy. 20, 45-56. Vega, J., Prieto, S., Elmore, B., Clausen, E., and Gaddy, J., 1989. The Biological production of ethanol from synthesis gas. Applied Biochemistry and Biotechnology. 20-21, 781-797. Vicente, G., Martinez, M., and Aracil, J., 2005. A comparative study of vegetable oils for biodiesel production in Spain. Energy & Fuels. 20, 394-398. Wei, L., Pordesimo, L. O., Igathinathane, C., and Batchelor, W. D., 2009. Process engineering evaluation of ethanol production from wood through bioprocessing and chemical catalysis. Biomass and Bioenergy. 33, 255-266. Wilhelm, D. J., Simbeck, D. R., Karp, A. D., and Dickenson, R. L., 2001. Syngas production for gas-to-liquids applications: technologies, issues and outlook. Fuel Processing Technology. 71, 139-148. Wirl, F., 2008. Why do oil prices jump (or fall)? Energy Policy. 36, 1029-1043. Wood, H. G., Ragsdale, S. W., and Pezacka, P., 1986. The acetyl-CoA pathway of autotrophic growth. FEMS Microbiology Letters. 39, 345-362. Worden, R. M., Grethlein, A. J., Jain, M. K., and Datta, R., 1991. Production of butanol and ethanol from synthesis gas via fermentation. Fuel. 70, 615-619. Wu, M., Ren, Q., Durkin, A. S., Daugherty, S. C., Brinkac, L. M., Dodson, R. J., Madupu, R., Sullivan, S. A., Kolonay, J. F., Haft, D. H., Nelson, W. C., Tallon, L. J., Jones, K. M., Ulrich, L. E., Gonzalez, J. M., Zhulin, I. B., Robb, F. T., and Eisen, J. A., 2005. Life in hot carbon monoxide: the complete genome sequence of Carboxydothermus hydrogenoformans Z-2901. PLoS Genetics. 1, e65. www.iea.org/Textbase/techno/essentials.htm, Hydrogen production and distribution. IEA Energy Technology Essentials, 2007.

62
Xu, R., Yang, C., Wei, W., Li, W.-h., Sun, Y.-h., and Hu, T.-d., 2004. Fe-modified CuMnZrO2 catalysts for higher alcohols synthesis from syngas. Journal of Molecular Catalysis A: Chemical. 221, 51-58. Yang, B., and Wyman, C. E., 2008. Pretreatment: the key to unlocking low-cost cellulosic ethanol. Biofuels, Bioproducts and Biorefining. 2, 26-40. Yepes Rodríguez, R., 2008. Real option valuation of free destination in long-term liquefied natural gas supplies. Energy Economics. 30, 1909-1932. Yomano, L., York, S., Zhou, S., Shanmugam, K., and Ingram, L., 2008. Re-engineering Escherichia coli for ethanol production. Biotechnology Letters. 30, 2097-2103. Yomano, L. P., York, S. W., and Ingram, L. O., 1998. Isolation and characterization of ethanol-tolerant mutants of Escherichia coli KO11 for fuel ethanol production. Journal of Industrial Microbiology and Biotechnology. 20, 132-138. Yoshida, A., Nishimura, T., Kawaguchi, H., Inui, M., and Yukawa, H., 2005. Enhanced hydrogen production from formic acid by formate hydrogen lyase-overexpressing Escherichia coli strains. Applied and Environmental Microbiology. 71, 6762-6768. Younesi, H., Najafpour, G., Ku Ismail, K. S., Mohamed, A. R., and Kamaruddin, A. H., 2008. Biohydrogen production in a continuous stirred tank bioreactor from synthesis gas by anaerobic photosynthetic bacterium: Rhodopirillum rubrum. Bioresource Technology. 99, 2612-2619. Younesi, H., Najafpour, G., and Mohamed, A. R., 2005. Ethanol and acetate production from synthesis gas via fermentation processes using anaerobic bacterium, Clostridium ljungdahlii. Biochemical Engineering Journal. 27, 110-119. Younesi, H., Najafpour, G., and Mohamed, A. R., 2006. Liquid fuel production from synthesis gas via fermentation process in a continuous tank bioreactor (CSTBR) using Clostridium ljungdahlii. Iranian Journal of Biotechnology. 4, 45-53. Zeikus, J., Lynd, L., Thompson, T., Krzycki, J., Weimer, P., and Hegge, P., 1980. Isolation and characterization of a new, methylotrophic, acidogenic anaerobe, the marburg strain. Current Microbiology. 3, 381-386. Zhao, J., and Melaina, M. W., 2006. Transition to hydrogen-based transportation in China: Lessons learned from alternative fuel vehicle programs in the United States and China. Energy Policy. 34, 1299-1309.

63
Zurrer, H., and Bachofen, R., 1979. Hydrogen production by the photosynthetic bacterium Rhodospirillum rubrum. Applied and Environmental Microbiology. 37, 789-793.

64
CHAPTER 2
Metabolic Response of Clostridium ljungdahlii Strains to Oxygen Exposure
Oscar Tirado-Acevedo1, Jimmy L. Gosse2, Mari S. Chinn2, and Amy M. Grunden1
1Department of Microbiology, North Carolina State University, 4548 Thomas Hall, Campus Box 7615, Raleigh, NC 27695-7615; 2Department of Biological and Agricultural Engineering North Carolina State University D S, Weaver Labs 277, Box 7625 Raleigh, NC 27695-7626

65
ABSTRACT
Research in the biofuels area has been moving away from feedstocks that compete
with food supplies. Lignocellulosic biomass has been identified among the renewable energy
sources to have the highest potential to minimize dependency on fossil fuels. Any
carbonaceous material can be converted to syngas (a mixture of CO, CO2, N2, and H2) by
means of gasification. Clostridium ljungdahlii ferments syngas to ethanol resulting in the
conversion of the CO and H2 present in the syngas to ethanol and acetic acid. ATP synthesis
resulting from acetate production skews the final liquid products to higher acetate production
compared to ethanol. There have been previous studies reporting that certain acetogens can
produce higher amounts of ethanol compared to acetate when oxygen is added to the
cultures. For this project, a range of oxygen concentrations was added to the culture
headspace of both C. ljungdahlii wild type and the laboratory derived OTA1 strains. In the
present study, we demonstrate that these acetogens can grow in the presence of oxygen and
that oxygen is consumed in the course of the syngas fermentations. Furthermore, we
demonstrate that addition of oxygen to the cultures improves ethanol to acetate ratios, as well
as total ethanol yields in cultures grown in media with and without reducing agents. In
addition, cell extracts generated from the syngas fermentation cultures exposed to the varying
amounts of oxygen were assayed for oxidative stress enzyme activities, and NADH oxidase
activity was observed; however, catalase activity was not detected. NAD(P)H concentrations
decrease after cultures reach mid-log growth phase suggesting these adenine nucleotides
were utilized in response to oxygen exposure and for acetyl-CoA reduction to ethanol.

66
2.1. Introduction
Acetogenic bacteria (acetogens) form acetate as a final product of fermentation.
This group of organisms is very significant. They are ubiquitous in the environment and
reside at an important step of the anaerobic food chain. Acetogens are indirectly involved in
green-house gas formation. Acetate is considered to be the primary precursor for methane
(CH4) formation (Chauhan and Ogram, 2006). Methane is the second most important
greenhouse gas after CO2 (Frankenberg et al., 2005; Thauer et al., 2008). Furthermore,
approximately 70% of the CH4 produced on earth is produced by methanogens from acetate
(Chauhan and Ogram, 2006). Acetogens can metabolize a wide range of organic substrates
such as sugars, formate, methanol and amino acids (Morton et al., 1993). They are an
important part of the carbon cycle on Earth because of their ability to utilize CO and CO2
through the acetyl-CoA pathway as energy and carbon sources. Acetogens have also been
shown to participate in the anaerobic metabolism of methyl-tert-butyl-ether (MTBE)
(Mackay et al., 2007) as well as the degradation of halogenated compounds (Zinder, 2010).
These compounds are particularly problematic due to their persistence in the environment,
bioaccumulation in various organisms, and cytotoxic effects on wildlife and humans (Luo et
al., 2008; Teuten et al., 2005).
Acetogens have shown potential economical uses as well. Recently, it has been
demonstrated that some acetogens are able to degrade cellulose, converting it directly to
acetate (Karita et al., 2003; Wolin et al., 2003). Also, acetogens have the ability to convert
sugars and synthesis gas (a mixture of mainly CO2, CO and H2) to acetic acid (a valuable
industrial chemical), and/or ethanol, butanol and hydrogen (important biofuels) among other

67
products (Allen et al., 2009; Cotter et al., 2009a; Cotter et al., 2009b; Heiskanen et al., 2007;
Kundiyana et al., 2010; Munasinghe and Khanal; Tirado-Acevedo et al., 2010). Significant
advances have been made by companies for commercialization of syngas fermentation
technologies (Gnansounou and Dauriat, 2010; Munasinghe and Khanal).
Clostridium ljungdahlii (ATCC 49587T) was the first acetogen isolated for its ability
to produce ethanol and acetate from CO (Barik et al., 1988a; Tanner et al., 1993a). Ethanol
to acetate production ratios reported have been as low as 1:9 and as high as 21:1 (Vega et al.,
1989). Besides CO, this bacterium also utilizes a number of other carbon sources including
pyruvate, fructose, and xylose among others. Although a number of studies have been
performed to evaluate the ability of C. ljungdahlii to ferment syngas components and to
improve ethanol production by this organism, few studies have been done from a functional
genomics perspective. However, recently the C. ljungdahlii genome sequence was
published, and a genetic system developed for heterologous butanol production in C.
ljungdahlii was presented (Köpke et al., 2010). It has been found that in addition to the
acetyl-CoA and ethanol fermentation pathways, the C. ljungdahlii genome has genes
encoding reactive oxygen species detoxification enzymes, Pentose Phosphate Pathway (PPP)
enzymes and aldehyde oxidoreductase (AOR).
Acetogens have traditionally been classified as strict anaerobes (Fuchs, 1986),
nevertheless, they have been isolated from different aerobic or microaerobic environments
(Drake et al., 2008). It has been demonstrated these bacteria are equipped with an assortment
of oxidative stress enzymes and that certain acetogens can even reduce oxygen by different
means (Boga and Brune, 2003; Das et al., 2005; Karnholz et al., 2002; Küsel et al., 2001). In

68
addition, it has been suggested that exposing acetogens to microaerobic conditions trigger a
shift in electron flow towards ethanol, lactate, H2, and/or NH4+ production instead of acetate
formation (Drake and Daniel, 2004; Drake et al., 2008; Küsel et al., 2001). Clostridium
ljungdahlii was isolated from a microaerobic environment (Tanner et al., 1993a). In
addition, preliminary data suggests that this bacterium can tolerate relatively high
concentrations of O2 in the gas phase. Therefore, the objectives of this study were to
determine the tolerance, metabolic, and physiological response of C. ljungdahlii toward O2.
2.2 Materials and Methods
2.2.1 Organisms and inoculum preparation
Clostridium ljungdahlii (ATCC 55383), an acetogen isolated from chicken waste, and
Clostridium ljungdahlii-OTA1, a laboratory derived strain, were grown on a modified
Reinforced Clostridial Medium (mRCMfs). This medium contained (per liter, pH 6.8):
proteose peptone (10 g), beef extract (10 g), yeast extract (3 g), fructose (5 g), 5 mg/mL
resazurin solution (0.1%, w/v final), 50 ml PETC salt solution [(per L): NH4Cl (20 g), KCl
(2 g), MgSO4.7H2O (4 g), NaCl (16 g), KH2PO4 (2 g), and CaCl2 (0.4 g)], 10 ml PETC trace
element solution [(per L): nitrilotriacetic acid (2 g), MnCl2.4H2O (1.3 g), FeSO4.7H2O
(0.4 g), CoCl2.6H2O (0.2 g), ZnSO4.7H2O (0.2 g), CuCl2.2H2O (0.02 g), NiCl2.6H2O
(0.02 g), Na2MoO4.2H2O (0.02 g), Na2SeO3 (0.02 g), and Na2WO4.2H2O (0.025 g)] and 10
ml modified Wolfe’s vitamin solution [(per L): biotin (2 mg), folic acid (2 mg), pyridoxine
(10 mg), thiamine HCl (5 mg), riboflavin (5 mg), nicotinic acid (5 mg), calcium D (+)
pantothenate (5 mg), vitamin B12 (5 mg), p-aminobenzoic acid (5 mg), and lipoic acid

69
(thioctic acid) (5 mg)]. The medium was prepared and dispensed in 160 ml serum bottles (50
ml medium/bottle). Bottles were sealed with butyl rubber stoppers and aluminum seals,
connected to a vacuum manifold using a needle and a 0.22 µm filter and made anaerobic by
cycling three times (30 s cycles) between vacuum headspace evacuation and sparging with
artificial synthesis gas (a pure bottled mixture containing 20% CO, 20% CO2, 10% H2 with
N2 balance). The bottles were then autoclaved for 30 min (121 °C, 15 psig). Prior to
inoculation, when needed, cysteine–HCl (1 ml 2.5% w/v, 0.5 g final) and sodium sulfide (1
ml 2.5% w/v, 0.5 g final), were added to the bottles. The culture bottles were then inoculated
with 5 ml freezer stock cells and incubated with shaking at 100 rpm at 37°C. After 24 h, 2.5
ml of culture were transferred to fresh medium and incubated as above. After 12 h, 2.5 ml of
actively growing cells were transferred to fresh medium and incubated as above. After
inoculation, any excess pressure was released from the bottles by inserting a needle
connected to a 0.22 µm filter and a hose with its end immersed in a water trap. After 12 h of
incubation, O2 was injected by syringe at the indicated concentration (headspace volume).
Liquid and gas samples were taken at 0, 12, 24, 48, and 72 h. Results are reported as an
average of six replicates.
2.2.2 Gas and liquid product analysis
Headspace gas samples were collected using a sample lock, 5 ml gas-tight syringe
(SGE, Ringwood, Australia). The samples were analyzed by gas chromatography using an
Agilent 7890A gas chromatograph containing a 13823 molsieve 5 Å zeolite molecular sieve
packed stainless steel column (6 ft x 1/8 in. i.d. Supelco) and a thermal conductivity detector.

70
Argon was used as the carrier gas at a flow rate of 30 ml/min. The injector and detector
temperatures were 150 °C and 250 °C respectively, and the oven temperature was 160 °C.
Liquid samples (500 µl) were acidified with 125 µl 25% m-phosphoric acid. The
acidified samples were centrifuged for 10 min at 14,000 x g at room temperature. The sample
supernatants were analyzed for ethanol and acetate concentrations by gas chromatography
using an Agilent 7890A gas chromatograph containing a 0.25 µm J & W DB-FFAP column
(30 m x 0.32 mm i.d.) and a flame ionization detector. Argon was used as the carrier gas at a
flow rate of 30 ml/min. The injector and detector temperatures were 250 °C and the oven
temperature 160 °C.
2.2.3 Intracellular enzyme assays
Cell extracts were prepared as follows, 694 ml of sterile, modified un-reduced RCMfs
in 2 L stoppered bottles were inoculated with 5% (total volume) mid-log C. ljungdahlii
culture. These cultures were grown as above for 12 h to an O.D.600 of 0.3 – 0.4.
Experimental bottles were treated with 6 % O2 (headspace volume) and returned to the
incubator. After 2 h (early response) or 24 h incubation (later response), cultures were
transferred to an anaerobic chamber and dispensed into centrifuge bottles. The bottles were
sealed and centrifuged (25 min at 11,000 x g, 4 °C). The cell pellets were washed with 40 ml
anaerobic potassium phosphate buffer (50 mM, pH7.0) and centrifuged as described above.
Cell pellets were resuspended in 3 ml anaerobic potassium phosphate buffer (50 mM, pH7.0)
per gram of wet cell pellet. Five hundred microliters of the cell suspension were transferred
71
to 2 ml screw cap tubes. The cell suspensions were either processed immediately for assays
or stored at -80 °C.
Five hundred microliters of 0.1 mm disruption glass beads (RPI, Illinois, USA) were
added to the tubes. Samples were vortexed horizontally (10 min, maximum speed) using a
MoBio vortex adapter 13000-V1 for Vortex-Genie 2® (MoBio, California, USA), and
centrifuged (10 min, 21,000 x g, 4 °C). Supernatants were collected and kept on ice for
assays. All assays were carried out in 3 ml total volume at 25 °C in anaerobic cuvettes
except for the superoxide dismutase assay that was performed aerobically in 96-well plates.
All enzyme assays are reported as an average of six replicates, whereas the nucleotide pool
measurements represent three replicates.
NADH or NADPH oxidase was assayed as described by Stanton and Jensen, 1993.
Reactions were initiated by adding cell extract (10-100 µg protein). Catalase was assayed by
measuring the disappearance of H2O2 at 340 nm (Hassan and Fridovich, 1978). The assay
contained, 2 ml 50 mM potassium phosphate buffer pH 7.0 and 1 ml 59 mM H2O2 solution
(150 µL 30% H2O2 in 25 mL 50 mM, pH 7.0 potassium phosphate buffer). This mix should
give an Abs240 of 0.858 ± 0.02. The catalase reactions were initiated by adding cell extract
(10-100 µg protein). Peroxidase was assayed as described by Poole and Ellis, 1996, with the
following modification, 200 µM NADH or NADPH (final concentration) was used. SOD
activity was determined using a commercially available WST SOD assay kit (Dojindo
Laboratories, Kumamoto, Japan) (Peskin and Winterbourn, 2000). This kit uses the water-
soluble tetrazolium salt WST-1 which produces a formazan dye upon reduction with a
superoxide anion. This reduction rate is linearly related to xanthine oxidase activity, which is
72
inhibited by SOD. Therefore, the 50% inhibition activity of SOD can be determined by the
colorimetric method. Sample volumes were adjusted so that a 10 µg protein amount was
loaded per well. Enzyme activity, defined as percent inhibition of WST-1 reduction, was
calculated according to the manufacturer’s protocol using the formula SOD activity
(inhibition rate %) = {[(Ablank 1 - Ablank 3) - (Asample - Ablank 2)]/ (Ablank 1 - Ablank 3)} x 100,
where blank 1 lacks sample solution, blank 2 lacks xanthine oxidase solution and blank 3
lacks both sample and xanthine oxidase solutions.
Alcohol dehydrogenase assays contained 1.5 ml 100 mM Tris-HCl pH 8.5, 0.5 ml 2M
ethanol, and 1 ml of 0.025 M NAD+ or NADP+. Reactions were initiated by adding cell
extract (10-100 µg protein) and the appearance of NADH or NADPH was measured at 340
nm. Acetaldehyde dehydrogenase assays were performed as described in Clark and Cronan,
1980, in which the appearance of NADH or NADPH was measured at 340 nm.
Glucose-6-P dehydrogenase and 6-P-gluconate dehydrogenase were assayed as
described by Sugimoto and Shiio, 1987a and Sugimoto and Shiio, 1987b by measuring the
increase in absorbance at 340 nm of NADPH with the following modification, the reaction
mixture contained 50 mM Tris-HCl buffer, pH 7.5. One unit of the enzyme activity was
defined as the amount catalyzing the formation of 1 nmol of NADPH per min.
2.2.4 Quantitative analysis of intracellular pyridine nucleotide pools
Pyridine nucleotides were extracted as in (Wimpenny and Firth, 1972). In brief,
NAD+ and NADP+ were extracted with HCl, while NADH and NADPH were extracted with
KOH from cells after 2 h (early response) or 24 h (later response) of 6 % headspace v/v

73
oxygen exposure. Cells were grown on un-reduced mRCMfs as above. The concentrations
of pyridine nucleotides in extracts were measured by spectrophotometric enzyme assays as in
(Klingenberg, 1985).
2.2.5 Additional analytical methods
Growth was measured as optical density at 600 nm. Protein quantification in cell
extracts was performed using Bio-Rad’s Protein Assay Dye Reagent (Bio-Rad, Hercules,
CA, USA), according to manufacturer’s instructions. The amount of fructose present in the
culture media was determined by high-performance liquid chromatography as follows.
Liquid samples (600 µl) were centrifuged (10 min, 14,000 x g, room temperature).
Supernatant was filtered though a 0.22 µm syringe filter and analyzed using a Shimadzu
LC20 liquid chromatograph containing a HPX-87H column maintained at 65 °C. Sulfuric
acid (5 mM) was used as the eluent at a rate of 0.6 ml/min.
To determine cell density 11 ml of culture were sampled from growing cells. One ml
was used for O.D.600 reading while 10 ml of culture were filtered through a disposable pre-
weighed and pre-dried 22 µm syringe filter. Flow through was discarded. Filter and cells
were washed by passing 10 ml 50 mM phosphate buffer pH 7.0. Filter with cells was then
incubated at 80°C. These were weighed every 24 h until constant weight. The optical
densities were plotted against their corresponding dry cell weights yielding a linear
relationship between measured O.D.600 nm and culture densities (mg/L). The relationship
between optical density and dry cell weight was found to be 312 and 353 mg dry cells/L per
O.D.600 unit for C. ljungdahlii-WT and C. ljungdahlii-OTA1 respectively.
74
2.3. Results
2.3.1 Effects of oxygen on C. ljungdahlii growth
In all of our experiments, cultures reached stationary phase by 48 h. C. ljungdahlii
strains were unexpectedly resistant to various concentrations of oxygen in the gas phase (Fig.
2-1 and Appendix Figs. A-1, A-3, A-5 and A-7). C. ljungdahlii-WT grew in reduced
medium containing up to 8% O2 with no apparent differences in cell density when compared
to control cultures (Fig. 2-1A). C. ljungdahlii-OTA1 also grew in reduced medium
containing up to 8% O2 in the gas phase. Nevertheless, growth was significantly reduced
(p<0.05) in these cells after 12 h of O2 exposure when compared to control cultures (Fig. 2-
1B). Cell growth was inhibited when either WT or OTA1 cultures were exposed to 12% O2
in reduced medium.
Reducing agents are regularly used to remove O2 traces from the media as well as to
lower the redox potential in the medium (Chalmers and Taylor-Robinson, 1979). Because of
that the oxygen exposure growth studies performed for cells grown with reducing agents in
their media cannot necessarily be relied upon to provide an accurate assessment of the
Clostridium cells resistance to oxygen exposure. Therefore, we removed both cysteine and
ammonium sulfide from the medium (un-reduced medium) and proceeded to expose C.
ljungdahlii to different O2 concentrations. Absence of reducing agents in the medium did not
have an effect in growth for either of the C. ljungdahlii species, since, as in control
experiments, cell numbers were similar in both reduced and unreduced media (Fig 2-1C and
D). C. ljungdahlii species were also capable of growing in unreduced media containing
relatively high amounts of O2 in the gas phase (Fig. 2-1 C, D, and Appendix Figs. A-3 and A-

75
7). As in reduced media, C. ljungdahlii-WT showed no differences in growth when the
culture was exposed to O2 compared to control cultures (Fig. 2-1C). As expected, cultures
grown in un-reduced media showed less resistance to O2 than cells grown in reduced media.
Unlike C. ljungdahlii-WT, C. ljungdahlii-OTA1 growth was significantly reduced (p<0.05)
when cells were exposed to 6% O2 when compared to control cultures (Fig. 2-1 D). C.
ljungdahlii-WT and –OTA1 cultures failed to continue growth when exposed to 10% O2 and
8% O2 respectively, indicating that the OTA1 strain was more sensitive to O2 exposure than
the WT strain.
2.3.2 Effects of oxygen on ethanol production
Both in control as well as O2 exposed conditions, C. ljungdahlii –OTA1 produced
significantly higher (p < 0.05) concentrations of ethanol than C. ljungdahlii-WT (Fig. 2-2).
Ethanol production in C. ljungdahlii-WT reached its peak at 683 mg/L after 48 h of growth
in reduced medium (Fig. 2-2A). When these cells were exposed to 8% O2 in the gas phase,
the amount of ethanol produced was significantly higher (p < 0.05). Ethanol production
continued beyond 48 h with a production of 1.4 g/L at 72 h. This shows approximately
100% increase in ethanol production when compared to control cells. C. ljungdahlii-OTA1
strain growing in reduced control medium also reached maximum ethanol production at 48 h
with 1.2 g/L produced (Fig. 2-2B). It is important to note that in control experiments, OTA1
produced more than 75 % more ethanol than the WT strain (p < 0.05). As with WT, when C.
ljungdahlii-OTA1 cells were exposed to 8% O2, the amount of ethanol produced was
significantly higher (p < 0.05). Ethanol accumulation continued past 48 h with a production

76
of 2.0 g/L at 72 h; a 66 % increase compared to the 0% oxygen control experiments and 46%
higher when compared to C. ljungdahlii-WT exposed to 8% O2 (p < 0.05). Neither strain had
significant ethanol production when the headspace was supplemented with 12% O2 because
of poor growth (Fig 2-2A and B). Generally, ethanol production by both C. ljungdahlii-WT
and OTA1 strains ceased after 72 h (data not shown). For this reason experiments were
ended after 72 h of growth.
When grown in un-reduced medium, C. ljungdahlii strains produced less ethanol
when compared to cells grown in reduced media (Fig. 2-2C, D). These results were expected
as reducing agents have previously been shown to enhance ethanol production from syngas
(Atiyeh et al., 2009; Klasson et al., 1992c). Ethanol production in C. ljungdahlii-WT strain
reached 247 mg/L at 24 h and showed minimal increases in ethanol accumulation at later
time points (Fig. 2-2C). When these cells were exposed to 8% O2 in the gas phase, ethanol
production was maintained at increasing levels until 48 h. These cultures also had
significantly higher (p < 0.05) ethanol production (741 mg/L) than the 0% O2 control
experiment. A 200 % increase in ethanol production in C. ljungdahlii-WT control versus O2
treated cultures in un-reduced medium was observed. The C. ljungdahlii-WT strain was
unable to produce ethanol when the headspace was supplemented with 10% O2. In control
experiments, C. ljungdahlii-OTA1 strain continued ethanol production until reaching a
maximum (509 mg/L) after 48 h (Fig. 2-2D). When the OTA1 cultures were exposed to 6%
O2, ethanol production was increased by approximately 120% (1109 mg/L). When we
compare both strains exposed to 6% O2, C. ljungdahlii –OTA1 produced 50 % more ethanol

77
than the wild type strain. When exposed to 8% O2 ethanol production was negligible for the
OTA1 strain.
2.3.3 Effects of oxygen on acetate production
C. ljungdahlii, as do most acetogens, gains an ATP molecule when acetate is made
from acetyl-CoA (Russell and Martin, 2004). Therefore, because of this energetic benefit, it
produces considerably more acetate than ethanol. We see this in our experiments as C.
ljungdahlii strains produce as much as 22 times more acetate than ethanol (Fig. 2-2, 2-3).
When growing in reduced medium, C. ljungdahlii-WT strain, accumulated acetate until 48 h
of growth in the absence of O2 in the gas phase (Fig. 2-3A). When these cells were exposed
to 8% O2 the rate of acetate production decreased; however, the acetate concentration reached
similar amounts as in control experiments (Fig. 2-3A). C. ljungdahlii-OTA1 strain growing
in reduced medium also stopped acetate production by 48 h in control experiments (Fig. 2-
3B). As in the wild type strain, acetate formation rate decreased when C. ljungdahlii-OTA1
cells were exposed to 8% O2. Nevertheless, the final acetate concentration was comparable
to control experiments (Fig. 2-3B). Under both control and O2 exposed conditions, C.
ljungdahlii-WT produced significantly (p < 0.05) more acetate than C. ljungdahlii-OTA1,
33% and 45% higher amounts, respectively. Both strains cease acetate production when 12%
O2 was added in the gas phase because of poor culture growth.
In unreduced medium with no O2 in the headspace, C. ljungdahlii-WT produced the
highest observed acetate concentration of 7.3 g/L. Acetate production continued until 72 h
(Fig. 2-3C). Again, cells exposed to O2 showed a decrease in acetate production rate;

78
however, acetate concentration reached similar levels compared to control cells. C.
ljungdahlii -OTA1 growing in unreduced medium continued to produce acetate until 48 h.
When these cells were exposed to 6% O2, acetate continued to accumulate until 72 h of
growth. However, acetate in O2 exposed cells was 35% lower (p < 0.05) than in control cells
(Fig. 2-3D). In unreduced medium C. ljungdahlii-WT also produced significantly (p < 0.05)
more acetate than C. ljungdahlii-OTA1, 33% and 53% higher amounts in control and O2
exposure experiments, respectively. We observed that under all our conditions, regardless of
the medium, C .ljungdahlii-OTA1 produced significantly less acetate (p < 0.05) than the wild
type strain (Fig. 2-3). Acetate production in both wild type and OTA1 strains did not occur
when cells were exposed to 10% and 8% O2 respectively. Table 2-1 summarizes the effects
of O2 exposure on liquid products accumulation for the C. ljungdahlii-WT and –OTA1
strains.
2.3.4 Effects of oxygen on syngas utilization
Both C. ljungdahlii-WT and –OTA1 strains growing in reduced medium showed
continuous H2 and CO consumption until cultures reached stationary phase (Fig. 2-4A, 2-
5A). Consumption rate for these gases was 0.004 mmol/h and 0.015 mmol/h, respectively.
CO2 showed a net production throughout the length of the experiment at a rate of 0.025
mmol/h and 0.045 mmol/h for the WT and OTA1 strain, respectively. When cultures were
exposed to 8 % O2, O2 was completely reduced after 36 h of exposure (Fig. 2-4B, 2-5B).
Consumption rates for H2 and CO were not affected by O2 exposure. Nevertheless, the CO2
production rate increased (0.069 mmol/h and .061 mmol/h for C. ljungdahlii-WT and –

79
OTA1, respectively) when cultures were exposed to 8% O2 (Fig. 2-4B, 2-5B). Neither
consumption of CO and H2 nor production of CO2 were observed for cultures supplemented
with 12% O2, (Fig. 2-4C, 2-5C).
C. ljungdahlii-WT and OTA1 growing in unreduced medium also showed
continuous H2 and CO consumption until cultures reached stationary phase (Fig. 2-6A, 2-
7A). Consumption rates for H2 and CO were very similar for both strains (0.0072 and 0.0075
mmol/h for H2 and 0.018 and 0.019 mmol/h for CO for WT and OTA1, respectively. Again
CO2 was produced for the duration of the experiment and was accumulated at a rate of 0.018
mmol/h and 0.025 mmol/h in C. ljungdahlii-WT and OTA1cultures, respectively. When
cultures were exposed to 6% O2, O2 was completely reduced after 36 h of exposure (Fig. 2-
6B, 2-7B). Again, consumption rates for H2 and CO were not affected by O2 exposure; also
the CO2 production rate increased (0.031 mmol/h and .043 mmol/h for C. ljungdahlii-WT
and –OTA1 respectively) when cultures were exposed to 6% O2 (Fig. 2-6B, 2-7B). Neither
consumption nor production of gases was observed for cultures supplemented with 10 % O2,
(Fig. 2-6C, 2-7C).
2.3.5 Effects of oxygen on fructose utilization
The medium used for growth was supplemented with 5 g/L fructose as this carbon
source improves C. ljungdahlii growth, ethanol production and syngas utilization (see
chapter 3). Fructose utilization by C. ljungdahlii strains in control cultures was completed
by 48 h of growth (Fig. 2-8). A reduction of the fructose utilization rate was observed when
the cells were exposed to 8% and 6% O2 in reduced and unreduced medium, respectively.

80
Nevertheless, fructose was always completely utilized by 72 h. When C. ljungdahlii strains
growing in reduced media were exposed to 12% O2, fructose utilization did not appear to
occur. The same results were obtained when C. ljungdahlii-WT and –OTA1 strains growing
in unreduced media were exposed to 10% and 8% O2, respectively.
2.3.6 Enzyme activities associated with oxygen tolerance and ethanol production and
determination of cellular pyridine nucleotide pools
Crude cell extracts from both control and O2 exposed C. ljungdahlii strains had
superoxide dismutase, peroxidase, and oxidase activities. Catalase activity, which detoxifies
hydrogen peroxide, was not detected in any of the cell extracts (Table 2-2). C. ljungdahlii
WT strain had higher SOD activities than the OTA1 strain (24 and 9.5 U/mg for WT and
OTA1 respectively). SOD activity was not detected at early logarithmic phase in control
samples (14 h). However, activity was apparent at mid-logarithmic phase (36 h). SOD was
induced by O2 exposure as activity was detected in exposed cells at early logarithmic phase.
C. ljungdahlii strain crude extracts generally showed higher oxidase and peroxidase
activities (1.5 – 2.4 fold) when NADPH was used as electron donor (Table 2-2).
Nevertheless, this activity was not observed after 36 h of culture growth. Both oxidase and
peroxidase activities were detected early in the growth phase. Activities decreased after mid-
logarithmic growth phase and did not show induction after cells were exposed to O2. In
general, oxidase activity was higher in crude extracts from C. ljungdahlii strain OTA1 and
peroxidase higher in crude extracts from the WT strain.

81
The pentose phosphate pathway plays a crucial role for cells combating oxidative
stress. Specially one of its key enzymes, glucose-6-phosphate-dehydrogenase (G6PDH),
provides reducing equivalents in the form of NADPH for oxygen species reduction
(Lundberg et al., 1999; Pomposiello et al., 2001). Therefore, both NADPH producing
enzymes in the pathway, G6PDH and 6-phospho-gluconate dehydrogenase (6PGDH) were
assayed. Both enzymes were detected in crude extracts from both C. ljungdahlii species
exposed to 6 % O2 (Table 2-3). Activity was detected in extracts after 2 h (14 h of growth) of
O2 exposure but not after 24 h (36 h of growth) of O2 exposure. Importantly, activity was not
detected in cell extracts of control samples that had not been exposed to oxygen. The C.
ljungdahlii-WT strain showed higher G6PDH and 6PGDH activities than the OTA1 strain.
To try to understand why ethanol production was higher in O2 exposed cells,
ethanol production enzymes and pyridine nucleotide pools were measured. NAD+ dependent
aldehyde dehydrogenase (ALDH) activity was found in crude extracts from all samples
(Table 2-4). On the other hand, no activity was detected when NADP+ was provided as the e-
acceptor. ALDH activity was higher in crude extracts from control cells during early
logarithmic phase. However, activity was higher in crude extracts from O2 exposed cells
during mid-logarithmic phase. NAD+ dependent alcohol dehydrogenase (ADH) activity was
also observed in crude extracts from all samples assayed (Table 2-4). When NADP+ was
used as e- acceptor, activity was only detected in crude extracts from C. ljungdahlii strains
during early logarithmic phase. In addition, it was barely detected in samples from strain
OTA1 during mid-logarithmic growth phase. ADH activity was higher in C. ljungdahlii-
OTA1 crude extracts when compared to the WT strain. Once more, activity was higher in

82
extracts made from cells in early logarithmic phase. However, in O2 exposed cells, ADH
activity remained at steady levels after 24 h of O2 exposure, while it dropped more than half
in control cells.
The total pool size of NADH and NAD+ was approximately 2.5 fold higher in C.
ljungdahlii-WT strain control samples during early logarithmic growth phase compared to
the OTA1 strain (Table 2-5). Also, the total pool size of NADPH and NADP+ was higher in
the WT strain control samples at early logarithmic growth phase when compared to the
OTA1 strain (approximately 3 fold higher). In general, the total pool size of NAD(P)H and
NAD(P)+ for both strains decreased as cell numbers increased. In both strains, the
NADPH/NADP+ ratio increases upon exposure to O2 whereas NADH/NAD+ generally
decrease. This is more apparent in the OTA1 strain compared to WT (Table 2-5).
2.4. Discussion
We have shown that C. ljungdahlii strains are capable of tolerating and
enzymatically reducing O2 at concentrations up to 8% in the gas phase (Fig. 2-1). We also
demonstrate that exposure to O2 increases ethanol production as well as decreases acetate
formation (Fig. 2-2, 2-3 and Table 2-1). These results are not surprising as acetate producing
bacteria have been shown to tolerate oxygen in previous studies (Hardy and Hamilton, 1981).
Also, Drake and colleagues have described an acetogen, Clostridium glycolicum RD-1,
capable of tolerating up to 4% O2 in the gas phase in agitated cultures and showing increased
ethanol production at the expense of acetate in glucose-supplemented medium (Kusel et al.,

83
2001). However, we have reported that C. ljungdahlii can tolerate and reduce O2
concentrations of up to 8% in the headspace in agitated unreduced medium (see appendix)
and produces up to 10 fold more ethanol than was reported for C. glycolicum RD-1.
Furthermore, this study demonstrates that C. ljungdahlii is producing ethanol and acetate
while still consuming synthesis gas components (H2 and CO) (Fig. 2-4 and 2-5), presumably
by using the acetyl-CoA pathway, which is known to have enzymes that are readily
inactivated by O2 (Ragsdale and Wood, 1991b). Our results, therefore, suggest that C.
ljungdahlii species have effective enzymes to protect its metabolism from limited oxidative
stress.
Numerous anaerobes posses an array of oxidative stress protection enzymes. These
range from the classic enzymes such as SOD, catalase and NADH oxidase, to more recently
described, unusual enzymes such as SOR, thioredoxin reductase, and rubrerythrin among
others (Brioukhanov et al., 2002; Das et al., 2001; Jenney et al., 1999). In fact, the C.
ljungdahlii genome contains genes coding for at least six oxidative stress protection enzymes
(Köpke et al., 2010). These include SOD, catalase, NADPH flavin oxidoreductase, NADH
oxidase, rubredoxin and rubrerythrin. Cell extracts of C. ljungdahlii showed activities for
SOD, oxidase and peroxidase (using either NADH or NADPH as an e- donor), but not
catalase (Table 2-2). The C. ljungdahlii genome does not contain genes coding for NADPH
oxidase nor peroxidase; nevertheless, NADPH flavin oxidoreductase can show activity
towards O2 (reducing it to H2O2) (Bruchhaus et al., 1998). Also rubrerythrin has peroxidase
activity using NADPH as an e- donor (Coulter et al., 1999). These enzymes (with the

84
exception of SOD), appear to be constitutively expressed as we could detect relatively high
activities in control samples of both C. ljungdahlii strains.
Classic oxidative stress regulator systems such as SoxRS or PerR are not evident in
the genome of this organism. Nevertheless, we saw an increase in NADPH/NADP+ ratio in
C. ljungdahlii-WT strain as a response to O2 exposure (Table 2-5). In addition, oxidase and
peroxidase activities on both WT and OTA1 strains are higher when NADPH is used as e-
donor. NADPH plays a role in biosynthetic anabolism reactions and is required for many
detoxification reactions in bacteria; furthermore, it is produced mainly by the pentose
phosphate pathway (PPP) in response to oxidative stress (Briolat and Reysset, 2002; Kabir
and Shimizu, 2006). The C. ljungdahlii genome has genes that encode for the main enzymes
involved in the PPP. We show that both glucose-6-phosphate dehydrogenase and 6-
phosphogluconate dehydrogenase (responsible for producing NADPH) activities in crude
extracts are up-regulated after exposing the cells to O2 (Table 2-3). These results show
evidence for some level of regulation of oxidative stress response. On the other hand, we do
not observe an increase in NADPH/NADP+ ratio in strain OTA1. This suggests that we may
have missed this increase (happened between O2 exposure and 2 h sampling time) or that
NADPH consumption increased due to O2 exposure. There is evidence that demonstrates
NADPH turnover rate (consumption) can increase as a response to oxidative stress (Emerson
et al., 2003). Higher SOD activity in crude extracts from C. ljungdahlii-WT compared to the
OTA1 strain might explain the higher tolerance to O2 shown by the former versus the latter.
A proposed model for C. ljungdahlii oxidative stress detoxification system is shown in figure
2.9. It has been shown that addition of reducing agents to the culture medium alters e-
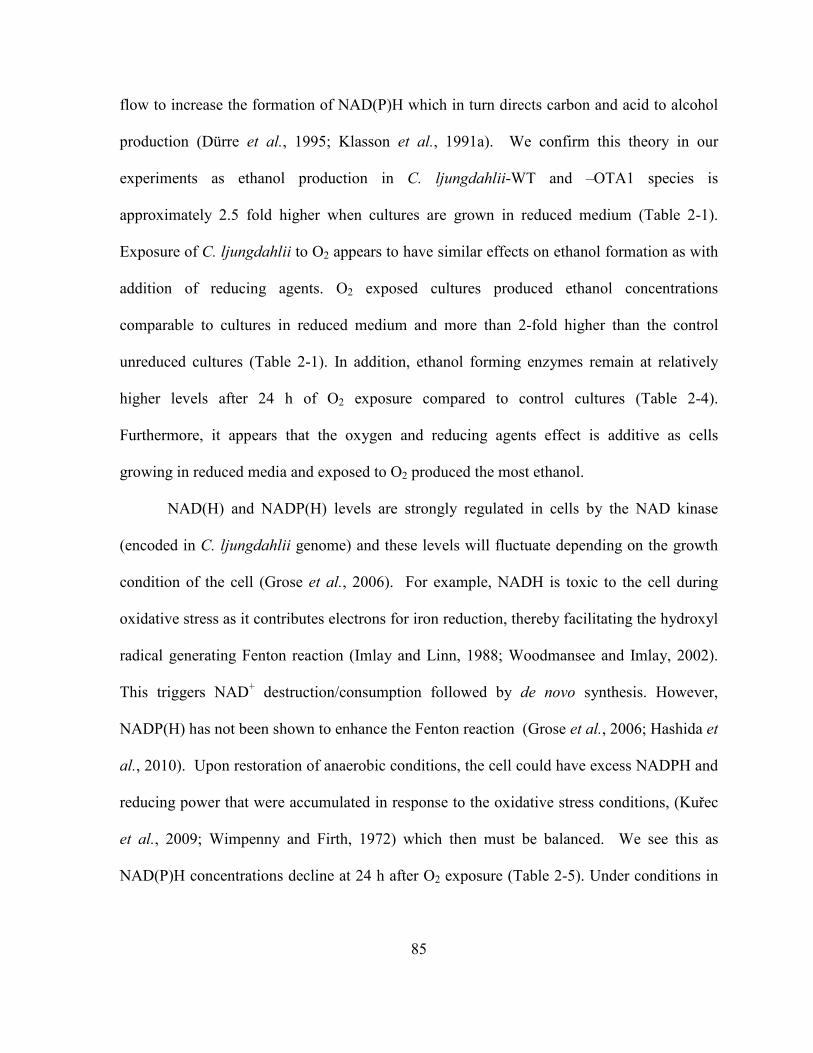
85
flow to increase the formation of NAD(P)H which in turn directs carbon and acid to alcohol
production (Dürre et al., 1995; Klasson et al., 1991a). We confirm this theory in our
experiments as ethanol production in C. ljungdahlii-WT and –OTA1 species is
approximately 2.5 fold higher when cultures are grown in reduced medium (Table 2-1).
Exposure of C. ljungdahlii to O2 appears to have similar effects on ethanol formation as with
addition of reducing agents. O2 exposed cultures produced ethanol concentrations
comparable to cultures in reduced medium and more than 2-fold higher than the control
unreduced cultures (Table 2-1). In addition, ethanol forming enzymes remain at relatively
higher levels after 24 h of O2 exposure compared to control cultures (Table 2-4).
Furthermore, it appears that the oxygen and reducing agents effect is additive as cells
growing in reduced media and exposed to O2 produced the most ethanol.
NAD(H) and NADP(H) levels are strongly regulated in cells by the NAD kinase
(encoded in C. ljungdahlii genome) and these levels will fluctuate depending on the growth
condition of the cell (Grose et al., 2006). For example, NADH is toxic to the cell during
oxidative stress as it contributes electrons for iron reduction, thereby facilitating the hydroxyl
radical generating Fenton reaction (Imlay and Linn, 1988; Woodmansee and Imlay, 2002).
This triggers NAD+ destruction/consumption followed by de novo synthesis. However,
NADP(H) has not been shown to enhance the Fenton reaction (Grose et al., 2006; Hashida et
al., 2010). Upon restoration of anaerobic conditions, the cell could have excess NADPH and
reducing power that were accumulated in response to the oxidative stress conditions, (Kuřec
et al., 2009; Wimpenny and Firth, 1972) which then must be balanced. We see this as
NAD(P)H concentrations decline at 24 h after O2 exposure (Table 2-5). Under conditions in

86
which C. ljungdahlii has high levels of NAD(P)H, it might reduce acetate to aldehyde and
then ethanol by the action of aldehyde oxidoreductase (AOR) enzymes encoded in the
genome. This could also assist the cell in energy conservation by forming ATP by acetate
production then acetaldehyde and ethanol (Köpke et al., 2010). This might explain an
increase of ethanol formation in cultures exposed to oxidative stress.
We have isolated a mutant strain (OTA1) that produces approximately 2-fold more
ethanol than the WT strain, most likely due a higher ethanol dehydrogenase activity (Table 2-
4). We have also shown that is possible to increase ethanol production along with decreasing
acetate formation by exposing C. ljungdahlii to O2. The fact that C. ljungdahlii can tolerate
high O2 concentrations and simultaneously produce higher ethanol concentration, is
significant for its use in the biofuels industry. It is likely that in a syngas fermentation
facility these cells will encounter O2 contamination in the gas stream, either directly from the
syngas or O2 intrusion along the syngas collection/stream process (Datar et al., 2004; Zainal
et al., 2002). Not only would these cells survive this O2 intrusion, the process would benefit
from it, lowering the cost by eliminating the use of reducing agents and stringent anaerobic
environment.

87
0 12 24 36 48 60 720
500
1000
15000% O2
8% O2
12% O2
Culture density (mg/L)
Time (h)
0 20 40 60 800
500
1000
15000% O2
8% O2
12% O2
Time (h)
Culture Density (mg/L)
0 20 40 60 800
500
1000
15000% O2
6% O2
10% O2
Time (h)
Culture Density (mg/L)
0 20 40 60 800
500
1000
15000% O2
6% O2
8% O2
Time (h)
Culture Density (mg/L)
A
DC
B
Figure 2-1. C. ljungdahlii cell growth. A) WT reduced, B) OTA1 reduced, C) WT unreduced, D) OTA1 unreduced.

88
0 12 24 36 48 60 720
500
1000
1500
2000
25000% O2
8% O2
12% O2
Time (h)
Ethanol (mg/L)
0 12 24 36 48 60 720
500
1000
1500
2000
25000% O2
8% O2
12% O2
Time (h)
Ethanol (mg/L)
0 12 24 36 48 60 720
500
1000
1500
2000
25000% O2
6% O2
10% O2
Time (h)
Ethanol (mg/L)
0 12 24 36 48 60 720
500
1000
1500
2000
25000% O2
6% O2
8% O2
Time (h)
Ethanol (mg/L)
C D
BA
Figure 2-2. C. ljungdahlii ethanol production. A) WT reduced, B) OTA1 reduced, C) WT unreduced, D) OTA1 unreduced.

89
0 12 24 36 48 60 720
2000
4000
6000
8000
100000% O2
8% O2
12% O2
Time (h)
Acetate (mg/L)
0 12 24 36 48 60 720
2000
4000
6000
8000
100000% O2
8% O2
12% O2
Time (h)
Acetate (mg/L)
0 12 24 36 48 60 720
2000
4000
6000
8000
100000% O2
6% O2
10% O2
Time (h)
Acetate (mg/L)
0 12 24 36 48 60 720
2000
4000
6000
8000
100000% O2
6% O2
8% O2
Time (h)
Acetate (mg/L)
C D
BA
Figure 2-3. C. ljungdahlii acetate production. A) WT reduced, B) OTA1 reduced, C) WT unreduced, D) OTA1 unreduced.

90
0 12 24 36 48 60 720
1
2
3
4H2
O2
CO
CO2
Time (h)
Gas concentration (mmoles)
0 12 24 36 48 60 720
1
2
3
4H2
O2
CO
CO2
Time (h)
Gas concentration (mmoles)
0 12 24 36 48 60 720
1
2
3
4H2
O2
CO
CO2
Time (h)
Gas concentration (mmoles)
A B
C
Figure 2-4. C. ljungdahlii WT syngas utilization when grown in reduced medium; A) 0% O2, B) 8% O2, C) 12% O2
91
0 12 24 36 48 60 720
1
2
3
4H2
O2
CO
CO2
Time (h)
Gas concentration (mmoles)
0 12 24 36 48 60 720
1
2
3
4H2
O2
CO
CO2
Time (h)
Gas concentration (mmoles)
0 20 40 60 800
1
2
3
4H2
O2
CO
CO2
Time (h)
Gas concentration (mmoles)
A B
C
Figure 2-5. C. ljungdahlii OTA1 syngas utilization when grown in reduced medium; A) 0% O2, B) 8% O2, C) 12% O2

92
0 12 24 36 48 60 720
1
2
3
4H2
O2
CO
CO2
Time (h)
Gas concentration (mmoles)
0 12 24 36 48 60 720
1
2
3
4H2
O2
CO
CO2
Time (h)
Gas concentration (mmoles)
0 12 24 36 48 60 720
1
2
3
4H2
O2
CO
CO2
Time (h)
Gas concentration (mmoles)
A
C
B
Figure 2-6. C. ljungdahlii WT syngas utilization when grown in unreduced medium; A) 0% O2, B) 6% O2, C) 10% O2

93
0 12 24 36 48 60 720
1
2
3
4H2
O2
CO
CO2
Time (h)
Gas concentration (mmoles)
0 12 24 36 48 60 720
1
2
3
4H2
O2
CO
CO2
Time (h)
Gas concentration (mmoles)
0 20 40 60 800
1
2
3
4H2
O2
CO
CO2
Time (h)
Gas concentration (mmoles)
A
C
B
Figure 2-7. C. ljungdahlii OTA1 syngas utilization when grown in unreduced medium; A) 0% O2, B) 6% O2, C) 8% O2

94
0 12 24 36 48 60 720
1
2
3
4
5
6
70% O2
8% O2
12% O2
Time (h)
Fructose (g/L)
0 12 24 36 48 60 720
1
2
3
4
5
6
70% O2
8% O2
12% O2
Time (h)
Fructose (g/L)
0 12 24 36 48 60 720
1
2
3
4
5
6
70% O2
6% O2
10% O2
Time (h)
Fructose (g/L)
0 12 24 36 48 60 720
1
2
3
4
5
6
70% O2
6% O2
8% O2
Time (h)
Fructose (g/L)
D
B
C
A
Figure 2-8. C. ljungdahlii fructose utilization. A) WT reduced, B) OTA1 reduced, C) WT unreduced, D) OTA1 unreduced.

95
Figure 2-9. Model for the C. ljungdahlii oxidative stress detoxification system. SOD (superoxide dismutase), Cat (catalase), Rr (rubrerythrin), Trx (thioredoxin).

96
Table 2-1. Effect of O2 on product profiles in C. ljungdahlii strains at maximum production
Strain Medium Condition (% O2) EtOH (g/L) Ac (g/L) EtOH/Aca
ratio
Total liq. Prod. (g/L)
C. ljung.-WT
Reduced 0% 0.68 4.9 0.14 5.7
8% 1.4 4.5 0.30 5.9
Unreduced 0% 0.29 7.2 0.05 7.6
6% 0.81 6.7 0.17 7.5
C. ljung.-OTA1
Reduced 0% 1.3 3.3 0.40 4.6
8% 2.0 2.5 0.80 4.5
Unreduced 0% 0.54 4.9 0.11 5.4
6% 1.1 3.2 0.35 4.3 aEtOH is ethanol, Ac is acetate

97
Table 2-2. Oxidative stress enzyme activities in C. ljungdahlii WT and OTA1
aN.D. is not detected

98
Table 2-3. Pentose Phosphate Pathway enzyme activities in C. ljungdahlii WT and OTA1
Strain Condition Time (h)
Enzyme Activity (mU/mg of protein)
Glucose-6-P DH
6-P-gluconate DH
C. ljungdahlii-WT Control 14 N.D.a N.D.
36 N.D. N.D. O2 exposed 14 0.70 ± 0.14 0.76 ± 0.19
36 N.D. N.D. C. ljungdahlii-OTA1 Control 14 N.D. N.D.
36 N.D. N.D. O2 exposed 14 0.30 ± 0.25 0.50 ± 0.21
36 N.D. N.D. aN.D. is not detected.

99
Table 2-4. Ethanol forming enzyme activities in C. ljungdahlii WT and OTA1
Strain Condition Time (h)
Enzyme Activities (mU/mg of protein)
ALDH ALDH ADH ADH
(NAD+) (NADP+) (NAD+) (NADP+) C. ljungdahlii-WT Control 14 102 ± 29 N.D.a 89 ± 32 67 ± 5
36 40 ± 0.3 N.D. 18 ± 3 N.D. O2 exposed 14 25 ± 11 N.D. 82 ± 16 73 ± 3
36 58 ± 2 N.D. 29 ± 5 N.D. C. ljungdahlii-OTA1 Control 14 98 ± 46 N.D. 131 ± 40 1 ± 1
36 23 ± 2 N.D. 58 ± 1 N.D. O2 exposed 14 27 ± 1 N.D. 87 ± 28 1 ± 1.5
36 64 ± 8 N.D. 86 ± 5 N.D. aN.D. is not detected.

100
Table 2-5. Intracellular pyridine nucleotide pools of C. ljungdahlii WT and OTA1

101
REFERE-CES
Allen, T. D., Caldwell, M. E., Lawson, P. A., Huhnke, R. L., and Tanner, R. S., 2010. Alkalibaculum bacchi gen. nov., sp. nov., a novel CO oxidizing, ethanol producing acetogen isolated from livestock-impacted soil. Int J Syst Evol Microbiol. 60, 2483-2489. Atiyeh, H. K., Babu, B. K., Wilkins, M. R., and Huhnke, R. L., 2009. Effect of the Reducing Agent Dithiothreitol on Ethanol and Acetic Acid Production by Clostridium Strain P11 Using Simulated Biomass-Based Syngas. American Society of Agricultural and Biological Engineers, St. Joseph, MI. ASABE 097917. Barik, S., Prieto, S., Harrison, S., Clausen, E., and Gaddy, J., 1988. Biological production of alcohols from coal through indirect liquefaction. Applied Biochemistry and Biotechnology. 18, 363-378. Boga, H. I., and Brune, A., 2003. Hydrogen-Dependent Oxygen Reduction by Homoacetogenic Bacteria Isolated from Termite Guts. Appl. Environ. Microbiol. 69, 779-786. Briolat, V., and Reysset, G., 2002. Identification of the Clostridium perfringens Genes Involved in the Adaptive Response to Oxidative Stress. J. Bacteriol. 184, 2333-2343. Brioukhanov, A., and Netrusov, A., 2007. Aerotolerance of strictly anaerobic microorganisms and factors of defense against oxidative stress: A review. Applied Biochemistry and Microbiology. 43, 567-582. Brioukhanov, A. L., Thauer, R. K., and Netrusov, A. I., 2002. Catalase and Superoxide Dismutase in the Cells of Strictly Anaerobic Microorganisms. Microbiology. 71, 281-285. Bruchhaus, I., Richter, S., and Tannich, E., 1998. Recombinant expression and biochemical characterization of an NADPH:flavin oxidoreductase from Entamoeba histolytica. Biochem. J. 330, 1217-1221. Chalmers, W. S. K., and Taylor-Robinson, D., 1979. The Effect of Reducing and Other Agents on the Motility of Treponema pallidum in an Acellular Culture Medium. J Gen Microbiol. 114, 443-447. Chauhan, A., and Ogram, A., 2006. Phylogeny of Acetate-Utilizing Microorganisms in Soils along a Nutrient Gradient in the Florida Everglades. Appl. Environ. Microbiol. 72, 6837-6840. Clark, D. P., and Cronan, J. E., Jr, 1980. Acetaldehyde coenzyme A dehydrogenase of Escherichia coli. J. Bacteriol. 144, 179-184.

102
Cotter, J., Chinn, M., and Grunden, A., 2009a. Ethanol and acetate production by Clostridium ljungdahlii and Clostridium autoethanogenum using resting cells. Bioprocess and Biosystems Engineering. 32, 369-380. Cotter, J. L., Chinn, M. S., and Grunden, A. M., 2009b. Influence of process parameters on growth of Clostridium ljungdahlii and Clostridium autoethanogenum on synthesis gas. Enzyme and Microbial Technology. 44, 281-288. Coulter, E. D., Shenvi, N. V., and Kurtz, D. M., 1999. NADH Peroxidase Activity of Rubrerythrin. Biochemical and Biophysical Research Communications. 255, 317-323. Das, A., Coulter, E. D., Kurtz, D. M., Jr., and Ljungdahl, L. G., 2001. Five-Gene Cluster in Clostridium thermoaceticum Consisting of Two Divergent Operons Encoding Rubredoxin Oxidoreductase- Rubredoxin and Rubrerythrin-Type A Flavoprotein- High-Molecular-Weight Rubredoxin. J. Bacteriol. 183, 1560-1567. Das, A., Silaghi-Dumitrescu, R., Ljungdahl, L. G., and Kurtz, D. M., Jr., 2005. Cytochrome bd Oxidase, Oxidative Stress, and Dioxygen Tolerance of the Strictly Anaerobic Bacterium Moorella thermoacetica. J. Bacteriol. 187, 2020-2029. Datar, R. P., Shenkman, R. M., Cateni, B. G., Huhnke, R. L., and Lewis, R. S., 2004. Fermentation of biomass-generated producer gas to ethanol. Biotechnology and Bioengineering. 86, 587-594. Drake, H. L., and Daniel, S. L., 2004. Physiology of the thermophilic acetogen Moorella thermoacetica. Research in Microbiology. 155, 422-436. Drake, H. L., Gößner, A. S., and Daniel, S. L., 2008. Old Acetogens, New Light. Annals of the New York Academy of Sciences. 1125, 100-128. Dürre, P., Fischer, R.-J., Kuhn, A., Lorenz, K., Schreiber, W., Stürzenhofecker, B., Ullmann, S., Winzer, K., and Sauer, U., 1995. Solventogenic enzymes of Clostridium acetobutylicum: catalytic properties, genetic organization, and transcriptional regulation. FEMS Microbiology Reviews. 17, 251-262. Emerson, J. P., Coulter, E. D., Phillips, R. S., and Kurtz, D. M., 2003. Kinetics of the Superoxide Reductase Catalytic Cycle. Journal of Biological Chemistry. 278, 39662-39668. Frankenberg, C., Meirink, J. F., van Weele, M., Platt, U., and Wagner, T., 2005. Assessing Methane Emissions from Global Space-Borne Observations. Science. 308, 1010-1014.
103
Fuchs, G., 1986. CO2 fixation in acetogenic bacteria: Variations on a theme. FEMS Microbiology Letters. 39, 181-213. Gnansounou, E., and Dauriat, A., 2010. Techno-economic analysis of lignocellulosic ethanol: A review. Bioresource Technology. 101, 4980-4991. Grose, J. H., Joss, L., Velick, S. F., and Roth, J. R., 2006. Evidence that feedback inhibition of NAD kinase controls responses to oxidative stress. Proceedings of the National Academy of Sciences. 103, 7601-7606. Hardy, J. A., and Hamilton, W. A., 1981. The oxygen tolerance of sulfate-reducing bacteria isolated from North Sea waters. Current Microbiology. 6, 259-262. Hashida, S.-N., Itami, T., Takahashi, H., Takahara, K., Nagano, M., Kawai-Yamada, M., Shoji, K., Goto, F., Yoshihara, T., and Uchimiya, H., 2010. Nicotinate/nicotinamide mononucleotide adenyltransferase-mediated regulation of NAD biosynthesis protects guard cells from reactive oxygen species in ABA-mediated stomatal movement in. Journal of Experimental Botany. 61, 3813-3825. Hassan, H. M., and Fridovich, I., 1978. Regulation of the synthesis of catalase and peroxidase in Escherichia coli. Journal of Biological Chemistry. 253, 6445-6420. Heiskanen, H., Virkajärvi, I., and Viikari, L., 2007. The effect of syngas composition on the growth and product formation of Butyribacterium methylotrophicum. Enzyme and Microbial Technology. 41, 362-367. Imlay, J., and Linn, S., 1988. DNA damage and oxygen radical toxicity. Science. 240, 1302-1309. Jenney, F. E., Jr., Verhagen, M. F., nbsp, J., M., Cui, X., Adams, M. W., and W., 1999. Anaerobic Microbes: Oxygen Detoxification Without Superoxide Dismutase. Science. 286, 306-309. Kabir, M. M., and Shimizu, K., 2006. Investigation into the effect of soxR and soxS genes deletion on the central metabolism of Escherichia coli based on gene expressions and enzyme activities. Biochemical Engineering Journal. 30, 39-47. Karita, S., Nakayama, K., Goto, M., Sakka, K., Kim, W.-J., and Ogawa, S., 2003. A Novel Cellulolytic, Anaerobic, and Thermophilic Bacterium, Moorella sp. Strain F21. Bioscience, Biotechnology, and Biochemistry. 67, 183-185.

104
Karnholz, A., Küsel, K., Goner, A., Schramm, A., and Drake, H. L., 2002. Tolerance and Metabolic Response of Acetogenic Bacteria toward Oxygen. Appl. Environ. Microbiol. 68, 1005-1009. Klasson, K. T., Ackerson, M. D., Clausen, E. C., and Gaddy, J. L., 1991. Bioreactor design for synthesis gas fermentations. Fuel. 70, 605-614. Klasson, K. T., Ackerson, M. D., Clausen, E. C., and Gaddy, J. L., 1992. Bioconversion of synthesis gas into liquid or gaseous fuels. Enzyme. Microb. Technol. 14, 602-608. Klingenberg, M., Nicotinamide-adenine Dinucleotides and Dinucleotide Phosphates (NAD, NADP, NADH, NADPH). In: H. U. Bergmeyer, J. Bergmeyer, M. Grabl, Eds.), Methods of Enzymatic Analysis, Vol. 7. Verlag Chemie, Weinheim, 1985, pp. 251-271. Köpke, M., Held, C., Hujer, S., Liesegang, H., Wiezer, A., Wollherr, A., Ehrenreich, A., Liebl, W., Gottschalk, G., and Dürre, P., 2010. Clostridium ljungdahlii represents a microbial production platform based on syngas. Proceedings of the National Academy of Sciences. 107, 13087-13092. Kundiyana, D. K., Huhnke, R. L., and Wilkins, M. R., 2010. Syngas fermentation in a 100-L pilot scale fermentor: Design and process considerations. Journal of Bioscience and Bioengineering. 109, 492-498. Kuřec, M., Kuncová, G., and Brányik, T., 2009. Yeast vitality determination based on intracellular NAD(P)H fluorescence measurement during aerobic-anaerobic transition Folia Microbiologica 54, 25-25. Kusel, K., Karnholz, A., Trinkwalter, T., Devereux, R., Acker, G., and Drake, H. L., 2001. Physiological Ecology of Clostridium glycolicum RD-1, an Aerotolerant Acetogen Isolated from Sea Grass Roots. Appl. Environ. Microbiol. 67, 4734-4741. Lundberg, B. E., Wolf, R. E., Jr., Dinauer, M. C., Xu, Y., and Fang, F. C., 1999. Glucose 6-Phosphate Dehydrogenase Is Required for Salmonella typhimurium Virulence and Resistance to Reactive Oxygen and Nitrogen Intermediates. Infect. Immun. 67, 436-438. Luo, X.-j., Zhang, X.-l., Liu, J., Wu, J.-p., Luo, Y., Chen, S.-j., Mai, B.-x., and Yang, Z.-y., 2008. Persistent Halogenated Compounds in Waterbirds from an e-Waste Recycling Region in South China. Environmental Science & Technology. 43, 306-311. Mackay, D., de Sieyes, N., Einarson, M., Feris, K., Pappas, A., Wood, I., Jacobson, L., Justice, L., Noske, M., Wilson, J., Adair, C., and Scow, K., 2007. Impact of Ethanol on the Natural Attenuation of MTBE in a Normally Sulfate-Reducing Aquifer. Environmental Science & Technology. 41, 2015-2021.

105
Morton, T. A., Chou, C.-F., and Ljungdahl, L. G., Cloning, sequencing, and expressions of genes encoding enzymes of the autotrophic acetyl-coA pathway in the acetogen Clostridium thermoaceticum. In: M. Sebald, (Ed.), Genetics and Molecular Biology of Anaeobic Bacteria. Springer-Verlag, New York, 1993, pp. 389-406. Munasinghe, P. C., and Khanal, S. K., 2010. Biomass-derived syngas fermentation into biofuels: Opportunities and challenges. Bioresource Technology. 101, 5013-5022. Peskin, A. V., and Winterbourn, C. C., 2000. A microtiter plate assay for superoxide dismutase using a water-soluble tetrazolium salt (WST-1). Clinica Chimica Acta. 293, 157-166. Pomposiello, P. J., Bennik, M. H. J., and Demple, B., 2001. Genome-Wide Transcriptional Profiling of the Escherichia coli Responses to Superoxide Stress and Sodium Salicylate. J. Bacteriol. 183, 3890-3902. Poole, L. B., and Ellis, H. R., 1996. Flavin-Dependent Alkyl Hydroperoxide Reductase from Salmonella typhimurium. 1. Purification and Enzymatic Activities of Overexpressed AhpF and AhpC Proteins. Biochemistry. 35, 56-64. Ragsdale, S. W., and Wood, H. G., 1991. Enzymology of the Acetyl-CoA Pathway of CO2 Fixation. Critical Reviews in Biochemistry and Molecular Biology. 26, 261-300. Russell, M. J., and Martin, W., 2004. The rocky roots of the acetyl-CoA pathway. Trends in Biochemical Sciences. 29, 358-363. Stanton, T. B., and Jensen, N. S., 1993. Purification and characterization of NADH oxidase from Serpulina (Treponema) hyodysenteriae. J. Bacteriol. 175, 2980-2987. Sugimoto, S., and Shiio, I., 1987a. Regulation of 6-Phosphogluconate Dehydrogenase in Brevibacterium flavum. Agricultural and Biological Chemistry. 51, 1257-1263. Sugimoto, S., and Shiio, I., 1987b. Regulation of Glucose-6-Phosphate Dehydrogenase in Brevibacterium flavum. Agricultural and Biological Chemistry. 51, 101-108. Tanner, R. S., Miller, L. M., and Yang, D., 1993. Clostridium ljungdahlii sp. nov., an Acetogenic Species in Clostridial rRNA Homology Group I. Int J Syst Bacteriol. 43, 232-236. Teuten, E. L., Xu, L., and Reddy, C. M., 2005. Two Abundant Bioaccumulated Halogenated Compounds Are Natural Products. Science. 307, 917-920.
106
Thauer, R. K., Kaster, A.-K., Seedorf, H., Buckel, W., and Hedderich, R., 2008. Methanogenic archaea: ecologically relevant differences in energy conservation. Nat Rev Micro. 6, 579-591. Tirado-Acevedo, O., Chinn, M. S., and Grunden, A. M., Production of Biofuels from Synthesis Gas Using Microbial Catalysts. In: I. L. Allen, S. Sima, M. G. Geoffrey, Eds.), Advances in Applied Microbiology, Vol. Volume 70. Academic Press, 2010, pp. 57-92. Vega, J., Prieto, S., Elmore, B., Clausen, E., and Gaddy, J., 1989. The Biological production of ethanol from synthesis gas. Applied Biochemistry and Biotechnology. 20-21, 781-797. Wimpenny, J. W. T., and Firth, A., 1972. Levels of Nicotinamide Adenine Dinucleotide and Reduced Nicotinamide Adenine Dinucleotide in Facultative Bacteria and the Effect of Oxygen. J. Bacteriol. 111, 24-32. Wolin, M. J., Miller, T. L., Collins, M. D., and Lawson, P. A., 2003. Formate-Dependent Growth and Homoacetogenic Fermentation by a Bacterium from Human Feces: Description of Bryantella formatexigens gen. nov., sp. nov. Appl. Environ. Microbiol. 69, 6321-6326. Woodmansee, A. N., and Imlay, J. A., 2002. Reduced Flavins Promote Oxidative DNA Damage in Non-respiring Escherichia coli by Delivering Electrons to Intracellular Free Iron. Journal of Biological Chemistry. 277, 34055-34066. Zainal, Z. A., Rifau, A., Quadir, G. A., and Seetharamu, K. N., 2002. Experimental investigation of a downdraft biomass gasifier. Biomass and Bioenergy. 23, 283-289. Zinder, S. H., Anaerobic Utilization of Halohydrocarbons. In: K. N. Timmis, (Ed.), Handbook of Hydrocarbon and Lipid Microbiology. Springer Berlin 2010, pp. 2049-2064.

107
CHAPTER 3
Influence of carbon source pre-adaptation on Clostridium ljungdahlii growth and product formation*
Oscar Tirado-Acevedo1†, Jacqueline L. Cotter2†, Mari S. Chinn2 and Amy M. Grunden1
1-Department of Microbiology, North Carolina State University, 4548 Thomas Hall, Campus Box 7615, Raleigh, NC 27606, USA 2-Department of Biological and
Agricultural Engineering, North Carolina State University, 277 Weaver Labs, Campus Box 7625, Raleigh, NC 27695-7625, USA. † O.T.A. and J.L.C. contributed equally to this
work.
*Submitted for publication to: Bioresource Technology
108
ABSTRACT
Clostridium ljungdahlii was grown on different carbon sources including syngas only,
syngas-fructose and fructose only to identify ideal pre-adaptation conditions for ethanol and
acetate production from subsequent cultures grown in reactors containing syngas only or
fructose-syngas substrates. In syngas only reactors, cultures pre-adapted to fructose had
faster growth rates and higher ethanol and acetate formation than cells pre-grown on syngas
or syngas-fructose. In syngas-fructose reactors, cultures did not show significant growth or
acetate production differences under pre-adaptation treatments. Nevertheless, in these
reactors, syngas and syngas-fructose pre-adapted cultures showed higher ethanol production
than fructose pre-adapted cultures. Among the pre-adaptation carbon sources tested, fructose
showed better results in syngas only reactors. However, the presence of syngas in the pre-
adaptation cultures proved to be the better method overall for ethanol production.

109
3.1. Introduction
Conversion of synthesis gas to liquid fuels by biological catalysts has been suggested as a
promising technology to achieve oil independence (Zeikus, 1980). In this method, cellulosic
biomass and other carbon sources (coal, industry and/or municipal waste, etc.) are converted
to synthesis gas (syngas) by a well known process called gasification (Bridgwater, 1995).
This syngas is then fed to a microorganism which can utilize it as a carbon and energy
source. The by-product of this fermentation could be ethanol, butanol or other commodity
chemicals. There have been a number of microorganisms isolated for use in this process. In
addition, some companies are en route to commercializing their methods (Tirado-Acevedo et
al., 2010).
Extensive research has been focused on optimizing bioreactor designs and media
development (Hurst and Lewis, 2010; Phillips et al., 1993b; Worden et al., 1991). Recent
bioreactor processes have made use of micro-bubble gas dispersers, cell recycling, and
addition or removal of reducing agents and yeast extract, respectively. However, only a few
studies have examined the effects that seed cultures pre-adapted to different carbon sources
and carbon source in the production culture media have on product formation and cell yield
(Klasson et al., 1992c).
Clostridium ljungdahlii, which has been studied in regard to synthesis gas fermentation
(Phillips et al., 1993b), was isolated from chicken yard waste and was the first
microorganism described to be able to ferment syngas components to ethanol via the acetyl-
CoA pathway (Tanner et al., 1993b). In addition to utilizing CO and H2, C. ljungdahlii can
use sugars such as fructose as a carbon source. The purpose of this study was to compare

110
cell growth and product formation from C. ljungdahlii grown on different carbon sources
(syngas and sugar combinations) while using cells pre-adapted to sugar, syngas and mixed
sugar-syngas substrates in a continuous gas feed, batch liquid system.
3.2. Methods
3.2.1. Organism and medium preparation
C. ljungdahlii (ATCC 55353) was obtained from the American Type Culture Collection.
The bacterium was grown at 37 ºC on a modified Reinforced Clostridial Basal medium with
additional salts, vitamins, and trace elements adopted from the ATCC 1754 PETC medium
(RCM.NA.SVE) in a nitrogen atmosphere unless otherwise indicated (Cotter et al., 2009a).
Cultures provided syngas (7.5 ml/min ) were grown in a fermentation reactor (Fig.3.1)
(Cotter et al., 2009b). The bottled syngas used was an artificial mix of 50% N2, 20% CO,
20% CO2, and 10% H2. When added to medium in combination with syngas, fructose was
used at 2.5 g/L. All culture transfers were done at 5 % inoculum (v/v).
2.2. Inoculum preparation using different carbon sources
C. ljungdahlii was grown on RCM.NA.SVE (which from here on will be referred to
simply as medium). Cultures were initiated from a freezer stock (-80°C) and incubated at
37°C for 72 hours before 3 serial transfers every 24 hours to achieve steady growth in
medium containing fructose (5 g/L). Active cells (472 mg dry cells/ml) were transferred to
different carbon sources [medium-syngas, medium-syngas-fructose (2.5 g/L) or medium-
fructose (5g/L)] to start the seed cultures for the fermentation studies. Fermentation reactors
containing medium-syngas and medium-syngas-fructose at a working volume of 250 ml were
inoculated with the three different seed cultures (472 mg dry cells/ml; 5% v/v). Each

111
medium seed culture combination was grown in triplicate. Cell growth was monitored and
liquid and gas samples were taken for analysis every 6-8 hours.
3.2.3. Substrate and end product analysis
Headspace gases were analyzed by gas chromatography on a Carbosieve S-II, 100/120
mesh stainless steel column (10’ x 1/8”: 3.05 m x 0.3175 cm) using a thermal conductivity
detector (Shimadzu GC-17A), Ethanol and acetate concentrations were determined in
acidified samples by gas chromatography (Shimadzu GC-17A, Kyoto, Japan). The
chromatography column was packed with Supelco SP 1000 (1% H3 PO4, 100/120 mesh) and
analytes were quantified using a flame ionization detector (Cotter et al., 2009a; Cotter et al.,
2009b).
The amount of fructose present in the experimental cultures was determined by high-
performance liquid chromatography (Shimadzu LC20) as follows: liquid samples (600 µL)
were centrifuged (10 min, 18,400 x g, room temperature). Supernatant was filtered though a
0.22 µm syringe filter into a crimp vial and analyzed on a HPX-87H column (65°C) using a
refractive index detector. Sulfuric acid (5 mM) was used as the eluent at a rate of 0.6
ml/min.
3.2.4 Statistical analysis
Cell growth and liquid product analysis from the different inoculum sources were
evaluated using the General Linear Model (GLM) in SAS® Version 9.1 (SAS Inc., Cary, NC,
USA). Assessment of statistical significance for pre-adaptation on different carbon sources
and different production growth substrates was set at P < 0.05.
112
3.3. Results and discussion
3.3.1. Growth of C. ljungdahlii and product formation in syngas reactors
C. ljungdahlii cultures were pre-adapted on three different carbon source combinations
(syngas, syngas-fructose or fructose). Subsequently, these cells were transferred to
fermentation reactors with either syngas or syngas-fructose medium. In syngas only reactors,
cells pre-adapted on fructose produced the highest cell densities reaching maximum growth
after 24 hours (Fig. 3-2A). This observation is interesting since one would expect a lag-time
given that these cells would have to switch from fructose fermentation to syngas
fermentation. Syngas and syngas-fructose pre-adapted cells reached maximum densities
after 40 and 56 hours, respectively. Cells pre-adapted on syngas-fructose showed the longest
lag-time, contributing to the increased time to reach peak growth, where fructose only
cultures had a growth rate of 10.4 mg/ml/h, while syngas and syngas-fructose cultures both
had growth rates of 5 mg/ml/h. Interestingly, after 56 hours cell density was statistically the
same independent of pre-adaptation medium, possibly due to product inhibition or depletion
of an essential nutrient.
Ethanol production in syngas reactors was significantly higher (P < 0.05) when cells
where pre-adapted on fructose, reaching a maximum of 2.2 mM after 64 hours of growth
(Fig. 3-3A). Ethanol production in these cells seems to be non-growth associated since these
cells reached stationary phase after 24 hours. Cells pre-adapted on syngas also reached
maximum ethanol yield after 64 hours, while cells pre-adapted on syngas-fructose reached a
maximum after 48 hours. Although acetate is considered to be a growth associated product,
it was continuously accumulated during the growth phase as well as after the stationary phase

113
was reached (Fig. 3-3C). Cells pre-adapted on fructose produced significantly higher acetate
concentrations (P < 0.05) with a maximum of 34.3 mM. Again, in syngas reactors, cells pre-
adapted to syngas-fructose show a lag time in acetate production when compared to fructose
or syngas pre-adapted cells but reached comparable concentrations by the end of the
experiment.
3.3.2. Growth and product formation in syngas-fructose reactors
No significant growth differences were observed among the three inoculum sources in the
syngas-fructose reactors (Fig. 3-2B). These cultures did not show a lag-time and reached a
maximum cell density after 24 hours. Cell growth rates were approximately 43 mg/L/h for
syngas and fructose pre-adapted cultures and 37 mg/L/h for syngas-fructose pre-adapted
cultures. Independent of inoculum source, cells growing in syngas-fructose reactors had
significantly higher cell yields (P < 0.05) as compared to cells growing in syngas reactors
(787 mg/L vs. 332 mg/L).
Ethanol concentration in syngas-fructose reactors was statistically lower compared to
cells that were pre-adapted on fructose (Fig 3-3B). Pre-adaptation had no effect on acetate
production as all cultures produced statistically the same amount of acetate. Independent of
pre-adaptation, both ethanol and acetate production seem to be growth associated as
production slows down when cells reach stationary phase. It had been previously suggested
that ethanol production is associated with non-growth conditions (Klasson et al., 1992c). We
observe this in syngas only medium but not when fructose is present (Fig. 3-3A and B).
Independent of the inoculum source, cells grown in syngas-fructose reactors produced
significantly more ethanol and acetate than cells grown in syngas reactors (Fig. 3-3), with as

114
much as 8- and 1.5-fold more ethanol and acetate, respectively. This trend has also been
observed with addition of 5 g/L of fructose to syngas-grown cultures, where increases up to
25% and 35 % for ethanol and acetate concentration respectively were seen compared to
syngas alone (unpublished data). This may indicate that an addition of a small concentration
of sugar in the medium could improve C. ljungdahlii ethanol yields. A number of low-cost
sugar sources have been identified that could act as a carbon supplement for this process
without interfering with food supply demands (Jiang et al., 2009; Lawford and Rousseau,
1997). The use of low concentration sugar supplementation may be worth examining as a
method to improve commodity chemical production from C. ljungdahlii.
3.3.3. Gas and fructose analysis
Headspace gas composition was monitored in both syngas and syngas-fructose
fermentations. Figure 3-4A illustrates a representation of headspace gases exhausting from
the reactor. CO and H2 consumption at 8 to 24 hours coincides with a CO2 increase. This
indicates that C. ljungdahlii is most likely using the acetyl-CoA pathway for the metabolism
of CO and H2, thereby providing the cell with carbon for biomass and energy production as
well as reducing equivalents (Ragsdale and Wood, 1991a). Nevertheless, by the end of the
culture growth, the head-space gases return to near starting concentrations. This observation
may be related to several conditions, including cells that are no longer consuming gases for
growth and metabolism or that the gas flow rate exceeds the cells’ rate of consumption.
More complete utilization of the syngas supplied could be achieved by changing the reactor
design to include gas recirculation (Nie et al., 2008).

115
Fructose utilization was analyzed throughout the experiment for the syngas-fructose
reactors. Fructose was consumed at equal rates independent of inoculum source and was
exhausted by 24 hours (Fig. 3-4B). Fructose utilization and liquid product synthesis appear
to be tightly associated as disappearance of fructose in the medium correlates with reduction
of ethanol and acetate production. Nevertheless, after fructose is completely consumed,
ethanol production rate is still higher on syngas-fructose reactors when compared to syngas
reactors. This indicates that fructose is most likely providing the cell with an excess of
reducing equivalents , which in turn could be utilized to reduce acetate to ethanol (Kopke et
al., 2010).
3.4. Conclusions
In syngas reactors, inoculum source was found to have an effect on growth rate and final
cell concentration as well as ethanol formation. In these reactors, the highest cell
concentration and ethanol production was found in reactors with cells pre-adapted with
fructose. These reactors produced around 2.5 and 1.5 times more ethanol than reactors
inoculated with syngas and syngas-fructose pre-adapted cells, respectively. Fructose pre-
adaptation likely provides higher levels of energy equivalents (ATP/GTP) and reducing
power (NADH/NADPH) to the cells, which enables the cells to efficiently utilize a carbon
source (syngas) that initially requires an energy and reductant input (Kopke et al., 2010).
In syngas-fructose reactors, inoculum source did not appear to have an impact on cell
density, liquid product yield, nor fructose utilization. This suggests that independent of pre-
adaptation, in syngas-fructose reactors, cells have the capacity to readily utilize fructose as
carbon and electron source. Overall, syngas-fructose reactors had approximately 2.5 times

116
higher cell densities and 8 and 1.5 times higher ethanol and acetate, respectively than syngas
reactors. This indicates that a small amount of fructose may be needed to increase ethanol
yields in our system as excess reducing equivalents translate to better ethanol yields.
However, fructose is an expensive carbon source and is also part of the human food supply,
but there are cheap alternative carbon sources that could be suitable for C. ljungdahlii culture
(Gullón et al., 2008; Jiang et al., 2009).
Syngas utilization in the reactors could not be conclusively established possibly due to
the gas flow rate being greater than an accurately measureable cell gas utilization rate. If
quantification of gas consumption in the continuous gas feed system is desired, changes in
reactor design and gaseous substrate flow patterns would be needed. Therefore, it was
concluded that for syngas-fructose reactors, pre-adaptation is not necessary as the overall
fermentation was not affected. Nevertheless, in syngas only reactors a fructose pre-
adaptation will be beneficial as it increases cell numbers and liquid products.

117
Figure 3-1. Synthesis gas fermentation reactor.

118
Figure 3-2. C. ljungdahlii culture density in the syngas reactor (A) and syngas-fructose reactor (B) inoculated with cells pre-grown on fructose (circles), syngas-fructose (squares), or syngas (triangles).

119
Figure 3-3. C. ljungdahlii production of ethanol (A and B) and acetate (C and D) in the syngas reactor (A and C) and in the syngas-fructose reactor (B and D) inoculated with cells pre-grown on fructose (circles), syngas-fructose (squares), or syngas (triangles).
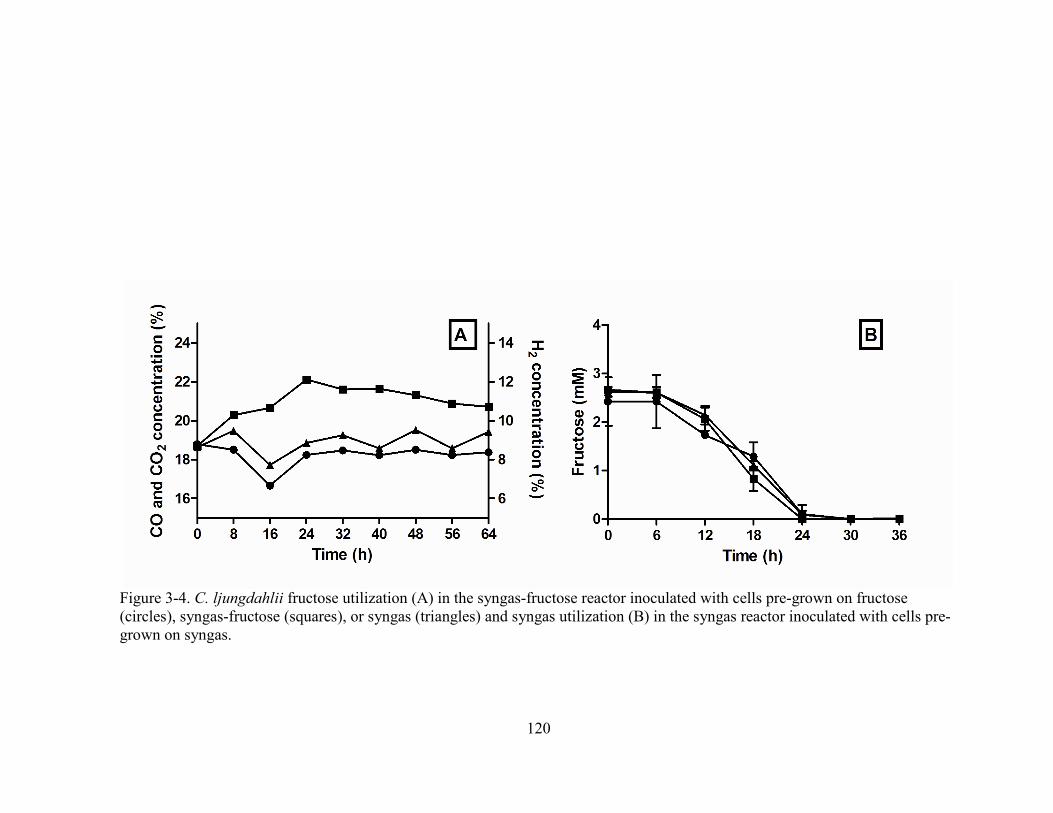
120
Figure 3-4. C. ljungdahlii fructose utilization (A) in the syngas-fructose reactor inoculated with cells pre-grown on fructose (circles), syngas-fructose (squares), or syngas (triangles) and syngas utilization (B) in the syngas reactor inoculated with cells pre-grown on syngas.

121
REFERE-CES
Bridgwater, A. V., 1995. The technical and economic feasibility of biomass gasification for power generation. Fuel. 74, 631-653. Cotter, J. L., Chinn, M. S., and Grunden, A. M., 2009a. Ethanol and acetate production by Clostridium ljungdahlii and Clostridium autoethanogenum using resting cells. Bioprocess. Biosyst. Eng. 32, 369-380. Cotter, J. L., Chinn, M. S., and Grunden, A. M., 2009b. Influence of process parameters on growth of Clostridium ljungdahlii and Clostridium autoethanogenum on synthesis gas. Enzyme. Microb. Technol. 44, 281-288. Gullón, B., Yáñez, R., Alonso, J. L., and Parajó, J. C., 2008. l-Lactic acid production from apple pomace by sequential hydrolysis and fermentation. Bioresour. Technol. 99, 308-319. Hurst, K. M., and Lewis, R. S., 2010. Carbon monoxide partial pressure effects on the metabolic process of syngas fermentation. Biochem. Eng. J. 48, 159-165. Jiang, L., Wang, J., Liang, S., Wang, X., Cen, P., and Xu, Z., 2009. Butyric acid fermentation in a fibrous bed bioreactor with immobilized Clostridium tyrobutyricum from cane molasses. Bioresour. Technol. 100, 3403-3409. Klasson, K. T., Ackerson, M. D., Clausen, E. C., and Gaddy, J. L., 1992. Bioconversion of synthesis gas into liquid or gaseous fuels. Enzyme. Microb. Technol. 14, 602-608. Kopke, M., Held, C., Hujer, S., Liesegang, H., Wiezer, A., Wollherr, A., Ehrenreich, A., Liebl, W., Gottschalk, G., and Durre, P., 2010. Clostridium ljungdahlii represents a microbial production platform based on syngas. P.N.A.S. 107, 13087-13092. Lawford, H., and Rousseau, J., 1997. Corn steep liquor as a cost-effective nutrition adjunct in high-performance Zymomonas ethanol fermentations. Appl. Biochem. Biotechnol. 63-65, 287-304. Nie, Y., Liu, H., Du, G., and Chen, J., 2008. Acetate yield increased by gas circulation and fed-batch fermentation in a novel syntrophic acetogenesis and homoacetogenesis coupling system. Bioresour. Technol. 99, 2989-2995. Phillips, J., Klasson, K., Clausen, E., and Gaddy, J., 1993. Biological production of ethanol from coal synthesis gas. Appl. Biochem. Biotechnol. 39-40, 559-571.
122
Ragsdale, S. W., and Wood, H. G., 1991. Enzymology of the Acetyl-CoA Pathway of CO2 Fixation. Crit. Rev. Biochem. Mol. Biol. 26, 261-300. Tanner, R. S., Miller, L. M., and Yang, D., 1993. Clostridium ljungdahlii sp. nov., an Acetogenic Species in Clostridial rRNA Homology Group I. Int. J. Syst. Bacteriol. 43, 232-236. Tirado-Acevedo, O., Chinn, M. S., and Grunden, A. M., Production of Biofuels from Synthesis Gas Using Microbial Catalysts. In: I. L. Allen, S. Sima, M. G. Geoffrey, Eds.), Advances in Applied Microbiology, Vol. Volume 70. Academic Press, 2010, pp. 57-92. Worden, R. M., Grethlein, A. J., Jain, M. K., and Datta, R., 1991. Production of butanol and ethanol from synthesis gas via fermentation. Fuel. 70, 615-619. Zeikus, J. G., 1980. Chemical and Fuel Production by Anaerobic Bacteria. Annu. Rev. Microbiol. 34, 423-464.

123
CHAPTER 4
STUDY CO-CLUSIO-S
Fossil fuels are harmful to the environment and human health, and the fossil reserves
are dwindling at a dramatic rate. In addition, today’s biofuels sources such as corn and sugar
cane are expensive, depend on government subsidies and can increase food prices as less of
these crops are made available for human consumption as a result of their use for fuel
production. Biofuels from cellulosic biomass have been identified as one suitable
alternative to fossil fuels and first generation biofuel corn ethanol (hydrolysis-fermentation).
Synthesis gas has been used as fuel for decades due to being affordable and can be obtained
from any type of biomass regardless of its composition. Being a gas, its use as a
transportation fuel is not ideal. Converting it to liquid would condense its energy and make it
easier to store and to transport.
Fermentation of synthesis gas obtained from biomass has proven to be a viable
approach to produce biofuels. This technology has higher product yields and lower energy
input than lignocellulose hydrolysis-fermentation. Researchers have isolated several
microorganisms capable of converting synthesis gas to more suitable, higher energy fuels.
These biocatalysts can manage most synthesis gas contaminants making them more robust
than some chemical catalysts. Nevertheless, contaminants such as NO, acetylene and O2 can
inhibit activities from these microbes. The industry and the government have been very
interested in this process and a commercial demonstration plant is already in operation
(Coskata Inc. Madison, Pennsylvania).

124
The syngas-fermenting bacterium C. ljungdahlii has been the subject of a number of
investigations to improve its ethanol yields. Nevertheless, extensive physiological and
metabolic research is limited for this organism. Several acetogens have been shown to
produce higher ethanol concentration as a response to O2 exposure. This opens up new
possibilities for improvement of biofuels production.
During our research to increase ethanol production by C. ljungdahlii, one of our aims
was to demonstrate that C. ljungdahlii could increase ethanol formation from synthesis gas as
a response to O2 exposure. We have also isolated a mutant strain (OTA1). This strain
produces approximately 2-fold more ethanol than the WT strain. Both strains increase
ethanol production along with decreasing acetate formation when exposed to O2. This is
significant for C. ljungdahlii’s use in the biofuels industry as O2 contamination is likely to
occur in the synthesis gas.
We also demonstrate that inoculum source for syngas reactors has an effect on growth
rate and final cell concentration as well as ethanol formation. Fructose pre-adaptation
improves cell concentration and ethanol production, most likely providing higher levels of
energy and reducing power to the cells. Fructose is an expensive carbon source; however, an
alternative inexpensive sugar may be utilized to enhance ethanol production instead.
Given the lack of genetic tools available for C. ljungdahlii, we have had to rely on other
methods to increase ethanol production from synthesis gas. We were successful in doing this
by exposing the cells to O2 and pre-adapting the cells to fructose. The fact that this organism
increases ethanol formation at the expense of acetate in the presence of O2 is beneficial in an

125
industrial production setting since it will lower the cost by eliminating the use of reducing
agents and the requirements for stringent anaerobic conditions.
126
APPE-DIX
This appendix section contains additional figures from C. ljungdaglii oxygen
exposure study presented in chapter 2. These include growth, ethanol and acetate formation,
headspace analysis and fructose utilization.

127
0 12 24 36 48 60 720
500
1000
1500
2000
0% O2
4% O2
6% O2
8% O2
12% O2
Time (h)
Culture Density (mg/L)
0 12 24 36 48 60 720
1
2
3
4
5
6
70% O2
4% O2
6% O2
8% O2
12% O2
Time (h)
Fructose (g/L)
0 12 24 36 48 60 720
500
1000
1500
2000
25000% O2
4% O2
6% O2
8% O2
12% O2
Time (h)
Ethanol (mg/L)
0 12 24 36 48 60 720
2000
4000
6000
8000 0% O2
4% O2
6% O2
8% O2
12% O2
Time (h)
Acetate (mg/L)
A
DC
B
Figure A-1. C. ljungdahlii-WT metabolism in reduced medium. A) Growth, B) fructose utilization, C) ethanol production, D) acetate production.

128
Figure A-2. C. ljungdahlii-WT growing in reduced medium, headspace analysis at different O2 concentrations. A) 0 % O2 B) 4 % O2 C) 6 % O2 D) 8 % O2 E) 12 % O2
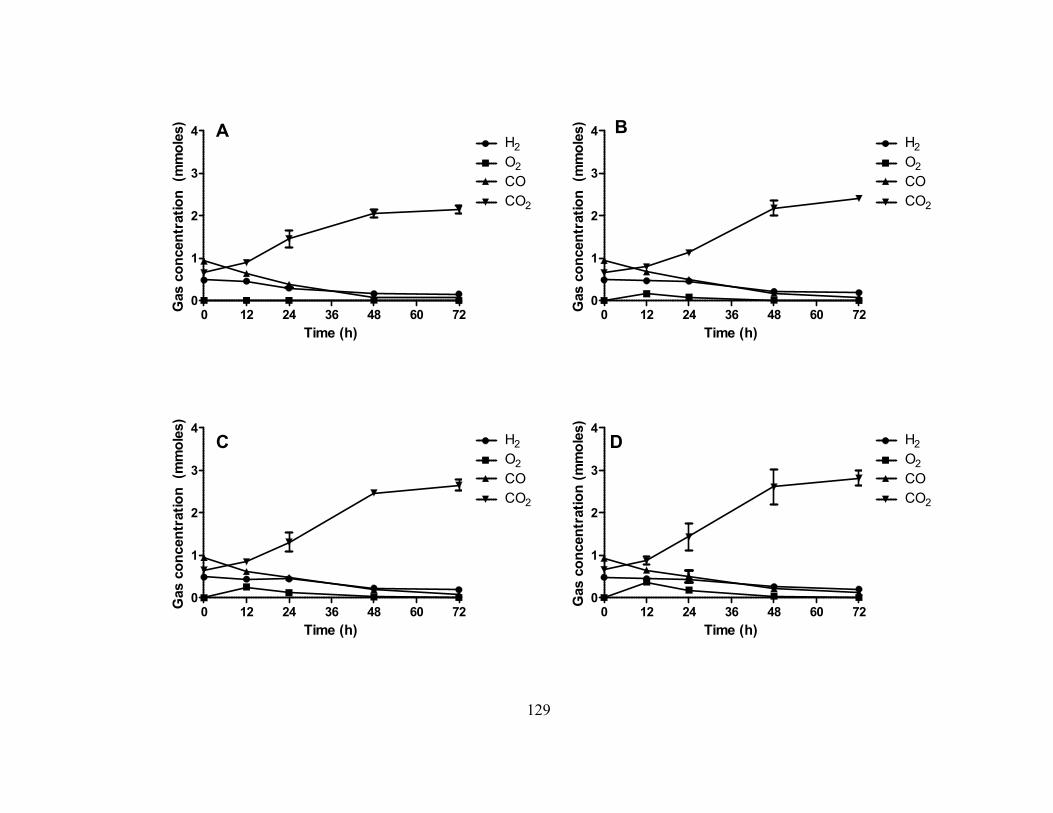
129
0 12 24 36 48 60 720
1
2
3
4H2
O2
CO
CO2
Time (h)
Gas concentration (mmoles)
0 12 24 36 48 60 720
1
2
3
4H2
O2
CO
CO2
Time (h)
Gas concentration (mmoles)
0 12 24 36 48 60 720
1
2
3
4H2
O2
CO
CO2
Time (h)
Gas concentration (mmoles)
0 12 24 36 48 60 720
1
2
3
4H2
O2
CO
CO2
Time (h)
Gas concentration (mmoles)
A B
C D

130
0 12 24 36 48 60 720
1
2
3
4H2
O2
CO
CO2
Time (h)
Gas concentration (mmoles)
E

131
0 12 24 36 48 60 720
500
1000
15000% O2
4% O2
6% O2
8% O2
10% O2
Time (h)
Culture Density (mg/L)
0 12 24 36 48 60 720
1
2
3
4
5
6
70% O2
4% O2
6% O2
8% O2
10% O2
Time (h)
Fructose (g/L)
0 12 24 36 48 60 720
500
1000
1500
2000
25000% O2
4% O2
6% O2
8% O2
10% O2
Time (h)
Ethanol (mg/L)
0 12 24 36 48 60 720
2000
4000
6000
8000 0% O2
4% O2
6% O2
8% O2
10% O2
Time (h)
Acetate (mg/L)
A
DC
B
Figure A-3. C. ljungdahlii-WT metabolism in unreduced medium. A) Growth, B) fructose utilization, C) ethanol production, D) acetate production
132
Figure A-4. C. ljungdahlii-WT growing in unreduced medium, headspace analysis at different O2 concentrations. A) 0 % O2 B) 4 % O2 C) 6 % O2 D) 8 % O2 E) 10 % O2

133
0 12 24 36 48 60 720
1
2
3
4H2
O2
CO
CO2
Time (h)
Gas concentration (mmoles)
0 12 24 36 48 60 720
1
2
3
4H2
O2
CO
CO2
Time (h)
Gas concentration (mmoles)
0 12 24 36 48 60 720
1
2
3
4H2
O2
CO
CO2
Time (h)
Gas concentration (mmoles)
0 12 24 36 48 60 720
1
2
3
4H2
O2
CO
CO2
Time (h)
Gas concentration (mmoles)
C D
A B
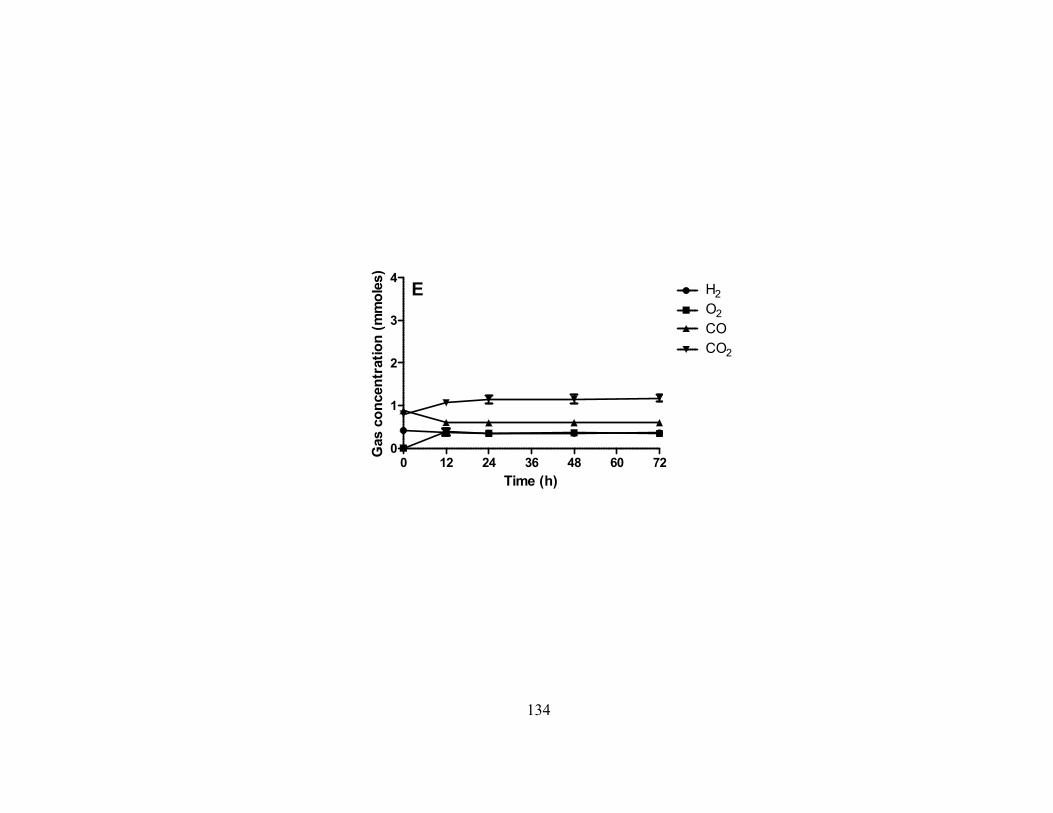
134
0 12 24 36 48 60 720
1
2
3
4H2
O2
CO
CO2
Time (h)
Gas concentration (mmoles)
E

135
0 12 24 36 48 60 720
2000
4000
6000
8000
0% O2
4% O2
6% O2
8% O2
12% O2
Time (h)
Acetate (mg/L)
0 12 24 36 48 60 720
500
1000
1500
20000% O2
4% O2
6% O2
8% O2
12% O2
Time (h)
Culture Density (mg/L)
0 12 24 36 48 60 720
500
1000
1500
2000
25000% O2
4% O2
6% O2
8% O2
12% O2
Time (h)
Ethanol (mg/L)
0 12 24 36 48 60 720
2
4
6
80% O2
4% O2
6% O2
8% O2
12% O2
Time (h)
Fructose (g/L)
C
A
D
B
Figure A-5. C. ljungdahlii-OTA1 metabolism in reduced medium. A) Growth, B) fructose utilization, C) ethanol production, D) acetate production

136
Figure A-6. C. ljungdahlii-OTA1 growing in reduced medium, headspace analysis at different O2 concentrations. A) 0 % O2 B) 4 % O2 C) 6 % O2 D) 8 % O2 E) 12 % O2

137
0 12 24 36 48 60 720
1
2
3
4H2
O2
CO
CO2
Time (h)
Gas concentration (mmoles)
0 12 24 36 48 60 720
1
2
3
4H2
O2
CO
CO2
Time (h)
Gas concentration (mmoles)
0 12 24 36 48 60 720
1
2
3
4H2
O2
CO
CO2
Time (h)
Gas concentration (mmoles)
0 12 24 36 48 60 720
1
2
3
4H2
O2
CO
CO2
Time (h)Gas concentration (mmoles)
A
D
B
C

138
0 12 24 36 48 60 720
1
2
3
4H2
O2
CO
CO2
Time (h)
Gas concentration (mmoles) E

139
0 12 24 36 48 60 720
500
1000
15000% O2
2% O2
4% O2
6% O2
8% O2
Time (h)
Culture Density (mg/L)
0 12 24 36 48 60 720
1
2
3
4
5
6
70% O2
2% O2
4% O2
6% O2
8% O2
Time (h)
Fructose (g/L)
0 12 24 36 48 60 720
500
1000
1500
2000
2500
0% O2
2% O2
4% O2
6% O2
8% O2
Time (h)
Ethanol (mg/L)
0 12 24 36 48 60 720
2000
4000
6000
8000 0% O2
2% O2
4% O2
6% O2
8% O2
Time (h)
Acetate (mg/L)
A
DC
B
Figure A-7. C. ljungdahlii-OTA1 metabolism in unreduced medium. A) Growth, B) fructose utilization, C) ethanol production, D) acetate production

140
Figure A-8. C. ljungdahlii-OTA1 growing in unreduced medium, headspace analysis at different O2 concentrations. A) 0 % O2 B) 2 % O2 C) 4 % O2 D) 6 % O2 E) 8 % O2

141
0 12 24 36 48 60 720
1
2
3
4H2
O2
CO
CO2
Time (h)
Gas concentration (mmoles)
0 12 24 36 48 60 720
1
2
3
4H2
O2
CO
CO2
Time (h)
Gas concentration (mmoles)
0 12 24 36 48 60 720
1
2
3
4H2
O2
CO
CO2
Time (h)
Gas concentration (mmoles)
0 12 24 36 48 60 720
1
2
3
4H2
O2
CO
CO2
Time (h)Gas concentration (mmoles)
A
DB
B

142
0 12 24 36 48 60 720
1
2
3
4H2
O2
CO
CO2
Time (h)
Gas concentration (mmoles)
E
Related Documents