0 Intergenerational social mobility during modernization: A micro-level study of two communities in southern Sweden 1830-1968 Martin Dribe* ([email protected]) Jonas Helgertz* ([email protected]) Bart van de Putte** ([email protected]) * Centre for Economic Demography and Department of Economic History, Lund University, Sweden ** Department of Sociology, University of Ghent, Belgium 2012-02-21 Abstract The aim of this paper is to study socioeconomic attainment and mobility in a confined geographic area over a period of more than 150 years. More specifically, using longitudinal individual level data from five parishes in southern Sweden, the paper focuses on how patterns of intergenerational social mobility changed from the early 1800s to 1968. In contrast to most previous research we are able to study an uninterrupted time period in which Sweden transformed from a pre-industrial to a mature industrial society. Based on theory and previous research we test different hypotheses linking changing social mobility patterns to the industrialization process by studying trends in two different areas. The analysis provides no uniform support for an immediate connection between industrialization and improved conditions for social mobility (upwards) and entry into the middle class. The chances of upward mobility clearly increased over time, but it is not equally clear that this development was stronger in industrializing areas than in rural ones. Moreover, the change seems to have connected to the period after the industrial breakthrough when Swedish industrial society matured and developed into a welfare state society. Finally, we find only weak support for the hypothesis that more siblings were detrimental to social mobility, and no support at all for the hypotheses that such an effect grew stronger with industrialization. This work has been done within the project “Towards the modern family. Socioeconomic stratification, family formation and fertility in a historical perspective”, funded by the Swedish Research Council (VR) and the Crafoord foundation. A previous version was presented at the annual meeting of the SSHA, Boston, November 2011.

Welcome message from author
This document is posted to help you gain knowledge. Please leave a comment to let me know what you think about it! Share it to your friends and learn new things together.
Transcript
0
Intergenerational social mobility during modernization: A micro-level study of two
communities in southern Sweden 1830-1968
Martin Dribe* ([email protected])
Jonas Helgertz* ([email protected])
Bart van de Putte** ([email protected])
* Centre for Economic Demography and
Department of Economic History, Lund University, Sweden
** Department of Sociology, University of Ghent, Belgium
2012-02-21
Abstract
The aim of this paper is to study socioeconomic attainment and mobility in a confined
geographic area over a period of more than 150 years. More specifically, using longitudinal
individual level data from five parishes in southern Sweden, the paper focuses on how
patterns of intergenerational social mobility changed from the early 1800s to 1968. In contrast
to most previous research we are able to study an uninterrupted time period in which Sweden
transformed from a pre-industrial to a mature industrial society. Based on theory and previous
research we test different hypotheses linking changing social mobility patterns to the
industrialization process by studying trends in two different areas. The analysis provides no
uniform support for an immediate connection between industrialization and improved
conditions for social mobility (upwards) and entry into the middle class. The chances of
upward mobility clearly increased over time, but it is not equally clear that this development
was stronger in industrializing areas than in rural ones. Moreover, the change seems to have
connected to the period after the industrial breakthrough when Swedish industrial society
matured and developed into a welfare state society. Finally, we find only weak support for the
hypothesis that more siblings were detrimental to social mobility, and no support at all for the
hypotheses that such an effect grew stronger with industrialization.
This work has been done within the project “Towards the modern family. Socioeconomic
stratification, family formation and fertility in a historical perspective”, funded by the
Swedish Research Council (VR) and the Crafoord foundation. A previous version was
presented at the annual meeting of the SSHA, Boston, November 2011.
1
1. Introduction
The long term development of patterns of social mobility has been a major research issue for
a long time both in sociology and economics. The main questions have been to what extent
social mobility differs between countries at different levels of development or with a different
institutional structure, and whether mobility changed during and after industrialization (see,
e.g., Ganzeboom, Treiman and Ultee 1991; Erikson and Goldthorpe 1992; Ferrie 2005; Long
and Ferrie 2007; Bourdieu, Ferrie and Kesztenbaum 2009; Van Leeuwen and Maas 2010;
Hout and DiPrete 2006). In turn, these questions are also related to issues of social
stratification more generally, and the extent to which these patterns are dependent on
economic development (see, e.g., Treiman 1976). A crucial distinction is between absolute (or
total) mobility and relative mobility, or what is sometimes referred to as social fluidity (e.g.,
Featherman, Jones and Hauser 1975). While total mobility may increase simply because the
social structure changes, relative mobility is measured net of such structural changes. Overall
total mobility does not seem to have changed to any considerable extent during
industrialization, but there appears to be considerable differences in mobility rates across
industrial societies (Van Leeuwen and Maas 2010). At the same time, Erikson and Goldthorpe
(1992) did not find big differences in relative mobility between countries at quite different
levels of development, and their conclusion of the “constant flux” is also supported by a
number of other studies (see Hout and DiPrete 2006; Van Leeuwen and Maas 2010). Some
comparative studies, most notably the one by Ganzeboom, Luijkx and Treiman (1989), have
found some increase in relative mobility in the post-war period, but the overall conclusion is
still that while the degree of openness varies somewhat between developed countries, the
patterns of relative mobility is basically the same (Hout and DiPrete 2006).
While most empirical studies have relied on aggregated mobility tables from contexts
at different levels of development (e.g., Featherman, Jones and Hauser 1975; Erikson and
Goldthorpe 1992; Ganzeboom, Luijkx and Treiman 1989) or historical data from marriage
certificates or population registers covering the onset of industrialization (e.g. Dribe and
Svensson 2008; Dribe and Lundh 2009, 2010; Maas and Van Leeuwen 2002, 2004; Zijdeman
2009; Maas and Zijdeman 2010; Van Bavel, Peeters and Matthijs 1998), few studies have
examined social mobility in a longitudinal perspective covering the entire period from pre-
industrial to post-industrial society, thereby enabling a more careful control of the setting and
of confounding factors (see, however, Van Leeuwen and Maas 1996).
The aim of this paper is to study socioeconomic attainment and mobility in a
confined geographic area over a period of more than 150 years. More specifically, using
2
longitudinal individual level data from five parishes in southern Sweden, we focus on how
patterns of intergenerational social mobility changed from the early 1800s and until about
1970. This enables an examination of an uninterrupted time period in which Sweden
transformed from a preindustrial to a mature industrial society. We thereby contribute to what
is arguably one of the most central topics in social stratification research, namely how
structural changes in the labor market, brought about by industrialization, affected
mechanisms of social mobility and attainment. We analyze two contexts affected very
differently by the industrialization process; one area experiencing substantial urbanization and
an expanding manufacturing industry and another which remained largely rural throughout
the period. Additionally, taking advantage of our longitudinal perspective, we assess the
degree to which parental investment in children (measured by number of siblings) affected
socioeconomic attainment and mobility and how its impact changed over time.
The results do not offer any unanimous support for a link between the degree of
industrialization and social mobility. While trends over time point to increasing social
mobility upwards and increasing chances of entering the middle class/elite group, it is not
clear that society was more open in the industrializing area than in the rural one. Moreover,
most of the change of time came in the period after the actual industrial breakthrough, when
Swedish industrial society matured and started its transformation into a modern welfare state.
Finally, our analysis does not offer strong support for the hypothesis that more siblings were
detrimental to social mobility, which casts some doubts on the importance of parental
investments for social attainment and mobility before and during industrialization in Sweden.
2. Theory
2.1. The relation between industrialization and social mobility and attainment
In preindustrial societies, the importance of land for socioeconomic status (income and
prestige) made inheritance and thus parental land holding of prime importance for status
attainment (see, e.g., Dribe and Svensson 2008 for Sweden), although lack of these inherited
assets could at least to some extent be compensated for through the marriage market (Dribe
and Lundh 2010). Similarly in artisan occupations sons often followed in their father’s
footsteps. This does not mean that mobility was absent. Studies of preindustrial societies have
typically found considerable social mobility, but mainly downwards (e.g. Dribe and Svensson
2008, Lundh 1999). This is linked to differences in reproduction and the difficulty of
reproducing high social status in rural contexts because of the connection to a rather fixed
supply of land (cf. Clark 2007).
3
Industrialization brought about overwhelming changes in the structure of the labor
market, with a massive growth in occupations within both the industrial and service sectors.
Across the Western world, industrializing countries during the nineteenth and early twentieth
centuries experienced growing employment shares within the industrial sector. This may have
led to dramatic changes of the social structure of regions and cities affected by this change.
There are different scenarios, however, depending on the specific outlook of the local
economy. The new economy may have led to the creation of a ‘new’ middle class. In modern
societies the middle class typically became dominant. Indeed, a new managerial and
administrative class and qualified technical and professional staff emerged with the rise of big
companies and government institutions. In the case of Belgium, artisans emphasized the
commercial dimension of their activities, and the whole trade sector, from the most modest
shops to the new Grand Bazaar department store, grew impressively in size and diversity (Van
de Putte et al., 2009). Yet, particularly in the early stages, industrialization can also have led
to the creation of more lower class positions (e.g. in iron industry, mining, and textile
industry). In addition, the old economy may have been affected in different ways. The
economic changes may have led to the exodus of unskilled farm workers and/or to the
proletarization of farmers and the ‘old’ artisanal middle class.
In short, while the economic change was dramatic, the consequences for the class
structure was, at least during the initial stages of industrialization, not uniform over different
types of economies. It is therefore difficult to formulate general statements on the
consequences for absolute mobility. We address this issue in relation to Sweden in section
2.3.
The new economy did not only change mobility patterns via changes of the class
structure, but also through changing mechanisms of socioeconomic attainment. According to
the liberal theory of industrialism, economic development sponsors more mobility and
encourages equal opportunities. While access to land represented a key transmitter of status
across generations in preindustrial societies, one consequence of increasing opportunities for
employment outside the agricultural sector is presumably an increasing reliance on
achievement rather than ascription as selection criteria (see, e.g., Blau and Duncan 1967). The
triumphant nineteenth-century bourgeoisie imposed an ideology of individual merit and
competition (Van de Putte et al., 2009), while the growing importance of larger firms and
state institutions with more fine grained hierarchical structures and the need for more formally
educated employees also stimulated meritocratic procedures of recruitment and promotion. In
4
this perspective new occupations were less dependent on father’s skills and prestige (see e.g.
Zijdeman 2009).
However, social origin could also remain an important determinant of status
attainment through a different mechanism. In contradiction to the meritocracy claim, it can be
argued that strategies of social closure – which is the process by which certain people are
excluded from participation in social groups, for example by using criteria such as race,
language, religion, geographical, or social origin – and social reproduction, for example by
increasing investment in children, did not fade away in the nineteenth century. Strategies of
social reproduction, became more important in a more competitive environment. Instead of
the straightforward transmittance of land or firms, higher status groups turned to other forms
of influence to maintain the status of their children, for example through the use of
occupational networks or wealth (see Grusky 1983), or by investing in the educational career
of their children by providing economic, social and cultural capital (see Bourdieu and
Passeron 2008). In such a situation, higher social status could be expected to lead to higher
educational investments in children through better knowledge and information about
educational systems, and to better access to economic and intellectual resources, which should
facilitate successful accumulation of human capital on the part of the children.
2.2. Trends in total and relative mobility over time
These different views on the relation between industrialization and social mobility and
attainment have inspired much research (see, e.g. Van Leeuwen and Maas 2010, Hout and Di
Prete 2006; Ganzeboom, Treiman and Ultee 1991). Originally it was typically believed that
even though total mobility did not differ much across developed countries, industrialization
was associated with increased mobility (Lipset and Bendix 1959). Subsequent empirical
research has generally failed to support both these propositions. Total mobility appears to
have varied quite a bit across Western countries in the post-war period and it has been
difficult to identify a strong increase in total mobility following industrialization (see Van
Leeuwen and Maas 2010). The latter conclusion, however, appears often to be based on
research that either only covers the initial phases of industrialization or that compares
mobility tables from different countries and/or periods, and thus not on longitudinal studies
covering the entire period if industrialization. However, also when looking at the historical
city of Berlin between 1825 and 1957, Van Leeuwen and Maas (1996) could not detect any
increase in total mobility following industrialization, while this seems to have been the case in
their study of late nineteenth century Sundsvall; a small town in northern Sweden which
5
experienced industrialization connected mainly to the expansion of the sawmill industry
(Maas and Van Leeuwen 2002).
Since the study of Featherman, Jones and Hauser (1975), dealing with social
mobility in the United States and Australia, relative mobility has been more in focus than total
mobility when looking at the connection between industrialization and social mobility, or at
cross-country comparisons more generally. The basic idea is that mobility chances depend on
the opportunity structure, i.e. the social structure of society, and if industrialization changes
the occupational structure it will also affect total mobility, almost by definition. Relative
mobility is the chance of mobility net of these structural changes. Often it has been analyzed
using log-linear models, logistic regression controlling for relative group size, or, as in the
case of more recent research by Ferrie and colleagues (Ferrie 2005, Long and Ferrie 2007,
Bourdieu, Ferrie and Kesztenbaum 2009) the Altham statistic (Altham and Ferrie 2007). All
these methods take the difference in marginal distributions (relative size of different
occupational groups) into account when looking at the chance of mobility.
In their seminal study, The Constant Flux, Erikson and Goldthorpe (1992)
empirically examined intergenerational mobility regimes in nine European countries using
aggregated data. Examining cohorts born from the early 1900s and until 1950, they failed to
find consistently higher relative mobility in more industrial societies. More specifically,
industrialization did not bring about a persistent increase in neither absolute nor relative
mobility rates. Instead, the major change in mobility patterns that resulted from
industrialization was the substantial outflow from the agricultural sector and into the
industrial sector, confined to a limited time period. Ganzeboom, Luijkx and Treiman (1989)
found some increase in relative mobility over time, but as their study only covered the post-
1950 period it remains unclear regarding what it says about the long term connection between
industrialization and social mobility.
Comparing Britain and the United States, Long and Ferrie (2007, see also Ferrie
2005) showed that while the United States had exceptionally high relative mobility in the
nineteenth century, this difference had disappeared by the second half of the twentieth
century. They provisionally connected this convergence in relative mobility to a convergence
between the countries in access to education and migration. Similar conclusions about
nineteenth century American exceptionalism and twentieth century convergence in relative
mobility were drawn from a comparison between the United States and France (Bourdieu,
Ferrie and Kesztenbaum 2009). Obviously these results do not support a clear positive
association between industrialization and social mobility. Instead, mobility in the more
6
industrial Britain was lower than in the less industrial United States in the second half of the
nineteenth century, and in the subsequent period mobility declined in the United States as
industrialization gained speed, while it increased in Britain in the later phases of
industrialization (Long and Ferrie 2007).
All in all, these results remain rather unspecified. Specific mobility patterns depend
on the socio-structural context. Also, more insight in the mechanisms underlying mobility
patterns can be gained by linking mobility chances not only to context characteristics, but also
to individual characteristics – such as the number of siblings. Finally, there are also
methodological issues to be addressed. How socioeconomic position, and hence mobility, is
conceptualized requires more attention. These topics will be discussed in the coming sections.
2.3. Socio-structural changes in Sweden
In Sweden, towards the end of the 1940s, the employment shares in the services and industrial
sectors within a few years of each other overtook the share employed in the agricultural sector
(Schön 2007). This can be viewed as the definitive completion of the transition to an
industrial society, partially being the result of a continuous decline of the employment share
within agriculture that had lasted for over 70 years. Simultaneously, the foundation for the
break-through of the industrial sector was made during the second half of the nineteenth
century, when substantial investments were made. Not only did the industrialization process
imply a changing labor market structure, but also a massive expansion of the number of
individuals in paid labor. During the 40-year-period from 1890 and until 1930, the number of
individuals in paid labor outside the agricultural sector more than doubled. In the period
studied, the proportion employed in agriculture declined from over 70 percent in 1850 to
roughly 10 percent at the end of the 1960s (Krantz and Schön 2007).
A process occurring parallel to the industrial expansion was that of urbanization,
owing to the fact that the majority of the new job opportunities in factories were located in
urban areas. While rural-urban migration not necessarily implied social mobility, it frequently
involved a move out of primary production (De Vries 1984). Thus, as a consequence,
opportunities for social mobility and attainment could be expected to differ between urban
and rural areas because of varying occupational structures.
For this reason it is important two distinguish between different types of
socioeconomic change at the contextual level. In this paper we look at two different
communities, one rural area which industrialized and one area that remained largely rural
during the whole period. They are located about 25-30 km apart in the western part of Scania
7
in southern Sweden. The industrializing area consists of the parishes Hög and Kävlinge.
Kävlinge grew rapidly from 1890 onwards. While Hög retained its rural character, the parish
is adjacent to Kävlinge and due to the very small distances (about 5 km between the parish
centers) it was drawn into the urban field. For example it was easy to walk to work at the
sugar factory or one of the leather mills. From Table 1 the rapid growth of the population in
this area after 1890 is clearly evident, and most of this growth happened in Kävlinge. On the
contrary, the rural area, consisting of the parishes Halmstad, Sireköpinge and Kågeröd, grew
modestly until 1910 and then experienced a declining population for the rest of the twentieth
century. In these parishes there were no similar industrialization and urbanization processes as
in Kävlinge, yet, some modest change was visible in the 20th
century.
Table 1 here
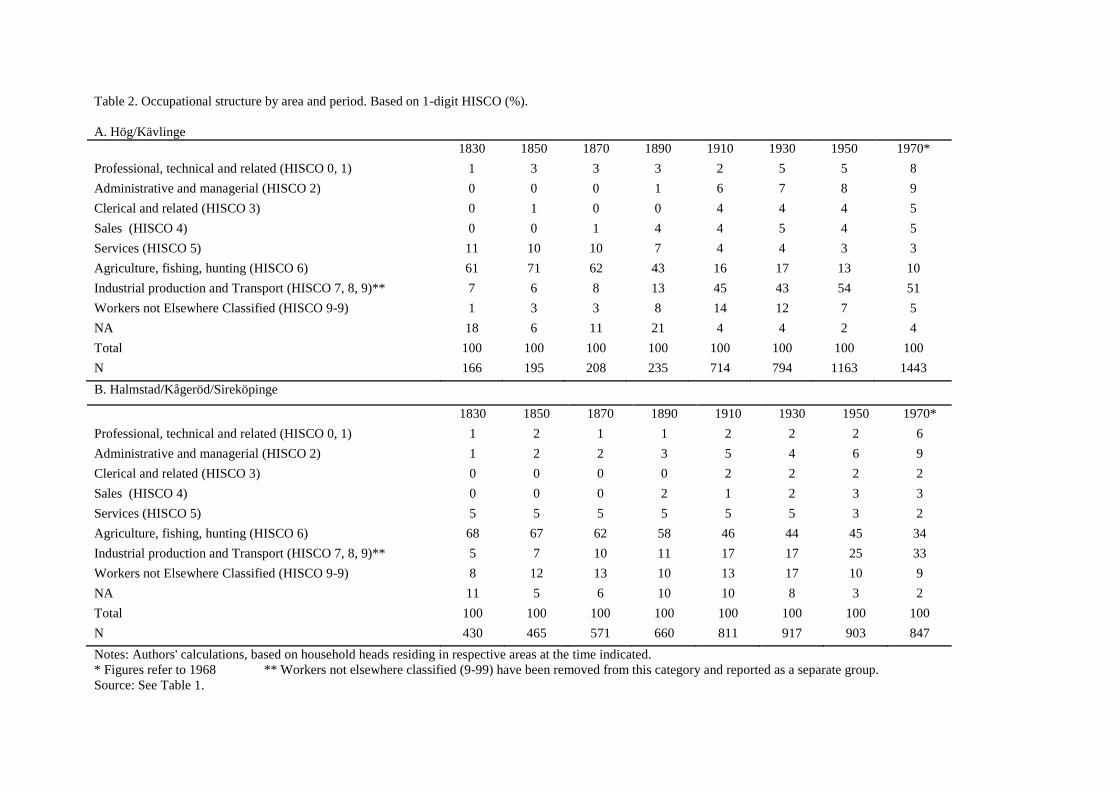
Table 2 provides an illustration of the different developments in the two areas. It
shows the occupational structure based on the 1-digit level of HISCO (Van Leeuwen, Maas
and Miles 2002). Looking first at Hög/Kävlinge the declining relative importance of
agricultural occupations from the last quarter of the nineteenth century emerges clearly. In
1870, 62 percent of the family heads were employed in agriculture, which then declined to 16
percent in 1910. Instead, the proportion employed in the industrial sector rose from 8 percent
in 1870 to 45 percent in 1910. In the rural area this process was much slower. As late as
1950, 45 percent of the family heads were still employed in agriculture and only 25 percent in
industrial occupations.
Table 2 here
Based on the preceding discussion, it is reasonable to expect that changes in the
occupational structure as a consequence of industrialization affected the pattern of social
mobility. In the urban-industrial parishes, the occupational structure provided semi-skilled
and skilled positions, offering new possibilities for unskilled farm workers, while in the rural
parishes this was not the case. This lead us to formulate the following hypothesis:
Hypothesis 1. Absolute (upward) mobility increased during industrialization in Kävlinge/Hög
while it remained unchanged in Halmstad/Sireköpinge/Kågeröd
As the expansion of the industrial sector primarily affected the urban areas, different
prerequisites for social mobility between urban and rural areas may have been the result,
according to the thesis of industrialism. In contrast to this claim, following the social
reproduction thesis, it can be postulated that even in more modern societies families managed
8
to transmit their social position to the next generation. While the educational system was only
fully developed later in the twentieth century, we cannot exclude that families found other
strategies for transmitting their position to the next generation (e.g. via social capital). Hence
the following competing hypotheses are formulated:
Hypothesis 2A: According to the thesis of industrialism, relative mobility increased during
(early) modernization/industrialization in Kävlinge and Hög
Hypothesis 2B: According to the social reproduction thesis, relative mobility did not increase
during (early) modernization/industrialization.
2.4. Mechanisms underlying social mobility and attainment
Regardless of the question whether relative mobility increased or not, there are indications
that the mechanisms underlying social mobility and attainment changed. A modern
competitive society requires more investment in children. While knowledge and information
about educational systems can be easily shared also in large families, both economic
resources and parental time are scarce resources which need to be shared among siblings.
According to the resource dilution hypothesis more siblings would then, all other things equal,
lead to less resources and lower educational attainment, or perhaps educational attainment of
lower quality (see Van Bavel 2006, Van Bavel et al. 2011). Controlling for social origin,
children growing up in smaller families would thus have better access to resources and
therefore be expected to be more likely to attain higher status and to be upwardly mobile.
This effect is most likely to have emerged during industrialization when human
capital became increasingly important for attainment and individual productivity (wages). Not
surprisingly, increasing demand for education has also been seen as a crucial factor behind
declining fertility in the demographic transition (see, e.g., Dribe 2009) at least partly through
a trade-off between quantity and quality of children, where parents opt for fewer children but
invest more in each child (Becker and Lewis 1973; Becker and Tomes 1976; Wahl 1992).
There is considerable empirical support for the resource dilution hypothesis in
various contexts during or after the demographic transition (Van Bavel 2006, Van Bavel et al
2011; Bras, Kok and Mandemakers 2010; Ferrari and Dalla Zuanna 2010; Marteleto 2010).
Recent studies of Prussia and England have even found support for an effect of family size on
education or literacy before the demographic transition (Becker, Cinnirella and Woessmann
2010; Klemp and Weisdorf 2011). Nevertheless, it seems logical to expect the effect of
number of siblings on social attainment to have increased during industrialization as the trade-
9
off between quantity and quality of children became increasingly important, and this is also
supported by the empirical findings (Bras, Kok and Mandemakers 2010; Marteleto 2010).
While at first sight this process is tightly linked to the new, modern economy, it may
have had implications for the society as a whole. The new view on children fitted modern
values. According to modernization theory, economic development is associated with
widespread cultural changes. More specifically, traditional values are universally replaced by
“modern” values (see e.g. Inglehart and Baker 2000). Evidence of the spread of modern
values includes the increasing importance of education as well as changing gender roles.
Hence, the consequences of modernization are believed to occur alongside industrialization,
but affecting the entire society.
Nevertheless, while not only families living in urban or industrial areas may be
inspired by these values, it does not imply that everybody profited from a lower number of
siblings. For children of unskilled farm workers in rural parishes there were few opportunities
for them to move up – regardless of the number of siblings. For children of farmers, a lower
number of siblings may – as always – have been useful, giving them more chance to inherit
the farm.
Hypothesis 3A: According to the resource dilution hypothesis, having more siblings was
associated with lower chances of upward social mobility.
Hypothesis 3B: This association got stronger with industrialization when education became
increasingly important for social attainment and mobility
2.5. What social mobility?
Finally two issues related to the conceptualization of class and mobility warrants discussion.
Each of them has methodological consequences. First, when measuring the consequences of
industrialization and urbanization on mobility, conflating class and economic sector needs to
be avoided (Van de Putte and Svensson 2010). The interest is not in measuring (evident)
consequences of these processes on the mobility from the agricultural to the non-agricultural
sector. Such a shift may simply mean the mobility from one unskilled position to another. For
this reason, a class scheme (SOCPO) which is not based on sector is used (see methods
section).
Second, not all social mobility is the same. For early-industrial societies, the most
relevant threshold is the one between the lower class and the middle class. Middle class
positions are defined by the presence of property that provides stable subsistence
10
opportunities (e.g. self-employed artisan business, medium-sized farming business), non-
manual skills (e.g. office clerks) or substantial hierarchical power (e.g. lower managers, not
agricultural or factory foremen supervising unskilled or semi-skilled workers). In the new
industrial economy, non-manual skills and property and hierarchical power of this scale can
be assumed to mark the line between middle class and below (Van de Putte & Miles, 2005).
For this reason, mobility and attainment will not only be discussed in general terms, but the
focus will also be directed towards the determinants of attaining middle class positions and
higher when evaluating the consequences of industrialization and urbanization.
3. Data
We study the intergenerational transmission of socioeconomic status in a sample of
individuals observed from 1830 to 1968, using data from the The Scanian Economic-
Demographic Database (SEDD, Bengtsson, Dribe and Svensson 2012). For the studied
parishes, data from continuous population registers that contain information on demographic
events, including migration to and from households were obtained, for all members of
households and families within households. The vital events have also been checked against
the birth and death registers to adjust for possible under-recording of events in the population
registers. The data from the population registers have also been linked to poll-tax registers
(mantalslängder) which provide annual information on occupation of the family head
(available up to 1945). In addition, occupational information from annual income- and
taxation registers has been linked from the 1860s, and from about 1905 they are available on
an individual basis. The resulting database contains all individuals born in the different
parishes, or migrating into them.
Due to the focus on intergenerational socioeconomic mobility, a necessary condition
for being selected into the sample is that socioeconomic status can be observed for both the
individual and the father. While the data covers all individuals living in the parishes, the
substantial migration in and out of the parishes implies the existence of a high share of
individuals who are either only observed during childhood or only during adulthood. To
partially ameliorate this weakness, individuals born until 1895 were tracked to their parish of
birth in order to obtain their father’s socioeconomic status at their time of birth. As a result,
among all individuals in the SEDD who belong to the birth cohorts studied in this paper,
socioeconomic status observed during childhood is observed for a satisfactorily high share of
the population. A missing observation on the individual’s own socioeconomic status during
adulthood represents the other source of such sample selection, again primarily due to
11
migration. In this case, individuals have not been linked to their adulthood occupation if it
was obtained subsequent to migration.
Despite the weakness of the SEDD in terms of sample selection, the data
nevertheless provides several advantages. The time period examined covers the entire
transition from rural society, via industrialization, and into and emerging welfare state. Using
a comparatively large sample, the paper offers unprecedented opportunities to examine how
regimes of intergenerational mobility changed over time. Of particular interest is naturally the
first half of the twentieth century which has remained virtually unstudied using longitudinal
individual level data. Furthermore, the possibility of comparing an industrializing area with a
rural community in the same region provides excellent opportunities to study the
consequences of the changing labor market structure associated with industrialization and
beyond.
4. Methods
Socioeconomic status is measured using data on occupation recorded at demographic events,
when entering the population registers, or on an annual basis in the poll-tax registers and
income registers. Occupations reported in the database have been coded into HISCO (van
Leeuwen, Maas and Miles 2002), and subsequently classified according to SOCPO (Van de
Putte and Miles 2005). SOCPO classifies occupations and titles into five different classes
based on a notion of social power. Social power indicates the control of resources, which in
turn serves as a measure of independence. Independence, in turn, determines the individual
degree of control, authority and replaceability. Social power is a function of both economic
power (income, property, etc.) and cultural power (e.g. prestige, not primarily related to
economic power). In case of multiple occupational notations the highest status has been used.
Table 3 provides an explanation of the different classes.
Table 3 here
Intergenerational mobility is measured by comparing the SOCPO of the individual’s
father at the time of birth with attained status at age 40. In the case of the individual not being
born in the parish but in-migrating before the age of 10, the SOCPO of the father observed at
the earliest point of time before the age of 10 is used. Furthermore, if the individual is not
observed at age 40, the SOCPO observed at the age closest to 40 is used, given that the
observation occurs after age 30. Both men and women are included in the sample, where the
attained socioeconomic status for women typically refers to their husbands’ occupation.
12
While the SOCPO classification contains five separate status levels, of particular
interest for this paper is to examine whether the entry into the middle class and elite group
became more likely following industrialization. Therefore, part of the analysis treats the
occupational class distribution as a dichotomous variable, distinguishing between lower (SP
1-3) and the middle/elite classes (SP 4-5).
In order to test the hypotheses about changing probabilities of social mobility over
time the sample is divided into three periods, indicating the time when the individual attained
their adulthood occupation: 1830-1869, 1870-1919 and 1920-1968 which broadly represents a
preindustrial or early industrial phase, the breakthrough phase, and the phase of maturing
industrialization and emergence of the welfare society. The development into a post-industrial
society largely falls outside the period under study. The analysis also accounts for differences
in opportunity structures between the area which remained largely rural
(Halmstad/Kågeröd/Sireköpinge) and the one whose labor market became substantially
influenced by the consequences of industrialization (Hög/Kävlinge).
In the multivariate analysis, five different models are estimated for each of the main
issues, social mobility and attaining middle class/elite status. Social mobility is analyzed
using multinomial logit models with upward and downward mobility as the competing
outcomes (vs. no mobility as the base outcome). Attaining middle class/elite status is analyzed
using a binary logit model where this outcome is measured relative to attaining worker status
(SP1-3).
All models control for age, age squared and sex. The first model (M1) test the
hypothesis of increasing absolute mobility over time by including the period covariates, and
the second model (M2) tests the hypothesis of differences between the areas as well as if the
period effects differ between the two areas using interactions between area and period. Model
3 (M3) tests the hypothesis of changing relative mobility by including period and relative
group size, while model 4 (M4) addresses area differences and interaction between area and
period in relative mobility. Relative group size is the proportion of the population of family
heads in the social group of origin at the time of attainment (measured over decades from
1830-1970). Thus, for an individual from elite origin born in 1804, and measured for
attainment in 1844, the proportion of the elite group in the period 1840-1850 is used as the
relative group size to measure the opportunity structure. Finally, models 5 and 6 (M5, M6)
test the hypothesis about the influence of sibship size on relative mobility chances by
including a categorical variable indicating number of siblings. While M5 gives the basic
effects, M6 also adds controls for migration status and social origin. In the analysis of middle
13
class/elite attainment a model is also estimated only for the subsample originating in the
working classes (SP1-3).
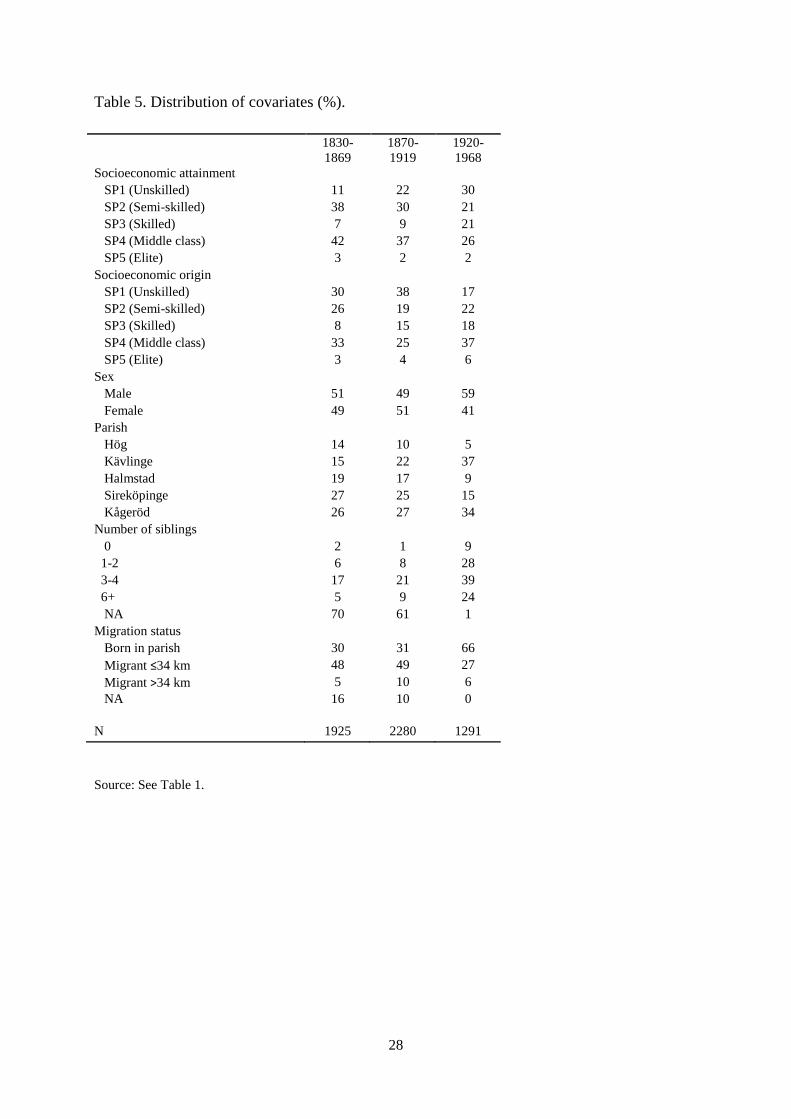
Table 5 displays the distributions of all covariates used in the estimations by period.
The total sample size is 5,496 individuals, where the influence of migration on the sample’s
composition tentatively emerges most clearly in the final time period. More specifically, the
share of individuals who are born in the parish of residence increase dramatically over time
which is explained by the lack of information about parental socioeconomic status for
individuals not observed in their parental home during this period.
Table 5 here
5. Descriptive analysis
Looking at socioeconomic attainment in adulthood in Table 5, it is quite clear that the most
noticeable change over time is the increased importance of skilled workers, going from 7 to
21 percent. Perhaps unexpectedly, the middle class is shrinking over time, which is explained
by the fact that farmers are included in this category.
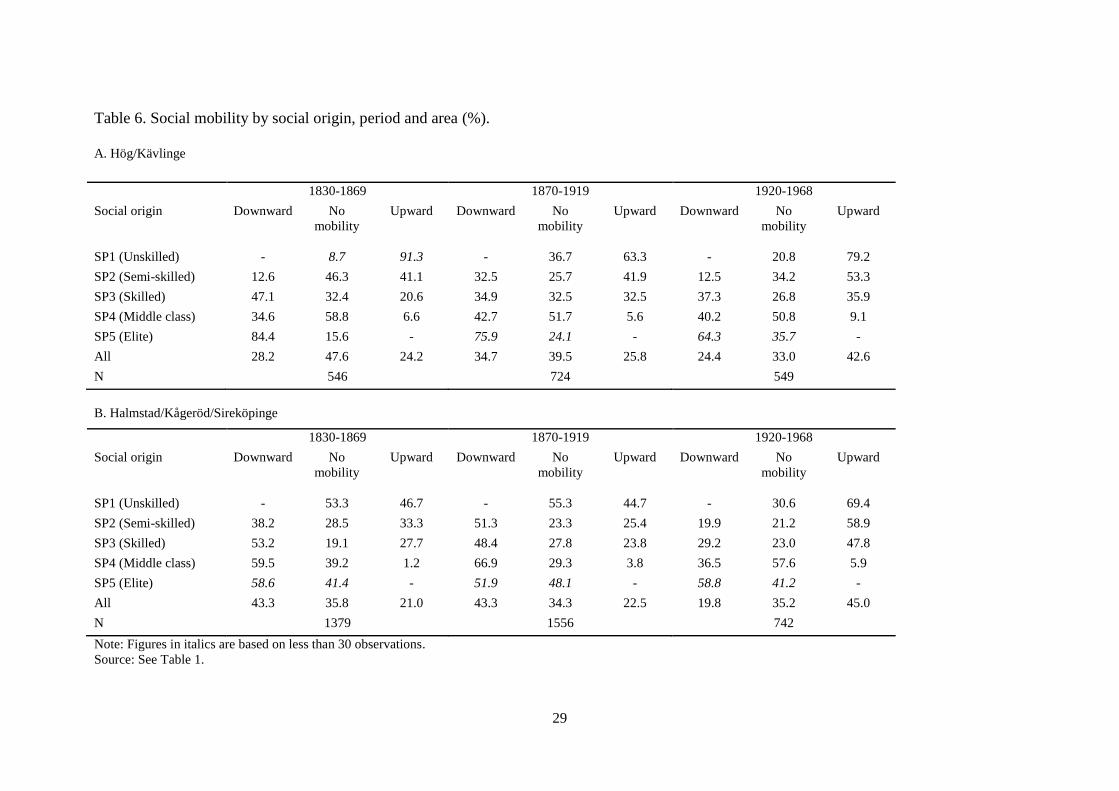
Table 6 pictures absolute mobility by socioeconomic origin and also differentiates
between period and area in order to obtain an initial indication regarding how mobility
regimes differed over time and across contexts. Looking first at all social groups, absolute
mobility increased in Hög/Kävlinge during the first decades of industrialization (1870-1919)
and continued thereafter (1920-1968). In the completely rural parishes no similar
development took place. This seems to offer at least partial support for our first hypothesis:
total mobility appears connected to industrialization (change over time in the industrializing
community) but not with modernization more generally (no change over time in the rural
parishes). However, the change in the industrializing community came from much lower
levels of mobility in the first period, leaving total mobility quite similar in the two areas in the
final period, which runs against expectations.
Turning to the direction of mobility, there are some noteworthy differences between
the two areas in the first period. Individuals with low status origins enjoyed more favorable
outcomes in Hög/Kävlinge. This was most obvious for those originating in the lowest status
group, where over 90 percent enjoyed upward intergenerational mobility in Hög/Kävlinge,
compared to 47 percent in Halmstad/Kågeröd/Sireköpinge (note that the former figure is
based on a small number of cases). Furthermore, among those in low class origins and in the
middle class (basically the farmers), a considerably larger share suffered from downward
intergenerational mobility in Halmstad/Kågeröd/Sireköpinge. Downward mobility was high,
14
but it did decrease considerably after 1920. While the opportunities on average appear to have
been more favorable in Hög/Kävlinge among individuals in the first birth cohort, those born
into the elite group (SP5) represent a starkly differing case. In Hög/Kävlinge, a staggering 84
percent experienced downward intergenerational mobility, a figure that was roughly 25
percentage points lower in Halmstad/Kågeröd/Sireköpinge.
Table 6 here
In both areas the overall chances of upward mobility increased over time, but the
biggest change was not between the first and the second period but between the second and
the third, when the total proportion moving upwards increased from 25.8 and 22.5,
respectively, to 42.6 and 45.0 percent.
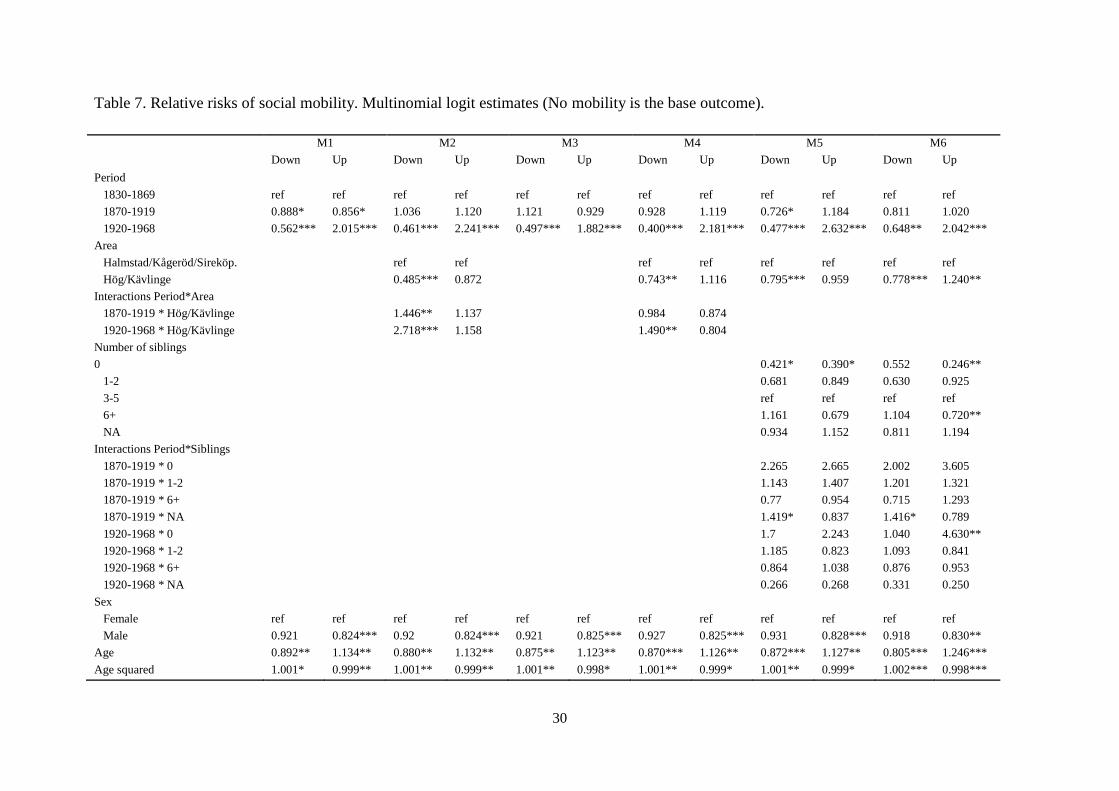
6. Multivariate results
Table 7 shows the relative risks of downward and upward mobility (vs. no mobility) estimated
by the five different models previously discussed. M1 shows a declining risk of absolute
downward mobility over time and increasing chances of upward mobility. While the decline
in downward mobility appears to have been roughly linear this was not the case for upward
mobility, where the big change took place in the final period. M2 first shows that the
declining risks of downward mobility mainly affected the rural area
(Halmstad/Sireköpinge/Kågeröd) as indicated by the positive interaction effects for
Hög/Kävlinge. Calculating area specific relative risks by period reveal that in the rural area
the period effects were 1.036 for 1870-1919 and 0.461 for 1920-1968 (compared to 1830-
1869), while the corresponding effects in the industrializing area were 1.498 (1.036*1.446)
and 1.253 (0.461*2.718). Thus, while downward mobility became less likely over time in the
rural area it actually increased in the industrializing area, at least in the second period. The
different developments in the two communities were also statistically significant.
Turning to upward mobility, the picture is different as the trends did not differ
significantly between the areas. Instead, chances of upward absolute mobility increased over
time in both areas and particularly in the final period when chances of moving upwards more
than doubled.
Looking instead at differences between the areas, it is evident that absolute mobility
was lower in Hög/Kävlinge in the preindustrial period (especially downward), and that there
was a clear convergence over time, and even a reversal in the final period when chances of
downward mobility was actually higher in Hög/Kävlinge than in the rural parishes.
15
We now turn to relative mobility in M3 and M4, which is measured by adding a
control for the relative size of the origin group at the time of attainment. By looking at the
period effects in M3, the picture is fairly similar to that of absolute mobility, but the decline in
downward mobility did not occur until the final period. In terms of relative mobility there was
not much change during the breakthrough phase (1870-1919). In the final period risks of
downward mobility declined to about half the previous level, while the chances of advancing
socially almost doubled. As was the case for absolute mobility there were some differences
between the areas in terms of downward mobility in the final period, but the overall pattern in
both areas was that the risk of downward mobility declined in the last period, but to a lesser
extent in the industrial area. The net effects for the final period for downward mobility was
0.40 in the rural area and 0.60 (0.400*1.490) in the industrial area, and the difference was
statistically significant. This may seem counterintuitive at first sight, but might be explained
by an increasing importance of rural-urban migration. If increasing proportions of individuals
of farming origin (middle class) who could not reproduce their parental status decided to
move to urban areas rather than ending up in the lower rural classes, this is the expected
pattern. In other words, it is difficult to conclude that the stronger declining risk of downward
mobility in the rural areas was connected to any positive development in terms of local
opportunities.
For upward mobility there was no statistically significant difference in the period
effects between the two areas, but the interaction effects indicated that the increasing trends
were a bit stronger in the rural area than in the more urban one. Taking a different perspective
and comparing mobility across areas, it seems clear that downward mobility (both absolute
and relative) was more frequent in the rural area in the first period before the industrial break-
through, but then converged and even reversed so that risks of downward mobility was higher
in the industrializing area than in the rural in the final period.
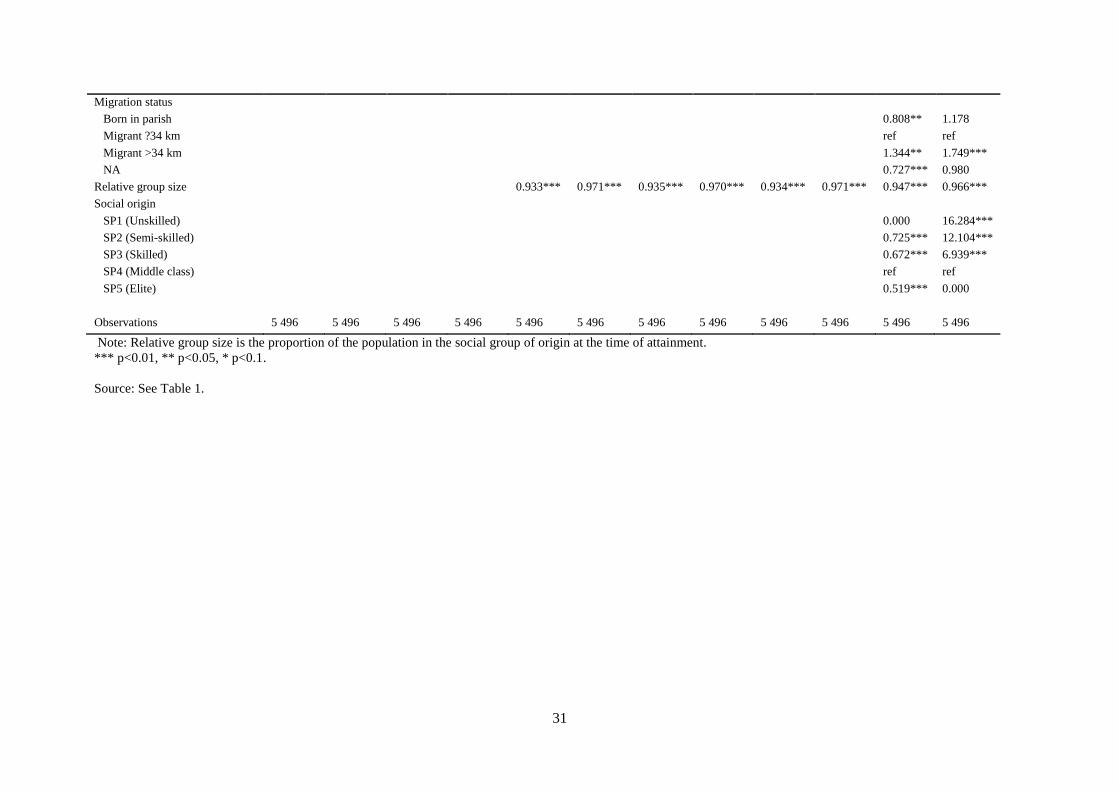
In M5 and M6 we analyze the impact of number of siblings on individual mobility
chances. In the first period having few siblings (up to 2) was related to lower chances of both
downward and upward mobility. Over time this pattern changed quite dramatically as shown
by the interaction effects (even though they are not statistically significant they are of a
considerable magnitude). The negative effect on upward and downward mobility of having
fewer siblings diminished. It is possible that the negative effect in the first period was a
selection effect in the sense that having few siblings in this period was outside the norm of
moderately high fertility, and these families might have had other unobserved characteristics
16
accounting for the low chance of advancement of their children. When fertility declined it
became more the norm to have smaller families and this selection effect was removed.
What is perhaps more relevant for our hypothesis is that there is at least some
indication that having many siblings (6+) was related to lower chances of upward mobility.
The relative risk was 0.68 (not statistically significant) in the first period and the net effects
for the subsequent periods were 0.65 and 0.70, respectively. In a model without period
interactions the effect was also statistically significant (RR=0.70, p=0.004, results not shown).
These results point to a possible effect of number of siblings on upward mobility in line with
our hypothesis, and also, which is more unexpected, that this effect did not change at all over
time.
Table 7 here
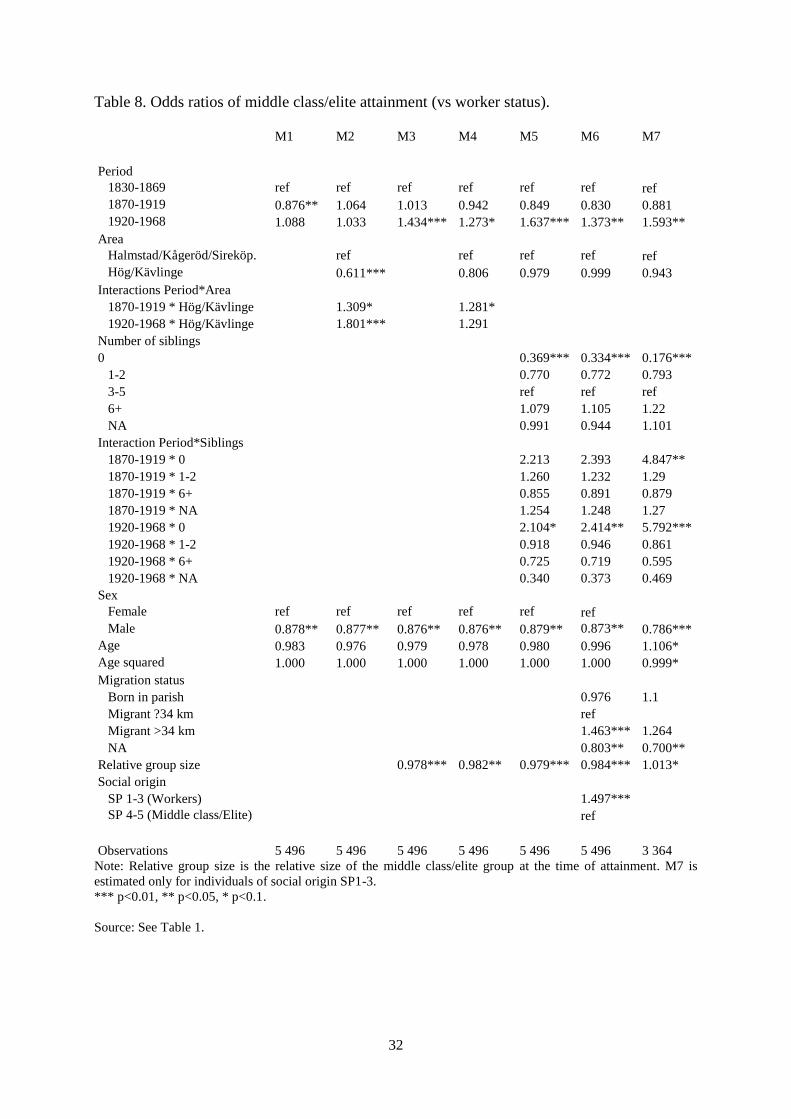
Having looked at absolute and relative mobility more generally we now turn to an
analysis of attaining middle class/elite status. The modeling structure is the same as
previously. The odds ratios are displayed in Table 8. The picture emerging is quite similar to
the one observed when looking at social mobility. In M1 we see that the chances of attaining
middle class/elite status declined in the second period and increased again ending up at the
same level as in the first period. M2 shows that this pattern could be explained by
compositional changes between the parishes. Looking at each area separately, the chances of
attaining middle class/elite status did not change at all over time in the rural parishes, while it
increased in Hög/Kävlinge as shown by the interaction effects. Calculating net effects shows
that the odds of attaining middle class/elite status was about 40 percent higher in the second
period than in the first, and almost 90 percent higher in the third period compared to the first.
This seems to offer clear support to the hypothesis that industrialization was connected to
expanding opportunities of entering the middle class. However, it should be noticed that the
change in the Hög/Kävlinge started from much lower levels than in the rural area, as indicated
by the area effect. This was also clear in the previous descriptive analysis. Thus, even though
the trends are consistent with our hypothesis, the chance of attaining middle class/elite status
was lower in the industrializing area in the second period and about the same in both areas in
the final period.
Table 8 here
Turning to relative mobility in M3 and M4 the pattern is similar to that of absolute
mobility, even though M3 and M1 look quite different. In M3 there is no difference between
the first and the second period, while there is a significant increase between the second and
the third just as was the case in M1. Thus, when controlling for the opportunity structure, it
17
became more likely to enter the higher classes in the final period. Looking at this time trend in
the two areas separately the increasing trend was stronger in the industrializing area, but as
with absolute mobility, it was an increase from initially low levels implying a convergence in
the chances of middle class/elite attainment rather than a divergence. In the final period the
odds of middle class/elite attainment in Hög/Kävlinge was 1.04 relative to the rural parishes,
pointing to very similar conditions in the two areas.
Finally, M5-M7 show the impact of number of siblings on the chances of middle
class/elite attainment. The estimates are quite similar in the three models, which shows that
the observed pattern was not dependent on social origin. Quite unexpectedly, those with few
children were less likely to reach the higher classes than those with more 3 or more siblings.
This was most extreme during the first period, but also the later periods showed the same
pattern. In the second and third periods the net effects for those with no siblings (compared to
3-5 siblings) was about 0.8, while the corresponding figures for those with 1-2 siblings was
0.97 in the second period and 0.71 in the third (none of these effects were statistically
significant). For those with 6 or more siblings the chance of reaching the middle class or the
elite was only slightly lower than for those with 3-5 siblings and none of the effects were
statistically significant. In fact the relative risks for 1-2 siblings and 6 or more were fairly
similar. Thus, having fewer siblings does not seem to have promoted middle class/elite
attainment neither for individuals from worker origins not in the population as a whole. One
reason for this could be the more egalitarian basic school system in Sweden with mandatory
basic education already in the mid-nineteenth century (Larsson 2011). This made it possible
also for children in large families to attend school and get basic training. In this way society
took responsibility for the quality of children lowering the effect of the quantity-quality trade
off.
7. Conclusions
In the first stage of industrialization there was an increase of absolute downward mobility in
the industrializing context of Kävlinge and Hög. Upward mobility increased only slightly.
This is related to the type of industrialization. In this first stage this created mainly unskilled,
semi-skilled and skilled jobs in sectors such as the sugar and leather industries. For children
of farmers, belonging to the old middle class, this was an experience of proletarization. In the
second period, after 1920, absolute mobility further increased, but now it was predominantly
upward mobility. Moreover, our analysis reveals that upward mobility led to the increasing
chance to take middle class and elite positions in this period. In this stage, new middle class
18
(and elite) positions increasingly became available, as is clear from the increasing number of
occupations in the categories of professional, technical and related occupations, the
administrative and managerial occupations, and the clerical and sales sector. Altogether, for
the industrializing context we can confirm our first hypothesis that industrialization went
together with increased mobility, via proletarization in the first period and the emergence of a
new middle class in the final period. Turning to relative mobility make clear that the change
in the final period is still present after controlling for group sizes (both for general mobility as
for the chance to attain a middle class or elite position), albeit less strong than the rise in
absolute mobility. This confirms our hypothesis in the industrializing context there was some
increase in relative mobility. This supports the idea that meritocracy gained strength, at least
in the long run when the new middle rose.
The results for the rural context complicate the picture, however. First, levels of
mobility were much higher in the parishes that did not industrialize in the later stages
(Halmstad, Kageröd and Sireköpinge). Mainly downward mobility was high, and continued to
be high in the first decades of the 20th
century. This situation is nowhere near the classically
portrayed stable, immobile rural context. This finding is however in line with previous
findings for this region, and can be related to the failure of farmers to hand over a stable
business to all of their children, who consequently end up as farm worker. This is a type of
proletarization inherent to the 19th
century Scanian agricultural system which is not related to
industrialization. The fact that this phenomenon is less strong for Kävlinge and Hög in their
rural period may be related to institutional factors, these villages being freeholders parishes,
while Halmstad, Kageröd and Sireköpinge were manioral parishes.
Second, our hypotheses on the lack of change in mobility did not find support in our
analysis. When agriculture changed – mechanized (?), in the 20th
century, this reduced the
opportunities for these children to work as a farm worker. The emerging urban industrial
economy provided an alternative. Hence, the decrease of downward mobility after 1920 as
those who migrated to find a job elsewhere are not observed any longer in our database.
While these findings do not imply that the claims made above regarding the consequence of
industrialization for mobility is less correct, it does show that not only forces related to
industrialization are important, and it does relativate the ‘impact’ of industrialization.
At first sight, the relation between industrialization is further relativated when
looking at upward mobility in the rural context. We see a clear increase after 1920, both in
19
absolute and relative terms. Yet, when specifying mobility to the chance of attaining a middle
class or elite position this picture is much weaker. There is only a modest increase of the
(relative) chance to attain a middle class or elite position. What happened, it seems, is that
there was a modest industrialization in the rural context as well, shown by the increase of
occupations in industrial sectors since 1930 (table 2), which offered the chance for modest
upward mobility into semi-skilled and skilled positions for those with an origin as farm
worker. As the rise of the new middle class in this context was modest, the increase in upward
mobility is not translated in a strong increase of attaining middle class (or elite) positions. In
other words, while there was an increase in upward mobility in the rural context in the final
period, it can also be related to (modest) industrialization, it seems.
The third hypothesis stated that having more siblings became increasingly connected
to greater difficulties in social advancement, and higher risks of downward mobility. Our
results offered only limited support for this hypothesis. Even though having 6 or more
siblings was connected to lower chances of upwards social mobility, as hypothesized, this was
not the case for attaining middle class/elite status. Moreover, the effects of number of siblings
on upward mobility remained constant over time, which does not support the idea of a
stronger effect in a more industrial society when parental investments were more important
for mobility chances.
Taken together the analysis provides support for a connection between
industrialization and social mobility. In the first period of industrial breaktrough this was
mainly downward mobility. It is only after 1920 that chances for upward mobility clearly
increased. In this period Swedish industrial society matured which made new middle class
positions available in the industrializing parishes and to a lesser extent also in the rural
parishes. But this is also the period when Sweden developed into a welfare society, income
inequality declined (Björklund and Jäntti 2011) and improvements in the educational system
were made. It is thus possible that the development towards a more open society in this period
was connected to an egalitarian development in general rather than to the new opportunities
created by industrialization as such.
20
References
Altham, P. M. E. and Ferrie, J. P. (2007). Comparing contingency tables. Tools for analyzing
data from two groups cross-classified by two characteristics. Historical Methods 40:
3-16.
Becker, G.S. and Lewis, H.G. (1973). On the interaction between the quantity and quality of
children. Journal of Political Economy 81: 279-288.
Becker, G.S. and Tomes, N. (1976). Child endowments and the quantity of children. Journal
of Political Economy 84: 143-162.
Becker, S. O., Cinnirella, F. and Woessmann, L. (2010). The trade-off between fertility and
education: Evidence from before the demographic transition. Journal of Economic
Growth 15: 177-204.
Bengtsson, T., Dribe, M and Svensson, P. (2012). The Scanian Economic Demographic
Database. Version 2.0 (Machine-readable database). Lund: Lund University, Centre
for Economic Demography.
Björklund, A. and Jäntti, M. (2011). Inkomstfördelningen i Sverige. SNS Välfärdsrapport
2011. Stockholm: SNS.
Blau, P. M. and Duncan, O. D. (1967). The American Occupational Structure. New York:
Wiley.
Bourdieu, J., Ferrie, J. P. and Kesztenbaum, L. (2009). Vive la difference? Intergenerational
social mobility in France and the United States during the Nineteenth and Twentieth
Centuries. Journal of Interdisciplinary History 34: 523-557.
Bras, H., Kok, J. and Mandemakers, K. (2010). Sibship size and status attainment across
contexts: Evidence from the Netherlands, 1840-1925. Demographic Research 23:73-
104.
Clark, G. (2007). A Farewell to Alms. A Brief Economic History of the World. Princeton:
Princeton University Press.
De Vries, J. (1984). European Urbanization, 1500-1800. Cambridge, MA: Harvard
University Press.
Dribe, M. (2009). Demand and supply factors in the fertility transition: A county level
analysis of age-specific marital fertility in Sweden 1880–1930. European Review of
Economic History 13:65-94
Dribe, M. and Svensson, P. (2008). Social mobility in nineteenth century rural Sweden – A
micro level analysis. Scandinavian Economic History Review 56:122-141.
21
Dribe, M. and Lundh, C. (2009). Partner choice and intergenerational occupational mobility.
The case of nineteenth century rural Sweden. Continuity and Change 24: 487-512.
Dribe, M. and Lundh, C. (2010). Marriage choices and social reproduction. The
interrelationship between partner selection and intergenerational socioeconomic
mobility in 19th century Sweden. Demographic Research 22:347-382.
Erikson, R. and Goldthorpe, J.H. (1992). The Constant Flux: A Study of Class Mobility in
Industrial Societies. Oxford: Clarendon Press.
Featherman, D. L., Jones, F. L. and Hauser, R. M. (1975). Assumptions of social mobility
research in the U.S.: The case of occupational status. Social Science Research 4:
329-360.
Ferrari, G. and Dalla Zuanna, G. (2010). Siblings and human capital: A comparison between
Italy and France. Demographic Research 23: 587-614.
Ferrie, J. P. (2005). The end of American exceptionalism? Mobility in the United States since
1850. Journal of Economic Perspectives 19: 199-215.
Gadd, C-J. (2000). Den agrara revolutionen : 1700-1870. Stockholm: Natur & Kultur.
Galor, O. (2005). From stagnation to growth: Unified Growth Theory, in Aghion, P., and
Durlauf, S. (eds), Handbook of Economic Growth. North-Holland: Elsevier.
Ganzeboom, H. B. G., Luijkx, R. and Treiman, D. J. (1989). Intergenerational class mobility
in comparative perspective. Research in Social Stratification and Mobility 9: 3-79.
Ganzeboom, H. B. G., Treiman, D. J. and Ultee, W. C. (1991). Comparative intergenerational
stratification research: Three generations and beyond. Annual Review of Sociology
17: 277-302.
Goldthorpe, J.H. (1985). On economic development and social mobility. British Journal of
Sociology 36(4): 549-573.
Grusky, D. B. (1983). Industrialization and the status attainment process: The thesis of
industrialism reconsidered. American Sociological Review 48: 494-506.
Hout, M. and DiPrete, T. A. (2006). What we have learned: RC28’s contributions to
knowledge about social stratification. Research in Social Stratification and Mobility
24: 1-20.
Inglehart, R., and Baker, W.E., (2000). Modernization, cultural change and the persistence of
traditional values. American Sociological Review 65(1): 19-51.
22
Klemp, M. P. B. and Weisdorf, J. W. (2011). The child quantity-quality trade-off during the
Industrial Revolution in England. Discussion Paper No. 11-16. Department of
Economics, University of Copenhagen.
Krantz, O., and Schön, L., (2007). Swedish Historical National Accounts 1800-2000. Lund:
Almqvist & Wiksell International.
Larsson, H.A., (2011): Mot bättre vetande: En svensk skolhistoria. SNS Förlag.
Lipset, S. M. and Bendix, R. (1959). Social Mobility in Industrial Society. Berkeley:
University of California Press.
Long, J. and Ferrie, J. (2007). The path to convergence: Intergenerational occupational
mobility in Britain and the US in three eras. Economic Journal 117: C61-C71.
Lundh, C. (1999). The social mobility of servants in rural Sweden, 1740-1894. Continuity and
Change 14: 57-89.
Maas, I. and van Leeuwen, M.H.D. (2002). Industrialization and intergenerational mobility in
Sweden. Acta Sociologica 45: 179-194.
Maas, I. and van Leeuwen, M.H.D. (2004). Occupational careers of the total male labour
force during industrialization: the example of nineteenth-century Sweden, in Mitch,
D., Brown, J., and van Leeuwen, M.H.D, (eds). Origins of the Modern Career
(2004). Aldershot, UK: Ashgate.
Maas, I. and Zijdeman, R. L. (2010). Beyond the local marriage market: The influence of
modernization on geographic heterogamy. Demographic Research 23: 933-962.
Marteleto, L. (2010). Family size, adolescents’ schooling and the demographic transition:
Evidence from Brazil. Demographic Research 23: 421-444.
Olsson, M. (2002). Storgodsdrift. Godsekonomi och arbetsorganisation i Skåne från dansk tid
till mitten av 1800-talet. Stockholm: Almqvist & Wiksell International.
Schön, L. (2007). En modern svensk ekonomisk historia: tillväxt och omvandling under två
sekel. Stockholm: SNS Förlag.
Treiman, D. J. (1976). A standard occupational prestige scale for use with historical data.
Journal of Interdisciplinary History 7: 283-304.
Van Bavel, J. (2006). The effect of fertility limitation on intergenerational social mobility:
The quantity-quality trade-off during the demographic transition. Journal of
Biosocial Science 38: 553-569.
Van Bavel, J., Peeters, H. and Matthijs, K. (1998). Connections between intergenerational and
marital mobility. A case study: Leuven, 1830-1910. Historical Methods 31: 122-134.
23
Van Bavel, J., Moreels, S., Van de Putte, B. and Matthijs, K. (2011). Family size and
intergenerational social mobility during the fertility transition: Evidence of resource
dilution from the city of Antwerp in nineteenth century Belgium. Demographic
Research 24: 313-344.
Van de Putte, B. and Miles, A. (2005). A social classification scheme of historical
occupational data. Partner selection and industrialism in Belgium and England, 1800-
1918. Historical Methods 38: 61-92.
Van de Putte B., Oris M., Matthijs K., (2009) Marrying out of the lower classes in nineteenth
century Belgium. Continuity and Change 24: 421-453.
Van Leeuwen, M. H. D. and Maas, I. (1996). Long-term social mobility: research agenda and
a case study (Berlin, 1825-1957). Continuity and Change 11: 399-433.
Van Leeuwen, M. H. D. and Maas, I. (2010). Historical studies of social mobility and
stratification. Annual Review of Sociology 36: 429-451.
Van Leeuwen, M.H.D., Maas, I. and Miles, A. (2002). HISCO: Historical International
Standard Classification of Occupations. Leuven University Press, Leuven.
Wahl, J. B. (1992). Trading quantity for quality: explaining the decline in American fertility
in the nineteenth century. In C. Goldin and H. Rockoff (eds.), Strategic Factors in
Nineteenth Century American Economic History. A Volume to Honor Robert W.
Fogel. Chicago: University of Chicago Press.
Zijdeman, R. L. (2009). Like my father before me: Intergenerational occupational status
transfer during industrialization (Zeeland, 1811-1915). Continuity and Change 24:
455-486.

24
Table 1. Population development in the two areas.
Hög/Kävlinge Halmstad/Kågeröd/Sireköpinge
1830 920 2614
1850 1174 2931
1870 1154 3607
1890 1228 3658
1910 3017 4068
1930 3105 3718
1950 3587 2927
1970* 4601 2720
Source: SEDD (Bengtsson, Dribe and Svensson 2012).
25
Table 2. Occupational structure by area and period. Based on 1-digit HISCO (%).
A. Hög/Kävlinge
1830 1850 1870 1890 1910 1930 1950 1970*
Professional, technical and related (HISCO 0, 1) 1 3 3 3 2 5 5 8
Administrative and managerial (HISCO 2) 0 0 0 1 6 7 8 9
Clerical and related (HISCO 3) 0 1 0 0 4 4 4 5
Sales (HISCO 4) 0 0 1 4 4 5 4 5
Services (HISCO 5) 11 10 10 7 4 4 3 3
Agriculture, fishing, hunting (HISCO 6) 61 71 62 43 16 17 13 10
Industrial production and Transport (HISCO 7, 8, 9)** 7 6 8 13 45 43 54 51
Workers not Elsewhere Classified (HISCO 9-9) 1 3 3 8 14 12 7 5
NA 18 6 11 21 4 4 2 4
Total 100 100 100 100 100 100 100 100
N 166 195 208 235 714 794 1163 1443
B. Halmstad/Kågeröd/Sireköpinge
1830 1850 1870 1890 1910 1930 1950 1970*
Professional, technical and related (HISCO 0, 1) 1 2 1 1 2 2 2 6
Administrative and managerial (HISCO 2) 1 2 2 3 5 4 6 9
Clerical and related (HISCO 3) 0 0 0 0 2 2 2 2
Sales (HISCO 4) 0 0 0 2 1 2 3 3
Services (HISCO 5) 5 5 5 5 5 5 3 2
Agriculture, fishing, hunting (HISCO 6) 68 67 62 58 46 44 45 34
Industrial production and Transport (HISCO 7, 8, 9)** 5 7 10 11 17 17 25 33
Workers not Elsewhere Classified (HISCO 9-9) 8 12 13 10 13 17 10 9
NA 11 5 6 10 10 8 3 2
Total 100 100 100 100 100 100 100 100
N 430 465 571 660 811 917 903 847
Notes: Authors' calculations, based on household heads residing in respective areas at the time indicated.
* Figures refer to 1968 ** Workers not elsewhere classified (9-99) have been removed from this category and reported as a separate group. Source: See Table 1.

26
Table 3. Socioeconomic classification (SOCPO).
Social
Power
Commanders
(authority)
Self-employed
(business/property
owners)
Skill Pure status
5 High commander:
executive, general
policy tasks
Large-scale self-
employed
Non-manual
superskilled
Nobility
4 Medium
commander:
supervisor of
skilled workers
Medium-scale self-
employed: local
businessmen and farmers
Manual
superskilled/non-
manual skilled
3 Low commander:
supervision of
semi- and unskilled
workers
Manual-skilled
2 Small-scale self-
employed
Semi-skilled
1 Unskilled
Source: Van de Putte and Miles (2005).

27
Table 4. Proportion of individuals of worker origin (SP1-3) advancing to middle class/elite
(SP4-5) by area and period (%).
1830-1869
1870-1919 1920-1968
Halmstad/Kågeröd/Sireköpinge 22.6 15.9 38.9
N
789 1007 522
Hög/Kävlinge 29.1 29.3 30.5
N 271 372 403
Source: See Table 1.
28
Table 5. Distribution of covariates (%).
1830-
1869
1870-
1919
1920-
1968
Socioeconomic attainment
SP1 (Unskilled) 11 22 30
SP2 (Semi-skilled) 38 30 21
SP3 (Skilled) 7 9 21
SP4 (Middle class) 42 37 26
SP5 (Elite) 3 2 2
Socioeconomic origin
SP1 (Unskilled) 30 38 17
SP2 (Semi-skilled) 26 19 22
SP3 (Skilled) 8 15 18
SP4 (Middle class) 33 25 37
SP5 (Elite) 3 4 6
Sex
Male 51 49 59
Female 49 51 41
Parish
Hög 14 10 5
Kävlinge 15 22 37
Halmstad 19 17 9
Sireköpinge 27 25 15
Kågeröd 26 27 34
Number of siblings
0 2 1 9
1-2 6 8 28
3-4 17 21 39
6+ 5 9 24
NA 70 61 1
Migration status
Born in parish 30 31 66
Migrant ≤34 km 48 49 27
Migrant >34 km 5 10 6
NA 16 10 0
N 1925 2280 1291
Source: See Table 1.
29
Table 6. Social mobility by social origin, period and area (%).
A. Hög/Kävlinge
1830-1869 1870-1919 1920-1968
Social origin Downward No
mobility
Upward Downward No
mobility
Upward Downward No
mobility
Upward
SP1 (Unskilled) - 8.7 91.3 - 36.7 63.3 - 20.8 79.2
SP2 (Semi-skilled) 12.6 46.3 41.1 32.5 25.7 41.9 12.5 34.2 53.3
SP3 (Skilled) 47.1 32.4 20.6 34.9 32.5 32.5 37.3 26.8 35.9
SP4 (Middle class) 34.6 58.8 6.6 42.7 51.7 5.6 40.2 50.8 9.1
SP5 (Elite) 84.4 15.6 - 75.9 24.1 - 64.3 35.7 -
All 28.2 47.6 24.2 34.7 39.5 25.8 24.4 33.0 42.6
N 546 724 549
B. Halmstad/Kågeröd/Sireköpinge
1830-1869 1870-1919 1920-1968
Social origin Downward No
mobility
Upward Downward No
mobility
Upward Downward No
mobility
Upward
SP1 (Unskilled) - 53.3 46.7 - 55.3 44.7 - 30.6 69.4
SP2 (Semi-skilled) 38.2 28.5 33.3 51.3 23.3 25.4 19.9 21.2 58.9
SP3 (Skilled) 53.2 19.1 27.7 48.4 27.8 23.8 29.2 23.0 47.8
SP4 (Middle class) 59.5 39.2 1.2 66.9 29.3 3.8 36.5 57.6 5.9
SP5 (Elite) 58.6 41.4 - 51.9 48.1 - 58.8 41.2 -
All 43.3 35.8 21.0 43.3 34.3 22.5 19.8 35.2 45.0
N 1379 1556 742
Note: Figures in italics are based on less than 30 observations.
Source: See Table 1.
30
Table 7. Relative risks of social mobility. Multinomial logit estimates (No mobility is the base outcome).
M1 M2 M3 M4 M5 M6
Down Up Down Up Down Up Down Up Down Up Down Up
Period
1830-1869 ref ref ref ref ref ref ref ref ref ref ref ref
1870-1919 0.888* 0.856* 1.036 1.120 1.121 0.929 0.928 1.119 0.726* 1.184 0.811 1.020
1920-1968 0.562*** 2.015*** 0.461*** 2.241*** 0.497*** 1.882*** 0.400*** 2.181*** 0.477*** 2.632*** 0.648** 2.042***
Area
Halmstad/Kågeröd/Sireköp. ref ref ref ref ref ref ref ref
Hög/Kävlinge 0.485*** 0.872 0.743** 1.116 0.795*** 0.959 0.778*** 1.240**
Interactions Period*Area
1870-1919 * Hög/Kävlinge 1.446** 1.137 0.984 0.874
1920-1968 * Hög/Kävlinge 2.718*** 1.158 1.490** 0.804
Number of siblings
0 0.421* 0.390* 0.552 0.246**
1-2 0.681 0.849 0.630 0.925
3-5 ref ref ref ref
6+ 1.161 0.679 1.104 0.720**
NA 0.934 1.152 0.811 1.194
Interactions Period*Siblings
1870-1919 * 0 2.265 2.665 2.002 3.605
1870-1919 * 1-2 1.143 1.407 1.201 1.321
1870-1919 * 6+ 0.77 0.954 0.715 1.293
1870-1919 * NA 1.419* 0.837 1.416* 0.789
1920-1968 * 0 1.7 2.243 1.040 4.630**
1920-1968 * 1-2 1.185 0.823 1.093 0.841
1920-1968 * 6+ 0.864 1.038 0.876 0.953
1920-1968 * NA 0.266 0.268 0.331 0.250
Sex
Female ref ref ref ref ref ref ref ref ref ref ref ref
Male 0.921 0.824*** 0.92 0.824*** 0.921 0.825*** 0.927 0.825*** 0.931 0.828*** 0.918 0.830**
Age 0.892** 1.134** 0.880** 1.132** 0.875** 1.123** 0.870*** 1.126** 0.872*** 1.127** 0.805*** 1.246***
Age squared 1.001* 0.999** 1.001** 0.999** 1.001** 0.998* 1.001** 0.999* 1.001** 0.999* 1.002*** 0.998***
31
Migration status
Born in parish 0.808** 1.178
Migrant ?34 km ref ref
Migrant >34 km 1.344** 1.749***
NA 0.727*** 0.980
Relative group size 0.933*** 0.971*** 0.935*** 0.970*** 0.934*** 0.971*** 0.947*** 0.966***
Social origin
SP1 (Unskilled) 0.000 16.284***
SP2 (Semi-skilled) 0.725*** 12.104***
SP3 (Skilled) 0.672*** 6.939***
SP4 (Middle class) ref ref
SP5 (Elite) 0.519*** 0.000
Observations 5 496 5 496 5 496 5 496 5 496 5 496 5 496 5 496 5 496 5 496 5 496 5 496
Note: Relative group size is the proportion of the population in the social group of origin at the time of attainment.
*** p<0.01, ** p<0.05, * p<0.1.
Source: See Table 1.
32
Table 8. Odds ratios of middle class/elite attainment (vs worker status).
M1 M2 M3 M4 M5 M6 M7
Period
1830-1869 ref ref ref ref ref ref ref
1870-1919 0.876** 1.064 1.013 0.942 0.849 0.830 0.881
1920-1968 1.088 1.033 1.434*** 1.273* 1.637*** 1.373** 1.593**
Area
Halmstad/Kågeröd/Sireköp. ref ref ref ref ref
Hög/Kävlinge 0.611*** 0.806 0.979 0.999 0.943
Interactions Period*Area
1870-1919 * Hög/Kävlinge 1.309* 1.281*
1920-1968 * Hög/Kävlinge 1.801*** 1.291
Number of siblings
0 0.369*** 0.334*** 0.176***
1-2 0.770 0.772 0.793
3-5 ref ref ref
6+ 1.079 1.105 1.22
NA 0.991 0.944 1.101
Interaction Period*Siblings
1870-1919 * 0 2.213 2.393 4.847**
1870-1919 * 1-2 1.260 1.232 1.29
1870-1919 * 6+ 0.855 0.891 0.879
1870-1919 * NA 1.254 1.248 1.27
1920-1968 * 0 2.104* 2.414** 5.792***
1920-1968 * 1-2 0.918 0.946 0.861
1920-1968 * 6+ 0.725 0.719 0.595
1920-1968 * NA 0.340 0.373 0.469
Sex
Female ref ref ref ref ref ref
Male 0.878** 0.877** 0.876** 0.876** 0.879** 0.873** 0.786***
Age 0.983 0.976 0.979 0.978 0.980 0.996 1.106*
Age squared 1.000 1.000 1.000 1.000 1.000 1.000 0.999*
Migration status
Born in parish 0.976 1.1
Migrant ?34 km ref
Migrant >34 km 1.463*** 1.264
NA 0.803** 0.700**
Relative group size 0.978*** 0.982** 0.979*** 0.984*** 1.013*
Social origin
SP 1-3 (Workers) 1.497***
SP 4-5 (Middle class/Elite) ref
Observations 5 496 5 496 5 496 5 496 5 496 5 496 3 364
Note: Relative group size is the relative size of the middle class/elite group at the time of attainment. M7 is
estimated only for individuals of social origin SP1-3.
*** p<0.01, ** p<0.05, * p<0.1.
Source: See Table 1.
Related Documents