Hot IPOs Can Damage your Long-Run Wealth! Jerry Coakley, Leon Hadass* and Andrew Wood Department of Accounting, Finance and Management and Essex Finance Centre University of Essex, UK This version: December 2005 JEL Classification: G24 Keywords: Hot markets; investor sentiment; venture capital. ___________________ *Corresponding author: Department of Accounting, Finance and Management, University of Essex, Colchester CO4 3SQ, UK. Tel: +44 20 8958 4290. Fax: +44 20 8958 0783. E-mail: [email protected] Prof. Jerry Coakley Department of Accounting, Finance and Management, University of Essex, Colchester CO4 3SQ, UK. Tel: +44 1206 872455. Fax: +44 1206 873429. E-mail: [email protected] Dr. Andrew Wood Department of Accounting, Finance and Management, University of Essex, Colchester CO4 3SQ, UK. Tel: +44 1206 872402. Fax: +44 1206 873429. E-mail: [email protected] 1

Welcome message from author
This document is posted to help you gain knowledge. Please leave a comment to let me know what you think about it! Share it to your friends and learn new things together.
Transcript
Hot IPOs Can Damage your Long-Run Wealth!
Jerry Coakley, Leon Hadass* and Andrew Wood
Department of Accounting, Finance and Management and Essex Finance CentreUniversity of Essex, UK
This version: December 2005
JEL Classification: G24Keywords: Hot markets; investor sentiment; venture capital. ___________________*Corresponding author: Department of Accounting, Finance and Management, University of Essex, Colchester CO4 3SQ, UK. Tel: +44 20 8958 4290. Fax: +44 20 8958 0783. E-mail: [email protected] Prof. Jerry CoakleyDepartment of Accounting, Finance and Management, University of Essex, Colchester CO4 3SQ, UK. Tel: +44 1206 872455. Fax: +44 1206 873429. E-mail: [email protected] Dr. Andrew WoodDepartment of Accounting, Finance and Management, University of Essex, Colchester CO4 3SQ, UK. Tel: +44 1206 872402. Fax: +44 1206 873429. E-mail: [email protected]
1
Hot IPOs Can Damage your Long-Run Wealth!
Abstract
This paper investigates the links between hot markets, long run underperformance and venture
capital in the UK using a unique sample of 593 IPOs for the 1985-2003 period. It finds no
evidence for long run underperformance for the full sample but does find robust support for
significant underperformance during hot markets. The significant hot market return differential
relative to the first day trading is consistent with investor sentiment and market timing. The
differential relative to the offer price is also statistically significant thereby confirming
Ljungqvist et al.’s (2006) first prediction and providing further support for long run
underperformance by hot market IPOs.
The evidence does not support certification hypotheses. Hot-market, venture-backed IPOs
underperform very significantly while their non-venture counterparts suffer substantial negative
returns for only three years post-IPO. Similarly, the significantly negative relationship between
underpricing and long-term returns for venture-backed IPOs during hot markets furnishes
evidence of market timing.
Industry analysis reveals that the return differential is significant for the high-technology sector
both for the full sample and separately for venture-backed and non-venture IPOs. Indeed a
majority of high-technology firms in the sample went public during hot markets. Cross-sectional
regressions provide additional support for significant underperformance by high-technology
firms in hot markets for the whole sample and non-venture IPOs.
Finally, IPOs in general and venture-backed IPOs in particular with strong pre-IPO earnings
growth generated significantly superior performance in all periods. The impact was most marked
during hot markets, suggesting a role for robust pre-IPO operating results in determining the
likelihood of long-term performance.
2

3

1. Introduction
Loughran and Ritter (1995) find for a sample of almost 5000 US IPOs 1970-1990 that investors
receive annual returns of just 7% on average in the five post-issue years. To place this
underperformance in context, investors would have had to invest a staggering 44% more in
issuers than in similar-sized non-issuers to achieve the same terminal wealth.1 Their graphic
conclusion is that “Investing in firms issuing stock is hazardous for your wealth” (Ibid. p.46).2
Long run underperformance has puzzled researchers in financial economics ever since and is
identified by Ritter and Welch (2002) as possibly the most controversial area of IPO research.
This paper has three objectives. The first is empirically to test hypotheses related to hot
markets and especially some of those proposed by Ljungqvist, Nanda and Singh (2006). To our
knowledge the latter has not been done to date. Ljungqvist et al. argue that investor sentiment is
the underlying cause of the IPO underperformance anomaly. They propose that a test of
underperformance in hot markets relative to the offer price rather than the first day trading price
provides a tougher hurdle. We adduce empirical support for significant underperformance in hot
markets relative to both the first day trading price and to the offer price. These are in line with
those of Ritter (1991), Cook, Jarrell and Kieschnick (2003) and Helwege and Liang (2004) and
Derrien (2005) who link investor sentiment to hot markets.3
Our results are in agreement with recent findings for IPO markets in other countries.
Helwege and Liang (2004) compare US firms going public in hot and cold markets during
1975-2000 and examine their performance over the following five years. Both hot and cold
market IPOs are found in the same narrow set of industries and hot markets occur at the same
time for many industries. Their results suggest that hot markets reflect greater investor optimism
1 See Aggarwal and Rivoli (1990) and Ritter (1991) for early studies of the long-run underperformance of IPOs.2 The title of our paper was inspired by this quote.3 Many other researchers have underlined the role of investor sentiment including Loughran, Ritter, and Rydqvist (1994), Loughran and Ritter (1995), Rajan and Servaes (1997, 2003), Pagano, Panetta, and Zingales (1998), Teoh, Welch and Wong (1998), Baker and Wurgler (2000) and Lowry (2003).
4
rather than other factors. Cook et al. (2003) also find that US IPOs during hot markets have
lower long-term returns than IPOs during cold markets due to sentiment investors driving prices
beyond their fair value. Derrien (2005) is one of the few hot market studies to focus on a non-US
market. His findings support the view that IPOs occurring during bullish market conditions in
France are overpriced.
The second objective is to explore the links between long run underperformance and hot
markets for a sample of UK IPOs. In this context it is the first attempt to investigate such links in
the UK which boasts one of the largest and most developed capital markets outside the United
States. Ibbotson and Jaffe (1975) and Ritter (1984) pioneered the hot markets concept. They
documented the existence of hot periods of high IPO volume (underpricing) where subsequent
underperformance tends to be more dramatic. The implication is that market timing is uppermost
in issuers’ minds when taking advantage of market sentiment in such periods.
Our UK sample comprises of a set of 59371 venture-backed and non-venture IPOs on the
Official List of the London Stock Exchange over the period from 1985 up to 20030. The
advantages of this sample are twofold. On one hand, it is a relatively large sample according to
the definition of Ritter (2003) who points out that Japan and the UK are the only countries other
than the US that can muster IPO samples in excess of 500. On the other hand and more
importantly, our UK IPO sample differs in one fundamental aspect from US samples. The latter
contain a large proportion of high-technology firms while our UK sample is more evenly
distributed by industry.4 Thus our data should provide a basis for robust hypothesis testing ofn
aspects of long run underperformance.
4 The sample of 59371 IPOs used in this sample is evenly split by number of IPOs across the three aggregate industries (32% each in industry and in high-technology, 33% in industry and 354% in services). The split is replicated across venture-backed and non-venture IPOs. In contrast to the above industry distribution, Gompers and Lerner (1999b) show that venture-backed IPOs in the high-technology sector represent 79% of the total during 1985-1996.
5
The third objective of the paper is to explore the conjecture first postulated by Brav and
Gompers (1997) that venture capitalists play an important role in explaining the
underperformance puzzle.5 They show that US venture-backed IPOs outperform non-venture
IPOs five years after the offer date and conclude that underperformance primarily resides in
small non-venture IPOs which are the most likely to be influenced by investor sentiment.
However, our sample shows no significant difference in returns between venture-backed and
non-venture IPOs in contrast to the Brav and Gompers (1997) findings. The return differential
between hot and normal markets is more markedhighly significant for venture-backed IPOs
although it is highly only marginally significant for both types ofnon-venture firms. Industry
analysis reveals that this return differential is significant for the high-technology sector for both
the full sample and separately for venture-backed and non-venture IPOs while it is also
significant in other industries for venture-backed firms.
We find some evidence of venture capitalists exploiting investor sentiment during hot
markets which is confirmed by a significantly negative relationship between underpricing and
long-term returns for venture-backed IPOs during hot markets. This latter finding contrasts with
that of Helwege and Liang (2004) who find no significant role for venture capital presence
during either hot or cold markets in the US.
The remainder of this paper is organised as follows. In section 2 the literature on long run
IPO performance, venture capital involvement and investor sentiment is reviewed. Section 3
describes the data and methodology related to performance measurement. Section 4 discusses the
empirical results of univariate sorts and cross-sectional regressions. A final section concludes.
2. Hot Markets and Long-run IPO Underperformance
2.1 The underperformance anomaly5 The hypotheses in the recent rational literature on IPO market cycles typified by Lowry and Schwert (2002) and Pastor and Veronesi (2003) are beyond the scope of this paper.
6

While long run underperformance is well documented for the USA, results for other countries
such as the UK are rather limited. Levis (1993) used a sample of 712 UK IPOs 1980-1988 to
document significant long-term IPO underperformance 36 months after the first trading day.
Espenlaub, Gregory and Tonks (2000) re-examine the evidence on the long-term returns of IPOs
for a sample of 588 UK IPOs 1985-1992. Using an event-time framework, they find substantial
negative abnormal returns after the first three years irrespective of the benchmark used.
Although some researchers underline the role of hot IPO markets, only a few empirical
studies have so far compared long-run performance in hot and cold (normal) markets. Helwege
and Liang (2004) study a US sample of 3,698 IPOs between 1975 and 2000. Distinguishing
between hot, cold and neutral markets they find both hot and neutral market IPOs tend to
underperform while cold market IPOs tend to outperform a variety of benchmarks. After
adjusting for economic conditions, they find little evidence for cross-sectional differences
between the characteristics of hot and cold market IPOs and no significant difference between
their post-issue operating performances. These findings lead the authors to conclude that hot
markets are primarily driven by investor optimism.
Similarly, Cook et al. (2003), using 6,080 US IPOs between 1980 and 2002, show that
IPOs during hot markets tend to perform more poorly than IPOs during cold markets. They find
that IPOs and trade at higher valuations and their offer sizes are larger during hot markets and
that these firms are less likely to survive. They conclude that investor sentiment is a more
important feature of IPO markets then hitherto recognised. Non-US studies are rare but Derrien
(2005) is a notable exception. He develops a model in which bullish noise trader sentiment
during hot markets leads to overpriced IPO shares relative to their long-run intrinsic value. Using
a sample of 62 IPOs on the French stock exchange for the hot period of 1999 till 2001, he
empirically shows that the long-run stock price performance of IPO shares is negatively
impacted by investor sentiment.
7
Ljungqvist, Nanda and Singh (2006) build a theoretical model in which the presence of
irrational investors leads to hot markets and the associated long-run underperformance. In their
model, sentiment investors purchase stock from institutional investors at inflated prices.
Underwriters allocate new issues to their institutional client base if there is insufficient sentiment
demand, perhaps due to a hot IPO market and many issuers trying to tap the capital markets.
These institutional investors then sell off their holdings at increased prices to exuberant investors
post-IPO who are driven by market fads. The sentiment driven prices, on the other hand, deflate
over time, leading to negative returns. Below we extend the existing hot market studies by
empirically testing some of the hypotheses proposed by Ljungqvist et al. (2006).
2.2 Venture capitalists and investor sentiment
While much of this literature stresses asymmetric information and the certification role of
venture capitalists, a part of it also ascribes a role to investor sentiment. Brav and Gompers
(1997) were the first to test the long-run performance of a sample of new issues disaggregated
into venture-backed and non-venture IPOs.6 They use a sample of 934 venture capital backed
IPOs and 3,407 non-venture IPOs in the United States from 1972 through 1992 and show that
venture-backed IPOs outperform non-venture IPOs over a five-year period. They conduct an
asset pricing analysis and find that venture-backed IPOs do not underperform while non-venture
IPOs indicate severe underperformance. Partitioning the non-venture IPOs on the basis of size
shows that underperformance resides primarily in small non-venture IPOs.
Brav and Gompers (1997) argue that bouts of investor sentiment are a possible
explanation for the severe underperformance of small non-venture IPOs because the latter are
6 A related literature deals with the conflicts of interest for underwriter-affiliated venture capital firms. See for example Gompers and Lerner (1999a) for the US, Hamao, Packer and Ritter (2000) for Japan and Espenlaub, Garrett and Mun (2000) for the UK.
8
more likely to be held by individuals.7 Along similar lines, Megginson and Weiss (1991) show
that institutional ownership of IPOs is substantially higher for venture-backed than for non-
venture IPOs. They report that institutions hold, on average, 42.3% of the offer in venture-
backed firms as compared to 22.2% of the amount offered in non-venture backed firms. We
employ the hot market concept to shed new light on the role and performance of venture versus
non-venture backed firms
3. Data and Methodology
3.1 Data
A unique sample was selected from the IPOs listed on the London Stock Exchange for the period
from January 1985 to December 20030. IPOs of investment trusts, financial companies, building
societies, privatisation issues, foreign-incorporated companies, unit offerings and spin-offs are
excluded. The filtering process also excludes share issues at the time of a relisting after a firm is
temporarily suspended or transfers from lower tier markets such as the now defunct Unlisted
Securities Market and the Alternative Investment Market.8 We exclude the latter IPO market
established in 1995 since it has no minimum market capitalization and would likely lead to a small
company bias.
The final sample consists of 59371 IPOs of ordinary shares by domestic operating
companies on the Official List of the London Stock Exchange with listing methods comprising
placements or offers for sale at a fixed price. This is the result of the filters applied to a total of
2,285 489 IPOs that listed on the Official List of the London Stock Exchange for the period
7 Brav and Gompers (1997) rerun the Fama-French three-factor regressions including an index that measures the change in the average discount on closed-end funds constructed as in Lee, Shleifer and Thaler (1991) who argue that this discount is a useful benchmark for investor sentiment. As expected, the change in discount is indeed negatively related to returns of the smallest group of non-venture IPOs.8 The filtering process is consistent with methodological approaches used in recent IPO research. See for example Espenlaub, Gregory and Tonks (2000), Espenlaub, Goergen and Khurshed (2001) for the UK and Bradley, Jordan, Roten and Yi (2001) for the US.
9
1985-20030. The sample include some 31705 venture-backed and 2766 non-venture IPOs. The
data sources include Datastream, the London Stock Exchange Quality of Markets Quarterly
Reviews, Primary Market Fact Sheets and Yearbooks, IPO prospectuses, Extel Financial
microfiches and Thomson Financial Global Access Database.9
3.2 Definition of hot and normal IPO markets
Hot IPO markets could potentially be defined on the basis of any of several criteria. These
include an above-average number of IPO issues, non-negative autocorrelation10 in IPO issue
numbers and above-average or abnormal initial returns. Each points to different hot market years
with some degree of overlap. We consider the latter to be important for robust definition and so
identify hot IPO market periods as only those years that simultaneously satisfy all three criteria.
The most commonly used criteria are periods of either high IPO volume or high level of
initial returns.11 These two criteria are related as Lowry and Schwert (2002) show. They
investigate the relationship between volume and underpricing or high initial returns over hot and
cold markets and find that periods of high underpricing are typically followed by high IPO
volume. We believe that another criterion also matters to capture the momentum generated by
investor sentiment in hot markets. This can be represented by non-negative autocorrelation in the
number of yearly IPOs. This requires that the number of IPOs in a hot market year to be no lower
than that in the previous calendar year.
The basis of our classification into hot and normal markets thus implies that a hot market
year simultaneously satisfies the two commonly used criteria of abnormal IPO volume and initial
returns as well as non-negative autocorrelation in volume. Those years that fail to satisfy any or
9 See Appendix I for more details.10 Close inspection of Table II in Lowry and Schwert (2002) reveals that volume is strongly autocorrelated. Indeed two coefficients in the volume regression on lagged volume are statistically significant as opposed to just one on lagged initial returns across all three data series.11 See Ibbotson and Jaffe (1975), Ritter (1984), Loughran and Ritter (1995), Helwege and Liang (2004) and Derrien (2005).
10
all of these criteria are classified as normal market years. Figure 1 shows the number of sample
IPOs and raw IPO returns for each year from 1985 to 20030.
[Figure 1 around here]
The average number of issues per year over the full sample was some 31.27.5. Years rather than
quarters or months are used as the basic time interval in classification to avoid the noise
problems inherent in the use of shorter intervals.12 There is an above average frequency of IPOs
in the years 1986-19878, 1993-1997 and 2000. However, not all of these years exhibit non-
negative autocorrelation in the number of IPOs issued. On this basis, only 1986-1987,
1993-1994, 1996 and 2000 indicate non-negative autocorrelation or investor sentiment in the
spirit of Ljungqvist et al. (2006).13 The average initial IPO return over the full sample was some
10.22.9%. On this basis, the years 1987, 1993, 1995 and 1998-2000 enjoy above average returns.
The only years simultaneously satisfying all of our three criteria are 1987, 1993 and
2000.14 While three years may seem like a small fraction of our sample, the IPOs in these years
account for some 142 IPOs or 245% of the total in our sample. The other 163 years of our
sample are defined as normal market years.15 There are two reasons for this. On one hand we do
not wish to discard useful sample information since our total sample comprises only 59371 IPOs.
On the other, a test of the difference between hot markets and the remaining normal markets
imposes a higher hurdle than one involving a test of the difference between hot markets and cold
markets where the latter are defined as a lower percentile of the remaining sample.
3.3 Methodology
12 Helwege and Liang (2004) tackle the latter by using three-month centered moving averages of the number of IPOs for each month in their sample.13 The cycles of IPO issuance are highly correlated between the sample used in this paper and the total number of IPOs of 2,285 489 issued on the London Stock Exchange between 1985 and 20030. 14 A number of other hot market definitions were used. These include the number of IPOs or initial IPO returns separately, as well as different IPO issuance and initial return cut-off points. The results were qualitatively similar to those reported in this paper.15 Although other researchers such as Helwege and Liang (2004) differentiate between hot, cold and in-between IPO markets, like Ritter (1984) we combine the latter and cold markets.
11

Several methodological issues related to long-run event studies have attracted attention in the
financial economics literature. Barber and Lyon (1997), Kothari and Warner (1997) and Lyon,
Barber, and Tsai (1999) provide discussions of the inference problems in tests of long-run
returns using buy-and-hold abnormal returns (BHAR) and cumulative abnormal returns (CARs).
BHAR is the difference between a sample firm’s long run (say three-year) return and the
corresponding return on a benchmark portfolio. CAR is calculated by subtracting benchmark
returns from the IPO firm’s return and summing abnormal returns over three years.
Barber and Lyon and Kothari and Warner provide simulation evidence that estimation
procedures can produce biased BHAR estimates. Fama (1998) and Mitchel and Stafford (2000)
argue that cumulative abnormal returns (CARs) are a more robust methodology for measuring
long run returns since BHAR can magnify underperformance due to the compounding of single-
period returns. This is important as the holding period length is arbitrarily fixed and the BHAR is
increasing in holding period, given abnormal performance during any portion of the return series.
They argue that CARs are a better, less biased method for calculating long-horizon returns as
they avoid the compounding of a single time period’s poor or strong performance (although still
suffering from cross-sectional correlation).
In addition, Mitchel and Stafford (2000) argue that the distributional properties and test
statistics for CARs are better understood while there are serious statistical problems with BHARs
which exhibit strong positive skewness as shown by Barber and Lyon (1997). Statistical
inference for the mean BHAR is thus often based on a bootstrapping approach that however
cannot solve all dependence problems, leading to potentially biased test statistics. For these
reasons, this paper employs CARs to compute long-horizon abnormal returns.
Equally-weighted average returns are used throughout this paper since we are interested
in measuring the abnormal returns of the average firm undergoing an IPO. Equally-weighted
average returns represent a portfolio investment strategy of investing an equal nominal amount in
12
every IPO. This is a reasonable assumption given that rationing is not a limiting factor after the
first day post-IPO. Consistent with Fama (1998), the weighting scheme has been chosen based
on the economic hypothesis of interest. Loughran and Ritter (2000) confirm that the equally-
weighted methodology produces point estimates that are relevant from the point of view of a
researcher attempting to predict the abnormal returns associated with a random event.16
Loughran and Ritter (2000) show that tests using equally-weighted returns yield greater
abnormal returns than tests that use value weighting. Weighting portfolios by firms’ market
capitalisation can lead to individual firms disproportionately dominating the portfolio, resulting
in high return variance, as unsystematic risk is not diversified away. Consequently, the value-
weighted tests will have low power and generate large standard errors and low t-statistics.17
3.4 Performance measurement
The long-run performance measurement includes both raw and market-adjusted returns over 36
months and 60 months after the IPO. The first two trading days are excluded to allow for
underpricing in the initial trading days.18 The returns incorporate dividend payments and are
adjusted for rights and scrip issues. If the IPO is delisted before the 36th (60th) month, the return
is added for CARi until the delisting date.
Following Gompers and Lerner (2003), the Cumulative Abnormal Returns (CAR) for a
portfolio of IPOs (CARp) are obtained by taking the average across the CAR of all IPOs in the
portfolio:
CARp = ∑=
n
in
1
1 [ CARi] (1)
16 Loughran and Ritter (2000) argue that value weighting is more appropriate when trying to measure the abnormal returns on a value-weighted portfolio with an equal amount of money invested in each time period. 17 The power of a test is the probability of rejecting the null hypothesis when the hypothesis is false. 18 See Doukas and Gonenc (2000) for a similar approach.
13
The Cumulative Average Abnormal Returns (CAARs) are calculated following Lyon, Barber
and Tsai (1999) and Espenlaub, Garrett and Mun (2000) to take account of a monthly
rebalancing strategy. First, an average benchmark-adjusted return on a portfolio of n IPOs is
calculated for each calendar month as the equally weighted arithmetic average of the benchmark-
adjusted returns:
ARt = ∑=
n
in
1
1 arit (2)
The three- (five-) year CAAR starting on the third trading day extending to T months after the
IPO is the summation of the average benchmark-adjusted returns:
CAAR3 to T = ∑=
T
t 3
ARt (3)
The Financial Times All Share index was chosen as the main benchmark index as it
comprises the largest cross-section of listed shares. This index is a capitalisation-weighted index
which represents 98%-99% of the market capitalisation of listed companies in the UK. It is
comparable to the S&P 500 index in the USA and has typically been used in past studies on UK
IPO performance.19
4. Empirical Results
4.1 Long run IPO underperformance
Long-run IPO returns by cohort year are reported in Table 1.
[Table 1 around here]
The number of IPOs and three-year benchmark-adjusted returns are shown in Panel A while five-
year benchmark-adjusted returns are presented in Panel B. The classical position – which we call
19 See for example Levis (1993), Khurshed (1999), Espenlaub, Gregory and Tonks (2000) and Jelic, Saadouni and Wright (2004). The use of the Financial Times All Share index avoids the benchmark contamination issue raised in Loughran and Ritter (2000), as the components of the sample only represent a tiny fraction of the index throughout the period. Indeed, the 100 largest constituents (which are largely absent from the sample) represent about 80-90% of the index’s value.
14
the underperformance hypothesis - is that IPOs do not underperform in the long run while
behavioural approaches predict long run underperformance. Table 1 indicates that the three-year
CARs for all IPOs of -5.691.53% are not significantly different from zero at conventional levels
even if those in 1989 and 2000 exhibit severe underperformance that is significant at the 1%
level. Thus we cannot reject the underperformance hypothesis for the three-year CAR in line
with the classical position. However Similarly, the five-year CARs for all IPOs of -13.19-4.55%
are not significant significantly different from zero.at the 1% level and so the hypothesis is
clearly rejected in this case.
Venture and non-venture IPOs
The classical certification null hypothesis states that venture-backed outperform non-venture
IPOs in the long run. This is due either to the monitoring role of the venture capitalists or to
investor sentiment-prone individuals holding a larger share of non-venture IPO stock as argued
by Megginson and Weiss (1991). Table 1 indicates that neither the three-year CARs nor five-
year CARs for venture-backed IPOs 1985-2000 or non-venture IPOs are not significantly
different from zero while those for non-venture IPOs are significantly negative at the 10% level.
The overall difference between both sets of IPOs is also not significant even though non-venture
IPOs underperformed by a significant margin in 1988-1989. Furthermore, a particularly strong
performance by non-venture IPOs is noticeable during 2001 and 2002, which is statistically
significant at the 1% level. This strong performance follows closely after the bursting of the
internet bubble in 2000, indicating a flight to quality among investors in this period.
Thus the certification hypothesis is unequivocally rejected for the full sample using both
three- and five-year CARs. These UK findings contrast with the US evidence of Brav and
Gompers (1997) that shows a significant performance differential between venture-backed and
non-venture issuers using five-year wealth relatives. Comparing the three- and five-year CARs, it
15

is evident that underperformance deteriorates with horizon. This is consistent with evidence by
Ritter (1991) and Loughran and Ritter (1995) on long-run underperformance by US IPOs.
Hot and normal market IPOs
A division into hot and normal/cold periods permits tests of recent behavioural theories that
IPOs floated in hot market periods underperform more severely compared to those in normal
markets due to the influence of market sentiment in hot periods. For instance, the Ljungqvist et
al. (2006) model predicts that IPOs underperform in hot markets due to sentiment investors
driving prices beyond their fair value. By contrast the classical position suggests that there is no
difference in underperformance between hot and normal markets.
Table 2 reports the three- (Panel A) and five-year (Panel B) CARs for hot and normal
periods.
[Table 2 around here]
The hot market IPOs generate three-year CARs of –35.4227.96% that are significantly negative
at the 1% level while the corresponding normal market CARs are insignificant at 4.156.80%.
Thus the hot market prediction is supported at the 1% level for three-year CARs. The magnitude
of underperformance during hot markets measured by five-year CARs is even more dramatic.
The returns are now some –52.5435.72% for all hot market IPOs and significant at the 1% level
while those for normal IPOs are positive and insignificant. These results strongly support the
prediction of Ljungqvist et al. (2006) that severe underperformance is associated with hot periods
but not during normal markets.
The 142 IPOs during the hot periods divide into 84 venture-backed and 58 are non-
venture IPOs. Of the remaining 429 451 IPOs in normal periods, some 221 233 are venture-
backed and 2108 non-venture IPOs. This split produces results for venture-backed IPOs very
similar to those for the overall sample. All hot and normal market CARs are significantly
different at the 1% level and so the hot market prediction is supported in all cases. For non-
16

venture IPOs, by contrast, only the three-year CARs exhibit marginally significant differences
between hot and cold markets, while for five-year CARs the differences in returns are not
significant. Indeed, hot market five-year CARs for non-venture IPOs are not significantly
different from zero. For instance, the five-year CARs of –57.18%, and 7.34%, respectively, for
hot and normal market venture-backed IPOs are statistically significant the 1% level. By
contrast, Furthermore, the difference between venture- and non-venture IPOs CARs is significant
only in one out of four cases (three-year CARs for normal markets) and then only marginally so
at the 10% level.
These results thus confirm the prediction of a significant hot market performance
differential by Ljungqvist et al. (2006), both for the overall sample and venture-backed IPOs.
They conform to their view of investor sentiment predominating during hot markets as also
established by Helwege and Liang (2004). They also support the findings of Cook et al. (2003)
who report that long-term returns of firms going public during hot markets are lower than those
for firms going public during cold markets.
Figures 2a-2c depict five-year CAARs for all IPOs and for venture-backed and non-
venture IPOs over for the whole sample and for hot and normal market periods.
[Figures 2a-2c around here]
Figure 2a shows that the CAARs for IPOs in hot and normal markets start to diverge after about
nine months post-IPO, that the differential narrows temporarily at month 31between month 27
and month 44, but then continuously widens until five years post-IPO. The CAARs for normal
market IPOs remain relatively constant over the five-years post-IPO in the –52% to 45% range,
while hot market CAARs remain continuously negative after seven months in line with
behavioural predictions.
These trends are broadly repeated when one divides the sample into venture-backed and
non-venture IPOs in Figures 2b and 2c. While normal market venture-backed IPOs generate
17
continuously positive returns, non-venture IPOs underperform continuously after 13 14 months
post-IPO. The differential in returns between hot and normal markets widens to some 656% for
venture-backed IPOs but reaches only 3821% for non-venture IPOs five years post-issue. This
points towards a more prominent investor sentiment influence in venture-backed as compared to
non-venture IPOs. It is particularly noticeable that hot market CAARs exhibit the underreaction-
overreaction profile predicted for stock returns in the behavioral finance theories of Barberis,
Shleifer and Vishny (1998), Daniel, Hirshleifer and Subrahmanyam (1998) and Hong and Stein
(1999). This pattern is especially prominent for non-venture IPOs.
Underperformance relative to the offer price
Figures 3a-3c depicts the CAARs using the offer price as the starting point.
[Figures 3a-3c around here]
The aim is to shed light on Ljungqvist et al.’s (2006) prediction No. 1 on IPO underperformance
relative to the offer price. They argue that that latter presents a higher hurdle and thus offers a
more exacting test of the underperformance hypothesis. The intuition is that the offer price will
exceed the firm’s fundamental value due to a surplus extracted from sentiment investors.
For the full sample, the results are similar to those previously reported with a return
differential of about 540% between hot and normal periods. Similar to Figure 2a, the returns start
out at fairly similar levels but then diverge considerably after the first year. However, the long-
run performance is now much better both overall and in the normal markets but
underperformance reaches –-825% in hot markets. These findings support the Ljungqvist et al.
(2006) prediction that hot market IPOs underperform even relative to the offer price.
The return differential between hot and normal markets for venture-backed IPOs in
Figure 3b is much less dramatic than in Figure 2b. It is interesting that the returns are initially
much larger for IPOs in hot markets relative to those in normal markets. Hot market IPO CAARs
18
quickly decline and end up underperforming relative to normal market CAARs with an absolute
decline of –1627%. This result points towards the initial presence of sentiment investors that buy
into overhyped issues, only to be disappointed in the long-term, as suggested by Ljungqvist et al.
(2006). Finally, non-venture IPOs raised during normal periods outperform those in the hot
periods by about 335% from the start, extending to about 5480% after five years, as can be seen
in Figure 3c. Hot market IPOs again exhibit a slightly positive absolute 5-year underperformance
of some +223%. Comparing Figures 3b and 3cIndeed, venture-backed IPOs appear sharply to
underperform non-venture IPOs overall and in both hot and normal markets relative to the offer
price.
Industry analysis
A large proportion of our sample of high-technology IPOs went public during hot markets.
Ofek and Richardson (2002) show for the US that a significantly larger proportion of investors in
internet stocks consisted of individuals rather than institutions, making the market prone to
behavioural biases based on overly optimistic beliefs. 20 They develop a framework in the spirit
of Miller (1977) arguing that irrationally exuberant investors overwhelmed the market with their
unrealistically high valuations, in particular in the high-technology sector. Rational investors did
not bet against them due to short sale constraints and the risk of prices increasing even further
due to the limits to arbitrage hypothesised by Shleifer and Vishny (1997). Thus they predict that
high-technology, hot market IPOs should underperform compared to those floated during normal
markets.
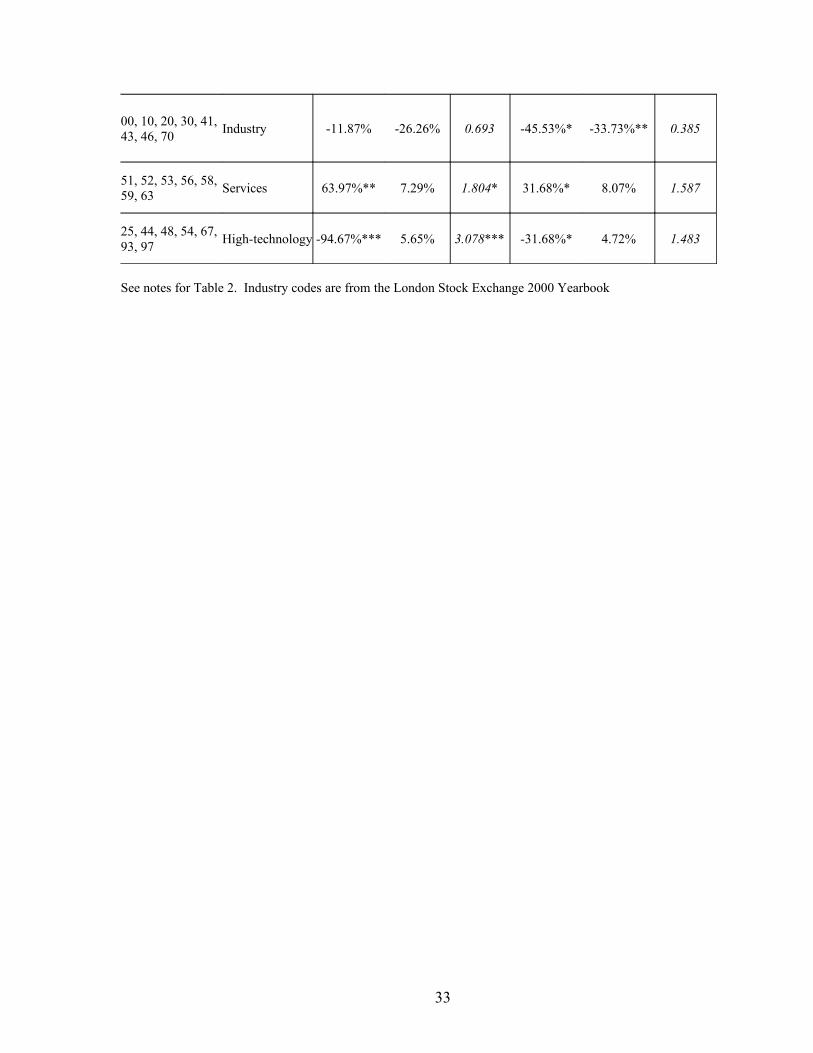
The analysis of long-run performance is presented for twelve industry sub-sectors and
three aggregate sectors classified according to the London Stock Exchange 2000 Yearbook in
20 65% of our venture-backed sample in that period are high-tech firms while only 26% are high-tech 1985-1997.
19

Table 3.21 Panel A gives the three-year and five-year CARs for the full sample while Panels B
and C report the results for venture and non-venture IPOs, respectively.
[Table 3 around here]
Panel A reveals that the three- and five-year CARs for the full sample are significantly
negative for the high-technology sector during the hot periods at the 1% level. The CARs are
also significantly different between hot and normal periods at the 1% level. We thus support the
Ofek and Richardson (2002) prediction for the high-technology sector. These results are
consistent with the basic premise of their model that some investors may occasionally be
irrationally exuberant about the prospects of IPOs in a particular industry. None of the other
aggregate sectors exhibits significant return differentials between the hot and normal periods.
Panel B confirms the significant return differential between hot and normal markets for
high-technology, venture-backed IPOs over both three- and five years at the 1% level. IPOs in
the industry and services sectors now also show significant five-year CAR differentials between
hot and normal markets at the 10% and 5% levels, respectively. Again, the return differentials
between hot and normal markets are not significantly different from none of the other aggregate
sectors. However, the non-venture IPO results in Panel C reveal that only the three-year CARs
for the high-technology sector are significantly different between the hot and normal periods at
the 1% level while the services sector only shows significance at the 10% level. None of the
aggregate industry sector return differentials is significant for five-year CARs.
The overall results from Table 3 point towards sustained underperformance in the high-
technology sector during the hot market periods. While Tthis performance differential holds
21 The high-technology sector includes the pure technology sectors electronic/electrical equipment and telecom/IT hardware and software as well as media/photography and healthcare/pharmaceuticals as these sectors are the usual focus of classical venture capital both in the US and Europe and were sectors that were particularly prone to investor sentiment during the TMT bubble of the late 1990s (see for example Ofek and Richardson (2002), Loughran and Ritter (2004) and Lerner (1994) for similar definitions).
20

holds mainly for both venture-backed and non-venture IPOs, across both three-year and five-year
periods. only the former exhibit significantly worse performance in hot markets in the other two
sectors. This is a refinement of the arguments of Lerner (1994) who shows that venture
capitalists are able to bring companies to the public markets at times that they perceive to be
optimal.
4.2 Cross-section regression results
The results ofrom from cross-section regression are presented in Table 4.
[Table 4 around here]
Results for all years, normal markets, and for hot periods only are reported for the full sample of
all IPOs and for sub-samples consisting of either VC backed IPOs or non-VC backed IPOs. The
estimation method used is ordinary least squares. The three-year CAR is the dependent variable
and t-statistics are calculated using White's (1980) heteroskedasticity-consistent method.
Two variables are included in the regressions to control for firm size: the natural
logarithm of the book value of assets in the year preceding the IPO divided by the market
capitalisation at IPO (BTOM) as well as the natural logarithm of the issuer’s market
capitalisation at IPO (MARKETCAP). The latter is based on the firm’s first closing price after
the issue. An UNDERWRITER dummy variable is used to control for underwriter reputation.
This equals 1 if the IPO's lead underwriter is listed in the top-ten in the annual Hambro
underwriter rankings. Finally, an industry dummy for the high-technology industry is included in
the regression analysis as research by Levis (1993) has shown that there are marked differences
in the long-run performance of individual industries and considerable return differences between
hot and normal periods were found in particular for the high-technology sector in the univariate
tests of Table 3. The HIGH-TECH dummy includes electronic and electrical equipment, health
and pharmaceuticals, media and photography as well as telecom, IT hardware and software.
21
Ljungqvist et al. (2006) conjecture in their Prediction No 6 that lower-quality companies
may go public in hot IPO markets for opportunistic reasons. This results in a decline in the
quality of the average issuer, in particular in relation to earnings deflated by total assets.
Ljungqvist and Wilhelm (2003) show that over 60% of firms listing in the US in 1997 had 12-
month track records of earnings while this had fallen to just 24% in 1999. The behavioral
assumption is that firms going public in hot markets will generally enjoy pre-IPO turnover
growth to attract capital market investors. Under the classical assumptions, pre-IPO earnings
quality should have no bearing on post-IPO performance, as share prices fully reflect intrinsic
corporate values.
The variables TURNOVER/ASSETS and EBIT/ASSETS represent the growth in the
level of turnover and earnings, respectively, between up to three years pre-IPO and the fiscal
year of the IPO divided by the average total assets in those four years. IPOs with strong earnings
growth prior to the offering generated significantly superior performance at the 15% level in all
periods and during both hot and normal markets. The coefficient on EBIT/ASSETS is
particularly high for VC-backed IPOs during hot markets, while high TURNOVER/ASSETS are
associated with stronger long term performance for non-VC backed IPOs during hot markets.
This suggests that evidence relating to fundamentals such as pre-issue earnings growth and
turnover are particularly useful during hot markets to identify issues that are less likely to
underperform in the long-term.
Ritter (1991) reports a negative impact of underpricing on long-run performance and
Ofek and Richardson (2002) find a strong negative relation between underpricing and future
excess returns to the end of 2000. However Ljungqvist et al. (2006) argue that the relationship is
not necessarily monotonic. They argue in their Prediction No. 4 that the relationship is negative
when the probability of the hot market ending is small.22 This is tested using the coefficient on
22 Krigman, Shaw and Womack (1999), on the other hand, find a positive relation between underpricing and short-run, one-year returns, except for “extra-hot” IPOs”, which generated the worst one-year performance in their
22
the FIRST DAY RETURN variable measured by the raw return on the first day of trading. For
venture-backed IPOs, the coefficient on the initial return variable is very large and negative
during hot markets, albeit only significant at the 105% level. For the full sample of IPOs and for
non-VCs the coefficient is insignificant for both normal and hot markets. This suggests that VCs
exploit sentiment traders and underlines the role of investor sentiment during hot markets.
Indeed, the hot market dummy variable is significant at the 1% level for the whole VC sample.
However, the high-technology dummy is significant at the 1% level only for the whole sample
and non-VCs during the hot market.
The classical venture capital certification hypothesis was first formulated by Megginson
and Weiss (1991). Brav and Gompers (1997) update this by arguing that reputable venture
capitalists provide access to top-tier investment and commercial bankers, participate on the board
of directors and implement superior management structures. Although we obtain positive
coefficients for the VCREP dummy variable, it is always insignificantly different from zero.23
In addition we find that prestigious underwriters do not provide a certifying role.
5. Conclusions
We examine the relationship between hot markets, long run underperformance and venture
capitalists for a sample of 59371 UK IPOs 1985-20030. Hot market IPOs significantly
underperform those issued during normal markets both relative to the first day trading price and
to the offer price. The latter confirms Ljungqvist et al.’s (2006) first prediction and provides
robust support for long run underperformance by hot market IPOs. These results underline the
role of investor sentiment in hot markets consistent with the recent findings of Derrien (2005),
Helwege and Liang (2004) and Cook et al. (2003). The significantly negative relationship
sample.23 In other specifications we included a general VC dummy for all VC backed IPOs in place of VCREP, but this was also not significant.
23
between underpricing and long-term returns for venture-backed IPOs during hot markets
furbishes evidence of market timing.
Industry analysis reveals that only the high-technology sector exhibits a significant return
differential between hot and normal markets for the full sample and separately for venture-
backed and non-venture IPOs. This result stems from the large proportion of high-technology
firms issued during hot markets with the pervasive presence of exuberant noise traders. Cross-
sectional regressions support the claim of significant underperformance by high-technology
firms in hot markets for the full sample and non-venture IPOs. Venture-backed IPOs issued
during hot markets underperform more severelyvery significantly althoughwhile their non-
venture counterparts also suffer substantial negative returns only three-years post-IPO.
24
References
Aggarwal, R., Rivoli, P., 1990. Fads in the initial public offering market? Financial Management 19, 45-57.
Baker, M., Wurgler, J., 2000, The equity share in new issues and aggregate stock returns. Journal of Finance 55, 2219-2257.
Barber, B., Lyon, J., 1997. Detecting long-run abnormal stock returns: The empirical power and specification of test statistics. Journal of Financial Economics 43, 341-372.
Barberis, N., Shleifer, A., Vishny, R., 1998. A model of investor sentiment. Journal of Financial Economics 49, 307-343.
Barry, C., Muscarella, C., Peavy, J., Vetsuypens, M., 1990. The role of venture capital in the creation of public companies. Evidence from the going public process. Journal of Financial Economics 27, 447-471.
Bradley, D., Jordan, B., Roten, I.,Yi, H., 2001. Venture capital and IPO lockup expiration: An empirical analysis. Journal of Financial Research 24, 465-494.
Brav, A., Gompers, P., 1997. Myth or Reality? The long-run underperformance of initial public offerings: evidence from venture capital and non-venture-backed companies. Journal of Finance 52, 1791-1822.
Carter, R., Dark, F., Singh, A., 1998. Underwriter reputation, initial returns, and the long-run performance of IPO stocks. Journal of Finance 53, 285-311.
Cook, D., Jarrell, S., Kieschnick, R., 2003. Investor sentiment and IPO cycles. Unpublished Working Paper, University of Mississippi.
Daniel, K. , Hirshleifer, D., Subrahmanyam, A., 1998. Investor psychology and security market under- and overreactions. Journal of Finance 53, 1839-85.
Derrien, F., 2005. Pricing in “hot” market conditions: who leaves money on the table? Journal of Finance 60, Forthcoming.
Doukas, J., Gonenc, H., 2000. Long run performance of initial public offerings: venture capitalists and reputations of investment bankers. EFMA 2000 Athens.
Espenlaub, S., Garrett, I., Mun, W., 2000. Conflicts of interest and the performance of venture-capital backed IPOs: A preliminary look at the UK. Venture Capital 1, 325-349.
Espenlaub, S., Goergen, M., Khurshed, A., 2001. Lock-in agreements in the UK: Is there a fourth IPO anomaly? Journal of Business, Finance and Accounting 28, 1235-1278.
Espenlaub, S., Gregory, A., Tonks, I., 2000. Re-assessing the long-term underperformance of UK initial public offerings. European Financial Management 6, 319-342.
25
Fama, E., 1998. Market efficiency, long-term returns, and behavioral finance. Journal of Financial Economics 49, 283-306.
Gompers, P., Lerner, J., 2003. The really long-run performance of initial public offering. Journal of Finance 58, 1355-1392.
Gompers, P., Lerner, J., 1999a. Conflict of interest and reputation in the issuance of public securities: Evidence from venture capital. Journal of Law and Economics 42, 53-80.
Gompers, P., Lerner, J., 1999b. The Venture Capital Cycle. The MIT Press, Cambridge, Massachusetts.
Hamao, Y., Packer, F., Ritter, J. 2000. Institutional affiliation and the role of venture capital: Evidence from initial public offerings in Japan, Pacific Basin Finance Journal 8, 529-558.
Helwege, J., Liang, N., 2004. Initial public offerings in hot and cold markets, Journal of Financial and Quantitative Analysis 39, 541-569.
Hong, H., Stein, J., 1999. A unified theory of underreaction, momentum trading and overreaction in asset markets. Journal of Finance 54, 2143-2184.
Ibbotson, R.G., Jaffe, J.F., 1975. Hot issue markets. Journal of Finance 30, 1027 – 1042.
Jelic, R., Saadouni, B., Wright, M., 2004. The performance of private to public MBOs - The role of venture capital. Journal of Business Finance and Accounting, Forthcoming.
Khurshed, A., 1999. Initial public offerings. An analysis of the post-IPO performance of UK firms. Unpublished PhD thesis, University of Reading.
Kothari, S., Warner, J., 1997. Measuring long-horizon security price performance. Journal of Financial Economics 43, 301-339.
Krigman, L., Shaw, W., Womack, K., 1999. The persistence of IPO mispricing and the predictive power of flipping. Journal of Finance 54, 1015-1044.
Lee, C., Shleifer, A., Thaler, R., 1991. Investor sentiment and the closed-end fund puzzle. Journal of Finance 46, 75-110.
Lerner, J., 1994. The syndication of venture capital investments. Financial Management 23, 16-27.
Levis, M., 1993. The long-run performance of initial public offerings: the UK evidence. Financial Management 22, 28-41.
Lin, T., Smith, R., 1998. Insider reputation and selling decisions: The unwinding of venture capital investments during equity IPOs. Journal of Corporate Finance 4, 241-263.
Ljungqvist, A., Nanda, V., Singh, R., 2006. Hot markets, investor sentiment and IPO pricing. Journal of Business, 79(4), forthcoming.
26
Ljungqvist, A.,Wilhelm, W., 2003. IPO pricing in the dot-com bubble. Journal of Finance 23, 723-752.
Loughran, T., Ritter, J. R., 2004. Why has IPO underpricing changed over time? Financial Management 33, 5-37.
Loughran, T., Ritter, J. R., 2000. Uniformly least powerful tests of market efficiency. Journal of Financial Economics 55, 361-389.
Loughran, T., Ritter, J. R., 1995. The new issues puzzle. Journal of Finance 50, 23-51.
Loughran, T.,. Ritter, J.R., Rydqvist, K., 1994. Initial public offerings: International insights, Pacific-Basin Finance Journal 2, 165-199.
Lowry, M., 2003. Why does IPO volume fluctuate so much? Journal of Financial Economics 67, 3-40.
Lowry, M., Schwert, G., 2002. IPO market cycles: Bubbles or sequential learning? Journal of Finance 57, 1171-1200.
Lyon, J., Barber, B., Tsai, C., 1999. Improved methods for tests for long run abnormal stock returns. Journal of Finance 54, 165-202.
Megginson, W., Weiss, K., 1991. Venture capital certification in initial public offerings. Journal of Finance 46, 879-893.
Mitchel, M., Stafford, R., 2000. Managerial decision making and long term stock price performance. Journal of Business 73, 287-329.
Miller, E., 1977. Risk, uncertainty and divergence of opinion. Journal of Finance 32, 1151-1168.
Ofek, E., Richardson, M., 2002. The valuation and market rationality of internet stock prices. Oxford Review of Economic Policy 18, 265-287.
Pagano, M., Panetta, F., Zingales, L., 1998. Why do companies go public? An empirical analysis. Journal of Finance 53, 27–64.
Pastor, L., Veronesi, P., 2003. Stock price and IPO waves. NBER Working Paper No. W9858.
Rajan, R., Servaes, H., 1997. Analyst following of initial public offerings. Journal of Finance 52, 507–530.
Rajan, R., Servaes, H., 2003. The effect of market conditions on initial public offerings. In: McCahery, J., Renneboog, L. (Eds.), Venture Capital Contracting and the Valuation of High-tech Firms. Oxford University Press.
Ritter, J. R., 2003. Differences between European and American IPO markets. European Financial Management 9, 421-434.
Ritter, J. R., 1991. The long-run performance of initial public offerings. Journal of Finance 42, 365-394.
27

Ritter, J. R., 1984. The 'hot issue' market of 1980. Journal of Business 57, 215-241.
Ritter, J. R., Welch, I., 2002. A review of IPO activity, pricing and allocations. ournal of Finance 57, 1795-1828.
Shleifer, A., Vishny, R., 1997. The limits of arbitrage. Journal of Finance 52, 35-55.
Teoh, S., Welch, I., Wong, T., 1998. Earnings management and the long-run performance of initial public offerings. Journal of Finance 53, 1935-1974.
White, H., 1980. A heteroskedastic-consistent covariance matrix and a direct test of heteroskedasticity. Econometrica 48, 817-838.
28
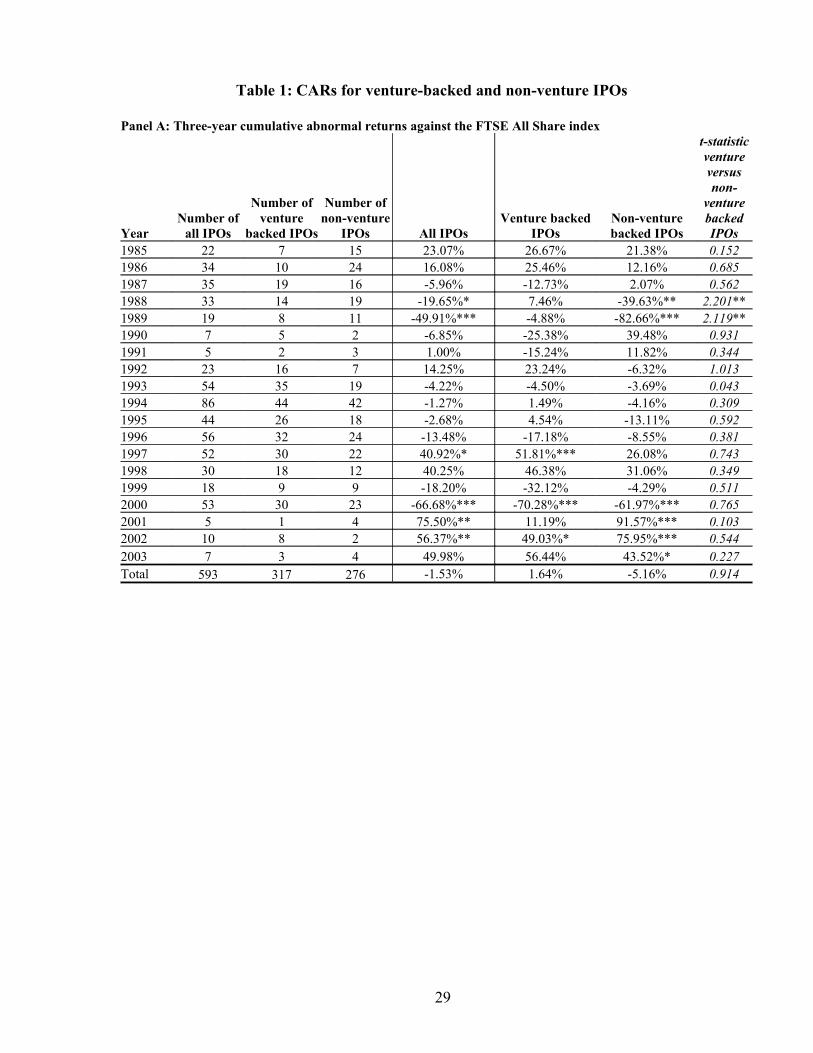
Table 1: CARs for venture-backed and non-venture IPOs
Panel A: Three-year cumulative abnormal returns against the FTSE All Share index
YearNumber of
all IPOs
Number of venture
backed IPOs
Number of non-venture
IPOs All IPOsVenture backed
IPOsNon-venture backed IPOs
t-statistic venture versus non-
venture backed IPOs
1985 22 7 15 23.07% 26.67% 21.38% 0.1521986 34 10 24 16.08% 25.46% 12.16% 0.6851987 35 19 16 -5.96% -12.73% 2.07% 0.5621988 33 14 19 -19.65%* 7.46% -39.63%** 2.201**1989 19 8 11 -49.91%*** -4.88% -82.66%*** 2.119**1990 7 5 2 -6.85% -25.38% 39.48% 0.9311991 5 2 3 1.00% -15.24% 11.82% 0.3441992 23 16 7 14.25% 23.24% -6.32% 1.0131993 54 35 19 -4.22% -4.50% -3.69% 0.0431994 86 44 42 -1.27% 1.49% -4.16% 0.3091995 44 26 18 -2.68% 4.54% -13.11% 0.5921996 56 32 24 -13.48% -17.18% -8.55% 0.3811997 52 30 22 40.92%* 51.81%*** 26.08% 0.7431998 30 18 12 40.25% 46.38% 31.06% 0.3491999 18 9 9 -18.20% -32.12% -4.29% 0.5112000 53 30 23 -66.68%*** -70.28%*** -61.97%*** 0.7652001 5 1 4 75.50%** 11.19% 91.57%*** 0.1032002 10 8 2 56.37%** 49.03%* 75.95%*** 0.5442003 7 3 4 49.98% 56.44% 43.52%* 0.227Total 593 317 276 -1.53% 1.64% -5.16% 0.914
29

Panel B: Five-year cumulative abnormal returns against the FTSE All Share index
YearNumber of
all IPOs
Number of venture
backed IPOs
Number of non-venture
IPOs All IPOsVenture backed
IPOsNon-venture backed IPOs
t-statistic for
difference in means venture backed
versus non-venture backed IPOs
1985 22 7 15 -16.55% -4.25% -22.29% 0.3761986 34 10 24 -19.36% -1.91% -26.63% 0.8191987 35 19 16 -10.58% -26.09% 7.82% 0.9671988 33 14 19 -25.71% 4.94% -48.30** 1.6151989 19 8 11 -28.69% 3.19% -51.88** 1.2651990 7 5 2 6.51% -9.72% 47.07% 1.0891991 5 2 3 -15.78% -68.01% 19.04% 0.7181992 23 16 7 8.07% 14.10% -5.71% 0.4881993 54 35 19 -46.24%*** -44.69%*** -49.10%* 0.1561994 86 44 42 -19.78%* -26.83%* -12.39% 0.6301995 44 26 18 9.10% 22.67% -10.50% 0.7851996 56 32 24 24.18% 21.14% 28.23% 0.2621997 52 30 22 30.24% 28.41% 32.73% 0.1071998 30 18 12 34.67%* 46.97% 16.23% 0.7931999 18 9 9 28.43% 20.27% 36.59% 0.3842000 53 30 23 -41.59%*** -58.99%*** -18.89% 0.2562001 5 1 4 97.4%* -13.06% 125.02%** 2.407*2002 10 8 2 61.23%*** 54.44%* 79.32%*** 0.5712003 7 3 4 49.98%* 56.44% 43.52%* 0.227Total 593 317 276 -4.55% -3.74% -5.48% 0.871
The sample consists of 317 venture backed IPOs and 276 non-venture backed IPOs listed on the Official List of the London Stock Exchange between January 1985 to December 2003. The venture backed IPOs are all new issues within the sample with venture capital participation recorded in the IPO prospectus. Three-year (five-year) equal-weighted cumulative returns on IPOs are calculated by adding returns from the third day of trading to the end of the month of the IPO and from then on adding monthly returns for thirty-five (fifty-nine) months. Abnormal returns are the simple difference between the IPO return in a given month and the FTSE All Share index. If the IPO is delisted before the thirty-fifth (fifty-ninth) month the return is added until the delisting date. Since monthly returns are available only until 30 June 2005, the returns are truncated for IPOs after 1 July 2000. All IPO and benchmark returns are taken from Datastream. One, two and three asterisks indicate significance, at the 10%, 5%and 1% level or better, respectively.
30

Table 2: CARs for Venture-backed and non-venture IPOs in hot and normal marketsPanel A: Three-year CARs (FTSE All Share)
Panel A: Three-year cumulative abnormal returns against the FTSE All Share index
Period
TotalNumber of all
IPOs
Number of vVenture
backed IPOs
Number of nNon-
venture IPOs All IPOs
Venture backed IPOs
Non-venture backed IPOs
t-statistic for difference in
means venture backed versus non-venture backed IPOs
Hot 142 84 58 -27.96%*** -29.86*** -25.21** 0.312Normal 451 233 218 6.80% 13.00%** 0.17% 1.645* t-statistic for difference in
means Hot versus
Normal
4.046*** 3.859*** 1.878*
Panel B: Five-year cumulative abnormal returns against the FTSE All Share index
PeriodYear
TotalNumber of all
IPOs
Venture backedNum
ber of venture
backed IPOs
Non-ventureNu
mber of non-venture
IPOsAll IPOsAll
IPOs
Venture backed IPOsVenture backed IPOs
Non-venture backed
IPOsNon-venture backed
IPOs
t-statistic for difference in
meanst-statistic for difference in means venture backed versus non-venture backed IPOs
Hot 142 84 58 -35.72*** -45.59*** -21.42% 1.332Normal 451 233 218 5.26% 11.35%* -1.24% 1.228t-statistic for difference in
means Hot versus
Normal
3.934*** 4.241*** 1.229
The sample consists of 317 venture backed IPOs and 276 non-venture backed IPOs listed on the Official List of the London Stock Exchange between January 1985 to December 2003. The venture backed IPOs are all new issues within the sample with venture capital participation recorded in the IPO prospectus. The Hot period includes 1987, 1993 and 2000. The Normal period includes the other years. Three-year (five-year) equal-weighted cumulative returns on IPOs are calculated by adding returns from the third day of trading to the end of the month of the IPO and from then on adding monthly returns for thirty-five (fifty-nine) months. Abnormal returns are the simple difference between the IPO return in a given month and the FTSE All Share index. If the IPO is delisted before the thirty-fifth (fifty-ninth) month the return is added until the delisting date. Since monthly returns are available only until 30 June 2005, the returns are truncated for IPOs after 1 July 2000. All IPO and benchmark returns are taken from Datastream. One, two and three asterisks indicate significance, at the 10%, 5%and 1% level or better, respectively.
31
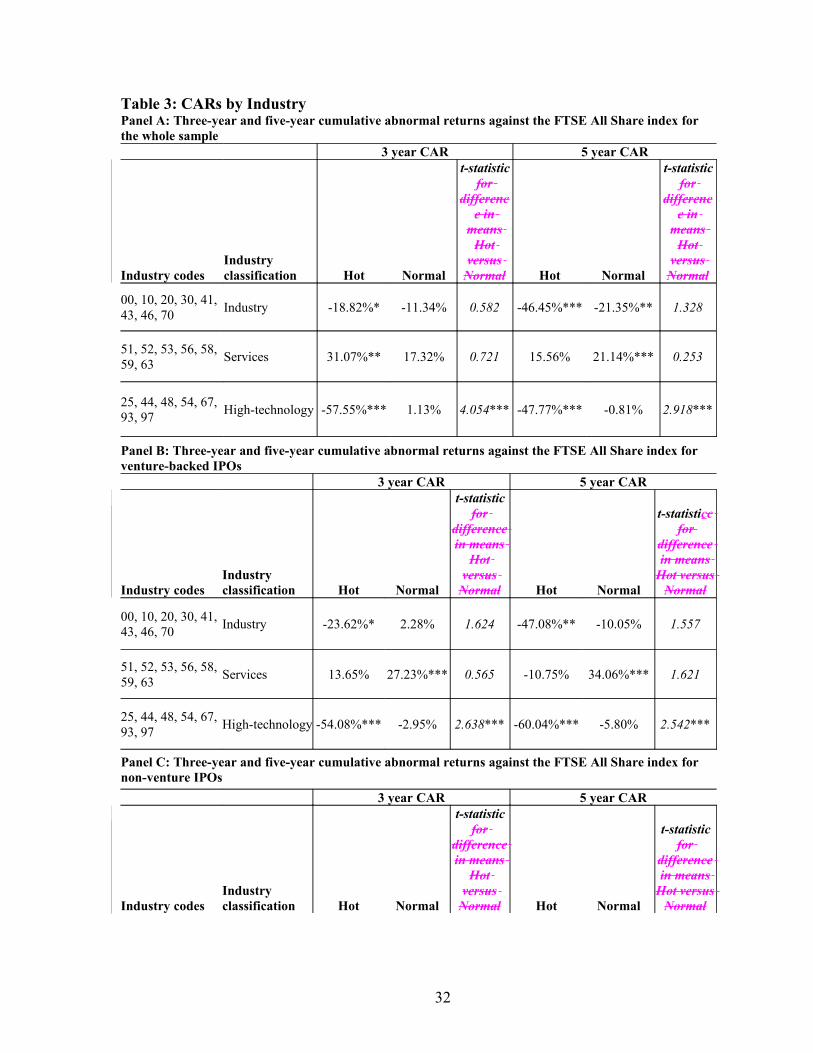
Table 3: CARs by IndustryPanel A: Three-year and five-year cumulative abnormal returns against the FTSE All Share index for the whole sample 3 year CAR 5 year CAR
Industry codesIndustry classification Hot Normal
t-statistic for
difference in
means Hot
versus Normal Hot Normal
t-statistic for
difference in
means Hot
versus Normal
00, 10, 20, 30, 41, 43, 46, 70
Industry -18.82%* -11.34% 0.582 -46.45%*** -21.35%** 1.328
51, 52, 53, 56, 58, 59, 63
Services 31.07%** 17.32% 0.721 15.56% 21.14%*** 0.253
25, 44, 48, 54, 67, 93, 97
High-technology -57.55%*** 1.13% 4.054*** -47.77%*** -0.81% 2.918***
Panel B: Three-year and five-year cumulative abnormal returns against the FTSE All Share index for venture-backed IPOs 3 year CAR 5 year CAR
Industry codesIndustry classification Hot Normal
t-statistic for
difference in means
Hot versus
Normal Hot Normal
t-statisticc for
difference in means
Hot versus Normal
00, 10, 20, 30, 41, 43, 46, 70
Industry -23.62%* 2.28% 1.624 -47.08%** -10.05% 1.557
51, 52, 53, 56, 58, 59, 63
Services 13.65% 27.23%*** 0.565 -10.75% 34.06%*** 1.621
25, 44, 48, 54, 67, 93, 97
High-technology -54.08%*** -2.95% 2.638*** -60.04%*** -5.80% 2.542***
Panel C: Three-year and five-year cumulative abnormal returns against the FTSE All Share index for non-venture IPOs
3 year CAR 5 year CAR
Industry codesIndustry classification Hot Normal
t-statistic for
difference in means
Hot versus
Normal Hot Normal
t-statistic for
difference in means
Hot versus Normal
32
00, 10, 20, 30, 41, 43, 46, 70
Industry -11.87% -26.26% 0.693 -45.53%* -33.73%** 0.385
51, 52, 53, 56, 58, 59, 63
Services 63.97%** 7.29% 1.804* 31.68%* 8.07% 1.587
25, 44, 48, 54, 67, 93, 97
High-technology -94.67%*** 5.65% 3.078*** -31.68%* 4.72% 1.483
See notes for Table 2. Industry codes are from the London Stock Exchange 2000 Yearbook
33

34

Table 4: Determinants of three-year cumulative abnormal performanceAll IPOs Non-VC VC-backed
1 1985-2003
2Normal markets
3 Hot period
41985-2003
5Normal markets
6 Hot markets
71985-2003
8Normal markets
9 Hot markets
Intercept -0.0562 -0.2628* 0.0629 -0.1976 -0.4124** -0.0409 0.1938 0.0565 -0.1077(0.46) (1.88) (0.28) (1.23) (2.34) (0.13) (0.92) (0.23) (.27)
BTOM -0.0327 -0.0160 -0.1952 -0.0914 -0.0102 -0.3923*** 0.0127 -0.0279 0.1744(0.42) (0.18) (1.59) (0.83) (0.08) (3.32) (0.13) (0.22) (1.00)
MARKETCAP 0.0079 0.0587* -0.0951* 0.0247 0.0967** -0.1303* -0.0176 0.0021 0.0207(0.25) (1.66) (1.66) (0.55) (2.07) (1.99) (0.39) (0.04) (0.20)
UNDERWRITER 0.0385 0.0285 0.0281 -0.0133 -0.0700 0.1527 0.0655 0.0894 0.0641(0.51) (0.32) (0.20) (0.11) (0.52) (0.66) (0.66) (0.74) (0.37)
FIRST DAY RETURN -0.0469 0.1900 -0.3707 -0.0180 0.0892 -0.0800 -0.1012 0.2389 -0.7126*(0.24) (0.53) (1.58) (0.06) (0.17) (0.36) (0.39) (0.49) (1.78)
TURNOVER/ASSETS 0.0380 0.0245 0.1071 0.0634* 0.0461 0.2443*** -0.0297 -0.0368 -0.0599(1.25) (0.82) (1.42) (1.68) (1.17) (4.47) (0.50) (0.58) (0.37)
EBIT/ASSETS 0.2825*** 0.2304*** 0.5689*** 0.2048 0.1363 0.4310* 0.3654*** 0.3055*** 1.1420***(2.82) (2.65) (2.92) (1.57) (1.47) (1.77) (3.05) (2.86) (3.65)
HIGH-TECH -0.1770** -0.0589 -0.4458*** -0.1535 0.0689 -0.8055*** -0.2075** -0.1808 -0.1226(2.16) (0.60) (2.96) (1.20) (0.45) (3.99) (1.97) (1.39) (0.53)
VCREP 0.1159 0.1158 0.0662 0.0787 0.0703 0.1021(1.53) (1.29) (0.46) (0.75) (0.53) (0.56)
HOT MARKET -0.2871*** -0.2272* -0.3580***
(3.44) (1.68) (3.26)
R20.071 0.034 0.229 0.045 0.030 0.385 0.112 0.052 0.255
F-Stat 4.900*** 1.908* 4.931*** 1.571 0.930 4.463*** 4.280*** 1.528 3.202***N 589 447 142 274 216 58 315 231 84The sample consists of 315 venture backed IPOs and 274 non-venture backed IPOs listed on the London Stock Exchange between 1985 and 2003. This sample is slightly smaller than that used in the rest of the paper due to the unavailability of earnings data for two IPOs. The Hot period includes 1987, 1993 and 2000. The dependent variable is the three-year CAR against the FTSE All Share index. BTOM is the natural logarithm of the book-to-market ratio of the issuer at IPO. The natural logarithm of market capitalisation (MARKETCAP) controls for size. The UNDERWRITER dummy variable equals 1 if the IPO's lead underwriter is listed in the top-ten in annual Hambro underwriter rankings. FIRST DAY RETURN is the raw return on the first day of trading. TURNOVER/ASSETS equals the growth in turnover between up to three years pre-IPO and the fiscal year of the IPO divided by the average total assets in those four years. EBIT/ASSETS equals the growth in EBIT between up to three years pre-IPO and the fiscal year of the IPO divided by the average total assets in those four years. The VCREP dummy variable equals 1 if the IPO's lead venture capitalist has an established reputation as defined previously. All regressions are OLS and include a HIGH-TECH industry dummy variable. One, two and three asterisks indicate significance, at the 10%, 5%and 1% level or better, respectively. The t-statistics (in italics) are calculated using White's (1980) heteroskedasticity-consistent method.
35

Figure 1
IPO Cycles on London Stock Exchange, 1985-2003
0102030405060708090
100
1985
1986
1987
1988
1989
1990
1991
1992
1993
1994
1995
1996
1997
1998
1999
2000
2001
2002
2003
Year
Nu
mb
er o
f IP
Os
0%
10%
20%
30%
40%
50%
60%
70%
Init
ial
IPO
ret
urn
s
Number of IPOs Initial IPO returns
The full population of IPOs contain 2,489 issues listed on the London Stock Exchange between 1985 and 2000. The sample consists of 593 IPOs listed on the London Stock Exchange between 1985 and 2003. The data are from the London Stock Exchange Quarterly Markets Reviews.
36

Figure 2: Long-run CAARs, 1985-2003
a) All IPOs
-40.0%
-30.0%
-20.0%
-10.0%
0.0%
10.0%
1 3 5 7 9 11 13 15 17 19 21 23 25 27 29 31 33 35 37 39 41 43 45 47 49 51 53 55 57 59
Months after IPO
Cum
ulat
ive
Ave
rage
Abn
orm
al R
etur
n
All markets Hot markets Normal markets
b) Venture-backed IPOs
-50.0%
-40.0%
-30.0%
-20.0%
-10.0%
0.0%
10.0%
20.0%
1 3 5 7 9 11 13 15 17 19 21 23 25 27 29 31 33 35 37 39 41 43 45 47 49 51 53 55 57 59
Months after IPO
Cum
ulat
ive
Ave
rage
Abn
orm
al R
etur
n
All markets Hot markets Normal markets
c) Non-venture backed IPOs
-40.0%
-30.0%
-20.0%
-10.0%
0.0%
10.0%
20.0%
1 3 5 7 9 11 13 15 17 19 21 23 25 27 29 31 33 35 37 39 41 43 45 47 49 51 53 55 57 59
Months after IPO
Cum
ulat
ive
Ave
rage
Abn
orm
al R
etur
n
All markets Hot markets Normal markets
The sample consists of 317 venture backed and 276 non-venture IPOs listed on the London Stock Exchange between January 1985 to December 2003. The venture backed IPOs are all new issues with venture capital participation recorded in the IPO prospectus. The monthly abnormal returns are difference between the IPO return in a given month and the FTSE All Share. The Hot period includes 1987, 1993 and 2000. The Normal period includes the other years. Abnormal returns are then averaged across IPOs to yield the monthly average abnormal returns. The cumulative average abnormal returns (CAAR) are calculated by cumulating the AARs from the third day of trading to the end of the month and then cumulating AARs for fifty-nine months. Since monthly returns are available only until 30 June 2005, the returns are truncated for IPOs after July 2000.
37
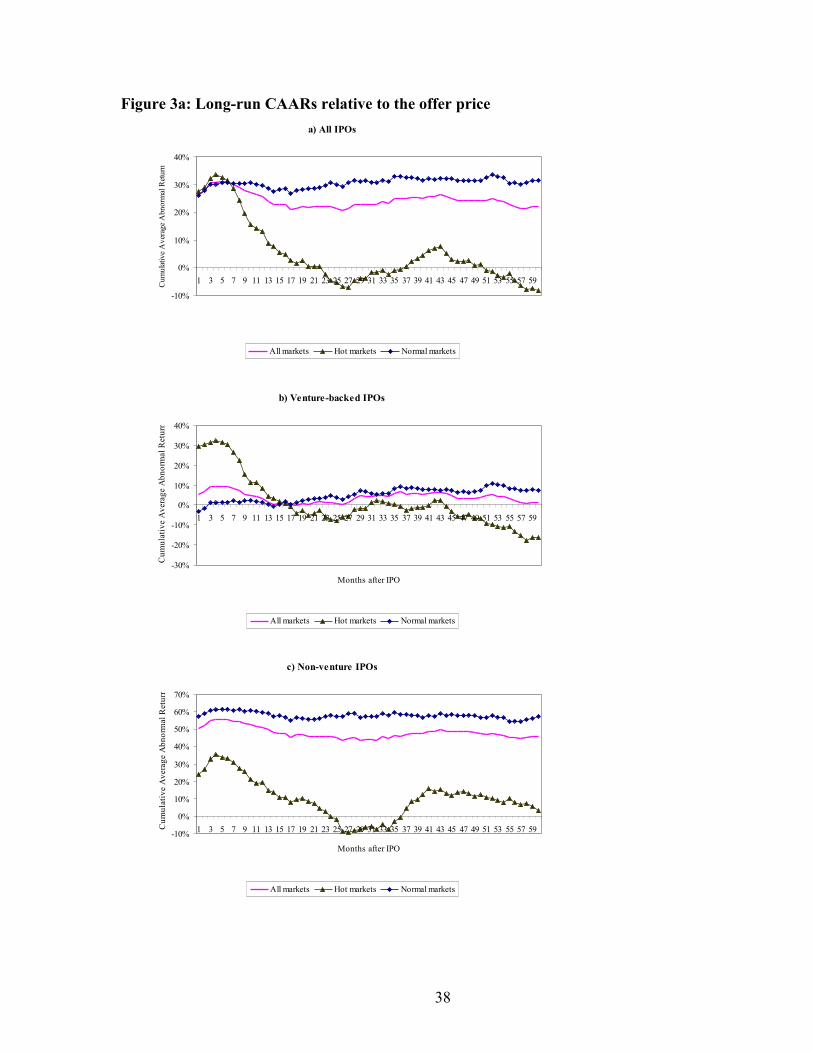
Figure 3a: Long-run CAARs relative to the offer price
a) All IPOs
-10%
0%
10%
20%
30%
40%
1 3 5 7 9 11 13 15 17 19 21 23 25 27 29 31 33 35 37 39 41 43 45 47 49 51 53 55 57 59Cum
ulat
ive
Ave
rage
Abn
orm
al R
etur
n
All markets Hot markets Normal markets
b) Venture-backed IPOs
-30%
-20%
-10%
0%
10%
20%
30%
40%
1 3 5 7 9 11 13 15 17 19 21 23 25 27 29 31 33 35 37 39 41 43 45 47 49 51 53 55 57 59
Months after IPO
Cum
ulat
ive
Ave
rage
Abn
orm
al R
etur
n
All markets Hot markets Normal markets
c) Non-venture IPOs
-10%
0%
10%
20%
30%
40%
50%
60%
70%
1 3 5 7 9 11 13 15 17 19 21 23 25 27 29 31 33 35 37 39 41 43 45 47 49 51 53 55 57 59
Months after IPO
Cum
ulat
ive
Ave
rage
Abn
orm
al R
etur
n
All markets Hot markets Normal markets
38

Appendix I. Data Sources
Venture-backed IPOs are defined as those IPOs where a venture capitalist is included as a
minimum 3% (or 5%) shareholder in the listing prospectus.24 Venture capitalists are investment
firms included in the directories of the British Venture Capital Association (BVCA), European
Venture Capitalist Association (EVCA) or National Venture Capitalist Association (NVCA – the
US venture capitalist association) as well as those listed in the database of Venture Economics
Inc., a consulting firm that tracks investments and fundraising by venture capital firms. To avoid
a survivorship bias, any changes in venture capitalist names or funds managed are recorded using
BVCA, EVCA and NVCA directories since 1985, where available.
The venture-backed IPOs identified through the above process were compared to those
compiled by the UK Venture Capital Journal for 1985 – 1989 and the BVCA between July 1992
and December 2000. In cases of discrepancies, the ownership information in the prospectus is
deemed to be accurate.25 Information on the incorporation date of the company, issue date and
price, type of issue, market value, proceeds raised, name of lead underwriter and auditor as well
as business sector are taken from the London Stock Exchange Quality of Markets Quarterly
Reviews, Primary Market Fact Sheets and Yearbooks. Underwriters and auditors are classified
according to the annual ranking in Hambro Companies Guides.
Daily and monthly returns for the IPOs and stock indexes (Financial Times All Share,
Financial Times All Share ex-financials, Financial Times Small Cap and Financial Times Small
Cap ex-investment trusts) are taken from Datastream. IPO prospectuses were inspected in
24 There are two different threshold requirements to define venture-backed IPOs because in some IPO prospectuses shareholders with holdings larger than 3% are listed separately while in others only those with holdings larger than 5% are listed separately.25 The discrepancies occurred where IPOs are listed as venture-backed in the UK Venture Capital Journal or by the BVCA but no venture capitalist is listed as a shareholder in the IPO prospectus. This may be because the venture capitalists’ stake is too small to be listed in the IPO prospectus, venture capitalists have sold their stake before IPO or hold non-equity claims.
39

Companies House, Extel Financial microfiches and Thomson Financial Global Access Database
to obtain information on pre-IPO operating performance, ownership, board membership and
identities of investors. Specifically, the ‘Substantial Shareholders’ and ‘Placing/Offer
Agreement’ sections of the prospectus were used to collect venture capitalists’ pre- and post-IPO
equity holdings and sale of ordinary shares. The data on venture capitalist board participation
and board tenure period were collected from the ‘Board of Directors’ section. The latter
identifies the top executives and directors of the issuing company. Board members who represent
venture capitalists are usually designated as such.
The venture capitalists’ year of incorporation, dates and sizes of funds raised are from the
BVCA, EVCA and NVCA directories as well as venture capitalists’ websites and Venture
Economics Inc. When venture capitalists syndicate their investments with other venture capitalists,
one investor usually takes the role of lead venture capitalist. The latter is defined as the venture
capitalist with the highest equity stake prior to IPO, indicating higher effective control over the
decisions of the firm, similar to the definition used by Barry et al. (1990). If two or more venture
capitalists hold equivalent positions, the one with board representation is classified as lead. Venture
capitalist reputation is measured by an index based on the venture capitalist's age before the IPO and
number of deals involved in as lead over the 196 years of the study. Those venture capitalists with a
reputation index value greater than the average are classified as having an established reputation
(Lin and Smith, 1998).26
26 The index value is calculated as follows: Index of lead venture capitalist reputation = 0.5*(Age of lead venture capitalist – Mean age)/age + 0.5*(Number of deals as lead by lead venture capitalist – Mean number of deals as lead)/deals
40
Related Documents