Abstract: 011-0885 Executive Remuneration and Financial Performance in Brazilian Companies Elizabeth Krauter University of Sao Paulo Av. Luciano Gualberto, 908 sala G120 05508-900 Sao Paulo / SP – Brazil Telephone: 55 11 38184022 Fax: 55 11 38184023 Email: [email protected] Almir Ferreira de Sousa University of Sao Paulo Av. Luciano Gualberto, 908 sala G120 05508-900 Sao Paulo / SP – Brazil Telephone: 55 11 38184022 Fax: 55 11 38184023 Email: [email protected] POMS 20 th Annual Conference Orlando, Florida U.S.A. May 1 to May 4, 2009

Welcome message from author
This document is posted to help you gain knowledge. Please leave a comment to let me know what you think about it! Share it to your friends and learn new things together.
Transcript
Abstract: 011-0885
Executive Remuneration and Financial Performance in Brazilian Companies
Elizabeth Krauter
University of Sao Paulo
Av. Luciano Gualberto, 908 sala G120
05508-900 Sao Paulo / SP – Brazil
Telephone: 55 11 38184022
Fax: 55 11 38184023
Email: [email protected]
Almir Ferreira de Sousa
University of Sao Paulo
Av. Luciano Gualberto, 908 sala G120
05508-900 Sao Paulo / SP – Brazil
Telephone: 55 11 38184022
Fax: 55 11 38184023
Email: [email protected]
POMS 20th Annual Conference
Orlando, Florida U.S.A.
May 1 to May 4, 2009
Executive Remuneration and Financial Performance in Brazilian Companies
Abstract
The objective of this study is to investigate the existence of a relationship between executive
remuneration and financial performance in 28 Brazilian companies from the industrial sector.
These companies have been selected among those companies elected as “The Best Companies
to Work For in Brazil”. In order to operationalize the remuneration variable, we use the
monthly salary, the variable salary and three indexes – of benefits, career and professional
development – which have been created especially for this survey. To measure financial
performance, we use three accounting measures: sales growth, return on equity (ROE) and
return on sales (ROS). The results point the existence of a relationship between executive
remuneration and financial performance.
Key-words: financial performance, Brazilian companies, executive remuneration, industrial
sector.
1. Introduction
The importance of operations management has increased in the last years. Globalization of
markets, increasing competition, shorter product and service life-cycles, and new technology
have increased pressures on the operations function to improve productivity and provide high-
quality products and services. In this new scenario, operations function needs employees who
are motivated and pledged with the goals of the company. The remuneration system is an
important mechanism through which individual efforts are guided toward strategic business
objectives.
Within the last few years, many researchers have tried to understand the nature of the
relationship between executive remuneration and corporate financial performance. The
underlying hypothesis is that the remuneration influences executive’s behavior, which then,
influences the company performance (DEVERS et al., 2007).
The surveys that have studied the relationship between executive remuneration and corporate
financial performance have mostly been carried out in United States, using data on American
companies. These surveys have found little direct evidence of a positive relationship between
executive remuneration and financial performance.
The lack of studies relating executive remuneration and corporate financial performance
within the context of the Brazilian market has led us to carry out this research, with the
objective to investigate the existence of a relationship between executive remuneration and
financial performance in 28 Brazilian companies from the industrial sector.
Executive remuneration is measured in terms of the monthly salary, the variable salary and
three indexes – of benefits, career and professional development – that we have created
especially for this survey. Financial performance is measured in terms of sales growth, return
on equity and return on sales. Both the data related to remuneration and the data related to
financial performance are from year 2006. The study focuses on the remuneration received by
directors, vice-presidents and company presidents.
We hope that this study expand knowledge about the relationship between executive
remuneration and corporate financial performance, and thus provide grounds based on which
the companies may improve their management systems.
2. Literature review and hypothesis
2.1. The concept of remuneration
There are several terminologies used to express the idea of remuneration. In Brazil, there is
not on single terminology. Recently, there has been a growth in the use of the word
remuneration in a wider sense, considering other factors besides the financial package
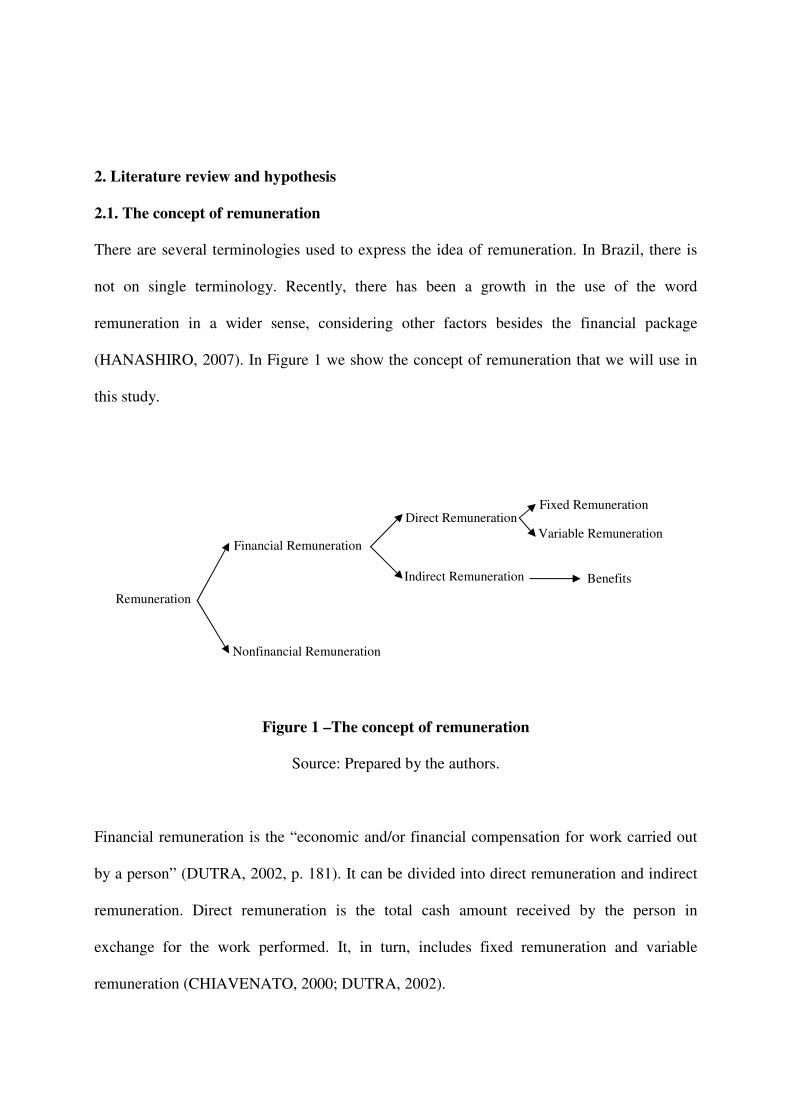
(HANASHIRO, 2007). In Figure 1 we show the concept of remuneration that we will use in
this study.
Figure 1 –The concept of remuneration
Source: Prepared by the authors.
Financial remuneration is the “economic and/or financial compensation for work carried out
by a person” (DUTRA, 2002, p. 181). It can be divided into direct remuneration and indirect
remuneration. Direct remuneration is the total cash amount received by the person in
exchange for the work performed. It, in turn, includes fixed remuneration and variable
remuneration (CHIAVENATO, 2000; DUTRA, 2002).
Financial Remuneration
Remuneration
Nonfinancial Remuneration
Direct Remuneration
Indirect Remuneration
Fixed Remuneration
Benefits
Variable Remuneration

Fixed remuneration is the cash amount previously agreed between the employee and the
company, paid on a regular basis for the work carried out. Normally, this is related to tasks
and also to the position that the person holds within the company (DUTRA, 2002). Variable
remuneration is the cash amount received by the person for having reached certain targets
beforehand between the employer and the employee.
Indirect remuneration is represented by the benefits that the company offers to its employees
in exchange for the work executed, in order to provide security and comfort (DUTRA, 2002).
Examples of benefits include: medical assistance, life insurance, retirement plan, company car
and others.
Organizations regularly incorporate nonfinancial rewards in their compensation packages for
employees (CARLON; DOWS; WEST-GRAY, 2006). Aspects regarding career and
professional development are two of the nonfinancial factors that are incorporated most often.
Regarding career, the companies offer support for career planning, executive outplacement
policy, internal recruitment program and professional promotion. In relation to professional
development, companies have used a process of ongoing learning, in order to develop, in their
employees, competences that are considered of critical importance for the business.
2.2. Financial performance
The concept of financial performance is a dominant element in empirical research. However,
there is no consensus as to which measurements should be used (CARTON; HOFER, 2006).
In order to find out which measurements were being used to measure performance of
companied, Carton and Hofer (2006) made a review of the empirical studies published from
July 1996 to June 2001 in five different American journals: Academy of Management
Journal, Strategic Management Journal, Journal of Management, Journal of Business
Venturing, and Entrepreneurship Theory & Practice. The result was that out of the 1,045
papers that were analyzed, 138 used company performance as a dependent variable.
The authors identified 88 different indicators to measure performance. Of these 138 papers,
46% used only one indicator to measure performance, 25% used two indicators and the 29%
remaining ones more than two indicators. The profitability indicators appeared in 70% of the
papers. Then came the growth indicators and in third the market-based indicators.
This review revealed that the performance concept has multiple dimensions, a view that is
shared by other authors such as Chakravarthy (1986), Venkatraman and Ramanujam (1986,
1987), and Keats (1990). Therefore performance has to be analyzed using more than one
indicator.
Venkatraman and Ramanujam (1987) showed that the financial performance construct has at
least two distinct dimensions: growth and profitability. Each of these dimensions may be
described by one or more indicators. Profitability, for example, may be measured by
indicators such as ROA, ROE and ROI. And growth may be measured by sales growth.
Carton and Hofer (2006) propose the use of more than one accounting indicator to
operationalize the financial performance construct. They point out that:
− Nonfinancial indicators do not have a definition or a standard unit of measurement;
− Market-based measures may only be used by listed companies;
− Financial indicators are the most commonly used in empirical studies.
The authors admit that the financial indicators do show some shortcomings, but highlight the
existence of two strong points:
− The researches have access to these indicators, which are made available by the
companies, through their financial statements;
− There is uniformity in the way the data is presented, as the financial statements are
prepared according to a strict set of rules, the generally accepted accounting principles
(GAAP).
We investigate the existence of a relationship between executive remuneration (monthly
salary, variable salary, benefits index, career index and professional development index) and
corporate financial performance (sales growth, ROE and ROS). Our hypothesis can be stated
as follows:
Hypothesis: There is a significant relationship between executive remuneration and corporate
financial performance.
3. Methodology
We extract the data of the independent variables from the database held by Progep (Programa
de Estudos em Gestão de Pessoas) of FIA (Fundação Instituto de Administração), responsible
for the survey that annually chooses “The 150 Best Companies to Work For in Brazil”. This
database contains information about human resource management of all the companies that

take part in the survey. We use the remuneration received by directors, vice-presidents and
company presidents in 2006.
We have extract the data of the dependent variables from the database of FIPECAFI
(Fundação Instituto de Pesquisas Contábeis, Atuariais e Financeiras) responsible for the
survey that annually chooses “The 500 Best and Larger Companies in Brazil”. We choose this
database as it brings together information about both public listed companies and privately
owned companies. The data are from year 2006.
We choose industrial companies that have information in the two databases to compose the
sample. Thus the non-probabilistic sample is composed of 28 Brazilian industrial companies.
As the sampling technique used is non-probabilistic, it shall not be possible to generalize the
results obtained to the population as a whole.
The data related to remuneration includes:
a) The executive’s average monthly salary in 2006, in Brazilian reais;
b) Average amount received by the executive during the year of 2006, in Brazilian reais,
as variable salary or bonus;
c) Executives’ access to the following benefits: medical assistance, medical office in the
company, dental assistance, subsidy of 50% or more to buy medicines, subsidy for less
than 50% to buy medicines, psychological counseling, life insurance, subsidies for
educational qualification, subsidies for professional specialization, subsidies for

language studies, support to the executives’ children education, subsidy to buy
housing, financing and loans.
d) Executives’ access to 25 mechanisms for career planning. These mechanisms are
divided into: process of planning and monitoring of professional development, support
for career planning, executive outplacement policy, internal recruitment program,
professional promotion, retirement program.
e) Executives’ access to 8 mechanisms for professional development: educational
programs that incorporate the identification of core competences, management
systems that encourage the sharing of knowledge and the exchange of experiences,
technology applied to education, company commitment to corporate citizenship,
educational programs that reinforce the culture of the organization, involvement of
leaders and managers with the learning process, systems for the assessment of the
results of the investment in education, partnership with higher education institutions.
We use this information about benefits, career and professional development to develop 3
indexes: of benefits, career and professional development. In the database each one of these
information are classified as:
No (= the company does not offer to its executives)
Part (= the company offers to part of its executives)
All (= the company offers to all its executives)
To create indexes we attribute a score from 0 to 2 as follows:
No = 0 points

Part = 1 point
All = 2 points
For the benefit index, the value 2 was given to each benefit offered by the company to all its
executives, the value 1 for each benefit offered by the company to part of its executives and 0
for each benefit that was not offered by the company to its executives. Then we sum the
points and divide by the maximum score a company could get: 26 points (that is, the company
offers all the benefits to all its executives). The percentage result corresponds to the benefit
index.
For the career index we use the same criteria. The value 2 was given to each mechanism for
career planning offered by the company to all its executives, the value 1 for each mechanism
for career planning offered by the company to part of its executives, and 0 for each
mechanism for career planning that was not offered by the company to its executives. Then
we sum the points and divide by the maximum score a company could get: 50 points (that is,
the company offers all the mechanism for career planning to all its executives). The
percentage result corresponds to the career index.
For the professional development index we use the same procedure of the previous indexes.
The value 2 was given to each mechanism for professional development offered by the
company to all its executives, the value 1 for each mechanism for professional development
offered by the company to part of its executives, and 0 for each mechanism for professional
development that was not offered by the company to its executives. Then we sum the points
and divide by the maximum score a company could get: 16 points (that is, the company offers

all the mechanism for professional development to all its executives). The percentage result
corresponds to the professional development index.
We select three financial indicators to measure corporate financial performance: sales growth,
return on equity and return on sales. The following factors were taken into consideration to
choose such indicators:
a) Most of the industrial companies are not listed in the stock market. Therefore it would
not be possible to use market-based indicators;
b) The indicators chosen are very used by researchers to measure corporate financial
performance.
We choose the size of the company as control variable and we use the natural logarithm of the
number of employees. For data tabulation, we use the statistical program SPSS, version 16.0
for Windows. To verify the existence of a relationship between variables, we use: Mann-
Whitney test, Pearson correlation test and regression analysis.
4. Results
In 2006, 28 sample companies together employed 115,233 employees and the sum of the
gross sales of these companies represents about 10% of Brazilian GDP 2006.
First, we present the descriptive statistics of the data extracted from Progep database. Table 1
shows the benefits that the companies offer to their executives. All the sample companies
offer “medical assistance” to all their executives.
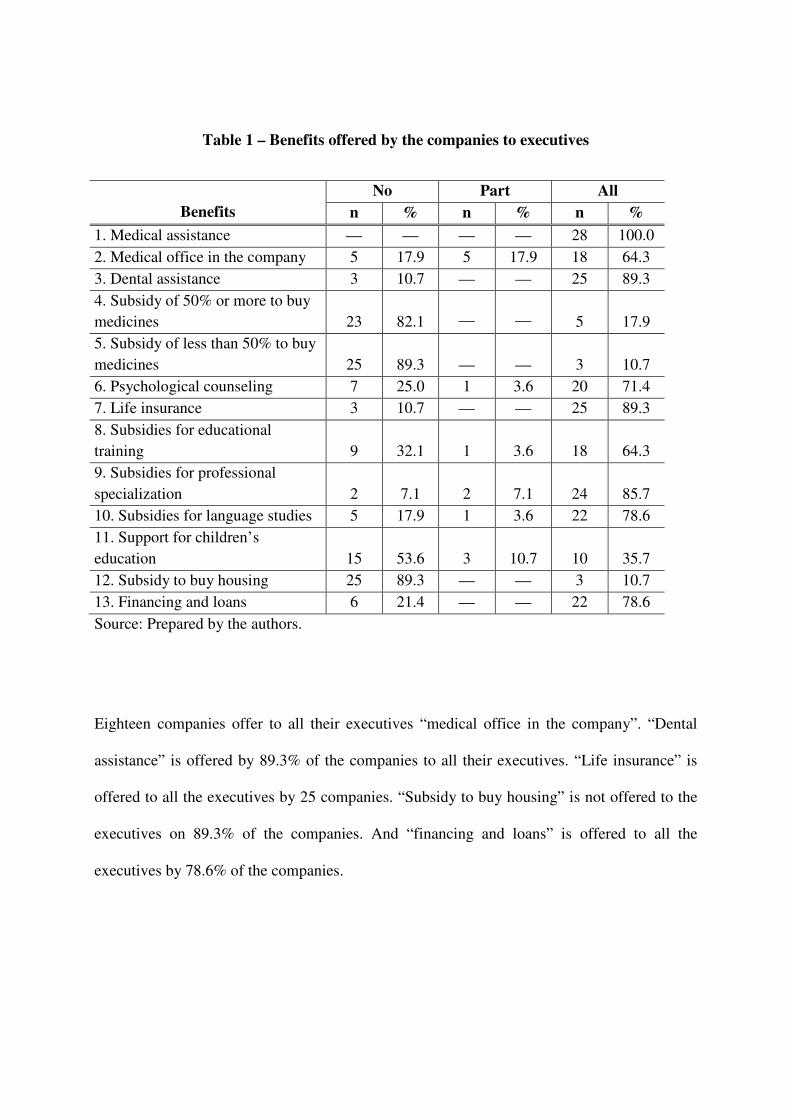
Table 1 – Benefits offered by the companies to executives
Benefits
No Part All
n % n % n %
1. Medical assistance 28 100.0
2. Medical office in the company 5 17.9 5 17.9 18 64.3
3. Dental assistance 3 10.7 25 89.3
4. Subsidy of 50% or more to buy
medicines
23
82.1
5
17.9
5. Subsidy of less than 50% to buy
medicines
25
89.3
3
10.7
6. Psychological counseling 7 25.0 1 3.6 20 71.4
7. Life insurance 3 10.7 25 89.3
8. Subsidies for educational
training
9
32.1
1
3.6
18
64.3
9. Subsidies for professional
specialization
2
7.1
2
7.1
24
85.7
10. Subsidies for language studies 5 17.9 1 3.6 22 78.6
11. Support for children’s
education
15
53.6
3
10.7
10
35.7
12. Subsidy to buy housing 25 89.3 3 10.7
13. Financing and loans 6 21.4 22 78.6
Source: Prepared by the authors.
Eighteen companies offer to all their executives “medical office in the company”. “Dental
assistance” is offered by 89.3% of the companies to all their executives. “Life insurance” is
offered to all the executives by 25 companies. “Subsidy to buy housing” is not offered to the
executives on 89.3% of the companies. And “financing and loans” is offered to all the
executives by 78.6% of the companies.
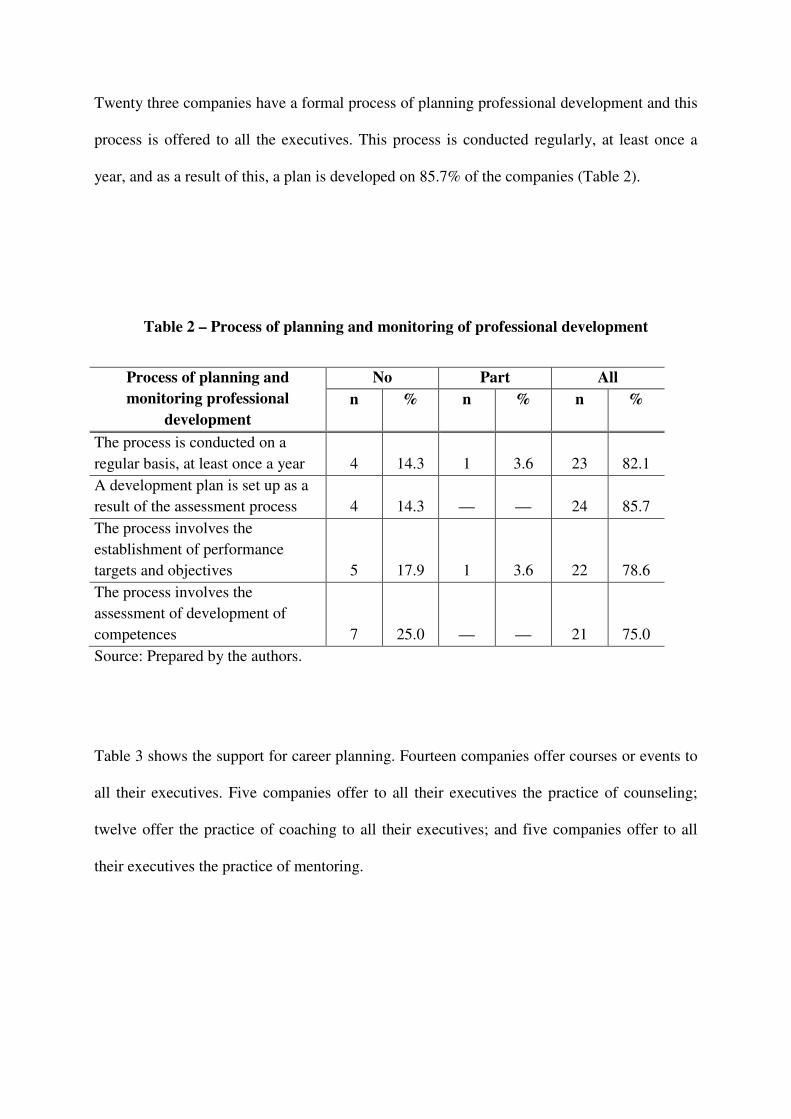
Twenty three companies have a formal process of planning professional development and this
process is offered to all the executives. This process is conducted regularly, at least once a
year, and as a result of this, a plan is developed on 85.7% of the companies (Table 2).
Table 2 – Process of planning and monitoring of professional development
Process of planning and
monitoring professional
development
No Part All
n % n % n %
The process is conducted on a
regular basis, at least once a year
4
14.3
1
3.6
23
82.1
A development plan is set up as a
result of the assessment process
4
14.3
24
85.7
The process involves the
establishment of performance
targets and objectives
5
17.9
1
3.6
22
78.6
The process involves the
assessment of development of
competences
7
25.0
21
75.0
Source: Prepared by the authors.
Table 3 shows the support for career planning. Fourteen companies offer courses or events to
all their executives. Five companies offer to all their executives the practice of counseling;
twelve offer the practice of coaching to all their executives; and five companies offer to all
their executives the practice of mentoring.
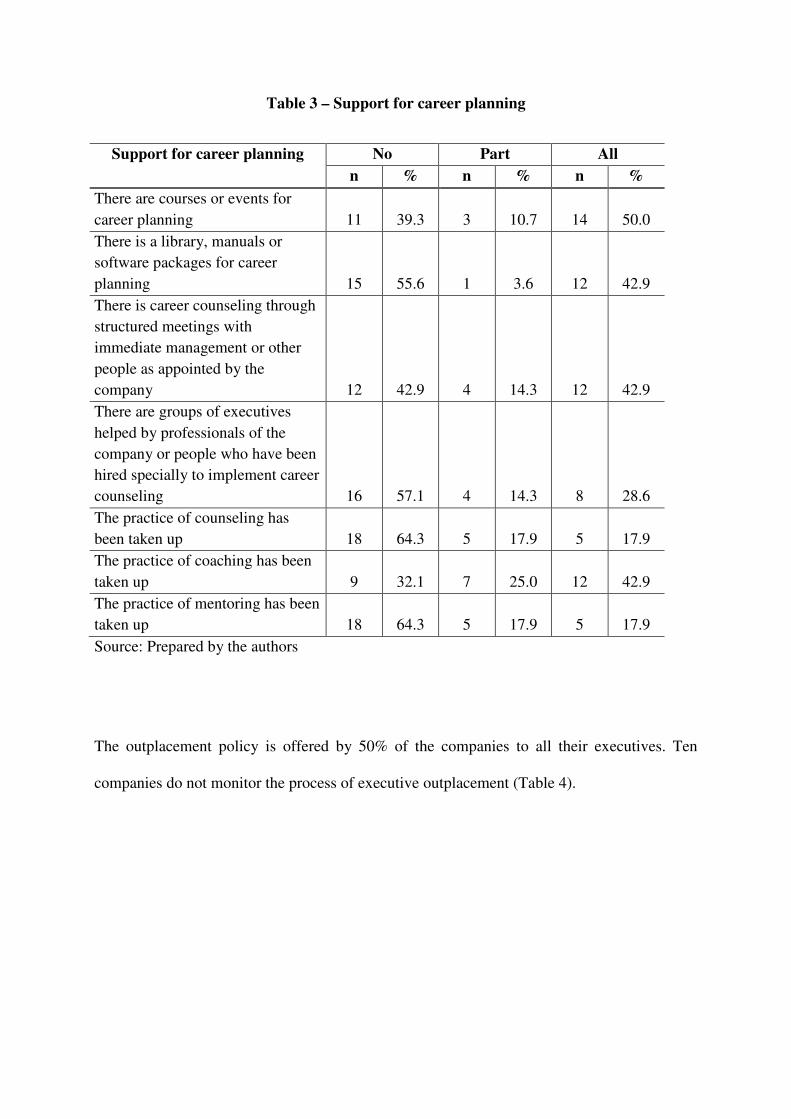
Table 3 – Support for career planning
Support for career planning
No Part All
n % n % n %
There are courses or events for
career planning
11
39.3
3
10.7
14
50.0
There is a library, manuals or
software packages for career
planning
15
55.6
1
3.6
12
42.9
There is career counseling through
structured meetings with
immediate management or other
people as appointed by the
company
12
42.9
4
14.3
12
42.9
There are groups of executives
helped by professionals of the
company or people who have been
hired specially to implement career
counseling
16
57.1
4
14.3
8
28.6
The practice of counseling has
been taken up
18
64.3
5
17.9
5
17.9
The practice of coaching has been
taken up
9
32.1
7
25.0
12
42.9
The practice of mentoring has been
taken up
18
64.3
5
17.9
5
17.9
Source: Prepared by the authors
The outplacement policy is offered by 50% of the companies to all their executives. Ten
companies do not monitor the process of executive outplacement (Table 4).
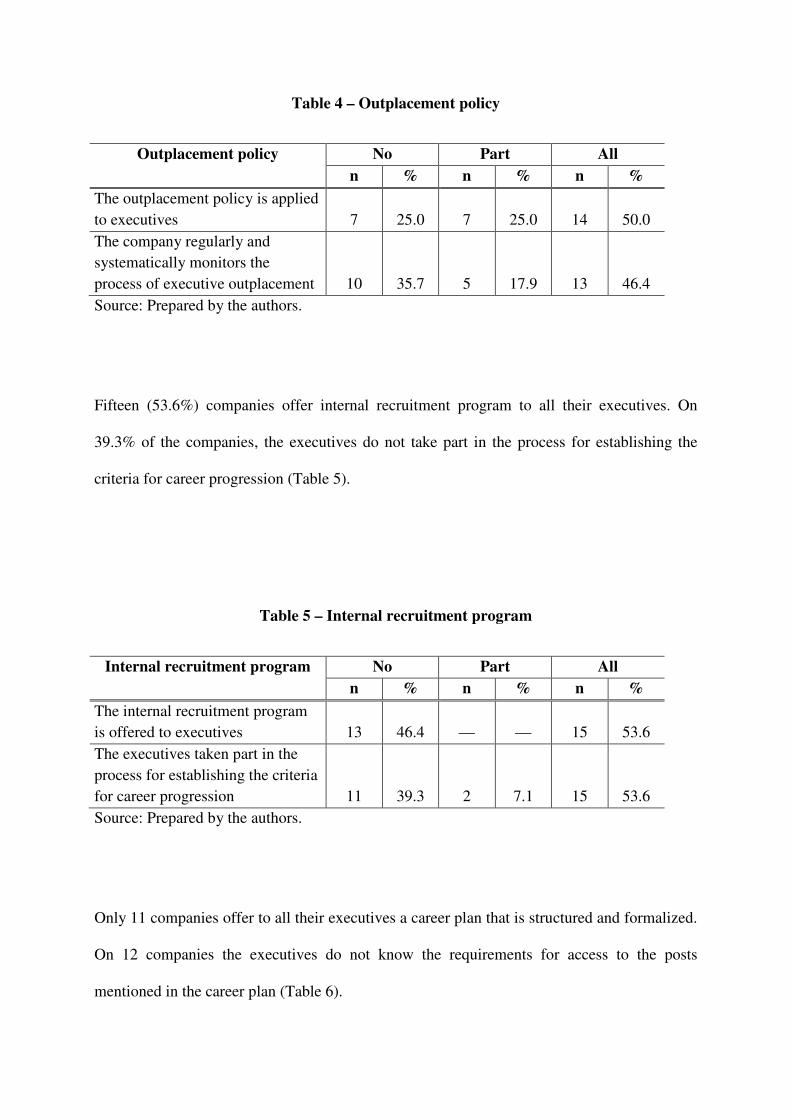
Table 4 – Outplacement policy
Outplacement policy No Part All
n % n % n %
The outplacement policy is applied
to executives
7
25.0
7
25.0
14
50.0
The company regularly and
systematically monitors the
process of executive outplacement
10
35.7
5
17.9
13
46.4
Source: Prepared by the authors.
Fifteen (53.6%) companies offer internal recruitment program to all their executives. On
39.3% of the companies, the executives do not take part in the process for establishing the
criteria for career progression (Table 5).
Table 5 – Internal recruitment program
Internal recruitment program
No Part All
n % n % n %
The internal recruitment program
is offered to executives
13
46.4
15
53.6
The executives taken part in the
process for establishing the criteria
for career progression
11
39.3
2
7.1
15
53.6
Source: Prepared by the authors.
Only 11 companies offer to all their executives a career plan that is structured and formalized.
On 12 companies the executives do not know the requirements for access to the posts
mentioned in the career plan (Table 6).
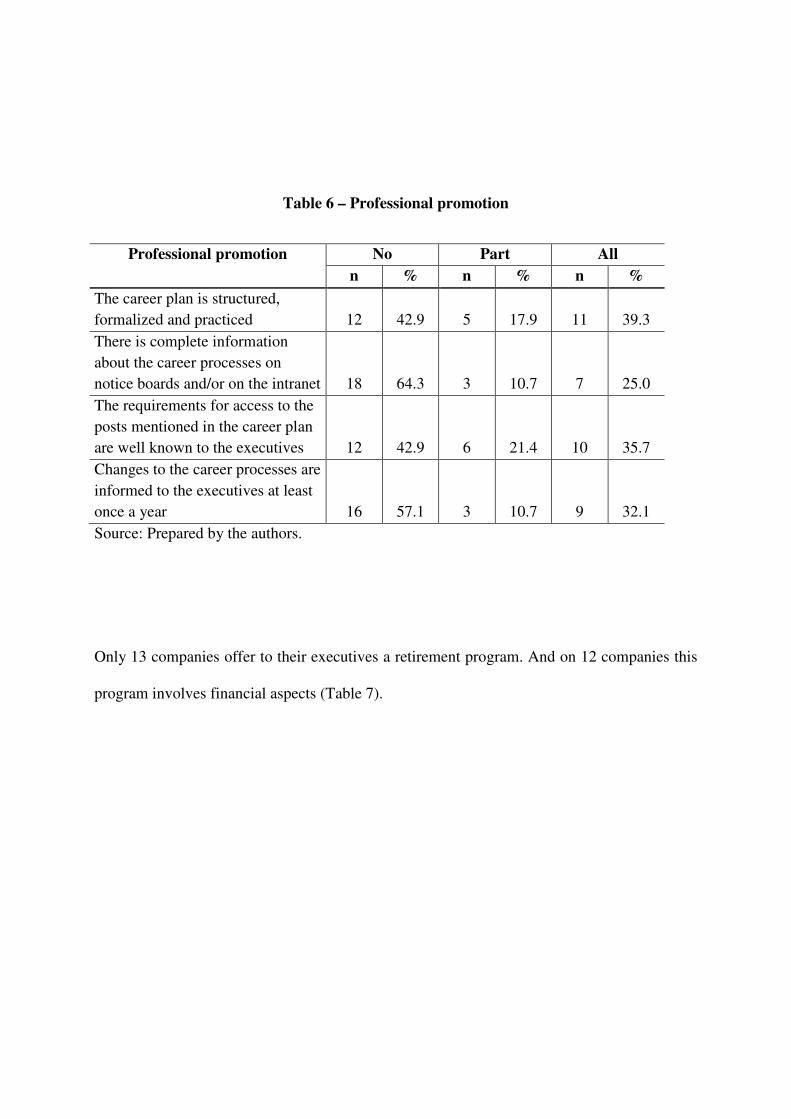
Table 6 – Professional promotion
Professional promotion No Part All
n % n % n %
The career plan is structured,
formalized and practiced
12
42.9
5
17.9
11
39.3
There is complete information
about the career processes on
notice boards and/or on the intranet
18
64.3
3
10.7
7
25.0
The requirements for access to the
posts mentioned in the career plan
are well known to the executives
12
42.9
6
21.4
10
35.7
Changes to the career processes are
informed to the executives at least
once a year
16
57.1
3
10.7
9
32.1
Source: Prepared by the authors.
Only 13 companies offer to their executives a retirement program. And on 12 companies this
program involves financial aspects (Table 7).
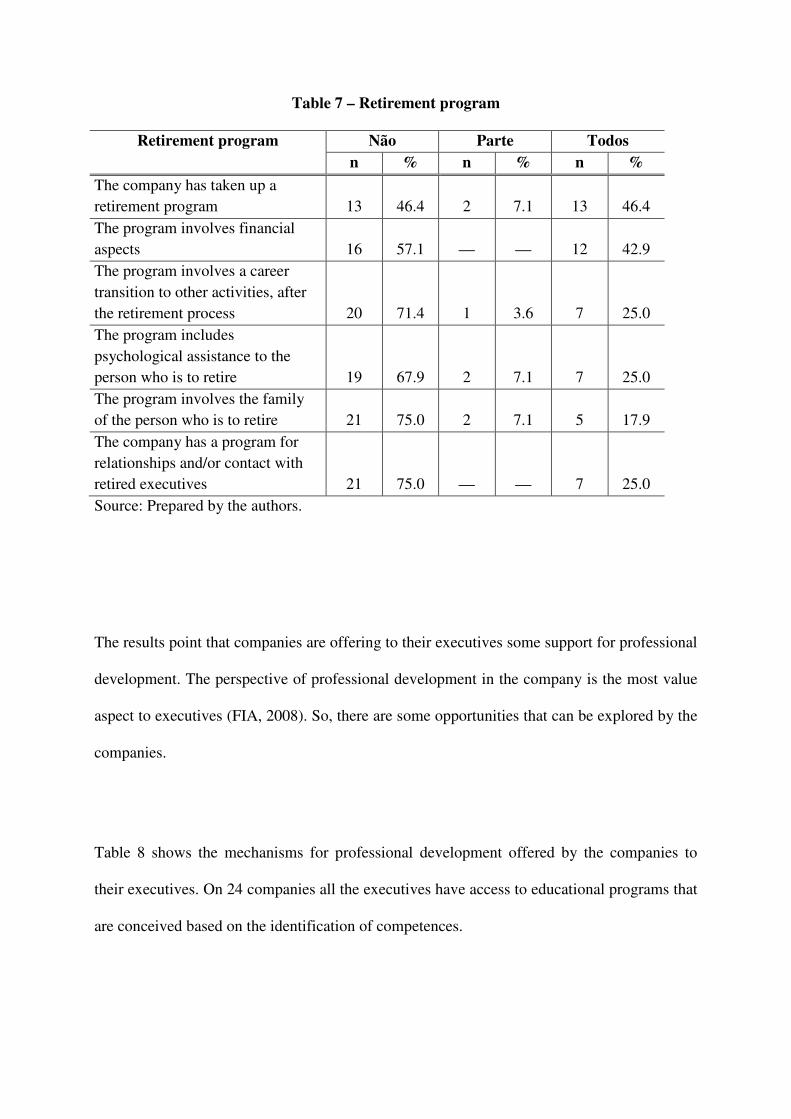
Table 7 – Retirement program
Retirement program
Não Parte Todos
n % n % n %
The company has taken up a
retirement program
13
46.4
2
7.1
13
46.4
The program involves financial
aspects
16
57.1
12
42.9
The program involves a career
transition to other activities, after
the retirement process
20
71.4
1
3.6
7
25.0
The program includes
psychological assistance to the
person who is to retire
19
67.9
2
7.1
7
25.0
The program involves the family
of the person who is to retire
21
75.0
2
7.1
5
17.9
The company has a program for
relationships and/or contact with
retired executives
21
75.0
7
25.0
Source: Prepared by the authors.
The results point that companies are offering to their executives some support for professional
development. The perspective of professional development in the company is the most value
aspect to executives (FIA, 2008). So, there are some opportunities that can be explored by the
companies.
Table 8 shows the mechanisms for professional development offered by the companies to
their executives. On 24 companies all the executives have access to educational programs that
are conceived based on the identification of competences.
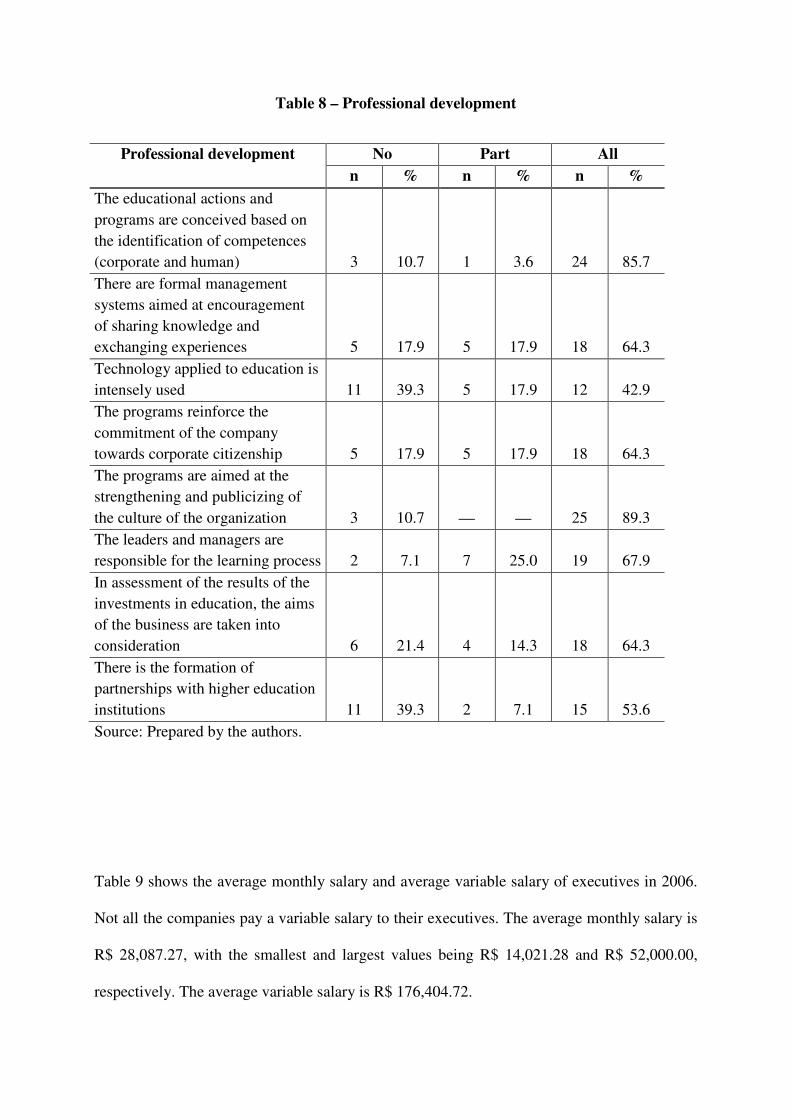
Table 8 – Professional development
Professional development
No Part All
n % n % n %
The educational actions and
programs are conceived based on
the identification of competences
(corporate and human)
3
10.7
1
3.6
24
85.7
There are formal management
systems aimed at encouragement
of sharing knowledge and
exchanging experiences
5
17.9
5
17.9
18
64.3
Technology applied to education is
intensely used
11
39.3
5
17.9
12
42.9
The programs reinforce the
commitment of the company
towards corporate citizenship
5
17.9
5
17.9
18
64.3
The programs are aimed at the
strengthening and publicizing of
the culture of the organization
3
10.7
25
89.3
The leaders and managers are
responsible for the learning process
2
7.1
7
25.0
19
67.9
In assessment of the results of the
investments in education, the aims
of the business are taken into
consideration
6
21.4
4
14.3
18
64.3
There is the formation of
partnerships with higher education
institutions
11
39.3
2
7.1
15
53.6
Source: Prepared by the authors.
Table 9 shows the average monthly salary and average variable salary of executives in 2006.
Not all the companies pay a variable salary to their executives. The average monthly salary is
R$ 28,087.27, with the smallest and largest values being R$ 14,021.28 and R$ 52,000.00,
respectively. The average variable salary is R$ 176,404.72.

Table 9 – Average salary of executives in 2006
n Mean Standard
deviation Minimum Maximum
Average monthly salary (in Brazilian reais) 28 28087.27 8390.53 14021.28 52000.00 Average variable salary (in Brazilian reais) 28 176404.72 147910.00 0.00 4471120.00
Source: Prepared by the authors
The benefits index measures executives’ access to 13 benefits and ranges from 46.15% to
92.31%. The career index measures the support to career planning offered by the companies
to their executives and ranges from 4.00% to 86.00%. The professional development index
measures the mechanisms for professional development offered by the companies to their
executives and ranges from 0.00% to 100.00%. Any companies do not offer any mechanism
for professional development while another companies offer all the mechanism. The average
sales growth is 4.03%, the average ROE is 17% and the average ROS is 6.46%. The natural
logarithm of number of employee ranges from 5.98 to 9.91 (Table 10).
Table 10 – Descriptive statistics
n Mean Standard
deviation
Minimum Maximum
Benefits index (%) 28 63.60 12.05 46.15 92.31 Career index (%) 28 48.14 19.48 4.00 86.00 Professional development index (%)
28
72.99
26.47
0.00
100.00 Sales growth (%) 28 4.03 11.40 -14.10 27.40 ROE (%) 28 17.00 24.77 -79.90 64.40 ROS (%) 28 6.46 6.98 -2.70 26.30 Size (ln number of employees)
28
7.81
1.06
5.98
9.91
Source: Prepared by the authors
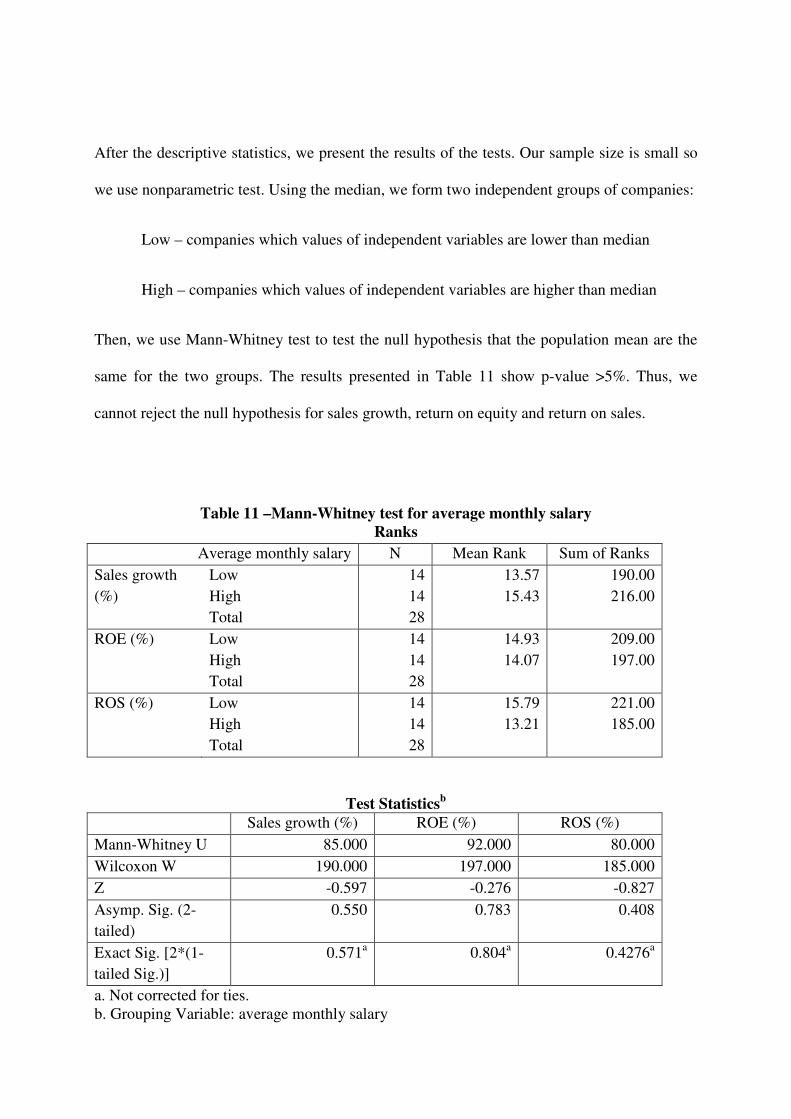
After the descriptive statistics, we present the results of the tests. Our sample size is small so
we use nonparametric test. Using the median, we form two independent groups of companies:
Low – companies which values of independent variables are lower than median
High – companies which values of independent variables are higher than median
Then, we use Mann-Whitney test to test the null hypothesis that the population mean are the
same for the two groups. The results presented in Table 11 show p-value >5%. Thus, we
cannot reject the null hypothesis for sales growth, return on equity and return on sales.
Table 11 –Mann-Whitney test for average monthly salary
Ranks
Average monthly salary N Mean Rank Sum of Ranks
Sales growth
(%)
Low
High
Total
14
14
28
13.57
15.43
190.00
216.00
ROE (%) Low
High
Total
14
14
28
14.93
14.07
209.00
197.00
ROS (%) Low
High
Total
14
14
28
15.79
13.21
221.00
185.00
Test Statisticsb
Sales growth (%) ROE (%) ROS (%)
Mann-Whitney U 85.000 92.000 80.000
Wilcoxon W 190.000 197.000 185.000
Z -0.597 -0.276 -0.827
Asymp. Sig. (2-
tailed)
0.550 0.783 0.408
Exact Sig. [2*(1-
tailed Sig.)]
0.571a 0.804a 0.4276a
a. Not corrected for ties. b. Grouping Variable: average monthly salary
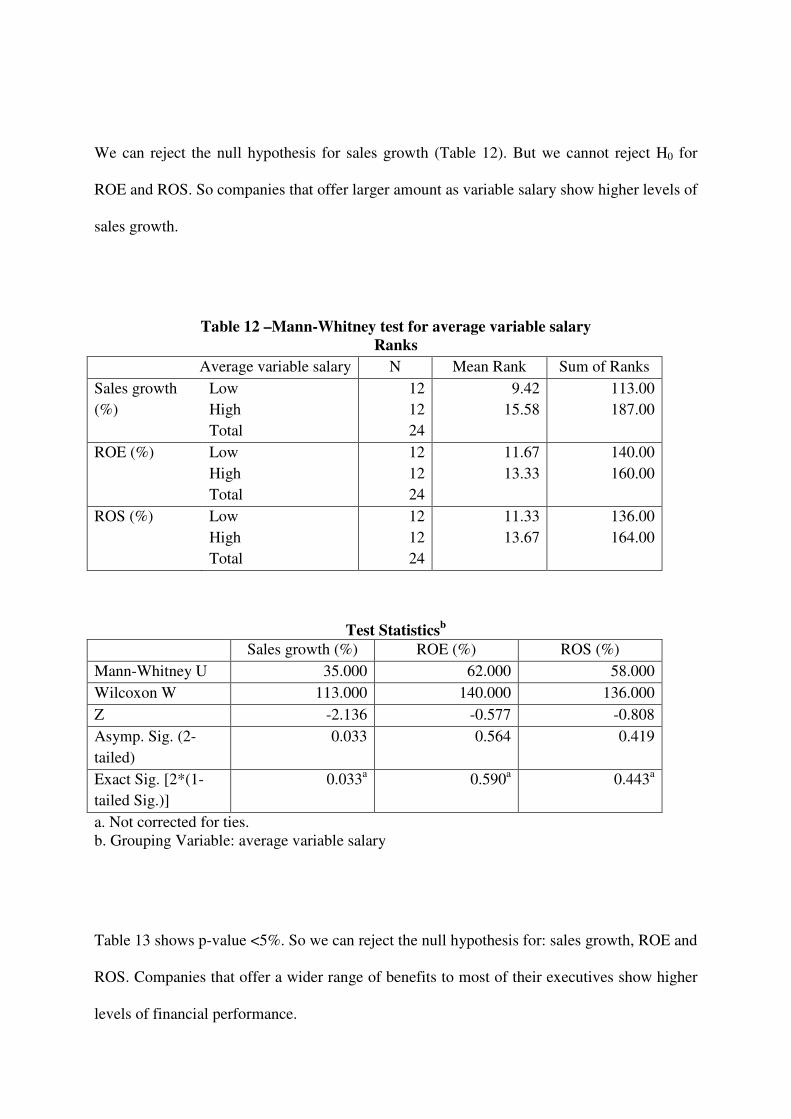
We can reject the null hypothesis for sales growth (Table 12). But we cannot reject H0 for
ROE and ROS. So companies that offer larger amount as variable salary show higher levels of
sales growth.
Table 12 –Mann-Whitney test for average variable salary
Ranks
Average variable salary N Mean Rank Sum of Ranks
Sales growth
(%)
Low
High
Total
12
12
24
9.42
15.58
113.00
187.00
ROE (%) Low
High
Total
12
12
24
11.67
13.33
140.00
160.00
ROS (%) Low
High
Total
12
12
24
11.33
13.67
136.00
164.00
Test Statisticsb
Sales growth (%) ROE (%) ROS (%)
Mann-Whitney U 35.000 62.000 58.000
Wilcoxon W 113.000 140.000 136.000
Z -2.136 -0.577 -0.808
Asymp. Sig. (2-
tailed)
0.033 0.564 0.419
Exact Sig. [2*(1-
tailed Sig.)]
0.033a 0.590a 0.443a
a. Not corrected for ties. b. Grouping Variable: average variable salary
Table 13 shows p-value <5%. So we can reject the null hypothesis for: sales growth, ROE and
ROS. Companies that offer a wider range of benefits to most of their executives show higher
levels of financial performance.
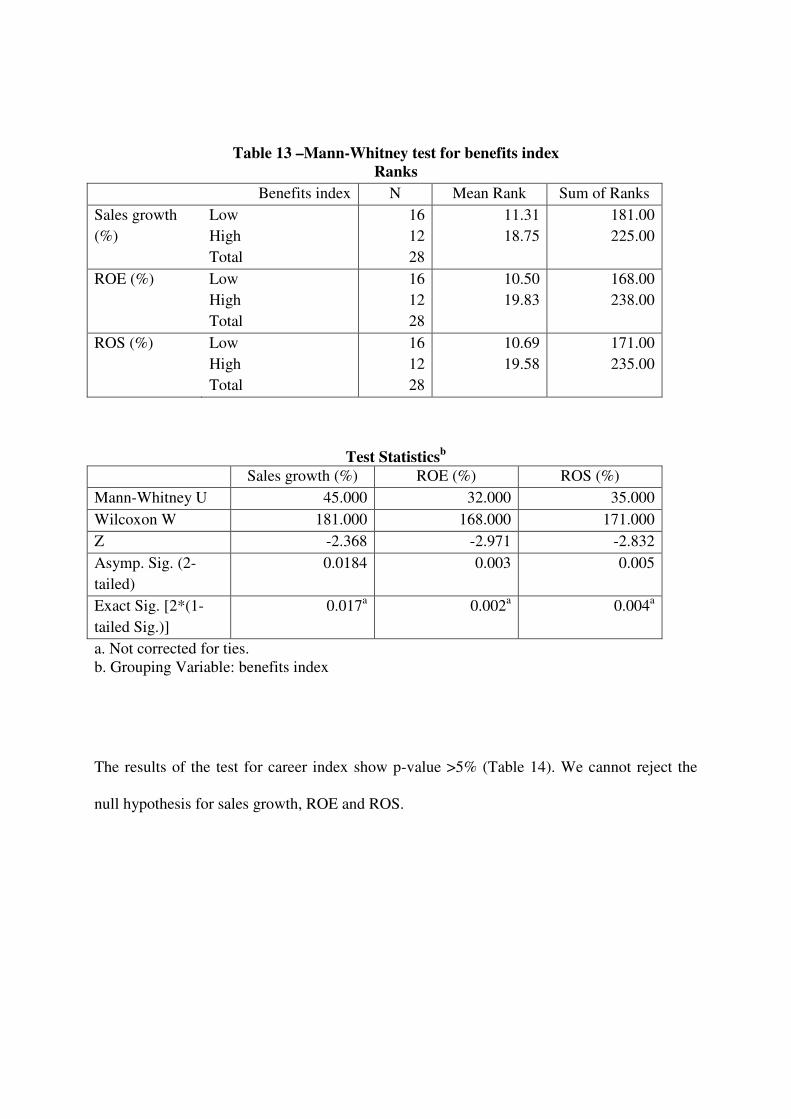
Table 13 –Mann-Whitney test for benefits index
Ranks
Benefits index N Mean Rank Sum of Ranks
Sales growth
(%)
Low
High
Total
16
12
28
11.31
18.75
181.00
225.00
ROE (%) Low
High
Total
16
12
28
10.50
19.83
168.00
238.00
ROS (%) Low
High
Total
16
12
28
10.69
19.58
171.00
235.00
Test Statisticsb
Sales growth (%) ROE (%) ROS (%)
Mann-Whitney U 45.000 32.000 35.000
Wilcoxon W 181.000 168.000 171.000
Z -2.368 -2.971 -2.832
Asymp. Sig. (2-
tailed)
0.0184 0.003 0.005
Exact Sig. [2*(1-
tailed Sig.)]
0.017a 0.002a 0.004a
a. Not corrected for ties. b. Grouping Variable: benefits index
The results of the test for career index show p-value >5% (Table 14). We cannot reject the
null hypothesis for sales growth, ROE and ROS.
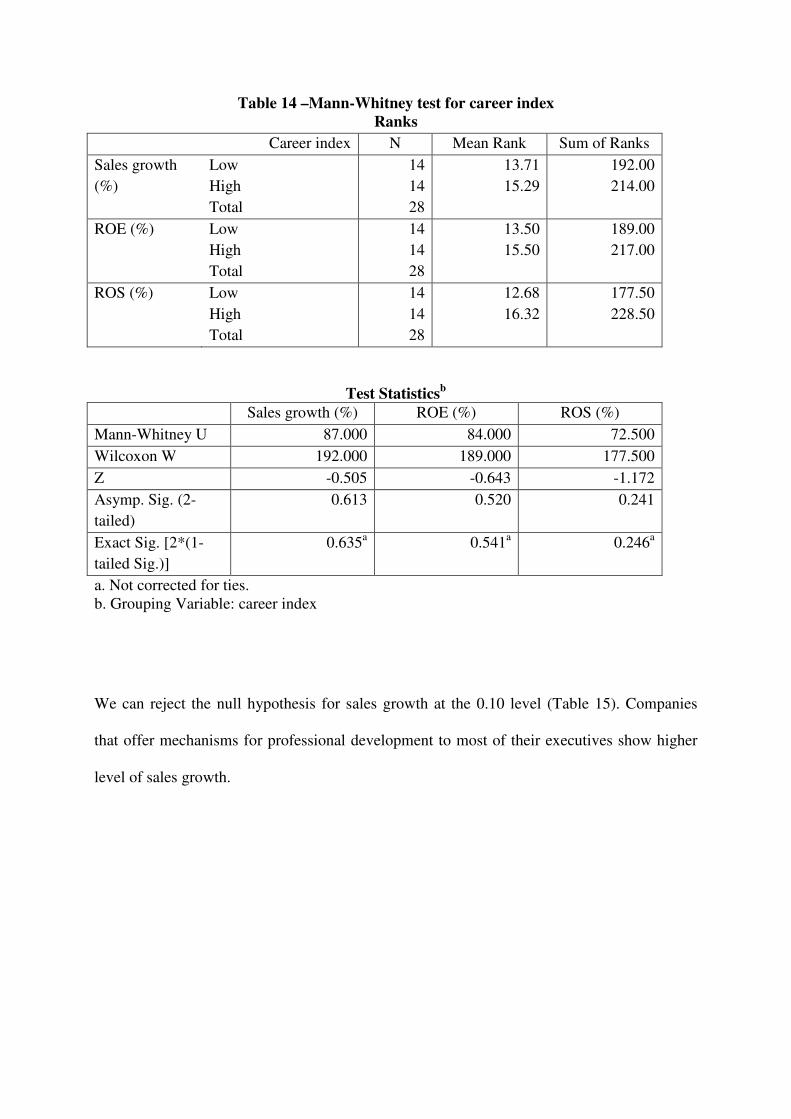
Table 14 –Mann-Whitney test for career index
Ranks
Career index N Mean Rank Sum of Ranks
Sales growth
(%)
Low
High
Total
14
14
28
13.71
15.29
192.00
214.00
ROE (%) Low
High
Total
14
14
28
13.50
15.50
189.00
217.00
ROS (%) Low
High
Total
14
14
28
12.68
16.32
177.50
228.50
Test Statisticsb
Sales growth (%) ROE (%) ROS (%)
Mann-Whitney U 87.000 84.000 72.500
Wilcoxon W 192.000 189.000 177.500
Z -0.505 -0.643 -1.172
Asymp. Sig. (2-
tailed)
0.613 0.520 0.241
Exact Sig. [2*(1-
tailed Sig.)]
0.635a 0.541a 0.246a
a. Not corrected for ties. b. Grouping Variable: career index
We can reject the null hypothesis for sales growth at the 0.10 level (Table 15). Companies
that offer mechanisms for professional development to most of their executives show higher
level of sales growth.
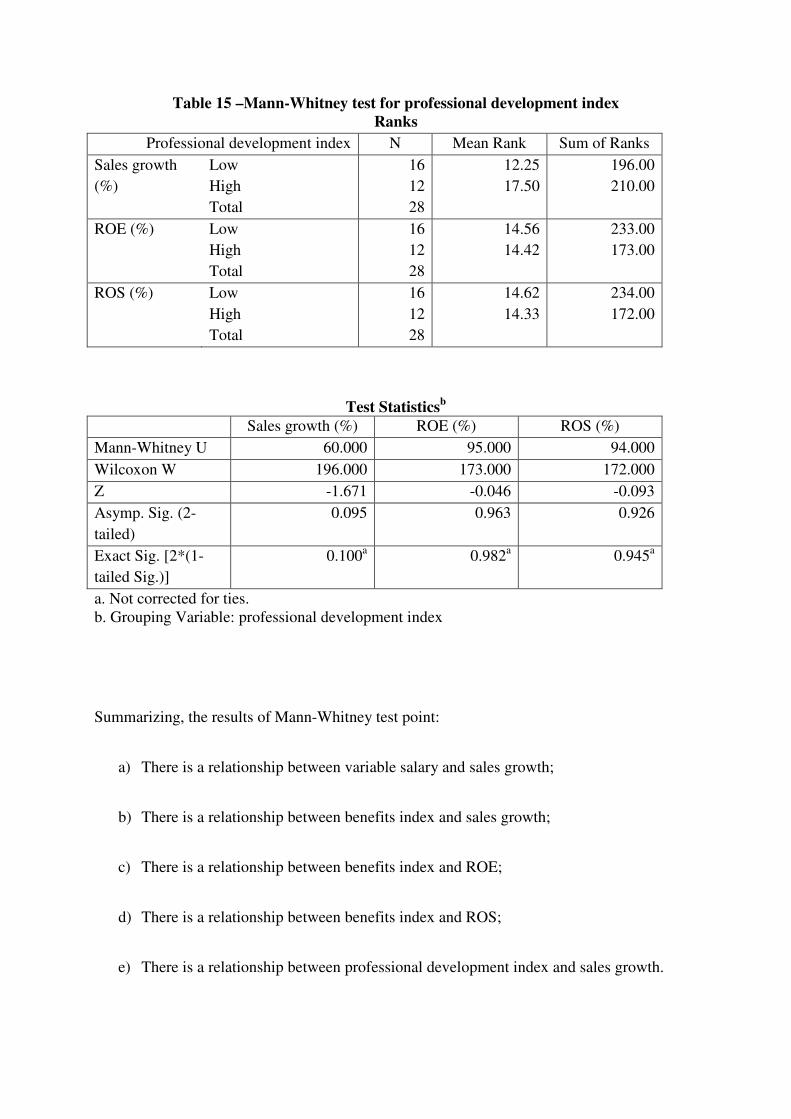
Table 15 –Mann-Whitney test for professional development index
Ranks
Professional development index N Mean Rank Sum of Ranks
Sales growth
(%)
Low
High
Total
16
12
28
12.25
17.50
196.00
210.00
ROE (%) Low
High
Total
16
12
28
14.56
14.42
233.00
173.00
ROS (%) Low
High
Total
16
12
28
14.62
14.33
234.00
172.00
Test Statisticsb
Sales growth (%) ROE (%) ROS (%)
Mann-Whitney U 60.000 95.000 94.000
Wilcoxon W 196.000 173.000 172.000
Z -1.671 -0.046 -0.093
Asymp. Sig. (2-
tailed)
0.095 0.963 0.926
Exact Sig. [2*(1-
tailed Sig.)]
0.100a 0.982a 0.945a
a. Not corrected for ties. b. Grouping Variable: professional development index
Summarizing, the results of Mann-Whitney test point:
a) There is a relationship between variable salary and sales growth;
b) There is a relationship between benefits index and sales growth;
c) There is a relationship between benefits index and ROE;
d) There is a relationship between benefits index and ROS;
e) There is a relationship between professional development index and sales growth.
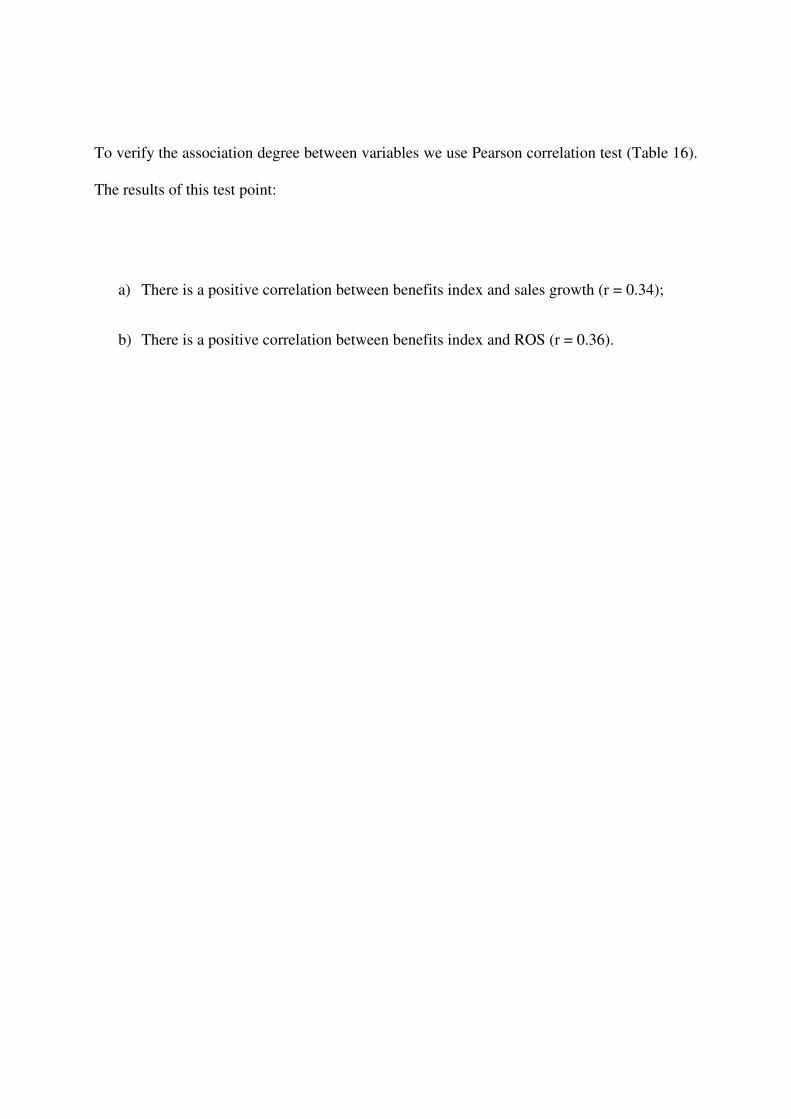
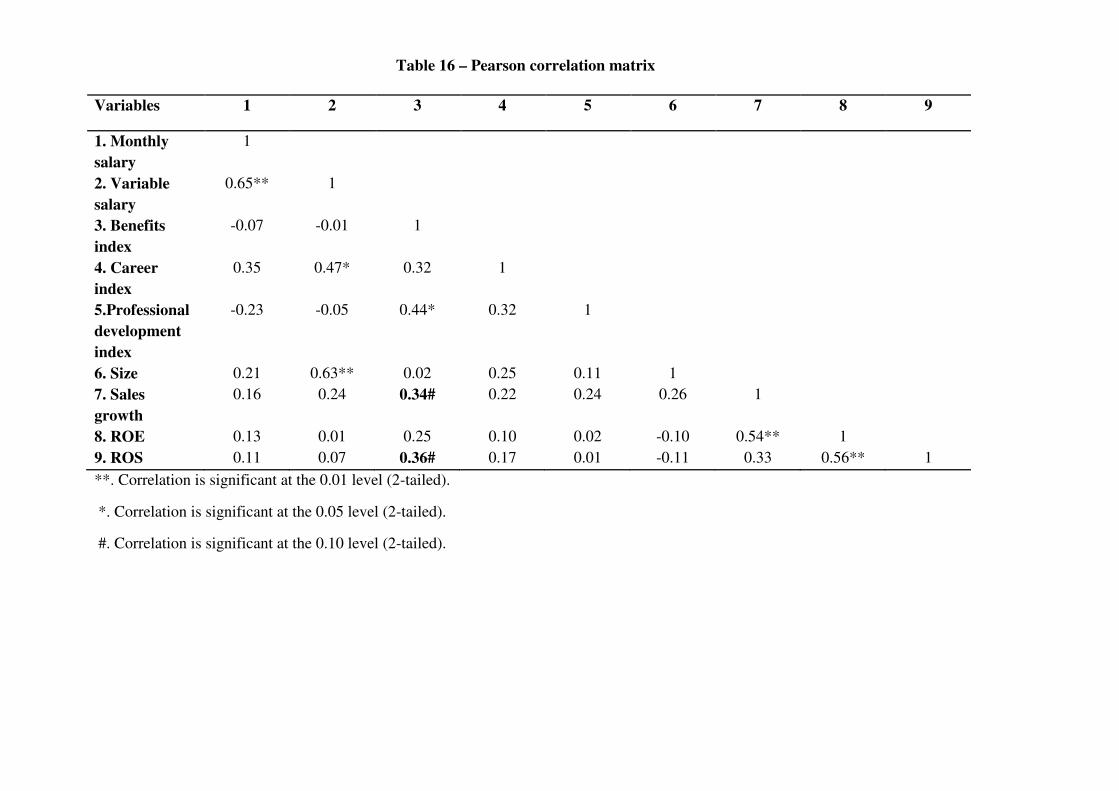
To verify the association degree between variables we use Pearson correlation test (Table 16).
The results of this test point:
a) There is a positive correlation between benefits index and sales growth (r = 0.34);
b) There is a positive correlation between benefits index and ROS (r = 0.36).
Variables 1 2 3 4 5 6 7 8 9
1. Monthly
salary
1
2. Variable
salary
0.65** 1
3. Benefits
index
-0.07 -0.01 1
4. Career
index
0.35 0.47* 0.32 1
5.Professional
development
index
-0.23 -0.05 0.44* 0.32 1
6. Size 0.21 0.63** 0.02 0.25 0.11 1
7. Sales
growth
0.16 0.24 0.34# 0.22 0.24 0.26 1
8. ROE 0.13 0.01 0.25 0.10 0.02 -0.10 0.54** 1
9. ROS 0.11 0.07 0.36# 0.17 0.01 -0.11 0.33 0.56** 1
**. Correlation is significant at the 0.01 level (2-tailed).
*. Correlation is significant at the 0.05 level (2-tailed).
#. Correlation is significant at the 0.10 level (2-tailed).
Table 16 – Pearson correlation matrix
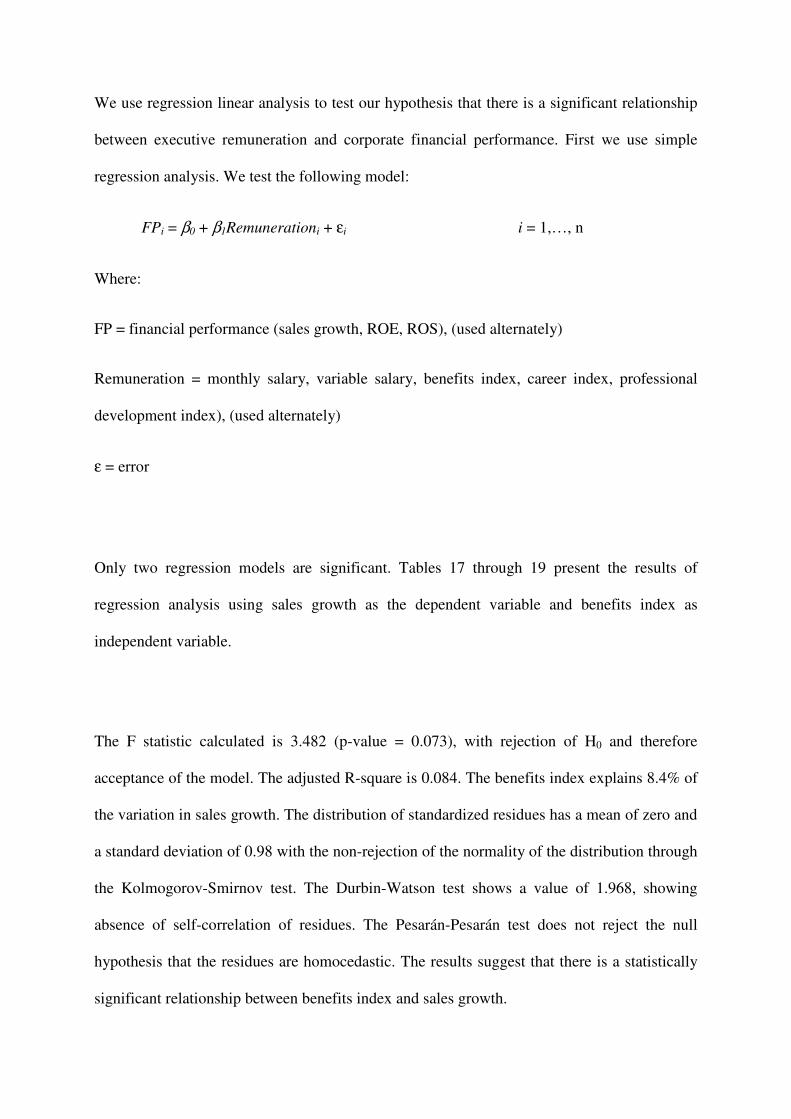
We use regression linear analysis to test our hypothesis that there is a significant relationship
between executive remuneration and corporate financial performance. First we use simple
regression analysis. We test the following model:
FPi = β0 + β1Remunerationi + εi i = 1,…, n
Where:
FP = financial performance (sales growth, ROE, ROS), (used alternately)
Remuneration = monthly salary, variable salary, benefits index, career index, professional
development index), (used alternately)
ε = error
Only two regression models are significant. Tables 17 through 19 present the results of
regression analysis using sales growth as the dependent variable and benefits index as
independent variable.
The F statistic calculated is 3.482 (p-value = 0.073), with rejection of H0 and therefore
acceptance of the model. The adjusted R-square is 0.084. The benefits index explains 8.4% of
the variation in sales growth. The distribution of standardized residues has a mean of zero and
a standard deviation of 0.98 with the non-rejection of the normality of the distribution through
the Kolmogorov-Smirnov test. The Durbin-Watson test shows a value of 1.968, showing
absence of self-correlation of residues. The Pesarán-Pesarán test does not reject the null
hypothesis that the residues are homocedastic. The results suggest that there is a statistically
significant relationship between benefits index and sales growth.
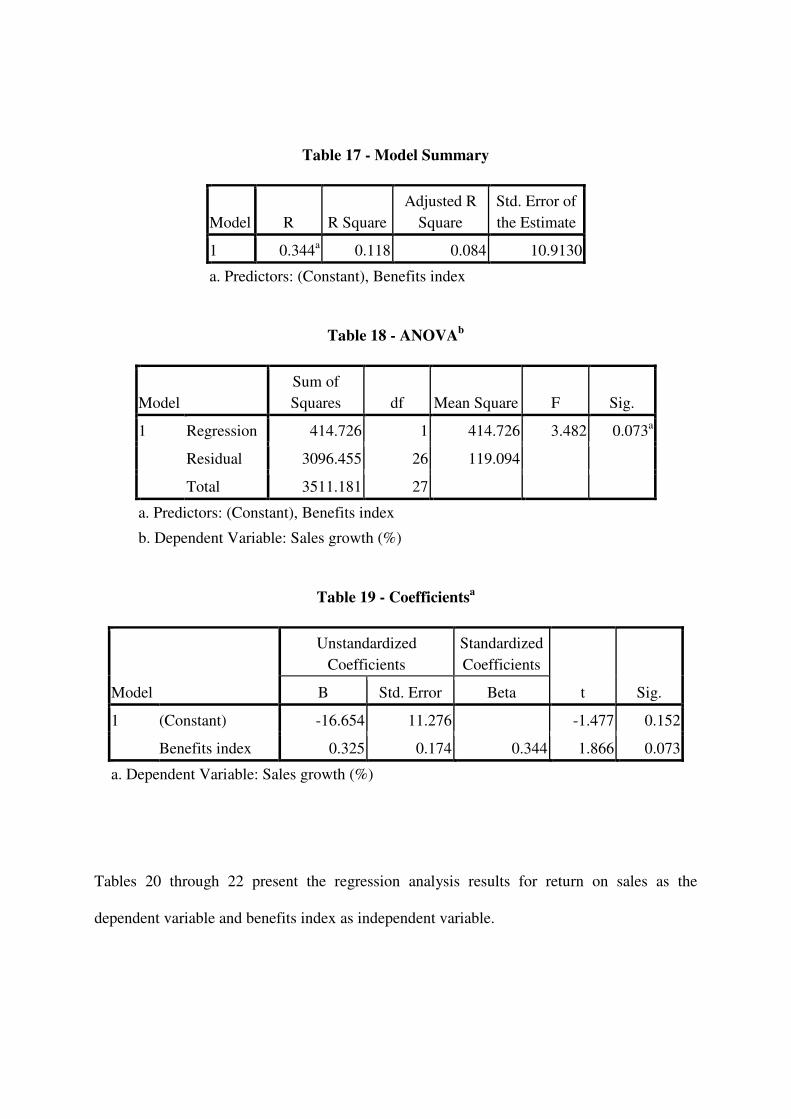
Table 17 - Model Summary
Model R R Square
Adjusted R
Square
Std. Error of
the Estimate
1 0.344a 0.118 0.084 10.9130
a. Predictors: (Constant), Benefits index
Table 18 - ANOVAb
Model
Sum of
Squares df Mean Square F Sig.
1 Regression 414.726 1 414.726 3.482 0.073a
Residual 3096.455 26 119.094
Total 3511.181 27
a. Predictors: (Constant), Benefits index
b. Dependent Variable: Sales growth (%)
Table 19 - Coefficientsa
Model
Unstandardized
Coefficients
Standardized
Coefficients
t Sig. B Std. Error Beta
1 (Constant) -16.654 11.276 -1.477 0.152
Benefits index 0.325 0.174 0.344 1.866 0.073
a. Dependent Variable: Sales growth (%)
Tables 20 through 22 present the regression analysis results for return on sales as the
dependent variable and benefits index as independent variable.
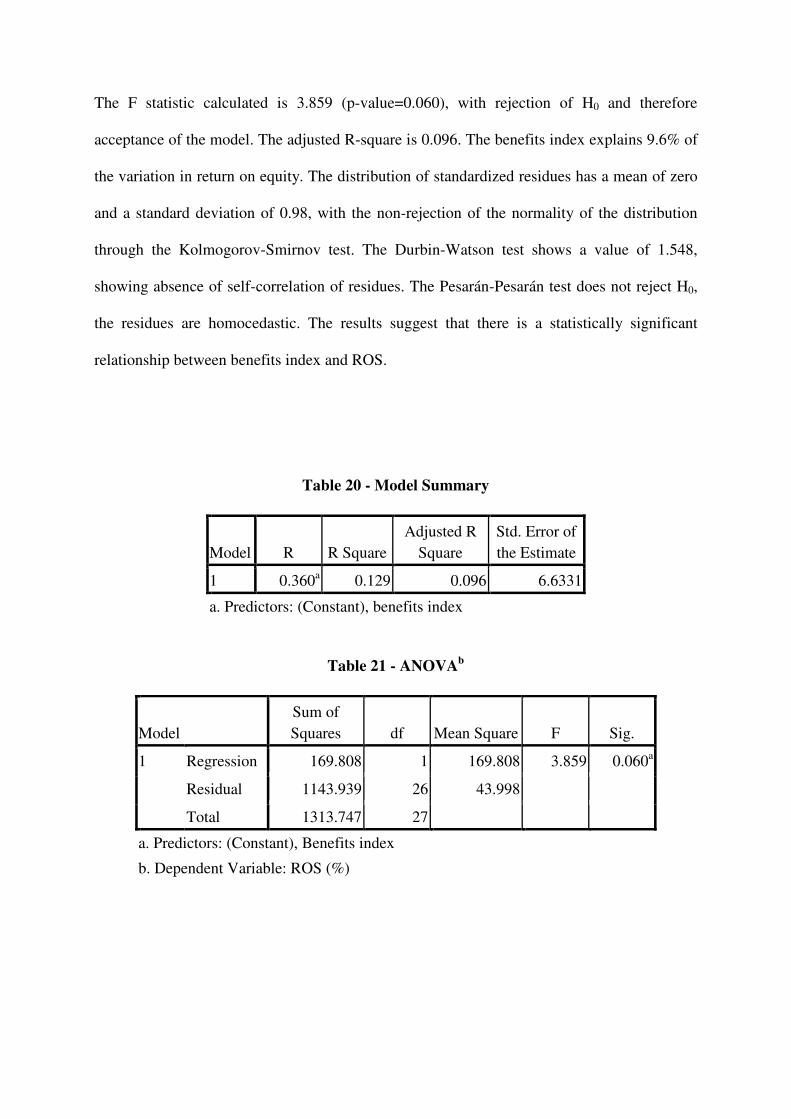
The F statistic calculated is 3.859 (p-value=0.060), with rejection of H0 and therefore
acceptance of the model. The adjusted R-square is 0.096. The benefits index explains 9.6% of
the variation in return on equity. The distribution of standardized residues has a mean of zero
and a standard deviation of 0.98, with the non-rejection of the normality of the distribution
through the Kolmogorov-Smirnov test. The Durbin-Watson test shows a value of 1.548,
showing absence of self-correlation of residues. The Pesarán-Pesarán test does not reject H0,
the residues are homocedastic. The results suggest that there is a statistically significant
relationship between benefits index and ROS.
Table 20 - Model Summary
Model R R Square
Adjusted R
Square
Std. Error of
the Estimate
1 0.360a 0.129 0.096 6.6331
a. Predictors: (Constant), benefits index
Table 21 - ANOVAb
Model
Sum of
Squares df Mean Square F Sig.
1 Regression 169.808 1 169.808 3.859 0.060a
Residual 1143.939 26 43.998
Total 1313.747 27
a. Predictors: (Constant), Benefits index
b. Dependent Variable: ROS (%)
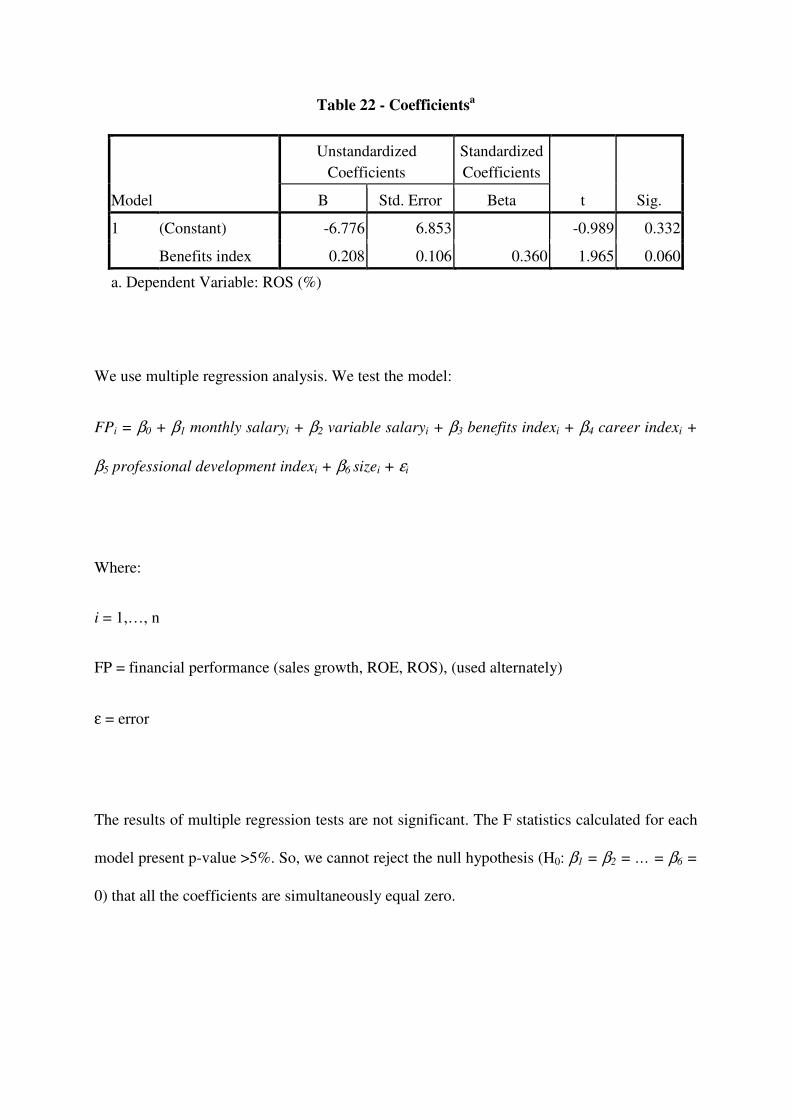
Table 22 - Coefficientsa
Model
Unstandardized
Coefficients
Standardized
Coefficients
t Sig. B Std. Error Beta
1 (Constant) -6.776 6.853 -0.989 0.332
Benefits index 0.208 0.106 0.360 1.965 0.060
a. Dependent Variable: ROS (%)
We use multiple regression analysis. We test the model:
FPi = β0 + β1 monthly salaryi + β2 variable salaryi + β3 benefits indexi + β4 career indexi +
β5 professional development indexi + β6 sizei + εi
Where:
i = 1,…, n
FP = financial performance (sales growth, ROE, ROS), (used alternately)
ε = error
The results of multiple regression tests are not significant. The F statistics calculated for each
model present p-value >5%. So, we cannot reject the null hypothesis (H0: β1 = β2 = … = β6 =
0) that all the coefficients are simultaneously equal zero.

5. Conclusion
Operations function needs motivated employees to improve productivity and provide high-
quality products and services. The remuneration system is an important mechanism that it can
help to operations function to reach these goals.
The objective of this study is to investigate the existence of a relationship between executive
remuneration and financial performance in 28 Brazilian companies from the industrial sector.
This survey focuses on the remuneration received by directors, vice-presidents and company
presidents.
To operationalize the remuneration we use the monthly salary, the variable salary and three
indexes – of benefits, career and professional development – which have been created
especially for this survey. To measure financial performance, we use three accounting
indicators: sales growth, return on equity and return on sales.
The results of Mann-Whitney test suggest that there is a relationship between: variable salary
and sales growth, benefits index and sales growth, benefits index and return on equity,
benefits index and return on sales, and professional development index and sales growth.
Pearson correlation test point a positive correlation between benefits index and sales growth,
and between benefits index and return on equity. The results of simple regression analyses
show a statistically significant relationship between benefits index and sales growth, and
between benefits index and return on sales.
Although there is strong support for the hypothesis that there is a relationship between
executive remuneration and corporate financial performance, the results of multiple regression
analysis are not significant. Thus, new researches need to be developed.
This survey has some limitations. The companies selected for the sample are benchmarks in
human resources management. This means that the sample may not be a true representation of
industrial companies in general and, the results of this survey may not be generalized to the
population as a whole.
The independent variables may be operationalized in ways other than those used in this
research study, which calculated three indexes and used them as a proxy, for remuneration of
executives.
Most of the companies in the sample have closed capital. The fact that in Brazil it is not
mandatory for these companies to disclose their financial statements makes it harder to obtain
financial data. In addition, the problem of handling accounting results, like those that
happened in the recent past, show that the financial indicators may not present a true picture
of the companies’ realities. Indeed, the manipulation of figures may lead to distortion in the
results of research.
In spite of these limitations, the results found are indeed relevant for a discussion about the
relationship between executive remuneration and corporate financial performance.
References
Carlon, D. M., Downs, A. A. & West-Gray, S. (2006). Statistics as fetishes: The case of
financial performance and executive compensation. Organizational Research
Methods, 9, 475-490.
Carton, R. B. & Hofer, C. W. (2006). Measuring organizational performance: Metrics
for entrepreneurship and strategic management research. Northampton: Edward
Elgar.
Chakravarthy, B. S. (1986). Measuring strategic performance. Strategic Management
Journal, 7, 437-458.
Chiavenato, I. (2000). Recursos Humanos. São Paulo: Atlas.
Devers, C. E., Cannella Jr, A. A., Reilly, G. P. & Yoder, M. E. (2007). Executive
compensation: A multidisciplinary review of recent developments. Journal of
Management, 33, 1016-1072.
Dutra, J. S. (2002). Gestão de pessoas. São Paulo: Atlas.
FIA. (2008). Laudo técnico – pesquisa VOCÊ S/A – EXAME 2007. Available in:
www.fia.com.br/progep. Accessed in 02/04/2008.
Hanashiro, D. M. (Org.). (2007). Gestão do fator humano: Uma visão baseada em
stakeholders. São Paulo: Saraiva.
Keats, B. W. (1990). Diversification and business economic performance revisited: Issues
of measurement and causality. Journal of Management, 16, 61-72.
Venkatraman, N. & Ramanujam, V. (1986). Measurement of business performance in
strategy research: a comparison of approaches. Academy of Management Review, 11,
801-814.

Venkatraman, N. & Ramanujam, V. (1987). Measurement of business economic
performance: An examination of method convergence. Journal of Management, 13,
109-122.
Related Documents