Atmos. Chem. Phys., 10, 1155–1169, 2010 www.atmos-chem-phys.net/10/1155/2010/ © Author(s) 2010. This work is distributed under the Creative Commons Attribution 3.0 License. Atmospheric Chemistry and Physics Absorption Angstrom Exponent in AERONET and related data as an indicator of aerosol composition P. B. Russell 1 , R. W. Bergstrom 2 , Y. Shinozuka 3 , A. D. Clarke 4 , P. F. DeCarlo 5,6,* , J. L. Jimenez 5,7 , J. M.Livingston 8 , J. Redemann 2 , O. Dubovik 9 , and A. Strawa 1 1 NASA Ames Research Center, MS 245-5, Moffett Field, CA 94035-1000, USA 2 Bay Area Environmental Research Institute, 560 3rd Street West, Sonoma, CA 95476, USA 3 Oak Ridge Associated Universities, NASA Ames Research Center, MS 245-5, Moffett Field, CA 94035-1000, USA 4 School of Ocean and Earth Science and Technology, University of Hawaii, Honolulu, HI, USA 5 Cooperative Institute for Research in the Environmental Sciences, University of Colorado, Boulder, Colorado, USA 6 Dept. of Atmospheric and Oceanic Sciences University of Colorado, Boulder, Colorado, USA 7 Dept. of Chemistry and Biochemistry, University of Colorado, Boulder, Colorado, USA 8 SRI International, 333 Ravenswood Avenue, Menlo Park, CA 94025, USA 9 Laboratoire d’Optique Atmospherique, CNRS Universite de Lille, Bat 5, 59655 Villeneuve d’Ascq CEDEX, France * now at: Laboratory of Atmospheric Chemistry, Paul Scherrer Institut, Villigen, Switzerland Received: 4 August 2009 – Published in Atmos. Chem. Phys. Discuss.: 16 October 2009 Revised: 8 January 2010 – Accepted: 25 January 2010 – Published: 3 February 2010 Abstract. Recent results from diverse air, ground, and lab- oratory studies using both radiometric and in situ techniques show that the fractions of black carbon, organic matter, and mineral dust in atmospheric aerosols determine the wave- length dependence of absorption (often expressed as Absorp- tion Angstrom Exponent, or AAE). Taken together, these re- sults hold promise of improving information on aerosol com- position from remote measurements. The main purpose of this paper is to show that AAE values for an Aerosol Robotic Network (AERONET) set of retrievals from Sun-sky mea- surements describing full aerosol vertical columns are also strongly correlated with aerosol composition or type. In par- ticular, we find AAE values near 1 (the theoretical value for black carbon) for AERONET-measured aerosol columns dominated by urban-industrial aerosol, larger AAE values for biomass burning aerosols, and the largest AAE values for Sahara dust aerosols. These AERONET results are con- sistent with results from other, very different, techniques, including solar flux-aerosol optical depth (AOD) analyses and airborne in situ analyses examined in this paper, as well as many other previous results. Ambiguities in aerosol composition or mixtures thereof, resulting from intermedi- ate AAE values, can be reduced via cluster analyses that Correspondence to: P. B. Russell ([email protected],) supplement AAE with other variables, for example Extinc- tion Angstrom Exponent (EAE), which is an indicator of particle size. Together with previous results, these results strengthen prospects for determining aerosol composition from space, for example using the Glory Aerosol Polarime- try Sensor (APS), which seeks to provide retrievals of multi- wavelength single-scattering albedo (SSA) and aerosol op- tical depth (and therefore aerosol absorption optical depth (AAOD) and AAE), as well as shape and other aerosol prop- erties. Multidimensional cluster analyses promise additional information content, for example by using the Ozone Mon- itoring Instrument (OMI) to add AAOD in the near ultravi- olet and CALIPSO aerosol layer heights to reduce height- absorption ambiguity. 1 Previous results on connections between aerosol type and remotely sensible properties Recent research (e.g., IPCC 2007; Myhre, 2009) has em- phasized that assessments of aerosol effects on climate re- quire globally distributed information not just on aerosol amount (as conveyed, e.g., by maps of aerosol optical depth (AOD)), but also on aerosol characteristics such as size, composition and optical properties, including especially ab- sorption. Kaufman et al. (2002) and Yu et al. (2009) have shown that it is possible to retrieve useful information on Published by Copernicus Publications on behalf of the European Geosciences Union.

Welcome message from author
This document is posted to help you gain knowledge. Please leave a comment to let me know what you think about it! Share it to your friends and learn new things together.
Transcript

Atmos. Chem. Phys., 10, 1155–1169, 2010www.atmos-chem-phys.net/10/1155/2010/© Author(s) 2010. This work is distributed underthe Creative Commons Attribution 3.0 License.
AtmosphericChemistry
and Physics
Absorption Angstrom Exponent in AERONET and related data asan indicator of aerosol composition
P. B. Russell1, R. W. Bergstrom2, Y. Shinozuka3, A. D. Clarke4, P. F. DeCarlo5,6,*, J. L. Jimenez5,7, J. M.Livingston8,J. Redemann2, O. Dubovik9, and A. Strawa1
1NASA Ames Research Center, MS 245-5, Moffett Field, CA 94035-1000, USA2Bay Area Environmental Research Institute, 560 3rd Street West, Sonoma, CA 95476, USA3Oak Ridge Associated Universities, NASA Ames Research Center, MS 245-5, Moffett Field, CA 94035-1000, USA4School of Ocean and Earth Science and Technology, University of Hawaii, Honolulu, HI, USA5Cooperative Institute for Research in the Environmental Sciences, University of Colorado, Boulder, Colorado, USA6Dept. of Atmospheric and Oceanic Sciences University of Colorado, Boulder, Colorado, USA7Dept. of Chemistry and Biochemistry, University of Colorado, Boulder, Colorado, USA8SRI International, 333 Ravenswood Avenue, Menlo Park, CA 94025, USA9Laboratoire d’Optique Atmospherique, CNRS Universite de Lille, Bat 5, 59655 Villeneuve d’Ascq CEDEX, France* now at: Laboratory of Atmospheric Chemistry, Paul Scherrer Institut, Villigen, Switzerland
Received: 4 August 2009 – Published in Atmos. Chem. Phys. Discuss.: 16 October 2009Revised: 8 January 2010 – Accepted: 25 January 2010 – Published: 3 February 2010
Abstract. Recent results from diverse air, ground, and lab-oratory studies using both radiometric and in situ techniquesshow that the fractions of black carbon, organic matter, andmineral dust in atmospheric aerosols determine the wave-length dependence of absorption (often expressed as Absorp-tion Angstrom Exponent, or AAE). Taken together, these re-sults hold promise of improving information on aerosol com-position from remote measurements. The main purpose ofthis paper is to show that AAE values for an Aerosol RoboticNetwork (AERONET) set of retrievals from Sun-sky mea-surements describing full aerosol vertical columns are alsostrongly correlated with aerosol composition or type. In par-ticular, we find AAE values near 1 (the theoretical valuefor black carbon) for AERONET-measured aerosol columnsdominated by urban-industrial aerosol, larger AAE valuesfor biomass burning aerosols, and the largest AAE valuesfor Sahara dust aerosols. These AERONET results are con-sistent with results from other, very different, techniques,including solar flux-aerosol optical depth (AOD) analysesand airborne in situ analyses examined in this paper, aswell as many other previous results. Ambiguities in aerosolcomposition or mixtures thereof, resulting from intermedi-ate AAE values, can be reduced via cluster analyses that
Correspondence to:P. B. Russell([email protected],)
supplement AAE with other variables, for example Extinc-tion Angstrom Exponent (EAE), which is an indicator ofparticle size. Together with previous results, these resultsstrengthen prospects for determining aerosol compositionfrom space, for example using the Glory Aerosol Polarime-try Sensor (APS), which seeks to provide retrievals of multi-wavelength single-scattering albedo (SSA) and aerosol op-tical depth (and therefore aerosol absorption optical depth(AAOD) and AAE), as well as shape and other aerosol prop-erties. Multidimensional cluster analyses promise additionalinformation content, for example by using the Ozone Mon-itoring Instrument (OMI) to add AAOD in the near ultravi-olet and CALIPSO aerosol layer heights to reduce height-absorption ambiguity.
1 Previous results on connections between aerosol typeand remotely sensible properties
Recent research (e.g., IPCC 2007; Myhre, 2009) has em-phasized that assessments of aerosol effects on climate re-quire globally distributed information not just on aerosolamount (as conveyed, e.g., by maps of aerosol optical depth(AOD)), but also on aerosol characteristics such as size,composition and optical properties, including especially ab-sorption. Kaufman et al. (2002) and Yu et al. (2009) haveshown that it is possible to retrieve useful information on
Published by Copernicus Publications on behalf of the European Geosciences Union.

1156 P. B. Russell et al.: Absorption Angstrom Exponent in AERONET
Table 1. Attributes of the campaigns that produced the results in Figs. 1–3.
Campaign name Acronym Location Dates Research focus
Tropospheric Aerosol RadiativeForcing Observational Experi-ment
TARFOX US Atlantic coast Jul 1996 Aerosol radiative forcing
Puerto Rico Dust Experiment PRIDE Puerto Rico Jun–Jul 2000 Sahara dust in CaribbeanSouthern Africa Regional Sci-ence Initiative
SAFARI Southern Africa Aug–Sep 2000 Dry season aerosols
Aerosol CharacterizationExperiment-Asia
ACE-Asia Asian Pacific coast Mar–May 2001 Asian Pacific aerosol
International Consortium for At-mospheric Research on Transportand Transformation
ICARTT New England Atlantic coast Jul–Aug 2004 NE US and downwindaerosols
Megacity Initiative: Local andGlobal Research Observations
MILAGRO Mexico City to Gulf ofMexico
Mar 2006 Mexico City and downwindaerosols
aerosol type, and indeed to help distinguish natural from an-thropogenic aerosols, by using the aerosol size informationcontained in the wavelength dependence of AOD retrievedfrom the spaceborne instrument MODIS (see Appendix foracronyms). Also, many recent suborbital measurementshave shown that there are persistent connections betweenaerosol composition and the wavelength dependence of ab-sorption. In this section we summarize previous results re-lating aerosol composition and/or type to remotely sensibleproperties, as an introduction to the Aerosol Robotic Net-work (AERONET) results presented in Sect. 2.
1.1 The solar flux-AOD technique and results
The solar flux-AOD technique (Bergstrom et al., 2003, 2004,2007, 2009) uses a radiative transfer model to solve for thespectrum of aerosol single scattering albedo (SSA, the ra-tio of scattering to extinction) that provides the best matchbetween measured and calculated spectra of atmospheric ab-sorption of solar radiation. The measured absorption spec-trum is obtained as the difference of net flux spectra mea-sured at the top and bottom of an atmospheric aerosol layerby Solar Spectral Flux Radiometer (SSFR, Pilewskie et al.,2000, 2003). (A related technique uses flux measurementsonly at layer bottom e.g., Redemann et al., 2006.) The cal-culated absorption spectrum uses the layer AOD spectrum,obtained as the difference between AOD spectra measuredat layer bottom and top by an Ames Airborne Tracking Sun-photometer (AATS, Matsumoto et al., 1987, Russell et al.,2005, 2007). The technique also provides the layer’s aerosolabsorption optical depth (AAOD) spectrum, obtained as
AAOD(λ) = [1−SSA(λ)] AOD(λ), (1)
whereλ is wavelength. The technique is applied in condi-tions where little or no clouds are present to affect the solarflux measurements.
Recently Bergstrom et al. (2007) showed that spectra ofaerosol SSA and AAOD obtained by the solar flux-AODtechnique in different regions of the world varied signifi-cantly from region to region, in ways that could be ascribedto regional aerosol composition. Figure 1 summarizes theBergstrom et al. (2007) results, and Table 1 summarizes lo-cations and other characteristics of the campaigns in whichthe results were obtained.
SSA spectra obtained by the solar flux-AOD technique(Fig. 1 top left) have several desirable features:
1. They are obtained from direct measurements of radiantabsorption and AOD.
2. Results describe the layer aerosol in its ambient state(without loss of large or small particles or condensedvolatiles like water, organics, and nitrates).
3. Results cover a wide wavelength range, from near-UV,across the visible, and into the near-IR.
4. This wavelength range includes all or most aerosol-measurement wavelengths of many spaceborne and air-borne sensors (e.g., OMI, MISR, MODIS, CALIPSO,HSRL, Glory APS, RSP, POLDER).
5. The radiative calculations use an albedo spectrum forthe surface-plus-atmosphere below the aircraft obtaineddirectly from SSFR-measured upwelling and down-welling flux.
6. Use of the net flux difference between two altitudes toobtain the intervening absorption greatly reduces sen-sitivity to absorbing gases above and below the inter-vening layer, as well as to aerosol scattering asymmetryfactor.
The difference in SSA spectral shapes and magnitudes fromregion to region in Fig. 1 (top left frame) is striking. So
Atmos. Chem. Phys., 10, 1155–1169, 2010 www.atmos-chem-phys.net/10/1155/2010/

P. B. Russell et al.: Absorption Angstrom Exponent in AERONET 1157
acp-2009-484-manuscript-version3iAC.docPage 26 of 30 9:52 AM, 25 January 2010
Figure 1. Top: Spectra of Single Scattering Albedo (SSA) derived by the solar flux-AOD technique, reproduced from Bergstrom et al. (2007), with corresponding Aerosol Absorption Optical Depth (AAOD) spectra. (See Appendix for experiment acronyms.) The TARFOX absorption results are from laboratory analysis of collected aerosol samples, since SSFR did not fly in TARFOX. Bottom: Absorption Angstrom Exponent (AAE) values for the AAOD spectra above. The two AAE values for SAFARI are for different wavelength ranges (1.45 for 325-1000 nm, 1.11 for 325-1685 nm).
325- 1685 nm
325- 1000 nm
Fig. 1. Top: Spectra of Single Scattering Albedo (SSA) derived by the solar flux-AOD technique, reproduced from Bergstrom et al. (2007),with corresponding Aerosol Absorption Optical Depth (AAOD) spectra. (See Appendix for experiment acronyms.) The TARFOX absorptionresults are from laboratory analysis of collected aerosol samples, since SSFR did not fly in TARFOX. Bottom: Absorption AngstromExponent (AAE) values for the AAOD spectra above. The two AAE values for SAFARI are for different wavelength ranges (1.45 for325–1000 nm, 1.11 for 325–1685 nm).
www.atmos-chem-phys.net/10/1155/2010/ Atmos. Chem. Phys., 10, 1155–1169, 2010

1158 P. B. Russell et al.: Absorption Angstrom Exponent in AERONET
acp-2009-484-manuscript-version3iAC.docPage 27 of 30 9:52 AM, 25 January 2010
Figure 2. Scatter plot of AAE vs. organic fraction of submicron non-refractory aerosol mass, color coded by scattering Angstrom exponent. Results are from in situ measurements of aerosols by absorption photometer, nephelometer, and aerosol mass spectrometer on the C-130 mostly over Central Mexico during MILAGRO in March 2006. (Shinozuka et al., 2008, 2009; DeCarlo et al., 2008; see Appendix for acronyms.) AAE and SAE are for total particles observed behind the aircraft inlet (i.e., not submicron aerosol).
Correlation with organic mass fraction
Shortwave absorption enhancement due to dust
Organic fraction of submicron non-refactory mass
Fig. 2. Scatter plot of AAE vs. organic fraction of submicron non-refractory aerosol mass, color coded by scattering Angstrom exponent.Results are from in situ measurements of aerosols by absorption photometer, nephelometer, and aerosol mass spectrometer on the C-130mostly over Central Mexico during MILAGRO in March 2006. (Shinozuka et al., 2008, 2009; DeCarlo et al., 2008; see Appendix foracronyms.) AAE and SAE are for total particles observed behind the aircraft inlet (i.e., not submicron aerosol).
is the change in coalbedo (1 minus SSA) over a relativelyshort wavelength range for some of the spectra. For exam-ple, PRIDE coalbedo changes from∼0.24 to∼0.04 (a factorof 6) between 315 and 700 nm.
Figure 1 (top right frame) shows the spectra of AAOD cor-responding to the SSA spectra in the top left frame, withthe addition of TARFOX (US mid-Atlantic coast, urban-industrial aerosol). (The TARFOX absorption results arefrom laboratory analysis of collected aerosol samples, sinceSSFR did not fly in TARFOX.) Another striking feature ofFig. 1 is that the very different shapes of SSA spectra in thetop left frame all convert to AAOD spectra that can be fit-ted, to first approximation, by straight lines on the log-logplot. (We discuss departures from the straight-line fits later.)These fits are power laws, given by
AAOD = Kλ−AAE, (2)
where AAE is Absorption Angstrom Exponent. What dis-tinguishes the AAOD spectra in Fig. 1 from each other istheir slopes, i.e., their AAE values. The two experimentsconducted in summer off the US East coast, TARFOX andICARTT, have AAE close to 1. This is the theoretical AAEvalue for black carbon (Bergstrom, 1973; Bohren and Huff-man, 1983), suggesting that aerosol absorption for this lo-cation and season is dominated by black carbon (a poten-tial source of which is diesel exhaust). The next steeperslope, AAE = 1.45 (for wavelengths 325 to 1000 nm), is forbiomass burning aerosols in southern Africa. And the steep-est slopes, AAE = 2.27 and 2.34, are for aerosols containing
mineral dust, with the lesser of the two, 2.27, being for a mixof Asian dust and pollution. Figure 1 (bottom frame) showsAAE results from the five experiments.
1.2 Airborne in situ measurements of composition, ab-sorption, and scattering
Figure 2 shows measurements made on the C-130 aircraft inMILAGRO (Shinozuka et al., 2009; DeCarlo et al., 2008)that show similar behavior to that in Fig. 1, even though theywere made entirely independently of the Fig. 1 results. Thehorizontal axis in Fig. 2 is the organic fraction of submicronnon-refractory aerosol mass. Here “non-refractory” followsthe empirical definition of Shinozuka et al. (2009), i.e., con-sisting of those species that evaporate in a few seconds underhigh vacuum at 600 C; it includes essentially all the organicspecies and most sulfates and nitrates, including their ammo-nium salts. The vertical axis is AAE calculated as a best fit ofEq. (2) to in situ aerosol absorption measurements at wave-lengths 470, 530, and 660 nm (i.e., one straight line fitted tothree data points in log-log coordinates). The color code fordata points in Fig. 2 is scattering Angstrom exponent (SAE,=−1lnσ /1lnλ, whereσ is scattering coefficient), which re-lates inversely to particle size. AAE and SAE are for totalparticles observed behind the aircraft inlet (i.e., not submi-cron aerosol). Dark blue points indicate the smallest SAEvalues (hence the largest size), indicative of the presence ofdust in this experiment. (See Fast et al., 2007 and Aiken etal., 2009 for descriptions of likely dust sources near Mexico
Atmos. Chem. Phys., 10, 1155–1169, 2010 www.atmos-chem-phys.net/10/1155/2010/

P. B. Russell et al.: Absorption Angstrom Exponent in AERONET 1159
acp-2009-484-manuscript-version3iAC.docPage 28 of 30 9:52 AM, 25 January 2010
Figure 3. Representative spectra of SSA and absorption coefficient for selected OMF and AAE values in Figure 2. Error bars are from Shinozuka et al. (2009).
Fig. 3. Representative spectra of SSA and absorption coefficient for selected OMF and AAE values in Fig. 2. Error bars are from Shinozukaet al. (2009).
City, which include wind-blown bare soil, re-suspension byvehicles, a cement plant, and a limestone quarry.) If the darkblue points are excluded, the remaining points are describedfairly well by the straight line shown. Note that the line hasintercept AAE = 1, the value for pure black carbon. (The rar-ity of data points with AAE = 1 is consistent with the elec-tron microscope results of Adachi and Busek (2008), whichshowed that most Mexico City particles containing black car-bon were coated with organic matter and sulfates.) Thus, thedata in Fig. 2 show that:
– When neither dust nor organics are present (i.e., organicfraction = 0 and dark blue points excluded), AAE = 1,indicating black carbon is the dominant absorber;
– When dust is absent (dark blue points excluded), in-creasing organic fraction is accompanied by increasingAAE;
– For a given organic fraction, the presence of dust in-creases AAE still more.
It should be noted that some of the trend in Fig. 2 of AAEincrease with OMF is likely due to different mixing of an ur-ban (lower OMF, lower AAE) and biomass burning source(higher OMF, higher AAE). This source mixing does notchange the observations given above. Although the wave-length range of the Fig. 2 results is limited (λ = 470, 530,660 nm) compared to Figure 1 (∼325–1670 nm), the similar-ity of these Fig. 2 general results to those discussed in con-nection with Figure 1 is noteworthy. Also noteworthy is thegreat difference in techniques used to generate the two fig-ures: Fig. 1 used radiometric measurements (solar flux andAOD), and Fig. 2 used in situ measurements by nephelome-ter, absorption photometer, and aerosol mass spectrometer.Even the experiment locations differ: Fig. 1 comes from the
US Atlantic coast, Caribbean, East China Sea, and SouthAfrica, whereas Fig. 2 comes from Central Mexico and theGulf of Mexico (see Shinozuka et al. (2009) for related dis-cussion).
Figure 3 shows another aspect of the recent MILAGROC-130 results that is consonant with the flux-AOD results:although the SSA spectra (left frame) vary considerably inslope and curvature, the corresponding absorption coefficientspectra (right frame) are to first order all power laws (i.e.,nearly straight lines on the log-log plot) with negative slope,and increasing Organic Mass Fraction (OMF) yields largerslopes (AAE values). The slight curvature of the absorptioncoefficient spectra in Fig. 3 (right frame), characteristic of or-ganics, is discussed further in Section 1.3. Note also that theSSA spectra in Fig. 3 (left frame) change slope,1SSA/1λ,from negative to positive as OMF increases from 0.3 to 0.7.This also is discussed further in Sects. 1.3 and 2.
1.3 Additional in situ field and laboratory measure-ments
The results in Figs. 1–3 are also consistent with several pre-vious aerosol absorption results surveyed by Bergstrom etal. (2007). These include both the laboratory studies ofKirchstetter et al. (2004) and the field studies of Clarke etal. (2007), Roden et al. (2006), Sierau et al. (2006), Virkkulaet al. (2006), and Schnaiter et al. (2006). These studies showthat not only is AAE for organic species (sometimes calledbrown carbon) larger than for black carbon (e.g., Bond, 2001;Kirchstetter et al., 2004; Schnaiter et al., 2003), AAE fororganic species can depend on wavelength (increasing fordecreasing wavelength), whereas it is independent of wave-length for black carbon. The dependence of AAE on wave-length can be seen in Fig. 1 for the SAFARI case: note thatAAE is 1.45 over the range 325–1000 nm, but 1.11 over
www.atmos-chem-phys.net/10/1155/2010/ Atmos. Chem. Phys., 10, 1155–1169, 2010

1160 P. B. Russell et al.: Absorption Angstrom Exponent in AERONET
the range 325–1685 nm. It is also evident in Fig. 3 (rightframe), increasingly so for increasing organic mass fraction.Taking into account all the above and additional references,Bergstrom et al. (2007) conclude that AAE can be as largeas 6, and they show some measurements of AAE<1, no-tably for Houston during GoMACCS in 2006 (Bates et al.,2008; Massoli et al., 2008). The GoMACCS measurementsof AAE<1 are from thousands of shipborne scattering andabsorption measurements that yielded a distribution rangingfrom AAE ∼0.3 to 3 with median values of∼0.84, 0.91, &1.07 for wavelength pairs 530 and 660, 467 and 660, and467 and 530 nm, respectively. Gyawali, et al. (2009) showthat values of AAE<1 (and indeed>1) can result from blackcarbon coated with either absorbing or nonabsorbing mate-rial, a point explored further by the calculations of Lack andCappa (2010).
Other recent references showing large values of AAE fororganic species include McMeeking (2008), McMeeking etal. (2008), Lewis et al. (2008), Barnard et al. (2008), San-dradewi et al. (2008), Martins et al. (2009), and Yang etal. (2009). Sandradewi et al. (2008) used the AAE differencebetween BC and organics to determine the relative contribu-tions of traffic and wood burning to the carbonaceous massof particulate matter in an Alpine valley town. McMeek-ing’s work showed that the AAE values depended stronglyon modified combustion efficiency (MCE), a measure of firecombustion conditions (flaming vs. smoldering). This de-pendence, coupled with the above-mentioned dependence ofAAE on the proportion of black carbon vs. organic speciesin aerosols, produced a strong dependence of AAE on MCE.For example, as MCE increased from 0.8 to 1.0 (correspond-ing to the change from smoldering to flaming pine needles),AAE decreased from 4.6 to∼1. Simultaneously, the ratio ofelemental carbon to total carbon increased from∼0 to∼0.5.These results offer the promise of using remote measure-ments of AAE (ideally combined with other remotely sensedvariables) to determine whether a particular biomass smokelayer resulted from flaming or smoldering combustion. Yanget al. (2009) also apportioned the absorption by aerosols inChina to black carbon, brown carbon, and dust, attributingthe high AAE values of dust to the presence of ferric oxides.
Three recent papers (Barnard et al., 2008; Marley et al.,2009; Corr et al., 2009) report enhanced absorption in the300–500 nm wavelength range for aerosols in the MexicoCity area. Corr et al. (2009) find SSA having little or nowavelength dependence for the wavelength pair 332 and368 nm, with values varying between∼0.70 and∼0.86.Barnard et al. (2008) also find SSA having little or no wave-length dependence between∼300 and∼400 nm, with valuesvarying between∼0.67 and∼0.78. Barnard et al. (2008)report a steep increase in SSA between∼400 and 500 nm,with SSA(500 nm)∼0.87 to 0.95, and decreasing SSA from500 to 870 nm, with SSA(870 nm)∼0.81 to∼0.93. Theyattribute the enhanced absorption forλ <400 nm to organicmatter, as do Marley et al. (2009). (Strong UV absorp-
tion by very many organic species is documented by Jacob-son (1998), although not expressed as SSA(λ).) The posi-tive 1SSA/1λ found by Barnard et al. betweenλ=400 and500 nm is similar to the positive1SSA/1λ shown in Fig. 3(left frame) for MILAGRO C-130 results with OMF≥0.5,although the different measurement wavelengths used by theC-130 and Barnard et al. prevent exact comparisons.
AAOD spectra calculated from the SSA and AOD val-ues in Barnard et al. (2008) do not follow a power lawwith near-constant AAE over their wavelength range (300–870 nm), and hence Barnard et al. find AAE values that arestrongly dependent on wavelength pair (3.2 to 5.1 for 300–500 nm; 1.9 to 2.6 for 300–870 nm). In contrast, Marley etal. (2009) find a different, and relatively restricted, range ofAAE (0.63 to 1.5 including both 2003 and 2006 field cam-paigns) over the wavelength range 370 to 950 nm. Bergstromet al. (2009) report wavelength-dependent AAE from Solarflux-AOD analyses of airborne measurements in the MexicoCity area and over the Gulf of Mexico. Hence, further re-search is needed to understand the differences among theseMexico City results, as well as the differences between theMexico City results and those in Fig. 1, which are for casesrelatively far from urban areas.
1.4 Recent efforts to derive information on aerosol com-position from AERONET retrieved complex refrac-tive index
The ground-based AERONET network of Sun-sky radiome-ters (Holben et al., 2001) produces measurements of solardirect-beam transmission and sky radiance that are invertedto yield aerosol column size distributions and complex re-fractive indices at four wavelengths: 440, 670, 870, and1020 nm (e.g., Dubovik & King, 2000; Dubovik et al., 2000).Recently, Schuster et al. (2005, 2009) have demonstrated theuse of AERONET-retrieved complex refractive index to de-rive information about both aerosol black carbon content andwater uptake. In the following section we present results of adifferent but related approach that assesses the usefulness ofAERONET-retrieved SSA, AAOD, and AAE as indicators ofaerosol composition, including black carbon, organic matter,and mineral dust.
2 AAOD spectra and AAE values from AERONETmeasurements of key aerosol types
Dubovik et al. (2002a) present representative aerosol sizedistributions and SSA spectra derived from 8 years of mea-surements by AERONET Sun-sky radiometers (Holben etal., 2001) at locations around the world where key aerosoltypes tend to prevail, especially during particular seasons.The Dubovik et al. (2002a) results were derived using theAERONET Version 1 retrieval, with cases restricted to largeAOD, so that results for SSA differ negligibly from results
Atmos. Chem. Phys., 10, 1155–1169, 2010 www.atmos-chem-phys.net/10/1155/2010/
P. B. Russell et al.: Absorption Angstrom Exponent in AERONET 1161
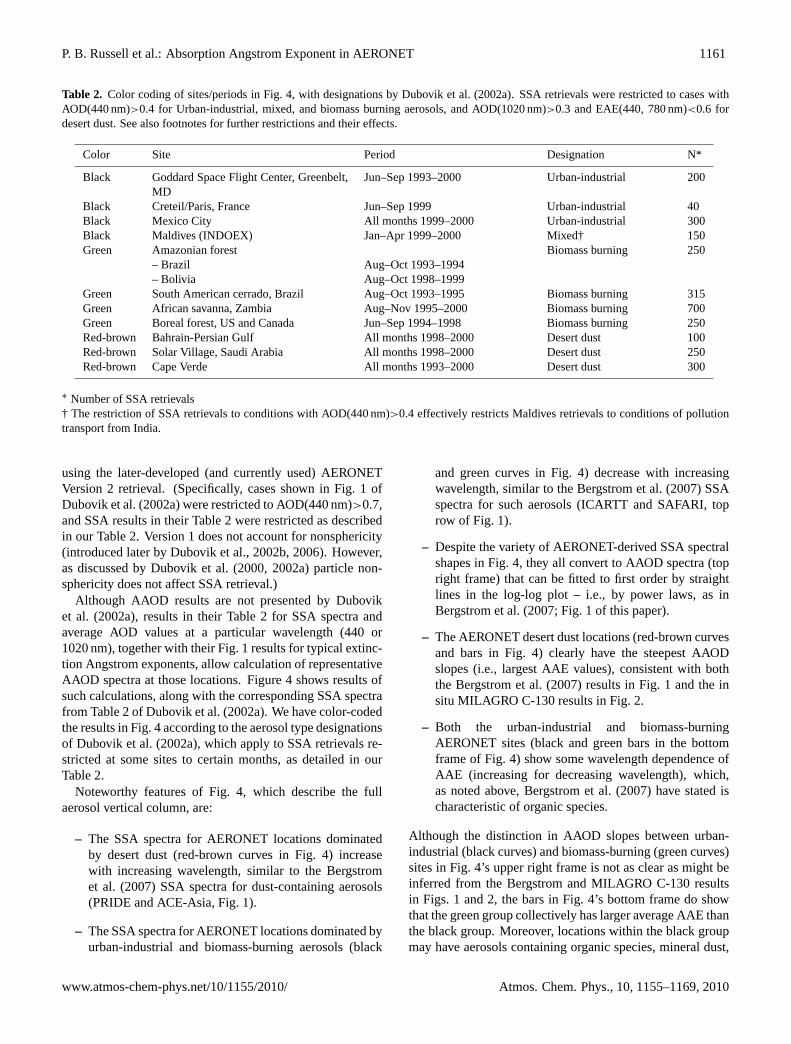
Table 2. Color coding of sites/periods in Fig. 4, with designations by Dubovik et al. (2002a). SSA retrievals were restricted to cases withAOD(440 nm)>0.4 for Urban-industrial, mixed, and biomass burning aerosols, and AOD(1020 nm)>0.3 and EAE(440, 780 nm)<0.6 fordesert dust. See also footnotes for further restrictions and their effects.
Color Site Period Designation N*
Black Goddard Space Flight Center, Greenbelt,MD
Jun–Sep 1993–2000 Urban-industrial 200
Black Creteil/Paris, France Jun–Sep 1999 Urban-industrial 40Black Mexico City All months 1999–2000 Urban-industrial 300Black Maldives (INDOEX) Jan–Apr 1999–2000 Mixed† 150Green Amazonian forest Biomass burning 250
– Brazil Aug–Oct 1993–1994– Bolivia Aug–Oct 1998–1999
Green South American cerrado, Brazil Aug–Oct 1993–1995 Biomass burning 315Green African savanna, Zambia Aug–Nov 1995–2000 Biomass burning 700Green Boreal forest, US and Canada Jun–Sep 1994–1998 Biomass burning 250Red-brown Bahrain-Persian Gulf All months 1998–2000 Desert dust 100Red-brown Solar Village, Saudi Arabia All months 1998–2000 Desert dust 250Red-brown Cape Verde All months 1993–2000 Desert dust 300
∗ Number of SSA retrievals† The restriction of SSA retrievals to conditions with AOD(440 nm)>0.4 effectively restricts Maldives retrievals to conditions of pollutiontransport from India.
using the later-developed (and currently used) AERONETVersion 2 retrieval. (Specifically, cases shown in Fig. 1 ofDubovik et al. (2002a) were restricted to AOD(440 nm)>0.7,and SSA results in their Table 2 were restricted as describedin our Table 2. Version 1 does not account for nonsphericity(introduced later by Dubovik et al., 2002b, 2006). However,as discussed by Dubovik et al. (2000, 2002a) particle non-sphericity does not affect SSA retrieval.)
Although AAOD results are not presented by Duboviket al. (2002a), results in their Table 2 for SSA spectra andaverage AOD values at a particular wavelength (440 or1020 nm), together with their Fig. 1 results for typical extinc-tion Angstrom exponents, allow calculation of representativeAAOD spectra at those locations. Figure 4 shows results ofsuch calculations, along with the corresponding SSA spectrafrom Table 2 of Dubovik et al. (2002a). We have color-codedthe results in Fig. 4 according to the aerosol type designationsof Dubovik et al. (2002a), which apply to SSA retrievals re-stricted at some sites to certain months, as detailed in ourTable 2.
Noteworthy features of Fig. 4, which describe the fullaerosol vertical column, are:
– The SSA spectra for AERONET locations dominatedby desert dust (red-brown curves in Fig. 4) increasewith increasing wavelength, similar to the Bergstromet al. (2007) SSA spectra for dust-containing aerosols(PRIDE and ACE-Asia, Fig. 1).
– The SSA spectra for AERONET locations dominated byurban-industrial and biomass-burning aerosols (black
and green curves in Fig. 4) decrease with increasingwavelength, similar to the Bergstrom et al. (2007) SSAspectra for such aerosols (ICARTT and SAFARI, toprow of Fig. 1).
– Despite the variety of AERONET-derived SSA spectralshapes in Fig. 4, they all convert to AAOD spectra (topright frame) that can be fitted to first order by straightlines in the log-log plot – i.e., by power laws, as inBergstrom et al. (2007; Fig. 1 of this paper).
– The AERONET desert dust locations (red-brown curvesand bars in Fig. 4) clearly have the steepest AAODslopes (i.e., largest AAE values), consistent with boththe Bergstrom et al. (2007) results in Fig. 1 and the insitu MILAGRO C-130 results in Fig. 2.
– Both the urban-industrial and biomass-burningAERONET sites (black and green bars in the bottomframe of Fig. 4) show some wavelength dependence ofAAE (increasing for decreasing wavelength), which,as noted above, Bergstrom et al. (2007) have stated ischaracteristic of organic species.
Although the distinction in AAOD slopes between urban-industrial (black curves) and biomass-burning (green curves)sites in Fig. 4’s upper right frame is not as clear as might beinferred from the Bergstrom and MILAGRO C-130 resultsin Figs. 1 and 2, the bars in Fig. 4’s bottom frame do showthat the green group collectively has larger average AAE thanthe black group. Moreover, locations within the black groupmay have aerosols containing organic species, mineral dust,
www.atmos-chem-phys.net/10/1155/2010/ Atmos. Chem. Phys., 10, 1155–1169, 2010

1162 P. B. Russell et al.: Absorption Angstrom Exponent in AERONET
acp-2009-484-manuscript-version3iAC.docPage 29 of 30 9:52 AM, 25 January 2010
Figure 4. Top: Spectra of AERONET-derived Single Scattering Albedo (SSA) from Dubovik et al. (2002a), with corresponding Aerosol Absorption Optical Depth (AAOD) spectra. Black: Urban/Industrial or Mixed; Green: Biomass Burning; Red-Brown: Desert Dust. Bottom: Absorption Angstrom Exponent (AAE) values for the AAOD spectra above. Shading for each location indicates wavelength pair (in nm) for AAE calculation. GSFC=Goddard Space Flight Center, Greenbelt, MD.
Fig. 4. Top: Spectra of AERONET-derived Single Scattering Albedo (SSA) from Dubovik et al. (2002a), with corresponding AerosolAbsorption Optical Depth (AAOD) spectra. Black: Urban/Industrial or Mixed; Green: Biomass Burning; Red-Brown: Desert Dust. Bottom:Absorption Angstrom Exponent (AAE) values for the AAOD spectra above. Shading for each location indicates wavelength pair (in nm) forAAE calculation. GSFC=Goddard Space Flight Center, Greenbelt, MD, USA.
Atmos. Chem. Phys., 10, 1155–1169, 2010 www.atmos-chem-phys.net/10/1155/2010/
P. B. Russell et al.: Absorption Angstrom Exponent in AERONET 1163
or both in addition to black carbon, especially consideringthat the AERONET results describe the full vertical column,which can contain several aerosol layers of different type. In-deed, Fig. 2 shows that Mexico City aerosols typically con-tain organic species, dust, or both, and Salcedo et al. (2006),DeCarlo et al. (2008), and Aiken et al. (2009) document thatorganic species consistently contribute about half the submi-cron mass in Mexico City aerosols, which represents a largerfraction of organic species than at locations in the US EastCoast (Zhang et al., 2007). The larger AERONET AAE val-ues for Mexico City as compared to Goddard Space FlightCenter (GSFC, bottom row, Fig. 4) are thus consistent withthe Bergstrom results in Fig. 1 and the MILAGRO C-130 insitu results in Fig. 2. (This follows from GSFC’s locationnear the US Atlantic coast, site of TARFOX and ICARTT,and the Bergstrom et al. AAE values from those experiments(AAE = 1.12 and 1.05, smallest of all the Bergstrom AAE re-sults, suggesting black carbon dominates aerosol absorptionthere).
The AERONET AAE values<1 in Fig. 4, bottom frame(GSFC and Maldives) are consistent with the shipborneAAE<1 results for Houston during GoMACCS cited byBergstrom et al. (2007, see above) and also the Gyawaliet al. (2009) results showing that black carbon with eitherabsorbing or nonabsorbing coatings can produce AAE<1.Moreover, the AERONET GSFC AAE values (0.81 to 0.94,depending on wavelength pair) are close to 1, and the dif-ferences from 1 may simply reflect the accuracy of the tech-nique. The Maldives AERONET AAE values (0.87 to 1.07,depending on wavelength pair) are closer still to 1. An-other consideration is that the AERONET results in Fig. 4are based on the location-averaged results in Dubovik etal. (2002a), rather than results from individual AERONETretrievals.
The negative slopes,dSSA/dλ <0, for AERONETbiomass burning locations in Fig. 4 (green curves, left frame)are consistent with the negative slope for SAFARI biomassburning smoke in Fig. 1 (green curve, left frame) from theflux-AOD technique. However, because biomass smokescontain organics, this raises the question of consistencywith the positive slope,dSSA/dλ>0, found by Barnard etal. (2008) for Mexico City and attributed to organics. Wespeculate that at least part of the explanation is the relativeamounts of BC and organics in wildfire smokes and in theMexico City aerosols observed by Barnard et al. Indeed,Fig. 3 (left frame) shows that, for the Mexico aerosols sam-pled by the C-130 in MILAGRO, increasing OMF causes theslope,dSSA/dλ, to change from negative to positive. Asnoted above, Salcedo et al. (2006), DeCarlo et al. (2008), andAiken et al. (2009) found that organic species contributedabout half the submicron mass in Mexico City aerosols, alarger fraction than at US East Coast locations (Zhang etal., 2007). We speculate that larger ratios of BC to or-ganic matter in wildfire smokes could be responsible forthe BC (with dSSA/dλ <0) outweighing the organic mat-
ter (with dSSA/dλ >0), but this is clearly a subject for fur-ther research. Effects of aerosol mixtures and evolution onAERONET-retrieved SSA spectra are explored by Eck etal. (2005) for Asian and mid-Pacific aerosols.
A note on seasalt aerosols.Seasalt aerosols can be impor-tant at many coastal and oceanic sites, and indeed Duboviket al. (2002a) include results from a 12th site, Lanai, HI (notshown in our Fig. 4 or Table 2), which they designate asoceanic (i.e., expected to be dominated by aerosols of mar-itime origin, with some influence of Asian dust and pollutionin Spring – as later documented by Eck et al., 2005). Wehave excluded the Dubovik et al. (2002a) Lanai results fromthis paper because many studies of seasalt optical properties(e.g., Shettle and Fenn, 1979; WMO, 1983; Koepke et al.,1997; Hess et al., 1998; Tanre et al., 1999) indicate negli-gible absorption (hence undefined AAE) for the AERONETwavelength range (440–1020 nm). Indeed, the AERONET-retrieved SSA values at Lanai are within a standard deviationof 1.00 (specifically, 0.98, 0.97, 0.97, 0.97±0.03 at 440, 670,870, and 1020 nm, where the 0.03 is the standard deviationof the 150 SSA retrievals at Lanai. Moreover, as pointedout by Dubovik et al. (2002a), the small AOD at Lanai(AOD(440 nm) usually less than 0.15) causes the AERONETretrieval uncertainty for aerosol absorption and SSA to besignificantly larger than for the other sites, where SSA re-trievals were restricted to cases with AOD(440 nm)≥0.4.Thus, the technique emphasized in this paper, of using AAEas an indicator of aerosol composition (or even combiningAAE and EAE, as in Sect. 3) is not applicable to pure seasaltaerosol, because of undefined AAE. Even in the case ofseasalt mixed with enough absorbing material (BC, OC ordust) to produce a well defined AAE, that AAE would becharacteristic of the absorbing material, not seasalt. How-ever, another approach, applicable to the optical data setsfrom AERONET and the other techniques described in thispaper, would be to identify as seasalt aerosol those cases withSSA∼=1 and EAE small (hence particles large). As shown byFigure 1 and Table 1 of Dubovik et al. (2002a), another char-acteristic of the oceanic site Lanai is relatively small retrievedvalues of both real and imaginary refractive index. This is anexample of information that could be used to identify seasaltin multidimensional clustering analyses, described further inthe following section.
3 Additional information from clustering analyses
Ambiguities in aerosol composition or mixtures thereof, re-sulting from intermediate AAE values, can be reduced viacluster analyses that supplement AAE with other variables.For example, Fig. 5 shows that a scatter plot of AAE vs ex-tinction Angstrom exponent (EAE, for wavelengths 440 and870 nm) for the 11 non-oceanic AERONET sites in Duboviket al. (2002a) has points grouped in clusters. Such an anal-ysis clearly shows the distinction between the aerosol types
www.atmos-chem-phys.net/10/1155/2010/ Atmos. Chem. Phys., 10, 1155–1169, 2010

1164 P. B. Russell et al.: Absorption Angstrom Exponent in AERONET
acp-2009-484-manuscript-version3iAC.docPage 30 of 30 9:52 AM, 25 January 2010
Figure 5. Scatter plot of AERONET-derived AAE vs. EAE for the 11 non-oceanic sites in Dubovik et al. (2002a), showing the clustering by aerosol type that results.
Desert dust Biomass
burning
Urban industrial
Fig. 5. Scatter plot of AERONET-derived AAE vs. EAE for the 11non-oceanic sites in Dubovik et al. (2002a), showing the clusteringby aerosol type that results.
at Solar Village/Saudi Arabia and at Boreal Forest, whichhave similar AAE values (∼1.4 to 1.6), but very differentEAE values (∼0.4 and 1.9, respectively), reflecting the muchlarger particle sizes at the former site. This is consonant withthe results in Fig. 2, which show that information on aerosoltype can come not only from the wavelength dependence ofabsorption, but also from the size information in the wave-length dependence of scattering. Indeed, Clarke et al. (2007)have used this type of two-dimensional cluster analysis (plot-ting SAE vs AAE) to distinguish dust, biomass burning, andpollution plumes in airborne in situ data. They even findevidence of a separation between scrubbed coal-fired powerplant plumes and regional strong urban pollution in AAE-SAE space, which they attribute to the combined presenceof brown carbon and smaller particles in the power plantplumes. Yang et al. (2009) show an SAE vs AAE plot fortheir results for the EAST-AIRE field program near Beijing.They conclude that dust generally had SAE close to zero dueto the large particle size, while its AAE was high but vari-able. Fresh chimney plumes were characterized by a near-unity AAE, which is expected for soot carbon. In compari-son, coal pollution aerosols were much more variable in op-tical characteristics, likely due to formation of brown carbonand clay in addition to soot carbon.
In addition to differences in AAE, EAE, and SAE, theslopes and shapes of SSA spectra in Figs. 1 and 4 show differ-ences that correlate with aerosol type (e.g., dust SSA spectrahave positive slope and negative curvature, whereas urban-industrial and biomass smoke SSA spectra have negativeslope). This suggests the value of combining several differenttypes of remotely sensed information in multi-dimensionalcluster analyses to derive the most information on aerosoltype (e.g., to reduce the ambiguity resulting from the par-tial overlap of the biomass burning and urban-industrial clus-ters in Fig. 5). Indeed, Cattrall et al. (2005) have de-veloped an objective cluster analysis technique that com-bines 4 different lidar-derived variables to classify aerosoltype, using as a basis retrievals of aerosol properties at 26
AERONET sites. This technique has been applied both byHostetler et al. (2008) to derive aerosol type from airborneHigh Spectral Resolution Lidar (HSRL) measurements, andby Reagan et al. (2004) to simulated spaceborne CALIOPmeasurements. In the HSRL algorithm, the input vari-ables are 4 intensive parameters: extinction/backscatter ratio(sensitive to absorption), depolarization (shape), backscattercolor ratio (size), and depolarization color ratio (nonspheri-cal/spherical size). The algorithm finds eight significant clus-ters, designated Biomass+urban, Urban + biomass, Urban(large), Urban biomass + large dust, Urban biomass + smalldust, Dust + urban, Dust (large), and Pure dust.
Another successful application of clustering was by Omaret al. (2005) who used cluster analysis by partitioning (cf.Kaufman and Rousseeuw, 1990) to classify global atmo-spheric aerosols using the complete AERONET archive(>143 000 data records from>250 sites) as of December2002. They used as input 26 AERONET-derived parame-ters (mean radius, width, and volume of 2 size modes, plusreal and imaginary refractive index, SSA, asymmetry fac-tor, and extinction/backscatter ratio, each at 4 wavelengths)and found six significant clusters of aerosol type, whichvaried in prevalence with season at each site. In addition,Levy et al. (2007) used cluster analysis to generate, from theAERONET data base, aerosol classes that now are used inthe MODIS retrieval algorithm.
4 Potential for improved spaceborne determination ofaerosol composition or type
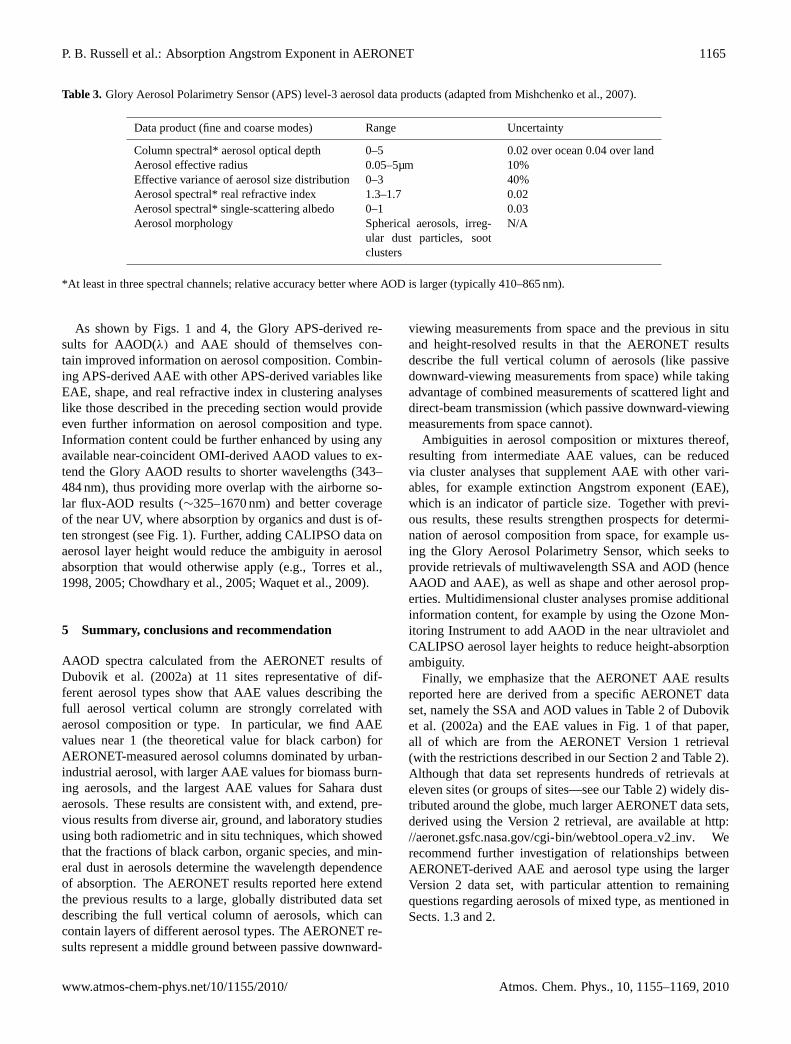
Kaufman et al. (2002) and Yu et al. (2009) have shown thatit is possible to retrieve useful information on aerosol type,and indeed to help distinguish natural from anthropogenicaerosols, by using the aerosol size information in MODIS-retrieved values of EAE. Here we point out the potential toimprove this space-derived information on aerosol type, pro-vided aerosol absorption wavelength dependence could bedetermined from space. In fact, as displayed in Table 3, theGlory Aerosol Polarimetry Sensor (APS; Mishchenko et al.,2007) aims to provide retrievals of multiwavelength single-scattering albedo (SSA) and aerosol optical depth (henceaerosol absorption optical depth (AAOD) and AAE), as wellas shape and other aerosol properties. (Glory is scheduled forlaunch no earlier than 1 October 2010http://www.nasa.gov/missions/highlights/schedule.html.) The APS level-3 aerosoldata products listed in Table 3 will be retrieved from APSmeasurements of the four Stokes parameters, I, Q, U, and V,describing the intensity and polarization state of the receivedradiation at wavelengths 410, 443, 555, 670, 865, 910, 1370,1610, and 2250 nm. The high accuracy, polarization diver-sity, and broad spectral range planned for APS are expectedto yield the uncertainties listed in Table 3, which will be asignificant step forward for space-based aerosol data prod-ucts.
Atmos. Chem. Phys., 10, 1155–1169, 2010 www.atmos-chem-phys.net/10/1155/2010/
P. B. Russell et al.: Absorption Angstrom Exponent in AERONET 1165
Table 3. Glory Aerosol Polarimetry Sensor (APS) level-3 aerosol data products (adapted from Mishchenko et al., 2007).
Data product (fine and coarse modes) Range Uncertainty
Column spectral* aerosol optical depth 0–5 0.02 over ocean 0.04 over landAerosol effective radius 0.05–5µm 10%Effective variance of aerosol size distribution 0–3 40%Aerosol spectral* real refractive index 1.3–1.7 0.02Aerosol spectral* single-scattering albedo 0–1 0.03Aerosol morphology Spherical aerosols, irreg-
ular dust particles, sootclusters
N/A
*At least in three spectral channels; relative accuracy better where AOD is larger (typically 410–865 nm).
As shown by Figs. 1 and 4, the Glory APS-derived re-sults for AAOD(λ) and AAE should of themselves con-tain improved information on aerosol composition. Combin-ing APS-derived AAE with other APS-derived variables likeEAE, shape, and real refractive index in clustering analyseslike those described in the preceding section would provideeven further information on aerosol composition and type.Information content could be further enhanced by using anyavailable near-coincident OMI-derived AAOD values to ex-tend the Glory AAOD results to shorter wavelengths (343–484 nm), thus providing more overlap with the airborne so-lar flux-AOD results (∼325–1670 nm) and better coverageof the near UV, where absorption by organics and dust is of-ten strongest (see Fig. 1). Further, adding CALIPSO data onaerosol layer height would reduce the ambiguity in aerosolabsorption that would otherwise apply (e.g., Torres et al.,1998, 2005; Chowdhary et al., 2005; Waquet et al., 2009).
5 Summary, conclusions and recommendation
AAOD spectra calculated from the AERONET results ofDubovik et al. (2002a) at 11 sites representative of dif-ferent aerosol types show that AAE values describing thefull aerosol vertical column are strongly correlated withaerosol composition or type. In particular, we find AAEvalues near 1 (the theoretical value for black carbon) forAERONET-measured aerosol columns dominated by urban-industrial aerosol, with larger AAE values for biomass burn-ing aerosols, and the largest AAE values for Sahara dustaerosols. These results are consistent with, and extend, pre-vious results from diverse air, ground, and laboratory studiesusing both radiometric and in situ techniques, which showedthat the fractions of black carbon, organic species, and min-eral dust in aerosols determine the wavelength dependenceof absorption. The AERONET results reported here extendthe previous results to a large, globally distributed data setdescribing the full vertical column of aerosols, which cancontain layers of different aerosol types. The AERONET re-sults represent a middle ground between passive downward-
viewing measurements from space and the previous in situand height-resolved results in that the AERONET resultsdescribe the full vertical column of aerosols (like passivedownward-viewing measurements from space) while takingadvantage of combined measurements of scattered light anddirect-beam transmission (which passive downward-viewingmeasurements from space cannot).
Ambiguities in aerosol composition or mixtures thereof,resulting from intermediate AAE values, can be reducedvia cluster analyses that supplement AAE with other vari-ables, for example extinction Angstrom exponent (EAE),which is an indicator of particle size. Together with previ-ous results, these results strengthen prospects for determi-nation of aerosol composition from space, for example us-ing the Glory Aerosol Polarimetry Sensor, which seeks toprovide retrievals of multiwavelength SSA and AOD (henceAAOD and AAE), as well as shape and other aerosol prop-erties. Multidimensional cluster analyses promise additionalinformation content, for example by using the Ozone Mon-itoring Instrument to add AAOD in the near ultraviolet andCALIPSO aerosol layer heights to reduce height-absorptionambiguity.
Finally, we emphasize that the AERONET AAE resultsreported here are derived from a specific AERONET dataset, namely the SSA and AOD values in Table 2 of Duboviket al. (2002a) and the EAE values in Fig. 1 of that paper,all of which are from the AERONET Version 1 retrieval(with the restrictions described in our Section 2 and Table 2).Although that data set represents hundreds of retrievals ateleven sites (or groups of sites—see our Table 2) widely dis-tributed around the globe, much larger AERONET data sets,derived using the Version 2 retrieval, are available athttp://aeronet.gsfc.nasa.gov/cgi-bin/webtooloperav2 inv. Werecommend further investigation of relationships betweenAERONET-derived AAE and aerosol type using the largerVersion 2 data set, with particular attention to remainingquestions regarding aerosols of mixed type, as mentioned inSects. 1.3 and 2.
www.atmos-chem-phys.net/10/1155/2010/ Atmos. Chem. Phys., 10, 1155–1169, 2010

1166 P. B. Russell et al.: Absorption Angstrom Exponent in AERONET
Appendix A
Acronyms
AAE Absorption Angstrom ExponentAAOD Aerosol Absorption Optical DepthAATS Ames Airborne Tracking Sunpho-
tometerACE Aerosol Characterization Experi-
ment, orAerosol/Cloud/Ecosystems(Decadal Survey Mission)
AERONET Aerosol Robotic NetworkAOD Aerosol Optical DepthAPS Aerosol Polarimetry SensorCALIOP Cloud-Aerosol Lidar with Orthog-
onal PolarizationCALIPSO Cloud-Aerosol Lidar and Infrared
Pathfinder Satellite ObservationsEAE Extinction Angstrom ExponentEAST-AIRE East Asian Study of Tropospheric
Aerosols: an International Re-gional Experiment
GoMACCS Gulf of Mexico Atmospheric Com-position and Climate Study
GSFC Goddard Space Flight CenterHSRL High Spectral Resolution LidarICARTT International Consortium for At-
mospheric Research on Transportand Transformation
INDOEXINTEX orINTEX-NA
Indian Ocean ExperimentIntercontinental Chemical Trans-port Experiment-North America
INTEX-A or -B
Phase A or B of INTEX-NA
IR InfraredMCE Modified Combustion EfficiencyMISR Multi-angle Imaging SpectroRa-
diometerMODIS Moderate-resolution Imaging
SpectroradiometerMILAGRO Megacity Initiative: Local and
Global Research ObservationsNIR Near Infra-RedOMF Organic Mass FractionOMI Ozone Monitoring InstrumentPOLDER Polarization and Directionality of
Earth RadiancesPRIDE Puerto Rico Dust ExperimentRSP Research Scanning PolarimeterSAE Scattering Angstrom exponentSAFARI Southern Africa Regional Science
InitiativeSSA Single Scattering AlbedoSSFR Solar Spectral Flux Radiometer
TARFOX Tropospheric Aerosol RadiativeForcing Observational Experiment
UV Ultraviolet
Acknowledgements.PBR, RWB, JML, JR, and AS were supportedby the NASA Radiation Science Program. ADC and YS weresupported by NSF grant number ATM05-11521. PFD and JLJ weresupported by NASA NNX08AD39G, NSF/UCAR S05-39607, andNSF-ATM-0513116. We appreciate helpful discussions with BrentHolben and Lorraine Remer on AERONET measurements, withOmar Torres on OMI future measurements and with Brian Cairnson Glory APS measurements, as well as internal reviews by RobertChatfield and Laura Iraci.
Edited by: T. Kirchstetter
References
Adachi, K. and Buseck, P. R.: Internally mixed soot, sulfates, andorganic matter in aerosol particles from Mexico City, Atmos.Chem. Phys., 8, 6469–6481, 2008
Aiken, A. C., Salcedo, D., Cubison, M. J., Huffman, J. A., DeCarlo,P. F., Ulbrich, I. M., Docherty, K. S., Sueper, D., Kimmel, J.R., Worsnop, D. R., Trimborn, A., Northway, M., Stone, E. A.,Schauer, J. J., Volkamer, R. M., Fortner, E., de Foy, B., Wang, J.,Laskin, A., Shutthanandan, V., Zheng, J., Zhang, R., Gaffney, J.,Marley, N. A., Paredes-Miranda, G., Arnott, W. P., Molina, L. T.,Sosa, G., and Jimenez, J. L.: Mexico City aerosol analysis duringMILAGRO using high resolution aerosol mass spectrometry atthe urban supersite (T0) Part 1: Fine particle composition andorganic source apportionment, Atmos. Chem. Phys., 9, 6633–6653, 2009,http://www.atmos-chem-phys.net/9/6633/2009/.
Barnard, J. C., Volkamer, R., and Kassianov, E. I.: Estimation of themass absorption cross section of the organic carbon componentof aerosols in the Mexico City Metropolitan Area, Atmos. Chem.Phys., 8, 6665–6679, 2008,http://www.atmos-chem-phys.net/8/6665/2008/.
Bates, T. S., Quinn, P. K., Coffman, D., et al.: Boundary layeraerosol chemistry during TexAQS/GoMACCS 2006: Insightsinto aerosol sources and transformation processes, J. Geophys.Res., 113, D00F01, doi:10.1029/2008JD010023, 2008.
Bergstrom, R. W.: Extinction and Absorption Coefficients of theAtmospheric Aerosol as a Function of Particle Size, Contr. At-mos. Phys., 46, 223–234, 1973.
Bergstrom, R. W., Russell, P. B., and Hignett, P.: Wavelength de-pendence of the absorption of black carbon particles: Predictionsand results from the TARFOX experiment and implications forthe aerosol single scattering albedo, J. Atmos. Sci., 59, 568–578,2002.
Bergstrom, R. W., Pilewskie, P., Schmid, B., and Russell, P. B.:Estimates of the spectral aerosol single scattering albedo andaerosol radiative effects during SAFARI 2000, J. Geophys. Res.,108(D13), 8474, doi:10.1029/2002JD002435, 2003.
Bergstrom, R. W., Pilewskie, P., Pommier, J., Rabbette, M., Rus-sell, P. B., Schmid, B., Redemann, J., Higurashi, A., Naka-jima, T., and Quinn, P. K.: Spectral absorption of solar radiationby aerosols during ACE-Asia, J. Geophys. Res., 109, D19S15,doi:10.1029/2003JD004467, 2004.
Atmos. Chem. Phys., 10, 1155–1169, 2010 www.atmos-chem-phys.net/10/1155/2010/
P. B. Russell et al.: Absorption Angstrom Exponent in AERONET 1167
Bergstrom, R. W., Pilewskie, P., Russell, P. B., Redemann, J., Bond,T. C., Quinn, P. K., and Sierau, B.: Spectral absorption proper-ties of atmospheric aerosols, Atmos. Chem. Phys., 7, 5937–5943,2007,http://www.atmos-chem-phys.net/7/5937/2007/.
Bergstrom, R. W., Schmidt, K. S., Coddington, O., Pilewskie, P.,Guan, H., Livingston, J. M., Redemann, J., and Russell, P. B.:Aerosol spectral absorption in the Mexico City area: resultsfrom airborne measurements during MILAGRO/INTEX B, At-mos. Chem. Phys. Discuss., 9, 27543–27569, 2009,http://www.atmos-chem-phys-discuss.net/9/27543/2009/.
Bohren, C. F. and Huffman, D. R.: Absorption and scattering oflight by small particles, John Wiley and Sons, New York, 530pp., 1983.
Bond, T. C.: Spectral Dependence of Visible Light Absorption byCarbonaceous Particles Emitted from Coal Combustion, Geo-phys. Res. Lett., 28(21), 4075–4078, 2001.
Cattrall, C., Reagan, J. A., Thome, K., and Dubovik, O.: Vari-ability of aerosol and spectral lidar and backscatter and extinc-tion ratios of key aerosol types derived from selected AerosolRobotic Network locations, J. Geophys. Res., 110, D10S11,doi:10.1029/2004JD005124, 2005.
Chandrasekhar, S.: Radiative Transfer, New York: Dover, 393 pp.,1960.
Chowdhary, J., Cairns, B., Mishchenko, M. I., Hobbs, P. V., Cota,G., Redemann, J., Rutledge, K., Holben, B. N., and Russell,E.: Retrieval of aerosol scattering and absorption propertiesfrom photopolarimetric observations over the ocean during theChesapeake Lighthouse and Aircraft Measurements for Satellite(CLAMS) experiment, J. Atmos. Sci., 62(4), 1093–1117, 2005.
Clarke, A., McNaughton, C., Kapustin, V., Shinozuka, Y., Howell,S., Dibb, J., Zhou, J., Anderson, B., Brekhovskikh, V., Turner,H., and Pinkerton, M.: Biomass Burning and Pollution Aerosolover North America: Organic Components and their influenceon Spectral Optical Properties and Humidification Response,J. Geophys. Res., 112, D12S18, doi:10.1029/2006JD007777,2007.
Corr, C. A., Krotkov, N., Madronich, S., Slusser, J. R., Holben, B.,Gao, W., Flynn, J., Lefer, B., and Kreidenweis, S. M.: Retrievalof aerosol single scattering albedo at ultraviolet wavelengths atthe T1 site during MILAGRO, Atmos. Chem. Phys., 9, 5813–5827, 2009,http://www.atmos-chem-phys.net/9/5813/2009/.
DeCarlo, P. F., Dunlea, E. J., Kimmel, J. R., Aiken, A. C., Sueper,D., Crounse, J., Wennberg, P. O., Emmons, L., Shinozuka, Y.,Clarke, A., Zhou, J., Tomlinson, J., Collins, D. R., Knapp, D.,Weinheimer, A. J., Montzka, D. D., Campos, T., and Jimenez,J. L.: Fast airborne aerosol size and chemistry measurementsabove Mexico City and Central Mexico during the MILAGROcampaign, Atmos. Chem. Phys., 8, 4027–4048, 2008,http://www.atmos-chem-phys.net/8/4027/2008/.
Dubovik, O., and King, M. D.: A flexible inversion algorithm forretrieval of aerosol optical properties from Sun and sky radiancemeasurements, J. Geophys. Res., 105, 20673–20696, 2000.
Dubovik, O., Smirnov, A., Holben, B. N., King, M. D., Kaufman,Y. J., Eck, T. F. and Slutsker, I.: Accuracy assessment of aerosoloptical properties retrieval from AERONET sun and sky radiancemeasurements, J. Geophys. Res., 105, 9791–9806, 2000.
Dubovik, O., Holben, B. N., Eck, T. F., Smirnov, A., Kaufman, Y.J., King, M. D., Tanre, D., and Slutsker, I.: Variability of ab-sorption and optical properties of key aerosol types observed in
worldwide locations, J. Atmos. Sci., 59, 590–608, 2002a.Dubovik, O., Holben, B. N., Lapyonok, T., Sinyuk, A.,
Mishchenko, M. I., Yang, P., and Slutsker, I.: Non-sphericalaerosol retrieval method employing light scattering by spheroids,Geophys. Res. Lett., 29(10), 1415, doi:10.1029/2001GL014506,2002b.
Dubovik, O., Sinyuk, A., Lapyonok, T., et al.: Application ofspheroid models to account for aerosol particle nonsphericity inremote sensing of desert dust, J. Geophys. Res., 111, D11208,doi:10.1029/2005JD006619, 2006.
Eck, T. F., Holben, B. N., Dubovik, O., et al.: Columnar aerosoloptical properties at AERONET sites in central eastern Asia andaerosol transport to the tropical mid-Pacific, J. Geophys. Res.,110, D06202, doi:10.1029/2004JD005274, 2005.
Fast, J. D., de Foy, B., Acevedo Rosas, F., Caetano, E., Carmichael,G., Emmons, L., McKenna, D., Mena, M., Skamarock, W.,Tie, X., Coulter, R. L., Barnard, J. C., Wiedinmyer, C., andMadronich, S.: A meteorological overview of the MILAGROfield campaigns, Atmos. Chem. Phys., 7, 2233–2257, 2007,http://www.atmos-chem-phys.net/7/2233/2007/.
Gyawali, M., Arnott, W. P.,, Lewis, and Moosmuller, H.: In situaerosol optics in Reno, NV, USA during and after the summer2008 California wildfires and the influence of absorbing and non-absorbing coatings on spectral light absorption, Atmos. Chem.Phys., 9, 8007–8015.
Hess, M., Koepke, P., and Schult, I.: Optical properties of aerosolsand clouds: The software package OPAC, B. Am. Meteorol.Soc., 80, 831–844, 1998.
Holben, B. N., Tanre, D., Smirnov, A., Eck, T. F., Slutsker, I.,Chatenet, B., Lavenue, F., Kaufman, Y., Castle, J. V., Setzer, A.,Markham, B., Clark, D., Frouin, R., Karneli, A., O’Neill, N. T.,Pietras, C., Pinker, R., Voss, K., and Zibordi, G.: An emergingground-based aerosol climatology: Aerosol Optical Depth fromAERONET, J. Geophys. Res., 106, 12067–12097, 2001.
Hostetler, C. A., Ferrare, R. A., Hair, J. W., Rogers, R. R., Ob-land, M., Burton, S. P., Su, W., Cook, A. L., and Harper, D.B.: Observations from the NASA Langley airborne High Spec-tral Resolution Lidar and plans for active-passive aerosol-cloudretrievals, Department of Energy Aerial Vehicle Program Work-shop on Advances in Airborne Instrumentation for MeasuringAerosols, Clouds, Radiation and Atmospheric State Parameters,Urbana-Champaign, IL, 14–16 October 2008.
IPCC, 2007: Climate Change 2007: The Physical Science Basis.Contribution of Working Group I to the Fourth Assessment Re-port of the Intergovernmental Panel on Climate Change, editedby: Solomon, S., Qin, D., Manning, M., Chen, Z., Marquis, M.,Averyt, K. B., Tignor, M., and Miller, H. L., Cambridge Univer-sity Press, Cambridge, UK and New York, NY, USA, 996 pp.,2007.
Jacobson, M. Z.: Isolating nitrated and aromatic aerosols and ni-trated aromatic gases as sources of ultraviolet light absorption, J.Geophys. Res., 104, 3527–3542, 1999.
Kaufman, L. and Rousseeuw, P.; Finding Groups in Data, J. Wiley,Hoboken, NJ, USA, 338 pp., 1990.
Kaufman, Y. J., Tanre, D., and Boucher, O.: A satellite view ofaerosols in the climate system. Nature, 419, 215–223, 2002.
Kirchstetter, T. W., Novakov, T., and Hobbs, P.: Evidence thatthe spectral dependence of light absorption by aerosols is af-fected by organic carbon, J. Geophys. Res., 109, D21208,
www.atmos-chem-phys.net/10/1155/2010/ Atmos. Chem. Phys., 10, 1155–1169, 2010

1168 P. B. Russell et al.: Absorption Angstrom Exponent in AERONET
doi:10.1029/2004JD004999, 2004.Koepke, P., Hess, M., Schult, I., and Shettle, E. P.: Global aerosol
data set. MPI Meteorologie Hamburg Report No. 243, 44 pp,1997.
Lack, D. A. and Cappa, C. D.: Impact of brown and clear carbonon light absorption enhancement, single scatter albedo and ab-sorption wavelength dependence of black carbon, Atmos. Chem.Phys. Discuss., 10, 785–819, 2010,http://www.atmos-chem-phys-discuss.net/10/785/2010/.
Levy, R., Remer, L., and Dubovik, O.; Global aerosol optical mod-els and application to MODIS aerosol retrieval over land, J. Geo-phys. Res., 112, D13210, doi:10.1029/2006JD007815, 2007.
Lewis, K., Arnott, W. P., Moosmuller, H., and Wold, C. E.: Strongspectral variation of biomass smoke light absorption and sin-gle scattering albedo observed with a novel dual-wavelengthphotoacoustic instrument, J. Geophys. Res., 113, D16203,doi:10.1029/2007JD009699, 2008.
Marley, N. A., Gaffney, J. S., Tackett, M., Sturchio, N. C., Heraty,L., Martinez, N., Hardy, K. D., Marchany-Rivera, A., Guilder-son, T., MacMillan, A., and Steelman, K.: The impact of bio-genic carbon sources on aerosol absorption in Mexico City, At-mos. Chem. Phys., 9, 1537–1549, 2009
Martins, J. V., Artaxo, P., Kaufman, Y. J., Castanho, A. D., andRemer, L. A.: Spectral absorption properties of aerosol par-ticles from 350–2500 nm, Geophys. Res. Lett., 36, L13810,doi:10.1029/2009GL037435, 2009.
Massoli, P., Bates, T. S., Quinn, P. K., Lack, D. A., Bay-nard, T., Lerner, B. M., Tucker, S. C., Brioude, J., Stohl, A.,and Williams, E. J.: Aerosol optical and hygroscopic prop-erties during TexAQS-GoMACCS 2006 and their impact onaerosol direct radiative forcing, J. Geophys. Res., 114, D00F07,doi:10.1029/2008JD011604, 2009.
Matsumoto, T., Russell, P., Mina, C., Van Ark, W., and Banta, V.:Airborne Tracking Sunphotometer, J. Atmos. Ocean. Tech., 4,336–339,1987.
McMeeking, G. R.: The Optical, Chemical, And Physical Proper-ties Of Aerosols And Gases Emitted By The Laboratory Com-bustion Of Wildland Fuels, Dissertation, Department of Atmo-spheric Science, Colorado State University, Fort Collins, Col-orado Fall 2008.
McMeeking, G., Petters, M., Carrico, K., Sullivan, A., Holden, M.,Collett, J., Kreidenweis, S., Moosmuller, H., Arnott, P., Lewis,K., Wold, C., Hao, W. M., Malm, W., Kirchstetter, T., and Lun-den, M.: Characterization of emissions from the laboratory com-bustion of wildland plant species, Int’l Conf. Carbonaceous Par-ticles in the Atmosphere, Berkeley, CA, USA, 12–14 August2008.
Mishchenko, M., Cairns, B., Kopp, G., Schueler, C., Fafaul, B.,Hansen, J., Hooker, J., Itchkawich, T., Maring, H., and Travis,L. D.: Accurate Monitoring of terrestrial aerosols and total solarirradiance, B. Am. Meteorol. Soc., 88(5), 677–691, 2007.
Myhre, G.: Consistency between satellite-derived and modeled es-timates of the direct aerosol effect, Science, 325 187–190, 2009.
Omar, A., Won, J.-G., Winker, D. M., Yoon, S.-C., Dubovik,O., and McCormick, M. P.: Development of global aerosolmodels using cluster analysis of aerosol Robotic Network(AERONET) measurements, J. Geophys. Res., 110, D10S14,doi:10.1029/2004JD004874, 2005.
Pilewskie P., Rabbette, M., Bergstrom, R., Marquez, J., Schmid, B.,
and Russell, P. B.; The discrepancy between measured and mod-eled downwelling solar irradiance at the ground: Dependence onwater vapor, Geophys. Res. Lett., 27, 137–140, 2000.
Pilewskie, P., Pommier, J., Bergstrom, R., et al.: Solarspectral radiative forcing during the Southern African Re-gional Science Initiative, J. Geophys. Res., 108(D13), 8486,doi:10.1029/2002JD002411, 2003.
Reagan, J. A., Wang, X., Cattrall, C., and Thome, K.: Spacebornelidar aerosol retrieval approaches based on aerosol model con-straints, in Geoscience and Remote Sensing Symposium, 2004IGARSS 04. Proceedings, 1940–1943, 2004.
Redemann, J., Pilewskie, P., Russell, P. B., Livingston, J. M.,Howard, S., Schmid, B., Pommier, J., Gore, W., Eilers, J., andWendisch, M.: Airborne measurements of spectral direct aerosolradiative forcing in the Intercontinental chemical Transport Ex-periment/Intercontinental Transport and Chemical Transforma-tion of anthropogenic pollution, 2004, J. Geophys. Res., 111,D14210, doi:10.1029/2005JD006812, 2006.
Roden, C. A., Bond, T. C., Conway, S., Benhamin, A., and Pinel,O.: Emission factors and real-time optical properties of particlesemitted from traditional wood burning cookstoves, Environ. Sci.Technol., 40, 6750–6757, 2006.
Russell, P., Livingston, J., Schmid, B., Eilers, J., Kolyer, R., Rede-mann, J., Ramirez, S., Yee, J.-H., Swartz, W., Shetter, R., Trepte,C., Risley Jr., A., Wenny, B., Zawodny, J., Chu, W., Pitts, M.,Lumpe, J., Fromm, Randall, M. C., Hoppel, K., and Bevilac-qua, R.: Aerosol optical depth measurements by airborne Sunphotometer in SOLVE II: Comparisons to SAGE III, POAM IIIand airborne spectrometer measurements, Atmos. Chem. Phys.,5, 1311–1339, 2005
Russell, P. B., Livingston, J. M., Redemann, J., Schmid, B.,Ramirez, S. A., Eilers, J., Khan, R., Chu, A., Remer, L.,Quinn, P. K., Rood, M. J., and Wang, W.: Multi-Grid-Cell Validation of Satellite Aerosol Property Retrievals in IN-TEX/ITCT/ICARTT 2004, J. Geophys. Res., 112, D12S09,doi:10.1029/2006JD007606, 2007.
Salcedo, D., Onasch, T. B., Dzepina, K., Canagaratna, M. R.,Zhang, Q., Huffman, J. A., DeCarlo, P. F., Jayne, J. T., Mor-timer, P., Worsnop, D. R., Kolb, C. E., Johnson, K. S., Zuberi,B., Marr, L. C., Volkamer, R., Molina, L. T., Molina, M. J., Car-denas, B., Bernab, R. M., Mrquez, C., Gaffney, J. S., Marley, N.A., Laskin, A., Shutthanandan, V., Xie, Y., Brune, W., Lesher,R., Shirley, T., and Jimenez, J. L.: Characterization of ambientaerosols in Mexico City during the MCMA-2003 campaign withAerosol Mass Spectrometry: results from the CENICA Super-site, Atmos. Chem. Phys., 6, 925–946, 2006,http://www.atmos-chem-phys.net/6/925/2006/.
Sandradewi, J., Prevot, A. S. H., Szidat, S., Perron, N., Rami Al-farra, M., Lanz, V. A., Weingartner, E., and Baltensparger, U.:Using Aerosol Light Absorption Measurements for the Quantita-tive Determination of Wood Burning and Traffic Emission Con-tributions to Particulate Matter, Environ. Sci. Technol., 42, 3316–3323, 2008.
Schnaiter, M., Horvath, H., Mohler, O., Naumann, K. H., Saathoff,H., and Schock, O. W.: UV-VIS-NIR spectral optical propertiesof soot and soot-containing aerosols, J. Aerosol Sci., 34, 1421–1444, 2003.
Schnaiter, M., Gimmler, M., Llamas, I., Linke, C., Jager, C., andMutschke, H.: Strong spectral dependence of light absorption by
Atmos. Chem. Phys., 10, 1155–1169, 2010 www.atmos-chem-phys.net/10/1155/2010/

P. B. Russell et al.: Absorption Angstrom Exponent in AERONET 1169
organic carbon particles formed by propane combustion, Atmos.Chem. Phys., 6, 2981–2990, 2006,http://www.atmos-chem-phys.net/6/2981/2006/.
Schuster G., O. Dubovik, B. N. Holben, and E. E. Clothiaux, Infer-ring black carbon content and specific absorption from AerosolRobotic Network (AERONET) aerosol retrievals, J. Geophys.Res., 110, No. D10, D10S17, 10.1029/2004JD004548, 2005.
Schuster, G. L., Lin, B., and Dubovik, O.: Remote sensingof aerosol water uptake, Geophys. Res. Lett., 36, L03814,doi:10.1029/2008GL036576, 2009.
Shettle, E. P. and Fenn, R. W.: Models of aerosols of lower tro-posphere and the effect of humidity variations on their opticalproperties. AFCRL Tech. Rep. 79 0214, Air Force CambridgeRes. Lab., Hanscom Air Force Base, Mass., 100 pp, 1979.
Shinozuka, Y., Clarke, A., Howell, S., et al.: Relations BetweenCloud Condensation Nuclei And Aerosol Optical Properties Rel-evant to Remote Sensing: Airborne Measurements in BiomassBurning, Pollution and Dust Aerosol Over North America, EosTrans. AGU, 89(53), Fall Meet. Suppl., Abstract A41E-0164,2008.
Shinozuka, Y., Clarke, A. D., DeCarlo, P. F., Jimenez, J. L., Dunlea,E. J., Roberts, G. C., Tomlinson, J. M., Collins, D. R., How-ell, S. G., Kapustin, V. N., McNaughton, C. S., and Zhou, J.:Aerosol optical properties relevant to regional remote sensing ofCCN activity and links to their organic mass fraction: airborneobservations over Central Mexico and the US West Coast dur-ing MILAGRO/INTEX-B, Atmos. Chem. Phys., 9, 6727–6742,2009,http://www.atmos-chem-phys.net/9/6727/2009/.
Sierau, B., Covert, D. S., Coffman, D. J., Quinn, P. K., and Bates,T. S.: Aerosol optical properties during the 2004 New Eng-land Air Quality Study – Intercontinental Transport and Chem-ical Transformation: Gulf of Maine surface measurements –Regional and case studies, J. Geophys. Res., 111, D23S37,doi:10.1029/2006JD007568, 2006.
Tanre D., Remer, L. R., Kaufman, Y. J., Mattoo, S., Hobbs, P. V.,Livingston, J. M., Russell, P. B., and Smirnov, A.: Retrieval ofaerosol optical thickness and size distribution over ocean fromthe MODIS airborne simulator during TARFOX, J. Geophys.Res., 104, 2261–2278, 1999.
Torres O., Bhartia, P. K., Herman, J. R., and Ahmad, Z.: Derivationof aerosol properties from satellite measurements of backscat-tered ultraviolet radiation. Theoretical Basis, J. Geophys. Res.,103, 17099–17110, 1998.
Torres, O., Bhartia, P. K., Syniuk, A., and Welton, E.: TOMS Mea-surements of Aerosol Absorption from Space: Comparison toSAFARI 2000 Ground based Observations, J. Geophys. Res.,110, D10S18, doi:10.10129/2004JD004611, 2005.
Virkkula, A., Ahlquist, N. C., Covert, D. S., Arnott, W. P., Sheridan,P. J., Quinn, P. K., and Coffman, D. J.: Modification, calibrationand a field test of an instrument for measuring light absorptionby particles, Aerosol Sci. Technol., 39(1), 68–83, 2005.
WMO: Radiation commission of IAMAP meeting of experts onaerosol and their climatic effects. WCP55, Williamsburg VA, 28–30, 1983.
Yang, M., Howell, S. G., Zhuang, J., and Huebert, B. J.: Attribu-tion of aerosol light absorption to black carbon, brown carbon,and dust in China – interpretations of atmospheric measurementsduring EAST-AIRE, Atmos. Chem. Phys., 9, 2035–2050, 2009,http://www.atmos-chem-phys.net/9/2035/2009/.
Yu, H., Chin, M., Remer, L. A., Kleidman, R. G., Bellouin, N.,Bian, H., and Diehl, T.: Variability of marine aerosol fine-mode fraction and estimates of anthropogenic aerosol componentover cloud-free oceans from the Moderate Resolution ImagingSpectroradiometer (MODIS), J. Geophys. Res., 114, D10206,doi:10.1029/2008JD010648, 2009.
Zhang, Q., Jimenez, J. L., Canagaratna, M. R., et al.:Ubiquity and Dominance of Oxygenated Species in Or-ganic Aerosols in Anthropogenically—Influenced NorthernHemisphere Mid-latitudes. Geophys. Res. Lett., 34, L13801,doi:10.1029/2007GL029979.
www.atmos-chem-phys.net/10/1155/2010/ Atmos. Chem. Phys., 10, 1155–1169, 2010
Related Documents