Absolute molecular optical Kerr effect spectroscopy of dilute organic solutions and neat organic liquids Steven R. Vigil* and Mark G. Kuzyk Department of Physics, Washington State University, Pullman, Washington 99164-2814 Received October 13, 2000; revised manuscript received December 1, 2000 We report the results of pump– probe optical Kerr effect (OKE) experiments performed on neat solutions of carbon tetrachloride, nitrobenzene, methyl methacrylate monomer, binary solutions of the squaraine dye in- dole squarylium, and the phthalocyanine dye silicon phthalocyanine-monomethacrylate, respectively, in car- bon tetrachloride, and solid solutions of indole squarylium and phthalocyanine-monomethacrylate in poly(methyl methacrylate). Dispersion measurements of the dye solutions were performed in the visible one- photon resonant region of the dyes defined by their linear-absorption spectra. The dyes’ third-order molecular susceptibility response g xxxx ( 2v 2 ; v 1 , 2v 1 , v 2 ) in this spectral region is markedly different, with R $ gISQ% . 0 and R $ gSiPc% , 0. Analysis of the dyes’ OKE response requires the inclusion of high-lying two-photon states and suggests that a purely electronic mechanism dominates their OKE response. The results are used to calculate the dyes’ off-resonant third-order molecular susceptibilities, which are well within the limits pre- dicted by the Thomas – Reiche – Kuhn sum rule [M. G. Kuzyk, Opt. Lett. 25, 1183– 1185 (2000)]. © 2001 Op- tical Society of America OCIS codes: 190.3270, 190.4710, 300.6290, 300.6420. 1. INTRODUCTION It has long been known that conjugated molecules (i.e., molecules with alternating single and double bonds) have very strong absorption bands in the visible and ultraviolet regions of the spectrum. 1 This conjugation strongly af- fects the molecular polarizability a, which determines the molecular-absorption spectrum. Conjugated molecules also have appreciable nonlinear-optical (NLO) suscepti- bilities. Because of their large nonlinear response and ease of incorporation into polymer waveguides, organic dyes have been extensively studied as NLO dopants in polymer optical devices. 2–4 The NLO response of these materials is due to their relatively large transition dipole moments and strong, narrow absorption features. There is a vast literature of linear and nonlinear studies of or- ganic dyes, much of it concerned with the structure- property relationships necessary to optimize the molecu- lar NLO response. The relative ease with which organic molecules can be tailored to a particular environment po- tentially gives them a great advantage as NLO materials, once the factors affecting their nonlinearity are well un- derstood, allowing them, for instance, to be chemically tailored to a particular environment while their nonlinear optical response is not affected. In this paper we report the results of resonant pump– probe optical Kerr effect (OKE) experiments performed on neat organic liquids and organic liquids and solids doped with squaraine and phthalocyanine dyes. While their strong absorption pre- cludes the use of devices made with these dyes in their one-photon resonant regime, we show that the study of their OKE spectra in the resonant regime yields informa- tion about their higher-lying electronic excited states, the knowledge of which is necessary to accurately predict the molecular NLO response at nonresonant wavelengths. 2. THEORY A. Optical Kerr Effect Theory The optical Kerr effect describes an optically induced bi- refringence wherein a strong optical field (the pump field) in a medium induces a change in the medium’s zero-field dielectric tensor. (Unless otherwise noted in the follow- ing discussion, we will assume an initially isotropic me- dium, i.e., a medium whose zero-field dielectric response can be described by a scalar and a linearly polarized pump field.) The induced birefringence is characterized by the difference between the refractive indices parallel and perpendicular to the pump field’s polarization vector. In a pump – probe experiment the refractive-index differ- ence induced by the strong pump field is probed by a sepa- rate, weak optical field having polarization components parallel and perpendicular to the birefringence-inducing field. For example, a linearly polarized plane-wave probe field having components parallel and perpendicular to the pump-field polarization will, upon passing through a bire- fringent medium of length L, in general be elliptically po- larized with a phase difference between orthogonal com- ponents d f 5 2 p l ~ d n i 2 d n ’ ! L , (1) where l is the vacuum wavelength of the probe field, and d n i and d n ’ are the optically induced refractive-index changes parallel and perpendicular to the pump-field po- S. R. Vigil and M. G. Kuzyk Vol. 18, No. 5 / May 2001 / J. Opt. Soc. Am. B 679 0740-3224/2001/050679-13$15.00 © 2001 Optical Society of America

Welcome message from author
This document is posted to help you gain knowledge. Please leave a comment to let me know what you think about it! Share it to your friends and learn new things together.
Transcript

S. R. Vigil and M. G. Kuzyk Vol. 18, No. 5 /May 2001/J. Opt. Soc. Am. B 679
Absolute molecular optical Kerr effectspectroscopy of dilute organic
solutions and neat organic liquids
Steven R. Vigil* and Mark G. Kuzyk†
Department of Physics, Washington State University, Pullman, Washington 99164-2814
Received October 13, 2000; revised manuscript received December 1, 2000
We report the results of pump–probe optical Kerr effect (OKE) experiments performed on neat solutions ofcarbon tetrachloride, nitrobenzene, methyl methacrylate monomer, binary solutions of the squaraine dye in-dole squarylium, and the phthalocyanine dye silicon phthalocyanine-monomethacrylate, respectively, in car-bon tetrachloride, and solid solutions of indole squarylium and phthalocyanine-monomethacrylate inpoly(methyl methacrylate). Dispersion measurements of the dye solutions were performed in the visible one-photon resonant region of the dyes defined by their linear-absorption spectra. The dyes’ third-order molecularsusceptibility response gxxxx(2v2 ;v1 , 2v1 , v2) in this spectral region is markedly different, with R$gISQ%
. 0 and R$gSiPc% , 0. Analysis of the dyes’ OKE response requires the inclusion of high-lying two-photonstates and suggests that a purely electronic mechanism dominates their OKE response. The results are usedto calculate the dyes’ off-resonant third-order molecular susceptibilities, which are well within the limits pre-dicted by the Thomas–Reiche–Kuhn sum rule [M. G. Kuzyk, Opt. Lett. 25, 1183–1185 (2000)]. © 2001 Op-tical Society of America
OCIS codes: 190.3270, 190.4710, 300.6290, 300.6420.
1. INTRODUCTIONIt has long been known that conjugated molecules (i.e.,molecules with alternating single and double bonds) havevery strong absorption bands in the visible and ultravioletregions of the spectrum.1 This conjugation strongly af-fects the molecular polarizability a, which determines themolecular-absorption spectrum. Conjugated moleculesalso have appreciable nonlinear-optical (NLO) suscepti-bilities. Because of their large nonlinear response andease of incorporation into polymer waveguides, organicdyes have been extensively studied as NLO dopants inpolymer optical devices.2–4 The NLO response of thesematerials is due to their relatively large transition dipolemoments and strong, narrow absorption features. Thereis a vast literature of linear and nonlinear studies of or-ganic dyes, much of it concerned with the structure-property relationships necessary to optimize the molecu-lar NLO response. The relative ease with which organicmolecules can be tailored to a particular environment po-tentially gives them a great advantage as NLO materials,once the factors affecting their nonlinearity are well un-derstood, allowing them, for instance, to be chemicallytailored to a particular environment while their nonlinearoptical response is not affected. In this paper we reportthe results of resonant pump–probe optical Kerr effect(OKE) experiments performed on neat organic liquids andorganic liquids and solids doped with squaraine andphthalocyanine dyes. While their strong absorption pre-cludes the use of devices made with these dyes in theirone-photon resonant regime, we show that the study oftheir OKE spectra in the resonant regime yields informa-tion about their higher-lying electronic excited states, the
0740-3224/2001/050679-13$15.00 ©
knowledge of which is necessary to accurately predict themolecular NLO response at nonresonant wavelengths.
2. THEORYA. Optical Kerr Effect TheoryThe optical Kerr effect describes an optically induced bi-refringence wherein a strong optical field (the pump field)in a medium induces a change in the medium’s zero-fielddielectric tensor. (Unless otherwise noted in the follow-ing discussion, we will assume an initially isotropic me-dium, i.e., a medium whose zero-field dielectric responsecan be described by a scalar and a linearly polarizedpump field.) The induced birefringence is characterizedby the difference between the refractive indices paralleland perpendicular to the pump field’s polarization vector.In a pump–probe experiment the refractive-index differ-ence induced by the strong pump field is probed by a sepa-rate, weak optical field having polarization componentsparallel and perpendicular to the birefringence-inducingfield. For example, a linearly polarized plane-wave probefield having components parallel and perpendicular to thepump-field polarization will, upon passing through a bire-fringent medium of length L, in general be elliptically po-larized with a phase difference between orthogonal com-ponents
df 52p
l~dn i 2 dn'!L, (1)
where l is the vacuum wavelength of the probe field, anddn i and dn' are the optically induced refractive-indexchanges parallel and perpendicular to the pump-field po-
2001 Optical Society of America

680 J. Opt. Soc. Am. B/Vol. 18, No. 5 /May 2001 S. R. Vigil and M. G. Kuzyk
larization, respectively. The changed polarization stateof the probe field can be measured, for example, by plac-ing the birefringent sample between crossed polarizers.For the OKE the refractive-index difference in Eq. (1) isfield dependent and expressed as
Dn 5 dn i 2 dn' 51
2n2BuEu2, (2)
where n2B is the optical Kerr coefficient5,6 and E is theamplitude of the pump electric field. It is the mecha-nisms contributing to the optical Kerr coefficient n2B inwhich we are interested.
In a pump–probe OKE arrangement the total field Eincident upon the Kerr sample can be written
E 5 E1 1 E2 , (3)
where E1 is the strong pump field and E2 is the compara-tively weak probe field. We assume both the pump andthe probe fields are linearly polarized plane waves travel-ing in the z direction, described by
E1 51
2@A1 exp~if1! 1 c.c.#, (4)
E2 51
2( A2 exp~if2!$exp@id ~z !#cos ux 1 sin uy% 1 c.c.),
(5)
where
f1 5 k1z 2 v1t 1 f~z !, (6)
f2 5 k2z 2 v2t, (7)
and (k1 , v1) and (k2 , v2) are the vacuum wave vectorsand the angular frequencies of the pump and probe fields,respectively. In Eq. (5), d (z) is the phase shift inducedin the probe field by the pump-induced birefringence, andu is the angle between the polarization vectors of thepump and the probe fields at the entrance to the Kerrsample (z 5 0). In Eq. (4), f(z) is the intensity-dependent self-induced phase shift of the pump. Theprobe is assumed weak enough that it induces nointensity-dependent phase change in the pump or itself.For a probe wave that is initially linearly polarized@d (z < 0) 5 0# the solution of the nonlinear wave equa-tion for the probe field7,8 yields a probe phase change,
d ~z ! 53k2puA1u2z
e0~v2!x~3 !~2v2 ; v1 , 2v1 , v2!, (8)
where e0(v2) is the dielectric constant of the Kerrmedium at the probe wavelength, andx (3)(2v2 ; v1 , 2v1 , v2) is the third-order NLO suscepti-bility for the pump–probe interaction. Equations (5) and(8) can be used to calculate the intensity output from theKerr shutter:
Itrans~v2 ; t ! 5 h2~t !exp~2a2Lc!
3F 24p3L
l2n0~v2!h1~t !G2
sin2~2u2!
3 uxxyyx~3 ! ~2v2 ; v1 , 2v1 , v2!
1 xxyxy~3 ! ~2v2 ; v1 , 2v1 , v2!u2, (9)
where
h i 5 Iimaxpi~t !, (10)
Iimax is the maximum intensity attained by pulse i in the
sample, pi(t) is the temporal intensity profile of pulse inormalized to unit maximum, a2 is the linear-absorptioncoefficient at the probe wavelength (and we assume neg-ligible absorption at the pump wavelength), n0(v2) is therefractive index of the sample at the probe frequency,Lc is the length of the Kerr sample, and L is the pump–probe overlap distance in the sample. Figures 1 and 2show typical experimental results of angular- andintensity-dependence measurements, respectively, andtheir agreement with Eq. (9). For all experiments
Fig. 1. Dependence of the measured optical Kerr intensity onthe angle u between the pump and the probe polarization vectors.(Statistical error bars are smaller than marker size.)
Fig. 2. Quadratic intensity dependence of the optical Kerr effectsignal of nitrobenzene. The solid curve is a fit of the functionIOKE /Iprobe 5 aIpump
2 to the data.

S. R. Vigil and M. G. Kuzyk Vol. 18, No. 5 /May 2001/J. Opt. Soc. Am. B 681
reported here the angle between the pump and the probepolarizations was kept at 45° for maximum signal.
We note in Eq. (9) the time t appearing on the left-handside and in the pump and the probe intensities on theright-hand side. Its omission from the susceptibilityterms implies an instantaneous susceptibility response tothe pump field. If the third-order susceptibility responseof the material is not instantaneous on the pump or theprobe pulse’s time scale, the result is a convolution of thepulse profiles and the temporal response function of thesusceptibility.9,10 Since the ;2-ps11 reorientational re-sponse time of the CCl4 solvent is short compared withthe 35-ps pump and 24-ps probe pulses, we assume an in-stantaneous response from the solvent. As we will seelater, the response of the dyes in solution is well modeledby a purely electronic (i.e., instantaneous) response de-scribed by the third-order molecular susceptibility12
g ijkl~2v; v1 , v2 , v3! 5e4
4\3 (a,b,c51
3
dv, v1 1 v2 1 v3
3 H(8mnn
^xi&gm^xj&mn^xk&nn^xl&ng
~Vmg 2 vc 2 vb 2 va!~Vng 2 vb 2 va!~Vng 2 vc!1
^xi&gm^xj&mn^xk&nn^xl&ng
~Vmg* 1 vc!~Vng 2 va 2 vb!~Vng 2 va!
3^xi&gm^xj&mn^xk&nn^xl&ng
~Vmg* 1 va!~Vng* 1 va 1 vb!~Vng 2 vc!1
^xi&gm^xj&mn^xk&nn^xl&ng
~Vmg* 1 va!~Vng* 1 va 1 vb!~Vng* 1 va 1 vb 1 vc!
2 ( 8mn
^xi&gm^xj&mg^xk&gn^xl&ng
~Vmg 2 vc 2 vb 2 va!~Vmg 2 vc!~Vng 2 va!1
^xi&gm^xj&mg^xk&gn^xl&ng
~Vmg 2 vc!~Vng* 1 vb!~Vng 2 va!
3^xi&gm^xj&mg^xk&gn^xl&ng
~Vmg* 1 va 1 vb 1 vc!~Vmg* 1 vc!~Vng* 1 va!1
^xi&gm^xj&mg^xk&gn^xl&ng
~Vmg* 1 vc!~Vng 2 vb!~Vng* 1 va!J , (11)
where $i, j, k, l% 5 $x, y, z%, e is the electronic charge, xis the position operator, Vmg is the (angular) transitionfrequency between state m and the ground state, va is anincident-field frequency, and ^xj& lm 5 ^xj& lm 2 ^xj&gg .The prime in both summation terms indicates the sum-mation is only over the excited states $m,n,n% (i.e., theground state is excluded). Equation (11) clearly shows adependence on those states accessible directly from theground state (double summation) and those that passthrough an intermediate state to reach the final excitedstate from the ground state (triple summation).
Equation (11) is calculated in the dipole approximationby applying the method of averages13,14 to the time-dependent perturbation solution of the Schrodinger equa-tion. The expression also allows for the inclusion ofdamping phenomena in a phenomenological manner byallowing the transition frequencies Vmg to be complex.In the case of homogeneous Lorentzian broadening thetransition frequency is given by
Vmg 5 Vmg0 2 iGm , (12)
where Vmg0 is the real transition frequency between the
ground level, g, and the excited level, m, and Gm is the
linewidth of the transition. It is important to note thatthe choice of the negative sign in the definition of the com-plex transition frequency is not arbitrary. The sign isbound by causality to be negative.15 Furthermore, in or-der to compare the molecular quantity g ijkl , whose Car-tesian indices in Eq. (11) refer to a molecule-fixed frame,to bulk measurements described by xIJKL
(3) , it is trans-formed to the lab frame by an orientational average fromwhich a bulk response can be calculated by applying theappropriate local-field factors.7
3. EXPERIMENTA. ApparatusFigure 3 shows a detailed schematic of the apparatus weuse to perform our OKE experiments. The laser provid-ing the pump pulse is a Continuum PY61-series active–
passive mode-locked system producing 30-mJ, 35-ps(FWHM) pulses at a rate of 10 Hz from Nd:YAG lasingmedia. The lasing wavelength is 1064 nm. The probepulse is provided by an optical parametric generator/amplifier (Continuum Mirage OPG-OPA) based on a de-sign and analysis reported by Zhang et al.16 The OPG-OPA output is tunable from 440 nm to 2000 nm. Only itsvisible output was used in these experiments.
After exiting the laser, the fundamental and thesecond-harmonic light generated exterior to the oscillatorpasses through a colloidally colored glass filter (SchottRG-715) that absorbs both the second-harmonic and theflashlamp light with an extinction ratio of greater than1025 and transmits greater than 90% of the energy at1064 nm. Because the fundamental and the second-harmonic pulses are not exactly collinear, any second-harmonic light that makes it through the filter eventuallybecomes spatially separated enough from the fundamen-tal that it removes itself from the experimental beampaths. Typical pump energies at the entrance to theKerr cell are of the order of 100 mJ/pulse, whereas probeenergies are of the order of 100 nJ/pulse.
A polarizer–half-wave-plate–polarizer (PHP) attenua-

682 J. Opt. Soc. Am. B/Vol. 18, No. 5 /May 2001 S. R. Vigil and M. G. Kuzyk
tor both controls the pump intensity incident on the Kerrsample and ensures that the pump pulse is linearly polar-ized. After passing through the attenuator, the pumppulse proceeds along a delay line composed of a prismmounted on a stepping-motor-controlled translationstage. This delay line is used to optimize the temporaloverlap of the pump and the probe pulses in the Kerrsample. The half-wave plate after the PHP attenuator isused in conjunction with a polarizing beam splitter fur-ther downline to adjust the distribution of the pump en-ergy between the two arms of the experiment. After thishalf-wave plate, the pump pulse passes through an irisdiaphragm to provide gross spatial filtering of the trans-verse intensity profile. Finer spatial filtering is accom-plished by passing the pulse through a 1:1 telescope. Af-ter the telescope, the pump pulse is split in two by theaforementioned polarizing beam splitter, with the indi-vidual pulses now traveling in the separate arms of theexperiment. After splitting, each pulse passes throughone more half-wave plate that is used to adjust the anglebetween the polarization vectors of the linearly polarizedpump and probe pulses. To provide a measure of thepump intensity incident on the sample, a glass slideplaced at a small angle of incidence with respect to thepump-pulse wave vector reflects a small amount of pumplight to a high-speed silicon photodiode photodetector(Thorlabs DET2-Si). The spatial overlap of the pumpand probe pulses at the sample position is optimized byadjustment of the final pump-steering prism. After pass-ing through the sample, the pump pulse ends its journeyin an absorptive beam dump.
The low-intensity probe pulse is steered by BK-7prisms and mirrors. After exiting the OPG-OPA bench,the probe pulse is steered through an iris diaphragm thatselects the central portion of the beam and partially colli-mates it. (The signal output from an OPG-OPA crystal oflength L pumped by a beam of radius r has a beam diver-gence with a solid angle DV ; pr2/L2.16,17 While anOPG-OPA system can effectively reduce the beam diver-gence of the output,16,18,19 the beam divergence from theContinuum OPG-OPA was large enough that collimating
Fig. 3. Schematic of the optical Kerr effect measurement appa-ratus: GLP, Glan-Laser polarizer; HWP, half-wave plate (1064nm); PBS, polarizing beam splitter; PD, silicon photodiode; PHP,polarizer–half-wave plate–attenuator; PMT, photomultipliertube; Pol., polarizer; SF, spatial filter.
the probe light with a pair of iris diaphragms in each armwas required.) The probe pulse then passes through aGlan-Laser (i.e., air-spaced) calcite polarizer to improveits polarization purity. This polarizer can also be manu-ally rotated to provide coarse intensity control of theprobe pulse. The probe pulse is then split by a nonpolar-izing beam splitter, and each pulse proceeds into its re-spective measurement arm. In a measurement arm theprobe pulse passes through and is recollimated by a sec-ond iris diaphragm stopped to its minimum diameter(;0.5 mm). (Figure 4 shows contour maps generated fromCCD camera images of typical transverse spatial profilesof the pump and the probe pulses at the Kerr-cell positionand a comparison of the pump and the probe pulse sizes.)The probe pulse then passes through another Glan-Laserpolarizer, placed a couple of feet downline, that fixes thepulse’s linear polarization state. Uncoated Glan-Lasercalcite polarizers (Karl Lambrecht, MGLA-SW) were usedin this experiment because of their high extinction ratio(greater than 106), low-frequency dispersion, and widetransparency range (at least 215–1060 nm). In order tomonitor the probe-pulse energy, a glass slide placed be-tween the iris diaphragm and polarizer at a small angle ofincidence reflects a small portion of the probe-pulse en-ergy to a high-speed silicon photodiode detector (ThorlabsDET1-Si). After the polarizer, the probe pulse impingeson the Kerr cell in which the OKE interaction with thepump within the sample medium changes the probepulse’s polarization from linear to elliptical. The cross-ing angle between the pump and the probe pulses is ap-proximately 52 mrad (3°). The change in the probepulse’s polarization is analyzed by a final Glan-Laser cal-
Fig. 4. Spatial intensity profiles of pump (left) and probe (right)pulses at the Kerr-cell position. The bottom graph shows dataand a fit to a Gaussian profile exp(2x2 /2x0
2) through a diameterof each profile. Pump FWHM 5 0.92 mm; probe FWHM5 0.36 mm.

S. R. Vigil and M. G. Kuzyk Vol. 18, No. 5 /May 2001/J. Opt. Soc. Am. B 683
cite polarizer (the analyzer) whose transmission axis isoriented perpendicular to the probe pulse’s polarizationwhen no pump light is incident upon the sample. Thelight making it through the analyzer is detected by ahigh-gain, low-noise photomultiplier tube (Burle ElectronTubes, C31034A-02) capable of counting single photons.
Because the Kerr experiment detects changes in the po-larization state of the probe light, and because, in gen-eral, this polarization change is quite small, it is of thehighest importance to minimize effects that depolarizethe probe light when no pump light is incident upon thesample. For example, in typical spectrophotometer cellsmade of optical-quality glass windows fused to a glassbody, the intrinsic stress birefringence of the transmis-sion windows caused a probe depolarization large enoughto saturate the detection system. For this and for rea-sons of simplicity and convenience in sample preparationand handling, measurements were attempted on solidsamples of poly(methyl methacrylate) (PMMA), both neatand doped with organic dyes. Experiments were at-tempted with two types of samples, solutions of organicdye and PMMA spin coated onto low-birefringence fused-silica windows, and bulk samples of dye-doped PMMAmade in the laboratory. For both types of samples thedepolarization background from the samples was too highto permit OKE measurements. Because of the unaccept-able depolarization background of the spectrophotometercells and polymer samples, a custom liquid sample cell in-corporating high-quality, 2.5-mm-thick fused-silica win-dows (Corning 7940/7980, Grade 0A, United Lens Com-pany) was designed, fabricated, and used as the Kerrsample cell.7
B. Data CollectionThe various photon fluxes from each arm of the experi-ment (pump energy, probe energy, and Kerr signal) foreach laser shot are converted into electrical currents byeither silicon photodiodes or photomultiplier tubes. Eachdetector signal is sent to one of the 11-bit (;1980 counts)channels of a 12-channel, gated, charge-sensitive(current-integrating), computer-automated measurementand control (CAMAC) analog-to-digital converter (ADC)(LeCroy 2249W). The ADC integrates charge pulsesfrom the detectors only when an external gate pulse is ap-plied to it. The external gate is a 200-ns transistor-transistor-logic pulse supplied by a digital delay/pulsegenerator (Stanford Research Systems DG535) triggeredby a photodiode that monitors the reflection from the RG-715 filter placed immediately outside the laser bench (Fig.3). Owing to an intrinsic 85-ns delay between the trig-gering of the DG535 and the initiation of the gate pulse,delays in the pump, probe, and OKE signals arriving atthe ADC are introduced by means of long (;21–28 m)coaxial-cable delay lines connecting the detectors to theADC. This results in a measured signal attenuation ofapproximately 1 dB. Before experiments are performed,an oscilloscope is used to display the gate and detectorpulses to ensure that the detector pulses are fully con-tained within the gate pulse applied to the ADC. Thedata in the registers of the ADC are read after each lasershot by a LeCroy 8901A CAMAC-to-GPIB (general-purpose interface bus) interface plugged into the control
station of a CAMAC mainframe (LeCroy 8013A). The8901A interface is queried and transfers the data by aGPIB cable to a 100-MHz Pentium personal computer(PC). The PC runs a LabVIEW 4.0 virtual instrumentthat controls the stepper motors and the 8901A interface.Data from each laser shot are stored for later analysis.
C. Data AnalysisIn order to calculate absolute x (3) values, we need to re-late the numbers read from the ADC to the total light en-ergy that they represent. Each detector produces a cur-rent pulse
i~t ! 5 Rdet~l!E E R~t, t8!I~t8!dAdt8, (13)
where Rdet(l) describes the detector’s spectral responsiv-ity having dimensions of electric current/light power,R(t, t8) is the detector temporal response function, I(t) isthe pulse’s temporal intensity profile, and the area inte-gration is over the active area of the detector (which inthese experiments encompasses the pulse’s entire trans-verse spatial profile). The current pulse is integrated bythe ADC and digitized, producing a number
NADC 51
RADCE
2Dt/2
Dt/2
i~t !dt, (14)
where RADC is the responsivity of the ADC channel hav-ing dimensions of charge/count, and Dt is the ADC tem-poral gate width. If the ADC’s gate width in Eq. (14) iswide enough to contain the current pulse described by Eq.(13), there is a simple relationship between total pulse en-ergy and the number of ADC counts it produces:
NADC 5Rdet~l!
RADCE~l! 5 RADC8 ~l!E~l!, (15)
where RADC8 (l) is the responsivity of the ADC detectorsystem having dimensions of counts per unit energy, andE(l) is the total pulse energy.
Each of the two arms in the experiment has three ADCchannels: one channel measures the Kerr signal NPMT ,the second monitors the pump energy Npump , and thethird monitors the probe energy Nprobe . Autocorrelationand cross-correlation measurements, to determine thetemporal profiles of the pump and the probe pulses,7 andCCD imaging of their spatial intensity profiles (Fig. 4),show that they are well approximated by Gaussian tem-poral and spatial profiles:
Ipulse~r, t ! 5 I0 exp~2r2/2rpulse2 !exp~2t2/2tpulse
2 !, (16)
where I0 is the maximum pulse intensity, and rpulse andtpulse are the pulse spatial and the temporal Gaussianstandard deviations, respectively. Knowledge of thepulse profiles allows us to integrate Eq. (9) and solve it forthe OKE susceptibility

684 J. Opt. Soc. Am. B/Vol. 18, No. 5 /May 2001 S. R. Vigil and M. G. Kuzyk
uxxyyx~3 ! ~v2! 1 xxyxy
~3 ! ~v2!u2
5 72p5 exp~a2Lc!F cl2n0~v2!
L G2
3 r12~r1
2 1 2r22!At1
2~t12 1 2t2
2!NPMTR28R18
2
N2N12RPMT8
, (17)
where we have used Eq. (15) and the results
E2`
` E0
2pE0
`
I2~r, t !I1~r, t !2rdrdudt
5 I20~I1
0!2t1t2A 8p3
t12 1 2t2
2S r12r2
2
r12 1 2r2
2D , (18)
E2`
` E0
2pE0
`
Ii~r, t !rdrdudt
5 A8p3Ii0tiri
2 5 Ei , (19)
where Ei is the total energy contained in pulse i.A single data point appearing, for example, in Figs. 7
and 8 (described later) is calculated according to the fol-lowing prescription: The ADC signals from the pump,probe, and signal detectors for 900 consecutive laser shotsare read and stored. The absolute OKE x (3) value foreach shot is calculated from Eq. (17), and the centroid ofthe expected Poissonian distribution (Fig. 5) of the 900shots is calculated and taken as the representative valueof uxOKE
(3) u for the given experimental configuration. Addi-tionally, in order to account for systematic drift in themeasurement apparatus, the points in the OKE disper-sion data that we present are averages of points calcu-lated as just described, taken at the same wavelengths onthree consecutive days.
4. RESULTSA. Absolute MeasurementsWe measured the absolute value of the OKE third-ordersusceptibility,
Fig. 5. Histogram of a 900-shot Kerr-signal experiment display-ing a Poissonian distribution.
uxOKE~3 ! u 5 uxxyyx
~3 ! 1 xxyxy~3 ! u, (20)
for neat solutions of nitrobenzene (C6H5NO2), carbon tet-rachloride (CCl4), and methyl-methacrylate (MMA)monomer. The measurements on nitrobenzene and car-bon tetrachloride allow for calibration of the apparatus bycomparison with previously published results. The mea-surements on MMA were performed in order to determineif it had a smaller x (3) response than CCl4. To the best ofour knowledge, this is the first time the OKE response ofMMA has been measured. Time-resolved measurementsperformed on a sample of polymerizing MMA, which has amore rigid structure in which reorientation should beminimal, showed no appreciable decrease in the OKE sig-nal (610% in x (3)), indicating an appreciable electroniccontribution to MMA’s third-order NLO response. Table1 compares the results obtained in these experimentswith previously measured values. The temporal re-sponses of both the CCl4 and the MMA were nearly in-stantaneous on the pulse time scale used, whereasnitrobenzene exhibited the well-documented20 reorienta-tional response with a decay time of approximately 35 ps.
B. Resonant Optical Kerr Effect DispersionMeasurementsThe relatively wide temporal pulse widths produced byour laser system make dispersion measurements morelikely to yield the most information about the samples un-der study. OKE dispersion measurements were per-formed on solutions of neat CCl4, 5 3 1015 mL21 indolesquarylium (ISQ) in CCl4, and 2 3 1015 mL21 silicon-phthalocyanine monomethacrylate (SiPc-MMA) in CCl4 inthe (visible) resonant absorption region of the two dyes inorder to determine the nature of their molecular third-order NLO response. Figure 6 shows the structures ofthe ISQ and SiPc-MMA dyes. These measurements wereperformed with the pump and the probe pulses both spa-tially and temporally coincident on the sample. Tempo-ral coincidence is achieved by adjusting the pump delay tomaximize the signal for a sample with a very strong, fastresponse: carbon disulfide (CS2).
9 The frequency re-sponse of the OKE signal is measured by tuning the OPG/OPA to obtain different probe colors and by use of Eq. (17)to calculate the absolute third-order susceptibilityuxOKE
(3) (2vprobe ;vpump , 2vpump ,vprobe)u at each color.In measurements of dye-doped liquid solutions the
measured signal is due to both the solute (dye) and thesolvent response. To describe the total third-order re-sponse of this binary solution, we model the solution as a
Table 1. Comparison of AbsolutexOKE
(3) Measurements
Material
uxOKE(3) u (10214 cm3/erg)
Earlier Research This Researcha
C6H5NO2 15b 9.25 6 0.33CCl4 0.6c 0.095 6 0.01MMA – 0.77 6 0.072
a Pump, 1064 nm, 35 ps; Probe, 550 nm, 25 ps.b Pump, 1064 nm, 35 ps; Probe, 500 nm, cw.8c Pump, 1064 nm, 10 ps; Probe, 532 nm, 9 ps.20

S. R. Vigil and M. G. Kuzyk Vol. 18, No. 5 /May 2001/J. Opt. Soc. Am. B 685
system in which the solute and the solvent molecules donot interact with each other. In this case the third-ordersusceptibility can be written simply as21,22
x~3 ! 5 xsolute~3 ! 1 xsolvent
~3 ! . (21)
This is the x (3) that appears in the expression for thepump–probe OKE signal in Eq. (17). Although the mo-lecular third-order response of the approximately spheri-cally symmetric carbon tetrachloride solvent molecule issmall, because its number density in the liquid phase is somuch greater than that of the dyes ('6.24 3 1021 mL21
compared with ;1015 mL21 for the dyes), its contributionto the bulk third-order response of the solution is not neg-ligible. As such, it is necessary to perform dispersionmeasurements on a neat solvent sample in order to deter-mine the solvent’s contribution to the solution’s OKE sig-nal. In addition to providing information about the sol-vent contribution, measurement of the neat solvent signalalso allows for referencing of the solution measurementsat each wavelength. As long as the dispersion of themeasurement apparatus itself is not too large, this kind ofreferencing accounts for any systematic dispersion in themeasurement apparatus and relatively long time-scalefluctuations in experimental conditions. The reproduc-ibility of the results for each of the three separate runsfrom which the OKE spectra that we present are calcu-lated is the justification for the use of this type of refer-encing. The referencing method used yields an experi-mentally measured OKE spectrum of the form
S~2v2 ;v2 , v1 ,2v1! 5uxsoln.
~3 ! u2
uxCCl4~3 ! u2
5
uxdye~3 ! 1 xCCl4
~3 ! u2
uxCCl4~3 ! u2
,
(22)
where we use Eq. (17) to solve for the absolute square ofthe bulk third-order OKE susceptibility of the sample.Our measurements show negligible dispersion in theOKE spectrum of neat CCl4 in the range of interest.7
Therefore the frequency dispersion in Eq. (22) is duesolely to frequency dispersion in the response of the sol-
Fig. 6. Chemical structure and molecular coordinate system ofISQ (top) and SiPc-MMA (bottom).
ute, where we set xCCl4(3) 5 9.51 3 10216 cm3/erg as deter-
mined from measurements of neat CCl4 solutions.The OKE spectrum described by Eq. (22) is calculated
by use of Eq. (11) to calculate the third-order molecularsusceptibility spectrum g of the chromophore, orientation-ally averaging the result,7 and calculating the x (3) of thedye in solution by use of molecular additivity. Both ISQand SiPc-MMA are centrosymmetric (neglecting the out-of-plane components of the SiPc-MMA). Our analysistreats the ISQ molecule as one dimensional and SiPc-MMA as two dimensional, which yields different resultsin the orientational average. The individual energyeigenstates n used in the sum-over-states (SOS) calcula-tion are completely specified by providing the informationshown in Table 2. The measured OKE spectrum is fit byby applying a least-squares fitting criterion to a fit of Eq.(22) to the data.
The energy eigenstates of the dye molecule are ob-tained in two ways. First, the known one-photon eigen-states of the molecule are obtained from the linear-absorption spectrum23
aabs~v! 5 A2k0@2R$e0~v!% 1 ue0~v!u#1/2, (23)
where k0 is the vacuum wave vector of the incident radia-tion, and e0(v) 5 1 1 4px (1)(v). The calculation of theone-photon states, i.e., those states that can be accesseddirectly from the ground state, follows along the samelines as the calculation of the OKE spectrum previouslydescribed. The first-order molecular susceptibility is cal-culated with states obtained by fitting the linear-absorption spectrum. The transition frequency and line-width can be estimated by visual inspection of theposition of each peak and its associated peak width in theabsorption spectrum. The first-order molecular suscepti-bility is calculated and used to obtain the complex first-order bulk susceptibility x (1), which is substituted intoEq. (23) to compute the linear-absorption spectrum. Thetransition moments mmg are varied in a least-squares fitto the absorption spectrum. In order to optimize the fitsthe peak positions and widths are also slightly varied, butthe most-significant fit parameters are the transition mo-ments.
Additional energy eigenstates, particularly the two-photon states, may be needed to obtain a better fit to theOKE spectrum. These two-photon states are oftenhigher-lying states that are not directly probed by themost common experiments.24,25 When calculating theOKE spectrum of Eq. (22), the parameters describing theone-photon states obtained from the best fit to the linear
Table 2. Parameters Necessary for Specifying anExcited Stationary State in the Sum-Over-States
Calculation of Molecular Susceptibilities
$mnm% Transition moments between stationary state n andall other stationary states $m%, where $m% includesthe ground state.
Vng Transition frequency between stationary state n andthe ground state.
Gng Linewidth of the transition between stationary staten and the ground state.

686 J. Opt. Soc. Am. B/Vol. 18, No. 5 /May 2001 S. R. Vigil and M. G. Kuzyk
absorption spectrum are kept fixed, and the parametersdescribing the postulated two-photon states are varieduntil the fit is optimized. In nonlinear optics it is rare fora single experiment to unequivocally determine particu-lar molecular excited states. This is also true of the OKEexperiment. When fitting the theory to the data, onemust be guided by earlier research and the reasonable-ness of the states obtained.
Figures 7 and 8 show the measured linear-absorptionand OKE spectra derived by applying Eq. (22) to the datafor the ISQ and SiPc-MMA solutions. (Carbon tetrachlo-ride is a clear liquid, and its contribution to the linear-absorption spectrum is negligible over the region studied.)The figures also show the best fits to the linear-absorptionspectra, which yield the parameters of the one-photonstates of the dyes.
It is apparent that the SiPc-MMA dye has a nonlinearsusceptibility that is opposite in sign to the solute nearthe absorption peak, whereas the nonlinear response ofthe ISQ has the same sign. As can be seen in Figs. 7 and
Fig. 7. Measured optical Kerr effect dispersion of a5 3 1015/mL ISQ:CCl4 solution (left ordinate). The measuredmolecular linear-absorption cross section and the calculated two-level best fit to it are also shown (right ordinate).
Fig. 8. Measured optical Kerr effect dispersion of a2 3 1015/mL SiPc-MMA:CCl4 solution (left ordinate). The mea-sured molecular linear-absorption cross section and the calcu-lated four-level best fit to it are also shown (right ordinate).
8, the structure in the OKE spectrum occurs in the sameregion as it does in the linear-absorption spectrum.While it may not be too surprising that the OKE and thelinear-absorption spectra have similar structure, the re-sults of a detailed SOS analysis of the OKE spectra ofboth the ISQ and SiPc-MMA solutions show that it is nec-essary to include higher-lying two-photon states to obtaingood agreement between the third-order susceptibilitytheory and the data for both dyes.
Figures 9 and 10 show the measured OKE spectra de-scribed by Eq. (22) and two calculated OKE spectra. Inboth figures the poorly fitting spectrum is that calculatedby substituting only the one-photon states derived fromthe linear-absorption spectrum into the SOS expressionfor g. In both cases it is clear that the one-photon statesare not sufficient to describe the dyes’ third-order re-sponse. The better-fitting curves in Figs. 9 and 10 incor-
Fig. 9. Measured OKE spectrum (large dots), spectrum calcu-lated from the single one-photon state, and the best-fit spectrum,obtained by the four-level model consisting of the singleone-photon state and two two-photon states given in Table 3, of a5 3 1015/mL ISQ:CCl4 solution. The pump wavelength is 1064nm.
Fig. 10. Measured OKE spectrum (large dots), spectrum calcu-lated from the three one-photon states, and the best-fit spectrum,obtained by a seven-level model consisting of the three one-photon states and three two-photon states as given in Table 4, ofa 2 3 1015/mL SiPc-MMA:CCl4 solution. The pump wavelengthis 1064 nm.
S. R. Vigil and M. G. Kuzyk Vol. 18, No. 5 /May 2001/J. Opt. Soc. Am. B 687
porate into the SOS calculation higher-lying two-photonstates that couple to the known one-photon states.
1. Indole SquaryliumEarly measurements on squaraine dyes,26 and ISQ in par-ticular, indicated that they had comparatively large third-order molecular susceptibilities. In particular, thesquarylium dyes (a class of zwitterionic polymethinedyes), of which ISQ is one, are interesting because of theirlarge transition moments and their relatively narrowlinewidths, which probably account for their large third-order molecular susceptibility.24,26 X-ray analysis ofsquarylium structures indicates extensive electron delo-calization and a low bond-length alternation (where bondlength is defined as the difference between the averagelength of carbon-carbon single and double bonds in thepolymethine chain).27 It is thought that this low bond-length alternation results in a negative value for g.28
Earlier theoretical investigations of one-dimensional cen-trosymmetric molecules also predicted they might havenegative values of g.12
The first state listed in Table 3 shows the parametersfor the single excited state that provides the best fit to themeasured linear absorption in Fig. 7. The measuredlinear-absorption spectrum exhibits the characteristicmain peak and the interesting but poorly understoodhigher-lying (in energy) shoulder that is probably indica-tive of vibronic levels or possibly due to dimers andtrimers.29 Because the one-photon states provided a poorfit to the measured OKE spectrum, two two-photonstates, whose parameters are shown in the last two rowsof Table 3, were added to the energy-level description tomore accurately characterize the OKE spectrum.
2. Silicon Phthalocyanine-MonomethacrylateA MMA moiety is attached to one end of the SiPc chro-mophore. This is done to increase the generally poorsolubility of SiPc in MMA30 to attain a higher concentra-tion of the chromophore in solid poly(methyl methacry-late) (PMMA) solutions by its chemically reacting withthe polymer to form a copolymer during PMMA polymer-ization (provided the chromophore concentration is not sohigh that it interferes with the polymerization process).Among the most important properties that make SiPc po-tentially attractive for use in NLO devices are its thermo-dynamic stability and its unusual stability underexposure to electromagnetic radiation.30–32 The phthalo-cyanine ring is also extensively conjugated (which is a
Table 3. Best-Fit One- and Two-Photon (Italic)Excited-State Parameters Used to Calculate the
ISQ OKE Spectrum of Fig. 9a
State (n) Vng (eV), (nm) Gng (meV)
1 1.872, (662) 38.7
m 5 F7.01
0 3
0 6.3G2 2.090, (593) 71
3 3.325, (373) 53
a In fitting the OKE spectrum the one-photon excited-state parametersare not varied from the values determined from the linear-absorptionspectrum of Fig. 7. (See Appendix A for an explanation of the dipole-moment operator m.)
hallmark of organic dyes1), potentially making itnonlinear-optically responsive.26 Because the majority ofthe conjugation occurs in the plane defined by the porphy-rin skeleton, we treat the molecule as two dimensional inour analysis.
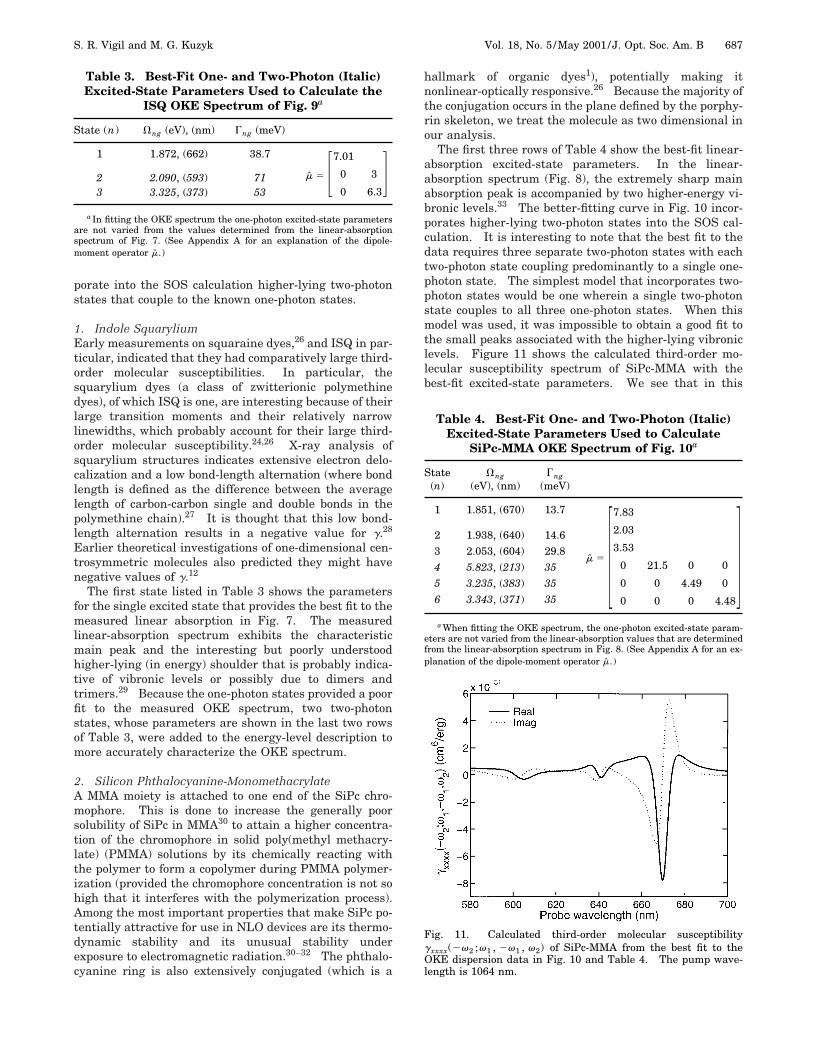
The first three rows of Table 4 show the best-fit linear-absorption excited-state parameters. In the linear-absorption spectrum (Fig. 8), the extremely sharp mainabsorption peak is accompanied by two higher-energy vi-bronic levels.33 The better-fitting curve in Fig. 10 incor-porates higher-lying two-photon states into the SOS cal-culation. It is interesting to note that the best fit to thedata requires three separate two-photon states with eachtwo-photon state coupling predominantly to a single one-photon state. The simplest model that incorporates two-photon states would be one wherein a single two-photonstate couples to all three one-photon states. When thismodel was used, it was impossible to obtain a good fit tothe small peaks associated with the higher-lying vibroniclevels. Figure 11 shows the calculated third-order mo-lecular susceptibility spectrum of SiPc-MMA with thebest-fit excited-state parameters. We see that in this
Fig. 11. Calculated third-order molecular susceptibilitygxxxx(2v2 ;v1 , 2v1 , v2) of SiPc-MMA from the best fit to theOKE dispersion data in Fig. 10 and Table 4. The pump wave-length is 1064 nm.
Table 4. Best-Fit One- and Two-Photon (Italic)Excited-State Parameters Used to Calculate
SiPc-MMA OKE Spectrum of Fig. 10a
State(n)
Vng
(eV), (nm)Gng
(meV)
1 1.851, (670) 13.7
m 5 37.83
2.03
3.53
0 21.5 0 0
0 0 4.49 0
0 0 0 4.48
42 1.938, (640) 14.63 2.053, (604) 29.84 5.823, (213) 35
5 3.235, (383) 35
6 3.343, (371) 35
a When fitting the OKE spectrum, the one-photon excited-state param-eters are not varied from the linear-absorption values that are determinedfrom the linear-absorption spectrum in Fig. 8. (See Appendix A for an ex-planation of the dipole-moment operator m.)

688 J. Opt. Soc. Am. B/Vol. 18, No. 5 /May 2001 S. R. Vigil and M. G. Kuzyk
Table 5. Real Part of the Resonant and Nonresonant Third-Order Molecular Susceptibilitiesgxxxx(2v2 ;v1 , 2v1 , v2) of the Molecules Studied
MoleculeNumber Densitya
(1020 mL21)R@gxxxx
res #(10234 cm6/erg)
R@gxxxx1064#
(10234 cm6/erg)Response Time
(ps)
C6H5NO2 114 – 0.081 45 6 5MMA 57 – 0.014 ,20CCl4 62 – 0.0015 ,20ISQ 0.00005 1802 276 ,20SiPc-MMAb 0.00002 27880 72 ,20
a Number density of molecule in bulk solution from which molecular value g was derived.b Note for this centrosymmetric, two-dimensional molecule, gyyyy 5 gxxxx .
case the real part of g is negative in the resonant regions,which results in the flipping of the peaks in the fit to thebulk data.
We present in Table 5 a comparison of resonant andnonresonant values (calculated at 1064 nm) of the third-order molecular susceptibilities of the materials studiedin this research. Because the spectral response of theneat organic liquids was fairly flat, the values reported forthem are assumed to be nonresonant. The resonant val-ues for the dye molecules were taken from the peak of thecalculated third-order molecular susceptibility from thebest fit to their respective OKE spectra. A reasonable es-timate for the error in g for all reported values is 620%.
5. DISCUSSIONQuadratic electroabsorption3,4 (QEA) measurements ofthin films of ISQ- and SiPc-doped PMMA, and third-harmonic generation measurements34 of ISQ in methanol,have been performed in the same spectral region as theOKE measurements described here. In both the OKEand QEA experiments there is a fundamental differencebetween the measured and the calculated third-order mo-lecular susceptibility tensors of ISQ and SiPc-MMA. Thebest fit of the ISQ spectrum yields a positive value for thereal part of g in the resonant region, whereas the best-fitSiPc-MMA spectrum is obtained with the real part of gnegative (Figs. 11 and 12). The results of the best fit tothe OKE spectrum of the ISQ:CCl4 solution agree wellwith the state parameters obtained from fits to the afore-mentioned QEA4 and third-harmonic generationresults.34
Because of the paucity of nonlinear spectroscopic dataon the phthalocyanines, there is no information availableconcerning their two-photon states. Quadratic electroab-sorption (QEA) measurements of thin PMMA films ofSiPc-MMA have been performed in the same spectral re-gion as the OKE measurements described here.35 It isencouraging that the best-fit parameters for both experi-ments result in the real part of g being predominantlynegative in the measured spectral region.
There are at least two mechanisms that can contributeto the birefringence caused by the optical Kerr effect:molecular reorientation and electron-cloud distortion.Although both effects ultimately depend on motion ofelectrons in response to an electric field, the main differ-ence between them is that the relatively slow (approxi-mately picosecond time scale) molecular-reorientation pro-
cess is distinguished by the motion of the nuclei inresponse to the electronic motion, whereas electron-clouddistortion and reequilibration occurs before the nucleihave a chance to move (approximately femtosecond timescale). The many contributing mechanisms to the OKEare discussed extensively by Hellwarth.36 Since the re-orientational contribution depends on the first-order mo-lecular susceptibility a, this contribution to the OKEmight be particularly strong in the resonant-absorptionregion where these measurements are performed. Thereorientational contribution was modeled by taking a re-orientational average of the dipole moment7
pi 5 a ijEj 1 D3g ijklEjEkEl , (24)
Fig. 12. Calculated third-order molecular susceptibilitygxxxx(2v2 ;v1 , 2v1 , v2) of ISQ from the best fit to the OKE dis-persion data in Fig. 9 and Table 3. The pump wavelength is1064 nm.
Table 6. Comparison of Data-Derived andTheoretical Maximum value of
lim(v1 , v2)\0gxxxx(2v2 ; v1 , Àv1 , v2)
for SiPc-MMA and ISQ
Molecule N
gxxxx(10234 cm6/erg)
Experimental gxxxx(v → 0) Theoretical gxxxxmax
SiPc-MMA 38 5.2 199ISQ 22 24.5 215.6

S. R. Vigil and M. G. Kuzyk Vol. 18, No. 5 /May 2001/J. Opt. Soc. Am. B 689
(where D3 is a degeneracy factor)37 with a Gibbs potentialorientational distribution function37
G~V, pmol~E!! 5 exp@2~p • E/kBT !#, (25)
where V is the triplet of Euler angles describing a mol-ecule’s orientation in the lab frame, kB is the Boltzmannconstant, and T is the absolute temperature. For bothdyes the results of this analysis yielded negligibly differ-ent calculated OKE spectra from those appearing in Figs.9 and 10. In performing the fits for both dyes, a free-gasmodel containing a purely electronic third-order responseresulted in the best fits in both cases. The purely elec-tronic response is at least in qualitative agreement withtime-response measurements performed on the dye-dopedliquid solutions. Femtosecond time-delay measurementswould be very helpful in further elucidating the responsemechanisms and interaction model.
Having established that the response we measure ispurely electronic, it is interesting to calculate the off-resonant value of gxxxx and compare it with the maximumlimit allowed by quantum mechanics. The maximum off-resonant third-order molecular susceptibility is givenby38,39
2e4\4
m2 S N2
E1g5 D < g0
max < 4e4\4
m2 S N2
E1g5 D , (26)
where N is the number of electrons in the molecule, andE1g is the transition energy to the first excited state.This result is general and independent of the molecule.
For conjugated systems, Kuhn showed that the numberof electrons participating in the excitation is approxi-mated by twice the number of double or triple bonds.40
For ISQ, N 5 22 and for SiPc, N 5 38 (or 42 if the oxy-gens are counted). Table 6 shows the off-resonant value[as calculated from the best-fit parameters in the limitlim(v1 , v2) → 0g (2v2 ;v1 , 2 v1 , v2)] and the maximumvalue of g calculated from Eq. (26), where we used thenegative maximum for ISQ and the positive maximumvalue for SiPc.
It is interesting to note that the calculated maximumvalues for both dyes are well below their respective theo-retical limits. We can explain why gSiPc ! gSiPc
max and gISQis within a factor of 4 of gISQ
max by understanding the sum-rule calculations. The calculations leading to Eq. (26)show that the largest nonlinear susceptibility resultswhen the system has only one dominant excited state.38,39
Since SiPc has more excited states, these states, by virtueof the sum rules, remove oscillator strength from thedominant state.
6. CONCLUSIONWe performed pump–probe optical Kerr effect measure-ments on the neat organic liquids nitrobenzene(C6H5NO2), CCl4, MMA, and squarylium and phthalocya-nine organic dyes in liquid solution in order to determinethe nature of their NLO response (e.g., whether it is elec-tronic, reorientational, or some combination of the two),the excited states contributing to the NLO response, andthe values of their molecular susceptibilities. Because of
the time resolution imposed by the pulse widths (;30 ps),we were not able to time resolve reorientational mecha-nisms in any of materials except nitrobenzene, althoughthe results of fitting the OKE spectra of the dyes indicatethe origin of their response is primarily electronic.
The results of OKE dispersion measurements per-formed on neat and dye-doped carbon tetrachloride solu-tions indicated the different nature of the molecular sus-ceptibility of the ISQ and SiPc-MMA dyes in the one-photon resonant region. The third-order molecularsusceptibility of SiPc-MMA is predominantly negative inthis region (Fig. 11), whereas that of ISQ is predomi-nantly positive (Fig. 12). (The physical reason, based onmolecular-structure differences, for this different re-sponse was not investigated.) For both dyes it is apparentthat the one-photon resonant states do not completely de-scribe the third-order electronic response in the one-photon resonant region. In both cases it is necessary toinclude higher-energy two-photon states to obtain reason-able fits to the data.
In the case of SiPc-MMA a seven-level model consistingof three one-photon and three two-photon states was usedto obtain the best fit to the OKE data. The nature of themodel was interesting in that each of the three postulatedtwo-photon levels coupled predominantly to their ownone-photon level. In the case of ISQ a four-level modelconsisting of a single one-photon state and two two-photon states, where each two-photon state coupled to theone-photon level, gave a good fit to the data and was con-sistent with two-photon states obtained in QEA4 andthird-harmonic generation experiments.34 The extrapo-lated off-resonant values of the measured values weresubstantially below the maximum values allowed byquantum mechanics, implying that much larger suscepti-bilities are possible for molecules of comparable size.
Whereas all-optical devices would typically not be usedin the one-photon resonant region, owing to the large lin-ear absorption, the knowledge of the states gained fromthese measurements can be applied to calculate the re-sponse at other wavelengths. Table 5 clearly shows thevery large third-order molecular response of the dyes withrespect to the other organic molecules. Results of thisnature will put to the test one of the major potential ad-vantages of organic materials, namely, the relative easewith which they can be functionalized to a given environ-ment. If it is possible to adapt strongly third-order mol-ecules to their environment in order to increase theirsolubility without significantly affecting their NLO re-sponse or linear figures of merit (e.g., linear absorption),the potential of organic nonlinear optics is nearly unlim-ited.
When designing molecular guest–host nonlinear-optical materials and devices, it is useful and desirable toknow the complete spectrum, both linear and nonlinear,and the response mechanisms of the molecules fromwhich the device will be made. This allows for the pre-diction of device performance with some confidence beforeexpending what is typically a considerable amount of timeand effort in synthesis. Nonlinear-optical measurementsand spectroscopic methods, like time-resolved OKE andOKE spectroscopy, allow the researcher to make suchmeasurements in a geometry that is similar to that which

690 J. Opt. Soc. Am. B/Vol. 18, No. 5 /May 2001 S. R. Vigil and M. G. Kuzyk
might be employed in many all-optical devices (i.e., astrong control beam controlling a weak signal beam).
Studies of nonlinear optical processes and devices areplaying an increasingly important role in both basic andapplied science. Organic and polymeric nonlinear opticalmaterials are steadily realizing the materials potentialfor applications that were foreseen years ago. Organicand polymeric systems are complex, and much more basicresearch is necessary to gain a better understanding oftheir response. This is especially crucial for findingnovel methods to overcome the upper limits of the nonlin-ear susceptibility. In addition, such an understandingwill allow for a more scientifically sound basis for theiruse, which must supplant trial-and-error approaches inorder to be useful in applications outside the laboratory.
APPENDIX A: TRANSITION-MOMENTMATRIXWe recall the definition of the transition moment betweentwo states:
mmn 5 e^muxun&, (27)
where e is the electronic charge, ^mu is the bra correspond-ing to the mth stationary state of the system, x is the po-sition operator, and un& is the ket corresponding to the nthstationary state of the system. From Eq. (27) we can con-struct a matrix representing the Hermitian operator m:
m 5 F m00 ..........................m10 m11 ....................m20 g21 m22 .............m30 m31 m32 m33 ........................................mn0 mn1 ... ... ... mnn
G . (28)
We have only indicated the lower triangular portion of theoperator because it is Hermitian. The first row corre-sponds to the ground-state transition moments of the sys-tem. The 00 term represents the permanent ground-state dipole moment. (This is true of the diagonalelements in general; i.e., the nn term corresponds to thedipole moment of excited state n.) The elements of thefirst column of the matrix describe the one-photon transi-tion moments between the ground state and the excitedstate indicated by the row index. This transition mo-ment is identically zero for pure two-photon states, sincedirect transitions between the ground state and pure two-photon states are not allowed. In general, the (m, n) el-ement of the matrix describes the transition moment be-tween states m and n.
In the specification of the operators in Tables 3 and 4we have left out the m00 term, since it is zero for boththese centrosymmetric molecules. Thus the transition-moment matrix appearing in the tables should be read
m 5 F m10 m11 ..............m20 m21 m22 .........m30 m31 m32 m33 ............................
mn0 mn1 ... ... mnn
G . (29)
The matrices presented in Tables 3 and 4 have only theunique nonzero elements. Zeros were placed in certainpositions for emphasis, for example, to emphasize whatstates are two-photon states, or simply to guide the eye.The complete transition-moment operators, as con-structed from the data appearing in Tables 3 and 4, wereused in the SOS calculations.
ACKNOWLEDGMENTSWe thank the U.S. Air Force Office of Scientific Researchfor their generous financial support of this research. Wealso thank J. Sounik for supplying the SiPc-MMA and C.Dirk for supplying the ISQ chromophores.
*Current address: P.O. Box 5800, Mail Stop 0328,Sandia National Laboratories, Albuquerque, NewMexico 87185-0328.
†Also with the Materials Science Program, WashingtonState University.
REFERENCES1. A. L. Sklar, ‘‘Theory of color of organic compounds,’’ J.
Chem. Phys. 5, 669–681 (1937).2. C. Poga, M. Kuzyk, and C. Dirk, ‘‘Quadratic electroabsorp-
tion studies of third-order susceptibility mechanisms indye-doped polymers,’’ J. Opt. Soc. Am. B 11, 80–91 (1994).
3. C. Poga, T. Brown, M. Kuzyk, and C. W. Dirk, ‘‘Character-ization of the excited states of a squaraine molecule withquadratic electroabsorption spectroscopy,’’ J. Opt. Soc. Am.B 12, 531–543 (1995).
4. K. S. Mathis, M. G. Kuzyk, C. W. Dirk, A. Tan, S. Martinez,and G. Gampos, ‘‘Mechanisms of the nonlinear optical prop-erties of squaraine dyes in poly(methyl methacrylate) poly-mers,’’ J. Opt. Soc. Am. B 15, 871–883 (1998).
5. G. Mayer and F. Gires, ‘‘Action d’une onde lumineuse in-tense sur l’indice de refraction des liquides,’’ C. R. Acad. Sci.258, 2039–2042 (1964).
6. M. A. Duguay and J. W. Hansen, ‘‘An ultrafast light gate,’’Appl. Phys. Lett. 15, 192–194 (1969).
7. S. R. Vigil, ‘‘Nonlinear optical studies of organic liquids andpolymer optical fibers,’’ Ph.D. dissertation (WashingtonState University, Pullman, Wash., 2000).
8. M. G. Kuzyk, R. A. Norwood, J. W. Wu, and A. F. Garito,‘‘Frequency dependence of the optical Kerr effect and third-order electronic nonlinear-optical processes of organic liq-uids,’’ J. Opt. Soc. Am. B 6, 154–164 (1989).
9. K. Sala and M. C. Richardson, ‘‘Optical Kerr effect inducedby ultrashort laser pulses,’’ Phys. Rev. A 12, 1036–1047(1975).
10. G. K. L. Wong and Y. R. Shen, ‘‘Study of pretransitional be-havior of laser-field-induced molecular alignment in isotro-pic nematic substances,’’ Phys. Rev. A 10, 1277–1284(1974).
11. B. I. Greene and R. C. Farrow, ‘‘Direct measurement of asubpicosecond birefringent response in CS2,’’ J. Chem.Phys. 77, 4779–4780 (1982).
12. M. G. Kuzyk and C. W. Dirk, ‘‘Effects of centrosymmetry onthe nonresonant electronic third-order nonlinear opticalsusceptibility,’’ Phys. Rev. A 41, 5098–5109 (1990).
13. B. J. Orr and J. F. Ward, ‘‘Perturbation theory of the non-linear optical polarization of an isolated system,’’ Mol.Phys. 20, 513–526 (1971).
14. N. N. Bogoliubov and J. A. Mitropolsky, Asymptotic Meth-ods in the Theory of Nonlinear Oscillations (Nauka, Mos-cow, 1948).
15. P. N. Butcher and D. Cotter, The Elements of Nonlinear Op-tics, Vol. 9 of Cambridge Studies in Modern Optics (Cam-bridge University Press, Cambridge, UK, 1990).
16. J. Y. Zhang, J. Y. Huang, Y. R. Shen, and C. Chen, ‘‘Opticalparametric generation and amplification in barium borate

S. R. Vigil and M. G. Kuzyk Vol. 18, No. 5 /May 2001/J. Opt. Soc. Am. B 691
and lithium triborate crystals,’’ J. Opt. Soc. Am. B 10,1758–1764 (1993).
17. B. Schroder, ‘‘Optical parametric amplification from quan-tum noise,’’ Opt. Quantum Electron. 15, 57–63 (1983).
18. J. Y. Huang, J. Y. Zhang, Y. R. Shen, C. Chen, and B. Wu,‘‘High-power, widely tunable, picosecond coherent sourcefrom optical parametric amplification in barium borate,’’Appl. Phys. Lett. 57, 1961–1963 (1990).
19. J. Y. Zhang, J. Y. Huang, Y. R. Shen, C. Chen, and B. Wu,‘‘Picosecond optical parametric amplification in lithiumtriborate,’’ Appl. Phys. Lett. 58, 213–215 (1991).
20. P. P. Ho and R. R. Alfano, ‘‘Optical Kerr effect in liquids,’’Phys. Rev. A 20, 2170–2187 (1979).
21. K. Kamada, M. Ueda, T. Sakaguchi, K. Ohta, and T. Fu-kumi, ‘‘Femtosecond optical Kerr dynamics of thiophene incarbon tetrachloride solution,’’ Chem. Phys. Lett. 249, 329–334 (1996).
22. S. Guha, C. C. Frazier, P. L. Porter, K. Kang, and S. E. Fin-berg, ‘‘Measurement of the third-order hyperpolarizabilityof platinum poly-ynes,’’ Opt. Lett. 14, 952–954 (1989).
23. J. Jackson, Classical Electrodynamics, 2nd ed. (Wiley, NewYork, 1982).
24. Q. L. Zhou, R. F. Shi, O. Zamani-Khamari, and A. F. Garito,‘‘Negative third-order optical responses in squaraines,’’Nonlinear Opt. 6, 145–154 (1993).
25. C. W. Dirk, L.-T. Cheng, and M. G. Kuzyk, ‘‘A simplifiedthree-level model describing the molecular third-order non-linear optical susceptibility,’’ Int. J. Quantum Chem. 43,27–36 (1992).
26. C. W. Dirk and M. G. Kuzyk, ‘‘Squarylium dye-doped poly-mer systems as quadratic electrooptic materials,’’ Chem.Phys. 2, 4–6 (1990).
27. C. W. Dirk, W. C. Herndon, F. Cervantes-Lee, H. Selnau, S.Martinez, P. Kalamegham, A. Tan, G. Campos, M. Velez, J.Zyss, I. Ledoux, and L. Cheng, ‘‘Squarylium dyes: struc-tural factors pertaining to the negative third-order nonlin-ear optical response,’’ J. Am. Chem. Soc. 117, 2214–2225(1995).
28. S. R. Marder, J. W. Perry, G. Bourhill, C. B. Gorman, B. G.Tiemann, and K. Mansour, ‘‘Relation between bond-lengthalternation and second electronic hyperpolarizability ofconjugated organic molecules,’’ Science 261, 186–189(1993).
29. S. Das, T. L. Thanulingam, K. G. Thomas, P. V. Kamat, andM. George, ‘‘Photochemistry of squaraine dyes. 5. Aggre-gation of bis(2,4-diydroxyphenl) squaraine and bis(2,4,6-trihydroxyphenyl) squaraine and their photodissociation inacetonitrile solutions,’’ J. Phys. Chem. 97, 13620–13624(1993).
30. C. W. Dirk, J. Bao, M. Kuzyk, and C. Poga, ‘‘Soluble phtha-locyanine silicone plastics and elastomers for nonlinear op-tics,’’ in Nonlinear Optical Properties of Organic MaterialsVII, G. R. Mohlmann, ed., Proc. SPIE 2285, 32–40 (1994).
31. P. P. Ho, N. L. Yang, T. Jimbo, Q. Z. Wang, and R. R. Al-fano, ‘‘Ultrafast resonant optical Kerr effect in4-butoxycarbonylmethylurethane polydiacetylene,’’ J. Opt.Soc. Am. B 4, 1025–1029 (1987).
32. M. K. Casstevens, M. Samoc, J. Pfleger, and P. N. Prasad,‘‘Dynamics of third-order nonlinear optical processes inLangmuir–Blodgett and evaporated films of phthalocya-nines,’’ J. Chem. Phys. 92, 2019–2024 (1990).
33. T. Sauer, W. Caseri, and G. Wegner, ‘‘Novel phthalocyaninepolymers for applications in optical devices,’’ Mol. Cryst.Liq. Cryst. 183, 387–402 (1990).
34. J. H. Andrews, J. D. V. Khaydarov, K. D. Singer, D. L. Hull,and K. C. Chuang, ‘‘Spectral dispersion of third harmonicgeneration in squaraines,’’ Nonlinear Opt. 10, 227–238(1995).
35. R. J. Kruhlak, ‘‘Characterization of molecular excited statesfor nonlinear optics,’’ Ph.D. dissertation (Washington StateUniversity, Pullman, Wash., 2000).
36. R. W. Hellwarth, ‘‘Third-order optical susceptibilities of liq-uids and solids,’’ Prog. Quantum Electron. 5, 1–68 (1977).
37. M. G. Kuzyk and C. W. Dirk, eds., Characterization Tech-niques and Tabulations for Organic Nonlinear Optical Ma-terials, Vol. 60 of Optical Engineering (Marcel Dekker, NewYork, 1998).
38. M. G. Kuzyk, ‘‘Physical limits on electronic nonlinear mo-lecular susceptibilities,’’ Phys. Rev. Lett. 85, 1218–1221(2000).
39. M. G. Kuzyk, ‘‘Fundamental limits on third-order molecularsusceptibilities,’’ Opt. Lett. 25, 1183–1185 (2000).
40. H. Kuhn, ‘‘A quantum-mechanical theory of light absorp-tion of organic dyes and similar compounds,’’ J. Chem.Phys. 17, 1198–1212 (1949).
Related Documents