Absence, Substitutability and Productivity: Evidence from Teachers Asma Benhenda Paris School of Economics November 2017 Abstract Worker absence is a frequent phenomenon but little is known on its effects on productivity nor on organizations’ strategies to cope with this temporary dis- ruptive event through substitute workers. Using a unique French administrative dataset matching, for each absence spell, each missing secondary school teacher to her substitute teacher, I find that the expected loss in daily productivity from teacher absences is on par with replacing an average teacher with one at the 15th percentile of the teacher value-added distribution. On average, tenured substitute teachers are able to compensate 37 % of this negative impact while contract substitute teachers do not have any statistically significant impact. Stu- dents in disadvantaged schools seem to be more sensitive to teacher absence and substitution than others. Contact: [email protected]. I am deeply grateful to my advisors Julien Grenet and Thomas Piketty for invaluable guidance and support. Part of this paper was conceived during my visit at Columbia University, I am grateful to Jonah Rockoff for very insightful feedback. I thank Joshua Angrist, David Autor, Ghazala Azmat, Raj Chetty, David Deming, Pascaline Dupas, Alex Eble, Albrecht Glitz, Marc Gurgand, Hilary Hoynes, Andrea Ichino, Rafael Lalive, Petra Persson, Imran Rasul, Randall Reback, Miika Rokkanen, Jesse Rothstein, Danny Yagan, Noam Yutchman and seminar participants at Paris School of Economics, the French Ministry of Education, and UC Berkeley for helpful comments. I also thank Catherine Moisan, Fabienne Rosenwald, Jean-Pierre Prudent, Caroline Caron and Pierrette Briant from the French Ministry of Education for help with the data. I acknowledge financial support from the Alliance Program of Columbia University. 1

Welcome message from author
This document is posted to help you gain knowledge. Please leave a comment to let me know what you think about it! Share it to your friends and learn new things together.
Transcript

Absence, Substitutability and
Productivity: Evidence from Teachers
Asma Benhenda *
Paris School of Economics
November 2017
Abstract
Worker absence is a frequent phenomenon but little is known on its effects
on productivity nor on organizations’ strategies to cope with this temporary dis-
ruptive event through substitute workers. Using a unique French administrative
dataset matching, for each absence spell, each missing secondary school teacher
to her substitute teacher, I find that the expected loss in daily productivity from
teacher absences is on par with replacing an average teacher with one at the
15th percentile of the teacher value-added distribution. On average, tenured
substitute teachers are able to compensate 37 % of this negative impact while
contract substitute teachers do not have any statistically significant impact. Stu-
dents in disadvantaged schools seem to be more sensitive to teacher absence and
substitution than others.
*Contact: [email protected]. I am deeply grateful to my advisors Julien Grenet and
Thomas Piketty for invaluable guidance and support. Part of this paper was conceived during my
visit at Columbia University, I am grateful to Jonah Rockoff for very insightful feedback. I thank
Joshua Angrist, David Autor, Ghazala Azmat, Raj Chetty, David Deming, Pascaline Dupas, Alex
Eble, Albrecht Glitz, Marc Gurgand, Hilary Hoynes, Andrea Ichino, Rafael Lalive, Petra Persson,
Imran Rasul, Randall Reback, Miika Rokkanen, Jesse Rothstein, Danny Yagan, Noam Yutchman
and seminar participants at Paris School of Economics, the French Ministry of Education, and UC
Berkeley for helpful comments. I also thank Catherine Moisan, Fabienne Rosenwald, Jean-Pierre
Prudent, Caroline Caron and Pierrette Briant from the French Ministry of Education for help with
the data. I acknowledge financial support from the Alliance Program of Columbia University.
1
1 Introduction
Worker absence is frequent in many countries. For example, in the United Kingdom,
the United States and France alike, every year, two to three percent of annual work time
is lost due to worker absence (DARES, 2013; UK Office for National Statistics, 2014;
US Bureau of Labor Statistics, 2016). Despite the importance of this phenomenon, em-
pirical evidence on the causal effect of worker absence on productivity is scarce.1 Even
much less is known on organizations’ strategies to cope with this temporary disruptive
event through worker substitution. When a worker is absent, how does it hurt her
productivity? How easily can organizations mitigate this effect with substitute work-
ers? Several major economic issues, from the impact of worker health and effort on
productivity (Curie and Madrian, 1999; Lazear and Oyer, 2012) to the analysis of spe-
cific human capital (Jacobson et al., 1993; Altonji and Williams, 2005; Gathmann and
Schonberg, 2010) and its relationship with worker substitutability (Stole and Zwiebel,
1996), depend on the answer to these questions.
I offer an empirical answer to these questions using a unique comprehensive admin-
istrative French panel dataset covering the 2007-2015 period and matching, for each
absence spell, each missing secondary school teacher to her substitute teacher. The aim
of this paper is to estimate, for Math, French and History ninth grade teachers and
their students: a) the effect of the number of days of teacher absence on student test
scores ; b) how this impact can be mitigated by the assignment of substitute teachers;
c) how the impact of substitute teachers depends on their type (tenured vs. contract
teachers).
Focusing on teachers to study worker absences is particularly relevant. First,
teacher absences represent a significant share of their working time: in France, teachers
are absent on average 7 % of the school year. Second, labor substitution is challenging
for teaching. It requires a high level of human capital: finding skilled teachers to work
as substitutes is a challenge because of the major teacher shortage experienced in many
developed countries 2. In France, there are not enough substitute teachers to cover all
absent days: around 25 % of them are not replaced. The probability of replacement
depends on the length of the absence spells and on the availability of substitute teach-
ers. Over the last ten years, less and less tenured substitute teachers were available to
cover absence spells. As a result, the government more and more resorts to contract
teachers, hired on the spot without training nor certification, to fill vacancies.
1To my best knowledge, there are only four papers covering this question: Miller et al (2008);Clotfelter et al. (2009); Duflo et al. (2012); Herrmann and Rockoff (2012)
2for more details, see Terrier, 2014 for France; Dee and Goldhaber, 2017 for the United States)
2

I identify the impact of the number of absence and replaced days by exploiting
variations within teachers/school, across years (teacher-school fixed effects). I perform
several specifications and robustness checks to confirm that the results are not driven
by a) reverse causality: teachers are more absent when assigned to low performing
students and it is more difficult to find quality substitution for this type of students;
b) the fact that absences are only a reflection of poor on-the-job teacher productivity;
c) or the fact that replaced absence spells are not comparable to non-replaced absence.
Based on the analysis of more than 100,000 teachers and three millions students,
I show that the expected loss in daily productivity from teacher absence is on par
with replacing an average teacher with one at the 15th percentile of the teacher value-
added distribution, which is consistent with the very few studies on this question
(Herrmann and Rockoff, 2012). The fraction of absence spell replaced does not have
any statistically significant compensating effect. However, when I make the distinction
between the two type of substitute teachers, I find that one additional replaced day
with a tenured substitute teacher (as opposed to a missed day at school) mitigates
37 % of the marginal impact of non replaced days. The marginal impact of a replaced
day with a contract teacher (as opposed to a missed day at school) is not statistically
significant. The heterogeneity analysis by length of absence spells suggests that the
number of replaced days have a statistically significant impact only for absence spells
longer than 30 days. Furthermore, the overall impact of one day of absence is 60 %
larger in disadvantaged schools than in non-disadvantaged schools. In disadvantaged
schools, tenured substitute teachers are able to compensate 45 % of the negative impact
of absence against only 29 % in non-disadvantaged schools.
These results have several implications. First, even if teacher absence in France
is less widespread than in developing countries, where teachers can miss up to 23 %
of annual school time (Abadzi, 2009), the negative impact of teacher absences is still
significantly large to be a worrying phenomenon. Second, whatever their type, substi-
tute teachers seem unable to mitigate the totality of the negative impact of absences on
student achievement. This might be due to the disruptive impact of absences: teaching
requires specific human capital which can be acquired only through prolonged and re-
peated interactions with students. This intuition is supported by the fact that replaced
days do not have any statistically significant impact for absence spells shorter than 30
days. This is the case whatever the type of substitute teacher, tenured or contract.
Finally, whatever the length of the absence spells, contract teachers are unable to sig-
nificantly mitigate the negative impact of absence, whereas tenured substitute teachers
seem to do a good job. This is a source of inefficiency as contract teachers represent,
3
overall, an ever growing share of the teaching workforce. It is also a source of educa-
tional inequality as substitution spells ensured by contract teachers are concentrated
in disadvantaged areas.
This paper contributes to several strands of the literature. First, it contributes to
the very small literature on the effect of worker absence on productivity (Miller et al.,
2008; Clotfelter et al., 2009; Duflo et al., 2012; Herrmann and Rockoff, 2012). This
literature focuses on teachers and finds that the expected loss in daily productivity
from teacher absence is on par with replacing a teacher of average productivity with
one at the 10th-20th percentile of productivity. One of the most important limitation
of this literature is that it does not provide any empirical evidence on the impact of
substitute teachers and the channels through which teacher absence affects students.
When a teacher is missing, her absence can impact her student through the loss of
instructional time (non replaced days) but also through the difference in general and
specific human capital between the missing teacher and the substitute teacher. This
paper is, to my best knowledge, the very first to analyze these channels.
Second, this paper contributes to the small literature on contract teachers, which
focuses on developing countries. The main paper on this question is Duflo et al.(2014),
which shows that, in Kenyan primary schools, contract teachers are more efficient than
regular teachers when their hiring is more closely monitored and they have higher
incentives to exert effort. The French context analyzed in this paper is very different
because the requirements to become a contract teacher are very low and contract
teachers do not seem to have higher incentives than regular teachers to exert effort.
Third, this paper contributes to an emerging empirical literature on worker substi-
tutability. Hensvik and Rosenqvist (2016) show that worker sickness absence is lower
in positions with few internal substitute. They interpret this finding as evidence that
firms try to keep absence low in positions with few internal substitute and that inter-
nal substitution insures firms against production disruptions caused by absence. Jager
(2016) provides more direct evidence of imperfect substituability between insiders and
outsiders. He analyzes the effect of unexpected worker deaths in the German private
sector and shows these worker exits on average raise the remaining workers’ wages and
retention probabilities. While these papers use wage and retention as proxies for worker
productivity, I measure it based on an actual and multidimensional output, student
outcomes. I can rely on an important literature which consistently finds teachers to
be the most important determinant of student outcomes, both in the short and long
run (Rockoff, 2004; Rivkin, Hanushek and Kain, 2005; Chetty, Friedman and Rockoff,
2014a;b). Moreover, because teaching is a complex, multidimensional task, based on
4

direct, personal and prolonged interactions with the “output” (students), it requires
specific human capital (student-specific, grade-specific etc., see Ost, 2014), which makes
it particularly well suited to the analysis of the relationship between human capital
specificity and substitutability.
Finally, this paper contributes to the literature on instruction time (Pischke, 2007;
Lavy, 2015). This literature finds that longer instructional time has a positive impact
on student test scores and one-time grade progression. While these papers focus on
variations in planned instruction time defined by law, I go a step further and analyze
the impact on student outcomes of variations in the actual amount of instruction hours,
and of variations with whom they are actually spent (regular or substitute teacher).
The remainder of the paper is organized as follows. Section 2 describes the French
educational context, highlighting its relevance to the analysis of worker absence and
substitutability. Section 3 presents a highly stylized conceptual framework to illus-
trate the mechanisms through which teacher absence and substitution affect student
outcomes. Section 4 presents the data and some descriptive statistics. Section 5 ex-
poses the empirical strategy, section 6 the baseline results and section 7 the robustness
checks. Section 8 analyses the impact of absence and substitution by length and reason
of absence, student background and teacher topic. Section 9 concludes.
2 Institutional Setting
2.1 Secondary School Teachers in France
The public French educational system is highly centralized. Contrary to the United
States for example, schools have little autonomy: they are all required to follow the
same national curriculum. School principals cannot hire nor fire their teachers. The
French territory 3 is decomposed in 25 large administrative school districts, called
academies (hereafter regions).
Secondary school teachers are selected through a subject-specific national compet-
itive examination, which is very demanding academically and has low passing rates
(between 15 and 30 %). There are two main certification levels: basic, called CAPES
(Certificat d’aptitude au professorat de l’enseignement du second degre) and advanced,
called Agregation. Conditional on passing this examination, teachers become civil
servants managed by the government.
Certified teachers are assigned via a centralized point-based system (called SIAM,
3This paper focuses on mainland France and does not analyses its overseas territories.
5
Systeme d’information et d’aide aux mutations) with two rounds: the inter-regional
round and the regional round. Candidates submit a rank-ordered list of choices and
are assigned according to a modified version of the school-proposing Deferred Accep-
tance mechanism (Combes, Tercieux and Terrier, 2016). Teachers’ priorities are mostly
determined by their number of years of experience. Every year, i) new teachers and
tenured teachers who want to change region apply to the inter-regional mobility round;
ii) participants of the inter-regional mobility round, and tenured teachers who want to
change school within their region, apply to the intra-regional mobility round.
Teacher wages are set through a national wage scale based on teachers’ number of
years of experience and certification level (none, basic and advanced). For example,
the gross wage of a teacher with the basic certification level and a year of experience
is approximately 2,000 euros per month. Wages do not vary across schools and de-
pend on output only indirectly through teacher evaluations. Teachers are evaluated
on the job every year by their school principal and regularly by external inspectors
with classroom observations. The weighted average of the school principal grade (40
percent) and the classroom observation (60 percent) can foster promotion. Given that
experience is the main criteria for promotion, teachers with a high weighted average
need less teaching experience to go up on the wage scale than teachers with a low
weighted average. Table 4 reports the relationship between teacher evaluation grades
and teacher absences, controlling for teacher characteristics, including the number of
years of experience. It shows that, whatever the specification (school fixed effects or
teacher fixed effects), neither the number of absence spells neither the number of days
of absence are significantly associated with the evaluation grades. This suggests that
neither school principals nor external inspectors take into account teachers’ absence
behavior in their evaluation.
Secondary school teachers are subject-specific: each subject is taught by a different
teacher. The legal working week is 15 hours for teachers with an advanced certification
level and 18 hours for teachers with a basic certification level. Students are not tracked
by major nor ability. Students stay in the same class, with the same peers throughout
the school year and in every subject. For ninth graders, a typical week consists in 29
school hours, distributed across 11 teachers–subjects, among which 4 hours of French,
3.30 hours of Mathematics, and 3.30 hours of History 4.
At the end of 9th grade, students take a national and externally graded examination
called Diplome national du Brevet in three topics: French, Math and History. This
4The rest of the hours are distributed between Foreign Languages (5h30), Science (4h30), Sport(3h)and Art (2h), see http://www.education.gouv.fr/cid80/les-horaires-par-cycle-au-college.html
6

exam takes place in the very last days of June/early days of July.
2.2 Teacher Absence Leave Regulation
Teachers are fully paid during the first three months of their absence leave for minor
illness, and during the first to third year of their leave for serious illness. After this
period, they receive half of their regular pay. Teachers are fully paid during their
maternity leave, which can last from 16 to 46 weeks depending on the order of the birth.
Paternity leaves are also fully paid and can last from 11 to 18 days. Teacher can also
take fully paid leave for professional reasons such as training, meetings, participation
to an examination board etc.. Unlike in the United States for example (Herrmann
and Rockoff, 2012), there is no limitation in the number of days of paid absence each
teacher can take per year. The only absences that are constrained are those for child’s
sickness. Depending on the marital status, teachers can take up to 10 paid days to
take care of their sick child.
2.3 Teacher Substitution Procedure
Teacher absences are not systematically replaced in France. Overall, the probability of
replacement depends on the length of the absence spell and the availability of substitute
teachers. Absences are handled by the regional educational authority (rectorat). There
are no official precise criteria: regional educational authorities are simply asked to give
priority to long term absences (IGEN, 2011).
In practice, when a teacher is absent, she has to notify her school principal, who
then notifies the region via an online form, whatever the length of the absence spell.
Principals can, additionally and separately, fill an online form to ask the region for an
external substitute teacher. Regional educational authorities assign substitute teachers
manually.
2.4 Substitute Teachers
Tenured Substitute Teachers. Certified teachers can ask to become substitute
teachers during the intra-regional mobility round of the centralized teacher assignment
procedure but most tenured substitutes (Titulaires sur zone de remplacement) are
teachers who participated to the inter-regional mobility round and failed to obtain one
of their choices in the intra-regional mobility round (IGAENR, 2015). They are as-
7
signed to a reference school called etablissement de rattachement administratif (RAD),
and can be called to replace absent teachers in any school located in an geographical
area called zone de remplacement. 5 There are around 250 zones de remplacement in
France. Tenured substitute teachers’ wages do not depend on the number of substitu-
tion they perform nor on the number of hours they work. Their wage has two main
components: a fixed part which is equal the regular teachers’ wage, and a variable
part, which depends on the distance between the substitute’s reference school and the
school she is called to cover. The latter part consists in a daily compensation which
goes from 15 e/day to 52 e/ day (Table 3).
As explained above, there is no clear rule for the assignment of tenured substitute
teachers. Regional educational authorities, which are in charge of the assignment and
do it manually, are simply given the general guideline to give priority to long absence
spells (IGEN, 2011). In the context of the shortage of tenured teachers in France
(Terrier, 2014), tenured substitute teachers are more and more assigned to fill one year
vacancies that remained open in September because a regular teacher left definitely
her school in June and her position remains unfilled.
Contract Teachers. When there is a shortage of available tenured certified sub-
stitute teachers to perform substitution, regions hire contract teachers on the spot.
Contract teachers are not hired via the same procedure as certified teachers. Candi-
dates apply directly to regional educational authorities via an online platform. 6 To be
eligible, they must hold a Bachelor’s degree and have no criminal record. Candidates
submit their resume, cover letter and, in some regions, their geographical preferences.
The selection process is managed by regional professional inspectors. In general, pro-
fessional inspectors are former experienced teachers. They screen candidates based on
their online application and conduct interviews. Successful candidates are hired on a
short term contract (Contrat a duree determinee) of maximum a year. This contract
can be renewed up to six consecutive times (DEPP, 2015). After six consecutive years
of work without interruptions lasting more than four months, contract teachers have
the legal right to a permanent contract (Contrat a duree indeterminee). Contract
teachers’ wage depends on their degree (High school degree, Bachelor’s, Master’s or
more), their professional experience, and on their region. 7 For example, the gross
wage of a contract teacher in Paris, with a Bachelor’s degree and a year of experience
5Decret 99-823 du 17 septembre 19996This online platform is called, depending on the region, either SIATEN (Systeme d’information
des agents temporaires de l’Education nationale) or ACLOE (Application de gestion des candidaturesen ligne)
7http://vocationenseignant.fr/devenir-enseignant-contractuel-ou-vacataire-mode-d-emploi
8

is 1699 e/ month.
3 Conceptual Framework
This section presents the main intuitions and predictions of the highly stylized concep-
tual framework which describes how teacher absences can impact teacher productivity
and how this impact can be mitigated or aggravated by teacher substitutes. The de-
tailed conceptual framework is presented in section 11.
Student yearly instructional time can be decomposed as follows:
- hours spent with the regular teacher
- hours lost because the regular teacher is absent and no substitute teacher is assigned
- hours spent with a substitute teacher. This substitute teacher can either be a
tenured substitute teacher or a contract substitute teacher.
Teacher productivity depends on her ability, professional experience and, impor-
tantly, student-specific human capital. The basic intuition of student-specific human
capital is that the longer teachers spend time teaching the specific students they are
assigned to, the better they are at teaching them. This may be because they get to
know and adjust to their students, and also have more time to implement a long-term
instructional strategy. Several suggestive empirical evidence back this intuition. Du-
flo, Dupas and Kremer (2011) suggest teachers adjust the level at which they teach
in response to changes in class composition. Herrmann and Rockoff (2012) find daily
productivity losses from absence decline with the length of an absence spell, consistent
with substitute teachers learning on the job.
Therefore, teacher absence can impact teacher productivity through different chan-
nels, depending on whether the absent teacher is replaced, and on the quality of the
substitute teacher:
1. if the regular teacher is absent and no substitute teacher is assigned, teacher
absence can impact productivity through the loss in instruction time and the
amount of student-specific capital the regular teacher loses during her absence
2. if the regular teacher is absent and a substitute teacher is assigned, the main
channels are:
- the difference in ability and experience between the regular and the substitute
teachers
9

- how fast substitute teachers gain student-specific human capital
- the amount of student-specific capital the regular teacher loses during her
absence
4 Data and Descriptive Statistics
4.1 Data
This paper relies on administrative data from the French ministry of Education covering
the whole country and school years 2005-2006 through 2014-2015. I focus on Math,
French and History teachers matched to their 9th grade students. A precise description
of the data is found in the section 10. I exploit four main set of data:
- individual data on students including an encrypted national identification number,
gender, financial aid status, parents’ occupation, the identification number of their
school and of their class. A separate database also includes their test scores at the
end of 9th grade examination in French, Math and History, which I standardize by
year and region.
- individual data on teachers including national identification number, date of birth,
gender, number of year of teaching experience, teaching subject, identification num-
ber of their assignment, and the identification number of the school and of the class
they teach. The two latter variables are used to match each teacher to her stu-
dents. I take into account, throughout the paper, only open business days and
remove holidays and weekends.
- data on teachers’ absence spells: regional identification number of the absent teacher;
day, month and year of the absence spells; detailed cause of absence (minor illness,
maternity leave, training etc.); region identification number.
- data on teachers’ assignment spells: region identification number of the substitute
teacher, day, month and year of the assignment spells; identification number of their
assignment; national identifying number of the school. The match between the
absent and the substitute teachers is made on the identification number and dates
of their respective assignment spells. As for absence spells, I take into account,
throughout the paper, only open business days and remove from absence spells
holidays and weekends.
10
4.2 Summary Statistics
Distribution of Absence Spells. Figure 3 shows the distribution of the number
of absence spells per teacher-year. Each year, 55 percent of teachers do not take any
absence leave. It is much more than in the United States where perfect attendance
by a teacher occurs only in 3 percent of cases (Herrmann and Rockoff, 2012). Around
half of teachers who are absent take only one absence spell. Figure 10a shows that the
majority of absence spells are health-related: 50 % for minor sickness, 10 % for long
term illness, 3 % for maternity leave, 2 % for maternity leave extension (in case of a
difficult pregnancy or childbirth) and 1 % for professional illness. The other reasons for
absence are work-related (meeeting, training) or family related. The average length,
in number of days, of absence spells varies greatly by reason of absence: from 100
days per year on average for long term illness to 1.5 days for family-related absences.
Therefore, the distribution of the number of absence per type of absence (Figure 10b)
differs from the distribution of the number of absence spells (Figure 10a). Absences
for long term illness account for 60 % of the total number of absence days, absences
for minor sickness 16 % and maternity leave 12 %.
Teachers are absent on average 13.14 days per year on average, which represents
around 7 % of the yearly instructional time. Figure 6 shows the cumulative distribution
of the number of instructional days of absence per absence spell. More than 36 % of
absence spells last only one day. The distribution of absence spells is right-skewed,
with 80 % of absence spells lasting less than 20 days.
There are large infra-year variations in the total weekly absence rate. Figure 4 shows
that the weekly absence rate can go as low as 1.5 % in the first week of September to
as high as 7.8 % in the middle of January. This trend of higher absence rates in the
winter than in the summer is common to all professions (Dares, 2013).
Distribution of Substitution Spells. Figure 9 shows the overall replacement
rate per year. Over the period, the replacement rate has decreased by 25 %, going from
20 % of absence spells covered in 2007 to 15 % of absence spells covered in 2015. The
replacement rate by tenured substitute teachers has also dramatically decreased. In
2007, 90 % of replacement spells were ensured by substitute teachers, against 55 % of
replacement spells in 2015. The major shift seems to have occurred between 2010 and
2012. A possible explanation is that, in the context of the shortage of teachers, more
and more tenured substitute teachers were assigned to fill vacancies, at the expense of
substitution of absence spells. At the end of the period, in 2015, the number of replaced
days is equal to 10 days per year, which means that around 75 % of absent days are
replaced (Figure 5). On average, 5 days per year are replaced by tenured substitute
11

teachers. This means that on average in 2015, 3 % of annual instructional time is spent
with tenured substitute teachers, against 6 % in 2007. Over the period, the share of
replaced days by contract substitute teachers is more than four times higher in 2015
than in 2007 (from 10 % to around 45 %).
There are large variations in replacement rates by reason of absence (Figure 11).
Short term absences such as minor sickness absence, maternity leave extension, family
related and work-related absences are rarely replaced (Figure 11a). On average, only
9 % of absent days for minor sickness are replaced. Long term absences such as mater-
nity leave, long term illness and professional illness are better covered: 67 % of absent
days for maternity leave are replaced. Therefore, regional educational authorities, in
charge of assigning substitute teachers, seem to comply with the instructions of the
Ministry of Education asking them to give priority to long absence spells. Figure 7
reports the average replacement rate by length of absence spell over the period. On
average, only 0.4 % of absence spells lasting a single day and 6 % of absence spells
lasting a week are replaced. The replacement rate rises quickly with the length of
absence spells, and reaches 50 % for 20 days absence spells and 90 % for 100 days ab-
sence spells. Importantly, the share of replacement spells ensured by contract teachers
increases with the length of the absence spells for absence spells lasting less than 20
days (which represent more than 80 % of the absence spells). The share of replacement
spells done by contract substitute teachers is equal to 6 % for one day absence spells,
against more than 17 % for absence spells lasting 20 days. This is quite surprising as it
goes against the instruction of the Ministry of Education asking them to give priority
to tenured substitute teachers for long absence spells. For absence spells lasting more
than 20 days, the share of replacement spells done by contract substitute teachers is
constant around 15 %.
There are also large variations in replacement rates between regions. For example,
in the Creteil region (disadvantaged Eastern suburb of Paris), only 6 % of absence
spells are replaced whereas in the Nice region (French Riveria), almost 45 % of absence
spells are replaced. The share of absence spells replaced by contract substitute teachers
differs greatly between these two regions. In Creteil in 2015, 51 % of replacement spells
are done by contract teachers, against 33 % of replacement spells in Nice the same year.
These inequalities reflect disparities in the assignment of teachers. The overall share of
contract teachers in the teaching workforce has increased over the period, going from
3 % of teachers in 2007 to almost 8 % in 2015 (Figure 8). However, this increase is not
homogeneous across regions. In 2015, contract teachers account for more than 10 % of
teachers in Creteil, against only 5 % in Caen (West of France).
12

Substitute Teachers Characteristics. Table 5 shows summary statistics on
teacher characteristics. Contract teachers are on average less experienced than regu-
lar and tenured substitute teachers. Contract teachers have on average 4.6 years of
experience, whereas tenured substitute teachers have 10 years of experience and reg-
ular teachers 14.1 years. 32 % of contract teachers have a year or less of experience,
against 13 % of tenured substitute teachers and 2 % of regular teachers. Regular
teachers and tenured substitute teachers have the same distribution by certification.
For both regular and tenured substitute teachers, Agregation recipients represent 5 %
of the population and CAPES recipients approximately 75 %. By definition, contract
teachers are not certified. I then focus on the subsample of contract teachers who take
the same certification examinations as regular and tenured substitute teachers (Table
6). Candidates who are contract teachers perform very badly both at Agregation and
CAPES. For example, only 16 % of them pass the CAPES against 33 % of candidates
who are not contract teachers.
5 Empirical Strategy
Empirical Strategy. As suggested by Table 9, absences and substitution can be cor-
related with observed and unobserved teachers’ characteristics which can have a direct
impact on student achievement. For example, there is a statistically significant relation-
ship between teacher substitution and her student socioeconomic background, experi-
ence and other teacher characteristics kept equal. Furthermore, low quality teachers
can be systematically assigned to low achieving students. To deal with these issues, I
resort to teacher fixed effects, which control for both observed and unobserved teacher
fixed characteristics (Miller et al., 2008; Herrmann and Rockoff, 2012). Therefore, I
exploit within teacher, across years variations in the number of days of absence and in
the number of replaced days. This source of variation has already been exploited in
the previous studies on the impact of teacher absences on student achievement (Miller,
2008; Herrmann and Rockoff, 2012). To better understand this strategy, Table 7 re-
ports a small example. Mr Dupont is a 9th grade Math teacher who take, in 2010 and
2011, three absence spells. Each year, only one of them is replaced. The impact of the
number of absent and replaced days is identified through the relationship between vari-
ations in Mr Dupont’s number of absent/replaced days and variations in Mr Dupont’s
student’s test scores. I estimate the following regression specification:
Yj,t = Aj,tβ +Rj,tγ + θj + θt + ej,t (1)
13

where Yj,t is the test scores of teacher j ’s students in year t in her topic. Aj,t is the
number of work day absences of all the absence spells taken by teacher j in year t
and Rj,t the number of replaced work days of all the absence spells taken by teacher
j in year t. Finally, θt year fixed-effect to control for common trends across years,
and θj is the teacher-school fixed effects to control for fixed individual characteristics.
Robust standard standard errors are clustered by school, which is more conservative
than clustering at the classroom or teacher levels.
Identification Hypotheses and Threats to Identification. The parameters
of interests Aj,t and Rj,t are identified under the assumption that variations within
teacher, across years in the number of days of absence/ number of replaced days are not
correlated with variations of unobserved determinants of student achievement, such as
i) within teacher variations in productivity; ii) student ability or iii) teachers’ overall
working conditions. First, table 9 shows that experience is strongly correlated with
the number of days of absence and replacement. We also know from the literature
that experience is an observable determinant of teacher quality. That is why I add
experience and the square of experience as control variables. A source of unobservable
variations in within teacher quality would be teacher motivation. If, for example, a
teacher were burning out, then her absences would only be a symptom of poor on-the-
job productivity. This point is discussed in the robustness checks with placebo tests in
the number of days of absence and replacement. Second, low achieving students can
discourage teachers and raise absences, i.e. there could be reverse causality. The match
between substitute teachers and students could not be random. For example, high
achieving students can be given priority in the substitute teacher assignment process.
I tackle this issue by including in the specification students socio-economic background
such dummies for parental profession and financial aid status. This issue of reverse
causality is also further discussed in the robustness checks section. Third, I tackle the
issue of unobserved variations in working conditions such as the school environment by
combining teacher fixed effects with school fixed effects (i.e. with teacher-school fixed
effects). With this specification, when a teacher moves to another school, he is assigned
in the data another individual identifier and considered as a different teacher. Finally,
in the heterogeneity analysis section, I distinguish between maternity leaves and other
type of absences. Indeed, maternity leave is the reason of absence most likely to be
unrelated to within teacher variations in motivation or burning out, student ability or
working conditions.
Another type of threat for identification is more specific to the replacement param-
eters. These parameters would not be identified if the type of absence spells that are
14

replaced were not comparable to those who are not. For example, absences planned in
advance may be more likely to be replaced than absences that are unexpected. In that
case, the impact of replacement may be biased. Teachers who know in advance they
are going to be missing a certain period of time can prepare their absence by giving
guidelines to their substitute, specific homework to their students etc. In particular,
the analysis of the impact of the assignment of tenured substitute teachers or contract
substitute teachers would be biased if tenured substitute teachers where assigned to
different type of absence spells, e.g. of different length, period of the year or reason,
than contract substitute teachers. This is all the more relevant since the summary
statistics (Figure 7) shows that, for absence spells lasting less than 20 days (more than
80 % of the absence spells), the share of replacement spells done by contract teachers
increases with the length of the absence spell. I tackle this issue by performing several
heterogeneity analyzes, in particular by length of absence spell and reason of absence.
More specifically, distinguishing between maternity leaves and other types of absence
can be fruitful because maternity leaves are the absences that are the most likely to
be planned long in advance.
6 Baseline Results
Impact of the Number of Days Absence and Replacement. Table 10 reports
regression estimates of the impact of the number of days of absence and the number of
replaced days per teacher-year on their student test scores at the 9th grade examination.
Each column corresponds to a single regression. Results are reported in percentage of a
standard deviation. All regressions include year x topic fixed effects. Robust standard
errors are clustered by school. Column 1 reports naive estimates, without teacher-
school fixed effect nor control variables. With this specification, an additional non-
replaced day of absence is associated with a 0.13 % of a standard deviation decrease in
student test scores. An additional replaced day (as compared to missing a day of school)
is associated with a 0.06 % of a standard deviation increase of student test scores.
In other words, replaced days compensate more than 45 % of the negative impact
of absence. I now control for teacher-school fixed effects and time-varying teacher
characteristics (teacher experience and seniority). The effect of absences is divided by
three but remains statistically significant (column 2). This is consistent with a negative
correlation between teacher quality and absences. Furthermore, the effect of replaced
days becomes statistically insignificant. This suggests a non-random sorting between
absent teachers and substitute teachers: the best absent teachers seem to have priority
15

in the assignment of substitute teachers. To get a sense of the influence variations
in student composition can have on teacher absences and substitution, I add parental
occupation and financial aid status of students as control variables to the specification
of column 2. With this specification (column 3), the marginal effect of absence is only
slightly different. The marginal impact of one additional non- replaced day of absence
is to reduce student achievement by 0.05 % of a standard deviation. In other words, the
expected loss in daily productivity from teacher absences is on par with replacing an
average teacher with one at the 15th percentile of the teacher value-added distribution.8
This is comparable to the results of the literature. Herrmann and Rockoff (2012) for
example find that the expected loss in daily productivity from teacher absences is on
par with replacing an average teacher with one at the 10-20 percentile of the teacher
value-added distribution. Furthermore, the coefficient associated with the number of
replaced days remains the same as in column 2. Thus, this suggests that, controlling for
teacher fixed and varying characteristics, across years variations in student composition
may not be a serious threat for identification. This question is further investigated in
the robustness checks section.
Impact of the Number of Days of Replacement by Type of Substitute
Teachers. The above results seems to suggest that substitute teachers are, on average,
unable to compensate the negative impact of teacher absences. However, Table 11
shows that, in fact, the impact of replaced days largely depends on the type of substitute
teachers. With the preferred specification (column 3), tenured substitute teachers are
able to mitigate more than 37 % of the marginal impact of absences. On the other
hand, the marginal impact of a replaced day with a contract teacher (as compared to
missing a day of school) is not statistically significant.
7 Robustness Checks
7.1 Threat I: Reverse Causality
Placebo test with students’ teacher in another topic. A concern for the validity
of the baseline results is that they are biased because of unobserved variations in
student ability, which can impact both teacher absences and replacement and student
test scores. A first test is to see if absences and replacements of a teacher in one topic
impact her students’ test scores in another topic (i.e. with another teacher). If the
baseline results were driven by student ability, then the absence days and replaced
8For the detail of the computation, see Herrmann and Rockoff, 2012
16

days of the Math teacher of student i would be significantly correlated with student
test scores in French. Table 14 reports regression estimates of the effect of absence and
replaced days of the “other topic” teacher of student i on student test scores in 9th
grade. Each column-panel corresponds to a single regression. This table shows that
Math absence and replacement days are not significantly related to student achievement
in French and in History. This is also true for French absence and replacement days on
Math and History test scores; and of History absence and replacement days on French
and Math test scores. Thus, this placebo test gives strong evidence in favor of the
robustness of the baseline results with respect to within teacher variations in student
ability.
Student fixed effects. Another robustness check usually done in the literature is
to control for students’ initial level of achievement with their previous year’s test scores
(Rockoff, 2004; Rivkin et al., 2005; Chetty et al., 2014). Contrary to American and
English students for example, who are regularly externally evaluated, French students
take only one externally graded examination, in 9th grade, and in three topics: French,
History and Math. Therefore, to give further support for the robustness of the baseline
results, I use student fixed effects in cross-section (Clotfelter, Ladd and Vigdor, 2010;
Lavy, 2010), exploiting with student, across topics variations in teachers. Table 8
presents a small fictitious example in order to give a better sense of this approach.
The source of variation comes from the fact that teachers are subject-specific. Each
student (Caroline and Henri) is observed, each year, once per teacher-topic. Thus, I
exploit within student, across topics variations in the number of days of absence and
in the number of replaced days. Regression estimates are reported in Table 15. The
marginal impact of absence and replacement are very similar to the baseline estimates,
which gives further support for the validity of the results.
7.2 Threat II: Absence as a symptom of poor on-the-job teacher
quality
Previous and Following Year Absences and Substitution. I also give evidence
against the idea that the baseline results are driven by the fact that absences are only
a symptom of poor on-the-job teacher quality. If, for example, the impact of absence
were only capturing the fact that absent teacher were burning out, then previous and
following absences would have a statistically significant impact. Table 16 reports a
placebo test of the effect of absence and replacement of the previous year ( t− 1) and
following year ( t + 1) of teacher j on student test scores in 9th grade with teacher j
17

during the year t. Each column corresponds to a different regression. All regressions
correspond to the preferred specification. This table shows absent days and replacement
day of years t− 1 and t+ 1 do not have any statistically significant impact on student
achievement in year t. Therefore, it does not seem that the baseline result are biased
by poor on-the-job teacher performance.
Absences During the Holidays. Teachers who fall sick or pregnant during the
school holidays (days when they do not have class) or during summer time have the
possibility to declare these days in order to have these absence days transferred during
school time 9. These absence spells represent around 1 % of the observations. Half
of them are maternity leaves happening over the summer. Table 17 shows regression
estimates of the marginal impact of one day of absence during holidays. It shows
that these estimates are not statistically significant. Therefore, this suggests that the
baseline estimates are not driven by that the baseline estimates are not driven by the
fact that absence would be a symptom of poor on-the-job teacher quality.
7.3 Threat III: Replaced Absences are not Comparable to
Non Replaced Absences
Heterogeneity by Reason of Absence. Table 18 reports regression estimates by
reason of absence. This table corresponds to a single regression. I make the distinction
between absence spells for maternity leave and non maternity leave absence spells. As
discussed in the empirical strategy, the reason for this distinction is that maternity
leave absence spells are those less likely to be determined by within teacher variations
in teacher quality, student ability or working conditions. Furthermore, maternity leaves
are the type of absence the most likely to be planned long in advance. We observe that
the marginal impact of absence for maternity leave is to reduce student test scores
by 0.05 % of a standard deviation. The impact of absence for non maternity leave
absences is similar. The impact of replacement by a tenured substitute teacher, for
both maternity leave and non maternity leave absences, is to mitigate 30 - 35 % of
the negative impact of absence. The fact that estimates for maternity leave absence
spells and non maternity absence spells are very similar gives strong support for the
robustness of the baseline results.
9Source: https://www.service-public.fr/particuliers/vosdroits/F2481
18

8 Heterogeneity Analysis
Heterogeneity by Length of Absence Spells. Table 12 reports regression esti-
mates of the effect of absence and replaced days on student test scores in 9th grade by
length of absence spell. Each line corresponds to a single regression. All regressions
correspond to the preferred specification. First, the marginal impact of one additional
day of absence decreases with the length of absence spells. The marginal impact of
absence is to reduce student achievement by 0.19 % of a standard deviation for absence
spells lasting less than five days whereas it is equal to 0.10 % of a standard deviation
for absence spells lasting less than 50 days. Second, the marginal impact of one. Third,
the marginal impact of one replaced day with a tenured substitute teacher is not sta-
tistically significant for absence spells lasting less than 30 days (which represent more
than 85 % of absence spells).
Heterogeneity by Topic. Figure 15 reports regression estimates by teaching
topic. The marginal impact of one additional day of non-replaced absence in Math is to
reduce student achievement by 0.08 % of a standard deviation. In French and History,
this impact is equal to 0.04 % of a standard deviation. The fact that absences have
a larger impact in Math than in other topics is consistent with the literature (Miller
et al., 2008; Herrmann and Rockoff, 2012). A possible explanation is that teacher
value-added is higher in Math than in other topics (Chetty et al., 2014).
Focus on Disadvantaged Schools. Table 13 reports regression estimates of the
impact of absence/replacement for disadvantaged schools and for non-disadvantaged
schools. Disadvantaged schools are defined as those who are part of the national
program Education prioritaire. They approximately represent the bottom 20 % of
schools in term of social composition. In disadvantaged schools, the marginal impact
of one day of absence is to reduce student test scores by 0.72 % of a standard deviation.
This is 60 % higher than the marginal impact of absence in non-disadvantaged schools.
Furthermore, tenured substitute teachers are able to compensate 45 % of the negative
impact of absence against 29 % in non-disadvantaged schools.
Heterogeneity by Month of the School Year. Figure 14 reports estimates
of the impact of the number of days/substitution by month of the beginning of the
absence spell. The three graphs correspond to a single regression with the preferred
specification. The graph 14a shows the seasonality of the marginal impact of absence
(controlling for the number of replaced days with tenured substitute and contract
substitute). The marginal impact of absence starting in September is not statistically
significant at the five percent level. Between October and January, the marginal impact
19

of absence on student test scores is equal to -0.06/- 0.08 percent of a standard deviation
and is statistically significant at the five percent level. It then drops to -0.10/ - 0.11
percent of a standard deviation in February and March. The marginal impact of
absence is the most negative in June when it reaches a -0.12 percent of a standard
deviation. The 9th grade exam takes place in the last days of June/first days of July.
This suggests that the presence and actions taken by regular teachers in the month
just before the exam have a larger impact on student test scores than those taken in
the previous months of the school year. This result is consistent with the previous
literature (Herrmann and Rockoff, 2012). The graph 14b confirms the intuition that
the month just before the exam is crucial for student test scores. It shows that the
marginal impact of one replaced day with a tenured substitute teacher is the largest
in June, where it is equal to 0.09 % of a standard deviation in test scores and is
statistically significant at the five percent level.
9 Conclusion
Using a unique French administrative dataset matching, for each absence spell, each
missing secondary school teacher to her substitute teacher, this paper (a) estimates the
effect of teacher absence on student achievement; (b) studies how the effect of teacher
absence can be mitigated through the assignment and quality of substitute teachers.I
find that the expected loss in daily productivity from teacher absences is on par with
replacing an average teacher with one at the 15th percentile of the teacher value-added
distribution. Tenured substitute teachers are able to compensate 37 % of this negative
impact, while contract substitute teachers do not have a statistically significant impact.
Thus, this paper shows that contract teachers are unable to significantly mitigate
the negative impact of absence, whereas tenured substitute teachers seem to do a good
job. This is a source of inefficiency as contract teachers represent, overall, an ever
growing share of the teaching workforce. It is also a source of educational inequality
as substitution spells ensured by contract teachers are concentrated in disadvantaged
areas.
References
Abadzi, H. (2009). Instructional Time Loss in Developing Countries: Concepts,
Measurement, and Implications, World Bank.
20

Chetty, R., Friedman, J.N. and Rockoff, J.E. (2014a). Measuring the Im-
pact of Teachers I: Evaluating Bias in Teacher Value-Added Estimates. The American
Economic Review, 104(9), pp.2593-2632.
Chetty, R., Friedman, J.N. and Rockoff, J.E.(2014b). Measuring the Im-
pact of Teachers II: Teacher Value-Added and Student Outcomes in Adulthood. The
American Economic Review, 104(9), pp.2633-2679.
Clotfelter, C. T., H. F. Ladd, and Vigdor J.L. (2009). Are Teacher Absences
Worth Worrying about in the US? Education Finance and Policy, 4, 115-149.
Combes J., Tercieux O. and Terrier C. (2016). The Design of Teacher
Assignment: Theory and Evidence, Working Paper, Paris School of Economics.
DARES (2013). Les absences au travail des salaries pour raisons de sante : un
role important des conditions de travail, Dares analyses, fevrier.
Dee T. and Goldhaber D.(2017). Understanding and Addressing Teacher
Shortages in the United States, The Hamilton Project, April.
DEPP(2015). Les enseignants non-titulaires du second degre public, Note d’information,
Direction de l’evaluation, de la prospective et de la performance, ministere de l’Education
nationale.
Duflo, E., Dupas, P., Kremer, M., (2011). Peer Effects, Teacher Incentives,
and the Impact of Tracking. The American Economic Review, 101(5).
Duflo, E., Hanna, R. and Ryan, S.P. (2012). Incentives work: Getting teach-
ers to come to school. The American Economic Review, 102(4), pp.1241-1278.
Hensvik, L. and Rosenqvist, O. (2016). The Strength of the Weakest Link:
Sickness Absence, Internal Substitution and Worker-Firm Matching, Working Paper,
Uppsala University.
Herrmann M. and Rockoff J.E (2012). Worker Absence and Productivity:
Evidence from Teaching, Journal of Labor Economics, 30(4), 749-782
IGAENR (2015). Les mouvements academiques et departementaux comme outils
de gestion des ressources humaines, Rapport 2015-025, Inspection generale de l’administration
de l’Education nationale et de la recherche.
Jacobson, L.S., LaLonde, R.J. and Sullivan, D.G.(1993). Earnings losses
of displaced workers. The American Economic Review, pp.685-709.
Jager S.(2016). How Substitutable Are Workers? Evidence from Worker Deaths,
Working Paper, Harvard University.
Lacoe J.R (2013). Too Scared to Learn? The Academic Consequences of Feeling
Unsafe at School, Working Paper, New York University.
Lavy, V. (2015). Do Differences in Schools’ Instruction Time Explain Interna-
21

tional Achievement Gaps? Evidence from Developed and Developing Countries, The
Economic Journal, 125(588), F397-F424.
Lazear E., Oyer P. (2012). Personnel Economics, The Handbook of Organiza-
tional Economics. Princeton University Press, 479-519.
Miller, R.T., Murnane, R.J. and Willett, J.B.(2008). Do worker absences
affect productivity? The case of teachers. International Labour Review, 147(1), pp.71-
89.
Ost, B. (2014). How do Teachers Improve? The Relative Importance of Specific
and General Human Capital. American Economic Journal. Applied Economics, 6(2),
p.127.
Pischke, J.S. (2007). The Impact of Length of the School Year on Student Per-
formance and Earnings: Evidence from the German Short School Years. The Economic
Journal, 117(523),1216-1242.
Senat (2003). Rapport sur le projet de loi relatif aux assistants d’education, avril.
Rivkin, S.G., Hanushek, E.A. and Kain, J.F.(2005). Teachers, Schools, and
Academic Achievement, Econometrica, 73(2), pp.417-458.
Rockoff, J.E.(2004). The Impact of Individual Teachers on Student Achievement:
Evidence from Panel Data.The American Economic Review, 94(2), pp.247-252.
Stole, L., and Zwiebel, J. (1996). Organizational Design and Technology
Choice under Intrafirm Bargaining.The American Economic Review, 86(1), 195-222.
Todd, P., and Wolpin, K. (2003). On the Specification and Estimation of the
Production Function for Cognitive Achievement. The Economic Journal, 113(485),
F3-F33.
UK Office for National Statistics (2014). Sickness Absence in the Labour
Market, February.
US Bureau of Labor Statistics (2016). Labor Force Statistics from the Current
Population Survey, US Department of Labor, February.
22

10 Data Construction
Table 1 – Main Datasets
Name Observation level Period covered
OCC teacher x assignment spell 2001 - 2015
CONG teacher x absence spell 2001 - 2015
RELAIS teacher x class x year 2004-2015
FAERE student x year 2006-2015
The OCC and CONG datasets are raw administrative datasets which are not previously
cleaned by the Statistical Department of the Ministry of Education. I do not use the
cleaned version of these datasets because they are not exhaustive:
1. The cleaned version of the OCC datasets does not include all teacher assign-
ment spells but only the assignment spells which are ongoing at the time of the
extraction by the Statistical Department (in December of each year). This is
highly problematic for the purpose of this study because I need to observe all
teacher assignments through the school year in order to know, for each absence
spell, whether a substitute teacher has been assigned, and the identity of this
substitute teacher.
2. The cleaned version of the CONG datasets does not include all teacher absence
spells but only absence for heath reasons: minor sickness, maternity leave, long
term illness and professional illness. This is highly problematic because, as shown
in figure 10b, non health related absences (meetings, training, family) represent
around 30 % of absence spells.
10.1 Merging Procedures
1. Merge between data on absence spells (CONG) and data on teacher assignment
spells (OCC). Matching variables: dates of assignment spells, dates of absence
23

spells, regional teacher identification number, regional identification number. The
dates variables give the exact day, month and year.
Table 2 – Description of the Merge between the Dataset on Teacher Assignmentsand the Dataset on Absence Spells
School Year Nb of obs – OCC Nb of obs – CONG Matching Rate
2001 1,138,588 2,642,820 100 %2002 1,208,334 2,752,949 100 %2003 1,249,347 2,678,823 100 %2004 1,237,848 2,827,934 100 %2005 1,295,957 2,858,053 100 %2006 1,961,504 2,778,671 100 %2007 1,194,925 2,806,209 100 %2008 1,376,532 1,376,532 100 %2009 1,405,110 2,607,199 100 %2010 1,387,348 2,667,126 100 %2011 1,390,155 2,617,673 100 %2012 1,343,316 2,481,001 100 %2013 1,331,228 2,444,893 100 %2014 1,324,245 2,418,418 100 %2015 1,307,329 2,445,823 100 %
2. Merge between the obtained dataset and the dataset on teacher assignment spells
(OCC) to match each teacher absence spells to its substitute teacher. Matching
variables: dates of the assignment spells, dates of the absence spells, assignment
identification number, school identification number:
- match on the dates: the assignment spell of the substitute teacher must be
included in the absence spell of the absence teacher
match on the assignment identification number and school identification num-
ber: each position held by a teacher has an identification number, the assign-
ment number. For example, “Math teacher #4 ” is an assignment. It is
not school-specific and must be combined with the school identification num-
ber to identify a single assignment, e.g. “Math teacher #4 in school #154
”. When a substitute teacher is assigned, she is given the same assignment
number/school identification number as the absent teacher. Therefore, sub-
stitution spells are assignment spells which are included in the absent teacher
assignment spell.
24

11 Detailed Conceptual Framework
I present a highly stylized conceptual framework aimed at understanding the intuitions
of my empirical analysis. I essentially build on Herrmann and Rockoff (2012) and add
to their framework the potential underlying mechanisms of the effect of absence and
substitution on productivity.
Consider qj,i,t the productivity of a representative teacher j during a specific hour
of teaching t with student i. The average hourly productivity of teacher j over her
hours of teaching with student i, indexed from 1 to Tj,i writes:
qj,i =1
Tj,i
Tj,i∑t=1
qj,i,t (2)
Crucially, I assume the average hourly productivity to be strictly increasing in the
number of hours Tj teacher j spends instructing her student i :
qj,i = qj(Tj,i), withδqj,i(Tj,i)
δTj,i> 0 (3)
The intuition is that teachers acquire, over their hours of teaching, student-specific
human capital which contributes positively to their average productivity. Several sug-
gestive empirical evidence back this intuition. Duflo, Dupas and Kremer (2011) suggest
teachers adjust the level at which they teach in response to changes in class composi-
tion. Herrmann and Rockoff (2012) find daily productivity losses from absence decline
with the length of an absence spell, consistent with substitute teachers learning on the
job. Therefore, I assume the longer teachers teach the student they are assigned to,
the better they are at teaching them. This may be because they get to know and ad-
just to their students, and also have more time to implement a long-term instructional
strategy.
I write total productivity QTj,i over hours of teaching indexed from 1 to Tj,i as a
function of hourly productivity:
QTj,i = fTj,i(qj,i,1, qj,i,2, ..., qj,i,Tj,i), where j =
r if the regular teacher is teaching
s if the substitute teacher s is teaching
(4)
From the student i perspective, the total number of planned hours of instruction
25

Ti writes:
Ti = Ti,r + Ti,s + Ti,a (5)
where Ti,a is the number of instruction hours lost by student i when her regular
teacher is absent and no substitute teacher is assigned. I write Yi,T , student i output
over T , as a function gT of the sum of regular teacher r and potential substitute
teacher s respective productivity, lost instruction time Ti,a and an idiosyncratic error
εi,Ti (other inputs):
Yi,Ti = gT (fTi,r + fTi,s , Ti,a, εi,Ti) (6)
Following the standard education production function framework (Todd and Wolpin,
2003), I assume fTi,j and gT to be additive and separable:
Yi,Ti = Ti,rqr(Ti,r).α + Ti,sqs(Ti,s).β + Ti,a.γ + εi,Ti (7)
Empirically, we observe two main different cases: 1) The regular teacher is absent
and no substitute teacher is assigned; 2) The regular teacher is absent and a substitute
teacher is assigned.
Case 1. It corresponds to Ti,s = 0, Ti,a > 0 and Ti,r = Ti − Ti,a. The marginal effect
of teacher absence writes:
δYi,TiδTi,a
= −α[qr(Ti − Ti,a)︸ ︷︷ ︸(a)
+δqr(Ti − Ti,a)
δTi,a(Ti − Ti,a)︸ ︷︷ ︸
(b)
] + γ︸︷︷︸(c)
(8)
Each term of this equation can be interpreted as follows:
- Term (a): The more productive the regular teacher is, the greater the output loss
from her absence
- Term (b): It can be interpreted as the disruptive effect of the regular teacher
absence. It is the additional student-specific human capital that teacher r would
have acquired during her absence. Intuitively, teacher r absence give her less time
to know her students and also creates discontinuities in her long-term instructional
strategy.
- Term (c): This is the variation in student output caused directly by the fact that
students do not have class during teacher r absence. Its sign can depend on the
quality of the regular teacher and on whether the absence was expected. For ex-
26
ample, if the absence was expected and the regular teacher is forward-looking, she
can give them extra homework: they have material to study during her absence,
which can mitigate the negative impact of her absence. The sign of this term can
also depend on the quality of the school environment outside the classroom. More
precisely, it can depend on the amount and the quality of adult supervision out-
side the classroom, in the school and its premises. For example, if students are
left without sufficient adult supervision during the hours teacher r is absent, they
can adopt negative non-cognitive behavior (bullying, fighting, smoking drugs etc.),
which can exacerbate the negative impact of teacher absence (Burdick-Will, 2013;
Lacoe, 2013). The quality of the school environment depends on the quality of the
school principal, and on the number and quality of hall monitors.
Overall, in case 1, the marginal effect of teacher absence will be negative unless
γ > α[qr(Ti−Ti,a) +δqr(Ti−Ti,a)
δTi,a(Ti−Ti,a)], i.e. unless students use their lost instruction
hours so efficiently that these hours are more productive than the instruction hours
they would have had with their missing regular teacher.
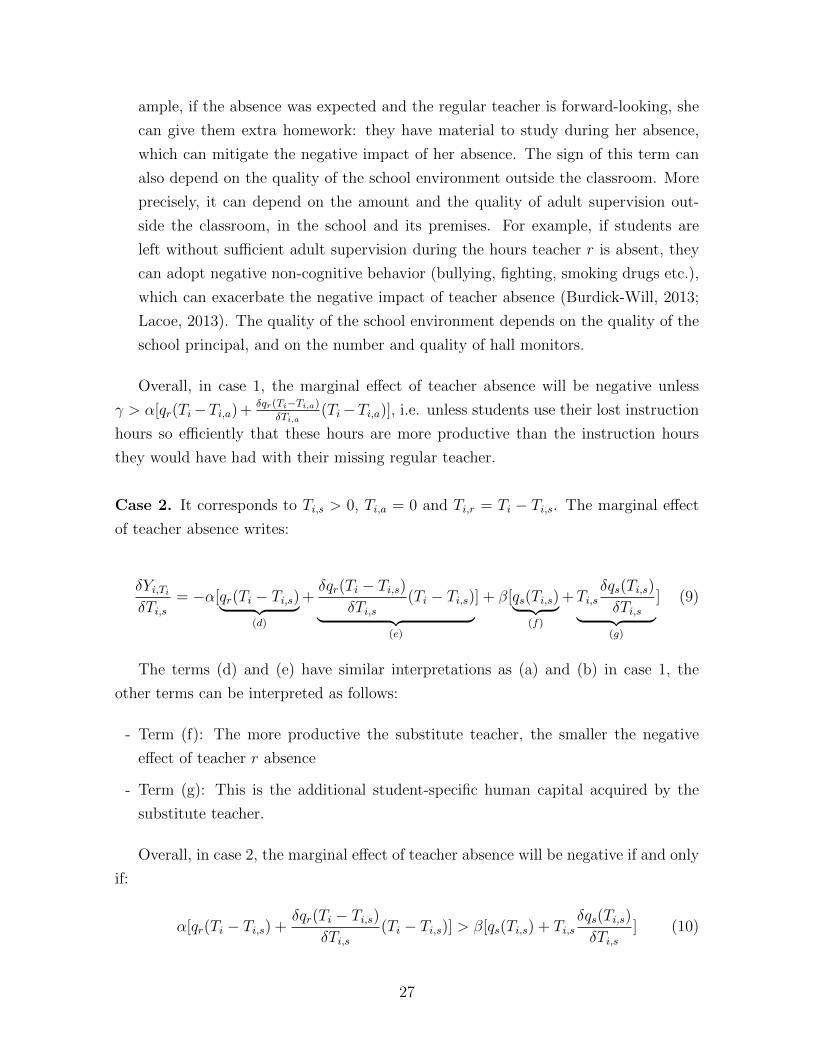
Case 2. It corresponds to Ti,s > 0, Ti,a = 0 and Ti,r = Ti − Ti,s. The marginal effect
of teacher absence writes:
δYi,TiδTi,s
= −α[qr(Ti − Ti,s)︸ ︷︷ ︸(d)
+δqr(Ti − Ti,s)
δTi,s(Ti − Ti,s)︸ ︷︷ ︸
(e)
] + β[qs(Ti,s)︸ ︷︷ ︸(f)
+Ti,sδqs(Ti,s)
δTi,s︸ ︷︷ ︸(g)
] (9)
The terms (d) and (e) have similar interpretations as (a) and (b) in case 1, the
other terms can be interpreted as follows:
- Term (f): The more productive the substitute teacher, the smaller the negative
effect of teacher r absence
- Term (g): This is the additional student-specific human capital acquired by the
substitute teacher.
Overall, in case 2, the marginal effect of teacher absence will be negative if and only
if:
α[qr(Ti − Ti,s) +δqr(Ti − Ti,s)
δTi,s(Ti − Ti,s)] > β[qs(Ti,s) + Ti,s
δqs(Ti,s)
δTi,s] (10)
27

In particular, equation (10) will be verified when the regular teacher is of higher
quality than the substitute teacher (qr > qs) and/or when the regular teacher ac-
quire student-specific human capital faster than the substitute teacher ( δqr/δTi,r >
δqs/δTi,s).
12 Tables and Figures
Table 3 – Daily Compensation for Tenured Substitute Teacher by Distance be-tween Reference School and Replacement School
Distance between reference school and replacement school Daily compensation
Less than 6 miles 15.20 eFrom 6 to 11 miles 19.78 eFrom 12 to 18 miles 24.37 eFrom 19 to 24 miles 28.62 eFrom 25 to 30 miles 33.99 eFrom 31 to 37 miles 39.41 eFrom 38 to 49 miles 45.11 eFrom 50 to 62 miles 51.85 e
For each additional 12 miles 6.73 e
Source: French Ministry of Education website. Note: A tenured substitute teacherwho replace an absent teacher in a school situated 12 miles from his reference schoolwill receive a compensation of 24.37 ¿ per day.
28

Table 4 – Regression Estimates of the School Principal and Inside ClassroomObservation Grades on Individual Teacher Characteristics
(1) (2) (3)
A. School principal gradeExperience (in years) 0.073*** 0.079*** 0.090***
(0.007) (0.007) (0.019)Experience2 -0.002*** -0.002*** -0.003
(0.000) (0.000) (0.005)
Nb of absence spells -0.004 -0.002 0.000(0.002) (0.003) (0.000)
Nb of days of absence 0.000 0.000 0.002*(0.000) (0.000) (0.003)
B. Inside classroom observation by external inspectorsExperience (in years) 0.034*** 0.032*** 0.064**
(0.009) (0.010) (0.028)Experience2 -0.001 -0.000 -0.002
(0.000) (0.000) (0.003)
Nb of absence spells 0.000 -0.001 -0.003(0.000) (0.003) (0.003)
Nb of days of absence 0.002 0.000 0.002(0.002) (0.000) (0.000)
Teacher Controls* Yes Yes YesAdjusted R2 0.02 0.22 0.53School Fixed Effect No Yes NoTeacher Fixed Effect No No Yes
Note: * Teacher controls: gender, teaching topic, certification level. Robust standard errors clusteredby teacher. This table reports estimates of regressions of the administrative on secondary schoolteachers (middle and high school) individual characteristics. Each column corresponds to a singleregression. The level of observation is teacher x year.
29

Table 5 – Substitute Teachers Characteristics
Regular Teacher Tenured Sub. Contract Teacher
A. DemographicsMale 0.36 0.39 0.43
(0.48) (0.49) (0.50)Age 43.8 39.0 37.9
(10.3) (10.5) (8.9)Average Experience (in years) 14.1 10.0 4.6
(8.3) (8.8) (10.2)A year or less of experience 0.02 0.13 0.32
(0.12) (0.34) (0.47)
B. CertificationAgregation 0.05 0.05 –
(0.23) (0.22)CAPES 0.77 0.74 –
(0.42) (0.44)Other 0.17 0.21 –
(0.38) (0.41)
C. EvaluationsClassroom Observation Grade (/60) 46.82(5.99) 44.84 (6.39) 11.85 (9.59)School Principal Grade (/100) 39.02(10.05) 39.15 (11.82) 13.86 (8.70)
Nb of teachers 193,766 67,541 23,035Note: Standard deviation in parenthesis. On average, regular teachers have 14.1 yearsof experience whereas tenured substitute teachers have 10 years of experience andcontract teachers only 4.6 years of experience.
30
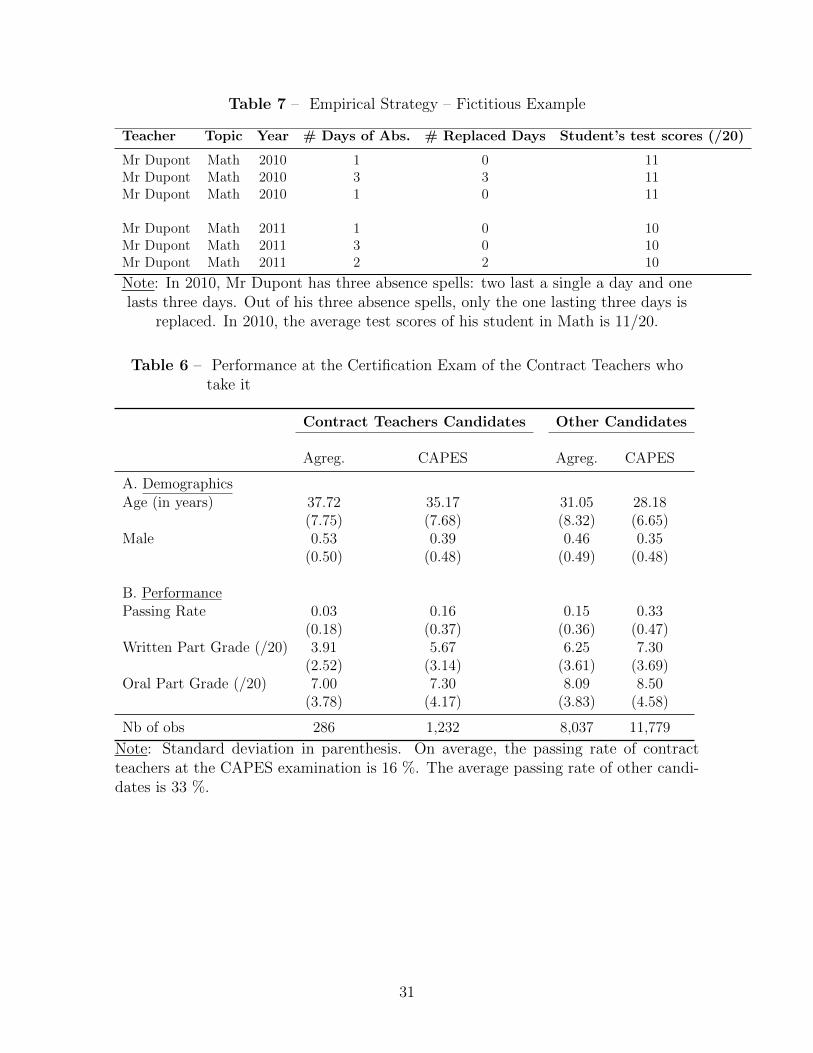
Table 7 – Empirical Strategy – Fictitious Example
Teacher Topic Year # Days of Abs. # Replaced Days Student’s test scores (/20)
Mr Dupont Math 2010 1 0 11Mr Dupont Math 2010 3 3 11Mr Dupont Math 2010 1 0 11
Mr Dupont Math 2011 1 0 10Mr Dupont Math 2011 3 0 10Mr Dupont Math 2011 2 2 10
Note: In 2010, Mr Dupont has three absence spells: two last a single a day and onelasts three days. Out of his three absence spells, only the one lasting three days is
replaced. In 2010, the average test scores of his student in Math is 11/20.
Table 6 – Performance at the Certification Exam of the Contract Teachers whotake it
Contract Teachers Candidates Other Candidates
Agreg. CAPES Agreg. CAPES
A. DemographicsAge (in years) 37.72 35.17 31.05 28.18
(7.75) (7.68) (8.32) (6.65)Male 0.53 0.39 0.46 0.35
(0.50) (0.48) (0.49) (0.48)
B. PerformancePassing Rate 0.03 0.16 0.15 0.33
(0.18) (0.37) (0.36) (0.47)Written Part Grade (/20) 3.91 5.67 6.25 7.30
(2.52) (3.14) (3.61) (3.69)Oral Part Grade (/20) 7.00 7.30 8.09 8.50
(3.78) (4.17) (3.83) (4.58)
Nb of obs 286 1,232 8,037 11,779
Note: Standard deviation in parenthesis. On average, the passing rate of contractteachers at the CAPES examination is 16 %. The average passing rate of other candi-dates is 33 %.
31

Table 8 – Empirical Strategy with Student Fixed Effects – Fictitious Example
Teacher Topic Student Year Nb days of Nb of Student’steacher’s abs. replaced days test scores (/20)
Mr Dupont Math Caroline 2010 10 2 6Mr Pierre French Caroline 2010 0 0 10Mr Jacques History Caroline 2010 5 5 12
Note: In 2010, Mr Dupont is the Math teacher of Caroline. Mr Dupont is absent 10days, and 2 days are replaced. Caroline’s test scores in the 9th grade exam in Math is6/20.
32

Table 9 – Regression Estimates of the Relationship between Ab-sence/Replacement and Teacher Characteristics
# Abs. Days Share Replaced Days Share Replaced x Contr. Share Replaced x Tenured Sub.(1) (2) (3) (4) (5) (6) (7) (8)
Experience (Ref: 6 + years)
One year or less of experience -4.976∗∗∗ -4.099 -0.043∗∗∗ -0.056∗∗∗ -0.012∗∗ -0.014 -0.031∗∗∗ -0.045∗∗∗
(1.255) (2.479) (0.008) (0.016) (0.005) (0.009) (0.006) (0.011)
Two years of experience -4.854∗∗∗ -5.415∗∗∗ -0.026∗∗∗ -0.0382∗∗∗ -0.008∗∗ -0.017∗∗∗ -0.018∗∗∗ -0.020∗∗
(0.613) (1.061) (0.005) (0.008) (0.002) (0.005) (0.004) (0.007)
Three years of experience -3.475∗∗∗ -4.059∗∗∗ -0.019∗∗∗ -0.025∗∗∗ -0.005∗ -0.011∗∗∗ -0.013∗∗∗ -0.0138∗∗
(0.455) (0.658) (0.004) (0.006) (0.002) (0.003) (0.003) (0.005)
Four years of experience -1.706∗∗∗ -2.711∗∗∗ -0.006∗ -0.012∗∗ -0.000 -0.006∗ -0.006∗ -0.007(0.377) (0.532) (0.003) (0.004) (0.002) (0.003) (0.002) (0.004)
Five years of experience 0.637 -0.681 0.008∗∗ 0.000 0.007∗∗∗ 0.000 0.001 0.000(0.350) (0.449) (0.002) (0.003) (0.001) (0.002) (0.002) (0.003)
Seniority (Ref.: 6 + years)
One year of seniority 5.320 22.930 0.498∗∗ 0.649∗∗ 0.332 0.294 0.167 0.356(10.26) (13.150) (0.210) (0.257) (0.200) (0.263) (0.177) (0.319)
Two years of seniority 3.084∗∗∗ 0.004 0.018∗∗∗ 0.004 0.007∗∗∗ -0.002 0.012∗∗∗ 0.006∗
(0.268) (0.437) (0.001) (0.003) (0.001) (0.002) (0.001) (0.003)
Three years of seniority 1.545∗∗∗ 1.001∗∗ 0.012∗∗∗ 0.0111∗∗∗ 0.005∗∗∗ 0.002 0.008∗∗∗ 0.009∗∗∗
(0.223) (0.365) (0.00171) (0.002) (0.000) (0.001) (0.001) (0.002)
Four years of seniority 1.368∗∗∗ 1.112∗∗∗ 0.011∗∗∗ 0.0101∗∗∗ 0.005∗∗∗ 0.002 0.006∗∗∗ 0.007∗∗∗
(0.222) (0.315) (0.001) (0.002) (0.000) (0.001) (0.001) (0.002)
Five years of seniority 0.695∗∗∗ 0.374 0.007∗∗∗ 0.004∗∗ 0.004∗∗∗ 0.001 0.003∗∗∗ 0.003(0.205) (0.275) (0.001) (0.002) (0.000) (0.001) (0.001) (0.001)
EvaluationsClassrom Obs. Eval. -0.266∗∗∗ 0.0115 -0.001∗∗∗ 0.000 -0.000 -0.000 -0.000 0.000
(0.0170) (0.0371) (0.000) (0.000) (0.000) (0.000) (0.000) (0.000)
School Principal Eval. -0.532∗∗∗ -0.222∗∗∗ -0.004∗∗∗ -0.002∗∗∗ -0.001∗∗∗ -0.000 -0.003∗∗∗ -0.002∗∗
(0.065) (0.075) (0.000) (0.000) (0.000) (0.000) (0.000) (0.000)
Student CompositionProp. of financial aid students -0.492* 0.901* -0.007∗∗∗ 0.002 0.003∗∗∗ 0.001 -0.009∗∗∗ 0.001
(0.339) (0.530) (0.002) (0.006) (0.001) (0.002) (0.001) (0.005)GenderMale -4.688∗∗∗ -0.029∗∗∗ -0.013∗∗∗ -0.017∗∗∗
(0.124) (0.000) (0.000) (0.000)
Certification Level (Ref: Capes)
Agregation 0.383 0.003 0.002∗ 0.001(0.219) (0.002) (0.000) (0.001)
Teaching Topic (Ref.: History)
French 0.855∗∗∗ -0.002∗ 0.002∗∗∗ -0.003∗∗∗
(0.158) (0.001) (0.0005) (0.002)
Math -0.851∗∗∗ -0.002∗∗ 0.007∗∗∗ -0.010∗∗∗
(0.144) (0.001) (0.000) (0.000)
Teacher - school fixed effects No Yes No Yes No Yes No YesNb. of obs. 282,001 282,001 282,001 282,001 282,001 282,001 282,001 282,001
* Each column corresponds to a single regression. Results are reported in percentageof a standard deviation. All regressions include year fixed effects. Robust standarderrors clustered by teacher-school.Note: With teacher-school fixed effects, the relationship between the share of financialaid students assigned to a teacher and her share of replaced absent days is negativeand statistically significant at the 1 % level.
33

Table 10 – Effect of Absence and Replaced Days on Student Test Scores in 9thGrade
in % of a SD (1) (2) (3)
# days of absence -0.130*** -0.044*** -0.053***(0.009) (0.006) (0.005)
# replaced days 0.056*** 0.010* 0.010*(0.011) (0.006) (0.006)
Av. nb of days of abs. [13.14] [13.14] [13.14]Av. nb of replaced days [10.06] [10.06] [10.06]
Teacher-School Fixed effect No Yes YesTeacher experience & seniority* No Yes YesStudent background** No No Yes
Number of observations 32,290,084 32,290,084 32,290,084
* Quadratic function of teacher experience and of teacher seniority. ** Student back-ground: parents’ occupation and financial aid status. Each column corresponds to asingle regression. Results are reported in percentage of a standard deviation. All re-gressions include year x topic fixed effects. Robust standard errors clustered by school.Note: With teacher-school fixed effects, teacher experience and seniority and studentbackground as controls (column 3), the marginal impact of one day of absence isto reduce student test score by 0.04 % of a standard deviation. The coefficient isstatistically significant at the 1 % level. The number of replaced days does not haveany statistically significant impact on student test scores.
34

Table 11 – Effect of Absence and Replaced Days on Student Test Scores in 9thGrade by Type of Substitute Teacher
in % of a SD (1) (2) (3)
# days of absence -0.132*** -0.052*** -0.051***(0.010) (0.005) (0.005)
# replaced days x tenured sub. 0.072*** 0.016*** 0.019***(0.011) (0.006) (0.005)
# replaced days x contract sub. 0.024** -0.010 -0.006(0.012) (0.007) (0.007)
Average # days of abs. [13.14] [13.14] [13.14]Average # replaced days tenured sub. [7.73] [7.73] [7.73]Average # replaced days contract sub. [2.22] [2.22] [2.22]
Teacher - school fixed effect No Yes YesTeacher experience & seniority* No Yes YesStudent background** No No Yes
Number of observations 32,290,084 32,290,084 32,290,084
* Quadratic function of teacher experience and of teacher seniority. ** Student back-ground: parents’ occupation and financial aid status. Each column corresponds to asingle regression. Results are reported in percentage of a standard deviation. Robuststandard errors clustered by school.Note: With teacher fixed effects and teacher experience and seniority as controls (col-umn 3), the marginal impact of one replaced day with a tenured substitute teacher isto increase student achievement by 0.016 % of a standard deviation. It correspondsto 30 % of the impact of teacher absence. The marginal impact of one replaced daywith a contract substitute teacher is to decrease student achievement by 0.009 % of astandard deviation. It corresponds to 17 % of the impact of teacher absence.
35

Table 12 – Effect of Absence and Replaced Days on Student Test Scores in 9thGrade by Length of Absence Spell
(in % of a SD) Impact on student test scores of...# Days of Absence # Days of Absence # Replaced Days # Replaced DaysSmaller or Equal than... with Contract Sub. with Tenured Sub.
5 -0.19*** -0.10 -0.16(0.02) (0.12) (0.11)
10 -0.20*** -0.14 -0.05(0.01) (0.12) (0.04)
15 -0.15*** -0.02 0.00(0.01) (0.04) (0.03)
20 -0.12*** -0.02 0.01(0.01) (0.03) (0.02)
25 -0.10*** -0.02 0.03*(0.01) (0.03) (0.02)
30 -0.14*** -0.02 0.03**(0.01) (0.02) (0.02)
35 -0.13*** -0.02 0.03**(0.01) (0.03) (0.02)
40 -0.12*** -0.02 0.03**(0.01) (0.03) (0.02)
45 -0.11*** -0.02 0.03**(0.01) (0.03) (0.02)
50 -0.10*** -0.02 0.03**(0.01) (0.03) (0.02)
55 -0.09*** -0.02 0.03***(0.00) (0.03) (0.01)
60 -0.08*** -0.01 0.03***(0.00) (0.03) (0.00)
65 -0.08*** -0.01 0.03***(0.00) (0.03) (0.00)
75 -0.07*** -0.00 0.03***(0.00) (0.03) (0.00)
86 -0.07*** -0.00 0.03***(0.00) (0.03) (0.00)
96 -0.07*** -0.00 0.03***(0.00) (0.03) (0.00)
106 -0.06*** -0.01 0.03***(0.00) (0.01) (0.00)
126 -0.05*** -0.01 0.02***(0.00) (0.01) (0.00)
180 (All) -0.05*** -0.01* 0.02***(0.00) (0.01) (0.00)
Each line corresponds to a single regression. The dependent variable is student testscores in 9th grade. The regression includes teacher-school fixed effects, teacher expe-rience, the square of teacher experience, topic fixed effects, year fixed effects, topic xyear fixed effects, student background (parental occupation and financial aid status).Robust standard errors clustered by school.Notes: For absence spells lasting less than five days (first line), the marginal impactof one additional day of absence is to reduce student test scores by 0.2 % of a stan-dard deviation. The marginal effects of one additional replaced day with a contractsubstitute teacher or with a tenured substitute teacher is not statistically significant.
36

Table 13 – Impact of days of absence/replacement (in % of standard deviation)in Disadvantaged Schools
Non Disadvantaged DisadvantagedSchool School
# Days of Absence -0.045*** -0.072***(0.005) (0.009)
Av. nb of days [12.47] [10.42]# Replaced Days x Tenured Sub. 0.013** 0.033***
(0.006) (0.013)Av. nb of days [6.20] [2.33]# Replaced Days x Contract Sub. -0.009 -0.001
(0.007) (0.014)Av. nb of days [3.80] [5.22]
Teacher-school fixed effects Yes YesTeacher experience & seniority Yes YesStudent background Yes YesNumber of observations 26,405,328 5,940,132
Notes: Disadvantaged schools are defined as those who belong to the national programEducation prioritaire. In disadvantaged schools, the marginal impact of absence is toreduce student test scores by 0.45 % of a standard deviation.
37

Table 14 – Robustness Check: Placebo Test of the Effect of Absence and Re-placed Days of “Other Subject” Teacher on Student Test Scores in9th Grade
Math Exam French Exam History Exam(1) (2) (3) (4) (5) (6)
A. Math Teacher
# Days of Absence -0.081*** -0.078*** -0.00 0.004 -0.009 -0.002(0.009) (0.009) (0.00) (0.009) (0.010) (0.010)
# Replaced Days 0.001 -0.00 0.000(0.001) (0.00) (0.000)
# Replaced Days x Tenured Sub. 0.007 -0.007 -0.002(0.011) (0.010) (0.011)
# Replaced Days x Contract Sub. -0.012 -0.004 0.003(0.011) (0.010) (0.011)
Math Teacher - School Fixed Effect Yes Yes Yes Yes Yes Yes
B. French Teacher(with French Teacher -school fixed effects)# Days of Absence -0.011 -0.007 -0.044*** -0.035*** -0.020 -0.016
(0.007) (0.007) (0.007) (0.005) (0.013) (0.10)# Replaced Days -0.002 0.013 0.013
(0.009) (0.009) (0.009)# Replaced Days x Tenured Sub. 0.004 0.016** 0.017
(0.008) (0.008) (0.010)# Replaced Days x Contract Sub. -0.012 -0.005 0.007
(0.010) (0.010) (0.010French Teacher - School Fixed Effect Yes Yes Yes Yes Yes Yes
C.History Teacher# Days of Absence -0.004 -0.000 -0.005 -.001 -0.038*** - 0.035***
(0.099) (0.010) (0.009) (0.010) (0.010) (0.011)# Replaced Days -0.013 -0.003 0.013
(0.011) (0.011) (0.012)# Replaced Days x Tenured Sub. -0.014 -0.001 0.013
(0.011) (0.011) (0.013)
# Replaced Days x Contract Sub. -0.025 -0.013 -0.002(0.020) (0.011) (0.014)
History Teacher - School Fixed Effect Yes Yes Yes Yes Yes Yes
Each column corresponds to a single regression. The dependent variable is student testscores in 9th grade. All regressions include topic fixed effects, year fixed effects, topicx year fixed effects. Robust standard errors clustered by school.Notes: With the Math exam test scores as the dependent variable (panel A, columns1 to 6)
38

Table 15 – Robustness Check: Effect of Absence and Replaced Days on StudentTest Scores in 9th Grade with Student Fixed Effects
(1) (2) (3) (4)
# Days of Absence -0.047*** -0.051*** -0.046*** -0.051***(0.001) (0.005) (0.001) (0.005)
# Replaced Days 0.002 0.009(0.001) (0.006)
# Replaced Days x Tenured Sub. 0.018*** 0.019***(0.005) (0.006)
# Replaced Days x Contract Sub. -0.009 -0.011(0.006) (0.007)
Teacher Fixed effect No Yes No YesTeacher experience & seniority Yes Yes Yes YesStudent fixed effect Yes No Yes NoNumber of observations 32,290,084 32,290,084 32,290,084 32,290,084
Notes: With student fixed effects (Columns 1 and 2), the marginal effect of one ad-ditional day of absence is to reduce student achievement by 0.05 % of a standarddeviation. With this specification, the overall marginal impact of replacement is notstatistically significant, but the marginal impact of one replaced day with a tenuredsubstitute is to increase student test scores by 0.02 % of a standard deviation and isstatistically significant at the 1 % level.
39

Table 16 – Robustness Check: Placebo Test of the Effect of Absence and Re-placed Days of Previous and Following Year on Student Test Scoresin 9th Grade
Previous year Following year(1) (2) (3) (4)
# Days of Absence 0.004 0.003 0.002 0.000(0.019) (0.020) (0.013) (0.013)
# Replaced Days 0.015 0.004(0.023) (0.018)
# Replaced Days x Tenured Sub. 0.023 0.003(0.027) (0.020)
# Replaced Days x Contract Sub. 0.008 0.018(0.029) (0.027)
Teacher - school fixed effect No No Yes YesTeacher experience & seniority* Yes Yes Yes YesStudent background** Yes Yes Yes YesNumber of observations 31,643,528 31,643,528 31,643,528 31,643,528
* Quadratic function of teacher experience and of teacher seniority. ** Student back-ground: parents’ occupation and financial aid status. Each column corresponds to asingle regression. Results are reported in percentage of a standard deviation. The levelof observation is teacher/topic x student x year. All regressions include year x topicfixed effects. Robust standard errors clustered by teacher-school. Robust standarderrors clustered by school.Notes: In columns 1 and 2, the number of days of absence, number of replaced daysand number of replaced days with the two types of substitute teachers of the previousyear are used as independent variables. Column 1 shows that the marginal impact ofone additional day of absence and replacement of the teacher in the year n − 1 doesnot have any statistically significant impact on her student test scores, assigned to herduring the year n.
40

Table 18 – Impact of Absence and Replacement by Type of Absence (Maternityleave vs. others) on Student Test Scores
N = 32,290,084 # Days of Abs. # Replaced Days # Replaced Daysx Tenured Sub. x Contract. Sub.
in % of a SD (1) (2) (3)
Maternity Leave -0.036*** 0.015*** 0.002(0.007) (0.008) (0.009)[53.67] [21.67] [12.14]
Non Maternity Leave -0.056*** 0.021*** -0.060*(same length) (0.007) (0.008) (0.030)
[49.30] [16.69] [8.42]
Note: Estimates corresponds to a single regression with the preferred specification.Results are reported in percentage of a standard deviation of student test scores.
Table 17 – Robustness Effect of Teacher Absence Spells During Holidays onStudent Test Scores in 9th Grade
in % of a SD (1) (2)
# days of holiday absence 0.029 0.027(0.035) (0.024)
Teacher-School Fixed effect No YesTeacher experience & seniority* No YesStudent background** No Yes
Number of observations 32,290,084 32,290,084
* Quadratic function of teacher experience and of teacher seniority. ** Student back-ground: parents’ occupation and financial aid status. Each column corresponds to asingle regression. Results are reported in percentage of a standard deviation. All re-gressions include year x topic fixed effects. Robust standard errors clustered by school.
41

Figure 1 – Share of Public Sector Workers Taking at Least One Minor SicknessLeave in 2013
0%
5%
10%
15%
20%
25%
30%
35%
Contract Worker in Public Sector
Civil Servant with College degree
Civil Servant with High School Degree
Tenured Teacher Civil Servant with Less than a High School Degree
Shar
e of
pub
lic se
ctor
wor
kers
Average All Public Sector
42

Figure 2 – Average Number of Absence for Minor Sickness per Teacher - Yearin England, the United States and France
0
1
2
3
4
5
6
England United States France
Aver
age
num
ber o
f mis
sing
day
s for
sick
ness
le
ave
per t
each
er -
year
Source: Hermann and Rockoff (2012); English Department of Education (2016) andauthor’s computations. Notes: In England, the average number of days of absencetaken for minor sickness is 5 days per teacher-year.
43

Figure 3 – Distribution of Absence Spells by Teacher-Year
Note: 55 % of secondary teachers do not take any absence spell per year.
44

Figure 4 – Average Absence Rate per School Week
Note: During the first week of September, approximately 1.5 % of secondary teachersare absent.
45

Figure 5 – Number of Days of Absence and Replacement per Year
0
2
4
6
8
10
12
14
16
2007 2008 2009 2010 2011 2012 2013 2014 2015
Aver
age
Num
ber o
f Day
s per
Yea
r
Year
Number of Days of Absence
Number of Replaced Days
Number of Replaced Days with Tenured Substitute
Notes: In 2015, middle school teachers were on average absent 12 days. On average,the number of replaced days in 2015 is 10 days, which means that 78 % of absent daysare replaced. The average number of replaced days with a tenured substitute teacheris 5.55 days in 2015, which means that 55 % of replaced days are done by tenuredsubstitute teachers.
46

Figure 6 – Cumulative Distribution of Absence Spells per Length
35%
45%
55%
65%
75%
85%
95%
0 20 40 60 80 100 120 140 160 180Number of Days per Absence Spell
Notes: 36 % of absence spells taken by middle school teachers last only one day. 90 %of absence spells last less than 40 days.
47

Figure 7 – Replacement Rate per Length of Absence Spell
0.2
.4.6
.81
Rep
lace
ment
Rate
1 21 41 61 81 101 121 141 161 181Number of days per absence spells
All Contract Teacher
Notes: 70 % of absence spells lasting 40 days are replaced (black line). 10 % of absencespells lasting 40 days are replaced by a contract substitute teacher. This implies that60 % of 40 days absence spells are replaced by a tenured substitute teacher.
48

Figure 8 – Share of Contract Teacher per Year
2%
4%
6%
8%
10%
12%
14%
2006 2007 2008 2009 2010 2011 2012 2013 2014 2015
Shar
e of
Tea
cher
Year
Contract Teacher
Tenured Substitute Teacher
Notes: In 2015, 10 % of middle school teachers are tenured substitute teachers and8 % of middle school teachers are contract substitute teachers.
49

Figure 9 – Replacement Rate per Year
0%
5%
10%
15%
20%
25%
2006 2007 2008 2009 2010 2011 2012 2013 2014 2015
Re
pla
cem
en
t R
ate
Year
Total
Contract Sub.
Tenured Sub.
Notes: In 2015, 15 % of absence spells are replaced (black line). 10 % of absence spellsare replaced by a tenured substitute teacher (light grey line) and 5 % of absence spellsare replaced by a contract substitute teacher (dark grey line).
50

Figure 10 – Distribution of Absence Spells and Days per Type of Absence
(a) Distribution of the Number of Absence Spellsper Type of Absence
Meeting
Training
Family
Maternity Extension
Long Term Illness
Minor Sickness
Professional Illness
Maternity Leave
(b) Distribution of the Number ofAbsence Days per Type of Ab-sence
Meeting
Training
Family
Maternity ExtensionLong Term Illness
Minor Sickness
Professional Illness
Maternity Leave
Notes: Figure 10a plots the distribution of the number of absence spells (2006-2015)per type of absence. Absence spells for minor sickness account for 50 % of absencespells. Maternity leaves account for 3 % of absence spells. Figure 10b plots the distri-bution of the number of absence days per type of absence. Absences for minor sicknessaccount for 16 % of the total of absence days per year. Maternity leaves account for12 % of the total of absence days per year.
51

Figure 11 – Average Number of Days of Absence and Replacement per Type ofAbsence
(a) Short Term Absences
0
1
2
3
4
5
6
7
8
9
10
Meeting Training Family Maternity Extension
Minor Sickness
Num
ber o
f day
s Tenured Substitute Contract Substitute Non replaced days
(b) Long Term Absence
0
10
20
30
40
50
60
70
80
90
100
Maternity Leave Long Term Illness Professional Illness
Num
ber o
f Day
s Tenured SubstituteContract SubstituteNon Replaced Days
Notes: Figure 11a and Figure 11b plot, per type of absence the average numberdays of absence, number of non-replaced days, number of days replaced by a contractsubstitute teacher and number of days replaced by a tenured substitute teacher, peryear. Figure 11a focuses on short term absences: meetings, training, family reason,maternitiy extension and minor sickness. Figure 11b focuses on long term absences:maternity leave, long term illness and professional illness. For minor sickness, theaverage number of days of absence is 5.24 days per year, the average number of replaceddays by a tenured substitute teacher is 0.41 days per year and the average number ofreplaced days by a contract teacher is 0.06 days per year.
52

Figure 12 – Share of Substitute Teacher per Region (2015)
(a) Share of Contract Teachers
0% 2% 4% 6% 8% 10%
CAENBESANCON
AMIENSRENNES
STRASBOURGTOULOUSE
ROUENLYON
NANTESLILLE
PARISREIMS
GRENOBLELIMOGES
MONTPELLIERPOITIERS
AIX-MARSEILLEDIJON
VERSAILLESORLEANS-TOURS
NICENANCY-METZ
BORDEAUXCLERMONT-FERRAND
CRETEIL
Share of contract teachers
Contract Teacher
(b) Share of Tenured Substitute Teachers
0% 2% 4% 6% 8% 10% 12% 14%
RENNESPARIS
LIMOGESVERSAILLESTOULOUSE
AMIENSPOITIERS
REIMSLYON
ROUENSTRASBOURG
GRENOBLEBESANCON
CAENNICE
CRETEILCLERMONT-FERRAND
DIJONNANCY-METZ
MONTPELLIERBORDEAUX
AIX-MARSEILLELILLE
NANTESORLEANS-TOURS
Share of tenured substitute teachers
Tenured Substitute Teachers
Notes: In 2015, 10 % of secondary school teachers in the region of Creteil (EasternParisian suburb) are contract teachers.
53

Figure 13 – Replacement Rate per Region
(a) Replacement Rate per Region (2015)
0% 10% 20% 30% 40%
NICERENNES
GRENOBLECLERMONT-FERRAND
LILLEPARIS
STRASBOURGNANTES
LIMOGESBESANCON
LYONBORDEAUX
DIJONAIX-MARSEILLE
AMIENSMONTPELLIER
TOULOUSENANCY-METZ
POITIERSCAEN
VERSAILLESORLEANS-TOURS
ROUENREIMS
CRETEIL
Replacement Rate
Contract SubstituteTenured Substitute
(b) Replacement Rate per Year in Creteil and Nice Regions
0%
1%
2%
3%
4%
5%
6%
7%
8%
9%
2006 2008 2010 2012 2014
Repl
acem
ent
Rate
A. CRETEIL
0%
10%
20%
30%
40%
50%
60%
2006 2008 2010 2012 2014
B. NICE
TotalContract Sub.Tenured Sub.
Notes: In the Creteil region (Eastern Parisian suburb), 6% of absence spells arereplaced in 2015. 45 % of replacement spells are made by tenured substitute teachersin the Creteil region in 2015. In the Nice region (French Riviera), 44 % of absencespells are replaced in 2015. 70 % of replacement spells are made by tenured substituteteachers in the Nice region.
54

Figure 14 – Impact of Absence/Replacement on 9th Grade Student Test Scoresper Month of the Year
(a) Impact of absence
-0.20%
-0.15%
-0.10%
-0.05%
0.00%
Month of beginning of absence spell
Sept Oct Nov Dec Jan Feb Mar Apr May Jun
(b) Impact of tenured substitute
-0.05%
0.00%
0.05%
0.10%
0.15%
Month of beginning of absence spell
Sept Oct NovSept Oct Nov Dec Jan Feb Mar Apr May Jun
(c) Impact of contract teacher
-0.10%
-0.05%
0.00%
0.05%
0.10%
0.15%
Month of beginning of absence spell
Sept Oct Nov Dec Jan Feb Mar Apr May Jun
Notes: These figures corresponds to a single regression, with the preferred specifica-tion. It reports the marginal impact of one day of absence/replacement with a tenuredsubstitute/replacement with a contract teacher on 9th grade student test scores bymonth of beginning of the absence spell.
55

Figure 15 – Impact of Absence/Replacement by Teaching Topic
-0.11%
-0.09%
-0.07%
-0.05%
-0.03%
-0.01%
0.01%
0.03%
0.05%
Abs Contr Tenured Abs ContrContr TenuredAbsTenured Contr
MATH HISTORY FRENCH
Notes: All reported estimates correspond to a single regression with the preferredspecification. Estimates by topic are estimated through interaction terms. For eachtopic, the first reported estimates corresponds to the number of days of absence, thesecond to the number of days with a contract teacher and the third to the number ofdays with a tenured substitute teacher. The marginal impact of one day of absence ofthe Math teacher is to reduce student test scores by 0.86 % of a standard deviation.This impact is statistically significant at the five percent level.
56
Related Documents


