ABOUT THE MARRIOTT FACT BOOK This booklet provides certain financial and operating information about Marriott International, Inc. It is intended to be used as a supplement to Marriott’s Annual Report and quarterly reports on Form 10-K and 10-Q, and therefore does not include the Company’s consolidated financial statements and notes. Marriott believes that the information contained in this booklet is correct in all material respects as of the date set forth below. However, such information is subject to change. December 31, 2017 CONTENTS I. Corporate Profile Page 1 II. Lodging Fees Page 2 III. Stock Information Page 3 IV. Corporate History Page 7 V. Domestic & International Room & Unit Counts Page A VI. Domestic Room & Unit Counts Page B VII. International Room & Unit Counts Page C VIII. Conversion of Hotels to Marriott Brands Page D IX. Deflagged Hotels Page E X. North American Company Operated Statistics (1996 – 2016) Page F XI. North American Systemwide Statistics (2003 – 2016) Page G XII. Full Service, International, and Luxury Statistics (1980 – 2016) Page H XIII. Limited Service Statistics (1980 – 2016) Page I XIV. North American Statistics (Pro Forma 2016 – Present) Page J XV. International Regional Statistics (2003 – Present) Page K

Welcome message from author
This document is posted to help you gain knowledge. Please leave a comment to let me know what you think about it! Share it to your friends and learn new things together.
Transcript

ABOUT THE MARRIOTT FACT BOOK This booklet provides certain financial and operating information about Marriott International, Inc. It is intended to be used as a supplement to Marriott’s Annual Report and quarterly reports on Form 10-K and 10-Q, and therefore does not include the Company’s consolidated financial statements and notes. Marriott believes that the information contained in this booklet is correct in all material respects as of the date set forth below. However, such information is subject to change. December 31, 2017 CONTENTS I. Corporate Profile Page 1 II. Lodging Fees Page 2 III. Stock Information Page 3 IV. Corporate History Page 7 V. Domestic & International Room & Unit Counts Page A VI. Domestic Room & Unit Counts Page B VII. International Room & Unit Counts Page C VIII. Conversion of Hotels to Marriott Brands Page D IX. Deflagged Hotels Page E X. North American Company Operated Statistics (1996 – 2016) Page F XI. North American Systemwide Statistics (2003 – 2016) Page G XII. Full Service, International, and Luxury Statistics (1980 – 2016) Page H XIII. Limited Service Statistics (1980 – 2016) Page I XIV. North American Statistics (Pro Forma 2016 – Present) Page J XV. International Regional Statistics (2003 – Present) Page K

I. CORPORATE PROFILE Marriott International, Inc. (NASDAQ: MAR) is the world’s largest hotel company based in Bethesda, Maryland, USA, with more than 6,500 properties in 127 countries and territories. Marriott operates and franchises hotels and licenses vacation ownership resorts. The company’s 30 leading brands include: Bulgari®, The Ritz-Carlton® and The Ritz-Carlton Reserve®, St. Regis®, W®, EDITION®, JW Marriott®, The Luxury Collection®, Marriott Hotels®, Westin®, Le Méridien®, Renaissance® Hotels, Sheraton®, Delta Hotels by MarriottSM, Marriott Executive Apartments®, Marriott Vacation Club®, Autograph Collection® Hotels, Tribute Portfolio™, Design Hotels™, Gaylord Hotels®, Courtyard®, Four Points® by Sheraton, SpringHill Suites®, Fairfield Inn & Suites®, Residence Inn®, TownePlace Suites®, AC Hotels by Marriott®, Aloft®, Element®, Moxy® Hotels, and Protea Hotels by Marriott®. The company also operates award-winning loyalty programs: Marriott Rewards®, which includes The Ritz-Carlton Rewards®, and Starwood Preferred Guest®. For more information, please visit our website at www.marriott.com, and for the latest company news, visit www.marriottnewscenter.com and @MarriottIntl. Corporate Office Investor Contact Marriott International, Inc. Laura Paugh, Senior Vice President, Investor Relations 10400 Fernwood Road [email protected] Bethesda, MD 20817 (301) 380-7418 (301) 380-3000 Betsy Dahm, Senior Director, Investor Relations [email protected]
(301) 380-3372 (301) 380-5067 fax

II. LODGING FEES
Notes to graph: For 2010, fee amounts shown are as reported. Assuming the timeshare spin-off had occurred on the first day of fiscal 2010, full year 2010 fees would have been as follows: $1,189 million of total fees, $182 million of incentive management fees, $505 million of franchise fees and $502 million of base management fees. For 2011, fee amounts shown have been adjusted as if the timeshare spin-off had occurred on the first day of fiscal 2010.
For 2015 Pro Forma (2015P) and 2016 Pro Forma (2016P), fee amounts shown reflect the combined company assuming Marriott’s acquisition of Starwood and Starwood’s sale of its timeshare business had been completed on January 1, 2015. Begining in the first quarter of 2017, credit card and residential branding fees will be reported in Franchise fee revenue. The pro forma fee amounts for 2015 and 2016 also reflect that change.
1999 2000 2001 2002 2003 2004 2005 2006 2007 2008 2009 2010 2011 2012 2013 2014 2015 2016 2015P 2016P 2017
Base Mgt. Fees 352 383 372 379 388 435 497 553 620 635 530 562 546 581 621 672 698 806 1,064 1,072 1,102Franchise Fees 180 208 220 232 245 296 329 390 439 451 400 441 566 607 666 745 853 988 1,315 1,438 1,618Incentive Mgt. Fees 268 316 202 162 109 142 201 281 369 311 154 182 195 232 256 302 319 425 529 562 607
0200400600800
1,0001,2001,4001,6001,8002,0002,2002,4002,6002,8003,0003,2003,400
Revenue($ In Millions)

III. STOCK INFORMATION Stock symbol: MAR Listed on NASDAQ Marriott Corporation was founded in 1927 Marriott Corporation went public in 1953 Stock split history
- Two-for-one split 1960
- Two-for-one split 1965
- Two-for-one split 1968
- Two-for-one split 1972
- Five-for-one split 1986
- Two-for-one split 1998 (in conjunction with Sodexho Marriott Services spin-off)
- Two-for-one split 2006 (effective June 9, 2006)
Marriott International was spun off from Marriott Corporation on October 8, 1993. Marriott
Corporation then changed its name to Host Marriott Corporation. Marriott International was spun off again on March 27, 1998. Following a merger, the old Marriott
International became Sodexho Marriott Services. The new spun-off entity comprised of the lodging, distribution services and senior living services businesses was named Marriott International, Inc.
Marriott Vacations Worldwide Corporation was spun off from Marriott International, Inc. on
November 21, 2011. Shareholders of Marriott International, Inc. received a tax-free dividend of one share of Marriott Vacations Worldwide Stock for every 10 shares of Marriott International, Inc. Shareholders received cash in lieu of fractional shares of Marriott Vacations Worldwide Corporation.
On September 23, 2016, Marriott International, Inc. completed its acquisition of Starwood Hotels & Resorts Worldwide. Starwood shareholders received $21.00 in cash and 0.80 shares of Marriott International, Inc. Class A common stock for each share of Starwood Hotels & Resorts Worldwide, Inc. common stock.

1
III. STOCK INFORMATION (continued) Dividend History: NOTE: The dividend information below represents the dividend declared by the Board of Directors on the dividend declaration date and has not been retroactively adjusted for stock splits or stock dividends. Except where otherwise noted, the dividends were cash dividends.
Year Amount Declaration
Date Record Date Payable Date
2017 4th Qtr $0.3000 per share 11/9/2017 11/22/2017 12/29/2017 3rd Qtr $0.3300 per share 8/10/2017 8/24/2017 9/29/2017 2nd Qtr $0.3300 per share 5/5/2017 5/19/2017 6/30/2017 1st Qtr $0.3000 per share 2/10/2017 2/24/2017 3/31/2017
2016 4th Qtr $0.3000 per share 11/10/2016 11/24/2016 12/30/2016 3rd Qtr $0.3000 per share 9/13/2016 9/23/2016 9/30/2016 2nd Qtr $0.3000 per share 5/6/2016 5/20/2016 6/30/2016 1st Qtr $0.2500 per share 2/11/2016 2/25/2016 3/31/2016
2015 4th Qtr $0.2500 per share 11/5/2015 11/19/2015 12/28/2015 3rd Qtr $0.2500 per share 8/6/2015 8/20/2015 9/25/2015 2nd Qtr $0.2500 per share 5/8/2015 5/22/2015 6/26/2015 1st Qtr $0.2000 per share 2/12/2015 2/27/2015 3/27/2015
2014 4th Qtr $0.2000 per share 11/6/2014 11/20/2014 12/26/2014 3rd Qtr $0.2000 per share 8/7/2014 8/21/2014 9/26/2014 2nd Qtr $0.2000 per share 5/9/2014 5/23/2014 6/27/2014 1st Qtr $0.1700 per share 2/14/2014 2/28/2014 3/28/2014
2013
4th Qtr $0.1700 per share 11/7/2013 11/21/2013 12/27/2013 3rd Qtr $0.1700 per share 8/8/2013 8/22/2013 9/27/2013 2nd Qtr $0.1700 per share 5/10/2013 5/24/2013 6/28/2013 1st Qtr $0.1300 per share 2/15/2013 3/1/2013 3/29/2013
2012
4th Qtr $0.1300 per share 11/9/2012 11/23/2012 12/28/2012 3rd Qtr $0.1300 per share 8/9/2012 8/23/2012 9/14/2012 2nd Qtr $0.1300 per share 5/4/2012 5/18/2012 6/22/2012 1st Qtr $0.1000 per share 2/10/2012 2/24/2012 3/30/2012

2
III. STOCK INFORMATION (continued)
Year Amount Declaration
Date Record Date Payable Date
2011
4th Qtr $0.1000 per share 11/10/2011 11/29/2011 1/6/2012
3rd Qtr $0.1000 per share 8/4/2011 8/18/2011 9/16/2011
2nd Qtr $0.1000 per share 5/6/2011 5/20/2011 6/24/2011
1st Qtr $0.0875 per share 2/11/2011 2/25/2011 4/1/2011
2010
4th Qtr $0.0875 per share 11/4/2010 11/18/2010 1/7/2011 3rd Qtr $0.0400 per share 8/5/2010 8/19/2010 9/17/2010 2nd Qtr $0.0400 per share 5/7/2010 5/21/2010 6/25/2010 1st Qtr $0.0400 per share 2/4/2010 2/19/2010 4/9/2010
2009 4th Qtr 0.00341 per share stock dividend 11/5/2009 11/19/2009 12/3/2009 3rd Qtr 0.00379 per share stock dividend 8/6/2009 8/20/2009 9/3/2009 2nd Qtr 0.00369 per share stock dividend 5/1/2009 6/25/2009 7/30/2009 1st Qtr $0.0875 per share 2/5/2009 4/1/2009 4/29/2009
2008 4th Qtr $0.0875 per share 11/6/2008 12/1/2008 1/9/2009 3rd Qtr $0.0875 per share 8/7/2008 9/11/2008 10/3/2008 2nd Qtr $0.0875 per share 5/2/2008 6/26/2008 8/1/2008 1st Qtr $0.0750 per share 2/7/2008 4/3/2008 5/1/2008
2007
4th Qtr $0.0750 per share 11/8/2007 12/6/2007 1/9/2008 3rd Qtr $0.0750 per share 8/2/2007 9/6/2007 10/23/2007 2nd Qtr $0.0750 per share 4/27/2007 6/21/2007 7/20/2007 1st Qtr $0.0625 per share 2/1/2007 3/30/2007 4/27/2007
2006
4th Qtr $0.0625 per share 12/7/2006 1/10/2007 3rd Qtr $0.0625 per share 9/1/2006 10/13/2006 2nd Qtr* $0.0625 per share 6/22/2006 7/21/2006 1st Qtr $0.1050 per share 3/31/2006 4/28/2006
2005 4th Qtr $0.105 per share 12/15/2005 1/10/2006 3rd Qtr $0.105 per share 9/8/2005 10/17/2005 2nd Qtr $0.105 per share 6/23/2005 7/25/2005 1st Qtr $0.085 per share 3/31/2005 4/25/2005
3
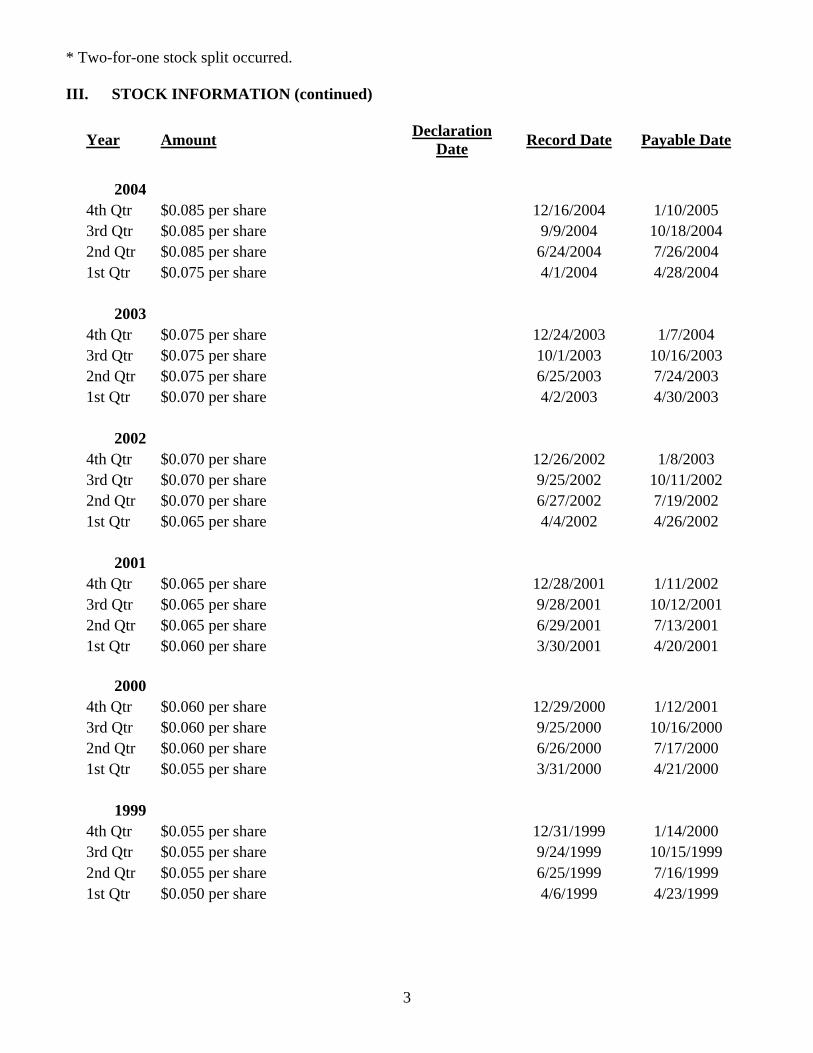
* Two-for-one stock split occurred. III. STOCK INFORMATION (continued)
Year Amount Declaration
Date Record Date Payable Date
2004 4th Qtr $0.085 per share 12/16/2004 1/10/2005 3rd Qtr $0.085 per share 9/9/2004 10/18/2004 2nd Qtr $0.085 per share 6/24/2004 7/26/2004 1st Qtr $0.075 per share 4/1/2004 4/28/2004
2003 4th Qtr $0.075 per share 12/24/2003 1/7/2004 3rd Qtr $0.075 per share 10/1/2003 10/16/2003 2nd Qtr $0.075 per share 6/25/2003 7/24/2003 1st Qtr $0.070 per share 4/2/2003 4/30/2003
2002 4th Qtr $0.070 per share 12/26/2002 1/8/2003 3rd Qtr $0.070 per share 9/25/2002 10/11/2002 2nd Qtr $0.070 per share 6/27/2002 7/19/2002 1st Qtr $0.065 per share 4/4/2002 4/26/2002
2001 4th Qtr $0.065 per share 12/28/2001 1/11/2002 3rd Qtr $0.065 per share 9/28/2001 10/12/2001 2nd Qtr $0.065 per share 6/29/2001 7/13/2001 1st Qtr $0.060 per share 3/30/2001 4/20/2001
2000
4th Qtr $0.060 per share 12/29/2000 1/12/2001 3rd Qtr $0.060 per share 9/25/2000 10/16/2000 2nd Qtr $0.060 per share 6/26/2000 7/17/2000 1st Qtr $0.055 per share 3/31/2000 4/21/2000
1999
4th Qtr $0.055 per share 12/31/1999 1/14/2000 3rd Qtr $0.055 per share 9/24/1999 10/15/1999 2nd Qtr $0.055 per share 6/25/1999 7/16/1999 1st Qtr $0.050 per share 4/6/1999 4/23/1999

4
IV. CORPORATE HISTORY 1927 At age 27, J. Willard Marriott enters business with the opening of a nine-seat root beer stand in
Washington, DC. Hot food later added and name changed to The Hot Shoppe. 1929 Marriott officially incorporated in the state of Delaware as Hot Shoppes, Inc. 1937 Marriott pioneers airline catering at Washington’s old Hoover Airfield (current site of the Pentagon)
serving Eastern, American and Capital Airlines. 1939 Beginning of food service management business with account at the U.S. Treasury building. Other
accounts soon followed at government defense plant cafeterias. 1953 Company stock first offered to the public at $10.25 per share. Offering sold out in two hours of
trading. 1955 Highway division begins with several shops on the New York State Thruway. 1957 Marriott opens first hotel, the Twin Bridges Marriott Motor Hotel, in Arlington, Virginia. 1964 Company name changes to Marriott-Hot Shoppes, Inc. and J.W. Marriott, Jr. elected president at age
32. 1966 Marriott becomes international, acquiring airline catering kitchen in Caracas, Venezuela. 1967 Marriott acquires 22-unit Big Boy restaurant chain from founder, Bob Wian. Corporate name changes from Hot Shoppes, Inc. to Marriott Corporation at annual shareholders
meeting.
1968 Marriott begins Roy Rogers fast food restaurant division with first location in Falls Church, Virginia. Stock first listed on the New York Stock Exchange – ticker symbol MHS. 1972 J.W. Marriott, Jr. succeeds his father as chief executive officer

5
IV. CORPORATE HISTORY (continued) 1979 Company moves to new international headquarters in Bethesda, Maryland. 1982 Marriott acquires Host International, and becomes the country’s largest operator of airport terminal
food, beverage and merchandise facilities. Marriott acquires Gino’s fast food restaurant chain, and plans to convert most units to Roy Rogers
restaurants. 1983 First Courtyard by Marriott, moderate price segment hotels, opens near Atlanta, Georgia. 1984 Marriott enters vacation timesharing business with acquisition of American Resorts Group. 1985 Marriott completes acquisition of Gladieux Corporation, a diversified food service company. Marriott completes acquisition of Service Systems, a contract food service company. J. Willard Marriott passes away at age 84. J.W. Marriott, Jr. named chairman of the board. Marriott acquires Howard Johnson Company, selling hotels to Prime Motor Inns and keeping 350
restaurants and 68 turnpike units. 1986 Marriott acquires Saga Corporation, a diversified food service management company, making Marriott
the largest food service management company in the United States. 1987 Marriott completes expansion of its Worldwide Reservation Center in Omaha, Nebraska, making it
the largest single-site reservations operation in U.S. hotel history. Marriott acquires The Residence Inn Company, an all-suite hotel chain targeted toward extended stay
travelers. Marriott stock listed on the Tokyo Stock Exchange. Marriott enters economy lodging segment with the opening of the first Fairfield Inn in Atlanta,
Georgia. Marriott transfers Big Boy restaurant system franchise rights to Elias Brothers of Warren, Michigan. 1988 Marriott acquires Basic American Retirement Communities (BARC) of Indianapolis, giving Marriott
a major presence in the rental retirement market. Marriott’s Senior Living Services division announces development plans for assisted living/personal
care complexes called Brighton Gardens.

6
IV. CORPORATE HISTORY (continued) 1989 Marriott acquires United Healthserv, Inc., a major provider of housekeeping, maintenance and laundry
services. Marriott completes transfer of airline catering division to CaterAir International, a private company
led by several members of Marriott’s In-flite Services division senior management. Marriott announces corporate restructuring. Plan includes sale of company’s fast food and family
restaurants. Company plans to sharpen focus on mega-markets in lodging and contract services. 1990 Marriott sells its Roy Rogers restaurant division to Hardee’s Food System for $365 million. 1992 Host completes acquisition of Dobbs airport concessions. Marriott Corporation announces plan to divide its operation into two separate companies through a
special dividend. 1993 Marriott completes split of its operations into two companies – Marriott International and Host
Marriott Corporation. 1995 Marriott International completes acquisition of 49 percent interest in The Ritz-Carlton Hotel
Company. Host Marriott Corporation announces plan to divide, through a special dividend, its operations into
two separate companies. Marriott Management Services acquires Taylorplan Services, a custodial and food service company
based in the United Kingdom. 1996 Host Marriott Corporation divides into two separate companies. Host Marriott continues to own
hotels and real estate; Host Marriott Services Corporation will operate concessions at airports, on toll roads and at sports and entertainment attractions.
Marriott introduces its new all-suite economy hotel – Fairfield Suites by Marriott. Marriott International acquires Forum Group, Inc., a leading operator of senior housing, and merges
it with Marriott’s Senior Living Services business. Marriott Management Services acquires Russell & Brand, Ltd., a UK-based food services company. Marriott International awarded nationwide food service distribution contract for Boston Market and
Einstein/Noah Bagel Corporation. 1997 Marriott International reports net income soared 24% in 1996 as sales top $10 billion. William J. Shaw named president and chief operating officer of Marriott International. Bill Marriott
retains position of chairman and chief executive officer.

7
IV. CORPORATE HISTORY (continued) 1997 (continued) Marriott introduces a new brand, Marriott Executive Residences. Marriott opens its first TownePlace Suites in Newport News, Virginia. Marriott International acquires Renaissance Hotel Group for approximately $1 billion. Adds three
brands (Renaissance, Ramada International and New World) and doubles Marriott’s presence overseas.
Marriott International launches “Marriott Rewards,” the world’s largest multi-brand frequent guest program.
Marriott International announces plans to merge its food service and facilities management business with Sodexho Alliance’s North American operations, and spin off to shareholders a new company comprised of its lodging, senior living and distribution service businesses.
1998 Marriott International increases its ownership interest in The Ritz-Carlton Company LLC to
approximately 98 percent. Marriott International completes spin off and merger transactions resulting in “New” Marriott
International and Sodexho Marriott Services. Marriott International announces it converted the Parc 55 Hotel in San Francisco to a Renaissance
hotel and designated it as Marriott’s 1,500th hotel world-wide. Marriott International announces conversion to single class of common stock effective May 21st. Marriott International confirms plans to convert Fairfield Suites to SpringHill Suites by Marriott. New
product positioned to capture share in the upper moderately priced all-suite lodging segment. 1999 Marriott International completes acquisition of ExecuStay; launches corporate housing business –
ExecuStay by Marriott. Marriott International named to Fortune 500 list of the largest U.S. companies – leads hotel industry
category. Marriott Vacation Club International launches new moderately priced resorts, Horizons by Marriott
Vacation Club, and luxury resorts, The Ritz-Carlton Club. ExecuStay by Marriott acquires Executive Living, Inc. of Columbus, Ohio, and enters into exclusive
agreement with JBI-Dallas. Marriott International, Inc. announces that its Marriott Rewards program is tripling the number of
hotels offering frequent flyer miles and more than doubling the number of miles previously offered at nine different brands, representing 1,650 hotels.
The last operating Hot Shoppe closes as Marriott tops 1,800 worldwide hotels – a historic mark for Marriott.
2000 Marriott announced the board of director’s approval of the purchase of an additional 25 million shares,
or about 10% of outstanding shares, through the company's ongoing share repurchase program. Marriott is named the official lodging supplier of the 2002 Winter Olympics and the 2000, 2002 and
2004 U.S. Olympic Teams.

8
IV. CORPORATE HISTORY (continued) 2000 (continued) Marriott announces the formation of a joint venture with Hyatt and Club Corporation to create the
largest, most comprehensive electronic procurement network. Marriott celebrated the opening of its 2,000th property with the Tampa, Florida Marriott Hotel. 2001 Travel industry impacted by difficult economic climate and events of September 11, 2001. Marriott restructuring and other charges in 2001 totaled $271 million, pretax. Net Income totaled
$236 million. Marriott opened nearly 50,000 lodging rooms worldwide in 2001. Marriott Rewards membership reaches 16 million travelers, remaining the largest and most preferred
loyalty program in the lodging industry. 2002 Marriott sold the businesses at nine distribution centers and closed four other centers, exiting Marriott
Distribution Service. Announced the plan to sell Marriott Senior Living Services to Sunrise Assisted Living, Inc. Marriott.com reached six million visits in one month. Reservations through Marriott.com grow 53%
versus 2001. With other lodging companies, Marriott formed travelweb.com for consumers who wish to
comparison shop. Opened the 2,500th hotel, the 950-room J.W. Marriott Desert Ridge Resort & Spa in Phoenix. 2003 Launched Marriott’s Look No Further, Best Rate Guarantee. One third of our room expansion (over 31,000 rooms) was from conversions to Marriott brands by
owners and franchisees of competitor brands. High-speed internet access available in 1400 hotels, far outpacing our competition. We also
introduced wireless internet access in lobbies, meeting rooms and public spaces in over 900 hotels. Marriott.com gross bookings topped $1.4 billion, 25 percent more than the prior year. 2004 Marriott added the 500,000th room to the system with the opening of the West India Quay Marriott in
London’s Canary Wharf. (Number of rooms at year end fell below 500,000 due to sale of the Ramada International brand.)
Marriott sold Ramada International brand to Cendant. Marriott.com gross bookings topped $1.8 billion, 41 percent more than the prior year. A record $650 million was returned to shareholders through the repurchase of 14 million shares of
stock. Announced Courtyard Joint Venture restructuring, which will result in a reduction of Marriott’s
interest in the joint venture to 21%, Host 4% and Sarofim 75%.

9
IV. CORPORATE HISTORY (continued) 2005 Marriott formed a joint venture with Whitbread PLC to acquire Whitbread’s portfolio of 46 franchised
Marriott and Renaissance hotels of over 8,000 rooms, and Marriott took over management of the entire portfolio.
Marriott, along with Sunstone Hotel Investors, Walton Street Capital and Tarsadia Hotels entered into an agreement to purchase 32 hotels and certain joint venture interests from CTF Holdings. The transaction was substantially completed in June 2005.
Marriott repurchased a record $1.65 billion of its stock. Internet gross bookings totaled $3.2 billion in 2005, 42 percent over 2004 levels. Nearly 85 percent
of internet gross bookings were made on Marriott.com. 2006 Marriott acquired the largest hotel in Paris; the 782 room Paris Rive Gauche Hotel and Conference
Center. Joint venture formed with Whitbread PLC sold to RBS. Internet gross bookings totaled $4.3 billion in 2006, 35 percent over 2005 levels. Nearly 87 percent of
internet gross bookings were made on Marriott.com. Marriott repurchased $1.58 billion of the company’s common stock. 2007 Marriott announced partnerships with Nickelodeon and Miller Global Properties, LLC, to co-develop
a new lodging resort brand and concept for travelers seeking fun and adventure, ‘Nickelodeon by Marriott.’
Marriott announced a partnership with the pioneer of the lifestyle boutique hotel, Ian Schrager, to create Edition, the first truly global boutique lifestyle hotel brand on a large scale.
Marriott celebrated the opening of its 3,000th property with the JW Marriott Hotel Beijing. Internet sales totaled $5.4 billion in 2007, 26 percent over 2006 levels. Over 87 percent of internet
sales were booked on Marriott.com. Marriott repurchased $1.78 billion of the company’s common stock. 2008 The travel industry was impacted by the significant economic decline affecting worldwide demand
and turmoil in the financial markets. Marriott restructuring and other charges in 2008 totaled $192 million pretax. Net income totaled $362
million. Marriott Rewards celebrated 25 years. With membership of 30 million, the program has 2,900
participating hotels in 65 countries. The company announced its five-point environmental plan to address climate change. As part of that
plan, Marriott committed $2 million to the Amazonas Sustainable Foundation to help protect 1.4 million acres of endangered rainforest.
Marriott opened over 33,000 rooms in 2008, nearly 25 percent of those rooms were outside North America.
Internet gross bookings totaled $6.4 billion in 2008, 19 percent over 2007 levels. Over 87 percent of internet sales were booked on Marriott.com. The company’s blog “Marriott on the Move” generated $2.6 million in gross bookings, while guests booked over $2 million using the new Marriott Mobile booking engine.

10
IV. CORPORATE HISTORY (continued) 2009 William J. Shaw named vice chairman of Marriott International, Arne M. Sorenson named president
and chief operating officer and Carl T. Berquist named executive vice president and chief financial officer. J. W. Marriott, Jr. retains position of chairman and chief executive officer and J. W. Marriott III continues to serve as vice chairman of the board of directors.
Marriott Vacation Club celebrated 25 years. With nearly 400,000 owners, the division has more than 50 Marriott Vacation Club resorts throughout the US, Caribbean, Europe and Asia.
Marriott restructuring and other charges in 2009 totaled $213 million pretax. The company also recorded non-cash pretax timeshare impairment changes of $752 million largely related to the plans to reduce prices and development at luxury fractional and residential resorts to accelerate cash flow. Reported net losses totaled $346 million.
Marriott opened over 38,000 rooms in 2009, nearly 25 percent of those rooms were outside North America.
Internet gross bookings totaled $6.0 billion in 2009, a 6 percent decline from 2008 levels. Over 85 percent of internet gross bookings were made on Marriott.com.
2010 Marriott announced its newest brand, the Autograph Collection, featuring independent hotels and
resorts around the world representing upper-upscale and luxury properties with distinctive personalities and added 13 hotels to the brand during the year.
The company opened its first EDITION hotel in Waikiki, Hawaii. Marriott Vacation Club International launched the Marriott Vacation Club Destinations™ points
program in North America allowing customers to make purchases in smaller increments than the traditional one-week product and providing greater flexibility of use.
Ritz-Carlton introduced its luxury frequent guest stay program, The Ritz-Carlton Rewards. Marriott opened nearly 29,000 rooms in 2010, nearly 30 percent of those rooms were outside North
America. In 2010, Marriott’s net income totaled $458 million, a dramatic improvement over 2009 results.
Worldwide comparable systemwide revenue per available room rose nearly 6 percent on a constant dollar basis.
2011 Marriott International completes spin-off of its timeshare business into the newly formed Marriott
Vacations Worldwide Corporation (NYSE: VAC). Marriott opened nearly 32,000 rooms in 2011, over 60 percent of those rooms were outside North
America. Marriott International and AC Hotels announced the formation of a joint venture to manage and
franchise a new lodging co-brand “AC Hotels by Marriott”. The joint venture added 80 hotels and over 8,300 rooms to Marriott International’s global portfolio under the new brand.
The Autograph Collection added its first hotel in Europe. By year-end, the Autograph Collection had grown to 27 hotels in 6 countries.
At year-end, Marriott had 57 hotels (nearly 23,000 rooms) located in China. 52 hotels (nearly 17,000 rooms were in the development pipeline. China is Marriott’s largest market outside the U.S.
William J. Shaw retires as vice chairman of Marriott International and resigns from the board of directors. Arne M. Sorenson joins the board of directors.

11
IV. CORPORATE HISTORY (continued) 2011 (continued) The board elected J.W. Marriott, Jr. as executive chairman and chairman of the board and named Arne
Sorenson as president and chief executive officer. He will be the third CEO in the company’s history. The board also appointed Robert McCarthy as Marriott International’s chief operations officer. All three appointments are effective March 31, 2012.
2012 On March 31, 2012, Arne Sorenson assumed the role of president and chief executive officer. Marriott acquired the Gaylord Hotel brand and management company. The transaction added five
hotels and nearly 8,100 rooms to the company’s portfolio. Including the Gaylord transaction, the company added over 27,000 rooms in 2012. Marriott signed a record 57,000 new rooms during the year and the pipeline of rooms under
development reached 130,000. At year-end, Marriott had 132 hotels (over 43,000 rooms) located in Asia; 140 hotels (over 37,000
rooms) were in the Asia development pipeline. The company sold its corporate housing division, ExecuStay, to Oakwood Worldwide. The Autograph Collection added its first hotels in Asia and South America. By year-end, the
Autograph Collection had grown to 37 hotels in 9 countries. Marriott Rewards membership reaches 40 million travelers. Gross bookings on Marriott.com topped $8 billion, a 14 percent increase year-over-year. With six other lodging companies, Marriott formed Roomkey.com providing consumers a search and
book experience tailored for ease of hotel comparison shopping. Marriott repurchased $1.16 billion of the company’s common stock. 2013 Marriott announced the Moxy brand, its entry into the economy, three-star segment in Europe. By
year-end, 13 Moxy properties were included in the company’s pipeline. The company added nearly 26,000 rooms in 2013. Marriott signed a record 67,000 new rooms during the year and the pipeline reached over 195,000
rooms, including nearly 30,000 rooms approved, but not yet subject to signed contracts. At year-end, Marriott had 150 hotels (over 48,000 rooms) located in Asia; 207 hotels (nearly 57,000
rooms) were in the Asia development pipeline. Less than three years after its introduction, The Autograph Collection reached 50 hotels in 13
countries. The Fairfield brand expanded to Asia with its first hotel in Bangalore, India. Marriott announced that it would import the AC Hotels by Marriott brand to the Americas. By year-
end, 22 AC Hotels by Marriott properties were included in the company’s pipeline. Marriott Rewards and Ritz-Carlton Rewards membership reached 45 million travelers. Gross bookings on Marriott.com topped $9 billion, a 13 percent increase year-over-year. A record 25
percent of systemwide room nights worldwide were booked on Marriott.com. Marriott mobile reservations surged 67 percent in 2013 Marriott introduced mobile check-in for all Marriott Hotels in the United States, an industry first. Marriott repurchased $829 million of the company’s common stock and paid $196 million in
dividends.
12
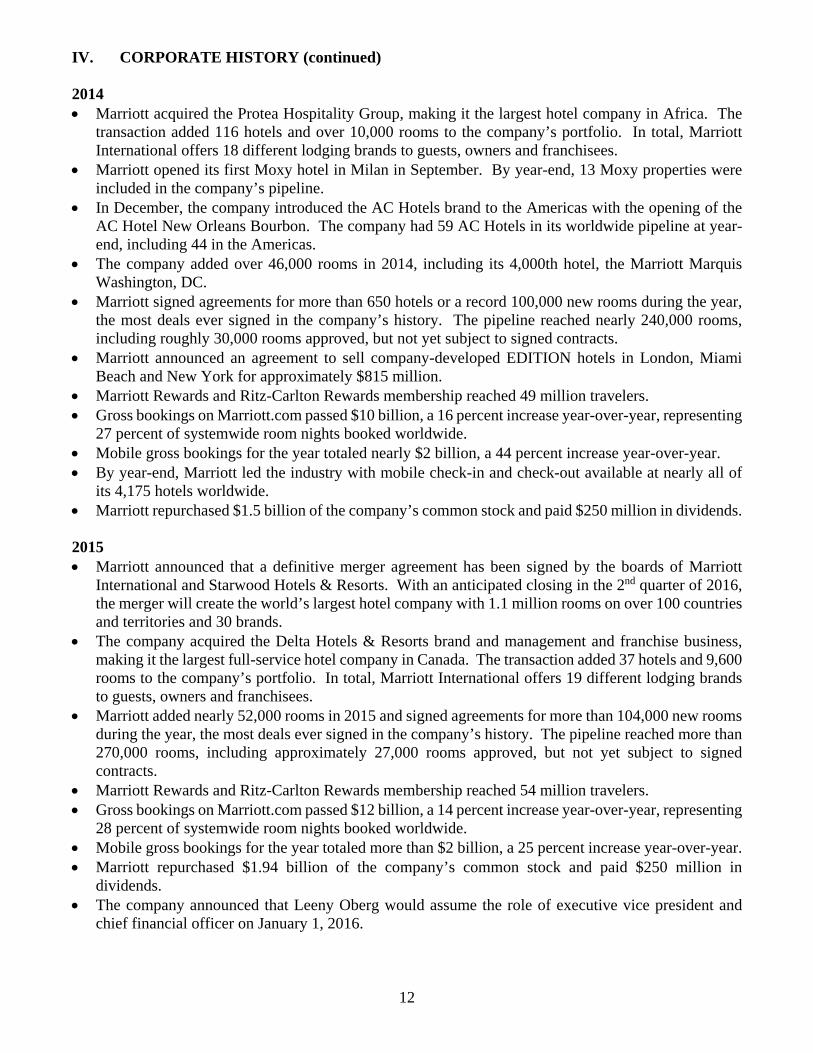
IV. CORPORATE HISTORY (continued) 2014 Marriott acquired the Protea Hospitality Group, making it the largest hotel company in Africa. The
transaction added 116 hotels and over 10,000 rooms to the company’s portfolio. In total, Marriott International offers 18 different lodging brands to guests, owners and franchisees.
Marriott opened its first Moxy hotel in Milan in September. By year-end, 13 Moxy properties were included in the company’s pipeline.
In December, the company introduced the AC Hotels brand to the Americas with the opening of the AC Hotel New Orleans Bourbon. The company had 59 AC Hotels in its worldwide pipeline at year-end, including 44 in the Americas.
The company added over 46,000 rooms in 2014, including its 4,000th hotel, the Marriott Marquis Washington, DC.
Marriott signed agreements for more than 650 hotels or a record 100,000 new rooms during the year, the most deals ever signed in the company’s history. The pipeline reached nearly 240,000 rooms, including roughly 30,000 rooms approved, but not yet subject to signed contracts.
Marriott announced an agreement to sell company-developed EDITION hotels in London, Miami Beach and New York for approximately $815 million.
Marriott Rewards and Ritz-Carlton Rewards membership reached 49 million travelers. Gross bookings on Marriott.com passed $10 billion, a 16 percent increase year-over-year, representing
27 percent of systemwide room nights booked worldwide. Mobile gross bookings for the year totaled nearly $2 billion, a 44 percent increase year-over-year. By year-end, Marriott led the industry with mobile check-in and check-out available at nearly all of
its 4,175 hotels worldwide. Marriott repurchased $1.5 billion of the company’s common stock and paid $250 million in dividends.
2015 Marriott announced that a definitive merger agreement has been signed by the boards of Marriott
International and Starwood Hotels & Resorts. With an anticipated closing in the 2nd quarter of 2016, the merger will create the world’s largest hotel company with 1.1 million rooms on over 100 countries and territories and 30 brands.
The company acquired the Delta Hotels & Resorts brand and management and franchise business, making it the largest full-service hotel company in Canada. The transaction added 37 hotels and 9,600 rooms to the company’s portfolio. In total, Marriott International offers 19 different lodging brands to guests, owners and franchisees.
Marriott added nearly 52,000 rooms in 2015 and signed agreements for more than 104,000 new rooms during the year, the most deals ever signed in the company’s history. The pipeline reached more than 270,000 rooms, including approximately 27,000 rooms approved, but not yet subject to signed contracts.
Marriott Rewards and Ritz-Carlton Rewards membership reached 54 million travelers. Gross bookings on Marriott.com passed $12 billion, a 14 percent increase year-over-year, representing
28 percent of systemwide room nights booked worldwide. Mobile gross bookings for the year totaled more than $2 billion, a 25 percent increase year-over-year. Marriott repurchased $1.94 billion of the company’s common stock and paid $250 million in
dividends. The company announced that Leeny Oberg would assume the role of executive vice president and
chief financial officer on January 1, 2016.
13
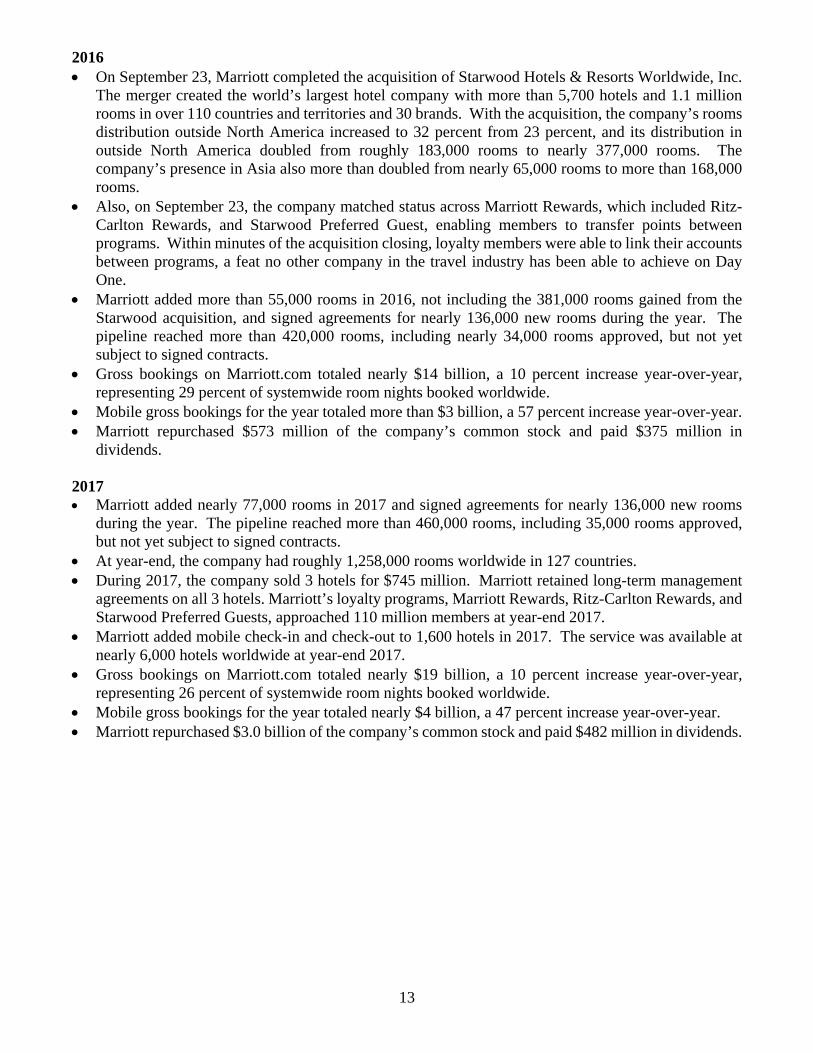
2016 On September 23, Marriott completed the acquisition of Starwood Hotels & Resorts Worldwide, Inc.
The merger created the world’s largest hotel company with more than 5,700 hotels and 1.1 million rooms in over 110 countries and territories and 30 brands. With the acquisition, the company’s rooms distribution outside North America increased to 32 percent from 23 percent, and its distribution in outside North America doubled from roughly 183,000 rooms to nearly 377,000 rooms. The company’s presence in Asia also more than doubled from nearly 65,000 rooms to more than 168,000 rooms.
Also, on September 23, the company matched status across Marriott Rewards, which included Ritz-Carlton Rewards, and Starwood Preferred Guest, enabling members to transfer points between programs. Within minutes of the acquisition closing, loyalty members were able to link their accounts between programs, a feat no other company in the travel industry has been able to achieve on Day One.
Marriott added more than 55,000 rooms in 2016, not including the 381,000 rooms gained from the Starwood acquisition, and signed agreements for nearly 136,000 new rooms during the year. The pipeline reached more than 420,000 rooms, including nearly 34,000 rooms approved, but not yet subject to signed contracts.
Gross bookings on Marriott.com totaled nearly $14 billion, a 10 percent increase year-over-year, representing 29 percent of systemwide room nights booked worldwide.
Mobile gross bookings for the year totaled more than $3 billion, a 57 percent increase year-over-year. Marriott repurchased $573 million of the company’s common stock and paid $375 million in
dividends.
2017 Marriott added nearly 77,000 rooms in 2017 and signed agreements for nearly 136,000 new rooms
during the year. The pipeline reached more than 460,000 rooms, including 35,000 rooms approved, but not yet subject to signed contracts.
At year-end, the company had roughly 1,258,000 rooms worldwide in 127 countries. During 2017, the company sold 3 hotels for $745 million. Marriott retained long-term management
agreements on all 3 hotels. Marriott’s loyalty programs, Marriott Rewards, Ritz-Carlton Rewards, and Starwood Preferred Guests, approached 110 million members at year-end 2017.
Marriott added mobile check-in and check-out to 1,600 hotels in 2017. The service was available at nearly 6,000 hotels worldwide at year-end 2017.
Gross bookings on Marriott.com totaled nearly $19 billion, a 10 percent increase year-over-year, representing 26 percent of systemwide room nights booked worldwide.
Mobile gross bookings for the year totaled nearly $4 billion, a 47 percent increase year-over-year. Marriott repurchased $3.0 billion of the company’s common stock and paid $482 million in dividends.

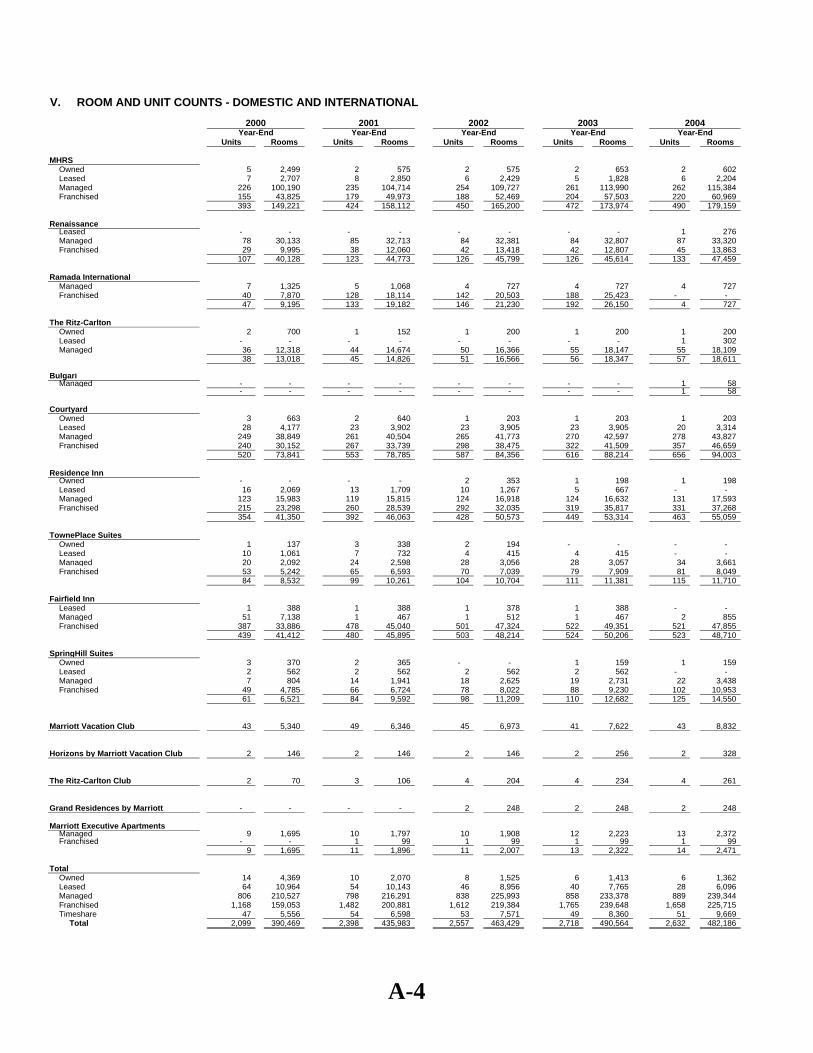
V. ROOM AND UNIT COUNTS - DOMESTIC AND INTERNATIONAL
Units Rooms Units Rooms Units Rooms Units Rooms Units Rooms
MHRSOwned 18 6,987 18 6,963 20 7,788 25 9,710 27 10,821Managed/Leased 97 47,427 106 52,366 109 55,439 115 57,197 128 61,980Franchised 34 11,114 40 13,228 48 16,153 52 17,256 53 17,581
149 65,528 164 72,557 177 79,380 192 84,163 208 90,382
CourtyardOwned 11 1,506 8 1,155 2 221 5 687 23 3,414Managed/Leased - - 28 4,018 74 10,758 106 15,450 117 17,110
11 1,506 36 5,173 76 10,979 111 16,137 140 20,524
Residence InnOwned - - - - 18 2,144 1 144 3 410Managed/Leased - - - - 38 4,629 73 8,677 82 10,096Franchised - - - - 50 5,496 56 6,280 63 7,207
- - - - 106 12,269 130 15,101 148 17,713
Fairfield InnOwned - - - - 2 265 18 2,388 43 5,730
- - - - 2 265 18 2,388 43 5,730
Timeshare - - - - - - - - 7 450
Total
Owned 29 8,493 26 8,118 42 10,418 49 12,929 96 20,375Managed/Leased 97 47,427 134 56,384 221 70,826 294 81,324 327 89,186Franchised 34 11,114 40 13,228 98 21,649 108 23,536 116 24,788Timeshare - - - - - - - - 7 450
Total 160 67,034 200 77,730 361 102,893 451 117,789 546 134,799
1985Year-End
1989198819871986Year-EndYear-End Year-End Year-End
A-1

V. ROOM AND UNIT COUNTS - DOMESTIC AND INTERNATIONAL
Units Rooms Units Rooms Units Rooms Units Rooms Units Rooms
MHRSOwned 30 12,193 30 11,548 23 9,688 1 139 1 139Managed/Leased 138 64,937 145 68,194 142 67,316 166 77,380 164 76,606Franchised 55 18,326 58 19,337 77 24,000 84 26,466 94 29,509
223 95,456 233 99,079 242 101,004 251 103,985 259 106,254
CourtyardOwned 58 8,428 65 9,373 54 7,896 - - - - Managed/Leased 120 17,558 126 18,390 139 20,368 194 28,435 195 28,551Franchised 0 0 5 1,061 14 2,208 24 3,548 36 5,042
178 25,986 196 28,824 207 30,472 218 31,983 231 33,593
Residence InnOwned 17 1,822 28 3,366 29 3,472 - - - - Managed/Leased 82 10,160 83 10,940 84 11,075 113 14,479 107 13,547Franchised 64 7,216 65 7,671 66 7,795 70 8,088 82 9,517
163 19,198 176 21,977 179 22,342 183 22,567 189 23,064
Fairfield InnOwned 23 2,841 30 3,633 30 3,632 - - - - Managed/Leased 50 6,683 50 6,681 50 6,677 80 10,306 54 7,121Franchised 2 252 13 1,185 38 3,036 52 4,088 118 10,354
75 9,776 93 11,499 118 13,345 132 14,394 172 17,475
Timeshare 14 735 18 1,035 21 1,418 25 1,692 28 1,939
TotalOwned 128 25,284 153 27,920 136 24,688 1 139 1 139Managed/Leased 390 99,338 404 104,205 415 105,436 553 130,600 520 125,825Franchised 121 25,794 141 29,254 195 37,039 230 42,190 330 54,422Timeshare 14 735 18 1,035 21 1,418 25 1,692 28 1,939
Total 653 151,151 716 162,414 767 168,581 809 174,621 879 182,325
199419931990 19921991Year-EndYear-End Year-End Year-End Year-End
A-2

V. ROOM AND UNIT COUNTS - DOMESTIC AND INTERNATIONAL
Units Rooms Units Rooms Units Rooms Units Rooms Units Rooms
MHRSOwned 2 495 2 498 3 942 5 2,595 5 2,585Leased - - - - - - 7 3,448 7 3,448Managed/Leased 195 83,714 197 84,995 201 86,481 196 85,752 218 94,679Franchised 100 31,804 117 35,294 122 37,148 143 42,809 138 39,977
297 116,013 316 120,787 326 124,571 351 134,604 368 140,689
RenaissanceOwned - - - - - - - - 1 504Managed/Leased - - - - 62 24,183 69 27,350 75 29,772Franchised - - - - 8 2,587 14 5,414 20 7,015
- - - - 70 26,770 83 32,764 96 37,291
Ramada InternationalManaged/Leased - - - - 33 7,032 8 1,514 7 1,325Franchised - - - - 41 7,444 38 6,421 19 4,246
- - - - 74 14,476 46 7,935 26 5,571
New WorldManaged/Leased - - - - 14 6,889 7 3,651 - -
The Ritz-CarltonOwned - - 1 148 1 148 1 152 1 152Managed/Leased 31 10,311 32 10,705 32 11,268 34 11,632 35 11,726
31 10,311 33 10,853 33 11,416 35 11,784 36 11,878
CourtyardOwned - - 1 153 - - 1 157 1 123Leased - - - - - - 29 4,177 32 4,544Managed/Leased 196 28,792 198 29,063 210 30,731 215 33,035 230 35,986Franchised 57 7,802 97 12,057 139 17,015 170 20,507 208 26,356
253 36,594 296 41,273 349 47,746 415 57,876 471 67,009
Residence InnOwned - - 1 120 1 106 3 408 3 372Leased - - - - - - 13 1,783 17 2,287Managed/Leased 101 12,853 106 13,864 111 14,613 108 14,336 117 15,745Franchised 95 10,791 117 12,563 146 15,957 170 18,523 187 20,349
196 23,644 224 26,547 258 30,676 294 35,050 324 38,753
TownePlace SuitesOwned - - - - 2 184 3 285 4 412Leased - - - - - - 2 190 9 934Managed/Leased - - - - - - 3 337 13 1,326Franchised - - - - - - 9 887 35 3,434
- - - - 2 184 17 1,699 61 6,106
Fairfield InnManaged/Leased 50 6,668 51 7,133 51 7,133 54 7,472 51 7,138Franchised 180 15,277 233 20,118 293 25,721 339 29,896 363 31,835
230 21,945 284 27,251 344 32,854 393 37,368 414 38,973
SpringHill SuitesManaged/Leased - - - - - - - - 6 654Franchised - - - - - - - - 28 2,791
- - - - - - - - 34 3,445
Marriott Vacation Club 29 2,526 31 2,880 32 3,351 37 3,938 42 4,540
Horizons by Marriott Vacation Club - - - - - - - - 1 101
Marriott Executive Apartments - - - - 8 1,504 8 1,624 7 1,527
TotalOwned 2 495 5 919 7 1,380 13 3,597 15 4,148Leased - - - - - - 51 9,598 65 11,213Managed/Leased 573 142,338 584 145,760 714 188,330 694 185,079 752 198,351Franchised 432 65,674 564 80,032 749 105,872 883 124,457 998 136,003Timeshare 29 2,526 31 2,880 32 3,351 37 3,938 43 4,641Marriott Executive Apartments - - - - 8 1,504 8 1,624 7 1,527
Total 1,036 211,033 1,184 229,591 1,510 300,437 1,686 328,293 1,880 355,883
1999199719961995 1998Year-EndYear-End Year-End Year-End Year-End
A-3
V. ROOM AND UNIT COUNTS - DOMESTIC AND INTERNATIONAL
Units Rooms Units Rooms Units Rooms Units Rooms Units Rooms
MHRSOwned 5 2,499 2 575 2 575 2 653 2 602 Leased 7 2,707 8 2,850 6 2,429 5 1,828 6 2,204 Managed 226 100,190 235 104,714 254 109,727 261 113,990 262 115,384Franchised 155 43,825 179 49,973 188 52,469 204 57,503 220 60,969
393 149,221 424 158,112 450 165,200 472 173,974 490 179,159
RenaissanceLeased - - - - - - - - 1 276 Managed 78 30,133 85 32,713 84 32,381 84 32,807 87 33,320 Franchised 29 9,995 38 12,060 42 13,418 42 12,807 45 13,863
107 40,128 123 44,773 126 45,799 126 45,614 133 47,459
Ramada InternationalManaged 7 1,325 5 1,068 4 727 4 727 4 727 Franchised 40 7,870 128 18,114 142 20,503 188 25,423 - -
47 9,195 133 19,182 146 21,230 192 26,150 4 727
The Ritz-CarltonOwned 2 700 1 152 1 200 1 200 1 200 Leased - - - - - - - - 1 302 Managed 36 12,318 44 14,674 50 16,366 55 18,147 55 18,109
38 13,018 45 14,826 51 16,566 56 18,347 57 18,611
BulgariManaged - - - - - - - - 1 58
- - - - - - - - 1 58
CourtyardOwned 3 663 2 640 1 203 1 203 1 203 Leased 28 4,177 23 3,902 23 3,905 23 3,905 20 3,314 Managed 249 38,849 261 40,504 265 41,773 270 42,597 278 43,827 Franchised 240 30,152 267 33,739 298 38,475 322 41,509 357 46,659
520 73,841 553 78,785 587 84,356 616 88,214 656 94,003
Residence InnOwned - - - - 2 353 1 198 1 198 Leased 16 2,069 13 1,709 10 1,267 5 667 - - Managed 123 15,983 119 15,815 124 16,918 124 16,632 131 17,593 Franchised 215 23,298 260 28,539 292 32,035 319 35,817 331 37,268
354 41,350 392 46,063 428 50,573 449 53,314 463 55,059
TownePlace SuitesOwned 1 137 3 338 2 194 - - - - Leased 10 1,061 7 732 4 415 4 415 - - Managed 20 2,092 24 2,598 28 3,056 28 3,057 34 3,661 Franchised 53 5,242 65 6,593 70 7,039 79 7,909 81 8,049
84 8,532 99 10,261 104 10,704 111 11,381 115 11,710
Fairfield InnLeased 1 388 1 388 1 378 1 388 - - Managed 51 7,138 1 467 1 512 1 467 2 855 Franchised 387 33,886 478 45,040 501 47,324 522 49,351 521 47,855
439 41,412 480 45,895 503 48,214 524 50,206 523 48,710
SpringHill SuitesOwned 3 370 2 365 - - 1 159 1 159 Leased 2 562 2 562 2 562 2 562 - - Managed 7 804 14 1,941 18 2,625 19 2,731 22 3,438 Franchised 49 4,785 66 6,724 78 8,022 88 9,230 102 10,953
61 6,521 84 9,592 98 11,209 110 12,682 125 14,550
Marriott Vacation Club 43 5,340 49 6,346 45 6,973 41 7,622 43 8,832
Horizons by Marriott Vacation Club 2 146 2 146 2 146 2 256 2 328
The Ritz-Carlton Club 2 70 3 106 4 204 4 234 4 261
Grand Residences by Marriott - - - - 2 248 2 248 2 248
Marriott Executive ApartmentsManaged 9 1,695 10 1,797 10 1,908 12 2,223 13 2,372 Franchised - - 1 99 1 99 1 99 1 99
9 1,695 11 1,896 11 2,007 13 2,322 14 2,471
TotalOwned 14 4,369 10 2,070 8 1,525 6 1,413 6 1,362 Leased 64 10,964 54 10,143 46 8,956 40 7,765 28 6,096 Managed 806 210,527 798 216,291 838 225,993 858 233,378 889 239,344Franchised 1,168 159,053 1,482 200,881 1,612 219,384 1,765 239,648 1,658 225,715Timeshare 47 5,556 54 6,598 53 7,571 49 8,360 51 9,669
Total 2,099 390,469 2,398 435,983 2,557 463,429 2,718 490,564 2,632 482,186
Year-End2004
Year-EndYear-End Year-End Year-End2002 200320012000
A-4
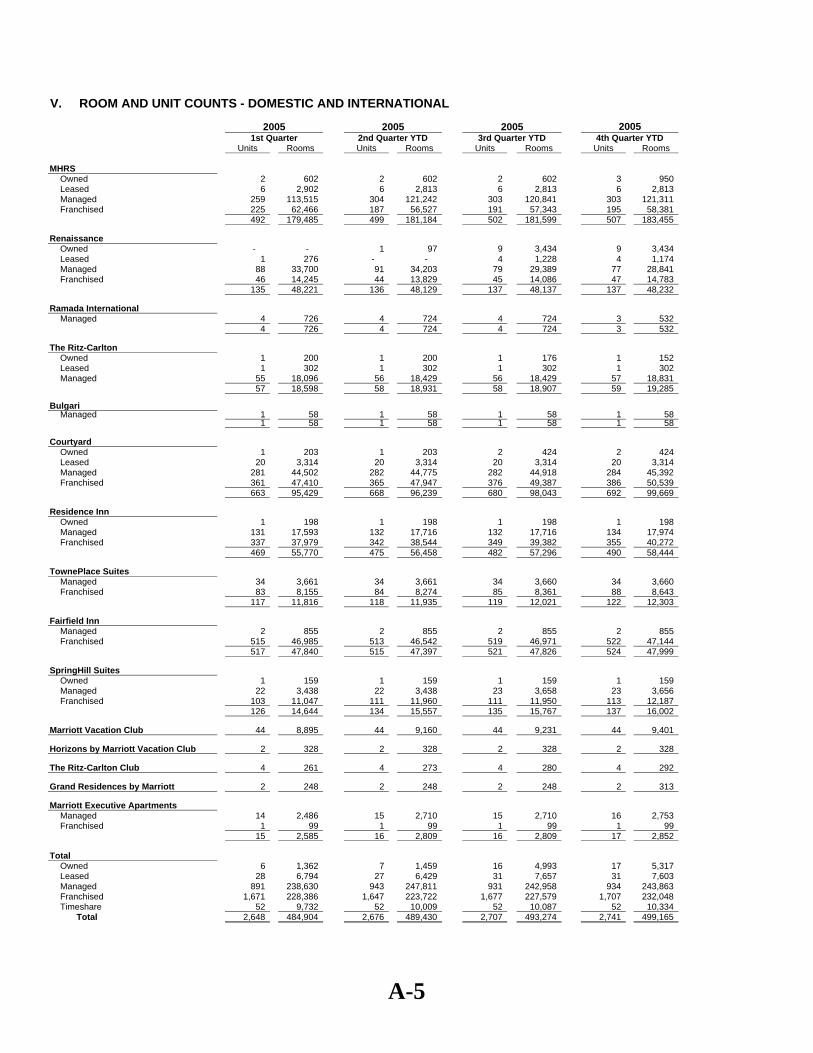
V. ROOM AND UNIT COUNTS - DOMESTIC AND INTERNATIONAL
2005 2005 20051st Quarter 2nd Quarter YTD 3rd Quarter YTD 4th Quarter YTD
Units Rooms Units Rooms Units Rooms Units Rooms
MHRSOwned 2 602 2 602 2 602 3 950 Leased 6 2,902 6 2,813 6 2,813 6 2,813 Managed 259 113,515 304 121,242 303 120,841 303 121,311 Franchised 225 62,466 187 56,527 191 57,343 195 58,381
492 179,485 499 181,184 502 181,599 507 183,455
RenaissanceOwned - - 1 97 9 3,434 9 3,434 Leased 1 276 - - 4 1,228 4 1,174 Managed 88 33,700 91 34,203 79 29,389 77 28,841 Franchised 46 14,245 44 13,829 45 14,086 47 14,783
135 48,221 136 48,129 137 48,137 137 48,232
Ramada InternationalManaged 4 726 4 724 4 724 3 532
4 726 4 724 4 724 3 532
The Ritz-CarltonOwned 1 200 1 200 1 176 1 152 Leased 1 302 1 302 1 302 1 302 Managed 55 18,096 56 18,429 56 18,429 57 18,831 57 18,598 58 18,931 58 18,907 59 19,285
BulgariManaged 1 58 1 58 1 58 1 58
1 58 1 58 1 58 1 58
CourtyardOwned 1 203 1 203 2 424 2 424 Leased 20 3,314 20 3,314 20 3,314 20 3,314 Managed 281 44,502 282 44,775 282 44,918 284 45,392 Franchised 361 47,410 365 47,947 376 49,387 386 50,539
663 95,429 668 96,239 680 98,043 692 99,669
Residence InnOwned 1 198 1 198 1 198 1 198 Managed 131 17,593 132 17,716 132 17,716 134 17,974 Franchised 337 37,979 342 38,544 349 39,382 355 40,272
469 55,770 475 56,458 482 57,296 490 58,444
TownePlace SuitesManaged 34 3,661 34 3,661 34 3,660 34 3,660 Franchised 83 8,155 84 8,274 85 8,361 88 8,643
117 11,816 118 11,935 119 12,021 122 12,303
Fairfield InnManaged 2 855 2 855 2 855 2 855 Franchised 515 46,985 513 46,542 519 46,971 522 47,144
517 47,840 515 47,397 521 47,826 524 47,999
SpringHill SuitesOwned 1 159 1 159 1 159 1 159 Managed 22 3,438 22 3,438 23 3,658 23 3,656 Franchised 103 11,047 111 11,960 111 11,950 113 12,187
126 14,644 134 15,557 135 15,767 137 16,002
Marriott Vacation Club 44 8,895 44 9,160 44 9,231 44 9,401
Horizons by Marriott Vacation Club 2 328 2 328 2 328 2 328
The Ritz-Carlton Club 4 261 4 273 4 280 4 292
Grand Residences by Marriott 2 248 2 248 2 248 2 313
Marriott Executive ApartmentsManaged 14 2,486 15 2,710 15 2,710 16 2,753 Franchised 1 99 1 99 1 99 1 99
15 2,585 16 2,809 16 2,809 17 2,852
TotalOwned 6 1,362 7 1,459 16 4,993 17 5,317 Leased 28 6,794 27 6,429 31 7,657 31 7,603 Managed 891 238,630 943 247,811 931 242,958 934 243,863 Franchised 1,671 228,386 1,647 223,722 1,677 227,579 1,707 232,048 Timeshare 52 9,732 52 10,009 52 10,087 52 10,334
Total 2,648 484,904 2,676 489,430 2,707 493,274 2,741 499,165
2005
A-5

V. ROOM AND UNIT COUNTS - DOMESTIC AND INTERNATIONAL
1st Quarter 2nd Quarter YTD 3rd Quarter YTD 4th Quarter YTDUnits Rooms Units Rooms Units Rooms Units Rooms
MHRSOwned 4 1,732 3 1,375 3 1,375 6 1,832 Leased 6 2,813 6 2,813 6 2,813 6 2,813 Managed 303 120,783 308 121,477 308 121,670 306 121,338 Franchised 202 60,682 200 60,594 199 60,296 201 61,421
515 186,010 517 186,259 516 186,154 519 187,404
RenaissanceOwned 8 2,761 3 1,102 1 300 2 562 Leased 4 1,178 4 1,178 4 1,181 4 1,181 Managed 78 29,672 81 30,734 84 32,013 82 31,745 Franchised 47 14,778 48 15,174 48 14,734 48 14,738
137 48,389 136 48,188 137 48,228 136 48,226
Ramada InternationalManaged 2 332 2 332 2 332 2 332
2 332 2 332 2 332 2 332
The Ritz-CarltonOwned 1 152 1 152 1 152 1 152 Leased 1 302 1 302 1 302 1 302 Managed 58 18,928 58 18,928 58 18,928 58 18,952 60 19,382 60 19,382 60 19,382 60 19,406
BulgariManaged 1 58 1 58 1 58 2 117
1 58 1 58 1 58 2 117
CourtyardOwned 2 424 1 203 1 203 1 203 Leased 20 3,314 20 3,314 20 3,314 20 3,314 Managed 286 45,744 289 46,336 290 46,649 287 46,296 Franchised 391 51,359 401 52,549 411 53,916 425 55,713
699 100,841 711 102,402 722 104,082 733 105,526
Residence InnOwned 1 198 1 198 1 198 1 198 Managed 134 18,008 134 18,068 134 18,068 136 18,393 Franchised 361 41,196 365 41,784 376 43,063 374 42,695
496 59,402 500 60,050 511 61,329 511 61,286
TownePlace SuitesManaged 34 3,661 34 3,661 34 3,661 34 3,661 Franchised 88 8,643 89 8,728 88 8,634 89 8,707
122 12,304 123 12,389 122 12,295 123 12,368
Fairfield InnManaged 2 855 2 855 2 855 2 855 Franchised 522 47,066 519 46,450 518 46,164 516 45,734
524 47,921 521 47,305 520 47,019 518 46,589
SpringHill SuitesOwned 1 159 1 159 1 159 1 159 Managed 22 3,422 22 3,422 22 3,422 22 3,422 Franchised 119 13,063 122 13,372 126 13,789 130 14,227
142 16,644 145 16,953 149 17,370 153 17,808
Marriott Vacation Club 44 9,542 44 9,876 45 10,189 45 10,512
Horizons by Marriott Vacation Club 2 328 2 328 2 328 2 372
The Ritz-Carlton Club 4 292 7 491 7 400 7 546
Grand Residences by Marriott 2 313 3 313 3 313 3 313
Marriott Executive ApartmentsOwned - - - - - - 1 50 Managed 16 2,753 16 2,705 17 2,928 16 2,878 Franchised 1 99 1 99 1 99 1 99
17 2,852 17 2,804 18 3,027 18 3,027
TotalOwned 17 5,426 10 3,189 8 2,387 13 3,156 Leased 31 7,607 31 7,607 31 7,610 31 7,610 Managed 936 244,216 947 246,576 952 248,584 947 247,989 Franchised 1,731 236,886 1,745 238,750 1,767 240,695 1,784 243,334 Timeshare 52 10,475 56 11,008 57 11,230 57 11,743
Total 2,767 504,610 2,789 507,130 2,815 510,506 2,832 513,832
2006 20062006 2006
A-6

V. ROOM AND UNIT COUNTS - DOMESTIC AND INTERNATIONAL
1st Quarter 2nd Quarter YTD 3rd Quarter YTD 4th Quarter YTDUnits Rooms Units Rooms Units Rooms Units Rooms
MHRSOwned 6 2,558 5 1,761 3 871 2 523 Leased 6 2,802 6 2,812 6 2,828 6 2,831 Managed 304 121,015 305 121,463 305 121,964 305 122,994 Franchised 203 61,787 205 61,731 207 62,272 207 62,196
519 188,162 521 187,767 521 187,935 520 188,544
Renaissance Owned 2 562 2 562 1 300 1 300 Leased 4 1,181 4 1,181 4 1,181 4 1,181 Managed 84 32,113 85 32,516 87 32,934 84 32,210 Franchised 48 14,004 50 14,533 50 14,566 52 15,243
138 47,860 141 48,792 142 48,981 141 48,934
Ramada InternationalManaged 2 332 2 332 2 332 2 332
2 332 2 332 2 332 2 332
The Ritz-CarltonOwned 1 152 1 152 1 152 1 152 Leased 1 302 2 552 2 552 2 552 Managed 1 59 18,881 60 19,126 63 20,126 67 20,901 Residences 15 1,424 15 1,425 16 1,495 17 1,707 76 20,759 78 21,255 82 22,325 87 23,312
BulgariManaged 2 117 2 117 2 117 2 117
2 117 2 117 2 117 2 117
CourtyardOwned 1 203 1 203 1 149 1 149 Leased 20 3,314 20 3,314 19 3,165 19 3,165 Managed 286 46,137 286 46,255 287 46,479 287 46,592 Franchised 432 56,713 433 57,176 444 58,642 460 60,874
739 106,367 740 106,948 751 108,435 767 110,780
Residence InnOwned 1 198 2 390 1 192 1 192 Managed 136 18,394 135 18,202 136 18,400 138 18,691 Franchised 384 43,777 389 44,433 397 45,441 407 46,533
521 62,369 526 63,025 534 64,033 546 65,416
TownePlace SuitesManaged 34 3,661 34 3,661 34 3,661 34 3,661 Franchised 89 8,705 94 9,196 100 9,806 107 10,461
123 12,366 128 12,857 134 13,467 141 14,122
Fairfield InnManaged 2 855 2 855 2 855 2 855 Franchised 512 45,011 518 45,493 526 46,235 535 47,022
514 45,866 520 46,348 528 47,090 537 47,877
SpringHill SuitesOwned 1 159 1 159 - - - - Managed 23 3,541 23 3,541 24 3,700 24 3,700 Franchised 133 14,584 139 15,322 143 15,796 153 16,869
157 18,284 163 19,022 167 19,496 177 20,569
Marriott Vacation Club 45 10,534 46 10,682 46 10,775 46 10,896
Horizons by Marriott Vacation Club 2 372 2 372 2 444 2 444
The Ritz-Carlton Club 2 9 467 9 470 10 528 10 532
Grand Residences by Marriott 2 2 248 2 248 3 313 3 313
Marriott Executive ApartmentsOwned 1 57 1 57 - - - - Managed 17 2,943 16 2,849 17 2,937 17 2,806 Franchised 1 99 1 99 1 99 1 99
19 3,099 18 3,005 18 3,036 18 2,905
TotalOwned 13 3,889 13 3,284 7 1,664 6 1,316 Leased 31 7,599 32 7,859 31 7,726 31 7,729 Managed 949 247,989 950 248,917 959 251,505 962 252,859 Franchised 1,802 244,680 1,829 247,983 1,868 252,857 1,922 259,297 Ritz-Carlton Residences 15 1,424 15 1,425 16 1,495 17 1,707 Timeshare 58 11,621 59 11,772 61 12,060 61 12,185
Total 2,868 517,202 2,898 521,240 2,942 527,307 2,999 535,093
1 Includes two services apartments properties.2 MVCI Residential properties are included in the respective brands
2007 20072007 2007
A-7

V. ROOM AND UNIT COUNTS - DOMESTIC AND INTERNATIONAL
1st Quarter 2nd Quarter YTD 3rd Quarter YTD 4th Quarter YTDUnits Rooms Units Rooms Units Rooms Units Rooms
Marriott Hotels & ResortsOwned 2 523 2 523 2 523 2 523 Leased 6 2,832 8 3,336 8 3,476 8 3,496 Managed 305 122,891 304 122,882 303 123,895 305 124,284 Franchised 208 62,595 209 62,846 211 63,409 216 64,927
521 188,841 523 189,587 524 191,303 531 193,230
Renaissance Owned 1 300 - - - - - - Leased 5 1,652 6 1,952 6 1,952 6 1,952 Managed 85 32,396 82 31,740 83 32,285 83 32,210 Franchised 52 15,508 52 15,147 51 14,993 52 15,227
143 49,856 140 48,839 140 49,230 141 49,389
The Ritz-CarltonOwned 1 180 1 180 1 180 1 180 Leased 2 552 2 552 2 552 2 552 Managed 1 67 20,846 68 21,263 69 21,429 70 21,579 Residences 19 1,823 21 2,122 21 2,122 23 2,269 89 23,401 92 24,117 93 24,283 96 24,580
BulgariManaged 2 117 2 117 2 117 2 117
2 117 2 117 2 117 2 117
CourtyardOwned 1 149 1 149 1 149 2 553 Leased 19 3,165 19 3,165 19 3,165 19 3,165 Managed 288 46,660 290 47,078 292 47,300 293 47,631 Franchised 462 60,994 475 63,085 481 63,770 494 65,909
770 110,968 785 113,477 793 114,384 808 117,258
Residence InnOwned 1 192 1 192 1 192 1 192 Managed 134 18,328 133 18,248 132 18,152 134 18,564 Franchised 412 47,110 418 48,014 426 48,873 438 50,161
547 65,630 552 66,454 559 67,217 573 68,917
TownePlace SuitesManaged 34 3,661 34 3,661 34 3,661 34 3,661 Franchised 111 10,861 118 11,534 120 11,742 129 12,667
145 14,522 152 15,195 154 15,403 163 16,328
Fairfield InnManaged 2 855 2 855 2 855 2 855 Franchised 533 46,695 543 47,828 554 48,796 567 49,932
535 47,550 545 48,683 556 49,651 569 50,787
SpringHill SuitesManaged 24 3,700 25 3,817 26 3,940 26 3,940 Franchised 163 17,881 171 19,025 173 19,241 182 20,211
187 21,581 196 22,842 199 23,181 208 24,151
Marriott Vacation Club 47 10,948 48 11,181 49 11,328 49 11,353
Horizons by Marriott Vacation Club 2 444 2 444 2 444 2 444
The Ritz-Carlton Club 2 10 532 10 533 12 570 13 604
Grand Residences by Marriott 2 3 313 3 313 3 313 3 306
Marriott Executive ApartmentsManaged 17 2,788 18 2,930 18 2,930 19 3,118 Franchised 1 99 1 99 1 99 1 99
18 2,887 19 3,029 19 3,029 20 3,217
TotalOwned 6 1,344 5 1,044 5 1,044 6 1,448 Leased 32 8,201 35 9,005 35 9,145 35 9,165 Managed 958 252,242 958 252,591 961 254,564 968 255,959 Franchised 1,942 261,743 1,987 267,578 2,017 270,923 2,079 279,133 Ritz-Carlton Residences 19 1,823 21 2,122 21 2,122 23 2,269 Timeshare 62 12,237 63 12,471 66 12,655 67 12,707
Total 3,019 537,590 3,069 544,811 3,105 550,453 3,178 560,681
1 Includes three services apartments properties.2 MVCI Residential properties are included in the respective brands.
2008 20082008 2008
A-8
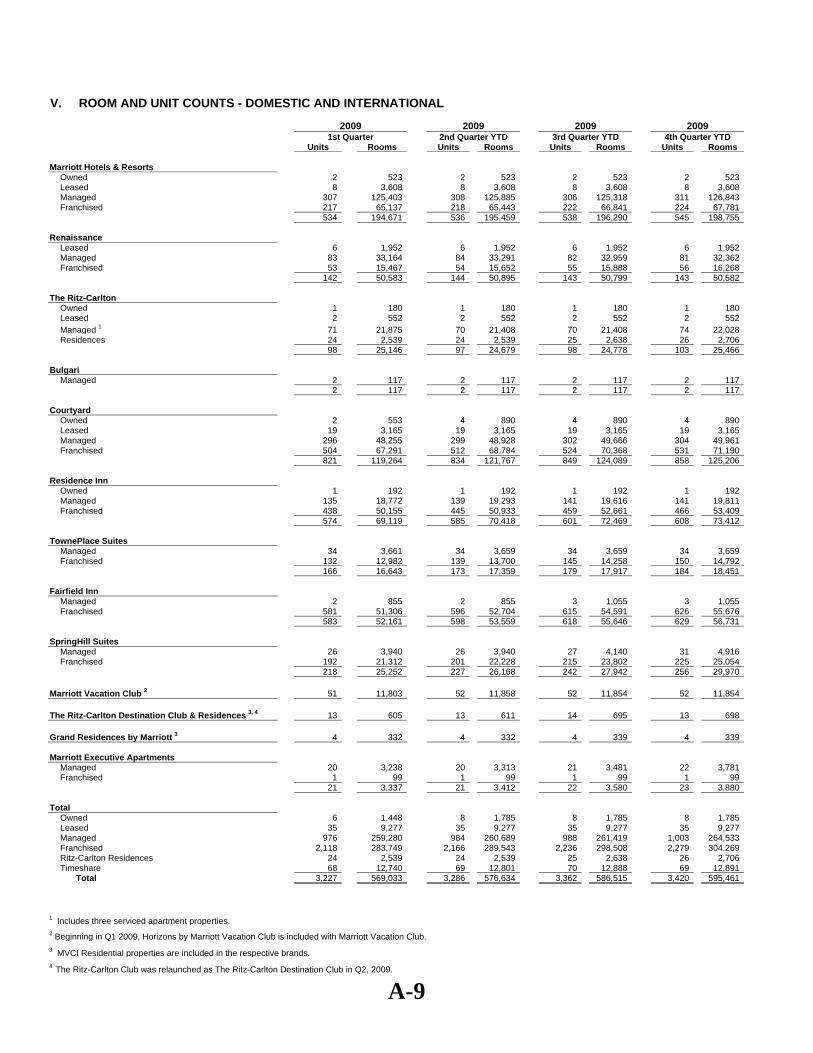
V. ROOM AND UNIT COUNTS - DOMESTIC AND INTERNATIONAL
1st Quarter 2nd Quarter YTD 3rd Quarter YTD 4th Quarter YTDUnits Rooms Units Rooms Units Rooms Units Rooms
Marriott Hotels & ResortsOwned 2 523 2 523 2 523 2 523 Leased 8 3,608 8 3,608 8 3,608 8 3,608 Managed 307 125,403 308 125,885 306 125,318 311 126,843 Franchised 217 65,137 218 65,443 222 66,841 224 67,781
534 194,671 536 195,459 538 196,290 545 198,755
Renaissance Leased 6 1,952 6 1,952 6 1,952 6 1,952 Managed 83 33,164 84 33,291 82 32,959 81 32,362 Franchised 53 15,467 54 15,652 55 15,888 56 16,268
142 50,583 144 50,895 143 50,799 143 50,582
The Ritz-CarltonOwned 1 180 1 180 1 180 1 180 Leased 2 552 2 552 2 552 2 552 Managed 1 71 21,875 70 21,408 70 21,408 74 22,028 Residences 24 2,539 24 2,539 25 2,638 26 2,706 98 25,146 97 24,679 98 24,778 103 25,466
BulgariManaged 2 117 2 117 2 117 2 117
2 117 2 117 2 117 2 117
CourtyardOwned 2 553 4 890 4 890 4 890 Leased 19 3,165 19 3,165 19 3,165 19 3,165 Managed 296 48,255 299 48,928 302 49,666 304 49,961 Franchised 504 67,291 512 68,784 524 70,368 531 71,190
821 119,264 834 121,767 849 124,089 858 125,206
Residence InnOwned 1 192 1 192 1 192 1 192 Managed 135 18,772 139 19,293 141 19,616 141 19,811 Franchised 438 50,155 445 50,933 459 52,661 466 53,409
574 69,119 585 70,418 601 72,469 608 73,412
TownePlace SuitesManaged 34 3,661 34 3,659 34 3,659 34 3,659 Franchised 132 12,982 139 13,700 145 14,258 150 14,792
166 16,643 173 17,359 179 17,917 184 18,451
Fairfield InnManaged 2 855 2 855 3 1,055 3 1,055 Franchised 581 51,306 596 52,704 615 54,591 626 55,676
583 52,161 598 53,559 618 55,646 629 56,731
SpringHill SuitesManaged 26 3,940 26 3,940 27 4,140 31 4,916 Franchised 192 21,312 201 22,228 215 23,802 225 25,054
218 25,252 227 26,168 242 27,942 256 29,970
Marriott Vacation Club 2 51 11,803 52 11,858 52 11,854 52 11,854
The Ritz-Carlton Destination Club & Residences 3, 4 13 605 13 611 14 695 13 698
Grand Residences by Marriott 3 4 332 4 332 4 339 4 339
Marriott Executive ApartmentsManaged 20 3,238 20 3,313 21 3,481 22 3,781 Franchised 1 99 1 99 1 99 1 99
21 3,337 21 3,412 22 3,580 23 3,880
TotalOwned 6 1,448 8 1,785 8 1,785 8 1,785 Leased 35 9,277 35 9,277 35 9,277 35 9,277 Managed 976 259,280 984 260,689 988 261,419 1,003 264,533 Franchised 2,118 283,749 2,166 289,543 2,236 298,508 2,279 304,269 Ritz-Carlton Residences 24 2,539 24 2,539 25 2,638 26 2,706 Timeshare 68 12,740 69 12,801 70 12,888 69 12,891
Total 3,227 569,033 3,286 576,634 3,362 586,515 3,420 595,461
1 Includes three serviced apartment properties.2 Beginning in Q1 2009, Horizons by Marriott Vacation Club is included with Marriott Vacation Club.3 MVCI Residential properties are included in the respective brands.4 The Ritz-Carlton Club was relaunched as The Ritz-Carlton Destination Club in Q2, 2009.
2009 2009 2009 2009
A-9

V. ROOM AND UNIT COUNTS - DOMESTIC AND INTERNATIONAL
1st Quarter 2nd Quarter YTD 3rd Quarter YTD 4th Quarter YTDUnits Rooms Units Rooms Units Rooms Units Rooms
Marriott Hotels & ResortsOwned 2 523 2 523 2 523 1 278 Leased 10 4,109 10 4,109 10 4,109 11 4,369 Managed 312 128,861 311 128,718 311 128,881 315 130,614Franchised 226 68,430 225 68,085 227 68,700 227 68,758
550 201,923 548 201,435 550 202,213 554 204,019
Renaissance HotelsLeased 6 1,952 5 1,481 5 1,481 11 2,653 Managed 81 32,196 82 32,695 83 33,062 76 31,336 Franchised 58 16,758 59 17,148 58 16,869 59 17,019
145 50,906 146 51,324 146 51,412 146 51,008
Autograph CollectionFranchised 2 242 10 1,529 11 1,646 13 3,828
2 242 10 1,529 11 1,646 13 3,828
The Ritz-CarltonOwned 1 180 1 180 1 180 1 180 Leased 2 552 2 552 2 552 2 552 Managed 1 74 22,017 73 21,484 74 21,770 74 21,770 Residences 26 2,669 25 2,644 26 2,715 28 3,085 103 25,418 101 24,860 103 25,217 105 25,587
BulgariManaged 2 117 2 117 2 117 2 117
2 117 2 117 2 117 2 117
EditionManaged - - - - - - 1 353 - - - - - - 1 353
CourtyardOwned 4 890 4 890 4 890 2 336 Leased 19 3,165 19 3,165 19 3,165 21 3,383 Managed 305 50,107 309 51,168 309 51,389 310 51,875 Franchised 540 72,881 544 73,357 550 74,188 559 75,475
868 127,043 876 128,580 882 129,632 892 131,069
Residence InnOwned 1 192 1 192 1 192 1 192 Managed 135 19,210 135 19,210 135 19,210 135 19,210 Franchised 469 53,739 470 54,014 474 54,437 477 54,728
605 73,141 606 73,416 610 73,839 613 74,130
TownePlace SuitesManaged 34 3,658 34 3,658 34 3,658 34 3,658 Franchised 153 15,101 156 15,405 158 15,662 159 15,767
187 18,759 190 19,063 192 19,320 193 19,425
Fairfield Inn & SuitesManaged 3 1,055 3 1,055 3 1,055 3 1,055 Franchised 638 57,002 647 57,878 654 58,578 655 58,690
641 58,057 650 58,933 657 59,633 658 59,745
SpringHill SuitesManaged 31 4,916 32 5,035 33 5,156 33 5,156 Franchised 230 25,692 236 26,384 239 26,740 241 26,929
261 30,608 268 31,419 272 31,896 274 32,085
Marriott Vacation Club 2 53 11,874 53 11,874 53 11,866 53 11,918
The Ritz-Carlton Destination Club & Residences 3, 4 13 702 13 707 13 684 14 729
Grand Residences by Marriott 3 4 316 4 316 4 316 4 316
Marriott Executive ApartmentsManaged 22 3,804 21 3,580 22 3,676 22 3,676 Franchised 1 99 1 99 1 99 1 99
23 3,903 22 3,679 23 3,775 23 3,775
TotalOwned 8 1,785 8 1,785 8 1,785 5 986 Leased 37 9,778 36 9,307 36 9,307 45 10,957 Managed 999 265,941 1,002 266,720 1,006 267,974 1,005 268,820Franchised 2,317 309,944 2,348 313,899 2,372 316,919 2,391 321,293Ritz-Carlton Residences 26 2,669 25 2,644 26 2,715 28 3,085 Timeshare 70 12,892 70 12,897 70 12,866 71 12,963
Total 3,457 603,009 3,489 607,252 3,518 611,566 3,545 618,104
1 Includes three serviced apartment properties.2 Beginning in Q1 2009, Horizons by Marriott Vacation Club is included with Marriott Vacation Club.3 MVCI Residential properties are included in the respective brands.4 The Ritz-Carlton Club was relaunched as The Ritz-Carlton Destination Club in Q2, 2009.
2010 2010 2010 2010
A-10

V. ROOM AND UNIT COUNTS - DOMESTIC AND INTERNATIONAL
1st Quarter 2nd Quarter Third Quarter Fourth QuarterUnits Rooms Units Rooms Units Rooms Units Rooms
Marriott Hotels & ResortsOwned 1 278 1 278 1 278 1 278 Leased 11 4,369 11 4,369 11 4,369 10 3,986 Managed 315 130,628 318 131,618 317 131,366 315 131,220 Franchised 228 69,939 227 69,609 228 69,970 229 70,111
555 205,214 557 205,874 557 205,983 555 205,595
Renaissance HotelsLeased 12 2,864 11 2,698 11 2,698 10 2,437 Managed 80 32,306 79 31,951 80 32,176 82 32,960 Franchised 59 17,019 61 17,292 61 17,312 62 17,569
151 52,189 151 51,941 152 52,186 154 52,966
Autograph CollectionFranchised 14 3,954 16 4,118 20 5,356 22 5,755 Unconsolidated Joint Ventures 4 278 4 278 4 277 5 350
18 4,232 20 4,396 24 5,633 27 6,105
The Ritz-CarltonOwned 1 180 1 180 1 180 1 180 Leased 2 552 2 552 2 552 2 552 Managed 1 76 22,375 77 22,687 78 22,937 79 23,430 Residences 29 3,309 30 3,468 31 3,780 32 3,838 108 26,416 110 26,887 112 27,449 114 28,000
BulgariManaged 2 117 2 117 2 117 2 117
2 117 2 117 2 117 2 117
EditionManaged 2 431 2 431 1 78 1 78 2 431 2 431 1 78 1 78
AC Hotels by MarriottUnconsolidated Joint Ventures 68 7,143 68 7,143 75 7,944 80 8,371
68 7,143 68 7,143 75 7,944 80 8,371
CourtyardOwned 3 505 3 505 3 505 3 505 Leased 21 3,383 21 3,383 21 3,383 21 3,383 Managed 314 52,543 313 52,345 314 52,523 317 53,146 Franchised 562 75,868 567 76,525 568 76,663 572 77,685
900 132,299 904 132,758 906 133,074 913 134,719
Residence InnOwned 1 192 1 192 1 192 1 192 Managed 136 19,535 137 19,690 137 19,690 137 19,684 Franchised 478 54,862 477 54,744 477 54,744 479 54,991
615 74,589 615 74,626 615 74,626 617 74,867
TownePlace SuitesManaged 34 3,658 34 3,658 34 3,658 29 3,086 Franchised 160 15,856 162 16,044 164 16,217 172 17,067
194 19,514 196 19,702 198 19,875 201 20,153
Fairfield Inn & SuitesManaged 3 1,055 3 1,055 3 1,055 3 1,055 Franchised 655 58,722 660 59,306 671 60,316 677 60,905
658 59,777 663 60,361 674 61,371 680 61,960
SpringHill SuitesManaged 33 5,156 34 5,311 34 5,311 34 5,311 Franchised 241 26,929 246 27,577 251 28,222 253 28,454
274 32,085 280 32,888 285 33,533 287 33,765
Timeshare 2 71 13,045 71 13,018 71 13,018 64 12,800
Marriott Executive ApartmentsManaged 22 3,676 21 3,463 21 3,463 22 3,601 Franchised 1 99 1 99 1 99 1 99
23 3,775 22 3,562 22 3,562 23 3,700
TotalOwned 6 1,155 6 1,155 6 1,155 6 1,155 Leased 46 11,168 45 11,002 45 11,002 43 10,358 Managed 1,017 271,480 1,020 272,326 1,021 272,374 1,021 273,688 Franchised 2,398 323,248 2,417 325,314 2,441 328,899 2,467 332,636 Unconsolidated Joint Ventures 72 7,421 72 7,421 79 8,221 85 8,721 Ritz-Carlton Residences 29 3,309 30 3,468 31 3,780 32 3,838 Timeshare 71 13,045 71 13,018 71 13,018 64 12,800
Total 3,639 630,826 3,661 633,704 3,694 638,449 3,718 643,196
1 Includes Serviced Apartments.2 The methodology used to report the number of timeshare properties and rooms changed in Q4 2011 as a result of our timeshare spin-off.
2011 2011 2011 2011
A-11

V. ROOM AND UNIT COUNTS - DOMESTIC AND INTERNATIONAL
1st Quarter 2nd Quarter 3rd Quarter 4th QuarterUnits Rooms Units Rooms Units Rooms Units Rooms
Marriott Hotels & ResortsOwned 1 278 1 278 1 278 1 278 Leased 10 3,986 10 3,986 10 3,986 9 3,734 Managed 315 130,263 315 129,803 314 129,270 319 130,886 Franchised 227 69,519 227 69,775 227 69,777 229 70,019
553 204,046 553 203,842 552 203,311 558 204,917
Renaissance HotelsLeased 10 2,437 10 2,437 9 2,201 8 1,998 Managed 81 32,613 82 33,114 82 32,871 82 32,425 Franchised 63 17,909 63 17,909 64 18,121 65 18,866
154 52,959 155 53,460 155 53,193 155 53,289
Autograph Collection Managed - - - - - - 1 308
Franchised 25 6,363 27 6,899 28 6,974 31 7,357 Unconsolidated Joint Ventures 5 350 5 348 5 348 5 348
30 6,713 32 7,247 33 7,322 37 8,013
Gaylord Hotels & ResortsManaged - - - - - - 5 8,098
- - - - - - 5 8,098
The Ritz-CarltonOwned 1 180 1 180 1 180 1 180 Leased 2 552 2 552 2 552 2 552 Managed 1 79 23,430 80 23,527 81 23,729 81 23,614 Residences 34 3,838 35 3,927 35 3,927 35 3,927 116 28,000 118 28,186 119 28,388 119 28,273
BulgariManaged 2 117 2 117 2 117 2 117 Franchised 1 85 1 85 1 85
2 117 3 202 3 202 3 202
Edition Managed 1 78 1 78 1 78 1 78 1 78 1 78 1 78 1 78
AC Hotels by Marriott Unconsolidated Joint Ventures 75 7,976 79 8,736 79 8,736 79 8,736
75 7,976 79 8,736 79 8,736 79 8,736
CourtyardOwned 3 505 3 505 3 505 3 505 Leased 21 3,383 19 2,792 19 2,792 19 2,792 Managed 316 52,764 313 52,425 316 52,796 317 52,916 Franchised 578 78,817 581 79,212 583 79,398 590 80,340
918 135,469 916 134,934 921 135,491 929 136,553
Residence InnOwned 1 192 1 192 1 192 1 192 Managed 139 19,923 137 19,717 135 19,509 133 19,261 Franchised 479 54,991 483 55,413 488 56,042 491 56,418
619 75,106 621 75,322 624 75,743 625 75,871
TownePlace SuitesManaged 29 3,086 22 2,440 22 2,440 22 2,440 Franchised 174 17,267 181 17,893 185 18,337 188 18,641
203 20,353 203 20,333 207 20,777 210 21,081
Fairfield Inn & SuitesManaged 3 1,055 3 1,055 3 1,055 3 1,055 Franchised 680 61,193 683 61,494 687 61,839 688 61,990
683 62,248 686 62,549 690 62,894 691 63,045
SpringHill SuitesManaged 34 5,311 32 5,129 30 4,844 29 4,545 Franchised 256 28,809 261 29,314 268 30,126 270 30,598
290 34,120 293 34,443 298 34,970 299 35,143
Timeshare 2 64 12,932 64 12,932 64 12,932 65 13,029
Marriott Executive ApartmentsManaged 23 3,727 24 3,846 24 3,846 25 4,066 Franchised 1 99 - - - - - -
24 3,826 24 3,846 24 3,846 25 4,066
TotalOwned 6 1,155 6 1,155 6 1,155 6 1,155 Leased 43 10,358 41 9,767 40 9,531 38 9,076 Managed 1,022 272,367 1,011 271,251 1,010 270,555 1,020 279,809 Franchised 2,483 334,967 2,507 337,994 2,531 340,699 2,553 344,314 Unconsolidated Joint Ventures 80 8,326 84 9,084 84 9,084 84 9,084 Ritz-Carlton Residences 34 3,838 35 3,927 35 3,927 35 3,927 Timeshare 64 12,932 64 12,932 64 12,932 65 13,029
Total 3,732 643,943 3,748 646,110 3,770 647,883 3,801 660,394
1 Includes Serviced Apartments.
spin-off.
2012 2012 2012 2012
2 Reported 2012 Timeshare properties and rooms/suites are not comparable to some 2011 data due to a change in reporting methodology that occurred in Q4 2011 as a result of our Timeshare
A-12

1st Quarter 2nd Quarter 3rd Quarter 4th QuarterUnits Rooms Units Rooms Units Rooms Units Rooms
Marriott Hotels Owned 1 278 1 278 1 278 2 716 Leased 9 3,734 8 3,585 7 3,325 7 3,325 Managed 323 131,978 321 131,530 332 131,326 320 130,639 Franchised 225 69,031 226 69,155 228 69,650 230 70,221
558 205,021 556 204,548 558 204,579 559 204,901
Renaissance HotelsLeased 8 1,998 8 1,998 8 1,998 8 1,998 Managed 80 31,743 81 32,033 81 31,515 80 31,028 Franchised 65 18,868 65 18,879 65 18,879 65 18,874
153 52,609 154 52,910 154 52,392 153 51,900
Autograph CollectionManaged 1 308 1 308 1 308 2 395 Franchised 35 7,825 38 8,302 44 9,788 49 10,720 Unconsolidated Joint Ventures 5 348 5 348 5 348 5 348
41 8,481 44 8,958 50 10,444 56 11,463
Gaylord Hotels & ResortsManaged 5 8,098 5 8,098 5 8,098 5 8,098
5 8,098 5 8,098 5 8,098 5 8,098
The Ritz-CarltonOwned 1 180 1 180 1 180 1 180 Leased 2 552 2 552 2 552 2 552 Managed 1 82 24,324 81 23,858 80 23,555 85 24,837 Residences 37 4,067 37 4,067 37 4,067 40 4,228 122 29,123 121 28,657 120 28,354 128 29,797
BulgariManaged 2 117 2 117 2 117 2 117 Franchised 1 85 1 85 1 85 1 85
3 202 3 202 3 202 3 202
EditionOwned - - - - 1 173 1 173 Managed 1 78 1 78 1 78 1 78
1 78 1 78 2 251 2 251
AC Hotels by MarriottUnconsolidated Joint Ventures 79 8,819 75 8,491 75 8,491 75 8,491
79 8,819 75 8,491 75 8,491 75 8,491
CourtyardOwned 3 505 3 505 4 699 4 699 Leased 19 2,792 18 2,667 18 2,667 18 2,667 Managed 314 52,862 311 52,350 313 52,663 313 52,792 Franchised 598 81,180 605 82,330 611 83,247 618 84,391
934 137,339 937 137,852 946 132,276 953 140,549
Residence InnOwned 1 192 1 192 1 192 1 192 Managed 133 19,261 128 18,411 128 1,841 127 18,210 Franchised 496 57,025 506 58,477 516 59,695 525 61,003
630 76,478 635 77,080 645 78,328 653 79,405
TownePlace SuitesManaged 22 2,440 22 2,440 22 2,440 22 2,440 Franchised 192 18,956 198 19,468 198 19,468 202 19,877
214 21,396 220 21,908 220 21,908 224 22,317
Fairfield Inn & SuitesManaged 3 1,055 3 1,055 4 1,197 5 1,345 Franchised 689 62,179 700 63,516 706 63,984 703 63,620
692 63,234 703 64,571 710 65,181 708 64,965
SpringHill SuitesManaged 29 4,545 29 4,582 29 4,582 29 4,582 Franchised 270 30,598 274 31,046 276 31,270 279 31,605
299 35,143 303 35,628 305 35,852 308 36,187
Timeshare 2 65 13,002 63 12,856 63 12,856 62 12,802
Marriott Executive ApartmentsManaged 26 4,140 27 4,295 27 4,295 27 4,295
26 4,140 27 4,295 27 4,295 27 4,295
TotalOwned 6 1,155 6 1,155 8 1,522 9 1,960 Leased 38 9,076 36 8,802 35 8,542 35 8,542 Managed 1,021 280,949 1,012 279,155 1,015 278,615 1,018 278,856 Franchised 2,571 345,747 2,613 351,258 2,645 356,066 2,672 360,396 Unconsolidated Joint Ventures 84 9,167 80 8,839 80 8,839 80 8,839 Ritz-Carlton Residences 37 4,067 37 4,067 37 4,067 40 4,228 Timeshare 65 13,002 63 12,856 63 12,856 62 12,802
Total 3,822 663,163 3,847 666,132 3,883 670,507 3,916 675,623
1 Includes Serviced Apartments.
2nd, 3rd, and 4th quarters, respectively.
2 Timeshare unit and room counts are as of March 22, 2013, June 14, 2013, September 6, 2013, and January 3, 2014, the end of Marriott Vacation Worldwide's 1st,
V. ROOM AND UNIT COUNTS - DOMESTIC AND INTERNATIONAL
2013 20132013 2013
A-13

1st Quarter 2nd Quarter 3rd Quarter 4th QuarterUnits Rooms Units Rooms Units Rooms Units Rooms
Marriott Hotels Owned 2 716 2 716 2 716 2 716 Leased 7 3,325 7 3,325 7 3,325 7 3,325 Managed 323 131,423 325 132,706 325 132,755 330 135,078 Franchised 232 71,006 234 71,542 237 72,427 239 72,884
564 206,470 568 208,289 571 209,223 578 212,003
Renaissance HotelsLeased 8 1,998 7 1,787 5 1,274 5 1,274 Managed 79 30,809 81 31,368 81 31,200 81 31,044 Franchised 67 19,191 71 20,009 73 20,638 73 20,638
154 51,998 159 53,164 159 53,112 159 52,956
Autograph CollectionManaged 3 584 3 584 4 765 4 765 Franchised 52 11,385 53 11,426 53 11,406 66 16,397 Unconsolidated Joint Ventures 5 348 5 348 5 348 5 348
60 12,317 61 12,358 62 12,519 75 17,510
Gaylord Hotels & ResortsManaged 5 8,098 5 8,098 5 8,098 5 8,098
5 8,098 5 8,098 5 8,098 5 8,098
Moxy HotelsFranchised - - - - 1 162 1 162
- - - - 1 162 1 162
Protea HotelsLeased - - 10 1,601 10 1,601 10 1,601 Managed - - 43 4,438 43 4,540 43 4,540 Franchised - - 59 3,956 59 3,966 59 3,966
- - 112 9,995 112 10,107 112 10,107
The Ritz-CarltonOwned 1 180 1 180 1 180 1 180 Leased 2 552 2 552 2 552 2 552 Managed 1 85 24,664 86 24,924 86 24,924 88 25,361 Residences 40 4,228 40 4,228 40 4,228 40 4,228 128 29,624 129 29,884 129 29,884 131 30,321
BulgariManaged 2 117 2 117 2 117 2 117 Franchised 1 85 1 85 1 85 1 85 Residences - - - - - - 1 5
3 202 3 202 3 202 4 207
EditionOwned - - - - - - 1 295 Managed 2 251 2 251 1 173 1 173 Franchised - - - - 1 78 1 78 Residences - - - - - - 1 25
2 251 2 251 2 251 4 571
AC Hotels by MarriottUnconsolidated Joint Ventures 74 8,329 73 8,310 75 8,499 77 9,531
74 8,329 73 8,310 75 8,499 77 9,531
CourtyardOwned 4 699 4 699 4 699 4 699 Leased 18 2,667 18 2,667 18 2,667 18 2,667 Managed 315 53,061 319 54,097 320 54,370 318 53,925 Franchised 619 84,889 626 85,649 639 87,089 648 88,509
956 141,316 967 143,112 981 144,825 988 145,800
Residence InnOwned 1 192 1 192 1 192 1 192 Managed 123 17,647 124 17,963 112 16,505 113 16,606 Franchised 526 61,144 534 62,106 552 64,229 561 65,365
650 79,983 659 80,261 665 80,926 675 82,163
TownePlace SuitesManaged 19 2,123 18 2,028 17 1,933 15 1,743 Franchised 205 20,242 213 21,081 219 21,715 229 22,748
224 22,365 231 23,109 236 23,648 244 24,491
Fairfield Inn & SuitesManaged 5 1,345 5 1,348 5 1,348 6 1,476 Franchised 707 63,966 710 64,232 719 65,154 715 64,975
712 65,311 715 65,580 724 66,502 721 66,451
SpringHill SuitesManaged 29 4,582 29 4,582 29 4,582 28 4,450 Franchised 283 32,151 284 32,254 284 32,305 288 32,817
312 36,733 313 36,836 313 36,887 316 37,267
Timeshare 2 62 12,901 62 13,054 62 13,124 58 12,866
Marriott Executive ApartmentsManaged 28 4,423 28 4,423 27 4,285 27 4,261
28 4,423 28 4,423 27 4,285 27 4,261
TotalOwned 8 1,787 8 1,787 8 1,787 9 2,082 Leased 35 8,542 44 9,932 42 9,419 42 9,419 Managed 1,018 279,127 1,070 286,927 1,057 285,595 1,061 287,637 Franchised 2,692 364,059 2,785 372,340 2,838 379,254 2,881 388,624 Unconsolidated Joint Ventures 79 8,677 78 8,658 80 8,847 82 9,879 Residences 40 4,228 40 4,228 40 4,228 42 4,258 Timeshare 62 12,901 62 13,054 62 13,124 58 12,866
Total 3,934 679,321 4,087 696,926 4,127 702,254 4,175 714,765
1 Includes Serviced Apartments.
Vacation Worldwide's 1st, 2nd, 3rd, and 4th quarters, respectively.
2 Timeshare unit and room counts are as of March 28, 2014, June 20, 2014, September 12, 2014, and January 2, 2015, the end of Marriott
V. ROOM AND UNIT COUNTS - DOMESTIC AND INTERNATIONAL
2014 2014 2014 2014
A-14
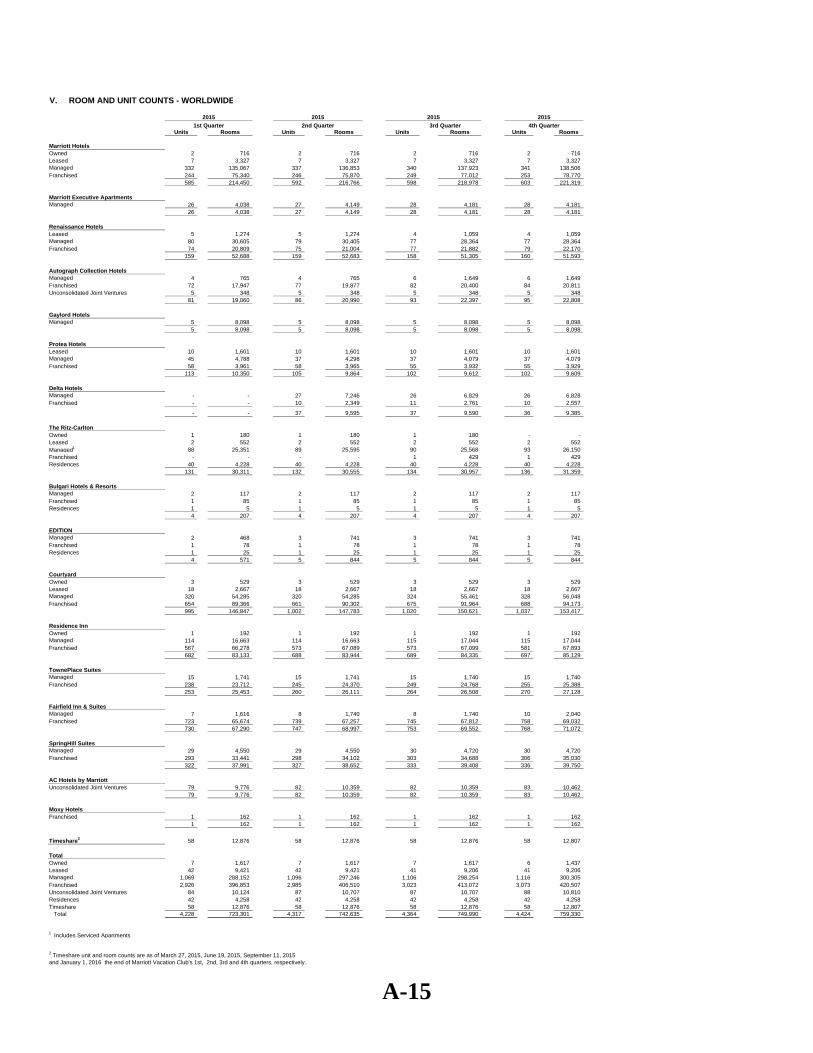
1st Quarter 2nd Quarter 3rd Quarter 4th QuarterUnits Rooms Units Rooms Units Rooms Units Rooms
Marriott HotelsOwned 2 716 2 716 2 716 2 716 Leased 7 3,327 7 3,327 7 3,327 7 3,327 Managed 332 135,067 337 136,853 340 137,923 341 138,506 Franchised 244 75,340 246 75,870 249 77,012 253 78,770
585 214,450 592 216,766 598 218,978 603 221,319
Marriott Executive ApartmentsManaged 26 4,038 27 4,149 28 4,181 28 4,181
26 4,038 27 4,149 28 4,181 28 4,181
Renaissance HotelsLeased 5 1,274 5 1,274 4 1,059 4 1,059 Managed 80 30,605 79 30,405 77 28,364 77 28,364 Franchised 74 20,809 75 21,004 77 21,882 79 22,170
159 52,688 159 52,683 158 51,305 160 51,593
Autograph Collection Hotels Managed 4 765 4 765 6 1,649 6 1,649 Franchised 72 17,947 77 19,877 82 20,400 84 20,811 Unconsolidated Joint Ventures 5 348 5 348 5 348 5 348
81 19,060 86 20,990 93 22,397 95 22,808
Gaylord HotelsManaged 5 8,098 5 8,098 5 8,098 5 8,098
5 8,098 5 8,098 5 8,098 5 8,098
Protea HotelsLeased 10 1,601 10 1,601 10 1,601 10 1,601 Managed 45 4,788 37 4,298 37 4,079 37 4,079 Franchised 58 3,961 58 3,965 55 3,932 55 3,929
113 10,350 105 9,864 102 9,612 102 9,609
Delta HotelsManaged - - 27 7,246 26 6,829 26 6,828 Franchised - - 10 2,349 11 2,761 10 2,557
- - 37 9,595 37 9,590 36 9,385
The Ritz-CarltonOwned 1 180 1 180 1 180 - - Leased 2 552 2 552 2 552 2 552 Managed1 88 25,351 89 25,595 90 25,568 93 26,150 Franchised - - - - 1 429 1 429 Residences 40 4,228 40 4,228 40 4,228 40 4,228
131 30,311 132 30,555 134 30,957 136 31,359
Bulgari Hotels & ResortsManaged 2 117 2 117 2 117 2 117 Franchised 1 85 1 85 1 85 1 85 Residences 1 5 1 5 1 5 1 5
4 207 4 207 4 207 4 207
EDITION Managed 2 468 3 741 3 741 3 741 Franchised 1 78 1 78 1 78 1 78 Residences 1 25 1 25 1 25 1 25
4 571 5 844 5 844 5 844
CourtyardOwned 3 529 3 529 3 529 3 529 Leased 18 2,667 18 2,667 18 2,667 18 2,667 Managed 320 54,285 320 54,285 324 55,461 328 56,048 Franchised 654 89,366 661 90,302 675 91,964 688 94,173
995 146,847 1,002 147,783 1,020 150,621 1,037 153,417
Residence InnOwned 1 192 1 192 1 192 1 192 Managed 114 16,663 114 16,663 115 17,044 115 17,044 Franchised 567 66,278 573 67,089 573 67,099 581 67,893
682 83,133 688 83,944 689 84,335 697 85,129
TownePlace SuitesManaged 15 1,741 15 1,741 15 1,740 15 1,740 Franchised 238 23,712 245 24,370 249 24,768 255 25,388
253 25,453 260 26,111 264 26,508 270 27,128
Fairfield Inn & SuitesManaged 7 1,616 8 1,740 8 1,740 10 2,040 Franchised 723 65,674 739 67,257 745 67,812 758 69,032
730 67,290 747 68,997 753 69,552 768 71,072
SpringHill SuitesManaged 29 4,550 29 4,550 30 4,720 30 4,720 Franchised 293 33,441 298 34,102 303 34,688 306 35,030
322 37,991 327 38,652 333 39,408 336 39,750
AC Hotels by MarriottUnconsolidated Joint Ventures 79 9,776 82 10,359 82 10,359 83 10,462
79 9,776 82 10,359 82 10,359 83 10,462
Moxy HotelsFranchised 1 162 1 162 1 162 1 162
1 162 1 162 1 162 1 162
Timeshare2 58 12,876 58 12,876 58 12,876 58 12,807
TotalOwned 7 1,617 7 1,617 7 1,617 6 1,437 Leased 42 9,421 42 9,421 41 9,206 41 9,206 Managed 1,069 288,152 1,096 297,246 1,106 298,254 1,116 300,305 Franchised 2,926 396,853 2,985 406,510 3,023 413,072 3,073 420,507 Unconsolidated Joint Ventures 84 10,124 87 10,707 87 10,707 88 10,810 Residences 42 4,258 42 4,258 42 4,258 42 4,258 Timeshare 58 12,876 58 12,876 58 12,876 58 12,807 Total 4,228 723,301 4,317 742,635 4,364 749,990 4,424 759,330
1 Includes Serviced Apartments
2015
2 Timeshare unit and room counts are as of March 27, 2015, June 19, 2015, September 11, 2015 and January 1, 2016 the end of Marriott Vacation Club's 1st, 2nd, 3rd and 4th quarters, respectively.
2015
V. ROOM AND UNIT COUNTS - WORLDWIDE
2015 2015
A-15

First Quarter Second Quarter Third Quarter Fourth QuarterUnits Rooms Units Rooms Units Rooms Units Rooms
Marriott HotelsOwned 2 716 2 716 2 716 2 716 Leased 6 2,831 6 2,831 6 2,831 6 2,831 Managed 279 110,470 278 108,929 280 109,611 285 112,987 Franchised 241 74,119 249 77,070 251 77,403 253 77,762
528 188,136 535 189,546 539 190,561 546 194,296
JW MarriottLeased 1 496 1 496 1 496 1 496 Managed 61 27,748 61 27,753 60 27,629 62 28,620 Franchised 15 5,824 15 5,824 16 5,942 17 6,211
77 34,068 77 34,073 77 34,067 80 35,327
Marriott Executive ApartmentsManaged 27 4,131 27 4,131 28 4,195 28 4,195
27 4,131 27 4,131 28 4,195 28 4,195
SheratonOwned - - - - 8 5,433 8 5,433 Leased - - - - 1 106 1 105 Managed - - - - 216 86,571 219 87,742 Franchised - - - - 220 65,136 221 65,544
- - - - 445 157,246 449 158,824
WestinOwned - - - - 3 2,078 3 2,078 Managed - - - - 113 46,475 116 47,137 Franchised - - - - 99 31,877 98 32,034
- - - - 215 80,430 217 81,249
Renaissance HotelsLeased 4 1,059 4 1,059 4 1,059 4 1,059 Managed 77 28,122 77 28,136 76 27,832 76 27,796 Franchised 81 22,651 81 22,756 82 23,059 83 23,271
162 51,832 162 51,951 162 51,950 163 52,126
Le MeridienManaged - - - - 78 21,764 79 21,672 Franchised - - - - 27 6,616 27 6,626
- - - - 105 28,380 106 28,298
Autograph Collection Hotels Managed 6 1,649 6 1,649 6 1,649 7 1,735 Franchised 89 21,679 91 21,940 94 22,277 99 22,856 Unconsolidated Joint Ventures 5 348 5 348 5 348 5 348
100 23,676 102 23,937 105 24,274 111 24,939
Delta Hotels and ResortsManaged 25 6,764 25 6,764 25 6,764 25 6,764 Franchised 12 3,020 12 3,020 12 3,020 12 3,020
37 9,784 37 9,784 37 9,784 37 9,784
Gaylord HotelsManaged 5 8,098 5 8,098 5 8,098 5 8,098
5 8,098 5 8,098 5 8,098 5 8,098
The Ritz-CarltonLeased 2 552 2 552 2 553 2 553 Managed1 93 26,127 93 26,123 93 26,124 95 26,581 Franchised 1 429 1 429 1 429 1 429 Residences 40 4,228 41 4,472 43 5,204 43 5,204
136 31,336 137 31,576 139 32,310 141 32,767
V. ROOM AND UNIT COUNTS - WORLDWIDE
2016
A-16
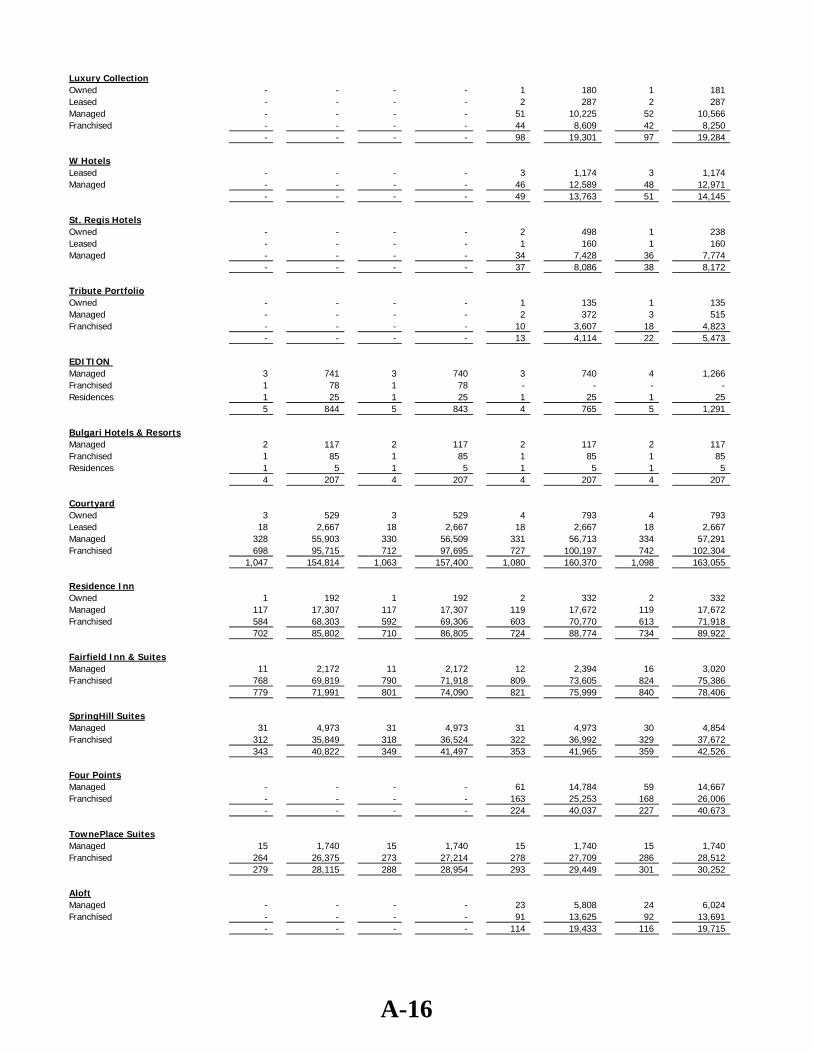
Luxury CollectionOwned - - - - 1 180 1 181 Leased - - - - 2 287 2 287 Managed - - - - 51 10,225 52 10,566 Franchised - - - - 44 8,609 42 8,250
- - - - 98 19,301 97 19,284
W HotelsLeased - - - - 3 1,174 3 1,174 Managed - - - - 46 12,589 48 12,971
- - - - 49 13,763 51 14,145
St. Regis HotelsOwned - - - - 2 498 1 238 Leased - - - - 1 160 1 160 Managed - - - - 34 7,428 36 7,774
- - - - 37 8,086 38 8,172
Tribute PortfolioOwned - - - - 1 135 1 135 Managed - - - - 2 372 3 515 Franchised - - - - 10 3,607 18 4,823
- - - - 13 4,114 22 5,473
EDITION Managed 3 741 3 740 3 740 4 1,266 Franchised 1 78 1 78 - - - - Residences 1 25 1 25 1 25 1 25
5 844 5 843 4 765 5 1,291
Bulgari Hotels & ResortsManaged 2 117 2 117 2 117 2 117 Franchised 1 85 1 85 1 85 1 85 Residences 1 5 1 5 1 5 1 5
4 207 4 207 4 207 4 207
CourtyardOwned 3 529 3 529 4 793 4 793 Leased 18 2,667 18 2,667 18 2,667 18 2,667 Managed 328 55,903 330 56,509 331 56,713 334 57,291 Franchised 698 95,715 712 97,695 727 100,197 742 102,304
1,047 154,814 1,063 157,400 1,080 160,370 1,098 163,055
Residence InnOwned 1 192 1 192 2 332 2 332 Managed 117 17,307 117 17,307 119 17,672 119 17,672 Franchised 584 68,303 592 69,306 603 70,770 613 71,918
702 85,802 710 86,805 724 88,774 734 89,922
Fairfield Inn & SuitesManaged 11 2,172 11 2,172 12 2,394 16 3,020 Franchised 768 69,819 790 71,918 809 73,605 824 75,386
779 71,991 801 74,090 821 75,999 840 78,406
SpringHill SuitesManaged 31 4,973 31 4,973 31 4,973 30 4,854 Franchised 312 35,849 318 36,524 322 36,992 329 37,672
343 40,822 349 41,497 353 41,965 359 42,526
Four PointsManaged - - - - 61 14,784 59 14,667 Franchised - - - - 163 25,253 168 26,006
- - - - 224 40,037 227 40,673
TownePlace SuitesManaged 15 1,740 15 1,740 15 1,740 15 1,740 Franchised 264 26,375 273 27,214 278 27,709 286 28,512
279 28,115 288 28,954 293 29,449 301 30,252
AloftManaged - - - - 23 5,808 24 6,024 Franchised - - - - 91 13,625 92 13,691
- - - - 114 19,433 116 19,715
A-16

AC Hotels by MarriottUnconsolidated Joint Ventures 87 11,045 91 11,629 94 12,404 95 12,758
87 11,045 91 11,629 94 12,404 95 12,758
Protea HotelsLeased 10 1,601 10 1,601 10 1,601 10 1,601 Managed 37 4,109 36 4,100 36 4,093 36 4,201 Franchised 52 3,670 51 3,583 51 3,548 51 3,550
99 9,380 97 9,284 97 9,242 97 9,352
ElementManaged - - - - 2 368 2 368 Franchised - - - - 20 2,999 21 3,106
- - - - 22 3,367 23 3,474
Moxy HotelsFranchised 3 600 4 708 6 1,094 7 1,294
3 600 4 708 6 1,094 7 1,294
TimeshareMVW2 60 12,889 60 12,889 62 13,020 62 13,020 Vistana - - - - 22 7,682 21 7,682
60 12,889 60 12,889 84 20,702 83 20,702
TotalOwned 6 1,437 6 1,437 23 10,165 22 9,906 Leased 41 9,206 41 9,206 48 10,934 48 10,933 Managed 1,117 300,171 1,117 299,241 1,748 506,728 1,777 516,373 Franchised 3,122 428,216 3,191 438,150 3,927 603,852 4,005 614,350 Unconsolidated Joint Ventures 92 11,393 96 11,977 99 12,752 100 13,106 Residences 42 4,258 43 4,502 45 5,234 45 5,234 Timeshare 60 12,889 60 12,889 84 20,702 83 20,702 Total 4,480 767,570 4,554 777,402 5,974 1,170,367 6,080 1,190,604
1 Includes Serviced Apartments2 MVW unit and room counts are reported one quarter in arrears. MVW data is as of September 16, 2016, the end of Marriott Vacation Worldwide's third quarter
A-16

4 5 6 7 8 9 10 11First Quarter Second Quarter Third Quarter Fourth Quarter
Units Rooms Units Rooms Units Rooms Units RoomsMarriott Hotels1,2
Owned 2 716 1 278 1 278 1 278 Leased 7 3,011 7 3,011 7 3,011 7 3,011 Managed 286 113,641 288 114,450 290 115,889 295 116,780 Franchised 249 76,827 252 77,669 260 79,434 263 80,211
544 194,195 548 195,408 558 198,612 566 200,280
JW MarriottLeased 1 496 1 496 1 496 1 496 Managed 62 28,620 62 28,624 62 28,634 64 29,184 Franchised 17 6,211 17 6,211 16 6,049 16 6,049
80 35,327 80 35,331 79 35,179 81 35,729
Marriott Executive Apartments3
Managed 28 4,195 28 4,195 28 4,195 29 4,270 28 4,195 28 4,195 28 4,195 29 4,270
SheratonOwned 8 5,433 8 5,433 8 5,432 7 4,060 Leased 1 105 1 105 1 105 1 105 Managed 219 87,682 218 87,593 214 86,363 213 87,021 Franchised 220 64,769 219 64,508 221 64,840 220 64,564 Residences - - - - 2 262 2 262
448 157,989 446 157,639 446 157,002 443 156,012
WestinOwned 3 2,078 2 1,319 2 1,319 2 1,319 Managed 115 46,820 114 46,861 114 46,971 114 46,915 Franchised 98 32,288 102 33,209 104 33,694 105 33,954 Residences - - - - 4 530 4 530
216 81,186 218 81,389 224 82,514 225 82,718
Renaissance HotelsLeased 4 1,059 4 1,059 4 1,066 4 1,066 Managed 75 27,526 77 28,017 78 28,322 80 28,729 Franchised 84 23,716 84 23,598 85 23,764 84 23,502
163 52,301 165 52,674 167 53,152 168 53,297
Le MeridienManaged 79 21,672 78 21,480 77 20,920 79 21,421 Franchised 28 6,866 29 7,064 33 8,308 33 8,308
107 28,538 107 28,544 110 29,228 112 29,729
Autograph Collection Hotels Managed 9 2,521 10 2,592 9 2,445 10 2,660 Franchised 105 24,753 108 25,189 115 26,085 119 26,741 Unconsolidated Joint Ventures 5 348 5 348 6 419 6 419
119 27,622 123 28,129 130 28,949 135 29,820
Delta Hotels and ResortsManaged 25 6,764 25 6,764 25 6,764 25 6,764 Franchised 15 3,789 18 4,662 22 5,267 25 5,948
40 10,553 43 11,426 47 12,031 50 12,712
Gaylord HotelsManaged 5 8,108 5 8,108 5 8,108 5 8,108
5 8,108 5 8,108 5 8,108 5 8,108
V. ROOM AND UNIT COUNTS - WORLDWIDE
2017
A-17

The Ritz-CarltonLeased 2 553 2 553 2 553 2 553 Managed4 96 26,785 97 26,942 99 27,408 99 27,087 Franchised 1 429 1 429 1 429 1 429 Residences 43 5,009 44 5,218 44 5,218 46 5,630
142 32,776 144 33,142 146 33,608 148 33,699
Luxury CollectionOwned 1 181 1 181 1 181 1 181 Leased 2 287 2 284 2 284 2 287 Managed 52 10,566 52 10,566 53 10,524 54 10,911 Franchised 42 8,278 45 8,648 46 8,759 48 9,544 Residences - - - - 2 155 2 155
97 19,312 100 19,679 104 19,903 107 21,078
W HotelsLeased 3 1,174 3 1,174 3 1,174 3 1,174 Managed 47 12,718 49 13,337 50 13,611 50 13,611 Residences - - - - 15 1,610 13 1,549
50 13,892 52 14,511 68 16,395 66 16,334
St. Regis HotelsOwned 1 238 1 238 1 238 1 238 Leased 1 160 1 160 1 160 1 160 Managed 37 7,962 39 8,656 41 9,039 41 9,038 Residences - - - - 12 983 13 1,101
39 8,360 41 9,054 55 10,420 56 10,537
Tribute PortfolioOwned 1 135 1 135 1 135 1 135 Managed 3 515 3 515 3 559 3 559 Franchised 20 5,083 21 5,156 23 5,530 24 5,514
24 5,733 25 5,806 27 6,224 28 6,208
EDITION Managed 4 1,266 4 1,266 4 1,266 4 1,266 Residences 1 25 1 25 1 25 1 25
5 1,291 5 1,291 5 1,291 5 1,291
Bulgari Hotels & ResortsManaged 2 117 2 117 3 237 4 357 Franchised 1 85 1 85 1 85 1 85 Residences 1 5 1 5 1 5 1 5
4 207 4 207 5 327 6 447
CourtyardOwned 4 793 4 793 4 793 4 794 Leased 18 2,665 18 2,665 18 2,665 18 2,665 Managed 335 57,458 333 57,204 333 57,152 325 56,561 Franchised 754 103,730 762 104,711 772 106,096 795 109,386
1,111 164,646 1,117 165,373 1,127 166,706 1,142 169,406
Residence InnOwned 2 332 2 332 2 332 2 332 Managed 118 17,513 117 17,417 111 16,724 114 17,162 Franchised 620 72,881 625 73,566 630 74,170 644 76,213
740 90,726 744 91,315 743 91,226 760 93,707
Fairfield Inn & SuitesManaged 18 3,248 18 3,256 22 3,776 24 4,010 Franchised 838 76,679 855 78,332 874 80,154 895 82,424
856 79,927 873 81,588 896 83,930 919 86,434
SpringHill SuitesManaged 30 4,854 30 4,854 30 4,854 30 4,854 Franchised 333 38,128 343 39,367 352 40,464 358 41,092
363 42,982 373 44,221 382 45,318 388 45,946
A-17

Four PointsManaged 59 14,512 60 14,732 62 15,055 63 15,335 Franchised 170 26,296 176 27,132 180 27,643 186 28,645
229 40,808 236 41,864 242 42,698 249 43,980
TownePlace SuitesManaged 15 1,740 15 1,740 15 1,740 16 1,841 Franchised 297 29,644 305 30,476 314 31,510 322 32,431
312 31,384 320 32,216 329 33,250 338 34,272
AloftManaged 26 6,539 28 6,948 29 7,056 30 7,236 Franchised 100 14,798 102 15,088 108 16,163 108 16,163
126 21,337 130 22,036 137 23,219 138 23,399
AC Hotels by MarriottUnconsolidated Joint Ventures 101 13,740 107 14,711 115 16,090 123 17,240
101 13,740 107 14,711 115 16,090 123 17,240
Protea HotelsLeased 9 1,421 9 1,415 9 1,415 9 1,415 Managed 36 4,223 36 4,220 36 4,265 36 4,265 Franchised 48 3,499 47 3,437 45 3,343 45 3,353
93 9,143 92 9,072 90 9,023 90 9,033
ElementManaged 2 368 4 949 5 1,113 5 1,113 Franchised 22 3,197 26 3,730 27 3,874 29 4,140
24 3,565 30 4,679 32 4,987 34 5,253
Moxy HotelsManaged - - 1 109 1 109 3 469 Franchised 10 2,168 10 2,168 15 3,640 17 4,104
10 2,168 11 2,277 16 3,749 20 4,573
TimeshareMVW 5 64 13,318 64 13,456 65 13,604 66 13,655 Vistana 21 7,634 23 8,267 23 8,283 23 8,499
85 20,952 87 21,723 88 21,887 89 22,154
TotalOwned 22 9,906 20 8,709 20 8,708 19 7,337 Leased 48 10,931 48 10,922 48 10,929 48 10,932 Managed 1,783 517,933 1,793 521,512 1,799 523,099 1,815 527,527 Franchised 4,072 624,114 4,148 634,435 4,244 649,301 4,338 662,800 Unconsolidated Joint Ventures 106 14,088 112 15,059 121 16,509 129 17,659 Residences 45 5,039 46 5,248 81 8,788 82 9,257 Timeshare 85 20,952 87 21,723 88 21,887 89 22,154 Total 6,161 1,202,963 6,254 1,217,608 6,401 1,239,221 6,520 1,257,666
Total Countries/Territories6 124 125 126 127
The Las Vegas assemblage (MHR, Courtyard and Residence Inn) is included with the Owned properties.
3 Marriott Executive Apartments includes 27 branded Marriott Executive Apartments (3,505 rooms) and 2 unbranded apartments 4 Includes Serviced Apartments in Tokyo (244 rooms), Jakarta (123 rooms), Guangzhou (91 rooms), Dubai (121 rooms) and Tianjin (118 rooms).5 MVW unit and room counts are reported one quarter in arrears. MVW data is as of September 30, 2017 the end of Marriott Vacation Worldwide's third quarter 6 Total Countries and Territories includes the United States and other countries and territories.
1 Includes Marriott Conference Centers.2 The Camelback hotel is a managed property; however, Marriott owns certain common areas that are shown as fixed assets by Marriott.
A-17

VI. ROOM AND UNIT COUNTS - DOMESTIC
Units Rooms Units Rooms Units Rooms Units Rooms Units Rooms
MHRSOwned 18 6,987 16 6,317 16 6,738 20 8,382 23 9,722Managed/Leased 97 47,427 95 48,181 100 51,653 106 53,411 114 56,018Franchised 34 11,114 40 13,228 48 16,153 52 17,256 53 17,581
149 65,528 151 67,726 164 74,544 178 79,049 190 83,321
CourtyardOwned 11 1,506 8 1,155 2 221 5 687 23 3,414Managed/Leased - - 28 4,018 74 10,758 106 15,450 117 17,110
11 1,506 36 5,173 76 10,979 111 16,137 140 20,524
Residence InnOwned - - - - 18 2,144 1 144 3 410Managed/Leased - - - - 38 4,629 73 8,677 82 10,096Franchised - - - - 50 5,496 56 6,280 63 7,207
- - - - 106 12,269 130 15,101 148 17,713
Fairfield InnOwned - - - - 2 265 18 2,388 43 5,730
- - - - 2 265 18 2,388 43 5,730
Timeshare - - - - - - - - 7 450
TotalOwned 29 8,493 24 7,472 38 9,368 44 11,601 92 19,276Managed/Leased 97 47,427 123 52,199 212 67,040 285 77,538 313 83,224Franchised 34 11,114 40 13,228 98 21,649 108 23,536 116 24,788Timeshare - - - - - - - - 7 450
Total 160 67,034 187 72,899 348 98,057 437 112,675 528 127,738
19891985 1986 1987 1988Year-EndYear-End Year-End Year-End Year-End
B-1
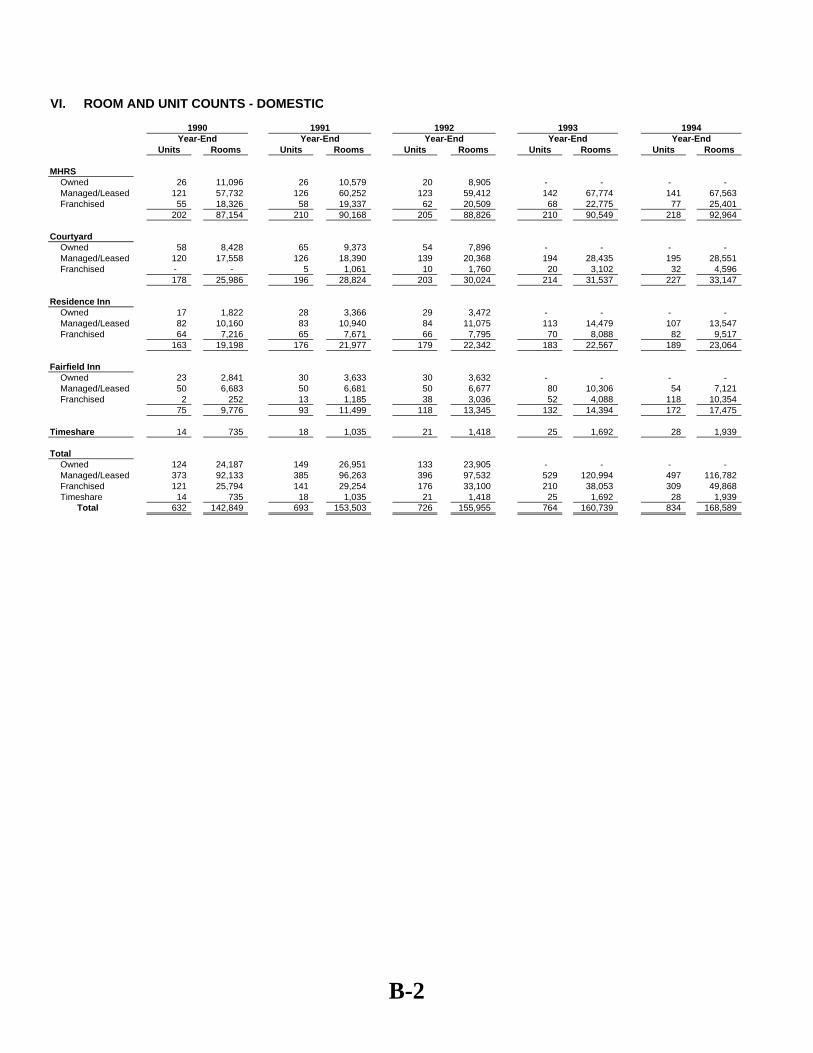
VI. ROOM AND UNIT COUNTS - DOMESTIC
Units Rooms Units Rooms Units Rooms Units Rooms Units Rooms
MHRSOwned 26 11,096 26 10,579 20 8,905 - - - - Managed/Leased 121 57,732 126 60,252 123 59,412 142 67,774 141 67,563Franchised 55 18,326 58 19,337 62 20,509 68 22,775 77 25,401
202 87,154 210 90,168 205 88,826 210 90,549 218 92,964
CourtyardOwned 58 8,428 65 9,373 54 7,896 - - - - Managed/Leased 120 17,558 126 18,390 139 20,368 194 28,435 195 28,551Franchised - - 5 1,061 10 1,760 20 3,102 32 4,596
178 25,986 196 28,824 203 30,024 214 31,537 227 33,147
Residence InnOwned 17 1,822 28 3,366 29 3,472 - - - - Managed/Leased 82 10,160 83 10,940 84 11,075 113 14,479 107 13,547Franchised 64 7,216 65 7,671 66 7,795 70 8,088 82 9,517
163 19,198 176 21,977 179 22,342 183 22,567 189 23,064
Fairfield InnOwned 23 2,841 30 3,633 30 3,632 - - - - Managed/Leased 50 6,683 50 6,681 50 6,677 80 10,306 54 7,121Franchised 2 252 13 1,185 38 3,036 52 4,088 118 10,354
75 9,776 93 11,499 118 13,345 132 14,394 172 17,475
Timeshare 14 735 18 1,035 21 1,418 25 1,692 28 1,939
TotalOwned 124 24,187 149 26,951 133 23,905 - - - - Managed/Leased 373 92,133 385 96,263 396 97,532 529 120,994 497 116,782Franchised 121 25,794 141 29,254 176 33,100 210 38,053 309 49,868Timeshare 14 735 18 1,035 21 1,418 25 1,692 28 1,939
Total 632 142,849 693 153,503 726 155,955 764 160,739 834 168,589
19941990 1991 1992 1993Year-EndYear-End Year-End Year-End Year-End
B-2

VI. ROOM AND UNIT COUNTS - DOMESTIC
Units Rooms Units Rooms Units Rooms Units Rooms Units Rooms
MHRSOwned 1 356 1 356 2 800 4 2,452 4 2,442Leased - - - - - - 2 1,000 2 1,000Managed/Leased 168 73,088 164 72,390 163 72,125 158 72,682 165 76,340Franchised 81 26,310 87 28,014 89 28,716 102 32,431 91 27,970
250 99,754 252 100,760 254 101,641 266 108,565 262 107,752
RenaissanceOwned - - - - - - - - 1 504Managed/Leased - - - - 31 14,145 31 13,723 31 13,724Franchised - - - - - - 3 1,850 7 2,856
- - - - 31 14,145 34 15,573 39 17,084
The Ritz-CarltonOwned - - 1 148 - - - - - - Managed/Leased 25 8,623 24 8,082 20 7,166 20 7,177 19 6,897
25 8,623 25 8,230 20 7,166 20 7,177 19 6,897
CourtyardOwned - - 1 153 - - 1 157 1 123Leased - - - - - - 29 4,177 32 4,544Managed/Leased 196 28,792 198 29,063 210 30,731 194 28,720 208 31,402Franchised 53 7,356 87 11,297 128 15,984 159 19,579 194 24,550
249 36,148 286 40,513 338 46,715 383 52,633 435 60,619
Residence InnOwned - - 1 120 1 106 3 408 3 372Leased - - - - - - 13 1,783 17 2,287Managed/Leased 101 12,853 106 13,864 111 14,613 108 14,336 117 15,745Franchised 94 10,715 114 12,201 142 15,406 165 17,743 180 19,313
195 23,568 221 26,185 254 30,125 289 34,270 317 37,717
TownePlace SuitesOwned - - - - 2 184 3 285 4 412Leased - - - - - - 2 190 9 934Managed/Leased - - - - - - 3 337 13 1,326Franchised - - - - - - 9 887 35 3,434
- - - - 2 184 17 1,699 61 6,106
Fairfield InnManaged/Leased 50 6,668 51 7,133 51 7,133 54 7,472 51 7,138Franchised 180 15,277 233 20,118 293 25,721 339 29,896 363 31,835
230 21,945 284 27,251 344 32,854 393 37,368 414 38,973
SpringHill SuitesManaged/Leased - - - - - - - - 6 654Franchised - - - - - - - - 28 2,791
- - - - - - - - 34 3,445
Marriott Vacation Club 29 2,526 31 2,880 32 3,351 33 3,516 38 4,038
Horizons by Marriott Vacation Club - - - - - - - - 1 101
TotalOwned 1 356 4 777 5 1,090 11 3,302 13 3,853Leased - - - - - - 46 7,150 60 8,765Managed/Leased 540 130,024 543 130,532 586 145,913 568 144,447 610 153,226Franchised 408 59,658 521 71,630 652 85,827 777 102,386 898 112,749Timeshare 29 2,526 31 2,880 32 3,351 33 3,516 39 4,139
Total 978 192,564 1,099 205,819 1,275 236,181 1,435 260,801 1,620 282,732
19991995 1996 1997 1998Year-EndYear-End Year-End Year-End Year-End
B-3

VI. ROOM AND UNIT COUNTS - DOMESTIC
Units Rooms Units Rooms Units Rooms Units Rooms Units Rooms
MHRSOwned 3 2,026 - - - - 1 408 - - Leased 3 1,383 3 1,383 3 1,382 2 781 1 383 Managed 165 77,914 167 80,335 172 82,346 173 84,135 173 85,473 Franchised 99 30,367 109 33,768 118 36,580 131 40,995 144 43,975
270 111,690 279 115,486 293 120,308 307 126,319 318 129,831
RenaissanceManaged 32 13,860 37 15,631 38 15,793 38 16,263 41 17,177 Franchised 15 5,615 21 7,298 25 8,168 26 8,036 26 8,297
47 19,475 58 22,929 63 23,961 64 24,299 67 25,474
The Ritz-CarltonOwned 1 548 - - - - - - - - Managed 20 7,063 26 8,796 32 10,270 35 11,669 35 11,629
21 7,611 26 8,796 32 10,270 35 11,669 35 11,629
CourtyardOwned 3 663 2 640 1 203 1 203 1 203 Leased 28 4,177 23 3,902 23 3,905 23 3,905 20 3,314 Managed 225 34,086 236 35,488 241 36,731 245 37,339 249 37,940 Franchised 223 27,824 247 31,005 274 35,066 294 37,389 325 41,828
479 66,750 508 71,035 539 75,905 563 78,836 595 83,285
Residence InnOwned - - - - 2 353 1 198 1 198 Leased 16 2,069 13 1,709 10 1,267 5 667 - - Managed 123 15,983 119 15,815 124 16,918 124 16,632 131 17,593 Franchised 206 22,063 250 27,168 280 30,464 306 34,022 317 35,381
345 40,115 382 44,692 416 49,002 436 51,519 449 53,172
TownePlace SuitesOwned 1 137 3 338 2 194 - - - - Leased 10 1,061 7 732 4 415 4 415 - - Managed 20 2,092 24 2,598 28 3,056 28 3,057 34 3,661 Franchised 53 5,242 65 6,593 70 7,039 79 7,909 81 8,049
84 8,532 99 10,261 104 10,704 111 11,381 115 11,710
Fairfield InnLeased 1 388 1 388 1 378 1 388 - - Managed 51 7,138 1 467 1 512 1 467 2 855 Franchised 387 33,886 478 45,040 501 47,324 521 49,248 517 47,403
439 41,412 480 45,895 503 48,214 523 50,103 519 48,258
SpringHill SuitesOwned 3 370 2 365 - - 1 159 1 159 Leased 2 562 2 562 2 562 2 562 - - Managed 7 804 14 1,941 18 2,625 19 2,731 22 3,438 Franchised 49 4,785 66 6,724 77 7,898 87 9,106 101 10,829
61 6,521 84 9,592 97 11,085 109 12,558 124 14,426
Marriott Vacation Club 39 4,779 44 5,622 37 5,909 34 6,394 36 7,354
Horizons by Marriott Vacation Club 2 146 2 146 2 146 2 256 2 328
The Ritz-Carlton Club 1 47 2 63 3 143 3 153 3 180
Grand Residences by Marriott - - - - 1 199 1 199 1 199
TotalOwned 11 3,744 7 1,343 5 750 4 968 3 560 Leased 60 9,640 49 8,676 43 7,909 37 6,718 21 3,697 Managed 643 158,940 624 161,071 654 168,251 663 172,293 687 177,766 Franchised 1,032 129,782 1,236 157,596 1,345 172,539 1,444 186,705 1,511 195,762 Timeshare 42 4,972 48 5,831 43 6,397 40 7,002 42 8,061
Total 1,788 307,078 1,964 334,517 2,090 355,846 2,188 373,686 2,264 385,846
2000Year-End Year-End Year-EndYear-EndYear-End
20042001 2002 2003
B-4

VI. ROOM AND UNIT COUNTS - DOMESTIC
1st Quarter 2nd Quarter YTD 3rd Quarter YTD 4th Quarter YTDUnits Rooms Units Rooms Units Rooms Units Rooms
MHRSLeased 2 1,414 2 1,414 2 1,414 2 1,414 Managed 170 83,588 170 83,310 169 82,912 170 83,571 Franchised 149 45,472 154 46,942 157 47,697 160 48,549
321 130,474 326 131,666 328 132,023 332 133,534
RenaissanceOwned - - - - 4 1,868 4 1,868 Leased - - - - 4 1,228 3 974 Managed 41 17,180 41 17,177 32 13,755 30 13,057 Franchised 27 8,658 27 8,578 28 8,835 30 9,532
68 25,838 68 25,755 68 25,686 67 25,431
The Ritz-CarltonManaged 35 11,616 35 11,616 35 11,616 35 11,616 35 11,616 35 11,616 35 11,616 35 11,616
CourtyardOwned 1 203 1 203 1 203 1 203 Leased 20 3,314 20 3,314 20 3,314 20 3,314 Managed 251 38,451 251 38,452 252 38,720 253 38,976 Franchised 328 42,420 332 42,957 341 44,140 349 45,046
600 84,388 604 84,926 614 86,377 623 87,539
Residence InnOwned 1 198 1 198 1 198 1 198 Managed 131 17,593 132 17,716 132 17,716 134 17,974 Franchised 321 35,872 326 36,437 332 37,142 338 38,032
453 53,663 459 54,351 465 55,056 473 56,204
TownePlace SuitesManaged 34 3,661 34 3,661 34 3,660 34 3,660 Franchised 83 8,155 84 8,274 85 8,361 88 8,643
117 11,816 118 11,935 119 12,021 122 12,303
Fairfield InnManaged 2 855 2 855 2 855 2 855 Franchised 511 46,533 509 46,090 514 46,412 517 46,585
513 47,388 511 46,945 516 47,267 519 47,440
SpringHill SuitesOwned 1 159 1 159 1 159 1 159 Managed 22 3,438 22 3,438 23 3,658 23 3,656 Franchised 102 10,923 110 11,836 110 11,826 112 12,063
125 14,520 133 15,433 134 15,643 136 15,878
Marriott Vacation Club 36 7,354 36 7,524 36 7,564 36 7,693
Horizons by Marriott Vacation Club 2 328 2 328 2 328 2 328
The Ritz-Carlton Club 3 180 3 180 3 187 3 187
Grand Residences by Marriott 1 199 1 199 1 199 1 264
TotalOwned 3 560 3 560 7 2,428 7 2,428 Leased 22 4,728 22 4,728 26 5,956 25 5,702 Managed 686 176,382 687 176,225 679 172,892 681 173,365 Franchised 1,521 198,033 1,542 201,114 1,567 204,413 1,594 208,450 Timeshare 42 8,061 42 8,231 42 8,278 42 8,472
Total 2,274 387,764 2,296 390,858 2,321 393,967 2,349 398,417
20052005 2005 2005
B-5

VI. ROOM AND UNIT COUNTS - DOMESTIC
2006 20061st Quarter 2nd Quarter YTD 3rd Quarter YTD 4th Quarter YTD
Units Rooms Units Rooms Units Rooms Units Rooms
MHRSOwned - - - - - - 1 193 Leased 2 1,414 2 1,414 2 1,414 2 1,414 Managed 167 82,350 168 82,334 167 82,229 166 82,225 Franchised 168 50,944 170 51,715 171 51,947 171 52,265
337 134,708 340 135,463 340 135,590 340 136,097
RenaissanceOwned 3 1,195 2 802 - - - - Leased 3 978 3 978 3 978 3 978 Managed 32 14,079 32 14,076 33 14,885 32 14,903 Franchised 30 9,527 31 9,923 30 9,221 30 9,225
68 25,779 68 25,779 66 25,084 65 25,106
The Ritz-CarltonManaged 35 11,616 35 11,616 35 11,616 35 11,616
CourtyardOwned 1 203 1 203 1 203 1 203 Leased 20 3,314 20 3,314 20 3,314 20 3,314 Managed 253 38,976 254 39,186 254 39,348 250 38,747 Franchised 353 45,687 359 46,375 366 47,301 379 48,962
627 88,180 634 89,078 641 90,166 650 91,226
Residence InnOwned 1 198 1 198 1 198 1 198 Managed 134 18,008 134 18,068 134 18,068 135 18,203 Franchised 344 38,956 348 39,544 358 40,654 358 40,572
479 57,162 483 57,810 493 58,920 494 58,973
TownePlace SuitesManaged 34 3,661 34 3,661 34 3,661 34 3,661 Franchised 88 8,643 89 8,728 88 8,634 89 8,707
122 12,304 123 12,389 122 12,295 123 12,368
Fairfield InnManaged 2 855 2 855 2 855 2 855 Franchised 517 46,507 514 45,891 513 45,605 511 45,175
519 47,362 516 46,746 515 46,460 513 46,030
SpringHill SuitesOwned 1 159 1 159 1 159 1 159 Managed 22 3,422 22 3,422 22 3,422 22 3,422 Franchised 118 12,939 121 13,248 125 13,665 129 14,103
141 16,520 144 16,829 148 17,246 152 17,684
Marriott Vacation Club 36 7,802 36 8,101 36 8,370 36 8,673
Horizons by Marriott Vacation Club 2 328 2 328 2 328 2 372
The Ritz-Carlton Club 3 187 5 372 5 288 5 434
Grand Residences by Marriott 1 264 2 264 2 264 2 264
TotalOwned 6 1,755 5 1,362 3 560 4 753 Leased 25 5,706 25 5,706 25 5,706 25 5,706 Managed 679 172,967 681 173,218 681 174,084 676 173,632 Franchised 1,618 213,203 1,632 215,424 1,651 217,027 1,667 219,009 Timeshare 42 8,581 45 9,065 45 9,250 45 9,743
Total 2,370 402,212 2,388 404,775 2,405 406,627 2,417 408,843
20062006
B-6

VI. ROOM AND UNIT COUNTS - DOMESTIC
1st Quarter 2nd Quarter YTD 3rd Quarter YTD 4th Quarter YTDUnits Rooms Units Rooms Units Rooms Units Rooms
MHRSOwned 2 965 1 193 1 278 1 278 Leased 2 1,414 2 1,414 2 1,414 2 1,414 Managed 165 81,466 166 81,962 165 81,685 167 82,457 Franchised 172 52,445 172 52,231 172 52,234 172 52,199
341 136,290 341 135,800 340 135,611 342 136,348
RenaissanceLeased 3 978 3 978 3 978 3 978 Managed 32 14,903 33 15,165 32 14,820 33 15,220 Franchised 30 8,491 33 9,226 33 9,225 35 9,919
65 24,372 69 25,369 68 25,023 71 26,117
The Ritz-CarltonManaged 34 11,343 34 11,343 35 11,530 36 11,627 Residences 14 1,331 14 1,332 15 1,402 16 1,614 48 12,674 48 12,675 50 12,932 52 13,241
CourtyardOwned 1 203 1 203 1 149 1 149 Leased 20 3,314 20 3,314 19 3,165 19 3,165 Managed 250 38,747 250 38,747 252 39,115 252 39,115 Franchised 386 49,955 397 51,064 407 52,401 421 54,330
657 92,219 668 93,328 679 94,830 693 96,759
Residence InnOwned 1 198 2 390 1 192 1 192 Managed 135 18,204 134 18,012 135 18,210 137 18,501 Franchised 368 41,654 371 41,891 380 43,019 390 44,112
504 60,056 507 60,293 516 61,421 528 62,805
TownePlace SuitesManaged 34 3,661 34 3,661 34 3,661 34 3,661 Franchised 89 8,705 94 9,196 100 9,806 107 10,461
123 12,366 128 12,857 134 13,467 141 14,122
Fairfield InnManaged 2 855 2 855 2 855 2 855 Franchised 506 44,371 511 44,737 519 45,376 527 46,075
508 45,226 513 45,592 521 46,231 529 46,930
SpringHill SuitesOwned 1 159 1 159 - - - - Managed 23 3,541 23 3,541 24 3,700 24 3,700 Franchised 132 14,460 138 15,198 142 15,672 152 16,745
156 18,160 162 18,898 166 19,372 176 20,445
Marriott Vacation Club 36 8,673 37 8,795 37 8,866 37 8,987
Horizons by Marriott Vacation Club 2 372 2 372 2 444 2 444
The Ritz-Carlton Club 1 6 359 6 362 7 419 7 421
Grand Residences by Marriott 1 1 199 1 199 2 264 2 264
TotalOwned 5 1,525 5 945 3 619 3 619 Leased 25 5,706 25 5,706 24 5,557 24 5,557 Managed 675 172,720 676 173,286 679 173,576 685 175,136 Franchised 1,683 220,081 1,716 223,543 1,753 227,733 1,804 233,841 Ritz-Carlton Residences 14 1,331 14 1,332 15 1,402 16 1,614 Timeshare 45 9,603 46 9,728 48 9,993 48 10,116
Total 2,447 410,966 2,482 414,540 2,522 418,880 2,580 426,883
1 MVCI Residential properties are included in the respective brands.
20072007 2007 2007
B-7

VI. ROOM AND UNIT COUNTS - DOMESTIC
1st Quarter 2nd Quarter YTD 3rd Quarter YTD 4th Quarter YTDUnits Rooms Units Rooms Units Rooms Units Rooms
MHRSOwned 1 278 1 278 1 278 1 278 Leased 2 1,414 3 1,770 3 1,770 3 1,770 Managed 167 82,590 166 82,248 165 82,053 164 81,895 Franchised 173 52,593 174 52,834 176 53,397 180 54,670
343 136,875 344 137,130 345 137,498 348 138,613
RenaissanceLeased 4 1,449 4 1,449 4 1,449 4 1,449 Managed 34 15,414 34 15,416 34 15,419 34 15,415 Franchised 37 10,593 38 10,856 37 10,678 38 10,910
75 27,456 76 27,721 75 27,546 76 27,774
The Ritz-CarltonManaged 36 11,437 36 11,437 37 11,603 37 11,629 Residences 17 1,639 19 1,938 19 1,938 22 2,176 53 13,076 55 13,375 56 13,541 59 13,805
CourtyardOwned 1 149 1 149 1 149 1 149 Leased 19 3,165 19 3,165 19 3,165 19 3,165 Managed 254 39,377 255 39,531 256 39,641 256 39,641 Franchised 423 54,450 433 56,056 439 56,721 452 58,788
697 97,141 708 98,901 715 99,676 728 101,743
Residence InnOwned 1 192 1 192 1 192 1 192 Managed 133 18,138 132 18,058 131 17,962 133 18,374 Franchised 395 44,689 401 45,593 409 46,398 421 47,686
529 63,019 534 63,843 541 64,552 555 66,252
TownePlace SuitesManaged 34 3,661 34 3,661 34 3,661 34 3,661 Franchised 111 10,861 118 11,534 120 11,742 129 12,667
145 14,522 152 15,195 154 15,403 163 16,328
Fairfield InnManaged 2 855 2 855 2 855 2 855 Franchised 525 45,746 534 46,717 545 47,687 558 48,823
527 46,601 536 47,572 547 48,542 560 49,678
SpringHill SuitesManaged 24 3,700 25 3,817 26 3,940 26 3,940 Franchised 162 17,757 170 18,901 172 19,117 181 20,087
186 21,457 195 22,718 198 23,057 207 24,027
Marriott Vacation Club 38 9,039 38 9,110 39 9,257 39 9,282
Horizons by Marriott Vacation Club 2 444 2 444 2 444 2 444
The Ritz-Carlton Club 1 7 421 7 421 8 449 9 477
Grand Residences by Marriott 1 2 264 2 264 2 264 2 264
TotalOwned 3 619 3 619 3 619 3 619 Leased 25 6,028 26 6,384 26 6,384 26 6,384 Managed 684 175,172 684 175,023 685 175,134 686 175,410 Franchised 1,826 236,689 1,868 242,491 1,898 245,740 1,959 253,631 Ritz-Carlton Residences 17 1,639 19 1,938 19 1,938 22 2,176 Timeshare 49 10,168 49 10,239 51 10,414 52 10,467
Total 2,604 430,315 2,649 436,694 2,682 440,229 2,748 448,687
1 MVCI Residential properties are included in the respective brands.
20082008 2008 2008
B-8

VI. ROOM AND UNIT COUNTS - DOMESTIC
1st Quarter 2nd Quarter YTD 3rd Quarter YTD 4th Quarter YTDUnits Rooms Units Rooms Units Rooms Units Rooms
Marriott Hotels & ResortsOwned 1 278 1 278 1 278 1 278 Leased 3 1,769 3 1,769 3 1,769 3 1,769 Managed 164 82,003 163 81,709 160 80,790 160 80,790 Franchised 181 54,881 182 55,189 186 56,443 189 57,323
349 138,931 349 138,945 350 139,280 353 140,160
RenaissanceLeased 4 1,449 4 1,449 4 1,449 4 1,449 Managed 34 15,688 34 15,688 33 15,514 33 15,514 Franchised 38 10,910 39 11,060 41 11,545 42 11,955
76 28,047 77 28,197 78 28,508 79 28,918
The Ritz-CarltonManaged 37 11,652 37 11,549 37 11,549 40 12,115 Residences 23 2,446 23 2,446 24 2,545 25 2,613 60 14,098 60 13,995 61 14,094 65 14,728
CourtyardOwned 1 149 1 149 1 149 1 149 Leased 19 3,165 19 3,165 19 3,165 19 3,165 Managed 257 39,756 258 39,984 260 40,578 260 40,581 Franchised 461 59,972 469 61,359 481 62,943 488 63,745
738 103,042 747 104,657 761 106,835 768 107,640
Residence InnOwned 1 192 1 192 1 192 1 192 Managed 134 18,582 136 18,888 138 19,211 138 19,406 Franchised 423 47,956 430 48,734 444 50,462 452 51,397
558 66,730 567 67,814 583 69,865 591 70,995
TownePlace SuitesManaged 34 3,661 34 3,659 34 3,659 34 3,659 Franchised 132 12,982 139 13,700 145 14,258 150 14,792
166 16,643 173 17,359 179 17,917 184 18,451
Fairfield InnManaged 2 855 2 855 3 1,055 3 1,055 Franchised 572 50,197 587 51,595 606 53,482 617 54,567
574 51,052 589 52,450 609 54,537 620 55,622
SpringHill SuitesManaged 26 3,940 26 3,940 27 4,140 31 4,916 Franchised 191 21,188 200 22,104 214 23,678 224 24,930
217 25,128 226 26,044 241 27,818 255 29,846
Marriott Vacation Club 1 41 9,732 41 9,732 41 9,728 41 9,728
The Ritz-Carlton Destination Club & Residences 2, 3 9 477 9 477 10 561 10 561
Grand Residences by Marriott 2 3 290 3 290 3 290 3 290
TotalOwned 3 619 3 619 3 619 3 619 Leased 26 6,383 26 6,383 26 6,383 26 6,383 Managed 688 176,137 690 176,272 692 176,496 699 178,036 Franchised 1,998 258,086 2,046 263,741 2,117 272,811 2,162 278,709 Ritz-Carlton Residences 23 2,446 23 2,446 24 2,545 25 2,613 Timeshare 53 10,499 53 10,499 54 10,579 54 10,579
Total 2,791 454,170 2,841 459,960 2,916 469,433 2,969 476,939
1 Beginning in Q1 2009, Horizons by Marriott Vacation Club is included with Marriott Vacation Club.2 MVCI Residential properties are included in the respective brands.3 The Ritz-Carlton Club was relaunched as The Ritz-Carlton Destination Club in Q2, 2009.
2009 2009 2009 2009
B-9
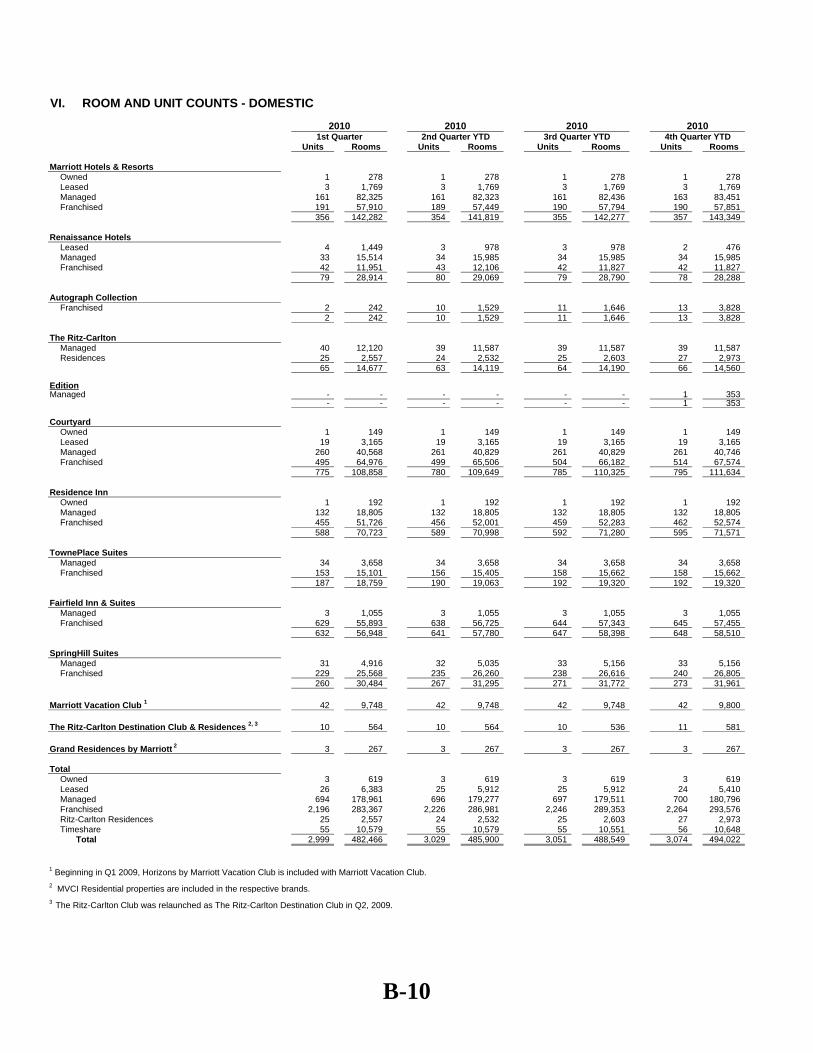
VI. ROOM AND UNIT COUNTS - DOMESTIC
1st Quarter 2nd Quarter YTD 3rd Quarter YTD 4th Quarter YTDUnits Rooms Units Rooms Units Rooms Units Rooms
Marriott Hotels & ResortsOwned 1 278 1 278 1 278 1 278 Leased 3 1,769 3 1,769 3 1,769 3 1,769 Managed 161 82,325 161 82,323 161 82,436 163 83,451 Franchised 191 57,910 189 57,449 190 57,794 190 57,851
356 142,282 354 141,819 355 142,277 357 143,349
Renaissance HotelsLeased 4 1,449 3 978 3 978 2 476 Managed 33 15,514 34 15,985 34 15,985 34 15,985 Franchised 42 11,951 43 12,106 42 11,827 42 11,827
79 28,914 80 29,069 79 28,790 78 28,288
Autograph CollectionFranchised 2 242 10 1,529 11 1,646 13 3,828
2 242 10 1,529 11 1,646 13 3,828
The Ritz-CarltonManaged 40 12,120 39 11,587 39 11,587 39 11,587 Residences 25 2,557 24 2,532 25 2,603 27 2,973 65 14,677 63 14,119 64 14,190 66 14,560
EditionManaged - - - - - - 1 353 - - - - - - 1 353 Courtyard
Owned 1 149 1 149 1 149 1 149 Leased 19 3,165 19 3,165 19 3,165 19 3,165 Managed 260 40,568 261 40,829 261 40,829 261 40,746 Franchised 495 64,976 499 65,506 504 66,182 514 67,574
775 108,858 780 109,649 785 110,325 795 111,634
Residence InnOwned 1 192 1 192 1 192 1 192 Managed 132 18,805 132 18,805 132 18,805 132 18,805 Franchised 455 51,726 456 52,001 459 52,283 462 52,574
588 70,723 589 70,998 592 71,280 595 71,571
TownePlace SuitesManaged 34 3,658 34 3,658 34 3,658 34 3,658 Franchised 153 15,101 156 15,405 158 15,662 158 15,662
187 18,759 190 19,063 192 19,320 192 19,320
Fairfield Inn & SuitesManaged 3 1,055 3 1,055 3 1,055 3 1,055 Franchised 629 55,893 638 56,725 644 57,343 645 57,455
632 56,948 641 57,780 647 58,398 648 58,510
SpringHill SuitesManaged 31 4,916 32 5,035 33 5,156 33 5,156 Franchised 229 25,568 235 26,260 238 26,616 240 26,805
260 30,484 267 31,295 271 31,772 273 31,961
Marriott Vacation Club 1 42 9,748 42 9,748 42 9,748 42 9,800
The Ritz-Carlton Destination Club & Residences 2, 3 10 564 10 564 10 536 11 581
Grand Residences by Marriott 2 3 267 3 267 3 267 3 267
TotalOwned 3 619 3 619 3 619 3 619 Leased 26 6,383 25 5,912 25 5,912 24 5,410 Managed 694 178,961 696 179,277 697 179,511 700 180,796 Franchised 2,196 283,367 2,226 286,981 2,246 289,353 2,264 293,576 Ritz-Carlton Residences 25 2,557 24 2,532 25 2,603 27 2,973 Timeshare 55 10,579 55 10,579 55 10,551 56 10,648
Total 2,999 482,466 3,029 485,900 3,051 488,549 3,074 494,022
1 Beginning in Q1 2009, Horizons by Marriott Vacation Club is included with Marriott Vacation Club.2 MVCI Residential properties are included in the respective brands.3 The Ritz-Carlton Club was relaunched as The Ritz-Carlton Destination Club in Q2, 2009.
2010 2010 2010 2010
B-10

VI. ROOM AND UNIT COUNTS - DOMESTIC
1st Quarter Second Quarter Third Quarter Fourth QuarterUnits Rooms Units Rooms Units Rooms Units Rooms
Marriott Hotels & ResortsOwned 1 278 1 278 1 278 1 278 Leased 3 1,769 3 1,769 3 1,769 2 1,386 Managed 162 83,204 163 83,534 161 82,876 159 82,228 Franchised 190 58,625 189 58,295 190 58,656 191 58,989
356 143,876 356 143,876 355 143,579 353 142,881
Renaissance HotelsLeased 2 476 1 310 1 310 1 310 Managed 36 16,589 36 16,589 36 16,589 37 17,116 Franchised 42 11,827 42 11,827 41 11,547 42 11,803
80 28,892 79 28,726 78 28,446 80 29,229
Autograph CollectionFranchised 14 3,954 16 4,118 16 4,860 17 5,207
14 3,954 16 4,118 16 4,860 17 5,207
The Ritz-CarltonManaged 39 11,587 39 11,587 39 11,587 39 11,587 Residences 28 3,197 28 3,197 29 3,509 29 3,509 67 14,784 67 14,784 68 15,096 68 15,096
EditionManaged 1 353 1 353 - - - -
1 353 1 353 - - - - Courtyard
Owned 1 149 1 149 1 149 1 149 Leased 19 3,165 19 3,165 19 3,165 19 3,165 Managed 262 40,896 262 40,896 262 40,896 262 40,936 Franchised 516 67,831 519 68,229 520 68,368 523 69,163
798 112,041 801 112,439 802 112,578 805 113,413
Residence InnOwned 1 192 1 192 1 192 1 192 Managed 133 19,130 134 19,285 134 19,285 133 19,172 Franchised 463 52,708 462 52,590 462 52,590 463 52,712
597 72,030 597 72,067 597 72,067 597 72,076
TownePlace SuitesManaged 34 3,658 34 3,658 34 3,658 29 3,086 Franchised 159 15,751 161 15,939 163 16,112 171 16,962
193 19,409 195 19,597 197 19,770 200 20,048
Fairfield Inn & SuitesManaged 3 1,055 3 1,055 3 1,055 3 1,055 Franchised 645 57,487 649 57,945 660 58,955 664 59,337
648 58,542 652 59,000 663 60,010 667 60,392
SpringHill SuitesManaged 33 5,156 34 5,311 34 5,311 34 5,311 Franchised 240 26,805 245 27,453 249 27,923 251 28,155
273 31,961 279 32,764 283 33,234 285 33,466
Timeshare 1 56 10,730 56 10,730 56 10,730 50 10,496
TotalOwned 3 619 3 619 3 619 3 619 Leased 24 5,410 23 5,244 23 5,244 22 4,861 Managed 703 181,628 706 182,268 703 181,257 696 180,491 Franchised 2,269 294,988 2,283 296,396 2,301 299,011 2,322 302,328 Ritz-Carlton Residences 28 3,197 28 3,197 29 3,509 29 3,509 Timeshare 56 10,730 56 10,730 56 10,730 50 10,496
Total 3,083 496,572 3,099 498,454 3,115 500,370 3,122 502,304
1 The methodology used to report the number of timeshare properties and rooms changed in Q4 2011 as a result of our timeshare spin-off.
2011 2011 2011 2011
B-11

VI. ROOM AND UNIT COUNTS - DOMESTIC
1st Quarter 2nd Quarter 3rd Quarter 4th QuarterUnits Rooms Units Rooms Units Rooms Units Rooms
Marriott Hotels & ResortsOwned 1 278 1 278 1 278 1 278 Leased 2 1,386 2 1,386 2 1,386 2 1,386 Managed 159 82,017 158 81,324 156 80,472 157 80,981 Franchised 189 58,397 190 58,821 191 59,042 192 59,032
351 142,078 351 141,809 350 141,178 352 141,677
Renaissance HotelsLeased 1 310 1 310 1 310 1 310 Managed 36 16,769 36 16,769 35 16,137 35 16,137 Franchised 43 12,150 43 12,150 43 12,150 43 12,150
80 29,229 80 29,229 79 28,597 79 28,597
Autograph CollectionFranchised 20 5,815 21 6,223 22 6,298 24 6,609
20 5,815 21 6,223 22 6,298 24 6,609
Gaylord Hotels & ResortsManaged - - - - - - 5 8,098
- - - - - - 5 8,098
The Ritz-CarltonManaged 39 11,587 39 11,587 39 11,587 38 11,357 Residences 29 3,509 30 3,598 30 3,598 30 3,598 68 15,096 69 15,185 69 15,185 68 14,955
CourtyardOwned 1 149 1 149 1 149 1 149 Leased 19 3,165 18 2,667 18 2,667 18 2,667 Managed 262 40,936 261 41,090 263 41,334 264 41,589 Franchised 525 69,442 528 69,837 530 70,023 534 70,543
807 113,692 808 113,743 812 114,173 817 114,948
Residence InnOwned 1 192 1 192 1 192 1 192 Managed 133 19,174 131 18,968 129 18,760 127 18,512 Franchised 463 52,712 467 53,134 471 53,562 474 53,938
597 72,078 599 72,294 601 72,514 602 72,642
TownePlace SuitesManaged 29 3,086 22 2,440 22 2,440 22 2,440 Franchised 173 17,162 180 17,788 183 18,059 186 18,363
202 20,248 202 20,228 205 20,499 208 20,803
Fairfield Inn & SuitesManaged 3 1,055 3 1,055 3 1,055 3 1,055 Franchised 667 59,625 670 59,926 674 60,271 675 60,422
670 60,680 673 60,981 677 61,326 678 61,477
SpringHill SuitesManaged 34 5,311 32 5,129 30 4,844 29 4,545 Franchised 254 28,510 259 29,015 266 29,827 268 30,299
288 33,821 291 34,144 296 34,671 297 34,844
Timeshare 1 50 10,628 50 10,628 50 10,628 50 10,706
TotalOwned 3 619 3 619 3 619 3 619 Leased 22 4,861 21 4,363 21 4,363 21 4,363 Managed 695 179,935 682 178,362 677 176,629 680 184,714 Franchised 2,334 303,813 2,358 306,894 2,380 309,232 2,396 311,356 Ritz-Carlton Residences 29 3,509 30 3,598 30 3,598 30 3,598 Timeshare 50 10,628 50 10,628 50 10,628 50 10,706
Total 3,133 503,365 3,144 504,464 3,161 505,069 3,180 515,356
1 Reported 2012 Timeshare properties and rooms/suites are not comparable to some 2011 data due to a change in reporting methodology that occurred in Q4 2011 as a result of our Timeshare spin-off.
2012 2012 2012 2012
B-12

VI. ROOM AND UNIT COUNTS - DOMESTIC
1st Quarter 2nd Quarter 3rd Quarter 4th QuarterUnits Rooms Units Rooms Units Rooms Units Rooms
Marriott Hotels Owned 1 278 1 278 1 278 2 716 Leased 2 1,386 2 1,386 2 1,386 2 1,386 Managed 157 80,922 157 80,943 155 79,968 151 78,310 Franchised 188 58,043 188 58,019 189 58,294 189 58,448
348 140,629 348 140,626 347 139,926 344 138,960
Renaissance HotelsLeased 1 310 1 310 1 310 1 310 Managed 34 15,749 33 15,356 32 14,725 32 14,725 Franchised 43 12,150 43 12,154 43 12,154 43 12,154
78 28,209 77 27,820 76 27,189 76 27,189
Autograph CollectionFranchised 26 6,910 26 6,917 30 8,059 32 8,410
26 6,910 26 6,917 30 8,059 32 8,410
Gaylord Hotels & ResortsManaged 5 8,098 5 8,098 5 8,098 5 8,098
5 8,098 5 8,098 5 8,098 5 8,098
The Ritz-CarltonManaged 38 11,357 38 11,356 37 11,048 37 11,040 Residences 30 3,598 30 3,598 30 3,598 30 3,598 68 14,955 68 14,954 67 14,646 67 14,638
CourtyardOwned 1 149 1 149 1 149 1 149 Leased 18 2,667 18 2,667 18 2,667 18 2,667 Managed 259 40,896 256 40,384 256 40,384 255 40,384 Franchised 542 71,383 549 72,533 555 73,349 562 74,493
820 115,095 824 115,733 830 116,549 836 117,693
Residence InnOwned 1 192 1 192 1 192 1 192 Managed 127 18,512 122 17,662 122 17,692 121 17,461 Franchised 479 54,545 489 55,997 499 57,215 507 58,403
607 73,249 612 73,851 622 75,099 629 76,056
TownePlace SuitesManaged 22 2,440 22 2,440 22 2,440 22 2,440 Franchised 190 18,678 196 19,190 196 19,190 200 19,599
212 21,118 218 21,630 218 21,630 222 22,039
Fairfield Inn & SuitesManaged 3 1,055 3 1,055 4 1,197 4 1,197 Franchised 676 60,611 686 61,800 690 62,088 687 61,724
679 61,666 689 62,855 694 63,285 691 62,921
SpringHill SuitesManaged 29 4,545 29 4,582 29 4,582 29 4,582 Franchised 268 30,299 272 30,747 274 30,971 277 31,306
297 34,844 301 35,329 303 35,553 306 35,888
Timeshare 1 50 10,706 48 10,560 48 10,560 47 10,506
TotalOwned 3 619 3 619 3 619 4 1,057 Leased 21 4,363 21 4,363 21 4,363 21 4,363 Managed 674 183,574 665 181,876 662 180,134 656 178,237 Franchised 2,412 312,619 2,449 317,357 2,476 321,320 2,497 324,537 Ritz-Carlton Residences 30 3,598 30 3,598 30 3,598 30 3,598 Timeshare 50 10,706 48 10,560 48 10,560 47 10,506
Total 3,190 515,479 3,216 518,373 3,240 520,594 3,255 522,298
2nd, 3rd, and 4th quarters, respectively.
2013 2013 2013 2013
1 Timeshare unit and room counts are as of March 22, 2013, June 14, 2013, September 6, 2013, and January 3, 2014, the end of Marriott Vacation Worldwide's 1st,
B-13

VI. ROOM AND UNIT COUNTS - DOMESTIC
1st Quarter 2nd Quarter 3rd Quarter 4th QuarterUnits Rooms Units Rooms Units Rooms Units Rooms
Marriott Hotels Owned 2 716 2 716 2 716 2 716 Leased 2 1,386 2 1,386 2 1,386 2 1,386 Managed 151 78,310 151 79,164 150 78,878 149 78,688 Franchised 189 58,445 191 58,981 193 59,595 194 59,785
344 138,857 346 140,247 347 140,575 347 140,575
Renaissance HotelsLeased 1 310 1 310 1 310 1 310 Managed 32 14,725 32 14,725 32 14,727 32 14,571 Franchised 43 12,154 44 12,384 45 12,707 45 12,707
76 27,189 77 27,419 78 27,744 78 27,588
Autograph CollectionManaged - - - - 1 181 1 181 Franchised 34 8,842 34 8,842 34 8,817 43 9,901
34 8,842 34 8,842 35 8,998 44 10,082
Gaylord Hotels & ResortsManaged 5 8,098 5 8,098 5 8,098 5 8,098
5 8,098 5 8,098 5 8,098 5 8,098
The Ritz-CarltonManaged 37 11,040 38 11,300 38 11,300 39 11,424 Residences 30 3,598 30 3,598 30 3,598 30 3,598 67 14,638 68 14,898 68 14,898 69 15,022
EditionOwned - - - - - - 1 295 Residences - - - - - - 1 25
2 320 AC Hotels by Marriott
Unconsolidated Joint Ventures - - - - - - 1 220 1 220
CourtyardOwned 1 149 1 149 1 149 1 149 Leased 18 2,667 18 2,667 18 2,667 18 2,667 Managed 255 40,311 256 40,468 257 40,666 255 40,322 Franchised 563 74,991 570 75,788 582 77,107 587 77,756
837 118,118 845 119,072 858 120,589 861 120,894
Residence InnOwned 1 192 1 192 1 192 1 192 Managed 117 16,898 118 17,214 106 15,756 105 15,636 Franchised 508 58,544 516 59,506 534 61,629 542 62,690
626 75,634 635 76,912 641 77,577 648 78,518
TownePlace SuitesManaged 19 2,123 18 2,028 17 1,933 15 1,743 Franchised 203 19,964 210 20,655 215 21,197 225 22,230
222 22,087 228 22,683 232 23,130 240 23,973
Fairfield Inn & SuitesManaged 4 1,197 4 1,200 4 1,200 4 1,200 Franchised 691 62,022 694 62,288 703 63,213 700 63,162
695 63,219 698 63,488 707 64,413 704 64,362
SpringHill SuitesManaged 29 4,582 29 4,582 29 4,582 28 4,450 Franchised 281 31,852 282 31,955 282 32,006 286 32,518
310 36,434 311 36,537 311 35,588 314 36,968
Timeshare 1 47 10,578 47 10,731 47 10,801 45 10,605
TotalOwned 4 1,057 4 1,057 4 1,057 5 1,352 Leased 21 4,363 21 4,363 21 4,363 21 4,363 Managed 649 177,284 651 178,779 639 177,321 633 176,313 Franchised 2,512 326,814 2,541 330,399 2,588 336,271 2,622 340,749 Unconsolidated Joint Ventures 1 220 Residences 30 3,598 30 3,598 30 3,598 31 3,623 Timeshare 47 10,578 47 10,731 47 10,801 45 10,605
Total 3,263 523,694 3,294 528,927 3,329 533,411 3,358 537,225
Vacation Club's 1st, 2nd, 3rd, and 4th quarters, respectively
2014 2014 2014 2014
1 Timeshare unit and room counts are as of March 28, 2014, June 20, 2014, September 12, 2014, and January 2, 2015, the end of Marriott
B-14

VI. ROOM AND UNIT COUNTS - North America
1st Quarter 2nd Quarter 3rd Quarter 4th QuarterUnits Rooms Units Rooms Units Rooms Units Rooms
Marriott HotelsOwned 2 716 2 716 2 716 2 716 Leased 2 1,386 2 1,386 2 1,386 2 1,386 Managed 154 80,095 153 79,825 153 80,364 153 80,457 Franchised 205 64,417 207 64,947 209 65,769 210 66,025
363 146,614 364 146,874 366 148,235 367 148,584
Renaissance HotelsLeased 1 310 1 310 1 310 1 310 Managed 32 14,571 31 14,371 27 11,919 27 11,919 Franchised 48 13,441 49 13,641 51 14,519 54 15,130
81 28,322 81 28,322 79 26,748 82 27,359
Autograph Collection Hotels Managed 1 181 1 181 3 1,065 3 1,065 Franchised 45 10,419 48 11,381 51 11,777 52 12,070
46 10,600 49 11,562 54 12,842 55 13,135
Gaylord Hotels Managed 5 8,098 5 8,098 5 8,098 5 8,098
5 8,098 5 8,098 5 8,098 5 8,098
Delta HotelsManaged - - 27 7,246 26 6,829 26 6,828 Franchised - - 10 2,349 11 2,761 10 2,557
- - 37 9,595 37 9,590 36 9,385 The Ritz-CarltonManaged 40 11,691 40 11,691 39 11,410 39 11,410 Franchised - - - - 1 429 1 429 Residences 32 3,812 32 3,812 32 3,812 32 3,812
72 15,503 72 15,503 72 15,651 72 15,651
EDITIONManaged 1 295 2 568 2 568 2 568 Residences 1 25 1 25 1 25 1 25
2 320 3 593 3 593 3 593
CourtyardOwned 1 149 1 149 1 149 1 149 Leased 18 2,667 18 2,667 18 2,667 18 2,667 Managed 256 40,494 256 40,494 257 41,074 257 41,074 Franchised 615 82,538 620 83,099 631 84,062 640 85,151
890 125,848 895 126,409 907 127,952 916 129,041
Residence InnOwned 1 192 1 192 1 192 1 192 Managed 109 16,146 109 16,146 110 16,527 110 16,527 Franchised 565 66,078 571 66,889 571 66,899 579 67,693
675 82,416 681 83,227 682 83,618 690 84,412
TownePlace SuitesManaged 15 1,741 15 1,741 15 1,740 15 1,740 Franchised 238 23,712 245 24,370 249 24,768 255 25,388
253 25,453 260 26,111 264 26,508 270 27,128
Fairfield Inn & SuitesManaged 4 1,200 5 1,324 5 1,324 5 1,324 Franchised 722 65,468 738 67,051 744 67,606 756 68,646
726 66,668 743 68,375 749 68,930 761 69,970
SpringHill SuitesManaged 29 4,550 29 4,550 30 4,720 30 4,720 Franchised 293 33,441 298 34,102 303 34,688 306 35,030
322 37,991 327 38,652 333 39,408 336 39,750
AC Hotels by MarriottUnconsolidated Joint Ventures 2 343 5 911 5 911 5 911
2 343 5 911 5 911 5 911
Timeshare1 45 10,609 45 10,609 45 10,609 45 10,540
TotalOwned 4 1,057 4 1,057 4 1,057 4 1,057 Leased 21 4,363 21 4,363 21 4,363 21 4,363 Managed 646 179,062 673 186,235 672 185,638 672 185,730 Franchised 2,731 359,514 2,786 367,829 2,821 373,278 2,863 378,119 Unconsolidated Joint Ventures 2 343 5 911 5 911 5 911 Residences 33 3,837 33 3,837 33 3,837 33 3,837 Timeshare 45 10,609 45 10,609 45 10,609 45 10,540 Total 3,482 558,785 3,567 574,841 3,601 579,693 3,643 584,557
1 Timeshare unit and room counts are as of March 27, 2015, June 19, 2015, September 11, 2015 and January 1, 2016 the end of Marriott Vacation Club's 1st, 2nd, 3rd and 4th quarters, respectively.
2015 2015 2015 2015
B-15

VI. ROOM AND UNIT COUNTS - NORTH AMERICA*
4 5 6 7 8 9 10 11
Units Rooms Units Rooms Units Rooms Units RoomsMarriott HotelsOwned 2 716 2 716 2 716 2 716 Leased 2 1,386 2 1,386 2 1,386 2 1,386 Managed 135 69,783 129 67,109 130 67,427 131 68,440 Franchised 201 62,162 207 64,560 208 64,821 210 65,271
340 134,047 340 133,771 342 134,350 345 135,813
JW MarriottManaged 15 9,690 15 9,695 15 9,695 15 9,695 Franchised 10 4,469 10 4,469 10 4,469 10 4,469
25 14,159 25 14,164 25 14,164 25 14,164
SheratonOwned - - - - 3 2,671 3 2,671 Managed - - - - 31 23,654 31 23,654 Franchised - - - - 161 47,693 162 48,025
- - - - 195 74,018 196 74,350
WestinOwned - - - - 2 1,832 2 1,832 Managed - - - - 48 25,129 48 25,173 Franchised - - - - 75 24,399 75 24,700
- - - - 125 51,360 125 51,705
Renaissance HotelsLeased 1 310 1 310 1 310 1 310 Managed 27 11,919 27 11,929 26 11,625 26 11,625 Franchised 57 15,816 56 15,799 57 16,103 57 16,103
85 28,045 84 28,038 84 28,038 84 28,038
Le MeridienManaged - - - - 4 719 4 720 Franchised - - - - 16 3,753 16 3,753
- - - - 20 4,472 20 4,473
Autograph Collection Hotels Managed 3 1,065 3 1,065 3 1,065 3 1,065 Franchised 55 12,443 57 12,649 58 12,804 61 13,234
58 13,508 60 13,714 61 13,869 64 14,299
Delta Hotels and ResortsManaged 25 6,764 25 6,764 25 6,764 25 6,764 Franchised 12 3,020 12 3,020 12 3,020 12 3,020
37 9,784 37 9,784 37 9,784 37 9,784
Gaylord HotelsManaged 5 8,098 5 8,098 5 8,098 5 8,098
5 8,098 5 8,098 5 8,098 5 8,098
The Ritz-CarltonManaged 39 11,414 39 11,410 39 11,410 39 11,410 Franchised 1 429 1 429 1 429 1 429 Residences 32 3,812 33 4,056 35 4,788 35 4,788
72 15,655 73 15,895 75 16,627 75 16,627
Luxury CollectionManaged - - - - 5 2,294 5 2,294 Franchised - - - - 10 2,009 9 1,863
- - - - 15 4,303 14 4,157
W HotelsLeased - - - - 1 509 1 509 Managed - - - - 24 7,441 25 7,729
- - - - 25 7,950 26 8,238
St. Regis HotelsOwned - - - - 2 498 1 238 Managed - - - - 8 1,464 9 1,725
- - - - 10 1,962 10 1,963
Tribute PortfolioOwned - - - - 1 135 1 135 Franchised - - - - 7 3,423 12 4,541
- - - - 8 3,558 13 4,676
2016
First Quarter Second Quarter Third Quarter Fourth Quarter
B-16

4 5 6 7 8 9 10 112016
First Quarter Second Quarter Third Quarter Fourth QuarterEDITION Managed 2 568 2 567 2 567 2 567 Residences 1 25 1 25 1 25 1 25
3 593 3 592 3 592 3 592
CourtyardOwned 1 149 1 149 1 149 1 149 Leased 18 2,667 18 2,667 18 2,667 18 2,667 Managed 256 40,821 256 40,821 256 40,821 256 40,821 Franchised 649 86,441 661 88,010 673 89,786 686 91,559
924 130,078 936 131,647 948 133,423 961 135,196
Residence InnOwned 1 192 1 192 1 192 1 192 Managed 112 16,790 112 16,790 114 17,155 114 17,155 Franchised 582 68,103 590 69,106 601 70,570 611 71,718
695 85,085 703 86,088 716 87,917 726 89,065
Fairfield Inn & SuitesManaged 5 1,324 5 1,324 5 1,324 6 1,432 Franchised 766 69,433 788 71,532 807 73,219 822 75,000
771 70,757 793 72,856 812 74,543 828 76,432
SpringHill SuitesManaged 31 4,973 31 4,973 31 4,973 30 4,854 Franchised 312 35,849 318 36,524 322 36,992 329 37,672
343 40,822 349 41,497 353 41,965 359 42,526
Four PointsManaged - - - - 1 134 1 134 Franchised - - - - 127 19,409 131 19,996
- - - - 128 19,543 132 20,130
TownePlace SuitesManaged 15 1,740 15 1,740 15 1,740 15 1,740 Franchised 264 26,375 273 27,214 278 27,709 286 28,512
279 28,115 288 28,954 293 29,449 301 30,252
AloftManaged - - - - 1 330 1 330 Franchised - - - - 79 11,637 80 11,766
- - - - 80 11,967 81 12,096
AC Hotels by MarriottUnconsolidated Joint Ventures 7 1,193 8 1,352 9 1,518 11 1,913
7 1,193 8 1,352 9 1,518 11 1,913
ElementManaged - - - - 1 180 1 180 Franchised - - - - 18 2,706 19 2,813
- - - - 19 2,886 20 2,993
Moxy HotelsFranchised 1 186 2 294 2 294 2 294
1 186 2 294 2 294 2 294
TimeshareMVW 1 46 10,611 46 10,611 48 10,665 48 10,665 Vistana - - - - 19 6,462 18 6,462
46 10,611 46 10,611 67 17,127 66 17,127
B-16

4 5 6 7 8 9 10 112016
First Quarter Second Quarter Third Quarter Fourth QuarterTotalOwned 4 1,057 4 1,057 12 6,193 11 5,933 Leased 21 4,363 21 4,363 22 4,872 22 4,872 Managed 670 184,949 664 182,285 789 244,009 792 245,605 Franchised 2,910 384,726 2,975 393,606 3,522 515,245 3,591 524,738 Unconsolidated Joint Ventures 7 1,193 8 1,352 9 1,518 11 1,913 Residences 33 3,837 34 4,081 36 4,813 36 4,813 Timeshare 46 10,611 46 10,611 67 17,127 66 17,127 Total 3,691 590,736 3,752 597,355 4,457 793,777 4,529 805,001
* North America includes properties located in the United States, Canada, and French Polynesia.1 MVW unit and room counts are reported one quarter in arrears. MVW data is as of September 16, 2016, the end of Marriott Vacation Worldwide's third quarter for 2016.
B-16

VI. ROOM AND UNIT COUNTS - NORTH AMERICA*
First Quarter Second Quarter Third Quarter Fourth QuarterUnits Rooms Units Rooms Units Rooms Units Rooms
Marriott Hotels1,2
Owned 2 716 1 278 1 278 1 278 Leased 2 1,386 2 1,386 2 1,386 2 1,386 Managed 130 68,389 130 68,336 131 69,576 131 69,234 Franchised 207 64,518 209 65,216 212 66,137 213 66,435
341 135,009 342 135,216 346 137,377 347 137,333
JW MarriottManaged 15 9,695 15 9,699 15 9,709 16 10,059 Franchised 10 4,469 10 4,469 10 4,425 10 4,425
25 14,164 25 14,168 25 14,134 26 14,484
SheratonOwned 3 2,671 3 2,671 3 2,671 2 1,299 Managed 31 23,600 31 23,600 30 23,208 29 24,010 Franchised 162 48,013 161 47,765 161 47,765 161 47,765
196 74,284 195 74,036 194 73,644 192 73,074
WestinOwned 2 1,832 1 1,073 1 1,073 1 1,073 Managed 48 25,288 47 25,332 46 25,127 46 25,127 Franchised 74 24,522 77 25,460 80 26,262 81 26,522 Residences - - - - 3 266 3 266
124 51,642 125 51,865 130 52,728 131 52,988
Renaissance HotelsLeased 1 310 1 310 1 317 1 317 Managed 26 11,625 27 11,829 28 12,134 28 12,128 Franchised 58 16,548 58 16,430 58 16,323 57 16,065
85 28,483 86 28,569 87 28,774 86 28,510
Le MeridienManaged 4 720 4 720 4 720 4 720 Franchised 16 3,753 16 3,759 18 4,286 18 4,286
20 4,473 20 4,479 22 5,006 22 5,006
Autograph Collection Hotels Managed 3 1,065 3 1,065 3 989 4 1,204 Franchised 65 14,655 67 15,008 70 15,247 74 15,903
68 15,720 70 16,073 73 16,236 78 17,107
Delta Hotels and ResortsManaged 25 6,764 25 6,764 25 6,764 25 6,764 Franchised 15 3,789 18 4,662 22 5,267 24 5,609
40 10,553 43 11,426 47 12,031 49 12,373
Gaylord HotelsManaged 5 8,108 5 8,108 5 8,108 5 8,108
5 8,108 5 8,108 5 8,108 5 8,108
The Ritz-CarltonManaged 39 11,413 39 11,413 40 11,764 39 11,256 Franchised 1 429 1 429 1 429 1 429 Residences 35 4,593 35 4,593 35 4,593 36 4,705
75 16,435 75 16,435 76 16,786 76 16,390
2017
B-17
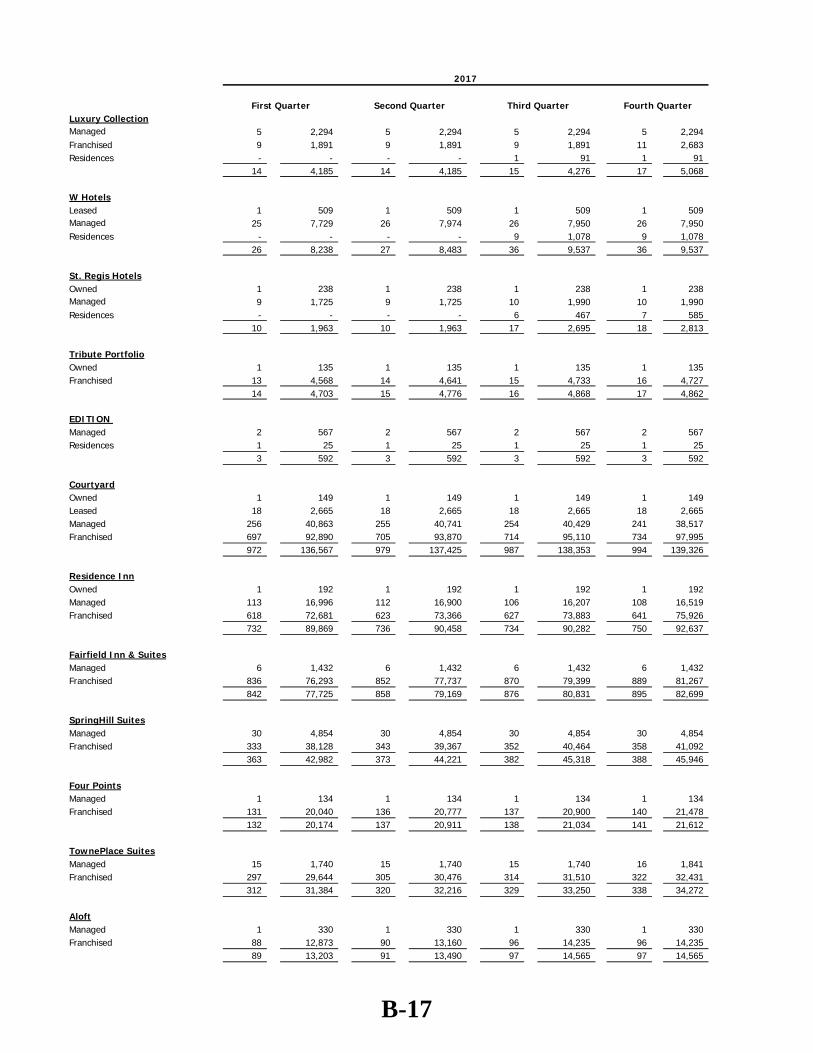
First Quarter Second Quarter Third Quarter Fourth Quarter
2017
Luxury CollectionManaged 5 2,294 5 2,294 5 2,294 5 2,294 Franchised 9 1,891 9 1,891 9 1,891 11 2,683 Residences - - - - 1 91 1 91
14 4,185 14 4,185 15 4,276 17 5,068
W HotelsLeased 1 509 1 509 1 509 1 509 Managed 25 7,729 26 7,974 26 7,950 26 7,950 Residences - - - - 9 1,078 9 1,078
26 8,238 27 8,483 36 9,537 36 9,537
St. Regis HotelsOwned 1 238 1 238 1 238 1 238 Managed 9 1,725 9 1,725 10 1,990 10 1,990 Residences - - - - 6 467 7 585
10 1,963 10 1,963 17 2,695 18 2,813
Tribute PortfolioOwned 1 135 1 135 1 135 1 135 Franchised 13 4,568 14 4,641 15 4,733 16 4,727
14 4,703 15 4,776 16 4,868 17 4,862
EDITION Managed 2 567 2 567 2 567 2 567 Residences 1 25 1 25 1 25 1 25
3 592 3 592 3 592 3 592
CourtyardOwned 1 149 1 149 1 149 1 149 Leased 18 2,665 18 2,665 18 2,665 18 2,665 Managed 256 40,863 255 40,741 254 40,429 241 38,517 Franchised 697 92,890 705 93,870 714 95,110 734 97,995
972 136,567 979 137,425 987 138,353 994 139,326
Residence InnOwned 1 192 1 192 1 192 1 192 Managed 113 16,996 112 16,900 106 16,207 108 16,519 Franchised 618 72,681 623 73,366 627 73,883 641 75,926
732 89,869 736 90,458 734 90,282 750 92,637
Fairfield Inn & SuitesManaged 6 1,432 6 1,432 6 1,432 6 1,432 Franchised 836 76,293 852 77,737 870 79,399 889 81,267
842 77,725 858 79,169 876 80,831 895 82,699
SpringHill SuitesManaged 30 4,854 30 4,854 30 4,854 30 4,854 Franchised 333 38,128 343 39,367 352 40,464 358 41,092
363 42,982 373 44,221 382 45,318 388 45,946
Four PointsManaged 1 134 1 134 1 134 1 134 Franchised 131 20,040 136 20,777 137 20,900 140 21,478
132 20,174 137 20,911 138 21,034 141 21,612
TownePlace SuitesManaged 15 1,740 15 1,740 15 1,740 16 1,841 Franchised 297 29,644 305 30,476 314 31,510 322 32,431
312 31,384 320 32,216 329 33,250 338 34,272
AloftManaged 1 330 1 330 1 330 1 330 Franchised 88 12,873 90 13,160 96 14,235 96 14,235
89 13,203 91 13,490 97 14,565 97 14,565
B-17

First Quarter Second Quarter Third Quarter Fourth Quarter
2017
AC Hotels by MarriottUnconsolidated Joint Ventures 17 2,895 19 3,315 25 4,423 31 5,288
17 2,895 19 3,315 25 4,423 31 5,288
ElementManaged 1 180 1 180 1 180 1 180 Franchised 20 2,904 24 3,437 25 3,581 27 3,847
21 3,084 25 3,617 26 3,761 28 4,027
Moxy HotelsFranchised 2 294 2 294 3 906 4 1,076
2 294 2 294 3 906 4 1,076
TimeshareMVW 3 50 10,963 50 11,101 51 11,249 51 11,249 Vistana 18 6,462 19 6,852 19 6,868 19 7,032
68 17,425 69 17,953 70 18,117 70 18,281
TotalOwned 11 5,933 9 4,736 9 4,736 8 3,364 Leased 22 4,870 22 4,870 22 4,877 22 4,877 Managed 790 245,511 789 245,737 784 246,206 774 245,218 Franchised 3,652 532,902 3,720 542,214 3,794 552,753 3,877 564,196 Unconsolidated Joint Ventures 17 2,895 19 3,315 25 4,423 31 5,288 Residences 36 4,618 36 4,618 55 6,520 57 6,750 Timeshare 68 17,425 69 17,953 70 18,117 70 18,281 Total 4,596 814,154 4,664 823,443 4,759 837,632 4,839 847,974
* North America includes properties located in the United States, Canada, and French Polynesia.
3 MVW unit and room counts are reported one quarter in arrears. MVW data is as of September 30, 2017 the end of Marriott Vacation Worldwide's third The Las Vegas assemblage (MHR, Courtyard and Residence Inn) is included with the Owned properties.
1 Includes Marriott Conference Centers.2 The Camelback hotel is a managed property; however, Marriott owns certain common areas that are shown as fixed assets by Marriott.
B-17
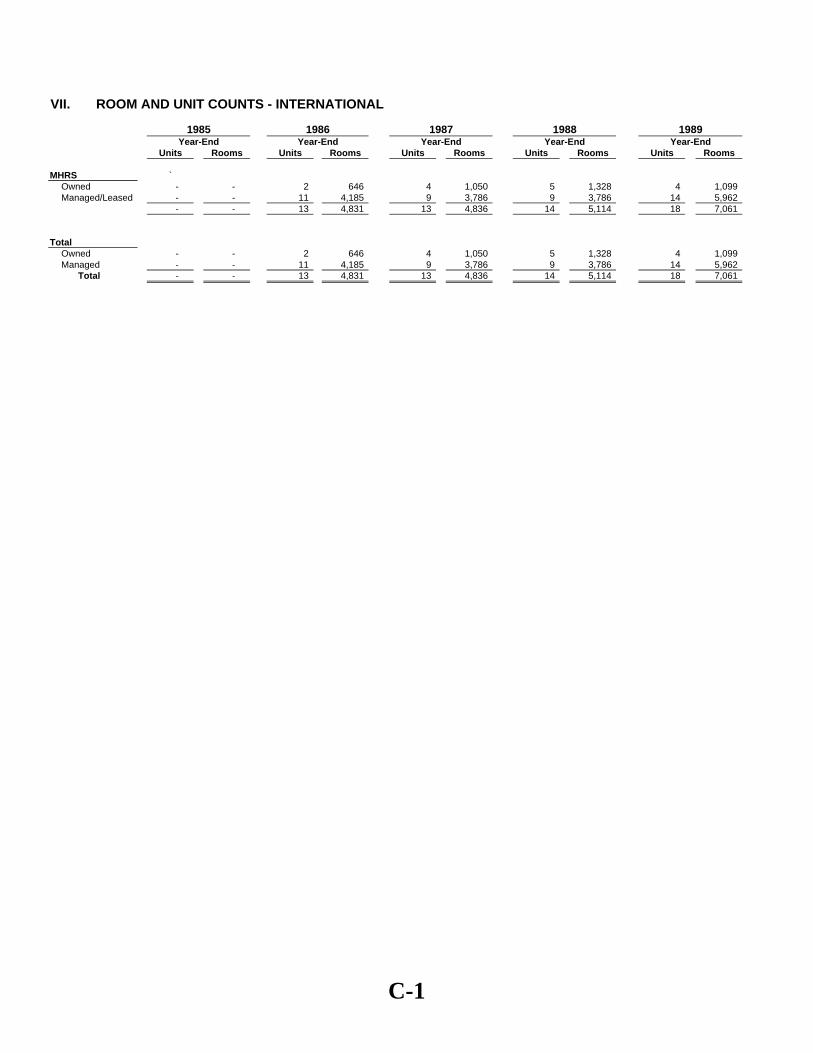
VII. ROOM AND UNIT COUNTS - INTERNATIONAL
Year-End Year-End Year-End Year-End Year-EndUnits Rooms Units Rooms Units Rooms Units Rooms Units Rooms
MHRS `Owned - - 2 646 4 1,050 5 1,328 4 1,099Managed/Leased - - 11 4,185 9 3,786 9 3,786 14 5,962
- - 13 4,831 13 4,836 14 5,114 18 7,061
TotalOwned - - 2 646 4 1,050 5 1,328 4 1,099 Managed - - 11 4,185 9 3,786 9 3,786 14 5,962
Total - - 13 4,831 13 4,836 14 5,114 18 7,061
19891985 1986 1987 1988
C-1

VII. ROOM AND UNIT COUNTS - INTERNATIONAL
Units Rooms Units Rooms Units Rooms Units Rooms Units Rooms
MHRSOwned 4 1,097 4 969 3 783 1 139 1 139Managed/Leased 17 7,205 19 7,942 19 7,904 24 9,606 23 9,043Franchised - - - - 15 3,491 16 3,691 17 4,108
21 8,302 23 8,911 37 12,178 41 13,436 41 13,290
CourtyardFranchised - - - - 4 448 4 446 4 446
- - - - 4 448 4 446 4 446
TotalOwned 4 1,097 4 969 3 783 1 139 1 139 Managed/Leased 17 7,205 19 7,942 19 7,904 24 9,606 23 9,043 Franchised - - - - 19 3,939 20 4,137 21 4,554
Total 21 8,302 23 8,911 41 12,626 45 13,882 45 13,736
19941990 1991 1992 1993Year-EndYear-End Year-End Year-End Year-End
C-2

VII. ROOM AND UNIT COUNTS - INTERNATIONAL
Units Rooms Units Rooms Units Rooms Units Rooms Units Rooms
MHRSOwned 1 139 1 142 1 142 1 143 1 143Leased - - - - - - 5 2,448 5 2,448Managed/Leased 27 10,626 33 12,605 38 14,356 38 13,070 53 18,339Franchised 19 5,494 30 7,280 33 8,432 41 10,378 47 12,007
47 16,259 64 20,027 72 22,930 85 26,039 106 32,937
RenaissanceManaged/Leased - - - - 31 10,038 38 13,627 44 16,048Franchised - - - - 8 2,587 11 3,564 13 4,159
- - - - 39 12,625 49 17,191 57 20,207
Ramada InternationalManaged/Leased - - - - 33 7,032 8 1,514 7 1,325Franchised - - - - 41 7,444 38 6,421 19 4,246
- - - - 74 14,476 46 7,935 26 5,571
New WorldManaged/Leased - - - - 14 6,889 7 3,651 - -
The Ritz-CarltonOwned - - - - 1 148 1 152 1 152Managed/Leased 6 1,688 8 2,623 12 4,102 14 4,455 16 4,829
6 1,688 8 2,623 13 4,250 15 4,607 17 4,981
CourtyardManaged - - - - - - 21 4,315 22 4,584Franchised 4 446 10 760 11 1,031 11 928 14 1,806
4 446 10 760 11 1,031 32 5,243 36 6,390
Residence InnFranchised 1 76 3 362 4 551 5 780 7 1,036
Marriott Vacation Club - - - - - - 4 422 4 502
Marriott Executive ApartmentsManaged/Leased - - - - 8 1,504 8 1,624 7 1,527
TotalOwned 1 139 1 142 2 290 2 295 2 295 Leased - - - - - - 5 2,448 5 2,448 Managed/Leased 33 12,314 41 15,228 136 43,921 134 42,256 149 46,652 Timeshare - - - - - - 4 422 4 502 Franchised 24 6,016 43 8,402 97 20,045 106 22,071 100 23,254
Total 58 18,469 85 23,772 235 64,256 251 67,492 260 73,151
1999199719961995 1998Year-EndYear-End Year-End Year-End Year-End
C-3

VII. ROOM AND UNIT COUNTS - INTERNATIONAL
Units Rooms Units Rooms Units Rooms Units Rooms Units Rooms
MHRSOwned 2 473 2 575 2 575 1 245 2 602 Leased 4 1,324 5 1,467 3 1,047 3 1,047 5 1,821 Managed 61 22,276 68 24,379 82 27,381 88 29,855 89 29,911 Franchised 56 13,458 70 16,205 70 15,889 73 16,508 76 16,994
123 37,531 145 42,626 157 44,892 165 47,655 172 49,328
RenaissanceLeased - - - - - - - - 1 276 Managed 46 16,273 48 17,082 46 16,588 46 16,544 46 16,143 Franchised 14 4,380 17 4,762 17 5,250 16 4,771 19 5,566
60 20,653 65 21,844 63 21,838 62 21,315 66 21,985
Ramada InternationalManaged 7 1,325 5 1,068 4 727 4 727 4 727 Franchised 40 7,870 128 18,114 142 20,503 188 25,423 - -
47 9,195 133 19,182 146 21,230 192 26,150 4 727
The Ritz-CarltonOwned 1 152 1 152 1 200 1 200 1 200 Leased - - - - - - - - 1 302 Managed 16 5,255 18 5,878 18 6,096 20 6,478 20 6,480
17 5,407 19 6,030 19 6,296 21 6,678 22 6,982
BulgariManaged - - - - - - - - 1 58
- - - - - - - - 1 58
CourtyardManaged 24 4,763 25 5,016 24 5,042 25 5,258 29 5,887 Franchised 17 2,328 20 2,734 24 3,409 28 4,120 32 4,831
41 7,091 45 7,750 48 8,451 53 9,378 61 10,718
Residence InnFranchised 9 1,235 10 1,371 12 1,571 13 1,795 14 1,887
Fairfield InnFranchised - - - - - - 1 103 4 452
SpringHill SuitesFranchised - - - - 1 124 1 124 1 124
Marriott Vacation Club 4 561 5 724 8 1,064 7 1,228 7 1,478
The Ritz-Carlton Club 1 23 1 43 1 61 1 81 1 81
Grand Residences by Marriott - - - - 1 49 1 49 1 49
Marriott Executive ApartmentsManaged 9 1,695 10 1,797 10 1,908 12 2,223 13 2,372 Franchised - - 1 99 1 99 1 99 1 99
9 1,695 11 1,896 11 2,007 13 2,322 14 2,471
TotalOwned 3 625 3 727 3 775 2 445 3 802Leased 4 1,324 5 1,467 3 1,047 3 1,047 7 2,399Managed 163 51,587 174 55,220 184 57,742 195 61,085 202 61,578Franchised 136 29,271 246 43,285 267 46,845 321 52,943 147 29,953Timeshare 5 584 6 767 10 1,174 9 1,358 9 1,608
Total 311 83,391 434 101,466 467 107,583 530 116,878 368 96,340
Year-End2001 2002 2003 20042000
Year-End Year-EndYear-End Year-End
C-4
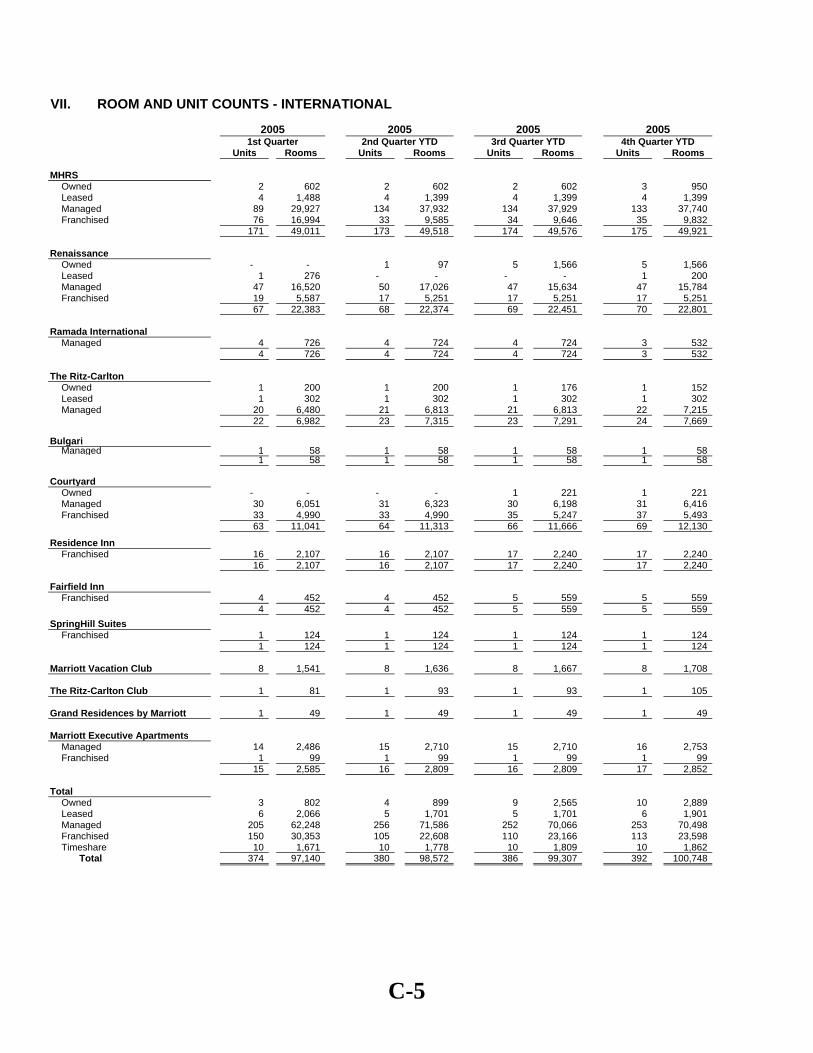
VII. ROOM AND UNIT COUNTS - INTERNATIONAL
1st Quarter 2nd Quarter YTD 3rd Quarter YTD 4th Quarter YTDUnits Rooms Units Rooms Units Rooms Units Rooms
MHRSOwned 2 602 2 602 2 602 3 950 Leased 4 1,488 4 1,399 4 1,399 4 1,399 Managed 89 29,927 134 37,932 134 37,929 133 37,740 Franchised 76 16,994 33 9,585 34 9,646 35 9,832
171 49,011 173 49,518 174 49,576 175 49,921
RenaissanceOwned - - 1 97 5 1,566 5 1,566 Leased 1 276 - - - - 1 200 Managed 47 16,520 50 17,026 47 15,634 47 15,784 Franchised 19 5,587 17 5,251 17 5,251 17 5,251
67 22,383 68 22,374 69 22,451 70 22,801
Ramada InternationalManaged 4 726 4 724 4 724 3 532
4 726 4 724 4 724 3 532
The Ritz-CarltonOwned 1 200 1 200 1 176 1 152 Leased 1 302 1 302 1 302 1 302 Managed 20 6,480 21 6,813 21 6,813 22 7,215 22 6,982 23 7,315 23 7,291 24 7,669
BulgariManaged 1 58 1 58 1 58 1 58
1 58 1 58 1 58 1 58
CourtyardOwned - - - - 1 221 1 221 Managed 30 6,051 31 6,323 30 6,198 31 6,416 Franchised 33 4,990 33 4,990 35 5,247 37 5,493
63 11,041 64 11,313 66 11,666 69 12,130
Residence InnFranchised 16 2,107 16 2,107 17 2,240 17 2,240
16 2,107 16 2,107 17 2,240 17 2,240
Fairfield InnFranchised 4 452 4 452 5 559 5 559
4 452 4 452 5 559 5 559 SpringHill Suites
Franchised 1 124 1 124 1 124 1 124 1 124 1 124 1 124 1 124
Marriott Vacation Club 8 1,541 8 1,636 8 1,667 8 1,708
The Ritz-Carlton Club 1 81 1 93 1 93 1 105
Grand Residences by Marriott 1 49 1 49 1 49 1 49
Marriott Executive ApartmentsManaged 14 2,486 15 2,710 15 2,710 16 2,753 Franchised 1 99 1 99 1 99 1 99
15 2,585 16 2,809 16 2,809 17 2,852
TotalOwned 3 802 4 899 9 2,565 10 2,889 Leased 6 2,066 5 1,701 5 1,701 6 1,901 Managed 205 62,248 256 71,586 252 70,066 253 70,498 Franchised 150 30,353 105 22,608 110 23,166 113 23,598 Timeshare 10 1,671 10 1,778 10 1,809 10 1,862
Total 374 97,140 380 98,572 386 99,307 392 100,748
20052005 2005 2005
C-5

VII. ROOM AND UNIT COUNTS - INTERNATIONAL
2006 2006 20061st Quarter 2nd Quarter YTD 3rd Quarter YTD 4th Quarter YTD
Units Rooms Units Rooms Units Rooms Units Rooms
MHRSOwned 4 1,732 3 1,375 3 1,375 5 1,639 Leased 4 1,399 4 1,399 4 1,399 4 1,399 Managed 136 38,433 140 39,143 141 39,441 140 39,113 Franchised 34 9,738 30 8,879 28 8,349 30 9,156
178 51,302 177 50,796 176 50,564 179 51,307
RenaissanceOwned 5 1,566 1 300 1 300 2 562 Leased 1 200 1 200 1 203 1 203 Managed 46 15,593 49 16,658 51 17,128 50 16,842 Franchised 17 5,251 17 5,251 18 5,513 18 5,513
69 22,610 68 22,409 71 23,144 71 23,120
Ramada InternationalManaged 2 332 2 332 2 332 2 332
The Ritz-CarltonOwned 1 152 1 152 1 152 1 152 Leased 1 302 1 302 1 302 1 302 Managed 23 7,312 23 7,312 23 7,312 23 7,336 25 7,766 25 7,766 25 7,766 25 7,790
BulgariManaged 1 58 1 58 1 58 2 117
CourtyardOwned 1 221 - - - - - - Managed 33 6,768 35 7,150 36 7,301 37 7,549 Franchised 38 5,672 42 6,174 45 6,615 46 6,751
72 12,661 77 13,324 81 13,916 83 14,300
Residence InnManaged - - - - - - 1 190 Franchised 17 2,240 17 2,240 18 2,409 16 2,123
17 2,240 17 2,240 18 2,409 17 2,313
Fairfield InnFranchised 5 559 5 559 5 559 5 559
SpringHill SuitesFranchised 1 124 1 124 1 124 1 124
Marriott Vacation Club 8 1,740 8 1,775 9 1,819 9 1,839
The Ritz-Carlton Club 1 105 2 119 2 112 2 112
Grand Residences by Marriott 1 49 1 49 1 49 1 49
Marriott Executive Apartments Owned - - - - - - 1 50
Managed 16 2,753 16 2,705 17 2,928 16 2,878 Franchised 1 99 1 99 1 99 1 99
17 2,852 17 2,804 18 3,027 18 3,027
TotalOwned 11 3,671 5 1,827 5 1,827 9 2,403 Leased 6 1,901 6 1,901 6 1,904 6 1,904 Managed 257 71,249 266 73,358 271 74,500 271 74,357 Franchised 113 23,683 113 23,326 116 23,668 117 24,325 Timeshare 10 1,894 11 1,943 12 1,980 12 2,000
Total 397 102,398 401 102,355 410 103,879 415 104,989
2006
C-6

VII. ROOM AND UNIT COUNTS - INTERNATIONAL
1st Quarter 2nd Quarter YTD 3rd Quarter YTD 4th Quarter YTDUnits Rooms Units Rooms Units Rooms Units Rooms
MHRSOwned 4 1,593 4 1,568 2 593 1 245 Leased 4 1,388 4 1,398 4 1,414 4 1,417 Managed 139 39,549 139 39,501 140 40,279 138 40,537 Franchised 31 9,342 33 9,500 35 10,038 35 9,997
178 51,872 180 51,967 181 52,324 178 52,196
Renaissance Owned 2 562 2 562 1 300 1 300 Leased 1 203 1 203 1 203 1 203 Managed 52 17,210 52 17,351 55 18,114 51 16,990 Franchised 18 5,513 17 5,307 17 5,341 17 5,324
73 23,488 72 23,423 74 23,958 70 22,817
Ramada InternationalManaged 2 332 2 332 2 332 2 332
2 332 2 332 2 332 2 332
The Ritz-CarltonOwned 1 152 1 152 1 152 1 152 Leased 1 302 2 552 2 552 2 552 Managed 1 25 7,538 26 7,783 28 8,596 31 9,274 Residences 1 93 1 93 1 93 1 93 28 8,085 30 8,580 32 9,393 35 10,071
BulgariManaged 2 117 2 117 2 117 2 117
2 117 2 117 2 117 2 117
CourtyardManaged 36 7,390 36 7,508 35 7,364 35 7,477 Franchised 46 6,758 36 6,112 37 6,241 39 6,544
82 14,148 72 13,620 72 13,605 74 14,021
Residence InnManaged 1 190 1 190 1 190 1 190 Franchised 16 2,123 18 2,542 17 2,422 17 2,421
17 2,313 19 2,732 18 2,612 18 2,611
Fairfield InnFranchised 6 640 7 756 7 859 8 947
6 640 7 756 7 859 8 947
SpringHill SuitesFranchised 1 124 1 124 1 124 1 124
1 124 1 124 1 124 1 124
Marriott Vacation Club 9 1,861 9 1,887 9 1,909 9 1,909
The Ritz-Carlton Club 2 3 108 3 108 3 109 3 111
Grand Residences by Marriott 2 1 49 1 49 1 49 1 49
Marriott Executive ApartmentsOwned 1 57 1 57 - - - - Managed 17 2,943 16 2,849 17 2,937 17 2,806 Franchised 1 99 1 99 1 99 1 99
19 3,099 18 3,005 18 3,036 18 2,905
TotalOwned 8 2,364 8 2,339 4 1,045 3 697 Leased 6 1,893 7 2,153 7 2,169 7 2,172 Managed 274 75,269 274 75,631 280 77,929 277 77,723 Franchised 119 24,599 113 24,440 115 25,124 118 25,456 Ritz-Carlton Residences 1 93 1 93 1 93 1 93 Timeshare 13 2,018 13 2,044 13 2,067 13 2,069
Total 421 106,236 416 106,700 420 108,427 419 108,210
1 Includes two serviced apartments properties.2 MVCI Residential properties are included in the respective brands.
2007 2007 2007 2007
C-7
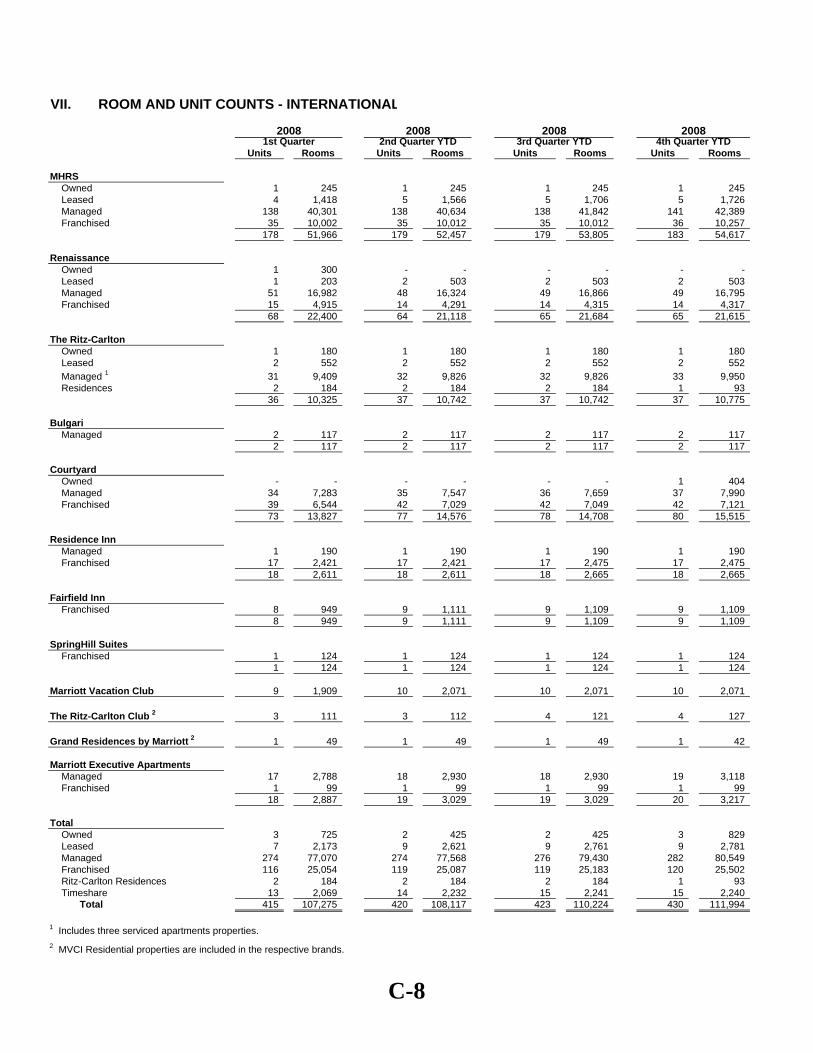
VII. ROOM AND UNIT COUNTS - INTERNATIONAL
1st Quarter 2nd Quarter YTD 3rd Quarter YTD 4th Quarter YTDUnits Rooms Units Rooms Units Rooms Units Rooms
MHRSOwned 1 245 1 245 1 245 1 245 Leased 4 1,418 5 1,566 5 1,706 5 1,726 Managed 138 40,301 138 40,634 138 41,842 141 42,389 Franchised 35 10,002 35 10,012 35 10,012 36 10,257
178 51,966 179 52,457 179 53,805 183 54,617
Renaissance Owned 1 300 - - - - - - Leased 1 203 2 503 2 503 2 503 Managed 51 16,982 48 16,324 49 16,866 49 16,795 Franchised 15 4,915 14 4,291 14 4,315 14 4,317
68 22,400 64 21,118 65 21,684 65 21,615
The Ritz-CarltonOwned 1 180 1 180 1 180 1 180 Leased 2 552 2 552 2 552 2 552 Managed 1 31 9,409 32 9,826 32 9,826 33 9,950 Residences 2 184 2 184 2 184 1 93 36 10,325 37 10,742 37 10,742 37 10,775
BulgariManaged 2 117 2 117 2 117 2 117
2 117 2 117 2 117 2 117
CourtyardOwned - - - - - - 1 404 Managed 34 7,283 35 7,547 36 7,659 37 7,990 Franchised 39 6,544 42 7,029 42 7,049 42 7,121
73 13,827 77 14,576 78 14,708 80 15,515
Residence InnManaged 1 190 1 190 1 190 1 190 Franchised 17 2,421 17 2,421 17 2,475 17 2,475
18 2,611 18 2,611 18 2,665 18 2,665
Fairfield InnFranchised 8 949 9 1,111 9 1,109 9 1,109
8 949 9 1,111 9 1,109 9 1,109
SpringHill SuitesFranchised 1 124 1 124 1 124 1 124
1 124 1 124 1 124 1 124
Marriott Vacation Club 9 1,909 10 2,071 10 2,071 10 2,071
The Ritz-Carlton Club 2 3 111 3 112 4 121 4 127
Grand Residences by Marriott 2 1 49 1 49 1 49 1 42
Marriott Executive ApartmentsManaged 17 2,788 18 2,930 18 2,930 19 3,118 Franchised 1 99 1 99 1 99 1 99
18 2,887 19 3,029 19 3,029 20 3,217
TotalOwned 3 725 2 425 2 425 3 829 Leased 7 2,173 9 2,621 9 2,761 9 2,781 Managed 274 77,070 274 77,568 276 79,430 282 80,549 Franchised 116 25,054 119 25,087 119 25,183 120 25,502 Ritz-Carlton Residences 2 184 2 184 2 184 1 93 Timeshare 13 2,069 14 2,232 15 2,241 15 2,240
Total 415 107,275 420 108,117 423 110,224 430 111,994
1 Includes three serviced apartments properties.2 MVCI Residential properties are included in the respective brands.
2008 2008 2008 2008
C-8

VII. ROOM AND UNIT COUNTS - INTERNATIONAL
1st Quarter 2nd Quarter YTD 3rd Quarter YTD 4th Quarter YTDUnits Rooms Units Rooms Units Rooms Units Rooms
MHRSOwned 1 245 1 245 1 245 1 245 Leased 5 1,839 5 1,839 5 1,839 5 1,839 Managed 143 43,400 145 44,176 146 44,528 151 46,053 Franchised 36 10,256 36 10,254 36 10,398 35 10,458
185 55,740 187 56,514 188 57,010 192 58,595
Renaissance Leased 2 503 2 503 2 503 2 503 Managed 49 17,476 50 17,603 49 17,445 48 16,848 Franchised 15 4,557 15 4,592 14 4,343 14 4,313
66 22,536 67 22,698 65 22,291 64 21,664
The Ritz-CarltonOwned 1 180 1 180 1 180 1 180 Leased 2 552 2 552 2 552 2 552 Managed 1 34 10,223 33 9,859 33 9,859 34 9,913 Residences 1 93 1 93 1 93 1 93 38 11,048 37 10,684 37 10,684 38 10,738
BulgariManaged 2 117 2 117 2 117 2 117
2 117 2 117 2 117 2 117
CourtyardOwned 1 404 3 741 3 741 3 741 Managed 39 8,499 41 8,944 42 9,088 44 9,380 Franchised 43 7,319 43 7,425 43 7,425 43 7,445
83 16,222 87 17,110 88 17,254 90 17,566
Residence InnManaged 1 190 3 405 3 405 3 405 Franchised 15 2,199 15 2,199 15 2,199 14 2,012
16 2,389 18 2,604 18 2,604 17 2,417
Fairfield InnFranchised 9 1,109 9 1,109 9 1,109 9 1,109
9 1,109 9 1,109 9 1,109 9 1,109
SpringHill SuitesFranchised 1 124 1 124 1 124 1 124
1 124 1 124 1 124 1 124
Marriott Vacation Club 2 10 2,071 11 2,126 11 2,126 11 2,126
The Ritz-Carlton Destination Club & Residences 3, 4 4 128 4 134 4 134 3 137
Grand Residences by Marriott 3 1 42 1 42 1 49 1 49
Marriott Executive ApartmentsManaged 20 3,238 20 3,313 21 3,481 22 3,781 Franchised 1 99 1 99 1 99 1 99
21 3,337 21 3,412 22 3,580 23 3,880
TotalOwned 3 829 5 1,166 5 1,166 5 1,166 Leased 9 2,894 9 2,894 9 2,894 9 2,894 Managed 288 83,143 294 84,417 296 84,923 304 86,497 Franchised 120 25,663 120 25,802 119 25,697 117 25,560 Ritz-Carlton Residences 1 93 1 93 1 93 1 93 Timeshare 15 2,241 16 2,302 16 2,309 15 2,312
Total 436 114,863 445 116,674 446 117,082 451 118,522
1 Includes three serviced apartment properties.
2 Beginning in Q1 2009, Horizons by Marriott Vacation Club is included with Marriott Vacation Club.
3 MVCI Residential properties are included in the respective brands.4 The Ritz-Carlton Club was relaunched as The Ritz-Carlton Destination Club in Q2, 2009.
2009 2009 2009 2009
C-9

VII. ROOM AND UNIT COUNTS - INTERNATIONAL
1st Quarter 2nd Quarter YTD 3rd Quarter YTD 4th Quarter YTDUnits Rooms Units Rooms Units Rooms Units Rooms
Marriott Hotels & ResortsOwned 1 245 1 245 1 245 - - Leased 7 2,340 7 2,340 7 2,340 8 2,600 Managed 151 46,536 150 46,395 150 46,445 152 47,163 Franchised 35 10,520 36 10,636 37 10,906 37 10,907
194 59,641 194 59,616 195 59,936 197 60,670
Renaissance HotelsLeased 2 503 2 503 2 503 9 2,177 Managed 48 16,682 48 16,710 49 17,077 42 15,351 Franchised 16 4,807 16 5,042 16 5,042 17 5,192
66 21,992 66 22,255 67 22,622 68 22,720
The Ritz-CarltonOwned 1 180 1 180 1 180 1 180 Leased 2 552 2 552 2 552 2 552 Managed 1 34 9,897 34 9,897 35 10,183 35 10,183 Residences 1 112 1 112 1 112 1 112 38 10,741 38 10,741 39 11,027 39 11,027
BulgariManaged 2 117 2 117 2 117 2 117
2 117 2 117 2 117 2 117
CourtyardOwned 3 741 3 741 3 741 1 187 Leased - - - - - - 2 218 Managed 45 9,539 48 10,339 48 10,560 49 11,129 Franchised 45 7,905 45 7,851 46 8,006 45 7,901
93 18,185 96 18,931 97 19,307 97 19,435
Residence InnManaged 3 405 3 405 3 405 3 405 Franchised 14 2,013 14 2,013 15 2,154 15 2,154
17 2,418 17 2,418 18 2,559 18 2,559
TownePlace SuitesFranchised - - - - - - 1 105
- - - - - - 1 105
Fairfield Inn & SuitesFranchised 9 1,109 9 1,153 10 1,235 10 1,235
9 1,109 9 1,153 10 1,235 10 1,235
SpringHill SuitesFranchised 1 124 1 124 1 124 1 124
1 124 1 124 1 124 1 124
Marriott Vacation Club 2 11 2,126 11 2,126 11 2,118 11 2,118
The Ritz-Carlton Destination Club & Residences 3, 4 3 138 3 143 3 148 3 148
Grand Residences by Marriott 3 1 49 1 49 1 49 1 49
Marriott Executive ApartmentsManaged 22 3,804 21 3,580 22 3,676 22 3,676 Franchised 1 99 1 99 1 99 1 99
23 3,903 22 3,679 23 3,775 23 3,775
TotalOwned 5 1,166 5 1,166 5 1,166 2 367 Leased 11 3,395 11 3,395 11 3,395 21 5,547 Managed 305 86,980 306 87,443 309 88,463 305 88,024 Franchised 121 26,577 122 26,918 126 27,566 127 27,717 Ritz-Carlton Residences 1 112 1 112 1 112 1 112 Timeshare 15 2,313 15 2,318 15 2,315 15 2,315
Total 458 120,543 460 121,352 467 123,017 471 124,082
1 Includes three serviced apartment properties.
2 Beginning in Q1 2009, Horizons by Marriott Vacation Club is included with Marriott Vacation Club.3 MVCI Residential properties are included in the respective brands.4 The Ritz-Carlton Club was relaunched as The Ritz-Carlton Destination Club in Q2, 2009.
2010 2010 2010 2010
C-10
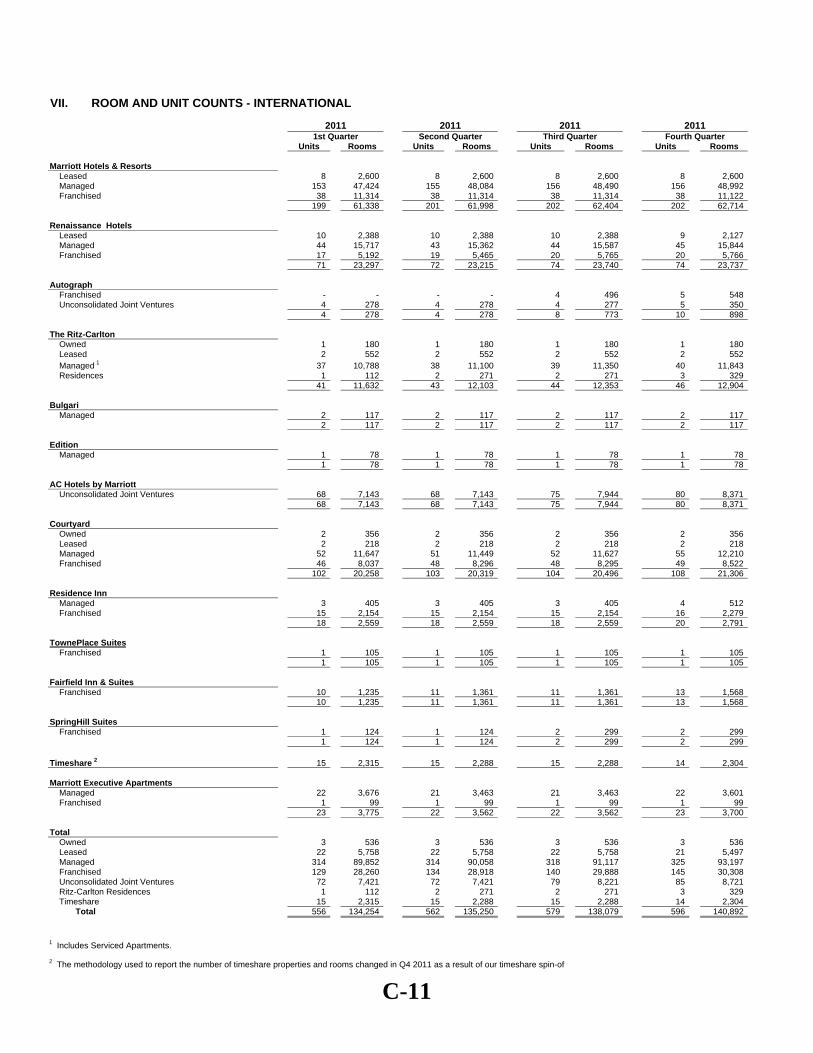
VII. ROOM AND UNIT COUNTS - INTERNATIONAL
1st Quarter Second Quarter Third Quarter Fourth QuarterUnits Rooms Units Rooms Units Rooms Units Rooms
Marriott Hotels & ResortsLeased 8 2,600 8 2,600 8 2,600 8 2,600 Managed 153 47,424 155 48,084 156 48,490 156 48,992 Franchised 38 11,314 38 11,314 38 11,314 38 11,122
199 61,338 201 61,998 202 62,404 202 62,714
Renaissance HotelsLeased 10 2,388 10 2,388 10 2,388 9 2,127 Managed 44 15,717 43 15,362 44 15,587 45 15,844 Franchised 17 5,192 19 5,465 20 5,765 20 5,766
71 23,297 72 23,215 74 23,740 74 23,737
AutographFranchised - - - - 4 496 5 548 Unconsolidated Joint Ventures 4 278 4 278 4 277 5 350
4 278 4 278 8 773 10 898
The Ritz-CarltonOwned 1 180 1 180 1 180 1 180 Leased 2 552 2 552 2 552 2 552 Managed 1 37 10,788 38 11,100 39 11,350 40 11,843 Residences 1 112 2 271 2 271 3 329 41 11,632 43 12,103 44 12,353 46 12,904
BulgariManaged 2 117 2 117 2 117 2 117
2 117 2 117 2 117 2 117
EditionManaged 1 78 1 78 1 78 1 78 1 78 1 78 1 78 1 78
AC Hotels by MarriottUnconsolidated Joint Ventures 68 7,143 68 7,143 75 7,944 80 8,371
68 7,143 68 7,143 75 7,944 80 8,371
CourtyardOwned 2 356 2 356 2 356 2 356 Leased 2 218 2 218 2 218 2 218 Managed 52 11,647 51 11,449 52 11,627 55 12,210 Franchised 46 8,037 48 8,296 48 8,295 49 8,522
102 20,258 103 20,319 104 20,496 108 21,306
Residence InnManaged 3 405 3 405 3 405 4 512 Franchised 15 2,154 15 2,154 15 2,154 16 2,279
18 2,559 18 2,559 18 2,559 20 2,791
TownePlace SuitesFranchised 1 105 1 105 1 105 1 105
1 105 1 105 1 105 1 105
Fairfield Inn & SuitesFranchised 10 1,235 11 1,361 11 1,361 13 1,568
10 1,235 11 1,361 11 1,361 13 1,568
SpringHill SuitesFranchised 1 124 1 124 2 299 2 299
1 124 1 124 2 299 2 299
Timeshare 2 15 2,315 15 2,288 15 2,288 14 2,304
Marriott Executive ApartmentsManaged 22 3,676 21 3,463 21 3,463 22 3,601 Franchised 1 99 1 99 1 99 1 99
23 3,775 22 3,562 22 3,562 23 3,700
TotalOwned 3 536 3 536 3 536 3 536 Leased 22 5,758 22 5,758 22 5,758 21 5,497 Managed 314 89,852 314 90,058 318 91,117 325 93,197 Franchised 129 28,260 134 28,918 140 29,888 145 30,308 Unconsolidated Joint Ventures 72 7,421 72 7,421 79 8,221 85 8,721 Ritz-Carlton Residences 1 112 2 271 2 271 3 329 Timeshare 15 2,315 15 2,288 15 2,288 14 2,304
Total 556 134,254 562 135,250 579 138,079 596 140,892
1 Includes Serviced Apartments.
2 The methodology used to report the number of timeshare properties and rooms changed in Q4 2011 as a result of our timeshare spin-off
2011 2011 2011 2011
C-11
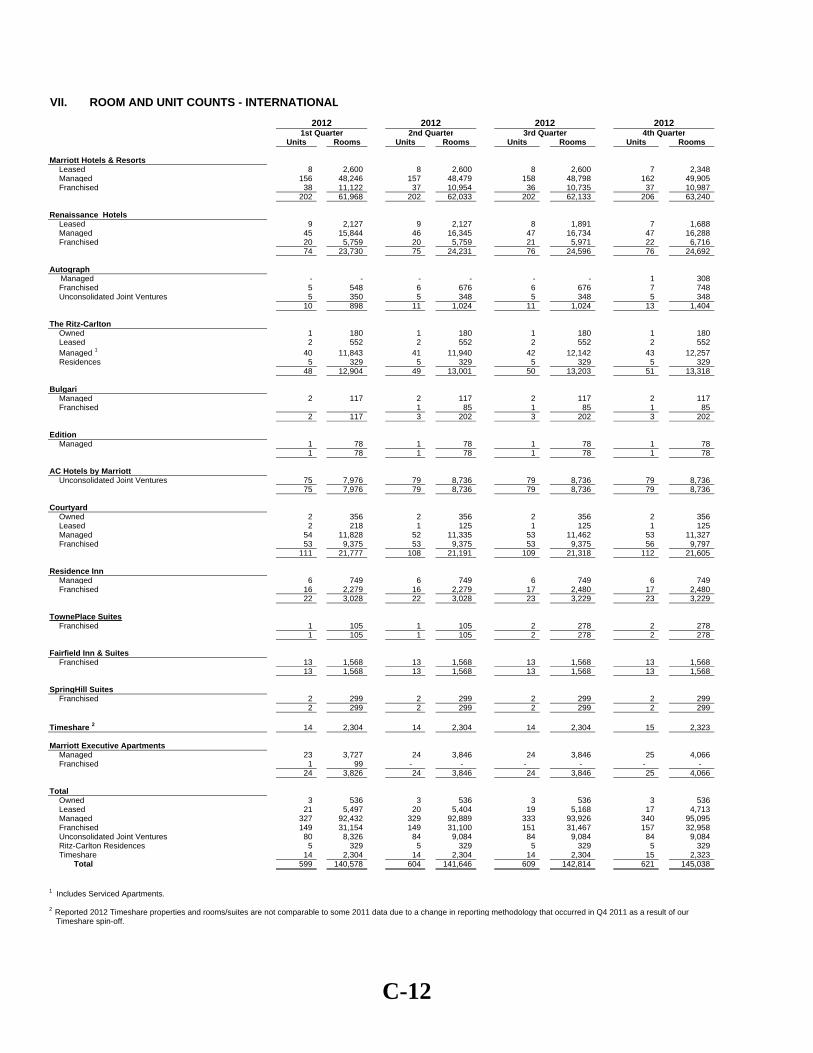
VII. ROOM AND UNIT COUNTS - INTERNATIONAL
1st Quarter 2nd Quarter 3rd Quarter 4th QuarterUnits Rooms Units Rooms Units Rooms Units Rooms
Marriott Hotels & ResortsLeased 8 2,600 8 2,600 8 2,600 7 2,348 Managed 156 48,246 157 48,479 158 48,798 162 49,905 Franchised 38 11,122 37 10,954 36 10,735 37 10,987
202 61,968 202 62,033 202 62,133 206 63,240
Renaissance HotelsLeased 9 2,127 9 2,127 8 1,891 7 1,688 Managed 45 15,844 46 16,345 47 16,734 47 16,288 Franchised 20 5,759 20 5,759 21 5,971 22 6,716
74 23,730 75 24,231 76 24,596 76 24,692
Autograph Managed - - - - - - 1 308
Franchised 5 548 6 676 6 676 7 748 Unconsolidated Joint Ventures 5 350 5 348 5 348 5 348
10 898 11 1,024 11 1,024 13 1,404
The Ritz-CarltonOwned 1 180 1 180 1 180 1 180 Leased 2 552 2 552 2 552 2 552 Managed 1 40 11,843 41 11,940 42 12,142 43 12,257 Residences 5 329 5 329 5 329 5 329 48 12,904 49 13,001 50 13,203 51 13,318
BulgariManaged 2 117 2 117 2 117 2 117 Franchised 1 85 1 85 1 85
2 117 3 202 3 202 3 202
EditionManaged 1 78 1 78 1 78 1 78 1 78 1 78 1 78 1 78
AC Hotels by MarriottUnconsolidated Joint Ventures 75 7,976 79 8,736 79 8,736 79 8,736
75 7,976 79 8,736 79 8,736 79 8,736
CourtyardOwned 2 356 2 356 2 356 2 356 Leased 2 218 1 125 1 125 1 125 Managed 54 11,828 52 11,335 53 11,462 53 11,327 Franchised 53 9,375 53 9,375 53 9,375 56 9,797
111 21,777 108 21,191 109 21,318 112 21,605
Residence InnManaged 6 749 6 749 6 749 6 749 Franchised 16 2,279 16 2,279 17 2,480 17 2,480
22 3,028 22 3,028 23 3,229 23 3,229
TownePlace SuitesFranchised 1 105 1 105 2 278 2 278
1 105 1 105 2 278 2 278
Fairfield Inn & SuitesFranchised 13 1,568 13 1,568 13 1,568 13 1,568
13 1,568 13 1,568 13 1,568 13 1,568
SpringHill SuitesFranchised 2 299 2 299 2 299 2 299
2 299 2 299 2 299 2 299
Timeshare 2 14 2,304 14 2,304 14 2,304 15 2,323
Marriott Executive ApartmentsManaged 23 3,727 24 3,846 24 3,846 25 4,066 Franchised 1 99 - - - - - -
24 3,826 24 3,846 24 3,846 25 4,066
TotalOwned 3 536 3 536 3 536 3 536 Leased 21 5,497 20 5,404 19 5,168 17 4,713 Managed 327 92,432 329 92,889 333 93,926 340 95,095 Franchised 149 31,154 149 31,100 151 31,467 157 32,958 Unconsolidated Joint Ventures 80 8,326 84 9,084 84 9,084 84 9,084 Ritz-Carlton Residences 5 329 5 329 5 329 5 329 Timeshare 14 2,304 14 2,304 14 2,304 15 2,323
Total 599 140,578 604 141,646 609 142,814 621 145,038
1 Includes Serviced Apartments.
2 Reported 2012 Timeshare properties and rooms/suites are not comparable to some 2011 data due to a change in reporting methodology that occurred in Q4 2011 as a result of our Timeshare spin-off.
2012 2012 2012 2012
C-12

VII. ROOM AND UNIT COUNTS - INTERNATIONAL
1st Quarter 2nd Quarter 3rd Quarter 4th QuarterUnits Rooms Units Rooms Units Rooms Units Rooms
Marriott Hotels Leased 7 2,348 6 2,199 5 1,939 5 1,939 Managed 166 51,056 164 50,587 167 51,358 169 52,329 Franchised 37 10,988 38 11,136 39 11,356 41 11,773
210 64,392 208 63,922 211 64,653 215 66,041
Renaissance HotelsLeased 7 1,688 7 1,688 7 1,688 7 1,688 Managed 46 15,994 48 16,677 49 16,790 48 16,303 Franchised 22 6,718 22 6,725 22 6,725 22 6,720
75 24,400 77 25,090 78 25,203 77 24,711
AutographManaged 1 308 1 308 1 308 2 395 Franchised 9 915 12 1,385 14 1,729 17 2,310 Unconsolidated Joint Ventures 5 348 5 348 5 348 5 348
15 1,571 18 2,041 20 2,385 24 3,053
The Ritz-CarltonOwned 1 180 1 180 1 180 1 180 Leased 2 552 2 552 2 552 2 552 Managed 1 44 12,967 43 12,502 43 12,507 48 13,797 Residences 7 469 7 469 7 469 10 630 54 14,168 53 13,703 53 13,708 61 15,159
BulgariManaged 2 117 2 117 2 117 2 117 Franchised 1 85 1 85 1 85 1 85
3 202 3 202 3 202 3 202
EditionOwned - - - - 1 173 1 173 Managed 1 78 1 78 1 78 1 78 1 78 1 78 2 251 2 251
AC Hotels by MarriottUnconsolidated Joint Ventures 79 8,819 75 8,491 75 8,491 75 8,491
79 8,819 75 8,491 75 8,491 75 8,491
CourtyardOwned 2 356 2 356 3 550 3 550 Leased 1 125 - - - - - - Managed 55 11,966 55 11,966 57 12,279 58 12,408 Franchised 56 9,797 56 9,797 56 9,898 56 9,898
114 22,244 113 22,119 116 22,727 117 22,856
Residence InnManaged 6 749 6 749 6 749 6 749 Franchised 17 2,480 17 2,480 17 2,480 18 2,600
23 3,229 23 3,229 23 3,229 24 3,349
TownePlace SuitesFranchised 2 278 2 278 2 278 2 278
2 278 2 278 2 278 2 278
Fairfield Inn & SuitesManaged - - - - - - 1 148 Franchised 13 1,568 14 1,716 16 1,896 16 1,896
13 1,568 14 1,716 16 1,896 17 2,044
SpringHill SuitesFranchised 2 299 2 299 2 299 2 299
2 299 2 299 2 299 2 299
Timeshare 2 15 2,296 15 2,296 15 2,296 15 2,296
Marriott Executive ApartmentsManaged 26 4,140 27 4,295 27 4,295 27 4,295
26 4,140 27 4,295 27 4,295 27 4,295
TotalOwned 3 536 3 536 5 903 5 903 Leased 17 4,713 15 4,439 14 4,179 14 4,179 Managed 347 97,375 347 97,279 353 98,481 362 100,619 Franchised 159 33,128 164 33,901 169 34,746 175 35,859 Unconsolidated Joint Ventures 84 9,167 80 8,839 80 8,839 80 8,839 Ritz-Carlton Residences 7 469 7 469 7 469 10 630 Timeshare 15 2,296 15 2,296 15 2,296 15 2,296
Total 632 147,684 631 147,759 643 149,913 661 153,325
1 Includes Serviced Apartments.
2nd, 3rd, and 4th quarters, respectively.
2013 2013 2013 2013
2 Timeshare unit and room counts are as of March 22, 2013, June 14, 2013, September 6, 2013, and January 3, 2014, the end of Marriott Vacation Worldwide's 1st,
C-13

VII. ROOM AND UNIT COUNTS - INTERNATIONAL
1st Quarter 2nd Quarter 3rd Quarter 4th QuarterUnits Rooms Units Rooms Units Rooms Units Rooms
Marriott Hotels Leased 5 1,939 5 1,939 5 1,939 5 1,939 Managed 172 53,113 174 53,542 175 53,877 181 56,390 Franchised 43 12,561 43 12,561 44 12,832 45 13,099
220 67,613 222 68,042 224 68,648 231 71,428
Renaissance HotelsLeased 7 1,688 6 1,477 4 964 4 964 Managed 47 16,084 49 16,643 49 16,473 49 16,473 Franchised 24 7,037 27 7,625 28 7,931 28 7,931
78 24,809 82 25,745 81 25,368 81 25,368
AutographManaged 3 584 3 584 3 584 3 584 Franchised 18 2,543 19 2,584 19 2,589 23 6,496 Unconsolidated Joint Ventures 5 348 5 348 5 348 5 348
26 3,475 27 3,516 27 3,521 31 7,428
Moxy HotelsFranchised - - - - 1 162 1 162
- - - - 1 162 1 162
Protea HotelsLeased - - 10 1,601 10 1,601 10 1,601 Managed - - 43 4,438 43 4,540 43 4,540 Franchised - - 59 3,956 59 3,966 59 3,966
- - 112 9,995 112 10,107 112 10,107
The Ritz-CarltonOwned 1 180 1 180 1 180 1 180 Leased 2 552 2 552 2 552 2 552 Managed 1 48 13,624 48 13,624 48 13,624 49 13,937 Residences 10 630 10 630 10 630 10 630 61 14,986 61 14,986 61 14,986 62 15,299
BulgariManaged 2 117 2 117 2 117 2 117 Franchised 1 85 1 85 1 85 1 85 Residences - - - - - - 1 5
3 202 3 202 3 202 4 207
EditionManaged 2 251 2 251 1 173 1 173 Franchised - - - - 1 78 1 78 2 251 2 251 2 251 2 251
AC Hotels by MarriottUnconsolidated Joint Ventures 74 8,329 73 8,310 75 8,499 76 9,311
74 8,329 73 8,310 75 8,499 76 9,311
CourtyardOwned 3 550 3 550 3 550 3 550 Managed 60 12,750 63 13,629 63 13,704 63 13,603 Franchised 56 9,898 56 9,861 57 9,982 61 10,753
119 23,198 122 24,040 123 24,236 127 24,906
Residence InnManaged 6 749 6 749 6 749 8 970 Franchised 18 2,600 18 2,600 18 2,600 19 2,675
24 3,349 24 3,349 24 3,349 27 3,645
TownePlace SuitesFranchised 2 278 3 426 4 518 4 518
2 278 3 426 4 518 4 518
Fairfield Inn & SuitesManaged 1 148 1 148 1 148 2 276 Franchised 16 1,944 16 1,944 16 1,941 15 1,813
17 2,092 17 2,092 17 2,089 17 2,089
SpringHill SuitesFranchised 2 299 2 299 2 299 2 299
2 299 2 299 2 299 2 299
Timeshare 2 15 2,323 15 2,323 15 2,323 13 2,261
Marriott Executive ApartmentsManaged 28 4,423 28 4,423 27 4,285 27 4,261
28 4,423 28 4,423 27 4,285 27 4,261
TotalOwned 4 730 4 730 4 730 4 730 Leased 14 4,179 23 5,569 21 5,056 21 5,056 Managed 369 101,843 419 108,148 418 108,274 428 111,324 Franchised 180 37,245 244 41,941 250 42,983 259 47,875 Unconsolidated Joint Ventures 79 8,677 78 8,658 80 8,847 81 9,659 Residences 10 630 10 630 10 630 11 635 Timeshare 15 2,323 15 2,323 15 2,323 13 2,261
Total 671 155,627 793 167,999 798 168,843 817 177,540
1 Includes Serviced Apartments.
Vacation Club's 1st, 2nd, 3rd, and 4th quarters, respectively
2014 2014 2014 2014
2 Timeshare unit and room counts are as of March 28, 2014, June 20, 2014, September 12, 2014, and January 2, 2015, the end of Marriott
C-14

VII. ROOM AND UNIT COUNTS - INTERNATIONAL
4th QuarterUnits Rooms Units Rooms Units Rooms Units Rooms
Marriott HotelsLeased 5 1,941 5 1,941 5 1,941 5 1,941 Managed 178 54,972 184 57,028 187 57,559 188 58,049 Franchised 39 10,923 39 10,923 40 11,243 43 12,745
222 67,836 228 69,892 232 70,743 236 72,735
Marriott Executive ApartmentsManaged 26 4,038 27 4,149 28 4,181 28 4,181
26 4,038 27 4,149 28 4,181 28 4,181
Renaissance HotelsLeased 4 964 4 964 3 749 3 749 Managed 48 16,034 48 16,034 50 16,445 50 16,445 Franchised 26 7,368 26 7,363 26 7,363 25 7,040
78 24,366 78 24,361 79 24,557 78 24,234
Autograph Collection Hotels Managed 3 584 3 584 3 584 3 584 Franchised 27 7,528 29 8,496 31 8,623 32 8,741 Unconsolidated Joint Ventures 5 348 5 348 5 348 5 348
35 8,460 37 9,428 39 9,555 40 9,673
Protea HotelsLeased 10 1,601 10 1,601 10 1,601 10 1,601 Managed 45 4,788 37 4,298 37 4,079 37 4,079 Franchised 58 3,961 58 3,965 55 3,932 55 3,929
113 10,350 105 9,864 102 9,612 102 9,609
The Ritz-CarltonOwned 1 180 1 180 1 180 - - Leased 2 552 2 552 2 552 2 552 Managed1 48 13,660 49 13,904 51 14,158 54 14,740 Residences 8 416 8 416 8 416 8 416
59 14,808 60 15,052 62 15,306 64 15,708
Bulgari Hotels & ResortsManaged 2 117 2 117 2 117 2 117 Franchised 1 85 1 85 1 85 1 85 Residences 1 5 1 5 1 5 1 5
4 207 4 207 4 207 4 207
EDITIONManaged 1 173 1 173 1 173 1 173 Franchised 1 78 1 78 1 78 1 78
2 251 2 251 2 251 2 251
CourtyardOwned 2 380 2 380 2 380 2 380 Managed 64 13,791 64 13,791 67 14,387 71 14,974 Franchised 39 6,828 41 7,203 44 7,902 48 9,022
105 20,999 107 21,374 113 22,669 121 24,376
Residence InnManaged 5 517 5 517 5 517 5 517 Franchised 2 200 2 200 2 200 2 200
7 717 7 717 7 717 7 717
Fairfield Inn & SuitesManaged 3 416 3 416 3 416 5 716 Franchised 1 206 1 206 1 206 2 386
4 622 4 622 4 622 7 1,102
AC Hotels by MarriottUnconsolidated Joint Ventures 77 9,433 77 9,448 77 9,448 78 9,551
77 9,433 77 9,448 77 9,448 78 9,551
Moxy HotelsFranchised 1 162 1 162 1 162 1 162
1 162 1 162 1 162 1 162
Timeshare 2 13 2,267 13 2,267 13 2,267 13 2,267
TotalOwned 3 560 3 560 3 560 2 380 Leased 21 5,058 21 5,058 20 4,843 20 4,843 Managed 423 109,090 423 111,011 434 112,616 444 114,575 Franchised 195 37,339 199 38,681 202 39,794 210 42,388 Unconsolidated Joint Ventures 82 9,781 82 9,796 82 9,796 83 9,899 Residences 9 421 9 421 9 421 9 421 Timeshare 13 2,267 13 2,267 13 2,267 13 2,267 Total 746 164,516 750 167,794 763 170,297 781 174,773
1 Includes Serviced Apartments.
201520153rd Quarter
2015
2 Timeshare unit and room counts are as of March 27, 2015, June 19, 2015, September 11, 2015 and January 1, 2016 the end of Marriott Vacation Club's 1st, 2nd, 3rd and 4th quarters, respectively.
20151st Quarter 2nd Quarter
C-15

VII. ROOM AND UNIT COUNTS - INTERNATIONAL
Units Rooms Units Rooms Units Rooms Units Rooms
Marriott Hotels
Leased 4 1,445 4 1,445 4 1,445 4 1,445 Managed 144 40,687 149 41,820 150 42,184 154 44,547
Franchised 40 11,957 42 12,510 43 12,582 43 12,491
188 54,089 195 55,775 197 56,211 201 58,483
JW Marriott
Leased 1 496 1 496 1 496 1 496 Managed 46 18,058 46 18,058 45 17,934 47 18,925
Franchised 5 1,355 5 1,355 6 1,473 7 1,742
52 19,909 52 19,909 52 19,903 55 21,163
Marriott Executive ApartmentsManaged 27 4,131 27 4,131 28 4,195 28 4,195
27 4,131 27 4,131 28 4,195 28 4,195
Sheraton
Owned - - - - 5 2,762 5 2,762
Leased - - - - 1 106 1 105 Managed - - - - 185 62,917 188 64,088
Franchised - - - - 59 17,443 59 17,519
- - - - 250 83,228 253 84,474
Westin
Owned - - - - 1 246 1 246 Managed - - - - 65 21,346 68 21,964
Franchised - - - - 24 7,478 23 7,334
- - - - 90 29,070 92 29,544
Renaissance Hotels
Leased 3 749 3 749 3 749 3 749 Managed 50 16,203 50 16,207 50 16,207 50 16,171
Franchised 24 6,835 25 6,957 25 6,956 26 7,168
77 23,787 78 23,913 78 23,912 79 24,088
Le MeridienManaged - - - - 74 21,045 75 20,952
Franchised - - - - 11 2,863 11 2,873
- - - - 85 23,908 86 23,825
Autograph Collection Hotels Managed 3 584 3 584 3 584 4 670
Franchised 34 9,236 34 9,291 36 9,473 38 9,622
Unconsolidated Joint Ventures 5 348 5 348 5 348 5 348
42 10,168 42 10,223 44 10,405 47 10,640
The Ritz-Carlton
Leased 2 552 2 552 2 553 2 553
Managed1 54 14,713 54 14,713 54 14,714 56 15,171 Residences 8 416 8 416 8 416 8 416
64 15,681 64 15,681 64 15,683 66 16,140
2016
First Quarter Second Quarter Third Quarter Fourth Quarter
C-16

2016
First Quarter Second Quarter Third Quarter Fourth QuarterLuxury CollectionOwned - - - - 1 180 1 181 Leased - - - - 2 287 2 287 Managed - - - - 46 7,931 47 8,272 Franchised - - - - 34 6,600 33 6,387
- - - - 83 14,998 83 15,127
W HotelsLeased - - - - 2 665 2 665 Managed - - - - 22 5,148 23 5,242
- - - - 24 5,813 25 5,907
St. Regis HotelsLeased - - - - 1 160 1 160 Managed - - - - 26 5,964 27 6,049
- - - - 27 6,124 28 6,209
Tribute PortfolioManaged - - - - 2 372 3 515 Franchised - - - - 3 184 6 282
- - - - 5 556 9 797
EDITION Managed 1 173 1 173 1 173 2 699 Franchised 1 78 1 78 - - - -
2 251 2 251 1 173 2 699
Bulgari Hotels & ResortsManaged 2 117 2 117 2 117 2 117 Franchised 1 85 1 85 1 85 1 85 Residences 1 5 1 5 1 5 1 5
4 207 4 207 4 207 4 207
CourtyardOwned 2 380 2 380 3 644 3 644 Managed 72 15,082 74 15,688 75 15,892 78 16,470 Franchised 49 9,274 51 9,685 54 10,411 56 10,745
123 24,736 127 25,753 132 26,947 137 27,859
Residence InnOwned - - - - 1 140 1 140 Managed 5 517 5 517 5 517 5 517 Franchised 2 200 2 200 2 200 2 200
7 717 7 717 8 857 8 857
Fairfield Inn & SuitesManaged 6 848 6 848 7 1,070 10 1,588 Franchised 2 386 2 386 2 386 2 386
8 1,234 8 1,234 9 1,456 12 1,974
Four PointsManaged - - - - 60 14,650 58 14,533 Franchised - - - - 36 5,844 37 6,010
- - - - 96 20,494 95 20,543
AloftManaged - - - - 22 5,478 23 5,694 Franchised - - - - 12 1,988 12 1,925
- - - - 34 7,466 35 7,619
AC Hotels by MarriottUnconsolidated Joint Ventures 80 9,852 83 10,277 85 10,886 84 10,845
80 9,852 83 10,277 85 10,886 84 10,845
C-16

2016
First Quarter Second Quarter Third Quarter Fourth QuarterProtea HotelsLeased 10 1,601 10 1,601 10 1,601 10 1,601 Managed 37 4,109 36 4,100 36 4,093 36 4,201 Franchised 52 3,670 51 3,583 51 3,548 51 3,550
99 9,380 97 9,284 97 9,242 97 9,352
ElementManaged - - - - 1 188 1 188 Franchised - - - - 2 293 2 293
- - - - 3 481 3 481
Moxy HotelsFranchised 2 414 2 414 4 800 5 1,000
2 414 2 414 4 800 5 1,000
TimeshareMVW 2 14 2,278 14 2,278 14 2,355 14 2,355 Vistana - - - - 3 1,220 3 1,220
14 2,278 14 2,278 17 3,575 17 3,575
TotalOwned 2 380 2 380 11 3,972 11 3,973 Leased 20 4,843 20 4,843 26 6,062 26 6,061 Managed 447 115,222 453 116,956 959 262,719 985 270,768 Franchised 212 43,490 216 44,544 405 88,607 414 89,612 Unconsolidated Joint Ventures 85 10,200 88 10,625 90 11,234 89 11,193 Residences 9 421 9 421 9 421 9 421 Timeshare 14 2,278 14 2,278 17 3,575 17 3,575 Total 789 176,834 802 180,047 1,517 376,590 1,551 385,603
1 Includes Serviced Apartments2 MVW unit and room counts are reported one quarter in arrears. MVW data is as of September 16, 2016, the end of Marriott Vacation Worldwide's third quarter for 2016.
C-16
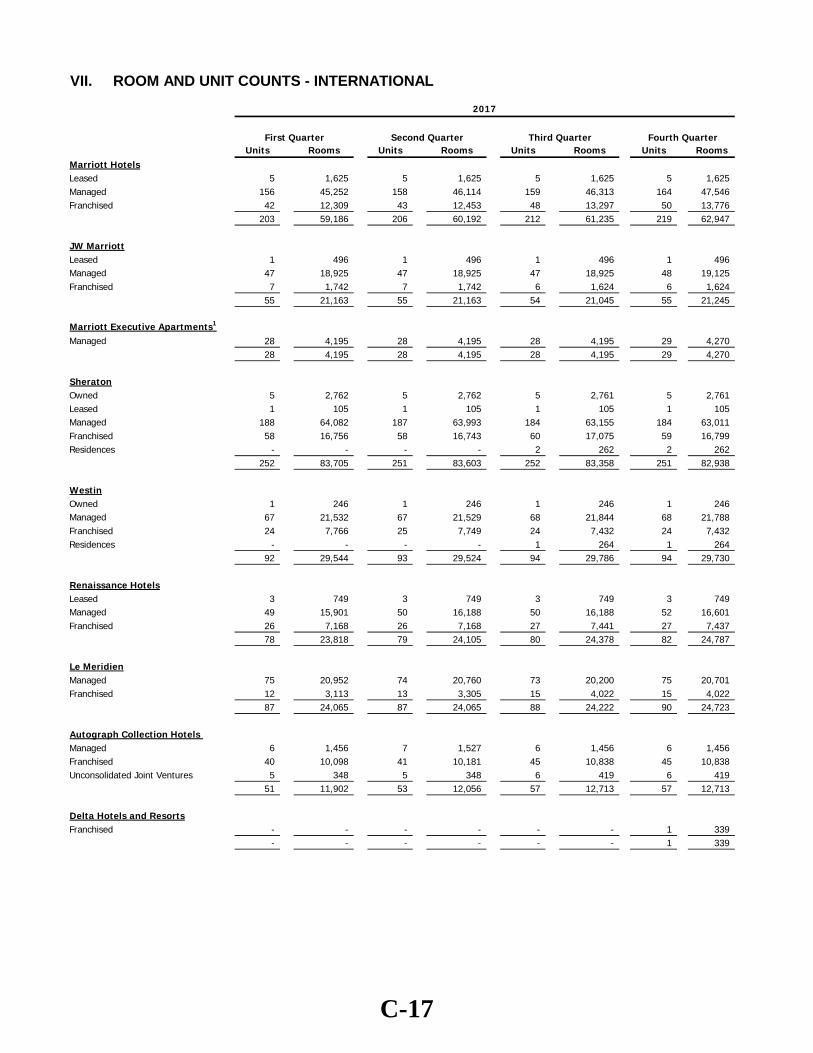
VII. ROOM AND UNIT COUNTS - INTERNATIONAL
First Quarter Second Quarter Third Quarter Fourth QuarterUnits Rooms Units Rooms Units Rooms Units Rooms
Marriott HotelsLeased 5 1,625 5 1,625 5 1,625 5 1,625 Managed 156 45,252 158 46,114 159 46,313 164 47,546 Franchised 42 12,309 43 12,453 48 13,297 50 13,776
203 59,186 206 60,192 212 61,235 219 62,947
JW MarriottLeased 1 496 1 496 1 496 1 496 Managed 47 18,925 47 18,925 47 18,925 48 19,125 Franchised 7 1,742 7 1,742 6 1,624 6 1,624
55 21,163 55 21,163 54 21,045 55 21,245
Marriott Executive Apartments1
Managed 28 4,195 28 4,195 28 4,195 29 4,270 28 4,195 28 4,195 28 4,195 29 4,270
SheratonOwned 5 2,762 5 2,762 5 2,761 5 2,761 Leased 1 105 1 105 1 105 1 105 Managed 188 64,082 187 63,993 184 63,155 184 63,011 Franchised 58 16,756 58 16,743 60 17,075 59 16,799 Residences - - - - 2 262 2 262
252 83,705 251 83,603 252 83,358 251 82,938
WestinOwned 1 246 1 246 1 246 1 246 Managed 67 21,532 67 21,529 68 21,844 68 21,788 Franchised 24 7,766 25 7,749 24 7,432 24 7,432 Residences - - - - 1 264 1 264
92 29,544 93 29,524 94 29,786 94 29,730
Renaissance HotelsLeased 3 749 3 749 3 749 3 749 Managed 49 15,901 50 16,188 50 16,188 52 16,601 Franchised 26 7,168 26 7,168 27 7,441 27 7,437
78 23,818 79 24,105 80 24,378 82 24,787
Le MeridienManaged 75 20,952 74 20,760 73 20,200 75 20,701 Franchised 12 3,113 13 3,305 15 4,022 15 4,022
87 24,065 87 24,065 88 24,222 90 24,723
Autograph Collection Hotels Managed 6 1,456 7 1,527 6 1,456 6 1,456 Franchised 40 10,098 41 10,181 45 10,838 45 10,838 Unconsolidated Joint Ventures 5 348 5 348 6 419 6 419
51 11,902 53 12,056 57 12,713 57 12,713
Delta Hotels and ResortsFranchised - - - - - - 1 339
- - - - - - 1 339
2017
C-17

First Quarter Second Quarter Third Quarter Fourth Quarter
2017
The Ritz-CarltonLeased 2 553 2 553 2 553 2 553 Managed2 57 15,372 58 15,529 59 15,644 60 15,831 Residences 8 416 9 625 9 625 10 925
67 16,341 69 16,707 70 16,822 72 17,309
Luxury CollectionOwned 1 181 1 181 1 181 1 181 Leased 2 287 2 284 2 284 2 287 Managed 47 8,272 47 8,272 48 8,230 49 8,617 Franchised 33 6,387 36 6,757 37 6,868 37 6,861 Residences - - - - 1 64 1 64
83 15,127 86 15,494 89 15,627 90 16,010
W HotelsLeased 2 665 2 665 2 665 2 665 Managed 22 4,989 23 5,363 24 5,661 24 5,661 Residences - - - - 6 532 4 471
24 5,654 25 6,028 32 6,858 30 6,797
St. Regis HotelsLeased 1 160 1 160 1 160 1 160 Managed 28 6,237 30 6,931 31 7,049 31 7,048 Residences - - - - 6 516 6 516
29 6,397 31 7,091 38 7,725 38 7,724
Tribute PortfolioManaged 3 515 3 515 3 559 3 559 Franchised 7 515 7 515 8 797 8 787
10 1,030 10 1,030 11 1,356 11 1,346
EDITION Managed 2 699 2 699 2 699 2 699
2 699 2 699 2 699 2 699
Bulgari Hotels & ResortsManaged 2 117 2 117 3 237 4 357 Franchised 1 85 1 85 1 85 1 85 Residences 1 5 1 5 1 5 1 5
4 207 4 207 5 327 6 447
CourtyardOwned 3 644 3 644 3 644 3 645 Managed 79 16,595 78 16,463 79 16,723 84 18,044 Franchised 57 10,840 57 10,841 58 10,986 61 11,391
139 28,079 138 27,948 140 28,353 148 30,080
Residence InnOwned 1 140 1 140 1 140 1 140 Managed 5 517 5 517 5 517 6 643 Franchised 2 200 2 200 3 287 3 287
8 857 8 857 9 944 10 1,070
Fairfield Inn & SuitesManaged 12 1,816 12 1,824 16 2,344 18 2,578 Franchised 2 386 3 595 4 755 6 1,157
14 2,202 15 2,419 20 3,099 24 3,735
Four PointsManaged 58 14,378 59 14,598 61 14,921 62 15,201 Franchised 39 6,256 40 6,355 43 6,743 46 7,167
97 20,634 99 20,953 104 21,664 108 22,368
C-17

First Quarter Second Quarter Third Quarter Fourth Quarter
2017
AloftManaged 25 6,209 27 6,618 28 6,726 29 6,906 Franchised 12 1,925 12 1,928 12 1,928 12 1,928
37 8,134 39 8,546 40 8,654 41 8,834
AC Hotels by MarriottUnconsolidated Joint Ventures 84 10,845 88 11,396 90 11,667 92 11,952
84 10,845 88 11,396 90 11,667 92 11,952
Protea HotelsLeased 9 1,421 9 1,415 9 1,415 9 1,415 Managed 36 4,223 36 4,220 36 4,265 36 4,265 Franchised 48 3,499 47 3,437 45 3,343 45 3,353
93 9,143 92 9,072 90 9,023 90 9,033
ElementManaged 1 188 3 769 4 933 4 933 Franchised 2 293 2 293 2 293 2 293
3 481 5 1,062 6 1,226 6 1,226
Moxy HotelsManaged - - 1 109 1 109 3 469 Franchised 8 1,874 8 1,874 12 2,734 13 3,028
8 1,874 9 1,983 13 2,843 16 3,497
TimeshareMVW 3 14 2,355 14 2,355 14 2,355 15 2,406 Vistana 3 1,172 4 1,415 4 1,415 4 1,467
17 3,527 18 3,770 18 3,770 19 3,873
TotalOwned 11 3,973 11 3,973 11 3,972 11 3,973 Leased 26 6,061 26 6,052 26 6,052 26 6,055 Managed 993 272,422 1,004 275,775 1,015 276,893 1,041 282,309 Franchised 420 91,212 428 92,221 450 96,548 461 98,604 Unconsolidated Joint Ventures 89 11,193 93 11,744 96 12,086 98 12,371 Residences 9 421 10 630 26 2,268 25 2,507 Timeshare 17 3,527 18 3,770 18 3,770 19 3,873 Total 1,565 388,809 1,590 394,165 1,642 401,589 1,681 409,692
2 Includes Serviced Apartments in Tokyo (244 rooms), Jakarta (123 rooms), Guangzhou (91 rooms), Dubai (121 rooms) and Tianjin (118 rooms).3 MVW unit and room counts are reported one quarter in arrears. MVW data is as of September 30, 2017 the end of Marriott Vacation Worldwide's third quarter for 2017.
1 Marriott Executive Apartments includes 27 branded Marriott Executive Apartments (3,505 rooms) and 2 unbranded apartments (765 rooms).
C-17

VIII. CONVERSION OF HOTELS TO MARRIOTT INTERNATIONAL BRANDS
Units Rooms Units Rooms Units Rooms Units Rooms Units Rooms Units Rooms
MHRS - Domestic 1 350 3 945 3 1,192 - - 3 717 - -
MHRS - International - - - - - - 1 228 1 170 - - Total 1 350 3 945 3 1,192 1 228 4 887 0 0
1987Units Rooms Units Rooms Units Rooms Units Rooms Units Rooms Units Rooms
MHRS - Domestic 3 1,332 2 1,775 4 1,354 1 237 3 1,172 3 1,114
MHRS - International 1 395 - - - - 1 230 - - - -
Courtyard - - - - 1 121 1 182 4 484 4 883
Residence Inn - - 1 78 - - 1 165 - - 4 1,176
Fairfield Inn - - - - - - 1 126 1 126 1 131Total 4 1,727 3 1,853 5 1,475 5 940 8 1,782 12 3,304
Units Rooms Units Rooms Units Rooms Units Rooms Units Rooms Units Rooms
MHRS - Domestic 4 1,071 4 1,233 13 4,135 9 3,003 4 1,288 6 1,665
MHRS - International 16 4,008 4 1,287 2 732 3 1,767 13 2,399 1 305
The Ritz-Carlton - - - - - - 1 148 - -
Courtyard 7 848 8 1,203 8 1,183 7 1,256 11 1,217 4 685
Residence Inn 1 78 1 92 - - 3 320 3 530
Fairfield Inn 4 512 1 169 11 1,201 5 684 5 1,289 4 452Total 31 6,439 18 3,970 35 7,343 24 6,710 37 6,661 18 3,637
2001 2002 2003Units Rooms Units Rooms Units Rooms Units Rooms Units Rooms Units Rooms
MHRS - Domestic 14 5,851 4 1,235 5 2,356 - 2,055 6 1,583 9 3,042
MHRS - International 1 113 7 2,372 11 1,897 19 2,310 3 924 2 626
Renaissance 3 1,606 6 1,931 6 2,516 7 1,797 2 674 1 134
Ramada International 1 140 - - 21 3,521 86 9,318 8 1,225 41 3,491
The Ritz-Carlton 1 230 1 54 - - - - 2 541 1 177
Courtyard 6 1,262 12 2,621 5 610 5 549 2 403 5 910
Residence Inn 2 390 3 460 1 100 2 244 2 223 1 218
TownePlace Suites - - 3 416 3 246 1 67
Fairfield Inn 1 162 5 591 5 544 21 2,534 7 849 7 792
SpringHill Suites - - - - - - - - - - 4 593
Other (Timeshare, Intl Apts) - - 1 102 - - 1 50 - - - - Total 29 9,754 39 9,366 54 11,544 144 19,273 35 6,668 72 10,050
2004
2nd Quarter YTD 3rd Quarter YTD Year - EndUnits Rooms Units Rooms Units Rooms Units Rooms Units Rooms
MHRS - Domestic 8 2,840 2 395 5 1,050 8 1,808 11 2,742
MHRS - International 2 580 - - 1 221 1 221 2 573
Renaissance 5 1,373 - - 1 97 2 175 2 175
Ramada International 18 2,209 - - - - - - - -
Courtyard 8 1,379 4 983 4 983 5 1,136 5 1,136
TownePlace Suites 1 82 2 106 2 106 2 106 3 181
Fairfield Inn 17 1,422 2 169 4 365 6 536 7 644
SpringHill Suites 5 680 - - 2 248 2 248 3 395 Total 64 10,565 10 1,653 19 3,070 26 4,230 33 5,846
1996 1997
198519841983
19901989 1991
2000
2005 20052005
1980 1981 1982
1986
19951993 1994
1988
1992
1998 1999
1st Quarter2005
D-1

VIII. CONVERSION OF HOTELS TO MARRIOTT INTERNATIONAL BRANDS
2006 2006 2006 20062nd Quarter YTD 3rd Quarter YTD Year - End
Units Rooms Units Rooms Units Rooms Units Rooms
MHR - Domestic 6 1,740 8 2,361 8 2,361 10 3,042
MHR - International 2 1,090 2 1,090 2 1,090 5 1,483
Renaissance 1 352 1 352 1 352 1 352
The Ritz-Carlton 1 112 1 112 1 112 1 112
Courtyard 2 289 4 546 5 749 8 1,231
TownePlace Suites - - - - - - 1 73
Fairfield Inn - - 1 110 1 110 2 178
SpringHill Suites 1 230 1 230 1 230 2 398
Total 13 3,813 18 4,801 19 5,004 30 6,869
2007 2007 2007 2007Year - End
Units Rooms Units Rooms Units Rooms Units Rooms
MHR - Domestic 2 504 3 724 3 724 4 1,127
MHR - International - - - - 1 209 1 209
Renaissance 1 279 3 779 3 779 5 1,550
Renaissance International - - - - 1 116 2 364
The Ritz-Carlton - - - - 1 476 1 476
Courtyard - - - - 2 374 7 1,219
Residence Inn 1 88 1 88 1 88 1 88
TownePlace Suites - - - - - - 1 79
Fairfield Inn - - 1 127 1 127 3 338
SpringHill Suites - - - - 1 168 1 168
Total 4 871 8 1,718 14 3,061 26 5,618
2008 2008 2008 2008Year - End
Units Rooms Units Rooms Units Rooms Units Rooms
MHR - Domestic 1 286 2 528 2 528 6 1,771
Renaissance 2 531 2 531 2 531 2 531
Renaissance International 1 231 1 231 1 231 1 231
The Ritz-Carlton 1 202 1 202 2 368 2 368
Courtyard - - 8 1,604 9 1,716 14 2,872
Residence Inn 1 105 1 105 1 105 1 105
TownePlace Suites - - - - - - 1 82
Fairfield Inn 1 95 3 388 4 479 4 479
Total 7 1,450 18 3,589 21 3,958 31 6,439
2009 2009 2009 2009Year - End
Units Rooms Units Rooms Units Rooms Units Rooms
MHR - Domestic 1 209 1 209 1 209 4 1,127
MHR - International - - - - - - 1 232
Renaissance Hotels - - - - 1 311 2 721
Courtyard 3 514 4 918 6 1,340 6 1,340
Fairfield Inn 1 82 2 163 2 163 4 333
SpringHill Suites - - - - 1 112 2 236
Total 5 805 7 1,290 11 2,135 19 3,989
1st Quarter
1st Quarter 2nd Quarter YTD 3rd Quarter YTD
1st Quarter 2nd Quarter YTD 3rd Quarter YTD
1st Quarter 2nd Quarter YTD 3rd Quarter YTD
D-2
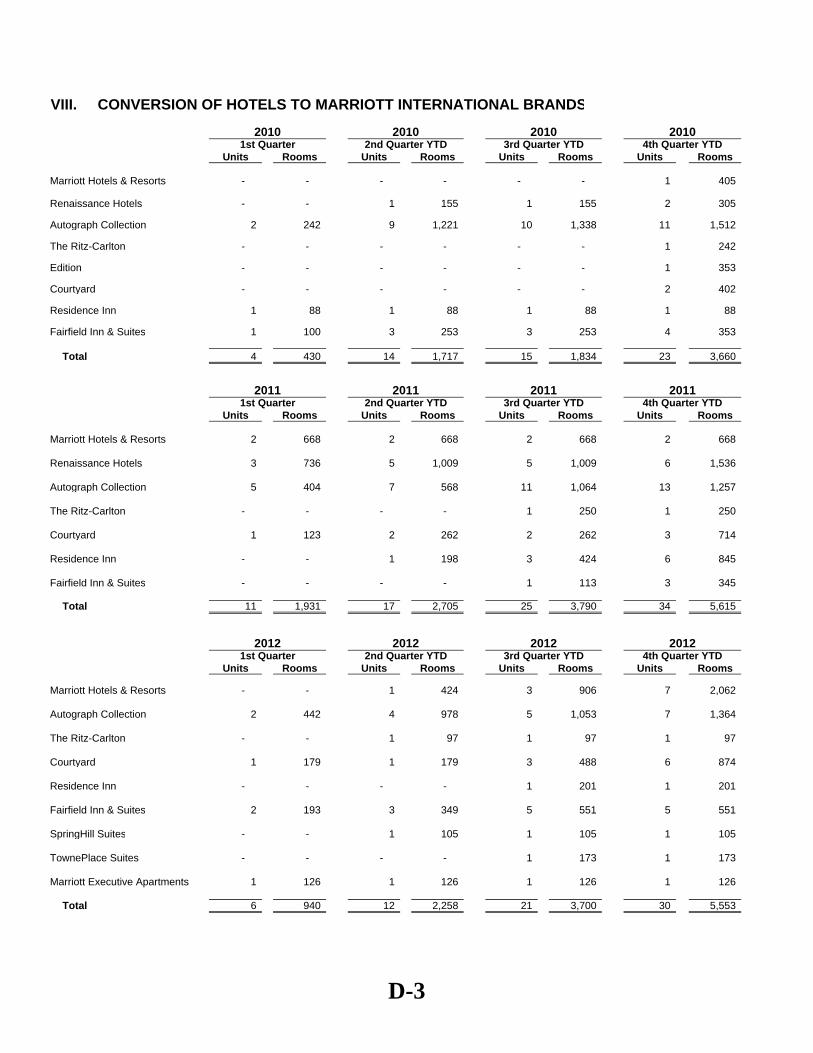
VIII. CONVERSION OF HOTELS TO MARRIOTT INTERNATIONAL BRANDS
2010 2010 2010 2010
Units Rooms Units Rooms Units Rooms Units Rooms
Marriott Hotels & Resorts - - - - - - 1 405
Renaissance Hotels - - 1 155 1 155 2 305
Autograph Collection 2 242 9 1,221 10 1,338 11 1,512
The Ritz-Carlton - - - - - - 1 242
Edition - - - - - - 1 353
Courtyard - - - - - - 2 402
Residence Inn 1 88 1 88 1 88 1 88
Fairfield Inn & Suites 1 100 3 253 3 253 4 353
Total 4 430 14 1,717 15 1,834 23 3,660
2011 2011 2011 2011
Units Rooms Units Rooms Units Rooms Units Rooms
Marriott Hotels & Resorts 2 668 2 668 2 668 2 668
Renaissance Hotels 3 736 5 1,009 5 1,009 6 1,536
Autograph Collection 5 404 7 568 11 1,064 13 1,257
The Ritz-Carlton - - - - 1 250 1 250
Courtyard 1 123 2 262 2 262 3 714
Residence Inn - - 1 198 3 424 6 845
Fairfield Inn & Suites - - - - 1 113 3 345
Total 11 1,931 17 2,705 25 3,790 34 5,615
2012 2012 2012 2012
Units Rooms Units Rooms Units Rooms Units Rooms
Marriott Hotels & Resorts - - 1 424 3 906 7 2,062
Autograph Collection 2 442 4 978 5 1,053 7 1,364
The Ritz-Carlton - - 1 97 1 97 1 97
Courtyard 1 179 1 179 3 488 6 874
Residence Inn - - - - 1 201 1 201
Fairfield Inn & Suites 2 193 3 349 5 551 5 551
SpringHill Suites - - 1 105 1 105 1 105
TownePlace Suites - - - - 1 173 1 173
Marriott Executive Apartments 1 126 1 126 1 126 1 126
Total 6 940 12 2,258 21 3,700 30 5,553
1st Quarter
1st Quarter 2nd Quarter YTD 3rd Quarter YTD 4th Quarter YTD
1st Quarter 2nd Quarter YTD 3rd Quarter YTD 4th Quarter YTD
2nd Quarter YTD 3rd Quarter YTD 4th Quarter YTD
D-3

VIII. CONVERSION OF HOTELS TO MARRIOTT INTERNATIONAL BRANDS
2013 2013 2013 2013
Units Rooms Units Rooms Units Rooms Units Rooms
Autograph Collection 4 468 7 938 13 2,424 16 3,030
AC Hotes By Marriott 1 152 1 152 1 152 1 152
Marriott Hotels - - 2 704 3 1,002 4 1,251
Courtyard 1 122 1 122 3 485 3 485
Residence Inn 1 211 1 211 2 314 2 314
Fairfield Inn & Suites 1 160 4 443 6 574 7 682
TownePlace Suites 1 52 1 52 1 52 1 52
SpringHill Suites - - 1 127 1 127 1 127
EDITION - - - - 1 173 1 173
Total 9 1,165 18 2,749 31 5,303 36 6,266
2014 2014 2014 2014
Units Rooms Units Rooms Units Rooms Units Rooms
Autograph Collection 3 776 4 816 4 816 15 5,707
Fairfield Inn & Suites 3 273 4 366 5 562 6 631
Courtyard - - 1 78 1 78 2 209
Renaissance - - 1 348 1 348 1 348
The Ritz-Carlton - - 1 260 1 260 2 384
Residence Inn - - - - 1 86 2 191
AC Hotels By Marriott - - - - - - 2 1,032
SpringHill Suites - - - - - - 1 116
Marriott Hotels - - - - - - 1 267
Total 6 1,049 11 1,868 13 2,150 32 8,885
2015 2015 2015 2015
Units Rooms Units Rooms Units Rooms Units Rooms
Autograph Collection 4 893 6 1,861 10 2,411 11 2,529
Courtyard 2 380 2 380 5 1,072 6 1,404
TownePlace Suites 2 238 2 238 2 238 2 238
AC Hotels By Marriott 1 123 3 541 3 541 3 541
SpringHill Suites 1 150 1 150 1 150 1 150
Marriott Hotels 1 210 3 571 3 571 3 571
Fairfield Inn & Suites 1 40 5 494 6 590 9 839
The Ritz-Carlton - - - - 2 627 4 1,029
Total 12 2,034 22 4,235 32 6,200 39 7,301
1st Quarter 2nd Quarter YTD 3rd Quarter YTD 4th Quarter YTD
1st Quarter 2nd Quarter YTD 3rd Quarter YTD 4th Quarter YTD
1st Quarter 2nd Quarter YTD 3rd Quarter YTD 4th Quarter YTD
D-4
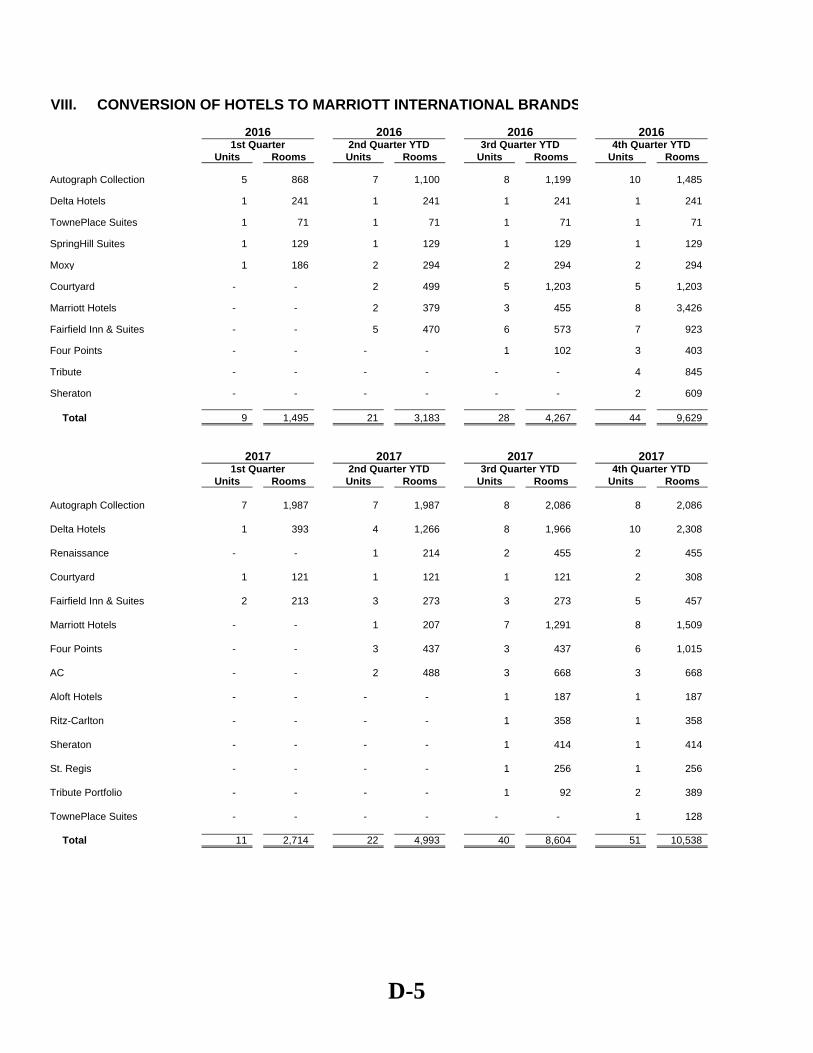
2016 2016 2016 2016
Units Rooms Units Rooms Units Rooms Units Rooms
Autograph Collection 5 868 7 1,100 8 1,199 10 1,485
Delta Hotels 1 241 1 241 1 241 1 241
TownePlace Suites 1 71 1 71 1 71 1 71
SpringHill Suites 1 129 1 129 1 129 1 129
Moxy 1 186 2 294 2 294 2 294
Courtyard - - 2 499 5 1,203 5 1,203
Marriott Hotels - - 2 379 3 455 8 3,426
Fairfield Inn & Suites - - 5 470 6 573 7 923
Four Points - - - - 1 102 3 403
Tribute - - - - - - 4 845
Sheraton - - - - - - 2 609
Total 9 1,495 21 3,183 28 4,267 44 9,629
2017 2017 2017 2017
Units Rooms Units Rooms Units Rooms Units Rooms
Autograph Collection 7 1,987 7 1,987 8 2,086 8 2,086
Delta Hotels 1 393 4 1,266 8 1,966 10 2,308
Renaissance - - 1 214 2 455 2 455
Courtyard 1 121 1 121 1 121 2 308
Fairfield Inn & Suites 2 213 3 273 3 273 5 457
Marriott Hotels - - 1 207 7 1,291 8 1,509
Four Points - - 3 437 3 437 6 1,015
AC - - 2 488 3 668 3 668
Aloft Hotels - - - - 1 187 1 187
Ritz-Carlton - - - - 1 358 1 358
Sheraton - - - - 1 414 1 414
St. Regis - - - - 1 256 1 256
Tribute Portfolio - - - - 1 92 2 389
TownePlace Suites - - - - - - 1 128
Total 11 2,714 22 4,993 40 8,604 51 10,538
1st Quarter 2nd Quarter YTD 3rd Quarter YTD 4th Quarter YTD
VIII. CONVERSION OF HOTELS TO MARRIOTT INTERNATIONAL BRANDS
4th Quarter YTD1st Quarter 2nd Quarter YTD 3rd Quarter YTD
D-5
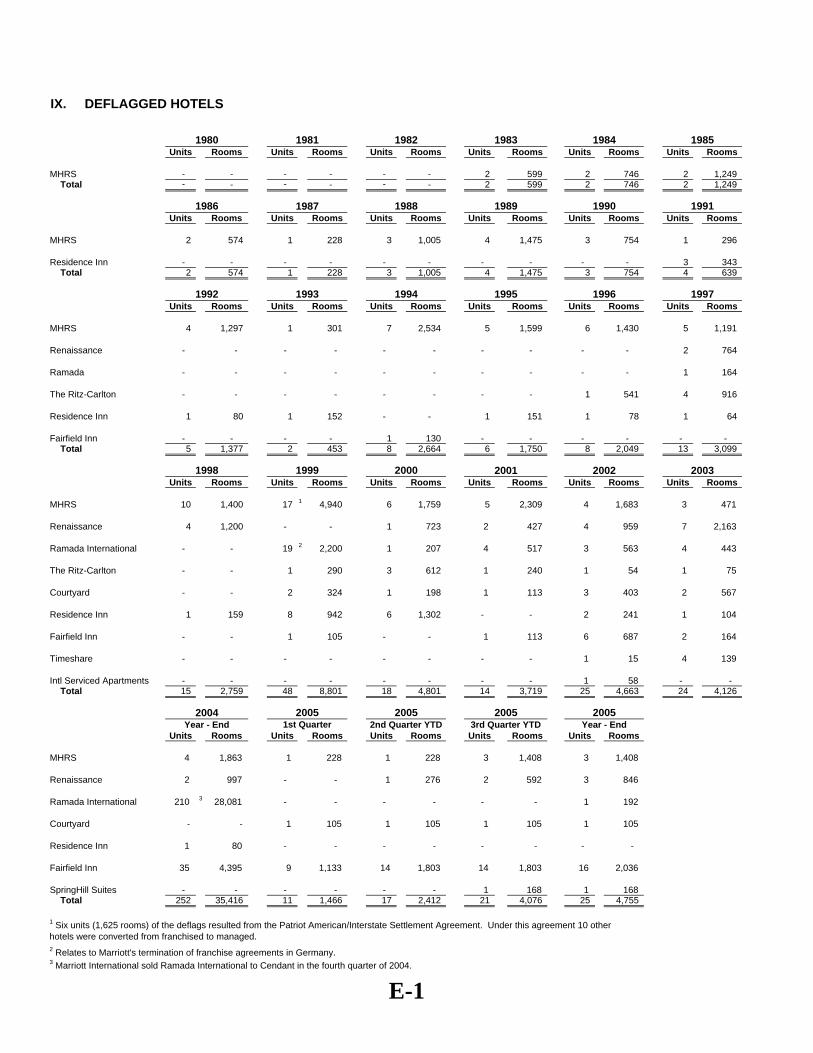
IX. DEFLAGGED HOTELS
Units Rooms Units Rooms Units Rooms Units Rooms Units Rooms Units Rooms
MHRS - - - - - - 2 599 2 746 2 1,249Total - - - - - - 2 599 2 746 2 1,249
1987Units Rooms Units Rooms Units Rooms Units Rooms Units Rooms Units Rooms
MHRS 2 574 1 228 3 1,005 4 1,475 3 754 1 296
Residence Inn - - - - - - - - - - 3 343Total 2 574 1 228 3 1,005 4 1,475 3 754 4 639
Units Rooms Units Rooms Units Rooms Units Rooms Units Rooms Units Rooms
MHRS 4 1,297 1 301 7 2,534 5 1,599 6 1,430 5 1,191
Renaissance - - - - - - - - - - 2 764
Ramada - - - - - - - - - - 1 164
The Ritz-Carlton - - - - - - - - 1 541 4 916
Residence Inn 1 80 1 152 - - 1 151 1 78 1 64
Fairfield Inn - - - - 1 130 - - - - - - Total 5 1,377 2 453 8 2,664 6 1,750 8 2,049 13 3,099
2001 2002 2003Units Rooms Units Rooms Units Rooms Units Rooms Units Rooms Units Rooms
MHRS 10 1,400 17 1 4,940 6 1,759 5 2,309 4 1,683 3 471
Renaissance 4 1,200 - - 1 723 2 427 4 959 7 2,163
Ramada International - - 19 2 2,200 1 207 4 517 3 563 4 443
The Ritz-Carlton - - 1 290 3 612 1 240 1 54 1 75
Courtyard - - 2 324 1 198 1 113 3 403 2 567
Residence Inn 1 159 8 942 6 1,302 - - 2 241 1 104
Fairfield Inn - - 1 105 - - 1 113 6 687 2 164
Timeshare - - - - - - - - 1 15 4 139
Intl Serviced Apartments - - - - - - - - 1 58 - - Total 15 2,759 48 8,801 18 4,801 14 3,719 25 4,663 24 4,126
2004Year - End 2nd Quarter YTD 3rd Quarter YTD Year - End
Units Rooms Units Rooms Units Rooms Units Rooms Units Rooms
MHRS 4 1,863 1 228 1 228 3 1,408 3 1,408
Renaissance 2 997 - - 1 276 2 592 3 846
Ramada International 210 3 28,081 - - - - - - 1 192
Courtyard - - 1 105 1 105 1 105 1 105
Residence Inn 1 80 - - - - - - - -
Fairfield Inn 35 4,395 9 1,133 14 1,803 14 1,803 16 2,036
SpringHill Suites - - - - - - 1 168 1 168 Total 252 35,416 11 1,466 17 2,412 21 4,076 25 4,755
2 Relates to Marriott's termination of franchise agreements in Germany.3 Marriott International sold Ramada International to Cendant in the fourth quarter of 2004.
1 Six units (1,625 rooms) of the deflags resulted from the Patriot American/Interstate Settlement Agreement. Under this agreement 10 other hotels were converted from franchised to managed.
1997199619941993 1995
2005 20051st Quarter
2005 2005
1985
1991
19841981 1982 1983
199019891988
1980
1998
1986
20001999
1992
E-1

IX. DEFLAGGED HOTELS
Units Rooms Units Rooms Units Rooms Units Rooms
Marriott Hotels & Resorts 1 579 3 1,390 5 2,055 9 2,843
Renaissance Hotels 1 191 2 399 4 1,386 5 1,386
Ramada International 1 200 1 200 1 200 1 200
The Ritz-Carlton - - - - - - 1 229
Courtyard - - 1 209 2 520 3 731
Residence Inn 1 88 1 88 1 88 4 475
TownePlace Suites - - - - 1 94 1 94
Fairfield Inn 3 315 10 1,257 16 1,992 21 2,658 Total 7 1,373 18 3,543 30 6,335 45 8,616
Units Rooms Units Rooms Units Rooms Units Rooms
Marriott Hotels & Resorts 3 505 5 1,525 7 1,892 11 2,623
Renaissance Hotels 1 1,009 1 1,009 2 1,354 7 2,743
The Ritz-Carlton 1 273 1 273 1 273 1 273
Courtyard 1 138 14 1,247 15 1,397 17 1,795
Residence Inn - - - - 2 184 2 184
Fairfield Inn 9 1,129 13 1,589 13 1,589 14 1,669
Timeshare 1 65 1 65 1 65 1 65
Marriott Executive Apartments - - 1 136 1 136 2 370 Total 16 3,119 36 5,844 42 6,890 55 9,722
Units Rooms Units Rooms Units Rooms Units Rooms
Marriott Hotels & Resorts - - 1 256 2 420 4 951
Renaissance Hotels 3 608 7 1,919 9 2,266 10 2,622
Ramada International 2 332 2 332 2 332 2 332
The Ritz-Carlton 2 608 2 608 2 608 2 608
Courtyard 2 368 4 793 4 793 5 931
Residence Inn 5 496 6 576 8 784 8 784
Fairfield Inn 6 689 9 1,009 10 1,128 11 1,297
Total 20 3,101 31 5,493 37 6,331 42 7,525
Units Rooms Units Rooms Units Rooms Units Rooms
Marriott Hotels & Resorts - - 1 297 2 393 5 874
Renaissance Hotels - - - - 2 407 3 1,005
The Ritz-Carlton - - 1 374 1 374 1 374
Courtyard - - 1 190 1 190 2 560
Residence Inn 2 276 2 276 2 276 3 462
Fairfield Inn 2 201 2 201 2 201 2 201
Timeshare - - - - - - 1 -
Total 4 477 7 1,338 10 1,841 17 3,476
2006Year - End
20063rd Quarter YTD
2006 20062nd Quarter YTD1st Quarter
20071st Quarter
20072nd Quarter YTD
2007Year - End
20073rd Quarter YTD
2008 2008 2008 20081st Quarter 2nd Quarter YTD 3rd Quarter YTD Year - End
2009 2009 2009 20091st Quarter 2nd Quarter YTD 3rd Quarter YTD Year - End
E-2

IX. DEFLAGGED HOTELS
2010 2010
Units Rooms Units Rooms Units Rooms Units Rooms
Marriott Hotels & Resorts - - 3 606 3 606 4 905
Renaissance Hotels 1 545 3 1,033 4 1,312 5 1,814
The Ritz-Carlton - - 2 374 2 374 2 374
Courtyard - - 2 303 3 539 7 1,527
Residence Inn 6 601 9 845 10 997 10 997
Fairfield Inn & Suites - - 1 72 1 72 3 256
Marriott Executive Apartments - - 1 224 1 224 1 224
Total 7 1,146 21 3,457 24 4,125 32 6,097
2011 2011
Units Rooms Units Rooms Units Rooms Units Rooms
Marriott Hotels & Resorts 2 482 2 482 4 949 7 2,061
Renaissance Hotels 2 819 4 1,340 5 1,620 6 1,881
The Ritz-Carlton 1 124 1 124 1 124 1 124
Edition - - - - 1 353 1 353
Courtyard - - 1 198 1 198 1 198
Residence Inn - - 3 334 3 334 5 510
Fairfield Inn & Suites 1 54 4 391 5 525 8 922
Marriott Executive Apartments - - 1 213 1 213 1 213
Total 6 1,479 16 3,082 21 4,316 30 6,262
Units Rooms Units Rooms Units Rooms Units Rooms
Marriott Hotels & Resorts 2 592 5 1,674 9 3,006 10 3,545
Renaissance Hotels - - - - 2 868 3 1,127
Courtyard 1 276 8 1,773 11 2,243 13 2,613
Residence Inn 1 128 1 128 3 336 4 464
Fairfield Inn & Suites 1 73 2 190 3 322 4 424
AC Hotels by Marriott 5 399 5 399 5 399 5 399
Marriott Executive Apartments - - 1 99 1 99 1 99
SpringHill Suites - - - - 1 93 1 93
TownPlace Suites - - 1 119 1 119 1 119
Total 10 1,468 23 4,382 36 7,485 42 8,883
3rd Quarter YTD 4th Quarter YTD
20111st Quarter 2nd Quarter YTD 3rd Quarter YTD 4th Quarter YTD
2010 20101st Quarter 2nd Quarter YTD
2011
20124th Quarter YTD
20123rd Quarter YTD1st Quarter
2012 20122nd Quarter YTD
E-3

IX. DEFLAGGED HOTELS
2013 2013 2013 2013
Units Rooms Units Rooms Units Rooms Units Rooms
Marriott Hotels 3 826 8 2,215 10 3,134 13 4,220
Renaissance 2 682 3 1,075 4 1,706 5 2,193
AC By Marriott 1 69 5 397 5 397 5 397
Courtyard 3 625 6 992 7 1,083 7 1,083
Fairfield Inn & Suites 2 120 3 200 6 469 14 1,245
The Ritz-Carlton - - 1 427 2 737 2 737
TownePlace Suites - - 1 95 1 95 1 95
Residence Inn - - - - - - 1 129
Total 11 2,322 27 5,401 35 7,621 48 10,099
2014 2014 2014 2014
Units Rooms Units Rooms Units Rooms Units Rooms
Marriott Hotels 1 314 2 750 4 1,588 4 1,588
Renaissance 1 219 1 219 2 423 2 423
AC By Marriott 1 162 3 330 3 330 3 330
The Ritz-Carlton 1 307 1 307 1 307 1 307
Courtyard 1 78 2 265 2 265 7 842
Residence Inn 6 761 6 761 6 761 7 857
Fairfield Inn & Suites 1 131 5 453 6 538 16 1,262
TownePlace Suites 2 182 2 182 2 182 2 182
Protea Hotels - - 1 21 3 94 3 94
SpringHill Suites - - - - 1 79 2 188
Autograph Collection - - - - - - 1 87
Total 14 2,154 23 3,288 30 4,567 48 6,160
2015 2015 2015 2015
Units Rooms Units Rooms Units Rooms Units Rooms
Marriott Hotels 1 387 1 387 1 387 2 494
Renaissance 1 442 1 442 2 657 3 980
Marriott Executive Apartments 1 223 1 223 2 454 2 454
Residence Inn 1 128 1 128 10 1,215 10 1,215
Fairfield Inn & Suites 2 235 3 354 5 515 12 1,172
Protea Hotels 1 5 9 485 15 1,011 15 1,011
Courtyard - - 1 159 x 1 159 1 159
SpringHill Suites - - 1 84 1 84 1 84
TownePlace Suites - - 1 95 2 190 2 190
The Ritz-Carlton - - - - 1 281 1 281
Autograph Collection - - - - - - 1 84
Delta Hotels & Resorts - - - - - - 1 204
Total 7 1,420 19 2,357 40 4,953 51 6,328
1st Quarter 2nd Quarter YTD 3rd Quarter YTD 4th Quarter YTD
1st Quarter 2nd Quarter YTD 3rd Quarter YTD 4th Quarter YTD
1st Quarter 2nd Quarter YTD 3rd Quarter YTD 4th Quarter YTD
E-4

IX. DEFLAGGED HOTELS
2016 2016 2016 2016
Units Rooms Units Rooms Units Rooms Units Rooms
Marriott Hotels 1 210 1 210 3 672 4 970
Marriott Executive Apartments 1 53 1 53 1 53 1 53
Renaissance 2 723 2 723 2 723 2 723
Protea Hotels 3 259 5 355 6 470 6 470
Delta Hotels 1 64 1 64 1 64 1 64
Residence Inn 3 342 3 342 3 342 3 342
Fairfield Inn & Suites 1 130 2 218 4 474 5 538
Courtyard - - 1 176 1 176 1 176
Autograph - - 2 189 2 189 2 189
EDITION - - - - 1 78 1 78
AC by Marriott - - - - - - 1 39
Ritz Carlton - - - - - - 1 375
Sheraton - - - - - - 2 710
Four Points - - - - - - 1 105
Luxury Collection - - - - - - 1 181
Westin - - - - - - 1 162
Total 12 1,781 18 2,330 24 3,241 33 5,175
2017 2017 2017
Units Rooms Units Rooms Units Rooms Units Rooms
Sheraton 3 1,390 5 1,779 11 3,918 15 5,167
Four Points 3 935 3 935 3 935 3 935
Marriott Hotels 4 765 4 765 4 765 5 1,378
Fairfield Inn & Suites 3 326 3 326 4 387 6 580
Renaissance 1 273 1 273 1 273 2 571
W Hotels 1 253 1 253 1 253 3 314
Westin 1 178 1 178 3 700 3 700
Courtyard 1 150 2 282 2 282 3 415
Protea Hotels 3 51 3 51 6 277 6 277
Luxury Collection 1 40 1 40 1 40 1 40
Autograph 1 15 2 332 2 332 2 332
Protea Hotels - - 1 52 1 52 1 52
Residence Inn - - 2 200 16 1,853 18 2,092
Aloft Hotels - - - - 1 99 1 99
Total 22 4,376 29 5,466 56 10,166 69 12,952
1st Quarter 2nd Quarter YTD 3rd Quarter YTD 4th Quarter YTD
1st Quarter 2nd Quarter YTD 3rd Quarter YTD 4th Quarter YTD2017
E-5

1996 2 1997 2 1998 2 1999 3 2000 2001 2002Full Year Full Year Full Year Full Year Full Year Full Year Full Year
Occupancy (%) 78.5 78.0 77.8 77.5 78.0 71.1 70.1 ADR ($) 104.92 113.94 121.71 123.16 129.56 128.60 123.43 RevPAR ($) 82.36 88.86 94.65 95.50 101.00 91.44 86.47 RevPar Change (%)1 8.0 8.2 5.7 3.7 6.7 (10.4) (5.7)
2003 2004 2005 2005 2005 2005 2005Full Year Full Year 1st Quarter 2nd Quarter 3rd Quarter 4th Quarter Full Year
Occupancy (%) 69.0 71.8 69.9 76.2 75.9 71.0 73.2 ADR ($) 124.45 132.36 140.64 144.20 132.29 146.19 141.14 RevPAR ($) 85.85 95.04 98.35 109.88 100.38 103.86 103.29 RevPar Change (%)1 (1.9) 8.6 8.0 10.0 8.8 11.4 9.8
2006 2006 2006 2006 20061st Quarter 2nd Quarter 3rd Quarter 4th Quarter Full Year
Occupancy (%) 70.2 77.0 74.8 69.8 72.8 ADR ($) 149.61 155.80 143.69 157.97 152.14 RevPAR ($) 105.06 119.92 107.42 110.23 110.74 RevPar Change (%)1 9.6 10.7 8.1 7.2 8.9
2007 2007 2007 2007 20071st Quarter 2nd Quarter 3rd Quarter 4th Quarter Full Year
Occupancy (%) 68.5 76.6 76.4 70.0 72.7 ADR ($) 157.75 163.11 149.47 164.43 159.01 RevPAR ($) 108.06 124.88 114.18 115.07 115.60 RevPar Change (%)1 5.2 5.6 7.2 6.2 6.2
2008 2008 2008 2008 20081st Quarter 2nd Quarter 3rd Quarter 4th Quarter Full Year
Occupancy (%) 67.5 75.3 74.1 64.5 69.8 ADR ($) 163.16 168.22 152.58 159.00 160.85 RevPAR ($) 110.18 126.61 113.10 102.55 112.31 RevPar Change (%)1 2.3 1.4 (1.0) (10.9) (2.9)
2009 2009 2009 2009 20091st Quarter 2nd Quarter 3rd Quarter 4th Quarter Full Year
Occupancy (%) 60.4 67.3 68.7 63.1 64.8ADR ($) 152.38 145.91 131.48 143.25 142.86RevPAR ($) 92.05 98.17 90.28 90.40 92.52RevPar Change (%)1 (18.0) (23.4) (20.6) (13.1) (18.5)
2010 2010 2010 2010 20101st Quarter 2nd Quarter 3rd Quarter 4th Quarter Full Year
Occupancy (%) 64.4 71.7 70.9 65.6 68.0ADR ($) 140.30 148.53 135.99 147.60 143.35RevPAR ($) 90.36 106.47 96.40 96.78 97.43RevPar Change (%)1 (1.9) 7.5 6.5 6.5 4.7
2011 2011 2011 2011 20111st Quarter 2nd Quarter 3rd Quarter 4th Quarter Full Year
Occupancy (%) 65.9 73.8 73.5 67.9 70.2ADR ($) 147.79 154.62 141.49 153.84 150.00RevPAR ($) 97.33 114.17 103.99 104.52 105.28RevPar Change (%)1 4.8 6.6 7.0 6.2 6.2
2012 2012 2012 2012 20121st Quarter 2nd Quarter 3rd Quarter 4th Quarter Full Year
Occupancy (%) 67.9 75.4 74.8 68.9 71.6ADR ($) 153.23 161.75 149.80 160.76 157.05RevPAR ($) 104.00 121.94 112.02 110.80 112.40RevPar Change (%)1 6.2 6.0 7.0 5.2 6.0
1 Year over year change of a consistent group of comparable hotels. Comparable hotel base changes each year based on hotel openings.2 Excludes SpringHill Suites and TownePlace Suites.3 Excludes SpringHill Suites.
X. NORTH AMERICAN COMPANY OPERATED COMPOSITE LODGING KEY OPERATING STATISTICS
F-1
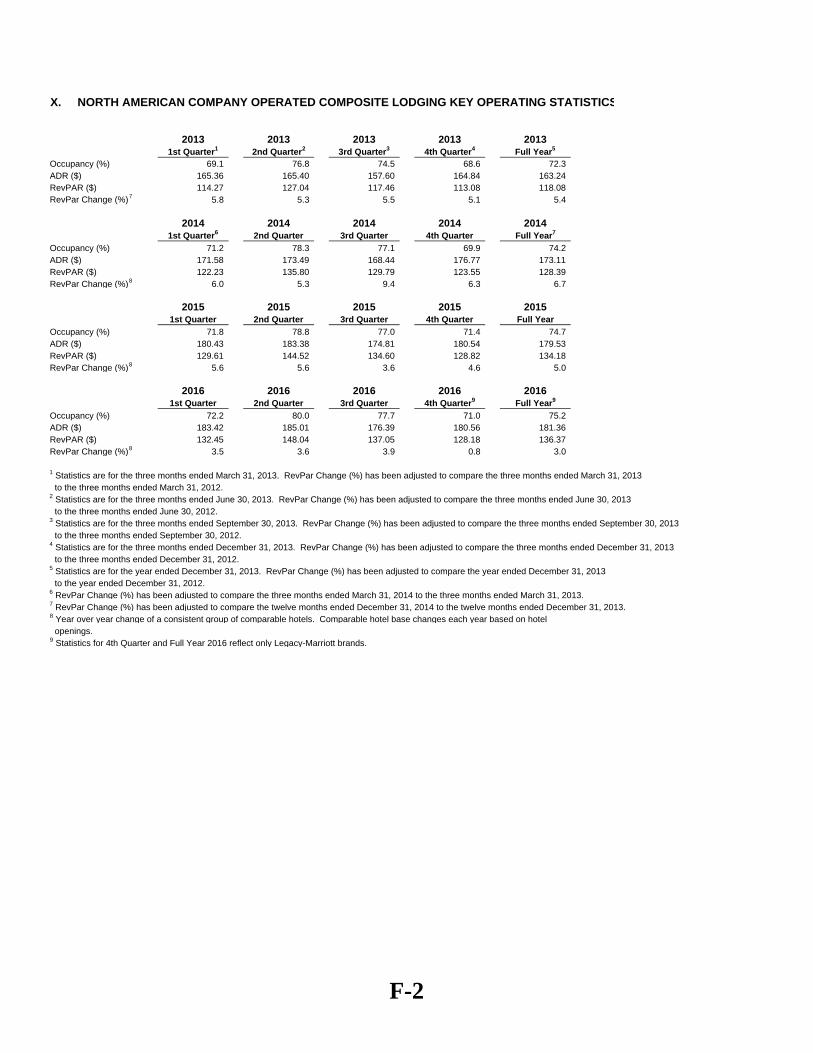
2013 2013 2013 2013 20131st Quarter1 2nd Quarter2 3rd Quarter3 4th Quarter4 Full Year5
Occupancy (%) 69.1 76.8 74.5 68.6 72.3 ADR ($) 165.36 165.40 157.60 164.84 163.24 RevPAR ($) 114.27 127.04 117.46 113.08 118.08 RevPar Change (%)7 5.8 5.3 5.5 5.1 5.4
2014 2014 2014 2014 20141st Quarter6 2nd Quarter 3rd Quarter 4th Quarter Full Year7
Occupancy (%) 71.2 78.3 77.1 69.9 74.2 ADR ($) 171.58 173.49 168.44 176.77 173.11 RevPAR ($) 122.23 135.80 129.79 123.55 128.39 RevPar Change (%)8 6.0 5.3 9.4 6.3 6.7
2015 2015 2015 2015 20151st Quarter 2nd Quarter 3rd Quarter 4th Quarter Full Year
Occupancy (%) 71.8 78.8 77.0 71.4 74.7 ADR ($) 180.43 183.38 174.81 180.54 179.53 RevPAR ($) 129.61 144.52 134.60 128.82 134.18 RevPar Change (%)8 5.6 5.6 3.6 4.6 5.0
2016 2016 2016 2016 20161st Quarter 2nd Quarter 3rd Quarter 4th Quarter9 Full Year9
Occupancy (%) 72.2 80.0 77.7 71.0 75.2 ADR ($) 183.42 185.01 176.39 180.56 181.36 RevPAR ($) 132.45 148.04 137.05 128.18 136.37 RevPar Change (%)8 3.5 3.6 3.9 0.8 3.0
1 Statistics are for the three months ended March 31, 2013. RevPar Change (%) has been adjusted to compare the three months ended March 31, 2013 to the three months ended March 31, 2012.2 Statistics are for the three months ended June 30, 2013. RevPar Change (%) has been adjusted to compare the three months ended June 30, 2013 to the three months ended June 30, 2012.3 Statistics are for the three months ended September 30, 2013. RevPar Change (%) has been adjusted to compare the three months ended September 30, 2013 to the three months ended September 30, 2012.4 Statistics are for the three months ended December 31, 2013. RevPar Change (%) has been adjusted to compare the three months ended December 31, 2013 to the three months ended December 31, 2012.5 Statistics are for the year ended December 31, 2013. RevPar Change (%) has been adjusted to compare the year ended December 31, 2013 to the year ended December 31, 2012.6 RevPar Change (%) has been adjusted to compare the three months ended March 31, 2014 to the three months ended March 31, 2013.7 RevPar Change (%) has been adjusted to compare the twelve months ended December 31, 2014 to the twelve months ended December 31, 2013.8 Year over year change of a consistent group of comparable hotels. Comparable hotel base changes each year based on hotel openings.9 Statistics for 4th Quarter and Full Year 2016 reflect only Legacy-Marriott brands.
X. NORTH AMERICAN COMPANY OPERATED COMPOSITE LODGING KEY OPERATING STATISTICS
F-2

2003 2004 2005 2005 2005 2005 2005Full Year Full Year 1st Quarter 2nd Quarter 3rd Quarter 4th Quarter Full Year
Occupancy (%) 68.3 71.2 69.0 75.3 76.1 70.7 72.7 ADR ($) 105.86 111.49 118.65 120.96 115.12 121.85 119.12 RevPAR ($) 72.31 79.35 81.81 91.12 87.63 86.14 86.56 RevPar Change (%)1 (1.3) 8.5 8.4 9.8 8.2 11.0 9.5
2006 2006 2006 2006 20061st Quarter 2nd Quarter 3rd Quarter 4th Quarter Full Year
Occupancy (%) 70.2 76.5 76.1 69.9 73.0 ADR ($) 126.36 129.78 124.37 130.92 128.07RevPAR ($) 88.69 99.26 94.65 91.49 93.47RevPar Change (%)1 10.9 10.7 8.6 7.0 9.1
2007 2007 2007 2007 20071st Quarter 2nd Quarter 3rd Quarter 4th Quarter Full Year
Occupancy (%) 68.3 76.2 76.8 69.8 72.6ADR ($) 133.82 136.01 130.54 137.43 134.62RevPAR ($) 91.45 103.63 100.20 95.89 97.70RevPar Change (%)1 5.1 5.6 6.7 6.2 6.0
2008 2008 2008 2008 20081st Quarter 2nd Quarter 3rd Quarter 4th Quarter Full Year
Occupancy (%) 66.6 74.0 74.3 63.9 69.2ADR ($) 139.53 141.79 133.93 134.56 137.36RevPAR ($) 92.97 104.87 99.45 86.04 95.04RevPar Change (%)1 2.2 1.2 (0.7) (10.1) (2.7)
2009 2009 2009 2009 20091st Quarter 2nd Quarter 3rd Quarter 4th Quarter Full Year
Occupancy (%) 60.2 66.4 68.5 61.7 64.0ADR ($) 129.44 124.41 117.09 121.37 122.71RevPAR ($) 77.97 82.63 80.16 74.90 78.59RevPar Change (%)1 (16.2) (21.2) (19.3) (13.1) (17.2)
2010 2010 2010 2010 20101st Quarter 2nd Quarter 3rd Quarter 4th Quarter Full Year
Occupancy (%) 63.0 70.7 71.8 64.8 67.4ADR ($) 119.96 124.31 118.69 123.01 121.50RevPAR ($) 75.63 87.90 85.24 79.74 81.87RevPar Change (%)1 (1.8) 6.3 7.2 7.5 4.9
2011 2011 2011 2011 20111st Quarter 2nd Quarter 3rd Quarter 4th Quarter Full Year
Occupancy (%) 64.9 72.8 74.2 66.8 69.5ADR ($) 123.51 127.87 122.52 127.29 125.67RevPAR ($) 80.11 93.07 90.89 85.04 87.28RevPar Change (%)1 5.8 6.6 6.9 6.4 6.5
2012 2012 2012 2012 20121st Quarter 2nd Quarter 3rd Quarter 4th Quarter Full Year
Occupancy (%) 66.6 74.4 75.1 68.1 70.8ADR ($) 128.59 133.20 128.73 132.40 130.97RevPAR ($) 85.61 99.06 96.74 90.14 92.79RevPar Change (%)1 6.9 6.5 6.3 5.9 6.4
1 Year over year change of a consistent group of comparable hotels. Comparable hotel base changes each year based on hotel openings.
XI. NORTH AMERICAN SYSTEMWIDE COMPOSITE LODGING KEY OPERATING STATISTICS
G-1

2013 2013 2013 2013 20131st Quarter 1 2nd Quarter2 3rd Quarter3 4th Quarter4 Full Year5
Occupancy (%) 67.8 76.2 75.0 67.3 71.6 ADR ($) 136.34 137.60 134.60 135.99 136.05RevPAR ($) 92.39 104.86 101.01 91.47 97.48RevPar Change (%)7 4.8 5.2 5.2 4.7 5.0
2014 2014 2014 2014 20141st Quarter 6 2nd Quarter 3rd Quarter 4th Quarter Full Year7
Occupancy (%) 69.6 77.8 77.6 69.0 73.6ADR ($) 141.66 144.37 142.52 143.80 143.27RevPAR ($) 98.67 112.36 110.58 99.18 105.39RevPar Change (%)8 6.3 6.0 8.7 6.7 7.0
2015 2015 2015 2015 20151st Quarter 2nd Quarter 3rd Quarter 4th Quarter Full Year
Occupancy (%) 70.4 78.0 77.8 69.5 73.9ADR ($) 147.82 151.10 148.06 147.31 148.53RevPAR ($) 104.12 117.89 115.18 102.33 109.83RevPar Change (%)8 6.9 5.4 4.2 4.0 5.2
2016 2016 2016 2016 20161st Quarter 2nd Quarter 3rd Quarter 4th Quarter9 Full Year9
Occupancy (%) 70.0 78.6 77.6 69.3 73.9 ADR ($) 150.15 153.17 150.08 147.79 150.31 RevPAR ($) 105.05 120.33 116.53 102.40 111.06 RevPar Change (%)8 2.4 3.2 2.4 1.2 2.3
1 Statistics are for the three months ended March 31, 2013. RevPar Change (%) has been adjusted to compare the three months ended March 31, 2013 to the three months ended March 31, 2012.2 Statistics are for the three months ended June 30, 2013. RevPar Change (%) has been adjusted to compare the three months ended June 30, 2013 to the three months ended June 30, 2012.3 Statistics are for the three months ended September 30, 2013. RevPar Change (%) has been adjusted to compare the three months ended September 30, 2013 to the three months ended September 30, 2012.4 Statistics are for the three months ended December 31, 2013. RevPar Change (%) has been adjusted to compare the three months ended December 31, 2013 to the three months ended December 31, 2012.5 Statistics are for the year ended December 31, 2013. RevPar Change (%) has been adjusted to compare the year ended December 31, 2013 to the year ended December 31, 2012.6 RevPar Change (%) has been adjusted to compare the three months ended March 31, 2014 to the three months ended March 31, 2013.7 RevPar Change (%) has been adjusted to compare the twelve months ended December 31, 2014 to the twelve months ended December 31, 2013.8 Year over year change of a consistent group of comparable hotels. Comparable hotel base changes each year based on hotel openings.9 Statistics for 4th Quarter and Full Year 2016 reflect only Legacy-Marriott brands.
XI. NORTH AMERICAN SYSTEMWIDE COMPOSITE LODGING KEY OPERATING STATISTICS
G-2

XII. FULL-SERVICE, INTERNATIONAL AND LUXURY LODGING KEY OPERATING STATISTICS1
1980 1981 1982 1983 1984 1985 1986 1987 1988 1989Full Year Full Year Full Year Full Year Full Year Full Year Full Year Full Year Full Year Full Year
MHRS - North AmericaOccupancy (%) 76.4 74.8 71.7 73.8 74.8 73.3 74.6 73.8 74.1 74.0Average Daily Rate ($) 57.31 64.34 66.28 65.31 72.56 78.79 84.68 86.71 95.11 98.23RevPar ($)2 43.78 48.13 47.52 48.20 54.27 57.75 63.17 63.99 70.48 72.69RevPar Change (%)3 12.2 10.0 1.3 7.0 13.3 9.6 7.8 3.6 6.3 3.2
1990 1991 1992 1993 1994 1995 1996 1997 1998 1999Full Year Full Year Full Year Full Year Full Year Full Year Full Year Full Year Full Year Full Year
MHRS - North AmericaOccupancy (%) 73.0 70.9 72.5 74.9 76.2 76.8 77.1 77.7 78.0 77.5Average Daily Rate ($) 101.83 98.05 97.94 99.00 103.21 110.36 117.56 128.64 137.95 140.86RevPar ($)2 74.34 69.52 71.01 74.15 78.65 84.76 90.64 99.95 107.60 109.22RevPar Change (%)3 2.2 (3.6) 2.4 4.3 5.1 6.7 7.9 9.2 6.1 3.9
MHRS - InternationalOccupancy (%) - - - - - - - 75.3 73.0 73.9Average Daily Rate ($)4 - - - - - - - 137.56 133.21 124.38RevPar ($)2,4 - - - - - - - 103.54 97.24 91.92RevPar Chg - Actual FX (%)3 - - - - - - 2.9 0.3 3.0RevPar Chg - Constant FX (%)3 - - - - - - 8.1 3.5 6.0
Renaissance - North AmericaOccupancy (%) - - - - - - - 69.4 70.3 70.8Average Daily Rate ($) - - - - - - - 121.25 129.38 132.09RevPar ($)2 - - - - - - - 84.15 90.95 93.54RevPar Change (%)3 - - - - - - - 6.6 6.5 2.9
Renaissance - InternationalOccupancy (%) - - - - - - - 66.3 67.2 66.1Average Daily Rate ($)4 - - - - - - - 115.13 109.31 101.28RevPar ($)2,4 - - - - - - - 76.35 73.45 66.99RevPar Chg - Actual FX (%)3 - - - - - - - (11.8) (4.2)RevPar Chg - Constant FX (%)3 - - - - - - - (5.8) (1.0)
The Ritz-Carlton - North AmericaOccupancy (%) - - - - - 70.4 75.2 79.0 75.4 77.8Average Daily Rate ($) - - - - - 168.99 181.04 185.27 205.48 219.37RevPar ($)2 - - - - - 118.97 136.14 146.36 154.93 170.67RevPar Change (%)3 - - - - - 7.1 8.7 9.8 5.8 10.3
Luxury - International5
Occupancy (%) - - - - - - - - 70.3 73.4Average Daily Rate ($)4 - - - - - - - - 168.99 180.71RevPar ($)2,4 - - - - - - - - 118.80 132.64RevPar Change (%)3 - - - - - - - - - 10.8
1 Statistics are for managed hotels opened for a full year (called comparable hotels).2 Revenue per Available Room3 Year over year change of a consistent group of comparable hotels. Comparable hotel base changes each year based on hotel openings4 Based on actual foreign exchange rates. Data not available prior to 1997.5 Beginning in Quarter 4, 2006, includes The Ritz-Carlton International and Bulgari Hotels & Resorts. Prior to Quarter 4, 2006, includes The Ritz-Carlton International.
H-1

XII. FULL-SERVICE, INTERNATIONAL AND LUXURY LODGING KEY OPERATING STATISTICS1
2000 2001 2002 2003 2004
Full Year Full Year Full Year Full Year Full Year
MHRS - North AmericaOccupancy (%) 78.2 70.4 70.1 69.3 72.0 Average Daily Rate ($) 149.50 142.96 137.28 135.42 143.70 RevPar ($)2 116.95 100.62 96.25 93.81 103.46 RevPar Change (%)3 6.8 (11.8) (4.8) (2.8) 7.4
MHRS - InternationalOccupancy (%) 74.6 68.4 69.1 68.7 75.1 Average Daily Rate ($)4 121.41 116.55 114.63 120.55 130.69 RevPar ($)2,4 90.61 79.71 79.26 82.80 98.12 RevPar Chg - Actual FX (%)3 2.8 (5.4) 2.9 3.7 20.1 RevPar Chg - Constant FX (%)3 9.0 (3.6) 3.0 (0.1) 16.4
Renaissance - North AmericaOccupancy (%) 73.3 65.6 65.1 65.8 69.6 Average Daily Rate ($) 142.27 137.79 131.77 132.12 135.54 RevPar ($)2 104.35 90.39 85.80 86.99 94.30 RevPar Change (%)3 7.5 (13.1) (4.5) (0.4) 8.4
Renaissance - InternationalOccupancy (%) 70.2 67.8 72.1 67.4 72.5 Average Daily Rate ($)4 99.29 93.97 93.32 102.24 111.12 RevPar ($)2,4 69.71 63.74 67.26 68.95 80.59 RevPar Chg - Actual FX (%)3 4.8 (8.3) 3.1 (0.4) 20.9 RevPar Chg - Constant FX (%)3 10.3 (4.2) 1.6 (5.3) 15.1
The Ritz-Carlton - North AmericaOccupancy (%) 77.5 66.9 66.1 65.7 69.2 Average Daily Rate ($) 242.26 249.94 233.40 231.12 257.16 RevPar ($)2 187.75 167.21 154.21 151.85 177.96 RevPar Change (%)3 9.4 (11.5) (4.3) 1.0 12.9
Luxury - International5
Occupancy (%) 77.6 68.6 69.2 60.8 71.0 Average Daily Rate ($)4 202.05 195.90 183.49 188.91 205.06 RevPar ($)2,4 156.79 134.39 127.00 114.88 145.68 RevPar Change (%)3 18.0 1.7 2.5 (9.0) 21.3
2005 2005 2005 2005 2005
1st Quarter 2nd Quarter 3rd Quarter 4th Quarter Full Year
MHRS - North AmericaOccupancy (%) 69.9 76.5 75.7 71.1 73.2 Average Daily Rate ($) 156.66 156.77 142.75 161.39 154.84 RevPar ($)2 109.44 119.90 108.10 114.74 113.31 RevPar Change (%)3 6.1 9.8 8.1 10.9 9.0
MHRS - InternationalOccupancy (%) 72.9 77.7 78.1 75.8 76.4 Average Daily Rate ($)4 144.01 146.83 136.77 148.64 145.14 RevPar ($)2,4 104.97 114.03 106.78 112.68 110.83 RevPar Chg - Actual FX (%)3 18.5 16.3 12.2 10.0 13.2 RevPar Chg - Constant FX (%)3 15.1 12.1 9.5 9.5 10.8
Renaissance - North AmericaOccupancy (%) 69.4 74.2 74.1 70.1 72.1 Average Daily Rate ($) 146.29 148.38 136.27 156.77 149.90 RevPar ($)2 101.47 110.14 100.97 109.95 108.01 RevPar Change (%)3 10.4 11.7 12.8 15.1 12.5
Renaissance - InternationalOccupancy (%) 65.5 71.5 75.3 74.6 72.5 Average Daily Rate ($)4 120.58 130.06 114.64 129.01 124.28 RevPar ($)2,4 78.97 92.93 86.36 96.20 90.11 RevPar Chg - Actual FX (%)3 16.3 14.9 13.1 9.6 12.8 RevPar Chg - Constant FX (%)3 10.6 9.0 9.7 9.7 9.7
The Ritz-Carlton - North AmericaOccupancy (%) 67.1 74.5 72.7 68.9 71.0 Average Daily Rate ($) 305.33 308.59 250.61 290.17 287.99 RevPar ($)2 204.87 229.89 182.22 199.80 204.45 RevPar Change (%)3 13.5 11.3 11.0 12.9 12.2
Luxury - International5
Occupancy (%) 71.2 75.6 67.7 72.3 71.6 Average Daily Rate ($)4 225.15 217.09 194.14 207.67 200.08 RevPar ($)2,4 160.30 164.08 131.43 150.08 143.30 RevPar Change (%)3 26.9 22.7 14.2 12.0 18.3
1 Statistics are for managed hotels opened for a full year (called comparable hotels).2 Revenue per Available Room3 Year over year change of a consistent group of comparable hotels. Comparable hotel base changes each year based on hotel openings.4 Based on actual foreign exchange rates. 5 Beginning in Quarter 4, 2006, includes The Ritz-Carlton International and Bulgari Hotels & Resorts. Prior to Quarter 4, 2006, includes The Ritz-Carlton International.
H-2

XII. FULL-SERVICE, INTERNATIONAL AND LUXURY LODGING KEY OPERATING STATISTICS1
2006 2006 2006 2006 2006
1st Quarter 2nd Quarter 3rd Quarter 4th Quarter Full Year
MHRS - North AmericaOccupancy (%) 69.5 76.3 74.0 70.1 72.3 Average Daily Rate ($) 166.76 170.31 156.77 175.71 168.11RevPar ($)2 115.93 129.97 116.08 123.11 121.58RevPar Change (%)3 8.0 9.3 7.9 7.9 8.3
MHRS - InternationalOccupancy (%) 72.3 77.0 76.8 74.9 75.6 Average Daily Rate ($)4 157.73 161.16 156.47 171.38 163.02 RevPar ($)2,4 114.01 124.08 120.09 128.44 123.32 RevPar Chg - Actual FX (%)3 8.5 10.0 13.4 14.1 11.9 RevPar Chg - Constant FX (%)3 11.0 11.4 11.1 10.4 10.9
Renaissance - North AmericaOccupancy (%) 70.5 77.2 73.3 69.2 72.8 Average Daily Rate ($) 154.21 168.34 153.22 169.29 162.96 RevPar ($)2 108.67 129.89 112.28 117.14 118.57 RevPar Change (%)3 12.7 15.7 6.8 4.3 9.6
Renaissance - InternationalOccupancy (%) 66.6 75.4 77.0 76.3 74.7 Average Daily Rate ($)4 121.97 133.77 127.83 145.50 134.53RevPar ($)2,4 81.21 100.83 98.39 111.08 100.46RevPar Chg - Actual FX (%)3 6.9 10.6 18.7 17.6 14.5 RevPar Chg - Constant FX (%)3 10.2 12.2 14.9 12.4 12.7
The Ritz-Carlton - North AmericaOccupancy (%) 71.5 77.7 73.4 69.4 72.9 Average Daily Rate ($) 319.74 325.44 263.58 315.47 304.72RevPar ($)2 228.61 252.81 193.59 219.04 222.23RevPar Change (%)3 10.8 10.4 9.2 10.2 10.3
Luxury - International5
Occupancy (%) 65.9 71.9 68.3 74.8 71.7 Average Daily Rate ($)4 214.74 227.61 208.74 256.05 241.90 RevPar ($)2,4 141.52 163.72 142.50 191.52 173.35 RevPar Change (%)3 2.6 7.1 2.2 16.8 9.1
2007 2007 2007 2007 2007
1st Quarter 2nd Quarter 3rd Quarter 4th Quarter Full Year
MHRS - North AmericaOccupancy (%) 68.4 76.6 76.2 70.0 72.6Average Daily Rate ($) 175.52 177.97 163.96 183.31 175.41RevPar ($)2 120.13 136.32 124.92 128.23 127.43RevPar Change (%)3 6.2 6.7 8.0 6.1 6.9
MHRS - InternationalOccupancy (%) 72.0 77.7 78.3 76.7 76.6Average Daily Rate ($)4 177.98 181.11 172.78 190.56 180.76RevPar ($)2,4 128.17 140.78 135.28 146.14 138.51RevPar Chg - Actual FX (%)3 14.9 15.2 12.1 15.7 14.8RevPar Chg - Constant FX (%)3 9.1 8.7 6.1 8.2 8.0
Renaissance - North AmericaOccupancy (%) 70.5 76.7 75.9 70.0 73.1Average Daily Rate ($) 164.65 175.72 157.82 176.29 169.93RevPar ($)2 116.02 134.78 119.71 123.40 124.17RevPar Change (%)3 4.1 3.2 8.4 7.9 5.9
Renaissance - InternationalOccupancy (%) 66.2 74.9 76.9 76.6 74.8Average Daily Rate ($)4 136.30 153.44 140.91 165.98 152.81RevPar ($)2,4 90.29 114.89 108.42 127.13 114.27RevPar Chg - Actual FX (%)3 18.0 14.5 9.3 14.2 13.3RevPar Chg - Constant FX (%)3 10.8 8.4 3.9 7.4 7.2
The Ritz-Carlton - North AmericaOccupancy (%) 70.5 76.2 74.2 68.7 72.3Average Daily Rate ($) 347.34 352.95 283.32 338.59 331.48RevPar ($)2 245.02 269.10 210.18 232.62 239.67RevPar Change (%)3 8.2 7.1 8.3 7.0 7.5
Luxury - International5
Occupancy (%) 68.9 76.0 72.9 72.0 72.7Average Daily Rate ($)4 290.95 311.43 271.09 293.69 292.24RevPar ($)2,4 200.44 236.74 197.49 211.48 212.54RevPar Change (%)3 11.7 12.2 17.0 9.3 12.2
1 Statistics are for managed hotels opened for a full year (called comparable hotels).2 Revenue per Available Room3 Year over year change of a consistent group of comparable hotels. Comparable hotel base changes each year based on hotel openings.4 Based on actual foreign exchange rates. 5 Beginning in Quarter 4, 2006, includes The Ritz-Carlton International and Bulgari Hotels & Resorts. Prior to Quarter 4, 2006, includes The Ritz-Carlton International.
H-3

XII. FULL-SERVICE, INTERNATIONAL AND LUXURY LODGING KEY OPERATING STATISTICS1
2008 2008 2008 2008 2008
1st Quarter 2nd Quarter 3rd Quarter 4th Quarter Full Year
MHRS - North AmericaOccupancy (%) 67.7 75.9 75.1 65.5 70.5 Average Daily Rate ($) 181.45 184.10 167.39 178.81 178.24RevPar ($)2 122.85 139.67 125.67 117.19 125.69RevPar Change (%)3 2.2 2.7 0.5 (8.7) (1.6)
MHRS - InternationalOccupancy (%) 71.8 76.8 75.2 70.3 73.4 Average Daily Rate ($)4 200.30 201.39 191.45 180.88 192.10 RevPar ($)2,4 143.91 154.73 144.02 127.11 140.99 RevPar Chg - Actual FX (%)3 16.5 14.3 11.2 (10.5) 5.1 RevPar Chg - Constant FX (%)3 9.7 6.3 4.5 (5.4) 2.6
Renaissance - North AmericaOccupancy (%) 68.9 74.7 72.3 64.1 69.4 Average Daily Rate ($) 171.70 176.46 154.39 166.26 167.17 RevPar ($)2 118.29 131.75 111.61 106.51 116.05 RevPar Change (%)3 3.1 1.5 0.1 (8.2) (1.5)
Renaissance - InternationalOccupancy (%) 67.7 74.2 72.1 69.3 71.0 Average Daily Rate ($)4 151.41 166.44 164.13 155.60 160.77RevPar ($)2,4 102.51 123.46 118.34 107.85 114.15RevPar Chg - Actual FX (%)3 18.0 14.9 12.9 (10.0) 5.5 RevPar Chg - Constant FX (%)3 10.2 6.6 6.0 (6.4) 2.4
The Ritz-Carlton - North AmericaOccupancy (%) 69.9 76.3 70.7 60.1 68.6 Average Daily Rate ($) 352.12 363.32 295.75 325.88 335.52RevPar ($)2 246.27 277.21 209.12 195.88 230.13RevPar Change (%)3 4.6 1.1 (1.7) (16.4) (4.7)
Luxury - International5Occupancy (%) 72.0 75.3 71.2 63.5 69.8 Average Daily Rate ($)4 333.83 362.55 319.09 305.89 315.83 RevPar ($)2,4 240.39 273.05 227.34 194.15 220.60 RevPar Chg - Actual FX (%)3 23.3 17.6 18.9 (1.6) 11.8 RevPar Chg - Constant FX (%)3 18.2 10.2 8.8 (3.8) 6.6
2009 2009 2009 2009 2009
1st Quarter 2nd Quarter 3rd Quarter 4th Quarter Full Year
MHRS - North AmericaOccupancy (%) 61.7 68.6 70.0 65.0 66.3 Average Daily Rate ($) 167.56 159.98 143.98 160.11 157.81RevPar ($)2 103.39 109.81 100.78 104.04 104.60RevPar Change (%)3 (15.9) (22.0) (19.8) (11.9) (17.2)
MHRS - InternationalOccupancy (%) 62.4 68.5 69.9 71.0 68.7 Average Daily Rate ($)4 166.91 153.19 150.62 160.41 157.26 RevPar ($)2,4 104.11 104.89 105.30 113.81 108.09 RevPar Chg - Actual FX (%)3 (24.1) (29.9) (27.1) (9.1) (22.0) RevPar Chg - Constant FX (%)3 (16.3) (20.2) (20.3) (9.6) (16.1)
Renaissance - North AmericaOccupancy (%) 62.5 68.1 68.0 63.4 65.3 Average Daily Rate ($) 168.26 158.24 138.14 151.82 153.71 RevPar ($)2 105.19 107.73 93.90 96.24 100.42 RevPar Change (%)3 (12.5) (20.8) (18.2) (13.4) (16.1)
Renaissance - InternationalOccupancy (%) 55.2 62.6 64.4 69.6 64.1 Average Daily Rate ($)4 134.85 133.79 129.92 142.37 136.52 RevPar ($)2,4 74.41 83.81 83.62 99.07 87.51RevPar Chg - Actual FX (%)3 (29.3) (35.2) (32.2) (13.1) (26.5) RevPar Chg - Constant FX (%)3 (21.0) (24.4) (24.2) (12.4) (19.7)
The Ritz-Carlton - North AmericaOccupancy (%) 57.0 61.9 64.9 60.8 61.5 Average Daily Rate ($) 337.03 299.28 238.99 278.52 280.76RevPar ($)2 192.13 185.34 155.09 169.42 172.61RevPar Change (%)3 (27.1) (31.4) (23.5) (11.6) (23.1)
Luxury - International5
Occupancy (%) 56.1 57.5 55.0 57.2 56.8 Average Daily Rate ($)4 343.71 322.05 289.65 303.07 317.16RevPar ($)2,4 192.86 185.31 159.39 173.30 179.99RevPar Chg - Actual FX (%)3 (19.9) (32.6) (30.9) (15.1) (24.9) RevPar Chg - Constant FX (%)3 (17.0) (26.1) (26.7) (17.1) (22.1)
1 Statistics are for managed hotels opened for a full year (called comparable hotels).2 Revenue per Available Room3 Year over year change of a consistent group of comparable hotels. Comparable hotel base changes each year based on hotel openings.4 Based on actual foreign exchange rates. 5 Beginning in Quarter 4, 2006, includes The Ritz-Carlton International and Bulgari Hotels & Resorts. Prior to Quarter 4, 2006, includes The Ritz-CarltonInternational.
H-4

2010 2010 2010 2010 2010
1st Quarter 2nd Quarter 3rd Quarter 4th Quarter Full Year
MHR - North AmericaOccupancy (%) 66.2 73.1 71.7 66.2 69.1Average Daily Rate ($) 152.59 160.30 147.02 163.16 156.27RevPar ($)2 101.50 117.21 105.35 108.08 107.98RevPar Change (%)3 (1.2) 7.6 7.0 5.6 4.7
MHR - InternationalOccupancy (%) 65.7 73.8 74.8 73.5 72.7Average Daily Rate ($)4 162.52 158.66 150.41 163.76 158.74RevPar ($)2,4 106.77 117.07 112.57 120.37 115.33RevPar Chg - Actual FX (%)3 5.7 11.4 6.7 6.7 7.8RevPar Chg - Constant FX (%)3 0.9 7.4 11.2 8.9 7.9
Renaissance Hotels - North AmericaOccupancy (%) 63.9 71.0 69.1 65.2 67.2Average Daily Rate ($) 150.21 159.16 142.02 157.97 152.57RevPar ($)2 96.04 113.08 98.20 102.95 102.51RevPar Change (%)3 (4.6) 6.1 3.8 6.4 2.6
Renaissance Hotels - InternationalOccupancy (%) 57.7 69.6 70.2 70.8 68.5Average Daily Rate ($)4 137.02 143.38 133.51 150.56 142.17RevPar ($)2,4 79.13 99.83 93.78 106.59 97.33RevPar Chg - Actual FX (%)3 11.5 21.0 11.7 9.8 13.6RevPar Chg - Constant FX (%)3 6.9 15.3 17.0 13.0 14.0
The Ritz-Carlton - North AmericaOccupancy (%) 64.2 71.6 68.6 65.4 67.6Average Daily Rate ($) 301.74 297.03 247.12 282.16 280.17RevPar ($)2 193.68 212.67 169.51 184.47 189.30RevPar Change (%)3 2.5 15.9 7.9 10.0 9.8
Luxury - International5
Occupancy (%) 58.5 67.3 62.8 64.5 64.0Average Daily Rate ($)4 318.38 309.20 275.17 309.32 305.69RevPar ($)2,4 186.34 208.18 172.78 199.60 195.77RevPar Chg - Actual FX (%)3 1.4 17.5 10.1 9.8 10.1RevPar Chg - Constant FX (%)3 (0.7) 14.0 12.4 13.7 10.7
1 Statistics are for managed hotels opened for a full year (called comparable hotels).2 Revenue per Available Room3 Year over year change of a consistent group of comparable hotels. Comparable hotel base changes each year based on hotel openings.4 Based on actual foreign exchange rates. 5 Beginning in Quarter 4, 2006, includes The Ritz-Carlton International and Bulgari Hotels & Resorts. Prior to Quarter 4, 2006, includes The Ritz-Carlton International.
XII. FULL-SERVICE, INTERNATIONAL AND LUXURY LODGING KEY OPERATING STATISTICS1
H-5

2011 2011 2011 2011 2011
1st Quarter 2nd Quarter 3rd Quarter 4th Quarter Full Year
MHR - North AmericaOccupancy (%) 66.9 74.6 73.8 68.9 71.0Average Daily Rate ($) 163.17 168.64 153.22 169.06 164.08RevPar ($)2 109.17 125.79 113.06 116.45 116.45RevPar Change (%)3 3.6 5.4 4.4 5.0 4.6
MHR - InternationalOccupancy (%) 65.0 73.1 75.7 73.0 72.8Average Daily Rate ($)4 165.12 171.34 167.27 175.70 171.68RevPar ($)2,4 107.32 125.18 126.59 128.29 124.91RevPar Chg - Actual FX (%)3 9.1 13.0 15.7 6.4 10.6RevPar Chg - Constant FX (%)3 9.9 8.1 7.2 4.2 6.7
Renaissance Hotels - North AmericaOccupancy (%) 66.1 72.4 72.3 68.5 69.7Average Daily Rate ($) 162.49 168.37 149.16 164.80 161.40RevPar ($)2 107.45 121.82 107.89 112.91 112.55RevPar Change (%)3 6.6 5.1 8.8 6.6 6.7
Renaissance Hotels - InternationalOccupancy (%) 59.8 70.4 71.3 72.3 69.7Average Daily Rate ($)4 141.01 161.05 151.56 158.24 156.07RevPar ($)2,4 84.34 113.33 108.13 114.35 108.84RevPar Chg - Actual FX (%)3 9.8 14.9 14.6 6.3 11.1RevPar Chg - Constant FX (%)3 10.1 9.7 4.7 3.3 6.2
The Ritz-Carlton - North AmericaOccupancy (%) 67.3 73.9 69.9 66.0 69.2Average Daily Rate ($) 316.29 311.67 270.02 308.44 302.31RevPar ($)2 212.81 230.43 188.75 203.45 209.11RevPar Change (%)3 6.9 10.6 13.5 9.3 10.2
Luxury - International5
Occupancy (%) 63.0 65.2 63.3 63.7 63.8Average Daily Rate ($)4 328.70 318.60 307.31 328.17 318.11RevPar ($)2,4 207.20 207.59 194.55 208.89 203.10RevPar Chg - Actual FX (%)3 13.6 4.3 17.2 4.4 4.5RevPar Chg - Constant FX (%)3 12.3 1.4 8.5 5.5 6.2
1 Statistics are for managed hotels opened for a full year (called comparable hotels).2 Revenue per Available Room3 Year over year change of a consistent group of comparable hotels. Comparable hotel base changes each year based on hotel openings.4 Based on actual foreign exchange rates. 5 Beginning in Quarter 4, 2006, includes The Ritz-Carlton International and Bulgari Hotels & Resorts. Prior to Quarter 4, 2006, includes The Ritz-Carlton International.
XII. FULL-SERVICE, INTERNATIONAL AND LUXURY LODGING KEY OPERATING STATISTICS1
H-6

2012 2012 2012 2012 20121st Quarter 2nd Quarter 3rd Quarter 4th Quarter Full Year
MHR - North AmericaOccupancy (%) 69.5 76.5 75.5 70.1 72.7Average Daily Rate ($) 169.26 175.85 162.27 176.61 171.48RevPar ($)2 117.58 134.49 122.60 123.86 124.72RevPar Change (%)3 6.7 5.6 7.2 5.1 6.1
MHR - InternationalOccupancy (%) 67.1 74.3 74.3 73.6 72.9Average Daily Rate ($)4 168.55 173.66 164.45 169.52 168.99RevPar ($)2,4 113.07 129.00 122.11 124.71 123.14RevPar Chg - Actual FX (%)3 6.1 4.7 1.0 1.2 2.8RevPar Chg - Constant FX (%)3 6.9 6.8 7.0 3.2 5.7
Renaissance Hotels - North AmericaOccupancy (%) 72.1 77.9 75.3 70.3 73.6Average Daily Rate ($) 167.06 176.16 155.07 172.51 167.67RevPar ($)2 120.39 137.16 116.74 121.25 123.38RevPar Change (%)3 7.9 8.9 8.8 5.1 7.5
Renaissance Hotels - InternationalOccupancy (%) 61.0 71.4 70.3 71.9 69.6Average Daily Rate ($)4 136.64 149.52 135.44 143.39 142.08RevPar ($)2,4 83.29 106.79 95.20 103.11 98.85RevPar Chg - Actual FX (%)3 8.8 3.0 -4.8 -0.6 0.5RevPar Chg - Constant FX (%)3 10.5 6.1 3.3 2.9 4.9
The Ritz-Carlton - North AmericaOccupancy (%) 68.4 74.2 71.2 66.5 69.9Average Daily Rate ($) 336.03 337.24 286.85 321.59 319.57RevPar ($)2 229.73 250.29 204.30 213.76 223.51RevPar Change (%)3 7.1 6.7 7.2 4.5 6.1
Luxury - International5
Occupancy (%) 59.9 68.4 63.2 64.3 63.4Average Daily Rate ($)4 349.99 334.07 309.85 339.54 341.32RevPar ($)2,4 209.55 228.65 195.74 218.15 216.34RevPar Chg - Actual FX (%)3 3.0 10.2 0.2 1.8 3.7RevPar Chg - Constant FX (%)3 2.2 11.3 5.5 4.2 5.9
1 Statistics are for managed hotels opened for a full year (called comparable hotels).2 Revenue per Available Room3 Year over year change of a consistent group of comparable hotels. Comparable hotel base changes each year based on hotel openings.4 Based on actual foreign exchange rates. 5 Beginning in Quarter 4, 2006, includes The Ritz-Carlton International and Bulgari Hotels & Resorts. Prior to Quarter 4, 2006, includes The Ritz-Carlton International.
XII. FULL-SERVICE, INTERNATIONAL AND LUXURY LODGING KEY OPERATING STATISTICS1
H-7
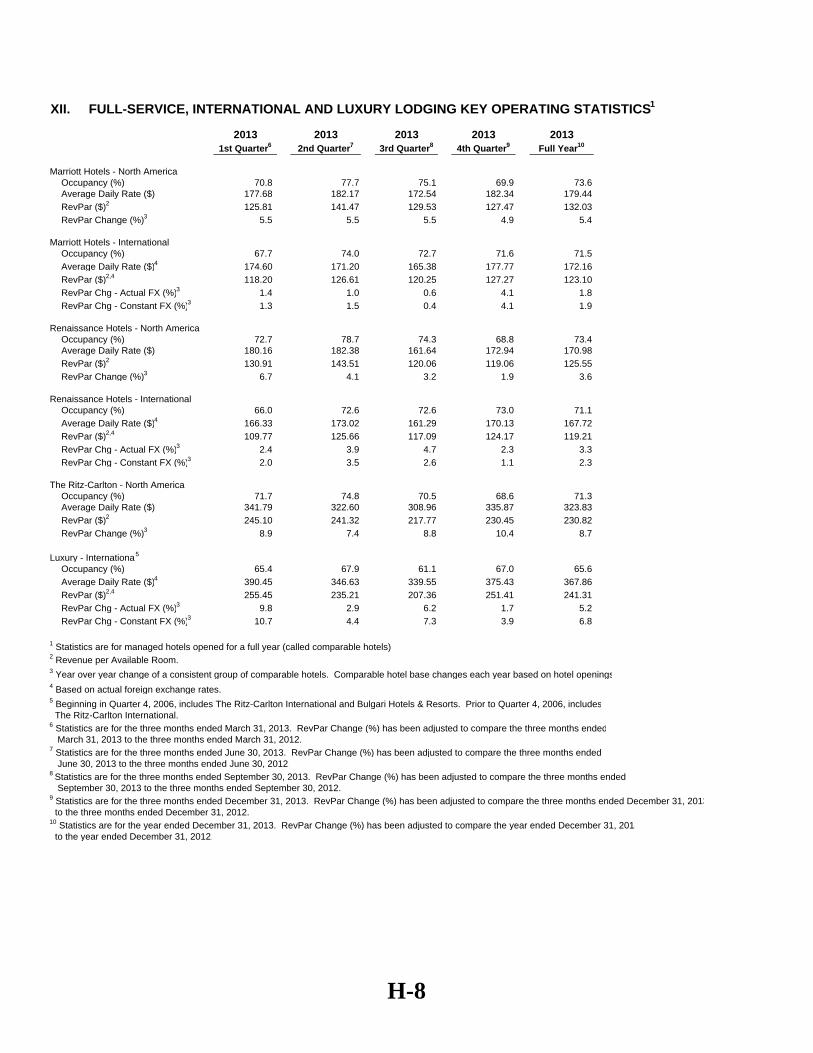
2013 2013 2013 2013 20131st Quarter6 2nd Quarter7 3rd Quarter8 4th Quarter9 Full Year10
Marriott Hotels - North AmericaOccupancy (%) 70.8 77.7 75.1 69.9 73.6Average Daily Rate ($) 177.68 182.17 172.54 182.34 179.44RevPar ($)2 125.81 141.47 129.53 127.47 132.03RevPar Change (%)3 5.5 5.5 5.5 4.9 5.4
Marriott Hotels - InternationalOccupancy (%) 67.7 74.0 72.7 71.6 71.5Average Daily Rate ($)4 174.60 171.20 165.38 177.77 172.16RevPar ($)2,4 118.20 126.61 120.25 127.27 123.10RevPar Chg - Actual FX (%)3 1.4 1.0 0.6 4.1 1.8RevPar Chg - Constant FX (%)3 1.3 1.5 0.4 4.1 1.9
Renaissance Hotels - North AmericaOccupancy (%) 72.7 78.7 74.3 68.8 73.4Average Daily Rate ($) 180.16 182.38 161.64 172.94 170.98RevPar ($)2 130.91 143.51 120.06 119.06 125.55RevPar Change (%)3 6.7 4.1 3.2 1.9 3.6
Renaissance Hotels - InternationalOccupancy (%) 66.0 72.6 72.6 73.0 71.1Average Daily Rate ($)4 166.33 173.02 161.29 170.13 167.72RevPar ($)2,4 109.77 125.66 117.09 124.17 119.21RevPar Chg - Actual FX (%)3 2.4 3.9 4.7 2.3 3.3RevPar Chg - Constant FX (%)3 2.0 3.5 2.6 1.1 2.3
The Ritz-Carlton - North AmericaOccupancy (%) 71.7 74.8 70.5 68.6 71.3Average Daily Rate ($) 341.79 322.60 308.96 335.87 323.83RevPar ($)2 245.10 241.32 217.77 230.45 230.82RevPar Change (%)3 8.9 7.4 8.8 10.4 8.7
Luxury - International5
Occupancy (%) 65.4 67.9 61.1 67.0 65.6Average Daily Rate ($)4 390.45 346.63 339.55 375.43 367.86RevPar ($)2,4 255.45 235.21 207.36 251.41 241.31RevPar Chg - Actual FX (%)3 9.8 2.9 6.2 1.7 5.2RevPar Chg - Constant FX (%)3 10.7 4.4 7.3 3.9 6.8
1 Statistics are for managed hotels opened for a full year (called comparable hotels)2 Revenue per Available Room.3 Year over year change of a consistent group of comparable hotels. Comparable hotel base changes each year based on hotel openings4 Based on actual foreign exchange rates. 5 Beginning in Quarter 4, 2006, includes The Ritz-Carlton International and Bulgari Hotels & Resorts. Prior to Quarter 4, 2006, includes The Ritz-Carlton International.6 Statistics are for the three months ended March 31, 2013. RevPar Change (%) has been adjusted to compare the three months ended March 31, 2013 to the three months ended March 31, 2012.7 Statistics are for the three months ended June 30, 2013. RevPar Change (%) has been adjusted to compare the three months ended June 30, 2013 to the three months ended June 30, 2012.8 Statistics are for the three months ended September 30, 2013. RevPar Change (%) has been adjusted to compare the three months ended September 30, 2013 to the three months ended September 30, 2012.9 Statistics are for the three months ended December 31, 2013. RevPar Change (%) has been adjusted to compare the three months ended December 31, 2013 to the three months ended December 31, 2012.10 Statistics are for the year ended December 31, 2013. RevPar Change (%) has been adjusted to compare the year ended December 31, 2013 to the year ended December 31, 2012.
XII. FULL-SERVICE, INTERNATIONAL AND LUXURY LODGING KEY OPERATING STATISTICS1
H-8

2014 2014 2014 2014 20141st Quarter5 2nd Quarter 3rd Quarter 4th Quarter Full Year7
Marriott Hotels - North AmericaOccupancy (%) 73.1 79.0 77.6 70.0 75.1Average Daily Rate ($) 186.20 189.56 183.21 194.07 188.39RevPar ($)2 136.07 149.83 142.11 135.81 141.42RevPar Change (%)3 5.5 4.3 8.7 4.2 5.7
Marriott Hotels - International6
Occupancy (%) 68.6 75.1 76.0 74.5 73.7Average Daily Rate ($)4 183.11 180.10 175.37 174.77 176.43RevPar ($)2,4 125.60 135.19 133.19 130.23 130.10RevPar Chg - Actual FX (%)3 4.3 5.8 10.5 2.8 5.8RevPar Chg - Constant FX (%)3 4.2 3.6 7.5 5.4 5.2
Renaissance Hotels - North AmericaOccupancy (%) 71.1 78.7 75.7 67.0 73.1Average Daily Rate ($) 172.46 182.54 171.99 182.74 177.42RevPar ($)2 122.63 143.65 130.26 122.50 129.76RevPar Change (%)3 3.8 3.2 9.9 4.4 5.2
Renaissance Hotels - International6
Occupancy (%) 65.9 70.1 72.9 72.2 70.2Average Daily Rate ($)4 161.85 180.25 163.12 163.39 166.63RevPar ($)2,4 106.70 126.29 118.96 118.04 116.95RevPar Chg - Actual FX (%)3 3.1 5.3 6.7 1.4 4.0RevPar Chg - Constant FX (%)3 3.4 4.6 6.2 5.3 4.7
The Ritz-Carlton - North AmericaOccupancy (%) 72.5 75.9 73.5 69.9 72.9Average Daily Rate ($) 348.56 337.09 317.67 351.61 338.48RevPar ($)2 252.58 255.78 233.45 245.95 246.89RevPar Change (%)3 5.2 6.4 7.6 5.7 6.2
The Ritz-Carlton - InternationalOccupancy (%) 69.0 71.9 68.5 71.7 70.5Average Daily Rate ($)4 422.06 363.38 342.21 377.06 373.80RevPar ($)2,4 291.28 261.33 234.33 270.51 263.54RevPar Chg - Actual FX (%)3 5.4 6.5 5.7 2.2 4.8RevPar Chg - Constant FX (%)3 7.2 7.8 6.8 6.3 7.0
1 Statistics are for managed hotels opened for a full year (called comparable hotels).2 Revenue per Available Room.3 Year over year change of a consistent group of comparable hotels. Comparable hotel base changes each year based on hotel openings.4 Based on actual foreign exchange rates. 5 RevPar Change (%) has been adjusted to compare the three months ended March 31, 2014 to the three months ended March 31, 2013.
7 RevPar Change (%) has been adjusted to compare the twelve months ended December 31, 2014 to the twelve months ended December 31, 2013.
XII. FULL-SERVICE AND INTERNATIONAL LODGING KEY OPERATING STATISTICS1
6 Due to significant inflation in Venezuela, the company’s three hotels in that country were removed from the comp set. 1st quarter results reflect the most recent month comp set.
H-9

2015 2015 2015 2015 20151st Quarter 2nd Quarter 3rd Quarter 4th Quarter Full Year
Marriott Hotels - North AmericaOccupancy (%) 72.8 79.8 77.9 71.7 75.4Average Daily Rate ($) 192.88 200.54 190.48 198.43 195.28RevPar ($)2 140.46 160.00 148.29 142.24 147.33RevPar Change (%)3 4.2 5.1 3.5 4.7 4.7
Marriott Hotels - InternationalOccupancy (%) 72.1 76.5 76.4 74.0 74.7Average Daily Rate ($)4 170.56 162.91 159.05 163.12 163.19RevPar ($)2,4 122.95 124.61 121.52 120.71 121.95RevPar Chg - Actual FX (%)3 0.8 (3.2) (2.1) (3.9) (2.0) RevPar Chg - Constant FX (%)3 6.3 5.3 6.3 2.6 5.2
Renaissance Hotels - North AmericaOccupancy (%) 74.1 79.5 75.3 69.9 75.2Average Daily Rate ($) 182.46 187.12 171.23 183.01 182.13RevPar ($)2 135.23 148.70 129.02 128.00 136.91RevPar Change (%)3 6.4 6.2 2.0 5.2 5.5
Renaissance Hotels - InternationalOccupancy (%) 66.4 71.4 72.5 69.6 70.0Average Daily Rate ($)4 150.06 156.74 147.13 149.01 150.73RevPar ($)2,4 99.64 111.95 106.64 103.71 105.50RevPar Chg - Actual FX (%)3 (1.1) (7.1) (7.4) (9.4) (6.5) RevPar Chg - Constant FX (%)3 7.1 4.3 4.5 1.5 4.3
The Ritz-Carlton - North AmericaOccupancy (%) 71.4 74.9 73.2 69.0 72.1Average Daily Rate ($) 381.04 356.95 334.03 365.97 359.92RevPar ($)2 272.05 267.47 244.58 252.44 259.41RevPar Change (%)3 2.9 3.2 3.3 1.7 2.7
The Ritz-Carlton - InternationalOccupancy (%) 68.0 69.3 64.0 68.1 67.3Average Daily Rate ($)4 394.92 331.93 312.31 346.18 346.56RevPar ($)2,4 268.69 230.07 199.73 235.58 233.34RevPar Chg - Actual FX (%)3 4.4 (2.0) (4.4) (4.1) (1.4) RevPar Chg - Constant FX (%)3 9.1 4.5 3.3 0.4 4.4
1 Statistics are for managed hotels opened for a full year (called comparable hotels).2 Revenue per Available Room.3 Year over year change of a consistent group of comparable hotels. Comparable hotel base changes each year based on hotel openings.4 Based on actual foreign exchange rates.
XII. FULL-SERVICE AND INTERNATIONAL LODGING KEY OPERATING STATISTICS1
H-10
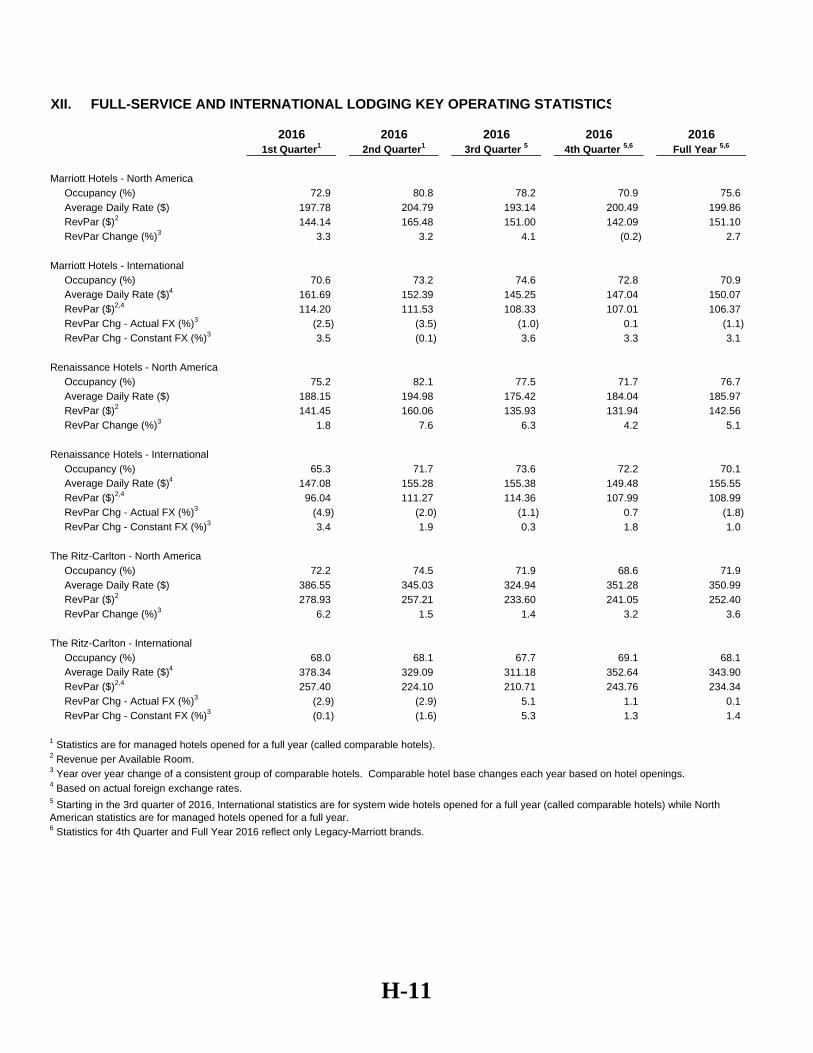
2016 2016 2016 2016 20161st Quarter1 2nd Quarter1 3rd Quarter 5 4th Quarter 5,6 Full Year 5,6
Marriott Hotels - North AmericaOccupancy (%) 72.9 80.8 78.2 70.9 75.6 Average Daily Rate ($) 197.78 204.79 193.14 200.49 199.86 RevPar ($)2 144.14 165.48 151.00 142.09 151.10 RevPar Change (%)3 3.3 3.2 4.1 (0.2) 2.7
Marriott Hotels - InternationalOccupancy (%) 70.6 73.2 74.6 72.8 70.9 Average Daily Rate ($)4 161.69 152.39 145.25 147.04 150.07 RevPar ($)2,4 114.20 111.53 108.33 107.01 106.37 RevPar Chg - Actual FX (%)3 (2.5) (3.5) (1.0) 0.1 (1.1) RevPar Chg - Constant FX (%)3 3.5 (0.1) 3.6 3.3 3.1
Renaissance Hotels - North AmericaOccupancy (%) 75.2 82.1 77.5 71.7 76.7 Average Daily Rate ($) 188.15 194.98 175.42 184.04 185.97 RevPar ($)2 141.45 160.06 135.93 131.94 142.56 RevPar Change (%)3 1.8 7.6 6.3 4.2 5.1
Renaissance Hotels - InternationalOccupancy (%) 65.3 71.7 73.6 72.2 70.1 Average Daily Rate ($)4 147.08 155.28 155.38 149.48 155.55 RevPar ($)2,4 96.04 111.27 114.36 107.99 108.99 RevPar Chg - Actual FX (%)3 (4.9) (2.0) (1.1) 0.7 (1.8) RevPar Chg - Constant FX (%)3 3.4 1.9 0.3 1.8 1.0
The Ritz-Carlton - North AmericaOccupancy (%) 72.2 74.5 71.9 68.6 71.9 Average Daily Rate ($) 386.55 345.03 324.94 351.28 350.99 RevPar ($)2 278.93 257.21 233.60 241.05 252.40 RevPar Change (%)3 6.2 1.5 1.4 3.2 3.6
The Ritz-Carlton - InternationalOccupancy (%) 68.0 68.1 67.7 69.1 68.1 Average Daily Rate ($)4 378.34 329.09 311.18 352.64 343.90 RevPar ($)2,4 257.40 224.10 210.71 243.76 234.34 RevPar Chg - Actual FX (%)3 (2.9) (2.9) 5.1 1.1 0.1 RevPar Chg - Constant FX (%)3 (0.1) (1.6) 5.3 1.3 1.4
1 Statistics are for managed hotels opened for a full year (called comparable hotels).2 Revenue per Available Room.3 Year over year change of a consistent group of comparable hotels. Comparable hotel base changes each year based on hotel openings.4 Based on actual foreign exchange rates.
6 Statistics for 4th Quarter and Full Year 2016 reflect only Legacy-Marriott brands.
XII. FULL-SERVICE AND INTERNATIONAL LODGING KEY OPERATING STATISTICS
5 Starting in the 3rd quarter of 2016, International statistics are for system wide hotels opened for a full year (called comparable hotels) while North American statistics are for managed hotels opened for a full year.
H-11

XIII. LIMITED-SERVICE LODGING KEY OPERATING STATISTICS1
1980 1981 1982 1983 1984 1985 1986 1987 1988 1989Full Year Full Year Full Year Full Year Full Year Full Year Full Year Full Year Full Year Full Year
CourtyardOccupancy (%) - - - 73.4 87.6 86.1 84.6 78.0 76.9 72.9Average Daily Rate ($) - - - 43.46 46.02 50.24 53.47 56.61 59.12 60.30RevPar ($)2 - - - 31.90 40.31 43.26 45.24 44.16 45.46 43.96RevPar Change (%)3 - - - - 26.4 7.3 1.5 6.0 9.2 7.2
Residence InnOccupancy (%) - - - - - - - 73.8 78.4 79.4Average Daily Rate ($) - - - - - - - 69.04 71.01 71.04RevPar ($)2 - - - - - - - 50.95 55.67 56.41RevPar Change (%)3 - - - - - - - - 4.6 3.3
Fairfield InnOccupancy (%) - - - - - - - 54.8 62.1 69.8Average Daily Rate ($) - - - - - - - 30.61 34.78 34.89RevPar ($)2 - - - - - - - 16.77 21.60 24.35RevPar Change (%)3 - - - - - - - - 8.8 12.7
1990 1991 1992 1993 1994 1995 1996 1997 1998 1999Full Year Full Year Full Year Full Year Full Year Full Year Full Year Full Year Full Year Full Year
CourtyardOccupancy (%) 72.8 72.5 78.4 81.0 81.3 81.1 80.1 80.6 79.7 79.3Average Daily Rate ($) 63.13 63.00 61.20 63.25 67.62 72.40 77.67 83.77 89.32 91.48RevPar ($)2 45.96 45.68 47.98 51.23 54.98 58.72 62.21 67.50 71.22 72.53RevPar Change (%)3 6.1 0.6 8.7 6.8 6.6 7.0 6.3 7.6 6.0 2.7
Residence InnOccupancy (%) 76.3 77.5 80.3 83.3 85.6 86.0 84.9 84.0 83.3 83.0Average Daily Rate ($) 74.20 73.02 73.83 75.03 77.46 82.84 88.78 95.24 99.12 99.03RevPar ($)2 56.61 56.59 59.29 62.50 66.31 71.24 75.37 80.01 82.59 82.23RevPar Change (%)3 0.9 (0.1) 4.2 5.3 5.5 7.2 5.8 6.1 3.7 0.8
Fairfield InnOccupancy (%) 72.7 77.2 78.3 80.1 81.0 80.6 76.6 75.4 73.7 71.8Average Daily Rate ($) 37.39 36.17 37.47 39.35 41.18 45.26 49.57 50.65 51.28 52.79RevPar ($)2 27.18 27.92 29.34 31.52 33.36 36.48 37.97 38.17 37.78 37.91RevPar Change (%)3 4.3 4.1 7.6 6.8 7.3 7.8 4.1 (0.1) (1.0) (0.2)
SpringHill SuitesOccupancy (%) - - - - - - - - - 78.8Average Daily Rate ($) - - - - - - - - - 83.46RevPar ($)2 - - - - - - - - - 65.80RevPar Change (%)3 - - - - - - - - - 6.6
TownePlace SuitesOccupancy (%) - - - - - - - - - 77.9Average Daily Rate ($) - - - - - - - - - 57.19RevPar ($)2 - - - - - - - - - 44.52RevPar Change (%)3 - - - - - - - - - 0.3
1 Statistics are for managed hotels opened for a full year (called comparable hotels)2 Revenue per Available Room.3 Year over year change of a consistent group of comparable hotels. Comparable hotel base changes each year based on hotel openings. SpringHill Suites and TownePlace Suites had only 3 and 1 comparable units, respectively, in 1999.
I-1

XIII. LIMITED-SERVICE LODGING KEY OPERATING STATISTICS1
2000 2001 2002 2003 2004Full Year Full Year Full Year Full Year Full Year
CourtyardOccupancy (%) 78.9 71.6 69.1 67.6 70.3Average Daily Rate ($) 97.68 99.45 94.47 93.16 96.30 RevPar ($)2 77.05 71.24 65.26 63.01 67.66 RevPar Change (%)3 5.7 (7.0) (7.9) (2.7) 9.6
Residence InnOccupancy (%) 83.5 77.8 76.9 77.0 79.0 Average Daily Rate ($) 104.88 105.46 97.36 94.94 99.49 RevPar ($)2 87.61 82.05 74.87 73.09 78.59 RevPar Change (%)3 6.1 (7.5) (7.9) (2.3) 7.4
Fairfield Inn 4
Occupancy (%) 69.7 66.3 66.0 64.1 66.6 Average Daily Rate ($) 61.32 64.70 64.48 64.28 67.97 RevPar ($)2 42.75 42.91 42.59 41.22 45.29 RevPar Change (%)3 2.4 (2.6) (1.3) (0.4) 6.2
SpringHill SuitesOccupancy (%) 72.0 70.8 67.4 66.4 69.8 Average Daily Rate ($) 73.42 86.50 78.24 82.66 88.53 RevPar ($)2 52.88 61.28 52.77 54.89 61.82 RevPar Change (%)3 25.7 (0.9) (1.1) 6.0 13.2
TownePlace SuitesOccupancy (%) 71.8 74.6 73.4 70.3 74.1 Average Daily Rate ($) 58.86 67.36 62.78 63.24 65.77 RevPar ($)2 42.23 50.28 46.08 44.48 48.71 RevPar Change (%)3 18.9 (4.2) (6.5) (1.0) 9.5
2005 2005 2005 2005 2005
1st Quarter 2nd Quarter 3rd Quarter 4th Quarter Full YearCourtyard
Occupancy (%) 67.9 74.1 73.5 68.2 70.7 Average Daily Rate ($) 106.57 106.85 103.94 108.67 106.50 RevPar ($)2 72.37 79.14 76.38 74.16 75.32 RevPar Change (%)3 8.7 9.4 7.8 10.2 9.1
Residence InnOccupancy (%) 76.7 81.7 83.4 78.5 80.0 Average Daily Rate ($) 105.63 108.45 108.13 108.87 108.09 RevPar ($)2 80.96 88.56 90.15 85.47 86.46 RevPar Change (%)3 10.0 7.6 6.8 9.7 8.6
Fairfield Inn 4
Occupancy (%) 63.4 72.3 75.2 67.4 69.5 Average Daily Rate ($) 71.87 74.26 76.15 74.94 74.47 RevPar ($)2 45.53 53.72 57.25 50.48 51.76 RevPar Change (%)3 10.9 11.8 10.0 13.5 11.7
SpringHill SuitesOccupancy (%) 69.0 77.9 78.7 72.3 74.9 Average Daily Rate ($) 93.86 95.54 95.17 95.13 93.89 RevPar ($)2 64.74 74.38 74.94 68.79 70.36 RevPar Change (%)3 20.8 17.3 13.0 14.0 16.3
TownePlace SuitesOccupancy (%) 70.4 77.8 80.9 73.3 75.4 Average Daily Rate ($) 68.48 69.93 71.43 71.70 70.52 RevPar ($)2 48.21 54.51 57.77 52.54 53.18 RevPar Change (%)3 6.6 7.1 9.6 11.6 9.1
1 Statistics are for managed hotels opened for a full year (called comparable hotels)2 Revenue per Available Room.
4 Beginning in 2000, represents Systemwide stats.
3 Year over year change of a consistent group of comparable hotels. Comparable hotel base changes each year based on hotel openings.
I-2

XIII. LIMITED-SERVICE LODGING KEY OPERATING STATISTICS1
2006 2006 2006 2006 2006
1st Quarter 2nd Quarter 3rd Quarter 4th Quarter Full YearCourtyard
Occupancy (%) 68.3 75.2 73.0 67.9 70.9 Average Daily Rate ($) 118.82 119.35 115.87 121.15 119.30RevPar ($)2 81.20 89.71 84.60 82.23 84.62RevPar Change (%)3 11.5 12.3 9.4 8.4 10.3
Residence InnOccupancy (%) 76.6 82.0 81.7 74.0 78.3 Average Daily Rate ($) 116.26 118.38 117.21 119.33 117.99RevPar ($)2 89.02 97.12 95.75 88.36 92.35RevPar Change (%)3 10.1 9.3 5.9 2.9 6.8
Fairfield Inn 4
Occupancy (%) 65.9 74.5 76.4 67.0 70.7 Average Daily Rate ($) 79.73 81.72 84.14 82.46 82.05RevPar ($)2 52.57 60.85 64.28 55.23 58.01RevPar Change (%)3 14.3 12.4 9.5 8.1 10.6
SpringHill SuitesOccupancy (%) 68.0 78.5 76.1 68.2 72.3 Average Daily Rate ($) 101.13 103.79 102.83 103.39 102.86RevPar ($)2 68.75 81.47 78.27 70.49 74.42RevPar Change (%)3 6.9 12.9 8.7 3.5 7.8
TownePlace SuitesOccupancy (%) 72.2 79.4 81.3 70.2 75.3 Average Daily Rate ($) 77.28 78.00 78.99 80.08 78.68RevPar ($)2 55.81 61.95 64.21 56.19 59.28RevPar Change (%)3 13.1 13.3 11.1 5.6 10.4
2007 2007 2007 2007 2007
1st Quarter 2nd Quarter 3rd Quarter 4th Quarter Full YearCourtyard
Occupancy (%) 66.0 74.3 74.2 68.0 70.4Average Daily Rate ($) 128.72 128.24 122.39 129.65 127.34RevPar ($)2 84.96 95.28 90.82 88.19 89.69RevPar Change (%)3 3.9 4.5 5.7 5.4 4.9
Residence InnOccupancy (%) 73.0 80.9 82.3 75.0 77.7Average Daily Rate ($) 124.22 123.93 121.78 124.83 124.24RevPar ($)2 90.70 100.22 100.23 93.60 96.53RevPar Change (%)3 1.4 3.4 5.0 5.1 3.9
Fairfield Inn 4
Occupancy (%) 64.4 74.7 76.9 67.0 70.5Average Daily Rate ($) 85.59 87.74 90.06 88.50 88.19RevPar ($)2 55.13 65.54 69.25 59.30 62.17RevPar Change (%)3 5.5 6.9 7.2 6.8 6.7
SpringHill SuitesOccupancy (%) 65.6 77.6 77.8 70.0 72.6Average Daily Rate ($) 109.56 108.22 106.33 107.65 107.86RevPar ($)2 71.88 84.02 82.73 75.40 78.27RevPar Change (%)3 3.5 3.1 6.1 6.8 5.0
TownePlace SuitesOccupancy (%) 68.8 78.3 79.2 71.5 74.2Average Daily Rate ($) 86.02 85.20 86.21 85.30 85.65RevPar ($)2 59.19 66.67 68.28 60.95 63.56RevPar Change (%)3 6.1 7.6 6.3 8.5 7.2
1 Statistics are for managed hotels opened for a full year (called comparable hotels).2 Revenue per Available Room.
4 Beginning in 2000, represents Systemwide stats.
3 Year over year change of a consistent group of comparable hotels. Comparable hotel base changes each year based on hotel openings.
I-3

XIII. LIMITED-SERVICE LODGING KEY OPERATING STATISTICS1
2008 2008 2008 2008 2008
1st Quarter 2nd Quarter 3rd Quarter 4th Quarter Full YearCourtyard
Occupancy (%) 64.7 72.7 71.3 61.7 67.0 Average Daily Rate ($) 132.41 131.44 124.21 124.49 127.86RevPar ($)2 85.68 95.51 88.52 76.83 85.71RevPar Change (%)3 1.0 (0.4) (3.1) (13.7) (4.9)
Residence InnOccupancy (%) 71.9 79.3 80.5 69.5 74.8 Average Daily Rate ($) 128.78 127.69 124.76 122.97 126.06RevPar ($)2 92.58 101.22 100.41 85.52 94.32RevPar Change (%)3 1.7 0.5 (1.4) (9.0) (2.7)
Fairfield Inn 4Occupancy (%) 62.3 70.8 73.3 60.5 66.2 Average Daily Rate ($) 92.33 92.79 93.82 88.83 91.75RevPar ($)2 57.54 65.69 68.74 53.76 60.78RevPar Change (%)3 3.2 (1.2) (2.2) (10.8) (3.5)
SpringHill SuitesOccupancy (%) 66.8 76.6 73.6 62.1 69.1 Average Daily Rate ($) 113.49 110.82 106.54 106.08 109.00RevPar ($)2 75.84 84.91 78.41 65.91 75.29RevPar Change (%)3 5.5 1.1 (5.2) (12.6) (3.8)
TownePlace SuitesOccupancy (%) 65.1 71.6 73.5 66.0 68.7 Average Daily Rate ($) 90.06 87.14 87.32 86.00 87.46RevPar ($)2 58.60 62.38 64.14 56.75 60.12RevPar Change (%)3 (1.0) (6.4) (6.0) (6.9) (5.4)
2009 2009 2009 2009 2009
1st Quarter 2nd Quarter 3rd Quarter 4th Quarter Full YearCourtyard
Occupancy (%) 56.7 64.2 65.0 59.4 61.2Average Daily Rate ($) 118.90 110.53 103.75 107.57 109.78RevPar ($)2 67.47 70.91 67.42 63.88 67.15RevPar Change (%)3 (21.5) (25.8) (23.7) (17.0) (21.7)
Residence InnOccupancy (%) 64.6 71.8 75.2 67.2 69.5Average Daily Rate ($) 121.72 115.31 110.56 110.55 114.27RevPar ($)2 78.58 82.78 83.11 74.33 79.38RevPar Change (%)3 (16.5) (18.9) (17.2) (13.6) (16.4)
Fairfield Inn & Suites4
Occupancy (%) 56.5 63.9 66.5 74.0 76.8Average Daily Rate ($) 87.12 85.46 85.21 78.44 83.06RevPar ($)2 49.22 54.60 56.69 58.08 63.83RevPar Change (%)3 (14.7) (17.1) (17.7) (1.1) (12.8)
SpringHill SuitesOccupancy (%) 56.0 65.9 64.6 59.3 61.3Average Daily Rate ($) 107.14 99.00 92.11 93.22 97.32RevPar ($)2 59.95 65.26 59.51 55.25 59.63RevPar Change (%)3 (21.4) (21.9) (22.6) (15.5) (20.0)
TownePlace SuitesOccupancy (%) 57.0 63.6 68.8 57.1 61.3Average Daily Rate ($) 85.50 77.69 75.46 72.83 77.4RevPar ($)2 48.75 49.42 51.94 41.61 47.45RevPar Change (%)3 (16.8) (20.8) (19.0) (26.7) (21.1)
1 Statistics are for managed hotels opened for a full year (called comparable hotels).2 Revenue per Available Room.
4 Beginning in 2000, represents Systemwide stats.
3 Year over year change of a consistent group of comparable hotels. Comparable hotel base changes each year based on hotel openings.
I-4
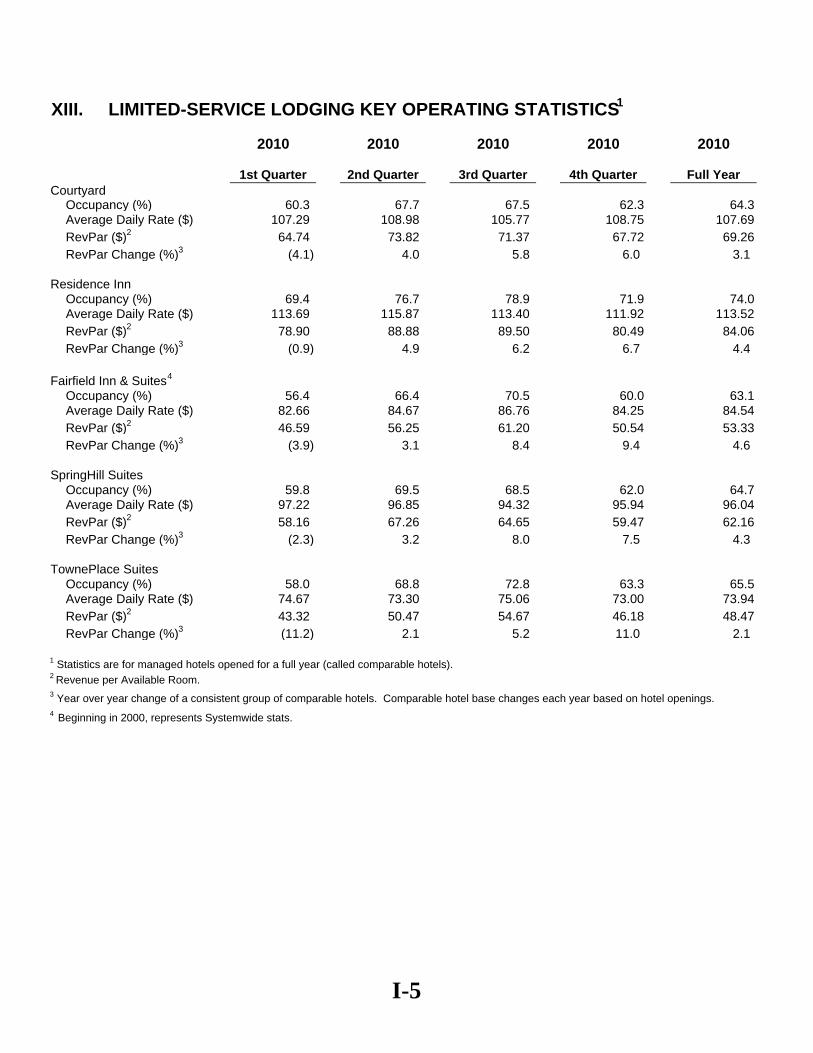
XIII. LIMITED-SERVICE LODGING KEY OPERATING STATISTICS1
2010 2010 2010 2010 2010
1st Quarter 2nd Quarter 3rd Quarter 4th Quarter Full YearCourtyard
Occupancy (%) 60.3 67.7 67.5 62.3 64.3Average Daily Rate ($) 107.29 108.98 105.77 108.75 107.69RevPar ($)2 64.74 73.82 71.37 67.72 69.26RevPar Change (%)3 (4.1) 4.0 5.8 6.0 3.1
Residence InnOccupancy (%) 69.4 76.7 78.9 71.9 74.0Average Daily Rate ($) 113.69 115.87 113.40 111.92 113.52RevPar ($)2 78.90 88.88 89.50 80.49 84.06RevPar Change (%)3 (0.9) 4.9 6.2 6.7 4.4
Fairfield Inn & Suites4
Occupancy (%) 56.4 66.4 70.5 60.0 63.1Average Daily Rate ($) 82.66 84.67 86.76 84.25 84.54RevPar ($)2 46.59 56.25 61.20 50.54 53.33RevPar Change (%)3 (3.9) 3.1 8.4 9.4 4.6
SpringHill SuitesOccupancy (%) 59.8 69.5 68.5 62.0 64.7Average Daily Rate ($) 97.22 96.85 94.32 95.94 96.04RevPar ($)2 58.16 67.26 64.65 59.47 62.16RevPar Change (%)3 (2.3) 3.2 8.0 7.5 4.3
TownePlace SuitesOccupancy (%) 58.0 68.8 72.8 63.3 65.5Average Daily Rate ($) 74.67 73.30 75.06 73.00 73.94RevPar ($)2 43.32 50.47 54.67 46.18 48.47RevPar Change (%)3 (11.2) 2.1 5.2 11.0 2.1
1 Statistics are for managed hotels opened for a full year (called comparable hotels).2 Revenue per Available Room.
4 Beginning in 2000, represents Systemwide stats.
3 Year over year change of a consistent group of comparable hotels. Comparable hotel base changes each year based on hotel openings.
I-5
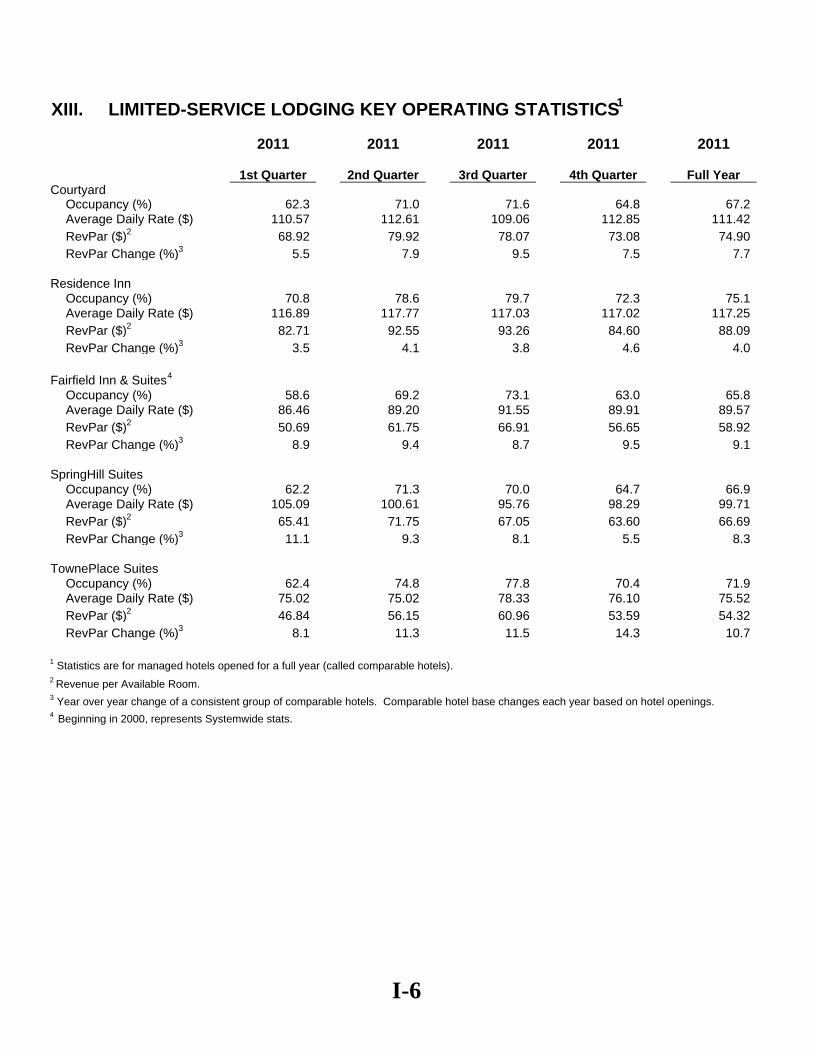
XIII. LIMITED-SERVICE LODGING KEY OPERATING STATISTICS1
2011 2011 2011 2011 2011
1st Quarter 2nd Quarter 3rd Quarter 4th Quarter Full YearCourtyard
Occupancy (%) 62.3 71.0 71.6 64.8 67.2 Average Daily Rate ($) 110.57 112.61 109.06 112.85 111.42 RevPar ($)2 68.92 79.92 78.07 73.08 74.90 RevPar Change (%)3 5.5 7.9 9.5 7.5 7.7
Residence InnOccupancy (%) 70.8 78.6 79.7 72.3 75.1 Average Daily Rate ($) 116.89 117.77 117.03 117.02 117.25RevPar ($)2 82.71 92.55 93.26 84.60 88.09RevPar Change (%)3 3.5 4.1 3.8 4.6 4.0
Fairfield Inn & Suites4
Occupancy (%) 58.6 69.2 73.1 63.0 65.8 Average Daily Rate ($) 86.46 89.20 91.55 89.91 89.57RevPar ($)2 50.69 61.75 66.91 56.65 58.92RevPar Change (%)3 8.9 9.4 8.7 9.5 9.1
SpringHill SuitesOccupancy (%) 62.2 71.3 70.0 64.7 66.9 Average Daily Rate ($) 105.09 100.61 95.76 98.29 99.71RevPar ($)2 65.41 71.75 67.05 63.60 66.69RevPar Change (%)3 11.1 9.3 8.1 5.5 8.3
TownePlace SuitesOccupancy (%) 62.4 74.8 77.8 70.4 71.9 Average Daily Rate ($) 75.02 75.02 78.33 76.10 75.52RevPar ($)2 46.84 56.15 60.96 53.59 54.32RevPar Change (%)3 8.1 11.3 11.5 14.3 10.7
1 Statistics are for managed hotels opened for a full year (called comparable hotels).2 Revenue per Available Room.
4 Beginning in 2000, represents Systemwide stats.
3 Year over year change of a consistent group of comparable hotels. Comparable hotel base changes each year based on hotel openings.
I-6

XIII. LIMITED-SERVICE LODGING KEY OPERATING STATISTICS1
2012 2012 2012 2012 20121st Quarter 2nd Quarter 3rd Quarter 4th Quarter Full Year
CourtyardOccupancy (%) 63.5 71.8 71.3 65.2 67.7Average Daily Rate ($) 115.11 118.05 115.70 118.88 117.11RevPar ($)2 73.05 84.82 82.46 77.52 79.32RevPar Change (%)3 5.4 6.0 5.2 5.8 5.6
Residence InnOccupancy (%) 70.3 78.2 80.4 73.1 75.4Average Daily Rate ($) 120.39 124.85 124.37 122.63 123.55RevPar ($)2 84.67 97.62 100.05 89.66 93.14RevPar Change (%)3 1.9 4.9 6.8 4.9 4.7
Fairfield Inn & Suites4
Occupancy (%) 61.3 71.3 73.7 63.9 67.3Average Daily Rate ($) 90.94 94.35 96.97 94.92 94.49RevPar ($)2 55.71 67.24 71.51 60.62 63.56RevPar Change (%)3 10.0 8.4 6.3 6.0 7.5
SpringHill SuitesOccupancy (%) 62.5 74.8 75.8 68.5 70.5Average Daily Rate ($) 106.52 104.21 99.38 100.89 103.04RevPar ($)2 66.54 77.89 75.31 69.06 72.63RevPar Change (%)3 2.9 8.5 12.1 7.2 7.0
TownePlace SuitesOccupancy (%) 65.7 73.9 79.1 65.9 70.8Average Daily Rate ($) 79.27 81.62 84.30 83.35 83.04RevPar ($)2 52.05 60.32 66.65 54.90 58.76RevPar Change (%)3 12.5 6.8 4.0 -0.1 5.1
1 Statistics are for managed hotels opened for a full year (called comparable hotels).2 Revenue per Available Room.
4 Beginning in 2000, represents Systemwide stats.
3 Year over year change of a consistent group of comparable hotels. Comparable hotel base changes each year based on hotel openings.
I-7

XIII. LIMITED-SERVICE LODGING KEY OPERATING STATISTICS1
2013 2013 2013 2013 20131st Quarter5 2nd Quarter6 3rd Quarter7 4th Quarter8 Full Year9
CourtyardOccupancy (%) 63.3 73.8 72.0 65.2 68.6Average Daily Rate ($) 121.41 123.26 121.93 120.87 122.07RevPar ($)2 76.82 90.95 87.74 78.76 83.75RevPar Change (%)3 3.5 5.7 6.2 5.6 5.3
Residence InnOccupancy (%) 72.3 80.5 80.0 71.6 76.2Average Daily Rate ($) 126.59 129.03 127.88 123.98 127.35RevPar ($)2 91.58 103.82 102.29 88.74 97.09RevPar Change (%)3 5.7 3.1 2.5 1.3 3.2
Fairfield Inn & Suites4
Occupancy (%) 62.3 72.9 73.0 63.0 67.9Average Daily Rate ($) 95.22 99.31 101.02 97.09 98.58RevPar ($)2 59.29 72.40 73.72 61.20 66.95RevPar Change (%)3 4.3 4.3 5.0 3.2 4.3
SpringHill SuitesOccupancy (%) 67.8 77.4 74.5 67.4 71.9Average Daily Rate ($) 111.37 108.69 102.04 104.64 106.75RevPar ($)2 75.55 84.09 76.00 70.51 76.73RevPar Change (%)3 10.1 2.7 1.3 2.9 4.1
TownePlace SuitesOccupancy (%) 62.9 70.8 76.6 64.5 68.7Average Daily Rate ($) 89.63 86.83 90.17 86.70 88.37RevPar ($)2 56.38 61.46 69.10 55.92 60.74RevPar Change (%)3 2.5 (0.2) 5.9 6.3 3.6
1 Statistics are for managed hotels opened for a full year (called comparable hotels).2 Revenue per Available Room.
4 Beginning in 2000, represents Systemwide stats.5 Statistics are for the three months ended March 31, 2013. RevPar Change (%) has been adjusted to compare the three months ended March 31, 2013 to the three months ended March 31, 2012.6 Statistics are for the three months ended June 30, 2013. RevPar Change (%) has been adjusted to compare the three months ended June 30, 2013 to the three months ended June 30, 2012.7 Statistics are for the three months ended September 30, 2013. RevPar Change (%) has been adjusted to compare the three months ended September 30, 2013 to the three months ended September 30, 2012.8 Statistics are for the three months ended December 31, 2013. RevPar Change (%) has been adjusted to compare the three months ended December 31, 2013 to the three months ended December 31, 2012.9 Statistics are for the year ended December 31, 2013. RevPar Change (%) has been adjusted to compare the year ended December 31, 2013 to the year ended December 31, 2012.
3 Year over year change of a consistent group of comparable hotels. Comparable hotel base changes each year based on hotel openings.
I-8

XIII. LIMITED-SERVICE LODGING KEY OPERATING STATISTICS1
2014 2014 2014 2014 20141st Quarter5 2nd Quarter 3rd Quarter 4th Quarter Full Year6
CourtyardOccupancy (%) 66.5 76.4 75.9 68.2 71.8Average Daily Rate ($) 127.44 130.37 130.78 128.83 129.72RevPar ($)2 84.77 99.66 99.24 87.89 93.18RevPar Change (%)3 8.6 8.2 11.7 9.6 9.6
Residence InnOccupancy (%) 75.3 81.7 82.2 74.1 78.4Average Daily Rate ($) 129.90 135.18 137.96 134.60 135.58RevPar ($)2 97.75 110.48 113.37 99.79 106.24RevPar Change (%)3 6.2 5.0 8.6 10.5 7.4
Fairfield Inn & Suites4
Occupancy (%) 63.7 75.1 75.9 65.6 70.1Average Daily Rate ($) 98.56 104.38 106.04 101.46 102.80RevPar ($)2 62.82 78.38 80.46 66.55 72.11RevPar Change (%)3 5.2 7.3 7.9 8.1 7.3
SpringHill SuitesOccupancy (%) 69.6 79.7 76.5 69.1 73.8Average Daily Rate ($) 113.49 112.00 109.51 112.38 112.14RevPar ($)2 79.03 89.27 83.82 77.65 82.78RevPar Change (%)3 3.4 6.2 10.3 9.4 7.5
TownePlace SuitesOccupancy (%) 68.9 78.9 80.9 65.2 72.6Average Daily Rate ($) 94.64 95.01 97.87 93.63 95.23RevPar ($)2 65.23 74.95 79.19 61.05 69.09RevPar Change (%)3 15.8 24.1 17.1 15.3 19.0
1 Statistics are for managed hotels opened for a full year (called comparable hotels).2 Revenue per Available Room.
4 Beginning in 2000, represents Systemwide stats.5 RevPar Change (%) has been adjusted to compare the three months ended March 31, 2014 to the three months ended March 31, 2013.6 RevPar Change (%) has been adjusted to compare the twelve months ended December 31, 2014 to the twelve months ended December 31, 2013.
3 Year over year change of a consistent group of comparable hotels. Comparable hotel base changes each year based on hotel openings.
I-9

XIII. LIMITED-SERVICE LODGING KEY OPERATING STATISTICS1
2015 2015 2015 2015 20151st Quarter 2nd Quarter 3rd Quarter 4th Quarter Full Year
CourtyardOccupancy (%) 68.8 77.1 75.9 69.1 72.8Average Daily Rate ($) 137.07 142.49 140.10 136.09 139.08RevPar ($)2 94.26 109.92 106.31 94.01 101.18RevPar Change (%)3 9.9 7.1 4.3 4.2 6.3
Residence InnOccupancy (%) 75.1 81.9 81.8 75.0 78.5Average Daily Rate ($) 141.14 147.15 145.06 138.68 143.14RevPar ($)2 106.00 120.56 118.63 104.08 112.33RevPar Change (%)3 7.0 8.5 5.2 5.2 6.5
Fairfield Inn & Suites4
Occupancy (%) 65.5 75.0 75.9 65.5 70.6Average Daily Rate ($) 103.86 110.49 112.16 106.58 108.71RevPar ($)2 67.98 82.83 85.17 69.76 76.70RevPar Change (%)3 8.2 4.4 3.8 2.9 4.7
SpringHill SuitesOccupancy (%) 70.7 80.9 79.1 73.2 76.0Average Daily Rate ($) 126.04 129.27 122.15 123.41 125.24RevPar ($)2 89.15 104.62 96.68 90.38 95.21RevPar Change (%)3 6.6 8.9 7.0 7.3 7.5
TownePlace SuitesOccupancy (%) 66.3 80.8 78.0 65.5 72.7Average Daily Rate ($) 100.56 102.81 107.96 99.71 102.99RevPar ($)2 66.66 83.02 84.24 65.29 74.83RevPar Change (%)3 9.5 11.4 5.6 6.9 8.3
1 Statistics are for managed hotels opened for a full year (called comparable hotels).2 Revenue per Available Room.
4 Beginning in 2000, represents Systemwide stats.
3 Year over year change of a consistent group of comparable hotels. Comparable hotel base changes each year based on hotel openings.
I-10

2016 2016 2016 2016 20161st Quarter 2nd Quarter 3rd Quarter 4th Quarter 5 Full Year 5
CourtyardOccupancy (%) 69.5 78.6 76.0 64.8 73.1Average Daily Rate ($) 140.88 144.88 142.70 138.35 141.83RevPar ($)2 97.88 113.81 108.40 94.56 103.65RevPar Change (%)3 3.3 3.4 1.8 0.2 2.2
Residence InnOccupancy (%) 75.0 82.5 83.4 75.2 79.0Average Daily Rate ($) 147.30 152.21 153.61 144.56 149.56RevPar ($)2 110.48 125.64 128.13 108.67 118.14RevPar Change (%)3 3.1 3.0 5.8 3.0 3.8
Fairfield Inn & Suites4
Occupancy (%) 64.4 74.7 75.6 65.4 70.1Average Daily Rate ($) 106.62 113.62 115.04 108.68 111.2RevPar ($)2 68.70 84.92 86.98 71.11 77.96RevPar Change (%)3 0.5 1.4 1.2 1.4 1.2
SpringHill SuitesOccupancy (%) 73.1 82.2 79.7 71.3 76.4Average Daily Rate ($) 127.49 131.25 125.63 127.38 128.58RevPar ($)2 93.18 107.94 100.12 90.87 98.29RevPar Change (%)3 4.5 3.2 3.6 0.2 2.8
TownePlace SuitesOccupancy (%) 66.3 81.0 81.1 68.9 74.3Average Daily Rate ($) 102.87 106.92 113.72 104.97 107.43RevPar ($)2 68.25 86.56 92.21 72.27 79.83RevPar Change (%)3 2.4 4.3 9.5 10.7 6.7
1 Statistics are for managed hotels opened for a full year (called comparable hotels).2 Revenue per Available Room.3 Year over year change of a consistent group of comparable hotels. Comparable hotel base changes each year based on hotel openings.4 Beginning in 2000, represents Systemwide stats.5 Statistics for 4th Quarter and Full Year 2016 reflect only Legacy-Marriott brands.
XIII. LIMITED-SERVICE LODGING KEY OPERATING STATISTICS1
I-11
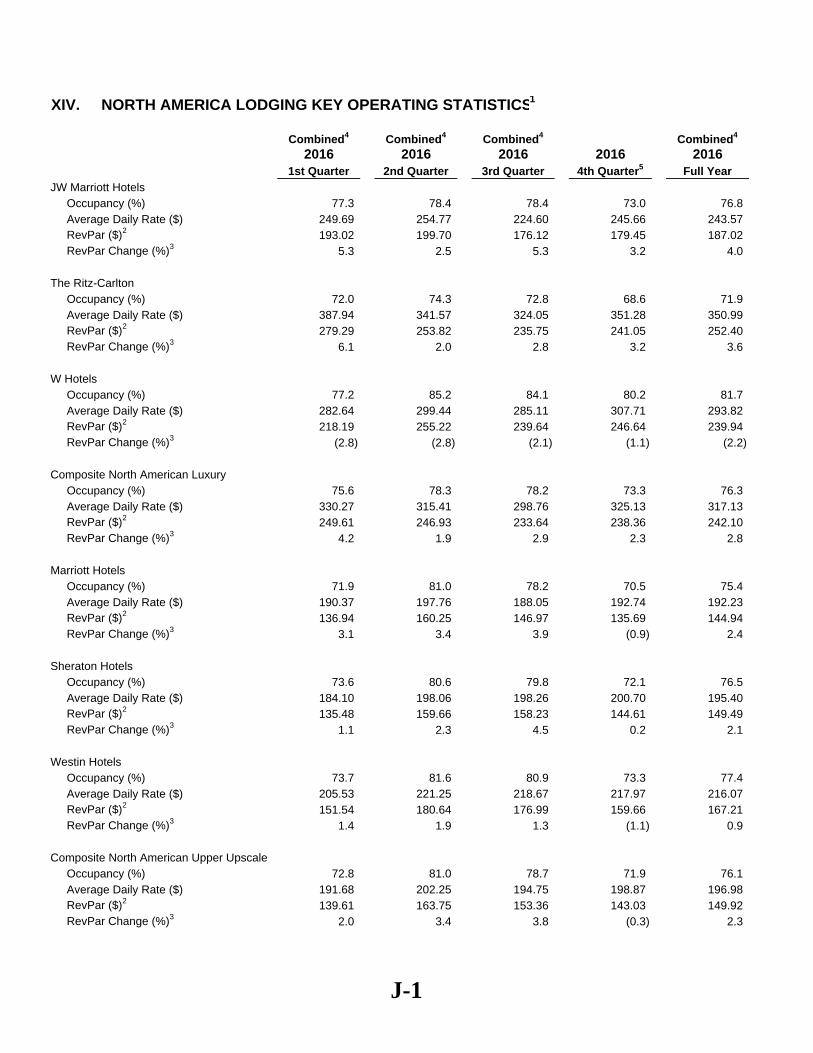
XIV. NORTH AMERICA LODGING KEY OPERATING STATISTICS1
Combined4 Combined4 Combined4 Combined4
2016 2016 2016 2016 20161st Quarter 2nd Quarter 3rd Quarter 4th Quarter5 Full Year
JW Marriott HotelsOccupancy (%) 77.3 78.4 78.4 73.0 76.8 Average Daily Rate ($) 249.69 254.77 224.60 245.66 243.57 RevPar ($)2 193.02 199.70 176.12 179.45 187.02 RevPar Change (%)3 5.3 2.5 5.3 3.2 4.0
The Ritz-CarltonOccupancy (%) 72.0 74.3 72.8 68.6 71.9 Average Daily Rate ($) 387.94 341.57 324.05 351.28 350.99 RevPar ($)2 279.29 253.82 235.75 241.05 252.40 RevPar Change (%)3 6.1 2.0 2.8 3.2 3.6
W HotelsOccupancy (%) 77.2 85.2 84.1 80.2 81.7 Average Daily Rate ($) 282.64 299.44 285.11 307.71 293.82 RevPar ($)2 218.19 255.22 239.64 246.64 239.94 RevPar Change (%)3 (2.8) (2.8) (2.1) (1.1) (2.2)
Composite North American LuxuryOccupancy (%) 75.6 78.3 78.2 73.3 76.3 Average Daily Rate ($) 330.27 315.41 298.76 325.13 317.13 RevPar ($)2 249.61 246.93 233.64 238.36 242.10 RevPar Change (%)3 4.2 1.9 2.9 2.3 2.8
Marriott HotelsOccupancy (%) 71.9 81.0 78.2 70.5 75.4 Average Daily Rate ($) 190.37 197.76 188.05 192.74 192.23 RevPar ($)2 136.94 160.25 146.97 135.69 144.94 RevPar Change (%)3 3.1 3.4 3.9 (0.9) 2.4
Sheraton HotelsOccupancy (%) 73.6 80.6 79.8 72.1 76.5 Average Daily Rate ($) 184.10 198.06 198.26 200.70 195.40 RevPar ($)2 135.48 159.66 158.23 144.61 149.49 RevPar Change (%)3 1.1 2.3 4.5 0.2 2.1
Westin HotelsOccupancy (%) 73.7 81.6 80.9 73.3 77.4 Average Daily Rate ($) 205.53 221.25 218.67 217.97 216.07 RevPar ($)2 151.54 180.64 176.99 159.66 167.21 RevPar Change (%)3 1.4 1.9 1.3 (1.1) 0.9
Composite North American Upper UpscaleOccupancy (%) 72.8 81.0 78.7 71.9 76.1 Average Daily Rate ($) 191.68 202.25 194.75 198.87 196.98 RevPar ($)2 139.61 163.75 153.36 143.03 149.92 RevPar Change (%)3 2.0 3.4 3.8 (0.3) 2.3
J-1

Composite North American Full-ServiceOccupancy (%) 73.3 80.5 78.6 72.2 76.2 Average Daily Rate ($) 218.09 222.63 213.87 222.57 219.25 RevPar ($)2 159.95 179.14 168.20 160.65 166.97 RevPar Change (%)3 2.6 3.0 3.6 0.4 2.4
Composite North American Full-Service - Systemwide6
Occupancy (%) 70.8 78.6 77.4 69.7 74.1 Average Daily Rate ($) 190.96 192.92 186.80 191.06 190.41 RevPar ($)2 135.25 151.56 144.61 133.08 141.11 RevPar Change (%)3 2.6 3.4 3.4 0.9 2.6
CourtyardOccupancy (%) 69.5 78.6 76.0 64.8 73.1 Average Daily Rate ($) 140.88 144.88 142.70 138.35 141.83 RevPar ($)2 97.88 113.81 108.40 94.56 103.65 RevPar Change (%)3 3.3 3.4 1.8 0.2 2.2
Residence InnOccupancy (%) 74.9 82.4 83.4 75.2 79.0 Average Daily Rate ($) 147.36 152.04 153.61 144.56 149.56 RevPar ($)2 110.42 125.33 128.13 108.67 118.14 RevPar Change (%)3 3.1 3.0 5.8 3.0 3.8
Fairfield Inn & Suites7
Occupancy (%) 64.5 74.8 75.6 65.4 70.1 Average Daily Rate ($) 106.50 113.52 115.08 108.68 111.20 RevPar ($)2 68.72 84.97 87.01 71.11 77.96 RevPar Change (%)3 0.5 1.6 1.2 1.4 1.2
Composite North American Limited-ServiceOccupancy (%) 71.2 79.9 78.3 70.5 75.0 Average Daily Rate ($) 140.53 144.37 143.24 138.10 141.68 RevPar ($)2 100.02 115.33 112.12 97.36 106.20 RevPar Change (%)3 3.4 3.3 3.2 1.2 2.8
Composite North American Limited-Service - Systemwide6
Occupancy (%) 69.8 79.1 78.7 69.5 74.2 Average Daily Rate ($) 127.10 132.66 133.11 127.01 130.15 RevPar ($)2 88.67 104.87 104.74 88.22 96.62 RevPar Change (%)3 1.9 2.9 1.7 1.3 2.0
Composite North American Company-OperatedOccupancy (%) 72.6 80.3 78.5 71.6 75.8 Average Daily Rate ($) 193.72 197.64 191.29 195.91 194.64 RevPar ($)2 140.73 158.66 150.21 140.35 147.48 RevPar Change (%)3 2.8 3.1 3.5 0.5 2.5
Composite North American Systemwide6
Occupancy (%) 70.2 78.8 78.1 69.5 74.2 Average Daily Rate ($) 155.82 159.44 156.84 155.62 157.00 RevPar ($)2 109.44 125.69 122.52 108.23 116.47 RevPar Change (%)3 2.3 3.2 2.6 1.1 2.3
J-1

1 Statistics are for managed hotels opened for a full year (called comparable hotels).2 Revenue per Available Room.3 Year over year change of a consistent group of comparable hotels. Comparable hotel base changes each year based on hotel openings.4 Combined Company statistics assume Marriott's acquisition of Starwood had been completed on January 1,2015.5 Beginning with the 4th Quarter 2016, all composite statistics reflect the combine Legacy-Marriott and Legacy-Starwood portfolios.6 Statistics are for managed and franchised hotels opened for a full year (called comparable hotels).7 Beginning in 2000, represents Systemwide stats.
J-1

XIV. NORTH AMERICA LODGING KEY OPERATING STATISTICS1
2017 2017 2017 2017 20171st Quarter 2nd Quarter 3rd Quarter 4th Quarter Full Year
JW Marriott HotelsOccupancy (%) 77.7 79.6 76.8 73.2 76.9Average Daily Rate ($) 248.00 233.81 204.83 219.89 225.32RevPar ($)2 192.58 186.05 157.22 160.87 173.27RevPar Change (%)3 4.7 2.8 (0.7) 4.1 3.1
The Ritz-CarltonOccupancy (%) 75.3 74.9 73.4 72.9 74.4Average Daily Rate ($) 394.67 357.45 330.37 355.70 355.44RevPar ($)2 297.26 267.75 242.43 259.41 264.45RevPar Change (%)3 3.0 4.0 1.8 7.3 4.9
W HotelsOccupancy (%) 76.6 85.5 84.6 81.1 82.2Average Daily Rate ($) 279.56 305.49 284.93 312.50 297.52RevPar ($)2 214.14 261.04 241.20 253.42 244.44RevPar Change (%)3 0.1 0.1 (3.3) 0.4 -0.7
Composite North American LuxuryOccupancy (%) 76.4 78.8 78.2 75.1 77.3Average Daily Rate ($) 319.63 302.92 282.23 307.63 300.34RevPar ($)2 244.32 238.62 220.67 231.12 232.19RevPar Change (%)3 3.6 2.3 (0.2) 4.7 2.8
Marriott HotelsOccupancy (%) 69.9 77.0 75.1 68.7 72.6Average Daily Rate ($) 175.01 176.09 170.87 173.21 173.49RevPar ($)2 122.25 135.66 128.24 119.02 126.00RevPar Change (%)3 2.5 0.3 (0.3) 4.5 1.8
Sheraton HotelsOccupancy (%) 68.7 77.1 77.4 69.1 73.2Average Daily Rate ($) 150.79 160.95 159.29 160.49 158.50RevPar ($)2 103.66 124.11 123.23 110.95 115.99RevPar Change (%)3 3.5 0.4 (0.9) 3.4 1.5
Westin HotelsOccupancy (%) 74.0 79.8 80.0 72.2 76.5Average Daily Rate ($) 207.21 209.87 203.02 208.71 207.74RevPar ($)2 153.44 167.56 162.47 150.66 159.00RevPar Change (%)3 4.6 1.2 (0.4) 2.2 1.8
Composite North American Upper UpscaleOccupancy (%) 70.7 77.5 76.7 70.0 73.7Average Daily Rate ($) 177.79 181.19 175.53 179.04 177.87RevPar ($)2 125.61 140.41 134.65 125.32 131.11RevPar Change (%)3 3.9 0.7 (0.3) 3.7 2.0
Composite North American Full-ServiceOccupancy (%) 71.3 77.6 76.9 70.5 74.1Average Daily Rate ($) 194.02 194.58 186.88 193.38 191.25RevPar ($)2 138.28 151.06 143.65 136.39 141.70RevPar Change (%)3 3.9 1.0 (0.3) 3.9 2.1
J-2
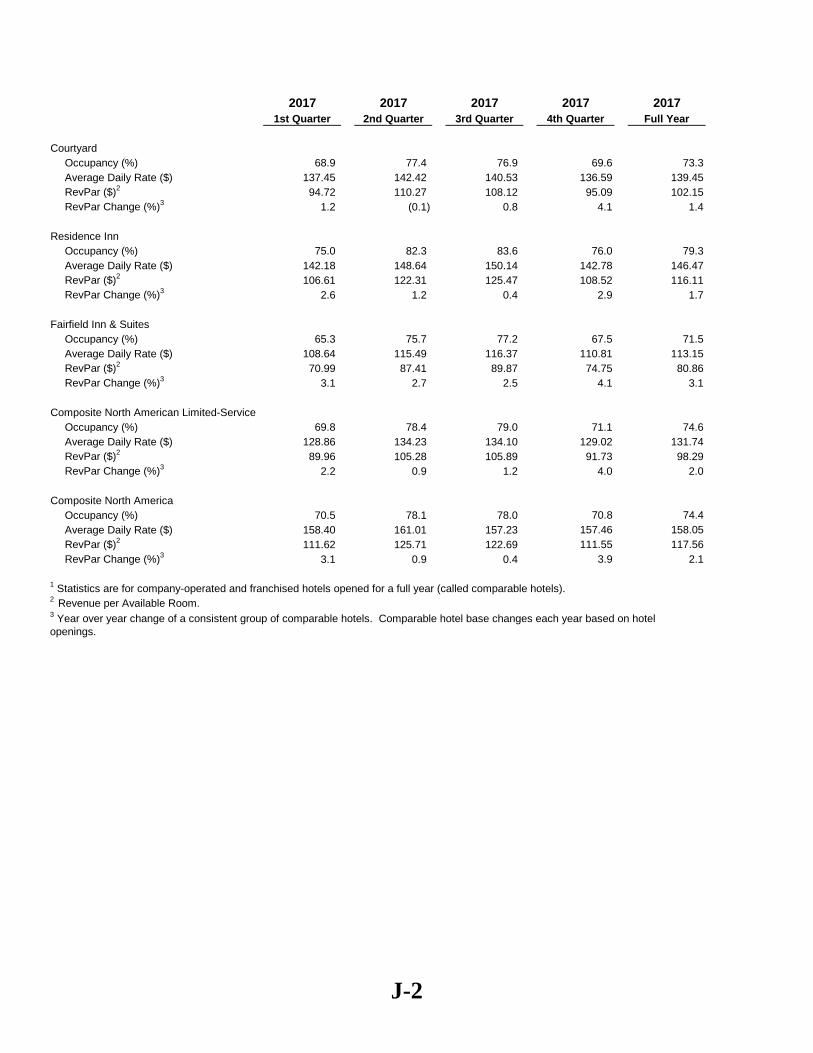
2017 2017 2017 2017 20171st Quarter 2nd Quarter 3rd Quarter 4th Quarter Full Year
CourtyardOccupancy (%) 68.9 77.4 76.9 69.6 73.3Average Daily Rate ($) 137.45 142.42 140.53 136.59 139.45RevPar ($)2 94.72 110.27 108.12 95.09 102.15RevPar Change (%)3 1.2 (0.1) 0.8 4.1 1.4
Residence InnOccupancy (%) 75.0 82.3 83.6 76.0 79.3Average Daily Rate ($) 142.18 148.64 150.14 142.78 146.47RevPar ($)2 106.61 122.31 125.47 108.52 116.11RevPar Change (%)3 2.6 1.2 0.4 2.9 1.7
Fairfield Inn & SuitesOccupancy (%) 65.3 75.7 77.2 67.5 71.5Average Daily Rate ($) 108.64 115.49 116.37 110.81 113.15RevPar ($)2 70.99 87.41 89.87 74.75 80.86RevPar Change (%)3 3.1 2.7 2.5 4.1 3.1
Composite North American Limited-ServiceOccupancy (%) 69.8 78.4 79.0 71.1 74.6Average Daily Rate ($) 128.86 134.23 134.10 129.02 131.74RevPar ($)2 89.96 105.28 105.89 91.73 98.29RevPar Change (%)3 2.2 0.9 1.2 4.0 2.0
Composite North AmericaOccupancy (%) 70.5 78.1 78.0 70.8 74.4Average Daily Rate ($) 158.40 161.01 157.23 157.46 158.05RevPar ($)2 111.62 125.71 122.69 111.55 117.56RevPar Change (%)3 3.1 0.9 0.4 3.9 2.1
1 Statistics are for company-operated and franchised hotels opened for a full year (called comparable hotels).2 Revenue per Available Room.3 Year over year change of a consistent group of comparable hotels. Comparable hotel base changes each year based on hotel openings.
J-2

XIV. INTERNATIONAL LODGING KEY OPERATING STATISTICS BY REGION
2003 2004 2005 2005 2005 2005 2005
Full Year Full Year 1st Quarter 2nd Quarter 3rd Quarter 4th Quarter Full Year
Caribbean & Latin AmericaOccupancy (%) 67.5 71.2 76.7 74.5 74.5 72.1 73.6 Average Daily Rate ($) 126.45 138.98 163.09 155.67 135.15 141.62 145.78 RevPar ($)2 85.32 98.91 125.16 115.98 100.71 102.05 107.24 RevPar Change (%)3 9.5 14.9 20.1 14.9 10.3 10.2 12.1
Continental EuropeOccupancy (%) 67.9 70.8 58.9 70.2 74.9 72.9 70.5 Average Daily Rate ($) 117.79 130.49 139.67 144.10 128.51 137.07 137.09 RevPar ($)2 79.92 92.38 82.30 101.18 96.26 99.87 96.69 RevPar Change (%)3 (4.9) 6.8 7.0 0.2 4.3 3.2 3.1
United KingdomOccupancy (%) 76.6 76.9 70.0 76.6 80.6 77.8 76.9 Average Daily Rate ($) 148.14 173.48 183.83 189.64 175.45 182.44 182.61 RevPar ($)2 113.48 133.37 128.72 145.21 141.41 141.92 140.49 RevPar Change (%)3 (2.4) 10.7 3.3 5.6 5.2 4.5 4.8
Middle East & AfricaOccupancy (%) 66.5 73.2 75.4 80.2 70.9 69.6 73.2 Average Daily Rate ($) 71.39 83.44 110.70 105.17 95.28 127.84 116.07 RevPar ($)2 47.49 61.10 83.50 84.37 67.51 88.93 84.96 RevPar Change (%)3 15.7 28.1 28.8 32.3 20.3 28.6 29.5
Asia Pacific4
Occupancy (%) 65.5 75.5 71.7 76.7 76.3 76.7 75.8 Average Daily Rate ($) 85.25 96.67 105.67 117.59 104.98 122.79 114.34 RevPar ($)2 55.86 72.98 75.73 90.14 80.14 94.14 86.63 RevPar Change (%)3 (10.5) 27.0 16.2 17.7 10.2 10.8 13.1
International Luxury5
Occupancy (%) 60.8 71.0 71.2 75.6 67.7 72.3 71.6 Average Daily Rate ($) 188.91 205.06 225.15 217.09 194.14 207.67 200.08 RevPar ($)2 114.88 145.68 160.30 164.08 131.43 150.08 143.30 RevPar Change (%)3 (9.0) 21.3 26.9 22.6 14.2 12.0 18.3
Total International6
Occupancy (%) N/A 73.3 69.5 74.9 75.6 74.5 74.0 Average Daily Rate ($) N/A 129.35 139.96 142.50 129.35 141.39 137.62 RevPar ($)2 N/A 94.75 97.21 106.78 97.73 105.37 101.84 RevPar Change (%)3 N/A 16.6 14.9 12.2 9.9 9.7 11.0
2 Revenue per Available Room.
4 Excludes Hawaii.5 Beginning in Quarter 4, 2006, includes The Ritz-Carlton International and Bulgari Hotels & Resorts. Prior to Quarter 4, 2006, includes The Ritz-Carlton International.6 Includes Hawaii.
3 Year over year change of a consistent group of comparable hotels. Comparable hotel base changes each year based on hotel openings.
1 International financial results are reported on a period basis, while international statistics are reported on a monthly basis. Statistics are in constant dollars. Excludes North
International Comparable Company-
Operated Properties1
K-1

XIV. INTERNATIONAL LODGING KEY OPERATING STATISTICS BY REGION
2006 2006 2006 2006 20061st Quarter 2nd Quarter 3rd Quarter 4th Quarter Full Year
Caribbean & Latin AmericaOccupancy (%) 79.0 77.7 74.2 71.4 74.9 Average Daily Rate ($) 178.40 167.65 142.25 157.41 159.93 RevPar ($)2 140.88 130.27 105.48 112.38 119.81 RevPar Change (%)3 10.7 16.0 9.5 11.2 12.0
Continental EuropeOccupancy (%) 60.5 73.8 75.3 75.3 72.6 Average Daily Rate ($) 129.40 143.45 151.02 153.93 147.28 RevPar ($)2 78.30 105.81 113.77 115.86 106.95 RevPar Change (%)3 4.7 10.3 13.2 8.4 9.6
United KingdomOccupancy (%) 71.0 78.7 84.4 80.9 79.6 Average Daily Rate ($) 206.16 212.32 228.26 240.89 225.38 RevPar ($)2 146.40 167.12 192.62 194.78 179.44 RevPar Change (%)3 14.6 13.7 17.6 13.1 14.6
Middle East & AfricaOccupancy (%) 64.6 74.1 69.1 66.8 68.9 Average Daily Rate ($) 149.86 146.13 119.90 155.71 143.12 RevPar ($)2 96.83 108.24 82.80 103.95 98.58 RevPar Change (%)3 7.1 13.5 9.0 10.6 10.5
Asia Pacific4
Occupancy (%) 73.3 76.2 76.0 76.1 75.8 Average Daily Rate ($) 118.42 127.60 115.90 139.90 127.09 RevPar ($)2 86.77 97.21 88.08 106.40 96.28 RevPar Change (%)3 15.5 10.8 12.7 13.0 12.7
International Luxury5
Occupancy (%) 65.9 71.9 68.3 74.8 71.7 Average Daily Rate ($) 214.74 227.60 208.74 256.05 241.90 RevPar ($)2 141.52 163.71 142.50 191.52 173.35 RevPar Change (%)3 2.6 7.1 2.2 16.8 9.1
Total International6
Occupancy (%) 69.3 75.5 75.5 74.9 74.4 Average Daily Rate ($) 146.60 152.37 146.06 163.04 153.99 RevPar ($)2 101.53 115.01 110.22 122.16 114.61 RevPar Change (%)3 9.9 11.1 11.3 11.4 11.1
1 International financial results are reported on a period basis, while international statistics are reported on a monthly basis. Statistics are in constant dollars. Excludes North America.2 Revenue per Available Room.3 Year over year change of a consistent group of comparable hotels. Comparable hotel base changes each year based on hotel openings.4 Excludes Hawaii.5 Beginning in Quarter 4, 2006, includes The Ritz-Carlton International and Bulgari Hotels & Resorts. Prior to Quarter 4, 2006, includes The Ritz-Carlton International.6 Includes Hawaii.
International Comparable Company-
Operated Properties1
K-2

XIV. INTERNATIONAL LODGING KEY OPERATING STATISTICS BY REGION
2007 2007 2007 2007 20071st Quarter 2nd Quarter 3rd Quarter 4th Quarter Full Year
Caribbean & Latin AmericaOccupancy (%) 76.8 78.4 76.8 74.8 76.5 Average Daily Rate ($) 182.53 174.44 151.88 166.81 167.56 RevPar ($)2 140.20 136.75 116.66 124.79 128.25 RevPar Change (%)3 11.7 11.2 13.2 14.2 12.7
Continental EuropeOccupancy (%) 62.5 75.8 76.9 76.9 74.4 Average Daily Rate ($) 153.57 171.08 165.16 189.57 173.92 RevPar ($)2 95.96 129.68 127.08 145.74 129.34 RevPar Change (%)3 10.4 9.0 2.0 10.1 7.7
United KingdomOccupancy (%) 71.2 76.7 81.4 78.1 77.8 Average Daily Rate ($) 186.95 191.32 197.83 214.00 203.27 RevPar ($)2 133.06 146.83 160.99 167.23 158.08 RevPar Change (%)3 6.2 5.2 5.4 5.2 5.2
Middle East & AfricaOccupancy (%) 69.8 76.8 70.5 72.2 73.3 Average Daily Rate ($) 144.09 143.60 118.92 144.39 135.74 RevPar ($)2 100.54 110.31 83.81 104.19 99.57 RevPar Change (%)3 21.3 16.5 14.5 15.1 16.8
Asia Pacific4
Occupancy (%) 71.5 75.3 76.0 76.2 75.2 Average Daily Rate ($) 146.35 155.79 135.68 159.51 147.79 RevPar ($)2 104.66 117.31 103.09 121.60 111.15 RevPar Change (%)3 10.7 8.6 7.0 6.1 7.8
International Luxury5
Occupancy (%) 68.9 76.0 72.9 72.0 72.7 Average Daily Rate ($) 290.95 311.43 271.09 293.69 292.24 RevPar ($)2 200.44 236.74 197.49 211.48 212.54 RevPar Change (%)3 11.7 12.2 17.0 9.3 12.2
Total International6
Occupancy (%) 69.5 76.5 76.8 76.0 75.4 Average Daily Rate ($) 175.38 183.03 170.12 190.18 180.73 RevPar ($)2 121.89 139.99 130.70 144.54 136.29 RevPar Change (%)3 10.5 9.6 7.5 8.5 8.9
1 International financial results are reported on a period basis, while international statistics are reported on a monthly basis. Statistics are in constant dollars. Excludes North America.2 Revenue per Available Room.3 Year over year change of a consistent group of comparable hotels. Comparable hotel base changes each year based on hotel openings.4 Excludes Hawaii.5 Beginning in Quarter 4, 2006, includes The Ritz-Carlton International and Bulgari Hotels & Resorts. Prior to Quarter 4, 2006, includes The Ritz-Carlton International.6 Includes Hawaii.
International Comparable Company-
Operated Properties1
K-3

XIV. INTERNATIONAL LODGING KEY OPERATING STATISTICS BY REGION
2008 2008 2008 2008 20081st Quarter 2nd Quarter 3rd Quarter 4th Quarter Full Year
Caribbean & Latin AmericaOccupancy (%) 77.4 78.1 74.6 69.1 74.1 Average Daily Rate ($) 211.49 203.49 183.61 189.98 195.63 RevPar ($)2 163.74 159.01 137.04 131.36 145.05 RevPar Change (%)3 14.0 8.0 10.0 10.2 10.2
Continental EuropeOccupancy (%) 64.1 73.2 73.8 70.8 71.0 Average Daily Rate ($) 191.13 214.52 211.57 192.23 203.88 RevPar ($)2 122.42 157.12 156.17 136.17 144.82 RevPar Change (%)3 11.5 4.6 4.9 (7.8) 1.2
United KingdomOccupancy (%) 68.3 76.1 79.0 74.1 74.8 Average Daily Rate ($) 185.23 185.57 182.42 156.94 175.32 RevPar ($)2 126.56 141.23 144.05 116.32 131.15 RevPar Change (%)3 1.5 2.9 (0.4) (7.3) (1.4)
Middle East & AfricaOccupancy (%) 75.2 83.1 73.4 71.3 75.4 Average Daily Rate ($) 173.22 174.69 143.48 171.22 165.72 RevPar ($)2 130.20 145.16 105.38 122.07 125.01 RevPar Change (%)3 13.9 22.2 17.9 6.6 14.4
Asia Pacific4
Occupancy (%) 72.6 74.5 71.3 66.0 70.6 Average Daily Rate ($) 163.29 160.89 154.45 146.31 155.27 RevPar ($)2 118.47 119.87 110.07 96.63 109.65 RevPar Change (%)3 9.6 5.4 4.0 (12.5) (0.2)
International Luxury5
Occupancy (%) 72.0 75.3 71.2 63.5 69.8 Average Daily Rate ($) 325.62 343.05 294.99 305.89 315.83 RevPar ($)2 234.48 258.37 210.17 194.15 220.60 RevPar Change (%)3 18.2 10.2 8.8 (3.8) 6.6
Total International6
Occupancy (%) 70.5 75.7 73.8 69.1 72.2 Average Daily Rate ($) 200.14 206.33 193.48 185.58 195.65 RevPar ($)2 141.08 156.22 142.71 128.17 141.18 RevPar Change (%)3 11.5 7.2 5.7 (5.3) 3.3
1 International financial results are reported on a period basis, while international statistics are reported on a monthly basis. Statistics are in constant dollars. Excludes North America.2 Revenue per Available Room.3 Year over year change of a consistent group of comparable hotels. Comparable hotel base changes each year based on hotel openings.4 Excludes Hawaii.5 Beginning in Quarter 4, 2006, includes The Ritz-Carlton International and Bulgari Hotels & Resorts. Prior to Quarter 4, 2006, includes The Ritz-Carlton International.6 Includes Hawaii.
International Comparable Company-
Operated Properties1
K-4

XIV. INTERNATIONAL LODGING KEY OPERATING STATISTICS BY REGION
2009 2009 2009 2009 20091st Quarter 2nd Quarter 3rd Quarter 4th Quarter Full Year
Caribbean & Latin AmericaOccupancy (%) 69.2 67.9 66.3 65.9 67.0 Average Daily Rate ($) 207.66 183.40 158.84 165.45 175.43 RevPar ($)2 143.65 124.51 105.28 109.05 117.59 RevPar Change (%)3 (14.4) (23.5) (23.9) (16.4) (19.8)
Continental EuropeOccupancy (%) 53.2 66.6 71.0 70.6 66.9 Average Daily Rate ($) 161.33 154.59 153.72 171.44 161.17 RevPar ($)2 85.87 102.98 109.13 121.11 107.83 RevPar Change (%)3 (19.6) (18.6) (18.4) (11.1) (16.0)
United KingdomOccupancy (%) 62.9 72.1 77.3 74.5 72.5 Average Daily Rate ($) 129.53 128.51 144.66 148.16 139.81 RevPar ($)2 81.45 92.61 111.78 110.38 101.41 RevPar Change (%)3 (14.8) (15.2) (12.3) (5.7) (11.1)
Middle East & AfricaOccupancy (%) 66.5 72.8 61.6 71.9 68.6 Average Daily Rate ($) 155.41 138.09 121.06 136.59 137.31 RevPar ($)2 103.42 100.59 74.52 98.17 94.21 RevPar Change (%)3 (10.5) (22.2) (27.8) (13.9) (18.9)
Asia Pacific4
Occupancy (%) 58.5 59.6 62.6 69.4 63.6 Average Daily Rate ($) 132.72 123.43 119.16 131.86 127.12 RevPar ($)2 77.66 73.57 74.55 91.49 80.80 RevPar Change (%)3 (21.5) (28.9) (29.6) (8.1) (21.1)
International Luxury5
Occupancy (%) 56.1 57.5 55.0 57.2 56.8 Average Daily Rate ($) 341.39 327.22 282.69 303.07 317.16 RevPar ($)2 191.56 188.29 155.56 173.30 179.99 RevPar Change (%)3 (17.0) (26.1) (26.7) (17.1) (22.1)
Total International6
Occupancy (%) 60.0 65.8 66.9 69.0 66.3 Average Daily Rate ($) 174.87 162.31 154.40 165.41 163.64 RevPar ($)2 104.85 106.80 103.26 114.21 108.45 RevPar Change (%)3 (17.0) (22.1) (22.3) (11.7) (18.0)
1 International financial results are reported on a period basis, while international statistics are reported on a monthly basis. Statistics are in constant dollars. Excludes North America.2 Revenue per Available Room.3 Year over year change of a consistent group of comparable hotels. Comparable hotel base changes each year based on hotel openings.4 Excludes Hawaii.5 Beginning in Quarter 4, 2006, includes The Ritz-Carlton International and Bulgari Hotels & Resorts. Prior to Quarter 4, 2006, includes The Ritz-Carlton International.6 Includes Hawaii.
International Comparable Company-
Operated Properties1
K-5

XIV. INTERNATIONAL LODGING KEY OPERATING STATISTICS BY REGION
2010 2010 2010 2010 20101st Quarter 2nd Quarter 3rd Quarter 4th Quarter Full Year
Caribbean & Latin AmericaOccupancy (%) 73.4 72.7 71.5 67.1 70.7 Average Daily Rate ($) 197.68 190.08 158.53 175.22 178.59 RevPar ($)2 145.17 138.23 113.33 117.64 126.19 RevPar Change (%)3 (3.0) 9.5 7.6 6.2 5.5
Continental EuropeOccupancy (%) 57.2 70.6 75.5 74.1 71.1 Average Daily Rate ($) 158.20 163.77 149.09 170.57 161.63 RevPar ($)2 90.47 115.68 112.54 126.41 114.92 RevPar Change (%)3 1.5 5.6 8.6 10.3 7.6
United KingdomOccupancy (%) 66.4 76.3 81.6 77.1 76.4 Average Daily Rate ($) 155.19 150.98 158.45 167.72 159.27 RevPar ($)2 103.06 115.15 129.35 129.39 121.68 RevPar Change (%)3 6.0 5.8 9.7 8.3 7.8
Middle East & AfricaOccupancy (%) 67.6 76.7 62.4 73.3 70.5 Average Daily Rate ($) 136.58 135.92 119.06 136.21 133.18 RevPar ($)2 92.29 104.18 74.25 99.88 93.86 RevPar Change (%)3 (11.6) (2.0) (2.2) 0.8 (2.6)
Asia Pacific4
Occupancy (%) 60.2 68.2 68.1 68.6 66.7 Average Daily Rate ($) 120.42 122.94 118.54 133.30 125.88 RevPar ($)2 72.52 83.87 80.76 91.43 83.96 RevPar Change (%)3 15.8 27.7 29.9 18.3 23.3
International Luxury5
Occupancy (%) 58.5 67.3 62.8 64.5 64.0 Average Daily Rate ($) 322.47 317.09 289.92 313.56 310.46 RevPar ($)2 188.74 213.49 182.05 202.34 198.82 RevPar Change (%)3 (0.7) 14.0 12.4 13.7 10.7
Total International6
Occupancy (%) 63.1 71.6 71.9 71.5 70.3 Average Daily Rate ($) 169.23 167.72 156.39 172.37 166.93 RevPar ($)2 106.72 120.13 112.42 123.28 117.38 RevPar Change (%)3 1.5 9.8 12.2 10.5 9.4
4 Excludes Hawaii.
6 Includes Hawaii.1 International financial results are reported on a period basis, while international statistics are reported on a monthly basis. Statistics are in constant dollars. Excludes North America.2 Revenue per Available Room.3 Year over year change of a consistent group of comparable hotels. Comparable hotel base changes each year based on hotel openings.4 Excludes Hawaii.5 Beginning in Quarter 4, 2006, includes The Ritz-Carlton International and Bulgari Hotels & Resorts. Prior to Quarter 4, 2006, includes The Ritz-Carlton International.6 Includes Hawaii.
1 International financial results are reported on a period basis, while international statistics are reported on a monthly 2 Revenue per Available Room.3 Year over year change of a consistent group of comparable hotels. Comparable hotel base changes each year based
5 Beginning in Quarter 4, 2006, includes The Ritz-Carlton International and Bulgari Hotels & Resorts. Prior to Quarter 4,
International Comparable Company-
Operated Properties1
K-6

XIV. INTERNATIONAL LODGING KEY OPERATING STATISTICS BY REGION
2011 2011 2011 2011 20111st Quarter 2nd Quarter 3rd Quarter 4th Quarter Full Year
Caribbean & Latin AmericaOccupancy (%) 74.8 74.0 73.5 69.8 72.6 Average Daily Rate ($) 195.87 190.44 167.78 184.44 183.64 RevPar ($)2 146.49 140.95 123.32 128.66 133.29 RevPar Change (%)3 9.7 9.1 12.8 10.9 10.6
Europe 4
Occupancy (%) 61.9 74.9 78.1 73.7 73.2 Average Daily Rate ($) 159.47 176.92 177.15 178.72 175.20 RevPar ($)2 98.73 132.47 138.28 131.66 128.21 RevPar Change (%)3 7.1 8.9 5.3 1.3 5.0
Middle East & AfricaOccupancy (%) 58.0 56.9 56.5 62.5 58.8 Average Daily Rate ($) 159.60 148.70 118.83 143.11 141.22 RevPar ($)2 92.52 84.59 67.12 89.50 83.11 RevPar Change (%)3 3.5 (17.0) (10.1) (8.4) (9.3)
Asia Pacific5
Occupancy (%) 63.6 72.2 73.5 75.2 73.1 Average Daily Rate ($) 132.06 139.56 130.27 143.78 137.80 RevPar ($)2 83.96 100.79 95.77 108.11 100.69 RevPar Change (%)3 22.2 17.7 13.9 11.1 14.8
International Luxury6
Occupancy (%) 63.0 65.2 63.3 63.7 63.8 Average Daily Rate ($) 325.87 312.48 292.33 321.28 312.52 RevPar ($)2 205.42 203.60 185.06 204.50 199.53 RevPar Change (%)3 12.3 1.4 8.5 5.5 6.2
Total InternationalOccupancy (%) 63.6 71.5 72.8 71.5 70.8 Average Daily Rate ($) 177.29 181.90 172.54 183.16 179.38 RevPar ($)2 112.79 129.98 125.64 130.93 126.96 RevPar Change (%)3 11.1 7.3 7.5 4.5 6.9
1 International financial results are reported on a period basis, while international statistics are reported on a monthly basis. Statistics are in constant dollars. Excludes North America.2 Revenue per Available Room.3 Year over year change of a consistent group of comparable hotels. Comparable hotel base changes each year based on hotel openings.4 Beginnning in Q1 2011 Continental Europe and the United Kingdom were combined.5 Excludes Hawaii.6 Beginning in Quarter 4, 2006, includes The Ritz-Carlton International and Bulgari Hotels & Resorts. Prior to Quarter 4, 2006, includes The Ritz-Carlton International.
International Comparable Company-
Operated Properties1
K-7

XIV. INTERNATIONAL LODGING KEY OPERATING STATISTICS BY REGION
2012 2012 2012 2012 20121st Quarter 2nd Quarter 3rd Quarter 4th Quarter Full Year
Caribbean & Latin AmericaOccupancy (%) 75.9 74.3 72.8 68.6 72.3 Average Daily Rate ($) 207.03 201.25 174.36 186.44 190.75 RevPar ($)2 157.17 149.58 126.98 127.93 137.93 RevPar Change (%)3 9.4 9.3 6.7 3.5 6.9
Europe 4
Occupancy (%) 60.8 74.0 77.4 74.1 72.7 Average Daily Rate ($) 161.31 174.68 169.46 172.20 170.72 RevPar ($)2 98.07 129.34 131.22 127.65 124.20 RevPar Change (%)3 2.9 2.6 4.9 2.0 3.0
Middle East & AfricaOccupancy (%) 57.5 62.5 58.8 66.4 61.8 Average Daily Rate ($) 145.75 143.89 121.19 135.28 133.14 RevPar ($)2 83.76 89.89 71.30 89.77 82.25 RevPar Change (%)3 (6.1) 10.7 12.2 8.7 8.3
Asia Pacific5
Occupancy (%) 67.8 74.7 71.8 75.0 73.0 Average Daily Rate ($) 131.58 136.69 126.19 135.82 133.01 RevPar ($)2 89.27 102.16 90.61 101.86 97.04 RevPar Change (%)3 16.1 10.9 7.8 4.2 8.4
International Luxury6
Occupancy (%) 59.9 68.4 63.2 64.3 63.4 Average Daily Rate ($) 351.58 334.07 309.85 339.54 341.32 RevPar ($)2 210.51 228.65 195.74 218.15 216.34 RevPar Change (%)3 2.2 11.3 5.5 4.2 5.9
Total InternationalOccupancy (%) 64.4 72.8 72.1 72.1 70.9 Average Daily Rate ($) 177.39 181.08 166.93 175.64 175.14 RevPar ($)2 114.28 131.74 120.41 126.65 124.22 RevPar Change (%)3 6.2 7.6 6.2 3.5 5.6
1 International financial results are reported on a period basis, while international statistics are reported on a monthly basis. Statistics are in constant dollars. Excludes North America.2 Revenue per Available Room.3 Year over year change of a consistent group of comparable hotels. Comparable hotel base changes each year based on hotel openings.4 Beginnning in Q1 2011 Continental Europe and the United Kingdom were combined.5 Excludes Hawaii.6 Beginning in Quarter 4, 2006, includes The Ritz-Carlton International and Bulgari Hotels & Resorts. Prior to Quarter 4, 2006, includes The Ritz-Carlton International.
International Comparable Company-
Operated Properties1
K-8
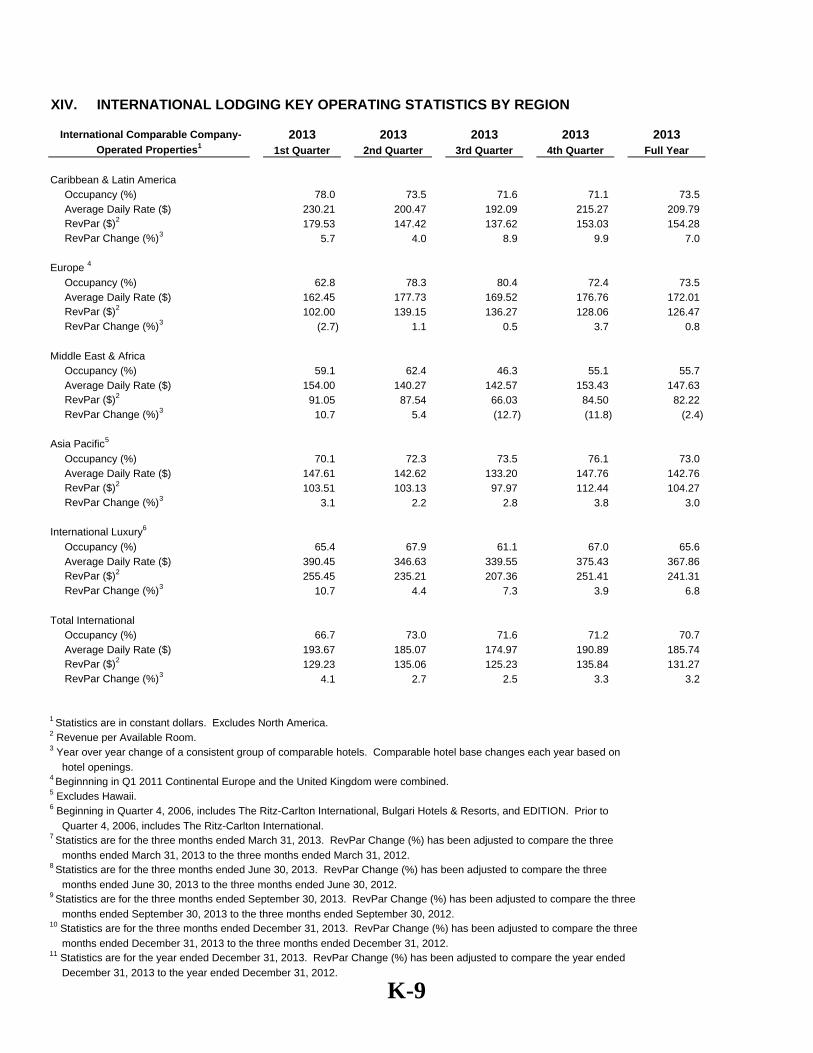
XIV. INTERNATIONAL LODGING KEY OPERATING STATISTICS BY REGION
2013 2013 2013 2013 20131st Quarter 2nd Quarter 3rd Quarter 4th Quarter Full Year
Caribbean & Latin AmericaOccupancy (%) 78.0 73.5 71.6 71.1 73.5 Average Daily Rate ($) 230.21 200.47 192.09 215.27 209.79 RevPar ($)2 179.53 147.42 137.62 153.03 154.28 RevPar Change (%)3 5.7 4.0 8.9 9.9 7.0
Europe 4
Occupancy (%) 62.8 78.3 80.4 72.4 73.5 Average Daily Rate ($) 162.45 177.73 169.52 176.76 172.01 RevPar ($)2 102.00 139.15 136.27 128.06 126.47 RevPar Change (%)3 (2.7) 1.1 0.5 3.7 0.8
Middle East & AfricaOccupancy (%) 59.1 62.4 46.3 55.1 55.7 Average Daily Rate ($) 154.00 140.27 142.57 153.43 147.63 RevPar ($)2 91.05 87.54 66.03 84.50 82.22 RevPar Change (%)3 10.7 5.4 (12.7) (11.8) (2.4)
Asia Pacific5
Occupancy (%) 70.1 72.3 73.5 76.1 73.0 Average Daily Rate ($) 147.61 142.62 133.20 147.76 142.76 RevPar ($)2 103.51 103.13 97.97 112.44 104.27 RevPar Change (%)3 3.1 2.2 2.8 3.8 3.0
International Luxury6
Occupancy (%) 65.4 67.9 61.1 67.0 65.6 Average Daily Rate ($) 390.45 346.63 339.55 375.43 367.86 RevPar ($)2 255.45 235.21 207.36 251.41 241.31 RevPar Change (%)3 10.7 4.4 7.3 3.9 6.8
Total InternationalOccupancy (%) 66.7 73.0 71.6 71.2 70.7 Average Daily Rate ($) 193.67 185.07 174.97 190.89 185.74 RevPar ($)2 129.23 135.06 125.23 135.84 131.27 RevPar Change (%)3 4.1 2.7 2.5 3.3 3.2
1 Statistics are in constant dollars. Excludes North America.2 Revenue per Available Room.3 Year over year change of a consistent group of comparable hotels. Comparable hotel base changes each year based on hotel openings.4 Beginnning in Q1 2011 Continental Europe and the United Kingdom were combined.5 Excludes Hawaii.6 Beginning in Quarter 4, 2006, includes The Ritz-Carlton International, Bulgari Hotels & Resorts, and EDITION. Prior to Quarter 4, 2006, includes The Ritz-Carlton International.7 Statistics are for the three months ended March 31, 2013. RevPar Change (%) has been adjusted to compare the three months ended March 31, 2013 to the three months ended March 31, 2012.8 Statistics are for the three months ended June 30, 2013. RevPar Change (%) has been adjusted to compare the three months ended June 30, 2013 to the three months ended June 30, 2012.9 Statistics are for the three months ended September 30, 2013. RevPar Change (%) has been adjusted to compare the three months ended September 30, 2013 to the three months ended September 30, 2012.10 Statistics are for the three months ended December 31, 2013. RevPar Change (%) has been adjusted to compare the three months ended December 31, 2013 to the three months ended December 31, 2012.11 Statistics are for the year ended December 31, 2013. RevPar Change (%) has been adjusted to compare the year ended December 31, 2013 to the year ended December 31, 2012.
International Comparable Company-
Operated Properties1
K-9

XIV. INTERNATIONAL LODGING KEY OPERATING STATISTICS BY REGION
2014 2014 2014 2014 20141st Quarter 2nd Quarter 3rd Quarter 4th Quarter Full Year
Caribbean & Latin America2
Occupancy (%) 78.4 73.5 71.0 71.6 73.6 Average Daily Rate ($) 283.35 232.45 201.84 238.87 239.95 RevPar ($)3 222.26 170.88 143.40 171.01 176.66 RevPar Change (%)4 9.4 12.7 13.6 9.5 11.0
Europe Occupancy (%) 63.4 77.9 81.0 74.5 74.9 Average Daily Rate ($) 181.47 205.60 199.06 183.81 193.20 RevPar ($)3 115.08 160.25 161.27 136.86 144.61 RevPar Change (%)4 2.6 1.3 4.7 4.2 3.2
Middle East & AfricaOccupancy (%) 59.6 62.8 54.2 64.9 60.1 Average Daily Rate ($) 202.06 187.10 166.85 199.27 190.60 RevPar ($)3 120.44 117.57 90.47 129.24 114.47 RevPar Change (%)4 (0.6) 3.9 16.1 15.7 7.9
Asia PacificOccupancy (%) 70.8 72.8 74.8 76.1 73.7 Average Daily Rate ($) 182.05 173.24 168.18 180.66 176.48 RevPar ($)3 128.90 126.19 125.85 137.46 130.04 RevPar Change (%)4 6.3 5.5 5.0 2.4 4.8
Total InternationalOccupancy (%) 67.7 73.6 74.3 73.7 72.6 Average Daily Rate ($) 198.30 194.31 184.29 190.74 192.04 RevPar ($)3 134.25 143.03 136.98 140.54 139.35 RevPar Change (%)4 4.9 4.5 6.6 5.3 5.4
1 Statistics are in constant dollars. Excludes North America.2 Due to significant inflation in Venezuela, the company’s three hotels in that country were removed from the comp set. 3 Revenue per Available Room.4 Year over year change of a consistent group of comparable hotels. Comparable hotel base changes each year based on hotel openings.
International Comparable Company-
Operated Properties1
K-10

XIV. INTERNATIONAL LODGING KEY OPERATING STATISTICS BY REGION
2015 2015 2015 2015 20151st Quarter 2nd Quarter 3rd Quarter 4th Quarter Full Year
Caribbean & Latin AmericaOccupancy (%) 77.4 73.3 68.5 70.4 72.4 Average Daily Rate ($) 300.53 235.10 205.63 246.24 248.05 RevPar ($)2 232.56 172.37 140.95 173.48 179.58 RevPar Change (%)3 7.1 6.7 2.4 3.6 5.2
Europe Occupancy (%) 67.7 80.0 82.9 73.0 75.9 Average Daily Rate ($) 163.44 177.18 178.39 171.05 173.07 RevPar ($)2 110.63 141.67 147.82 124.79 131.43 RevPar Change (%)3 8.5 5.7 8.8 3.1 6.5
Middle East & AfricaOccupancy (%) 64.9 62.2 55.6 62.1 61.2 Average Daily Rate ($) 197.74 177.70 161.10 185.59 181.16 RevPar ($)2 128.36 110.57 89.54 115.31 110.85 RevPar Change (%)3 9.5 0.1 2.7 (7.5) 0.9
Asia PacificOccupancy (%) 71.8 74.0 74.4 76.3 74.1 Average Daily Rate ($) 165.32 153.53 144.95 155.73 153.83 RevPar ($)2 118.65 113.67 107.89 118.87 114.00 RevPar Change (%)3 5.7 5.3 3.7 3.6 4.7
Total InternationalOccupancy (%) 70.3 74.5 74.2 72.6 72.9 Average Daily Rate ($) 188.38 175.53 166.91 176.08 176.24 RevPar ($)2 132.39 130.83 123.87 127.87 128.50 RevPar Change (%)3 7.3 5.1 5.5 2.0 5.0
1 Statistics are in constant dollars. Excludes North America.2 Revenue per Available Room.3 Year over year change of a consistent group of comparable hotels. Comparable hotel base changes each year based on hotel openings.
International Comparable Company-
Operated Properties1
K-11
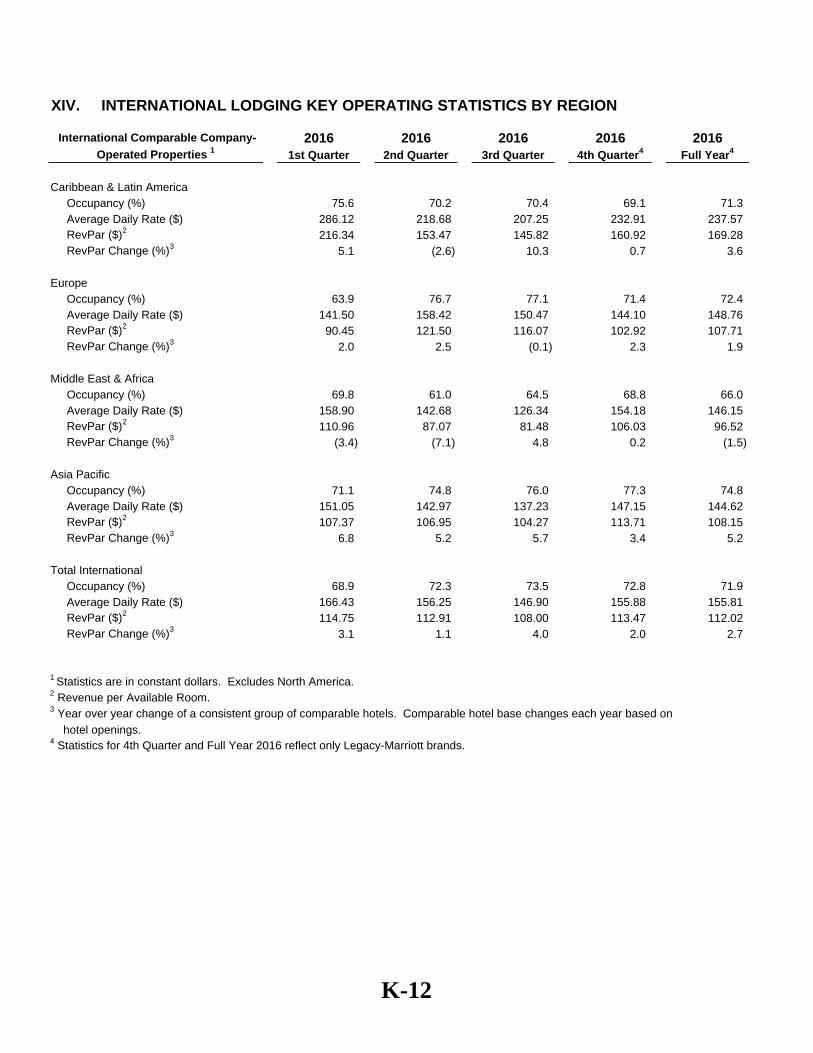
XIV. INTERNATIONAL LODGING KEY OPERATING STATISTICS BY REGION
2016 2016 2016 2016 20161st Quarter 2nd Quarter 3rd Quarter 4th Quarter4 Full Year4
Caribbean & Latin AmericaOccupancy (%) 75.6 70.2 70.4 69.1 71.3 Average Daily Rate ($) 286.12 218.68 207.25 232.91 237.57 RevPar ($)2 216.34 153.47 145.82 160.92 169.28 RevPar Change (%)3 5.1 (2.6) 10.3 0.7 3.6
Europe Occupancy (%) 63.9 76.7 77.1 71.4 72.4 Average Daily Rate ($) 141.50 158.42 150.47 144.10 148.76 RevPar ($)2 90.45 121.50 116.07 102.92 107.71 RevPar Change (%)3 2.0 2.5 (0.1) 2.3 1.9
Middle East & AfricaOccupancy (%) 69.8 61.0 64.5 68.8 66.0 Average Daily Rate ($) 158.90 142.68 126.34 154.18 146.15 RevPar ($)2 110.96 87.07 81.48 106.03 96.52 RevPar Change (%)3 (3.4) (7.1) 4.8 0.2 (1.5)
Asia PacificOccupancy (%) 71.1 74.8 76.0 77.3 74.8 Average Daily Rate ($) 151.05 142.97 137.23 147.15 144.62 RevPar ($)2 107.37 106.95 104.27 113.71 108.15 RevPar Change (%)3 6.8 5.2 5.7 3.4 5.2
Total InternationalOccupancy (%) 68.9 72.3 73.5 72.8 71.9 Average Daily Rate ($) 166.43 156.25 146.90 155.88 155.81 RevPar ($)2 114.75 112.91 108.00 113.47 112.02 RevPar Change (%)3 3.1 1.1 4.0 2.0 2.7
1 Statistics are in constant dollars. Excludes North America.2 Revenue per Available Room.3 Year over year change of a consistent group of comparable hotels. Comparable hotel base changes each year based on hotel openings.4 Statistics for 4th Quarter and Full Year 2016 reflect only Legacy-Marriott brands.
International Comparable Company-
Operated Properties 1
K-12

XIV. INTERNATIONAL LODGING KEY OPERATING STATISTICS BY REGION
Combined4 Combined4 Combined4 Combined4
2016 2016 2016 2016 20161st Quarter 2nd Quarter 3rd Quarter 4th Quarter5 Full Year
Caribbean & Latin AmericaOccupancy (%) 69.0 63.9 63.9 64.3 65.3 Average Daily Rate ($) 250.97 199.52 188.82 213.96 213.99 RevPar ($)2 173.25 127.57 120.65 137.49 139.69 RevPar Change (%)3 2.4 (4.2) 6.9 (3.1) 0.4
Europe Occupancy (%) 62.8 76.9 77.5 70.1 71.8 Average Daily Rate ($) 159.32 185.61 182.68 164.15 173.84 RevPar ($)2 100.10 142.65 141.58 115.09 124.87 RevPar Change (%)3 1.7 1.6 (0.6) 1.3 0.8
Middle East & AfricaOccupancy (%) 67.9 60.3 62.2 67.8 64.6 Average Daily Rate ($) 183.32 158.73 139.03 175.77 164.90 RevPar ($)2 124.40 95.78 86.54 119.24 106.49 RevPar Change (%)3 (5.4) (9.6) 1.4 (1.1) (3.8)
Greater ChinaOccupancy (%) 61.5 67.0 70.6 70.7 67.5 Average Daily Rate ($) 142.77 131.96 124.75 130.60 132.16 RevPar ($)2 87.83 88.42 88.01 92.39 89.17 RevPar Change (%)3 1.7 (0.5) (0.5) 0.8 0.4
Rest of Asia PacificOccupancy (%) 75.7 72.7 76.8 75.8 75.2 Average Daily Rate ($) 152.60 144.39 147.15 154.83 149.80 RevPar ($)2 115.45 104.99 112.94 117.34 112.69 RevPar Change (%)3 6.6 3.6 3.7 1.1 3.7
Asia PacificOccupancy (%) 66.3 68.9 72.6 72.4 70.1 Average Daily Rate ($) 146.54 136.37 132.70 139.12 138.52 RevPar ($)2 97.12 93.99 96.39 100.78 97.08 RevPar Change (%)3 3.6 1.0 1.1 0.9 1.6
Total InternationalOccupancy (%) 65.9 68.9 71.3 70.4 69.2 Average Daily Rate ($) 165.28 158.01 151.09 157.04 157.69 RevPar ($)2 108.99 108.95 107.72 110.54 109.05 RevPar Change (%)3 1.1 (1.1) 1.1 0.2 0.3
1 Statistics are in constant dollars. Excludes North America.2 Revenue per Available Room.3 Year over year change of a consistent group of comparable hotels. Comparable hotel base changes each year based on hotel openings.4 Combined Company statistics assume Marriott's acquisition of Starwood had been completed on January 1, 2015.5 Beginning with 4th Quarter 2016, all statistics reflect the combined Legacy-Marriott and Legacy-Starwood portfolios.
International Comparable Company-
Operated Properties 1
K-13

XIV. INTERNATIONAL LODGING KEY OPERATING STATISTICS BY REGION
2017 2017 2017 2017 20171st Quarter 2nd Quarter 3rd Quarter 4th Quarter Full Year
Caribbean & Latin AmericaOccupancy (%) 69.0 64.5 62.6 64.9 64.3 Average Daily Rate ($) 234.75 180.05 145.10 164.93 161.91 RevPar ($)2 161.96 116.22 90.89 107.04 104.10 RevPar Change (%)3 0.2 3.5 1.9 5.6 4.0
Europe Occupancy (%) 64.4 75.2 79.0 71.5 71.9 Average Daily Rate ($) 156.59 170.14 194.03 169.33 171.72 RevPar ($)2 100.86 128.01 153.25 121.06 123.44 RevPar Change (%)3 6.3 7.0 8.7 5.4 7.2
Middle East & AfricaOccupancy (%) 68.9 62.0 62.9 68.8 65.4 Average Daily Rate ($) 175.12 151.59 130.70 169.89 155.90 RevPar ($)2 120.69 94.05 82.23 116.85 101.98 RevPar Change (%)3 (0.7) 2.4 (0.3) 5.7 2.0
Greater ChinaOccupancy (%) 65.7 70.8 74.3 73.3 70.9 Average Daily Rate ($) 126.24 124.64 124.33 134.61 127.47 RevPar ($)2 82.91 88.21 92.38 98.70 90.37 RevPar Change (%)3 5.0 8.4 10.6 9.1 8.5
Rest of Asia PacificOccupancy (%) 76.2 72.0 76.0 75.6 74.8 Average Daily Rate ($) 155.94 153.65 159.00 164.27 158.21 RevPar ($)2 118.88 110.71 120.83 124.15 118.36 RevPar Change (%)3 5.6 5.0 5.3 5.3 5.1
Asia PacificOccupancy (%) 69.4 71.3 75.0 74.3 72.6 Average Daily Rate ($) 137.62 136.89 139.29 147.42 140.94 RevPar ($)2 95.44 97.61 104.50 109.50 102.27 RevPar Change (%)3 5.3 6.8 7.9 7.2 6.8
Total InternationalOccupancy (%) 68.1 70.1 72.9 71.5 70.3 Average Daily Rate ($) 157.80 154.79 156.46 159.04 154.71 RevPar ($)2 107.42 108.53 114.12 113.72 108.78 RevPar Change (%)3 3.6 5.8 6.7 6.2 5.9
1 Statistics are in constant dollars. Excludes North America.2 Revenue per Available Room.3 Year over year change of a consistent group of comparable hotels. Comparable hotel base changes each year based on hotel openings.
International Comparable Company-
Operated Properties 1
K-14
Related Documents

![WELCOME [files.shareholder.com]files.shareholder.com/downloads/ACIW/5800322185x0x707102/...PAPER BILLS/ CHECKS MOBILE ONLINE BRANCH POS ATM CHANNELS ACI UNIVERSAL PAYMENTS Global Markets](https://static.cupdf.com/doc/110x72/5aa109037f8b9ac67a8b46d7/welcome-files-files-bills-checks-mobile-online-branch-pos-atm-channels-aci.jpg)