Journal of Clinical Investigation Vol. 46, No. 7, 1967 Abnormalities of High Density Lipoproteins in Abetalipoproteinemia * JOHN W. JONES t AND PETER WAYS t (From the Williams Research Laboratories and Medical Service, King County Hospital, and the Department of Medicine, University of Washington School of Medicine, Seattle, Wash.) Summary. Detailed studies of the high density lipoproteins from three pa- tients with abetalipoproteinemia have revealed the following principal abnor- malities: 1) High density lipoprotein 3 (HDL3) is reduced in both absolute and relative concentration, although HDL2 is present in normal amounts. 2) The phospholipid distribution of both HDL fractions is abnormal, with low concentrations of lecithin and an increased percentage (though normal absolute quantity) of sphingomyelin. 3) In both HDL fractions, lecithin contains less linoleate and more oleate than normal. The cholesteryl esters are also low in linoleic acid, and the sphingomyelin is high in nervonic acid. Dietary intake influences the linoleic acid concentration within 2 weeks, and perhaps sooner, but the elevated sphingomyelin nervonic acid is little affected by up to 6 months of corn oil supplementation. Qualitatively similar changes in fatty acid composition, but not phospholipid distribution, are also found in other malabsorption states. The available evidence suggests that the abnormally low levels of HDL3 and the deranged phospholipid distribution are more specific for abetalipopro- teinemia than the fatty acid abnormalities. However, the absence of these abnormalities in obligate heterozygous subjects makes their relationship to the primary defect of abetalipoproteinemia difficult to assess. Introduction Abetalipoproteinemia is a rare hereditary dis- ease characterized by a degenerative neurological process, malabsorption, retinal degeneration, thorny red cells (acanthocytosis), and absent beta lipo- * Submitted for publication November 9, 1966; accepted March 15, 1967. Portions of this work have been previously reported (1, 2). These studies were supported by a grant from the Washington State Heart Association. t Present address: Dept. of Medicine, Veterans Ad- ministration Hospital, Richmond, Va. This work was done during the tenure of an indirect traineeship in cardiology (HTS-5821) from the National Heart In- stitute. t During these studies Dr. Ways was an Established Investigator of the American Heart Association. Address requests for reprints to Dr. Peter Ways, Dept. of Medicine, University of Washington School of Medi- cine, Seattle, Wash. 98105. protein. In all but two (3, 4) of the patients re- ported in the literature, the plasma cholesterol and phospholipid levels were lower than expected from the absence of beta lipoprotein alone, suggesting an accompanying deficiency in alpha-i or high density lipoproteins; this has been confirmed by electrophoretic and ultracentrifugal analyses in several patients (4-8). In addition to the low plasma cholesterol, triglyceride, and lipid phos- phorus values resulting from these lipoprotein de- ficiences, several investigators have found plasma phospholipid distribution to be abnormal (3, 4, 9), with a relative increase in sphingomyelin and a decrease in lecithin. In the present study, we have examined the chemical composition of the high density lipo- proteins in abetalipoproteinemia in detail to define better the high density lipoprotein abnormalities and their relationship to the underlying molecular defect in this disease. 1151

Welcome message from author
This document is posted to help you gain knowledge. Please leave a comment to let me know what you think about it! Share it to your friends and learn new things together.
Transcript
Journal of Clinical InvestigationVol. 46, No. 7, 1967
Abnormalities of High Density Lipoproteins inAbetalipoproteinemia *
JOHNW. JONESt ANDPETERWAYSt(From the Williams Research Laboratories and Medical Service, King County Hospital, andthe Department of Medicine, University of Washington School of Medicine, Seattle, Wash.)
Summary. Detailed studies of the high density lipoproteins from three pa-tients with abetalipoproteinemia have revealed the following principal abnor-malities: 1) High density lipoprotein 3 (HDL3) is reduced in both absoluteand relative concentration, although HDL2 is present in normal amounts.2) The phospholipid distribution of both HDL fractions is abnormal, withlow concentrations of lecithin and an increased percentage (though normalabsolute quantity) of sphingomyelin. 3) In both HDL fractions, lecithincontains less linoleate and more oleate than normal. The cholesteryl estersare also low in linoleic acid, and the sphingomyelin is high in nervonic acid.Dietary intake influences the linoleic acid concentration within 2 weeks, andperhaps sooner, but the elevated sphingomyelin nervonic acid is little affectedby up to 6 months of corn oil supplementation. Qualitatively similar changesin fatty acid composition, but not phospholipid distribution, are also found inother malabsorption states.
The available evidence suggests that the abnormally low levels of HDL3and the deranged phospholipid distribution are more specific for abetalipopro-teinemia than the fatty acid abnormalities. However, the absence of theseabnormalities in obligate heterozygous subjects makes their relationship tothe primary defect of abetalipoproteinemia difficult to assess.
Introduction
Abetalipoproteinemia is a rare hereditary dis-ease characterized by a degenerative neurologicalprocess, malabsorption, retinal degeneration, thornyred cells (acanthocytosis), and absent beta lipo-
* Submitted for publication November 9, 1966; acceptedMarch 15, 1967.
Portions of this work have been previously reported(1, 2).
These studies were supported by a grant from theWashington State Heart Association.
t Present address: Dept. of Medicine, Veterans Ad-ministration Hospital, Richmond, Va. This work wasdone during the tenure of an indirect traineeship incardiology (HTS-5821) from the National Heart In-stitute.
t During these studies Dr. Ways was an EstablishedInvestigator of the American Heart Association.
Address requests for reprints to Dr. Peter Ways, Dept.of Medicine, University of Washington School of Medi-cine, Seattle, Wash. 98105.
protein. In all but two (3, 4) of the patients re-ported in the literature, the plasma cholesterol andphospholipid levels were lower than expected fromthe absence of beta lipoprotein alone, suggestingan accompanying deficiency in alpha-i or highdensity lipoproteins; this has been confirmed byelectrophoretic and ultracentrifugal analyses inseveral patients (4-8). In addition to the lowplasma cholesterol, triglyceride, and lipid phos-phorus values resulting from these lipoprotein de-ficiences, several investigators have found plasmaphospholipid distribution to be abnormal (3, 4, 9),with a relative increase in sphingomyelin and adecrease in lecithin.
In the present study, we have examined thechemical composition of the high density lipo-proteins in abetalipoproteinemia in detail to definebetter the high density lipoprotein abnormalitiesand their relationship to the underlying moleculardefect in this disease.
1151
JOHN W. JONES AND PETERWAYS
Methods
Subjects. The following three patients with abetali-poproteinemia were studied: M.S. (age 8-10), J.D. (age7), and J. G. (age 7). Erythrocyte (4, 9, 10) and gas-trointestinal (11) studies on M.S. have been previouslyreported. Fresh plasma from J.D.1 was sent from NewYork City by air express at 40 C, and analysis was be-gun 12 hours after venesection. The clinical history ofJ.G.2 has been reported previously (11).
In all three patients, the diagnosis of abetalipoproteine-mia was established on the basis of clinical history, acan-thocytosis, absence of beta lipoprotein by immunoelec-trophoresis, and characteristic duodenal biopsy. Althoughpatients J.D. and M.S. were on unrestricted diets at thetime of the study, both limited fat intake voluntarily.The diet of M.S. was supplemented with variable amountsof safflower oil. J. G., except as otherwise noted, wasalso consuming a free choice diet, which averaged 0.88 gof fat per kg body weight each day.
Plasma lipoproteins were analyzed from seven controlsubjects, two women and five men (aged 25 to 35), whosetotal plasma lipid phosphorus and cholesterol values werewithin the generally accepted normal range. In ad-dition, pooled plasma from three children 7 to 9 yearsold was examined. These children had asymptomatic hayfever or bronchial asthma, for which they were beingdesensitized in the outpatient clinic. No attempt wasmade to estimate or control fat consumption in the con-trol subj ects.
Separation and extraction of plasma lipoproteins.Blood obtained after an overnight fast was anticoagu-lated with EDTA (1 mg per ml blood), and the plasmaand cells were separated by centrifugation at 4° C for 20minutes. The plasma was aspirated and then recentri-fuged for another 20 minutes to sediment any remainingformed elements. The lipoproteins were isolated in aSpinco model L ultracentrifuge with a type 50 rotor at150,000 g. All density adjustments were made with asolution of potassium bromide and sodium chloride (12)or by the addition of solid potassium bromide alone.
The initial centrifugation was at a density of 1.063 for15 hours. The tubes were sliced approximately 1 cm be-low the visible top layer, and the D < 1.063 fraction(low density lipoproteins, LDL) was removed. The in-franatant fractions from all tubes were combined, ad-justed to a density of 1.110, and centrifuged for 31 hoursto isolate HDL2 in the new supernatant fraction. Theinfranatant fraction was adjusted to a density of 1.21 andcentrifuged for 31 hours to separate HDL3 from theD > 1.21 residue. In some instances, when a type 40rotor was used, the material was centrifuged longer tocompensate for the lower centrifugal force. The lipo-protein fractions were transferred to cellulose tubing anddialyzed against 3 to 4 L of 0.15 M sodium chloride with
1 Provided through the courtesy of Drs. Marion Er-landson and John Farquhar.
2Referred to us by Drs. Richard Deemer and LloydBrandborg of San Francisco, Calif.
0.001 M EDTA. The LDL and HDL2 fractions weredialyzed for 24 hours with three changes of the dialysissolution; HDL3 and D > 1.21 fractions were dialyzed for48 hours with four changes of solution. Portions ofwhole plasma and the lipoprotein fractions were ex-tracted with methanol and chloroform as previouslydescribed (13).
Chromatographic separation of major lipid classes.Neutral lipids were separated from total phospholipidon silicic acid columns by using 2 g of silicic acid per mglipid phosphorus. Neutral lipids were eluted with chloro-form (60 ml per g silicic acid). Subsequently, chloro-form: methanol 1: 1 (15 ml per g silicic acid), chloro-form: methanol 1: 9 (30 ml per g), and 3% water inmethanol were used as eluents and then combined. (Allsolvent ratios are expressed as volume: volume.) Thisstepwise elution of the phospholipids resulted in 97 to100% recovery of the lipid phosphorus (14). Neutrallipids were then rechromatographed to separate cho-lesteryl esters from free cholesterol, triglycerides, andfree fatty acids. One gram of silicic acid stored at 1100 Cwas slurried in chloroform and packed in columns madefrom 10-ml serological pipettes. The column was washedwith 25 ml chloroform, then 20 ml of benzene: hexane 1: 3.The sample (up to 5 mg of total cholesterol) was trans-ferred to the column in benzene: hexane 1: 3, with threeseparate 2-ml transfers. The cholesteryl esters wereeluted with an additional 14 ml of benzene: hexane 1: 3.The remaining neutral lipids were eluted in bulk with25 ml of chloroform. This technique usually gave com-plete separation of cholesteryl esters and triglyceride, butthe purity of the fractions was always checked by thinlayer chromatography. If separation was incomplete, thesample was rechromatographed. Phospholipid distribu-tion was determined by elution and measurement of phos-phorus after chromatography of total lipid or total phos-pholipid on paper impregnated with silicic acid (13, 15).
Isolation and preparation of lipids for fatty acid analy-sis. The combined phospholipids from the silicic acidcolumns were further separated by thin layer chroma-tography. Silica gel G 3 was washed twice with each ofthe following solvents: chloroform, chloroform: methanol1: 1, chloroform: methanol 1: 3, and methanol. Afterdrying the silica gel overnight in a vacuum oven, we pre-pared thin layer (0.25 mm) plates and activated them at1100 C for at least 2 hours. Up to 0.3 mg of lipid phos-porus was applied as a streak across a 20-cm plate and de-veloped in chloroform: methanol: water 75: 35: 4. Thephospholipids were detected by spraying guide lanes with1% iodine in methanol or with a specific phosphorusspray (16). The corresponding unstained areas werescraped from the plates with glass slides. The phospho-lipids were eluted by stirring the silica gel in 5 ml ofchloroform: methanol 1: 1 and, after 20 minutes, pouringthe slurry into a small column. The lipid was then elutedwith three 5-ml portions of chloroform: methanol 1: 1,10 ml chloroform: methanol 1: 3, and 20 ml 3% waterin methanol. A blank area was also eluted to monitor con-
3 E. Merck, A. G., Darmstadt, Germany.
1152
ABNORMALITIES OF HIGH DENSITY LIPOPROTEINS IN ABETALIPOPROTEINEMIA
tamination. This elution technique was found to bequantitative by Masoro, Rowell, and McDonald (17) formuscle phospholipid phosphorus. In one determination,we recovered 102% of the lipid phosphorus from an ex-tract of whole plasma. With chromatographically pureplasma lecithin, fatty acid ester recovery was 103%o, asdetermined by infrared analysis (4).
After elution, approximately 5% of each fraction wasrechromatographed on a silica gel plate to determine itspurity. The sphingomyelin and lysolecithin samplesshowed single spots with the same Rf as the originallyeluted material. The lecithin, however, consistentlyshowed three spots, the major one with the Rf of lecithin,a smaller spot in the lysolecithin region, and a nonphos-phorus-containing spot at the solvent front. Apparently,some lecithin was hydrolyzed during the elution proce-dure. Despite this, the fatty acid ester content of theeluted lecithin was not significantly diminished (sidesupra), so the degree of deacylation was minor. Thesealterations in the lecithin were not accompanied bychanges in fatty acid composition. As shown in Table I,the fatty acid composition of purified lecithin chromato-graphed and eluted from the thin layer plate was virtu-ally identical to that of a sample transesterified directly.
Methyl esters were prepared from the phospholipidfractions separated by thin layer chromatography andfrom the cholesteryl esters and triglycerides isolated fromsilicic acid columns by transesterification in sulfuric acidand methanol (4). Their identification and quantificationby gas-liquid chromatography were done as previouslydescribed (4, 14). Fatty acid composition was expressedas moles per 100 moles of fatty acid.
Other analytical procedures. Protein determinationswere done on the intact HDL2 and HDL3 fractions by themethod of Lowry, Rosebrough, Farr, and Randall (18),with crystalline human albumin as reference standard.Lipid phosphorus was measured by established methods(14, 19). Glyceride glycerol was quantified by a periodateoxidation method (20), using the neutral lipid fractionobtained by silicic acid column chromatography. Totalcholesterol (0.08 to 0.5 mg) was quantified by the fol-
TABLE I
The fatty acid composition of plasma lecithin directly trans-esterified compared with that eluted after thin layer
chromatography and then transesterified
TransesterifiedTransesterified after
before thin layerFatty acid chromatography chromatography
moles/100 moles fatty acid14:0 0.2 0.416:0 28.9 29.816:1 0.9 1.618:0 13.7 13.718:1 10.8 11.018:2 26.4 25.220:3 2.5 2.520:4 10.7 10.322:5 0.9 1.022:6 2.7 2.5
lowing modification of the Liebermann-Burchard reac-tion. After drying under nitrogen, the lipid sample wasdissolved in 2 ml of dichloroethane: acetic acid 1: 1.After the addition of 1 ml of acetic anhydride and 0.1ml of sulfuric acid, the contents were well mixed andplaced in the dark for exactly 30 minutes. The opticaldensity at 615 m, was then determined against a reagentblank. Standards were run concurrently. Free andester cholesterol were determined by the same techniqueafter their separation on silicic acid columns. TheLiebermann-Burchard reaction gives a higher molar ex-tinction coefficient for esterified cholesterol than for freecholesterol. Since the values for total cholesterol re-ported in Table II were not corrected for this effect,they are 10 to 12% too high (21). When we analyzedthe column fractions, we used a standard of cholesterylpalmitate to measure accurately the cholesterol contentof the ester fraction.
ResultsLipid and protein concentrations. The lipid and
protein composition of HDL2 and HDL3 is givenin Table II. In abetalipoproteinemia, the HDL2lipid phosphorus, cholesterol, and protein valueswere within the normal range, but in HDL3 allwere reduced to about one-half to one-third ofnormal. All three patients had lower percentagesof cholesteryl ester in HDL2 and of triglyceride inHDL3 than any of the normal adults or children.The D > 1.21 fraction was lower in lipid phos-phorus content, but the cholesterol- levels weresimilar to those of normal subjects.
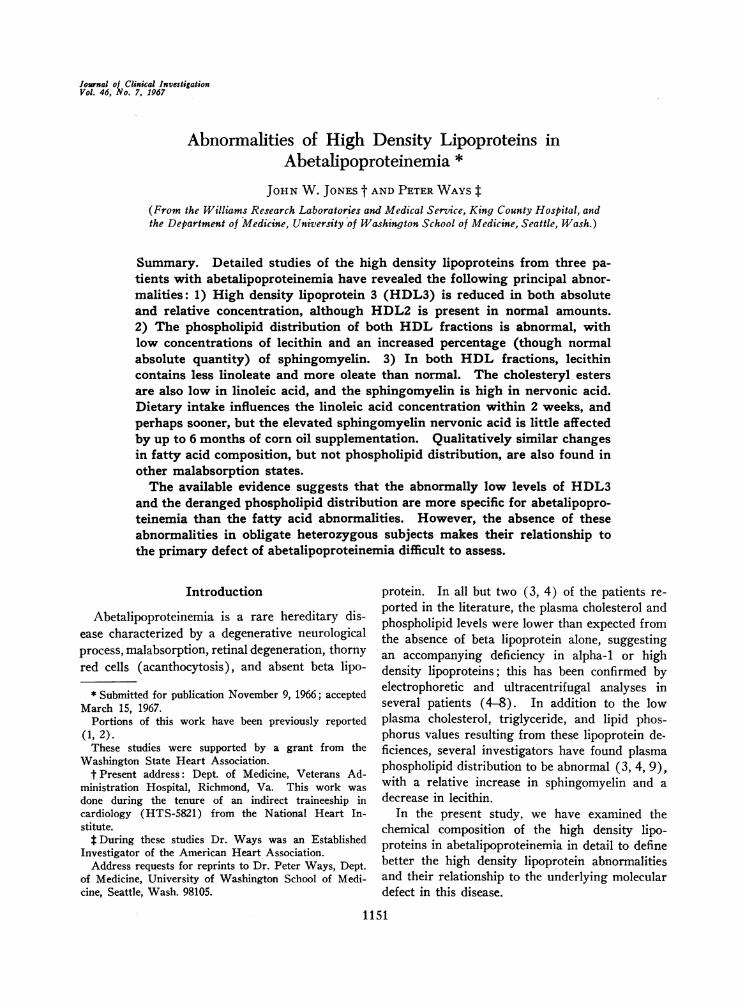
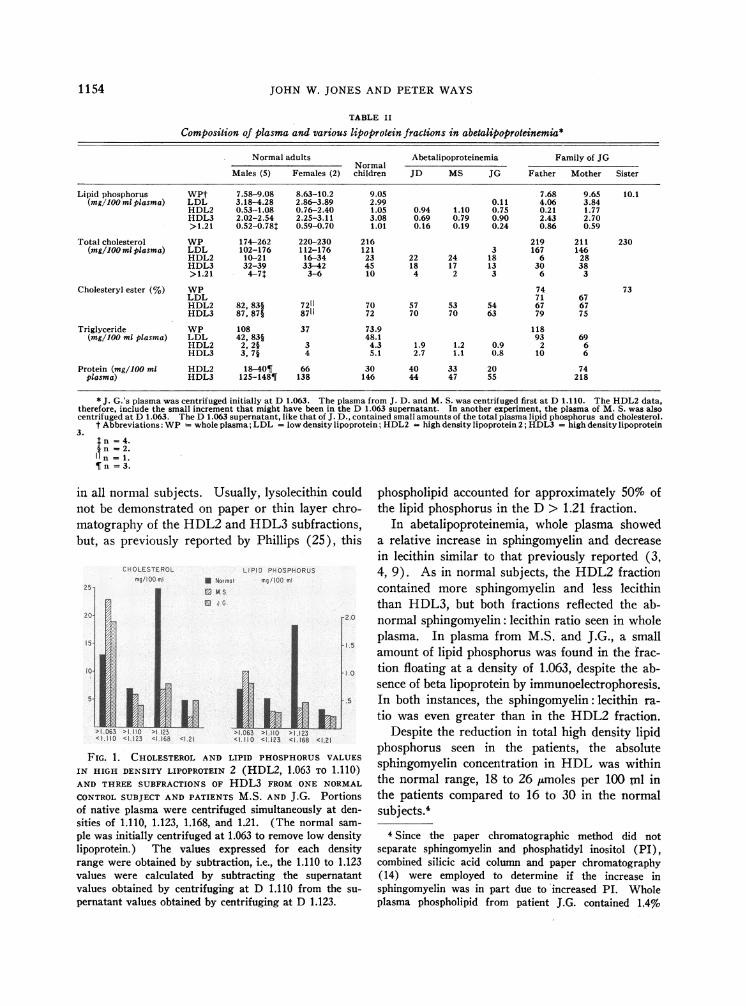
To determine whether the decrease in HDL3resulted from deletion of some subfraction withinthis lipoprotein class, we centrifuged samples ofwhole plasma from two patients and one normalsubject at densities of 1.110, 1.123, 1.160, and1.21. The derived lipid phosphorus and choles-terol values in Figure 1 show that the major quan-titative deficiency in the abnormal plasma was inthe 1.123 to 1.160 range, which was the mainHDL fraction in the normal subject.
Phospholipid distribution. The phospholipiddistributions in whole plasma and in the individuallipoproteins are summarized in Table III. Thewhole plasma data from normal subjects was simi-lar to those previously described (13, 22-24).When the separated normal lipoproteins were com-pared, increasing- lipoprotein density was accom-panied by a decrease in the relative amount ofsphingomyelin and an increase in lecithin. Thesedifferences in phospholipid composition betweenHDL2and HDL3, although small, were consistent
1153
JOHN W. JONES AND PETERWAYS
TABLE II
Composition of plasma and various lipoprotein fractions in abetalipoproteinemia*
Normal adults Abetalipoproteinemia Family of JGNormal
Males (5) Females (2) children JD MS JG Father Mother Sister
Lipid phosphorus WPt 7.58-9.08 8.63-10.2 9.05 7.68 9.65 10.1(mg/loo ml plasma) LDL 3.18-4.28 2.86-3.89 2.99 0.11 4.06 3.84
HDL2 0.53-1.08 0.76-2.40 1.05 0.94 1.10 0.75 0.21 1.77HDL3 2.02-2.54 2.25-3.11 3.08 0.69 0.79 0.90 2.43 2.70>1.21 0.52-0.781 0.59-0.70 1.01 0.16 0.19 0.24 0.86 0.59
Total cholesterol WP 174-262 220-230 216 219 211 230(mg/1OO ml plasma) LDL 102-176 112-176 121 3 167 146
HDL2 10-21 16-34 23 22 24 18 6 28HDL3 32-39 33-42 45 18 17 13 30 38>1.21 4-7 3-6 10 4 2 3 6 3
Cholesteryl ester (%) WP 74 73LDL 71 67HDL2 82. 831 7211 70 57 53 54 67 67HDL3 87, $7 8711 72 70 70 63 79 75
Triglyceride WP 108 37 73.9 118(mg/100 ml plasma) LDL 42, 83§ 48.1 93 69
HDL2 2, 2§ 3 4.3 1.9 1.2 0.9 2 6HDL3 3, 7§ 4 5.1 2.7 1.1 0.8 10 6
Protein (mg/100 ml HDL2 18-40¶ 66 30 40 33 20 74plasma) HDL3 125-148¶ 138 146 44 47 55 218
* J. G.'s plasma was centrifuged initially at D 1.063. The plasma from J. D. and M. S. was centrifuged first at D 1.110. The HDL2 data,therefore, include the small increment that might have been in the D 1.063 supernatant. In another experiment, the plasma of M. S. was alsocentrifuged at D 1.063. The D 1.063 supernatant, like that of J. D., contained small amounts of the total plasma lipid phosphorus and cholesterol.
t Abbreviations: WP whole plasma; LDL = low density lipoprotein; HDL2 = high density lipoprotein 2; HDL3 = high density lipoprotein3.
In = 4.In =2.In = 1.
I n = 3.
in all normal subjects. Usually, lysolecithin couldnot be demonstrated on paper or thin layer chro-matography of the HDL2 and HDL3 subfractions,but, as previously reported by Phillips (25), this
25 1
CHOLESTEROLmnq/100 ml M Normal
MS
J G
LIPID PHOSPHORUSmg/150 ml
I L1h>1 063 >1.110 >1 123 >1.063 >1.110 > 1.123<1.110 <I 123 <1 168 <1 21 <1c110 <1.123 <1 168 <1.21
FIG. 1. CHOLESTEROLAND LIPID PHOSPHORUSVALUES
IN HIGH DENSITY LIPOPROTEIN 2 (HDL2, 1.063 TO 1.110)AND THREE SUBFRACTIONS OF HDL3 FROM ONE NORMAL
CONTROLSUBJECT AND PATIENTS M.S. AND J.G. Portionsof native plasma were centrifuged simultaneously at den-sities of 1.110, 1.123, 1.168, and 1.21. (The normal sam-
ple was initially centrifuged at 1.063 to remove low densitylipoprotein.) The values expressed for each densityrange were obtained by subtraction, i.e., the 1.110 to 1.123values were calculated by subtracting the supernatantvalues obtained by centrifuging at D 1.110 from the su-
pernatant values obtained by centrifuging at D 1.123.
phospholipid accounted for approximately 50% ofthe lipid phosphorus in the D > 1.21 fraction.
In abetalipoproteinemia, whole plasma showeda relative increase in sphingomyelin and decreasein lecithin similar to that previously reported (3,4, 9). As in normal subjects, the HDL2 fractioncontained more sphingomyelin and less lecithinthan HDL3, but both fractions reflected the ab-normal sphingomyelin: lecithin ratio seen in wholeplasma. In plasma from M.S. and J.G., a smallamount of lipid phosphorus was found in the frac-tion floating at a density of 1.063, despite the ab-sence of beta lipoprotein by immunoelectrophoresis.In both instances, the sphingomyelin: lecithin ra-tio was even greater than in the HDL2 fraction.
Despite the reduction in total high density lipidphosphorus seen in the patients, the absolutesphingomyelin concentration in HDL was withinthe normal range, 18 to 26 ,umoles per 100 ml inthe patients compared to 16 to 30 in the normalsubjects.'
4Since the paper chromatographic method did notseparate sphingomyelin and phosphatidyl inositol (PI),combined silicic acid column and paper chromatography(14) were employed to determine if the increase insphingomyelin was in part due to increased PI. Wholeplasma phospholipid from patient J.G. contained 1.4%o
154
ABNORMALITIES OF HIGH DENSITY LIPOPROTEINS IN ABETALIPOPROTEINEMIA
TABLE IIIPercentage distribution of plasma lipopratein phospholipids in patients with
abetalipoproteinemia and control subjects*
Normal adultst Abetalipoproteinemia Family of JGNormal
Mean Range children JD MS JG Father Mother Sister
Lecithin WP 67 65-70 66 59 44 52 60 69LDL 65 63-68 62 39 45 68 63HDL2 71 65-72 73 54 47t 54 67 69HDL3 74 70-77 78 59 56t 65 74 81>1.21 33 28-38 43 35 31t 42 26
Sphingomyelin WP 21 20-23 20 30 48 31 22 19LDL 27 26-32 30 54 46 28 32HDL2 21 19-29 22 35 47t 39 22 17HDL3 17 15-18 16 31 381 30 20 14>1.21 10 8-12 14 16 21t 23 11
Lysolecithin WP 7 4-9 9 5 7 8 10 5>1.21 48 40-58 32 34 34t 32 55
Phosphatidyl WP 4 3-5 4 3 1 6 3 2 2ethanolamine LDL 5 3-5 4 3 3 2 1
HDL2 5 3-8 3 0.2 0.9t 1 4 3HDL3 5 3-10 5 3 2 1 3 2>1.21 5 3-8 6 6 8 0
* All values are expressed as per cent of total phospholipid recovered from the chromatograms. Recovery rangedfrom 85 to 111 %. In all analyses, 0 to 7 %of the phosphorus recovered was in areas not corresponding to any of thoseshown (mostly at the origin).
t No apparent differences were noted among five normal male and two female values. Hence, they have beencombined.
t These values are the averages of two determinations.
In addition to the more obvious changes insphingomyelin and lecithin, there was an apparentrelative and absolute decrease in the amount ofphosphatidyl ethanolamine, especially in HDL2.5Lysolecithin was the predominant phospholipid inthe D > 1.21 fraction, but it accounted for lessthan 50% of the phospholipid in that fraction.
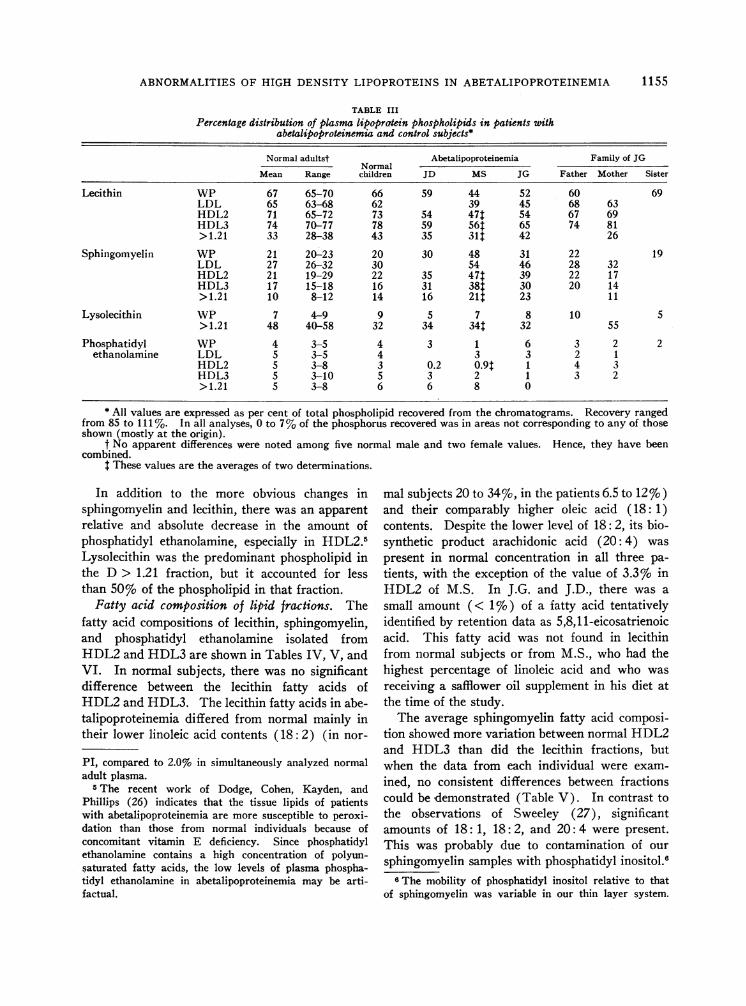
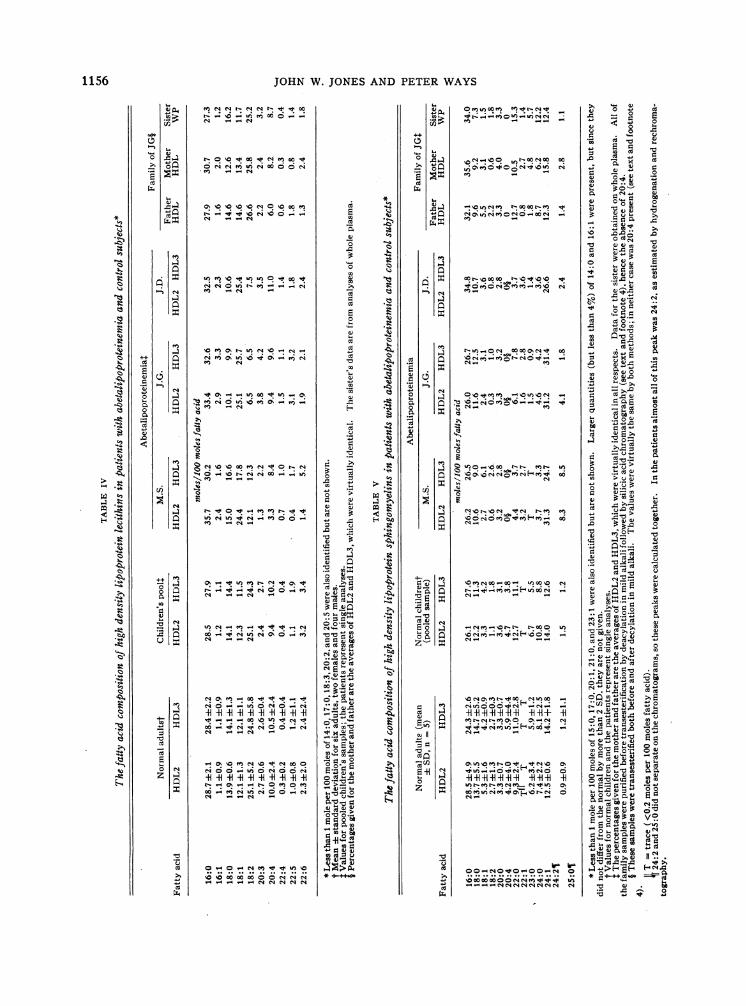
Fatty acid composition of lipid fractions. Thefatty acid compositions of lecithin, sphingomyelin,and phosphatidyl ethanolamine isolated fromHDL2and HDL3 are shown in Tables IV, V, andVI. In normal subjects, there was no significantdifference between the lecithin fatty acids ofHDL2and HDL3. The lecithin fatty acids in abe-talipoproteinemia differed from normal mainly intheir lower linoleic acid contents (18: 2) (in nor-
PI, compared to 2.0% in simultaneously analyzed normaladult plasma.
5The recent work of Dodge, Cohen, Kayden, andPhillips (26) indicates that the tissue lipids of patientswith abetalipoproteinemia are more susceptible to peroxi-dation than those from normal individuals because ofconcomitant vitamin E deficiency. Since phosphatidylethanolamine contains a high concentration of polyun-saturated fatty acids, the low levels of plasma phospha-tidyl ethanolamine in abetalipoproteinemia may be arti-factual.
mal subjects 20 to 34%o, in the patients 6.5 to 12 %)and their comparably higher oleic acid (18: 1)contents. Despite the lower level of 18: 2, its bio-synthetic product arachidonic acid (20: 4) waspresent in normal concentration in all three pa-tients, with the exception of the value of 3.3%o inHDL2 of M.S. In J.G. and J.D., there was asmall amount (< 1%o) of a fatty acid tentativelyidentified by retention data as 5,8,11-eicosatrienoicacid. This fatty acid was not found in lecithinfrom normal subjects or from M.S., who had thehighest percentage of linoleic acid and who wasreceiving a safflower oil supplement in his diet atthe time of the study.
The average sphingomyelin fatty acid composi-tion showed more variation between normal HDL2and HDL3 than did the lecithin fractions, butwhen the data from each individual were exam-ined, no consistent differences between fractionscould be demonstrated (Table V). In contrast tothe observations of Sweeley (27), significantamounts of 18: 1, 18: 2, and 20: 4 were present.This was probably due to contamination of oursphingomyelin samples with phosphatidyl inositol.8
IThe mobility of phosphatidyl inositol relative to thatof sphingomyelin was variable in our thin layer system.
1155
JOHN W. JONESAND PETERWAYS
"N N r N N"t 00_(0 ui 00 00 0
0 N N0 00 Nl 0 00 N
Ne - - N
00 _ _
0\_ _ U) 00_06.e 00 N 0 00 '00 ft 0_0
O No o X e es e O rkn
(U
r No+ 0.eet-.N tNO ... . *N00. . 0
00 N 00 d NS 00 00o-
00 _ 00 -N_
N _ - N -
00_ l "R LI! O_
00.o eN_00N00000_
N - N_ va o N o _ >
No _ ,+
N -No
0N N_ N,N - - N-)oN
004 04-4 N u N0 o 0 ((0(0_00000 N sN N
(U
(U
0
.0Cd0
0
0
(U(U(Uco
cd
._
._
H
0
._
.0
_
0 (U.0
0
.-0
Co*
C0
MV00 v
00£ be
(oU(UU)
0 U)O6-
coc.
U)(U0(J
o0_>
*
0)
$0
0e
0
0)
0)
0a
0S
0)
H ~o
0..
0v
00
0)
0'*$00
0m
0
(U
(d
00
._
.0
0
.006
¢
300
QN1:
44
(.4
(4C)
z
0-E. C Q
= g
.0-o
d Q
5
0 a
z z
0
t#4 _2vNMON _ -
N(t' 000 \-0N0 004v00-.\°°o 0-'O°°0O °°
004 N
~soU)Ne roooore 0
0(0(U M000 4 \0 I 00 N -4
QU.
0000.-e000 b-z-- o.. 0
\N \0_ NC ' N -OU)
o6 "i08 6, oe i( 6
C4-4e
t- M0
00t'-Nt--0000O
IR
0
40
_ *ee 0
-i M
r 0
w 0- 0
.W 0. O
.0-(0
o o:cCO~)( U)
.0
rn. Cd V
4i v~t Q
0 CN(U0.0t
*- (U'=>,
0
4i c i *
* (U
(U (
U) >()( 0
.0JJ.C
-o (U
06
0. >0 4i U)
0
.0~
.N(U0~~~~~ ~ C
0 0~
00-
~0 >(U.; .0 0
"0
1156
0
.-
._
0ap
._
0
0.0
Cd
Q1¢
0..
0
0t
0)
Hq w
0t
0t
00
0t0t
EN
(4
Cl)
(4
0 0;:0
. N
00(4
.0
UmZ44
ABNORMALITIES OF HIGH DENSITY LIPOPROTEINS IN ABETALIPOPROTEINEMIA
TABLE VIThe fatty acid composition of high density lipoprotein phos-
phatidyl ethanolamines in abetalipoproteinemic patientsand control subjects*
Normal adults Children's pool Patient M.S.Fattyacid HDL2t HDL31 HDL2 HDL3 HDL2 HDL3
moles/100 moles fatly acid16:0 13.4 14.64-4.1 11.8 14.5 28.7 31.416:1 2.0 2.1+1.7 4.1 5.8 3.3 8.118:0 14.7 14.3±1.0 16.5 17.1 10.0 15.618:1 6.2 7.7±-1.0 8.7 9.4 8.7 5.418:2 10.5 8.9±2.6 10.1 5.9 7.320:4 27.7 23.2 42.5 23.0 22.2 3.8 4.422:6 13.4 13.5 +2.8 12.2 13.3 3.8 6.224:0 T T T 4.7 4.724:1 T T T 16.7 9.9
* Less than 1 mole per 100 moles of 18:3 and 20:0 was present, so itis not included. From 0.5 to 2.3 moles per 100 moles of 20:3 and 22:4were found in the normal samples but not in abetalipoproteinemia.14:0, 20:5. and 22:5 were also present (never exceeding 5 moles per100 moles), but no differences were noted between normal and abnormal.All of these have been omitted.
t Mean for two adults.t Mean ± standard deviation for five adults.
The sphingomyelin fatty acids of three patientswith abetalipoproteinemia differed significantlyfrom those of the normal subjects, but with fewexceptions HDL2 and HDL3 fatty acids werevery similar. The greatest difference was the highnervonic acid (24: 1) value, which was twice nor-mal. Despite the low total HDL phospholipidvalue of about 50% of normal, the absolute quan-tity of HDL sphingomyelin nervonate was higherin all three patients. Accompanying this were botha relative and an absolute decrease in 22: 0, 23: 0,and 24: 0. In M.S., 24: 2 was markedly elevated,but this was not found in the other two patients.In contrast to findings on normal subjects, arachi-donic acid (20: 4) was not detectable in any ofthe patients' sphingomyelin fractions, and thelinoleic acid content was lower than normal.
The phosphatidyl ethanolamine fatty acid datawere limited because of the small sizes of the sam-ples available for analysis. In normal subjects,the polyunsaturated fatty acids 20: 4 and 22: 6 pre-dominated. Significant amounts of 16: 0, 18:0,and 18: 1 dimethylacetals derived from plasmal-ogens were present. In patient M.S., the phos-
One phosphatidyl inositol sample isolated from normalplasma by column chromatography contained 11% 18: 1,12% 18: 2, and 23%o 20: 4. In subsequent studies, we havefound that the unsaturated fatty acids 18: 2 and 20: 4 canbe eliminated from the "sphingomyelin fraction" by mildalkaline hydrolysis, which removes the glycerol-boundfatty acid. The sphingomyelins are then isolated bysilicic acid column chromatography before methanolysis.The studies on the family members were done with thelatter technique (Table V).
phatidyl ethanolamine fractions contained muchless 20: 4 than normal.5 The same dimethylacetalswere found as in normal plasma.
The fatty acid composition of cholesteryl esteris listed in Table VII. Since no significant differ-ences were found between HDL2 and HDL3, theaverage of these is given. Both J.G. and M.S.were receiving dietary supplements containinglinoleic acid at the time of these analyses. Cho-lesteryl linoleate accounted for over 50% of thetotal cholesteryl esters in normal subjects. In thepatients, linoleic acid was only 23 and 26% ofthe total, despite the supplementary linoleic acid.Palmitate, 16: 1, and 18: 1 were all relativelyhigher, and the 20: 4 content was essentially thatof the normal adult material.
Sufficient triglyceride from HDL was not ob-tained for valid fatty acid analyses.
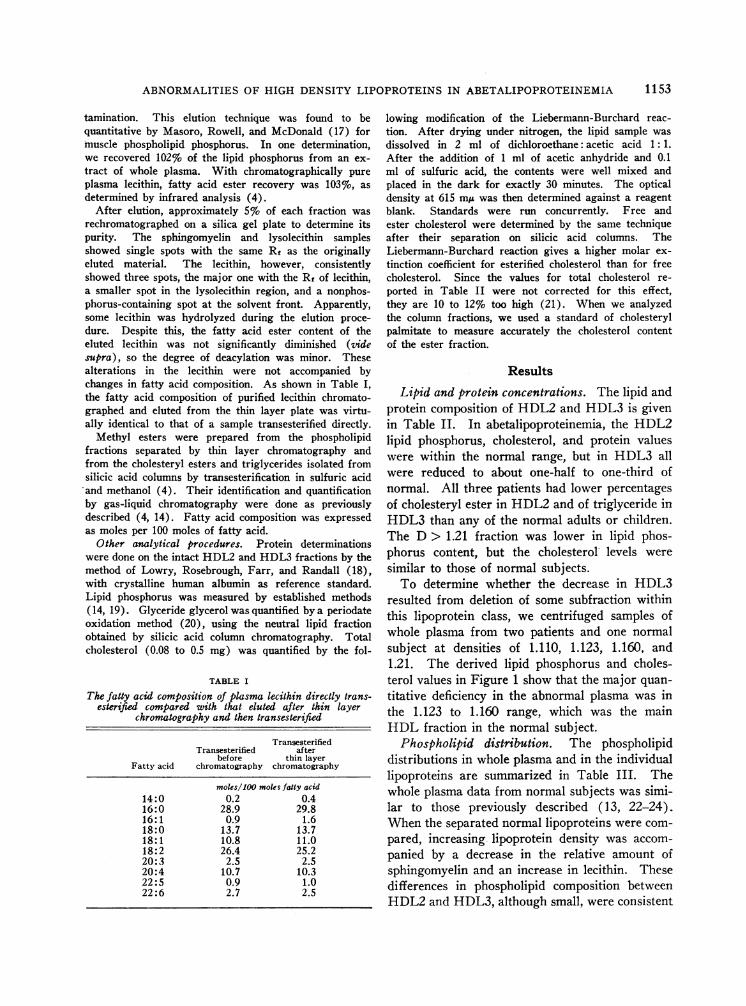
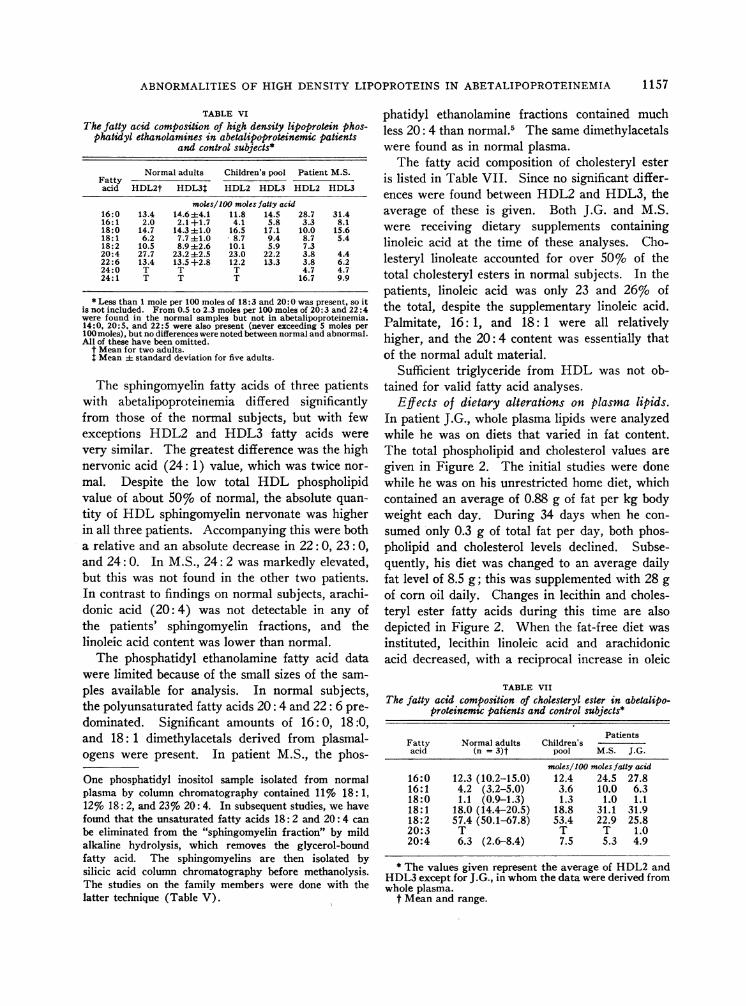
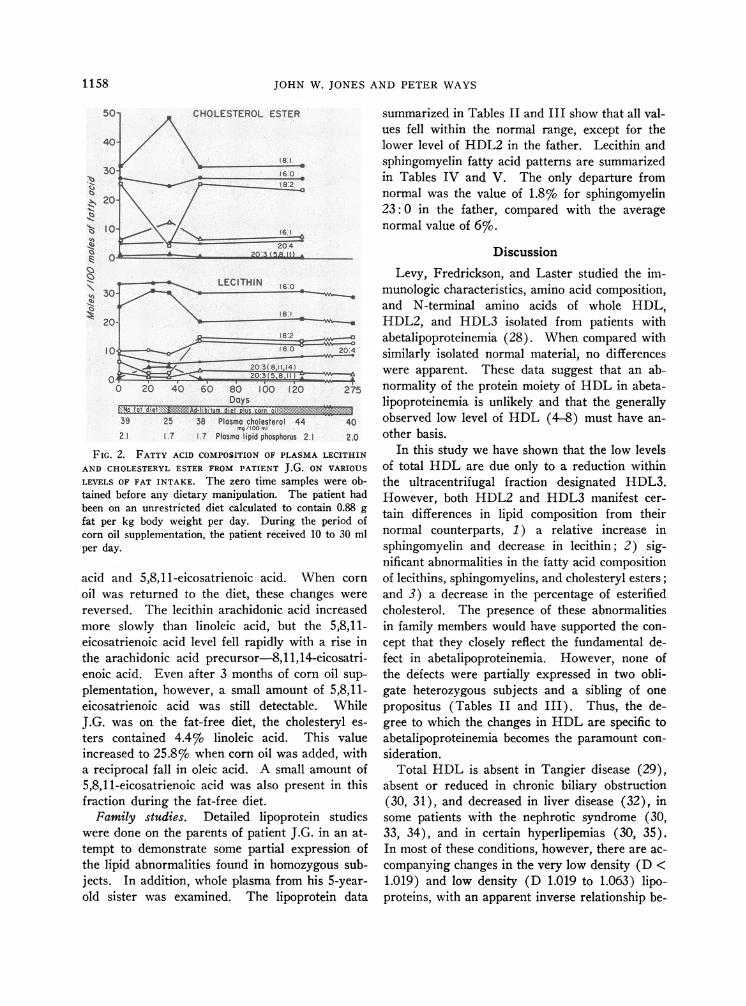
Effects of dietary alterations on plasma lipids.In patient J.G., whole plasma lipids were analyzedwhile he was on diets that varied in fat content.The total phospholipid and cholesterol values aregiven in Figure 2. The initial studies were donewhile he was on his unrestricted home diet, whichcontained an average of 0.88 g of fat per kg bodyweight each day. During 34 days when he con-sumed only 0.3 g of total fat per day, both phos-pholipid and cholesterol levels declined. Subse-quently, his diet was changed to an average dailyfat level of 8.5 g; this was supplemented with 28 gof corn oil daily. Changes in lecithin and choles-teryl ester fatty acids during this time are alsodepicted in Figure 2. When the fat-free diet wasinstituted, lecithin linoleic acid and arachidonicacid decreased, with a reciprocal increase in oleic
TABLE VIIThe fatty acid composition of cholesteryl ester in abetalipo-
proteinemic patients and control subjects*
PatientsFatty Normal adults Children'sacid (n = 3)t pool M.S. J.G.
moles/100 moles fatty acid16:0 12.3 (10.2-15.0) 12.4 24.5 27.816:1 4.2 (3.2-5.0) 3.6 10.0 6.318:0 1.1 (0.9-1.3) 1.3 1.0 1.118:1 18.0 (14.4-20.5) 18.8 31.1 31.918:2 57.4 (50.1-67.8) 53.4 22.9 25.820:3 T T T 1.020:4 6.3 (2.6-8.4) 7.5 5.3 4.9
* The values given represent the average of HDL2 andHDL3except for J.G., in whomthe data were derived fromwhole plasma.
t Mean and range.
1157
JOHN W. JONES AND PETER WAYS
0,tu
30-
20-
LECITHIN 6.0
18 1_I ~18:2
10^ ~~~~~~~~~~~~~~10 / 180& 204
203-8,11, 14C)~~ ~ ~ ~ ~~.0:3 (5,8.11)!
_ I
0 20 40 60 80 100 1220Days
1.0No ditts -itum 4i4[21# c.Q rn:
39 25 38 Plasma cholesterol 44 40g/100 ml
2.1 1.7 7 Plasma lipid phosphorus 2.1 2.0
FIG. 2. FATTY ACID COMPOSITION OF PLASMALECITHIN
AND CHOLESTERYLESTER FROM PATIENT J.G. ON VARIOUS
LEVELS OF FAT INTAKE. The zero time samples were ob-tained before any dietary manipulation. The patient hadbeen on an unrestricted diet calculated to contain 0.88 gfat per kg body weight per day. During the period ofcorn oil supplementation, the patient received 10 to 30 mlper day.
acid and 5,8,11-eicosatrienoic acid. When cornoil was returned to the diet, these changes werereversed. The lecithin arachidonic acid increasedmore slowly than linoleic acid, but the 5,8,11-eicosatrienoic acid level fell rapidly with a rise inthe arachidonic acid precursor-8,11,14-eicosatri-enoic acid. Even after 3 months of corn oil sup-plementation, however, a small amount of 5,8,11-eicosatrienoic acid was still detectable. WhileJ.G. was on the fat-free diet, the cholesteryl es-ters contained 4.4% linoleic acid. This valueincreased to 25.8% when corn oil was added, witha reciprocal fall in oleic acid. A small amount of5,8,11-eicosatrienoic acid was also present in thisfraction during the fat-free diet.
Family studies. Detailed lipoprotein studieswere done on the parents of patient J.G. in an at-tempt to demonstrate some partial expression ofthe lipid abnormalities found in homozygous sub-jects. In addition, whole plasma from his 5-year-old sister was examined. The lipoprotein data
summarized in Tables II and III show that all val-ues fell within the normal range, except for thelower level of HDL2 in the father. Lecithin andsphingomyelin fatty acid patterns are summarizedin Tables IV and V. The only departure fromnormal was the value of 1.8% for sphingomyelin23: 0 in the father, compared with the averagenormal value of 6%o.
DiscussionLevy, Fredrickson, and Laster studied the im-
munologic characteristics, amino acid composition,and N-terminal amino acids of whole HDL,HDL2, and HDL3 isolated from patients withabetalipoproteinemia (28). When compared withsimilarly isolated normal material, no differenceswere apparent. These data suggest that an ab-normality of the protein moiety of HDL in abeta-lipoproteinemia is unlikely and that the generallyobserved low level of HDL (4-8) must have an-other basis.
In this study we have shown that the low levelsof total HDL are due only to a reduction withinthe ultracentrifugal fraction designated HDL3.However, both HDL2 and HDL3 manifest cer-tain differences in lipid composition from theirnormal counterparts, 1) a relative increase insphingomyelin and decrease in lecithin; 2) sig-nificant abnormalities in the fatty acid compositionof lecithins, sphingomyelins, and cholesteryl esters;and 3) a decrease in the percentage of esterifiedcholesterol. The presence of these abnormalitiesin family members would have supported the con-cept that they closely reflect the fundamental de-fect in abetalipoproteinemia. However, none ofthe defects were partially expressed in two obli-gate heterozygous subjects and a sibling of onepropositus (Tables II and III). Thus, the de-gree to which the changes in HDL are specific toabetalipoproteinemia becomes the paramount con-sideration.
Total HDL is absent in Tangier disease (29),absent or reduced in chronic biliary obstruction(30, 31), and decreased in liver disease (32), insome patients with the nephrotic syndrome (30,33, 34), and in certain hyperlipemias (30, 35).In most of these conditions, however, there are ac-companying changes in the very low density (D <1.019) and low density (D 1.019 to 1.063) lipo-proteins, with an apparent inverse relationship be-
1158
ABNORMALITIES OF HIGH DENSITY LIPOPROTEINS IN ABETALIPOPROTEINEMIA 1
tween very low density and high density lipopro-tein concentrations (36, 37). Conversely, inabetalipoproteinemia, with almost complete ab-sence of all low density lipoproteins, the total highdensity fraction is decreased rather than increased.The relationship between HDL2 and HDL3 ob-served in this study may also be unique. Whereasboth physiologic and pathologic variations in theconcentrations of HDL2 and HDL3 do occur (30,36, 38), there have been no reports of normalHDL2 and low HDL3.7
The specificity of the altered distribution ofHDL phospholipid found in abetalipoproteinemiais difficult to establish. A similar but less strik-ing reduction in the lecithin: sphingomyelin ratiois found in fetal cord whole plasma, LDL, andHDL (13, 38). Changes equal to those in abeta-lipoproteinemia have been found in the wholeplasma of patients with nephrotic syndrome byNye and Waterhouse, but they were apparentlyconfined to the low density lipoproteins (34).Since malabsorption is a prominent feature ofabetalipoproteinemia, we have evaluated plasmaphospholipid distribution in four patients withsteatorrhea of another etiology. With one ex-ception, they had approximately half the normallevels of total plasma cholesterol and phospholipid,but their whole plasma lecithin: sphingomyelinratio was normal (38).
The fatty acid abnormalities found in abetalipo-proteinemia appear to be at least partly nonspecific.Three subjects with steatorrhea of another etiologyall had low levels of linoleic acid in their plasmalipids. In J.G., the low level of linoleic acid in
7 Levy and Fredrickson recently demonstrated that, dur-ing ultracentrifugation, the electrophoretically homogene-ous alpha-i lipoproteins from normal subjects (39) andfrom patients with abetalipoproteinemia (28) becomeheterogeneous. HDL2 retains the electrophoretic andimmunological characteristics of the alpha-i lipoproteinof fresh whole plasma, whereas HDL3 consists of twofractions, one identical to the original alpha-i lipopro-tein, and the other with different electrophoretic migrationand immunologic reactivity. This altered fraction pre-sumably contains less lipid relative to protein. Thesefindings suggest that, to an unknown extent, the datareported in the present study on the concentration ofHDL2 and HDL3 are artifactual. This does not, how-ever, alter the significance of a reduction in total HDLand differences between the relative proportions ofHDL2 and HDL3 in patients with abetalipoproteinemiacompared to normal subjects.
lecithin and cholesteryl esters was raised by addingcorn oil to the diet. During this supplementation,J.G. had a linoleic acid intake well above the 2.8%level of total calories sufficient to maintain normalplasma linoleic and arachidonic acid levels inadults (40). Nevertheless, his lecithin linoleicacid content did not reach a normal level evenafter 8 months of corn oil supplementation (10 to15 ml per day). This suggests that factors otherthan diet were influencing fatty acid composition.Whether the sphingomyelin fatty acid data can beexplained, even in part, by a deficiency of ab-sorbed or dietary fat remains unclear. The strik-ing increase in the level of 24: 1 has not beenpreviously reported for other diseases and was notdiminished appreciably in J.G. by dietary changeor supplementation. However, the plasma sphingo-myelin fatty acids from one patient with malab-sorption of another cause and one obese subjectstarved for 3 months revealed high levels of 24: 1(23.2 and 25.7 moles per 100 ml, respectively)(38). This suggests that the change in 24: 1 mayalso be a function of the type or amount of fat ab-sorbed, but perhaps slower to change than thelecithin and cholesteryl ester linoleate fractions.
To recapitulate, it appears that the low levelsof HDL3 and the phospholipid abnormalities ofthe magnitude seen in the HDL of our patientsmay be specific to abetalipoproteinemia. Thechanges in fatty acid composition, on the otherhand, are, at least in part, related to the malab-sorption.
If the low HDL3 and the abnormalities of HDLphospholipid distribution are related to the pri-mary defect in abetalipoproteinemia, how are theyto be explained? One possibility is that such ab-normalities are secondary to the absence of betalipoprotein. Also, they might reflect a funda-mental derangement of phospholipid metabolismthat causes both absence of beta lipoprotein andabnormal alpha lipoprotein formation. If the firstexplanation is correct, one could reasonably sus-pect that the primary defect lies in the productionof apolipoprotein. Someevidence exists that lipid-free beta lipoprotein can recognize antibodies toLDL; if so, the apobeta lipoprotein is not circu-lating in the plasma of these patients (28).8
8 It seems likely that the protein common to most orall LDL is not present in the plasma, since antibodiesused for detection of LDL apparently "recognize" the
1159
JOHN W. JONES AND PETERWAYS
On the other hand, if the phospholipid abnor-malities are primary, one might expect similarchanges in phospholipid distribution in othertissues. Reversals in the lecithin: sphingomyelinratio of the red cell are well documented (3, 4),but these have been shown to be secondary to theplasma abnormalities (41). Limited data indicatethat the gastrointestinal mucosa of patients withabetalipoproteinemia has a normal phospholipiddistribution (11) ; in any event, the gross ab-normalities seen in plasma are not present.
Although the nature of the fundamental defectremains unresolved by direct evidence, the avail-able data build a circumstantial case against thepresence of the apobeta lipoprotein in plasma.Whether it is not synthesized, is not released fromits site of synthesis, or is destroyed before reach-ing the plasma compartment cannot be determinedfrom the evidence on hand.
Finally, in retraction of a previous statement(4), we suggest that abetalipoproteinemia in theuntreated state should now be provisionally re-garded as an example of essential fatty acid de-ficiency in man. Earlier, less sensitive gas-liquidchromatographic studies failed to reveal the pres-ence of 5,8,11-eicosatrienoic acid, long regardedas the chemical signature of essential fatty aciddeficiency in experimental animals. This studyand those of others (42) have now demonstratedthe presence of this abnormal fatty acid on thebasis of retention data on gas-liquid chromatog-raphy. Only fatty acid degradation studies re-main to obtain final proof.
Acknowledgments
We are grateful to Dr. Marion Erlandson for makingplasma from J.D. available and to Dolores Dong andBonnie Sinnot for expert technical assistance. We alsothank Dr. Claude F. Reed for furnishing us with hismodification of the Liebermann-Burchard reaction.
References1. Jones, J. W., and P. Ways. Abnormalities of high
density lipoprotein in a-beta lipoproteinemia (acan-thocytosis). Clin. Res. 1965, 13, 325.
2. Farquhar, J., and P. Ways. Abetalipoproteinemia inThe Metabolic Basis of Inherited Disease, 2nd ed.,J. B. Stanbury, J. B. Wyngaarden, and D. S. Fred-
lipid free moiety alone.... However, this is not certain,since removal of the lipid from LDL is difficult and notall the protein is recovered (2).
rickson, Eds. New York, McGraw-Hill, 1966, p.509.
3. Phillips, G. B. Quantitative chromatographic analy-sis of plasma and red cell lipids in patients withacanthocytosis. J. Lab. clin. Med. 1962, 59, 357.
4. Ways, P., C. F. Reed, and D. J. Hanahan. Red-celland plasma lipids in acanthocytosis. J. clin. Invest.1963, 42, 1248.
5. Salt, H. B., 0. H. Wolff, J. K. Lloyd, A. S. Fos-brooke, A. H. Cameron, and D. V. Hubble. Onhaving no beta-lipoprotein. A syndrome compris-ing a-beta-lipoproteinemia, acanthocytosis, andsteatorrhoea. Lancet 1960, 2, 325.
6. Lamy, M., J. Fre'zal, J. Polonovski, G. Druez, andJ. Rey. Congenital absence of beta-lipoproteins.Pediatrics 1963, 31, 277.
7. Druez, G., M. Lamy, J. Frezal, J. Polonovski, and J.Rey. L'acanthocytose: ses rapports avec l'absencecongenitale de beta-lipoproteines. Presse med.1961, 69, 1546.
8. Lamy, M., J. Frezal, J. Polonovski, and J. Rey.L'absence congenitale de beta-lipoproteines. Pressemed. 1961, 69, 1511.
9. Simon, E. R., and P. Ways. Incubation hemolysisand red cell metabolism in acanthocytosis. J. clin.Invest. 1964, 43, 1311.
10. Kayden, H. J., and R. Silber. The role of vitamin Edeficiency in the abnormal autohemolysis of acan-thocytosis. Trans. Ass. Amer. Phycns 1965, 78,334.
11. Ways, P. O., C. M. Parmentier, H. J. Kayden, J. W.Jones, D. R. Saunders, and C. E. Rubin. Studieson the absorptive defect for triglyceride in abetali-poproteinemia. J. clin. Invest. 1967, 46, 35.
12. Havel, R. J., H. A. Eder, and J. H. Bragdon. Thedistribution and chemical composition of ultracen-trifugally separated lipoproteins in human serum.J. clin. Invest. 1955, 34, 1345.
13. Crowley, J., P. Ways, and J. W. Jones. Humanfetal erythrocyte and plasma lipids. J. clin. In-vest. 1965, 44, 989.
14. Ways, P., and D. J. Hanahan. Characterization andquantification of red cell lipids in normal man.J. Lipid Res. 1964, 5, 318.
15. Reed, C. F., S. N. Swisher, G. V. Marinetti, and E. G.Eden. Studies of the lipids of the erythrocyte. I.Quantitative analysis of the lipids of normal hu-man red blood cells. J. Lab. clin. Med. 1960, 56,281.
16. Dittmer, J. C., and R. L. Lester. A simple, specificspray for the detection of phospholipids on thin-layer chromatograms. J. Lipid Res. 1964, 5, 126.
17. Masoro, E. J., L. B. Rowell, and R. M. McDonald.Skeletal muscle lipids. I. Analytical method andcomposition of monkey gastrocnemius and soleusmuscles. Biochim. biophys. Acta (Amst.) 1964,84, 493.
18. Lowry, 0. H., M. J. Rosebrough, A. L. Farr, andR. J. Randall. Protein measurement with the
160
ABNORMALITIES OF HIGH DENSITY LIPOPROTEINS IN ABETALIPOPROTEINEMIA
Folin phenol reagent. J. biol. Chem. 1951, 193,265.
19. Hanahan, D. J., R. M. Watts, and D. Pappajohn.Some chemical characteristics of the lipids of hu-man and bovine erythrocytes and plasma. J. LipidRes. 1960, 1, 421.
20. Leveille, G. A., J. W. Schockley, and H. E. Sauber-lich. The influence of cholesterol on the deter-mination of serum glycerides. U. S. Army Medi-cal Research and Nutrition Laboratory, report 255,1961.
21. Kritchevsky, D. Cholesterol. New York, John Wiley& Sons, 1958.
22. Phillips, G. B. The isolation and quantitation of theprinciple phospholipid components of human se-rum using chromatography on silicic acid. Bio-chim. biophys. Acta (Amst.) 1958, 29, 594.
23. Nye, W. H. R., C. Waterhouse, and G. V. Marinetti.The phosphatides of human plasma. I. Normalvalues determined by paper and column chroma-tography. J. clin. Invest. 1961, 40, 1194.
24. Vogel, W. C., L. Zieve, and R. 0. Carleton. Meas-urement of serum lecithin, lysolecithin and sphingo-myelin by a simplified chromatographic technique.J. Lab. clin. Med. 1962, 59, 335.
25. Phillips, G. B. Lipid composition of human serumlipoprotein fraction with density greater than1.210. Proc. Soc. exp. Biol. (N. Y.) 1959, 100,14.
26. Dodge, J. T., G. Cohen, H. J. Kayden, and G. B.Phillips. Peroxidative hemolysis of red blood cellsfrom patients with abetalipoproteinemia (acantho-cytosis). J. clin. Invest. 1967, 46, 357.
27. Sweeley, C. C. Purification and partial character-ization of sphingomyelin from human plasma. J.Lipid Res. 1963, 4, 402.
28. Levy, R. I., D. S. Fredrickson, and L. Laster. Thelipoproteins and lipid transport in abetalipoproteine-mia. J. clin. Invest. 1966, 45, 531.
29. Fredrickson, D. S. Familial high-density lipoproteindeficiency: Tangier disease in The Metabolic Ba-sis of Inherited Disease, 2nd ed., J. B. Stanbury,J. B. Wyngaarden, and D. S. Fredrickson, Eds.New York, McGraw-Hill, 1966, p. 497.
30. Gofman, J. W., 0. F. DeLalla, F. Glazier, N. K.Freeman, F. T. Lindgren, A. V. Nichols, B.
Stesower, and A. R. Tamplin. The serum lipo-protein transport system in health, metabolic dis-orders, atherosclerosis and coronary heart disease.Plasma (Milano) 1954, 2, 413.
31. Russ, E. M., J. Raymunt, and D. Barr. Lipopro-teins in primary biliary cirrhosis. J. clin. Invest.1956, 35, 133.
32. Phillips, G. B. The lipid composition of serum inpatients with liver disease. J. clin. Invest. 1960,39, 1639.
33. Gitlin, D., D. G. Cornwell, D. Nakasato, J. L. On-cley, W. L. Hughes, Jr., and C. A. Janeway.Studies on the metabolism of plasma proteins inthe nephrotic syndrome. II. The lipoproteins. J.dlin. Invest. 1958, 37, 172.
34. Nye, W. H. R., and C. Waterhouse. The phospha-tides of human plasma. II. Abnormalities en-countered in the nephrotic syndrome. J. dlin. In-vest. 1961, 40, 1202.
35. Havel, R. J., and R. S. Gordon, Jr. Idiopathic hy-perlipemia: metabolic studies in an affected family.J. dlin. Invest 1960, 39, 1777.
36. Fredrickson, D. S., and R. S. Lees. Familial hy-perlipoproteinemia in The Metabolic Basis of In-herited Disease, 2nd ed., J. B. Stanbury, J. B.Wyngaarden, and D. S. Fredrickson, Eds. NewYork, McGraw-Hill, 1966, p. 429.
37. Nichols, A., C. S. Rehnborg, F. T. Lindgren, and R.D. Wills. Effects of oil ingestion on lipoproteinfatty acids in man. J. Lipid Res. 1962, 3, 320.
38. Lloyd, J. K., J. Crowley, J. W. Jones, and P. Ways.Unpublished data.
39. Levy, R. I., and D. S. Fredrickson. Heterogeneityof plasma high density lipoproteins. J. clin. In-vest. 1965, 44, 426.
40. Scott, R. F., K. T. Lee, D. N. Kim, E. S. Morrison,and F. Goodale. Fatty acids of serum and adiposetissue in six groups eating natural diets containing7 to 40 per cent fat. Amer. J. clin. Nutr. 1964,14, 280.
41. Ways, P., and D. Dong. Etiology of the RBCphos-pholipid abnormalities in A-beta lipoproteinemia(abstract). Clin. Res. 1965, 13, 283.
42. Dodge, J. T., and G. B. Phillips. Personal communi-cation.
1 161
Related Documents