ABILTY OF COLLEGE STUDENTS TO SIMULATE ADHD ON OBJECTIVE MEASURES OF ATTENTION A Dissertation Submitted to the Graduate Faculty of the Louisiana State University and Agricultural and Mechanical College in partial fulfillment of the requirements for the degree of Doctor of Philosophy In The Department of Psychology by Randee Lee Booksh B.A, University of New Orleans, 1995 M.A., Southeastern Louisiana University, 1999 December 2005

Welcome message from author
This document is posted to help you gain knowledge. Please leave a comment to let me know what you think about it! Share it to your friends and learn new things together.
Transcript
ABILTY OF COLLEGE STUDENTS TO SIMULATE ADHD ON OBJECTIVE MEASURES OF ATTENTION
A Dissertation
Submitted to the Graduate Faculty of the Louisiana State University and
Agricultural and Mechanical College in partial fulfillment of the
requirements for the degree of Doctor of Philosophy
In
The Department of Psychology
by Randee Lee Booksh
B.A, University of New Orleans, 1995 M.A., Southeastern Louisiana University, 1999
December 2005

ii
DEDICATION
This work is dedicated to Ellen D. Lee.

iii
ACKNOWLEDGEMENTS
I would like to thank my committee members: Wm. Drew Gouvier, Ph.D.,
my major professor, Paula Geiselman, Ph.D., my minor professor, Phillip J.
Brantley, Ph.D., Alan Baumeister, Ph.D., and Melinda Solmon, Ph.D. for their
guidance in the development and preparation of this dissertation. I would also
like to thank Susan R. Andrews, Ph.D., for volunteering her time and expertise as
a �blind� clinical neuropsychologist in this study (but mostly I thank her for her
enduring encouragement and mentorship over so many years). The support of
my family and friends is acknowledged whole heartedly. I thank my husband and
daughters, my truest source of inspiration, for their many sacrifices and for
making it all worthwhile.
iv
TABLE OF CONTENTS
DEDICATION����������������������������...ii
ACKNOWLEDGEMENTS�����������������������...iii ABSTRACT���������������������������..��.vi INTRODUCTION��������������������������.�.1 Historical Perspectives����������������������.1 Defining ADHD�������������������������..4
Pathogenesis of ADHD����������������������8 Course of ADHD�����������������������.�11 Diagnosing ADHD in Adults������������������..�12 Differential Diagnosis����������������������.15 Comorbidity in Adults with ADHD����������������....16 Prevalence of ADHD in Adults and College Students��������..16 Academic Functioning and Associated Psychopathology in College Students with ADHD�������������������18 Treatment of ADHD�����������������������21 Psychosocial Treatments����������������..�21 Pharmacology���������������������.�23 Defining Malingering���������������������..�24 Assessing Malingering���������������������..27
Malingering and ADHD���������������������..30 PURPOSE OF STUDY������������������������..31 Research Questions and Hypotheses���������������.31 Question 1������������������������31 Question 2������������������������32 Question 3������������������������33 METHOD..�����������������������������...34 Participants���������������.��.���������34
Materials����������������.��.���������35 Interviews and Questionnaires������������������.35
Structured Clinical Interview���������������.�35 Feedback Questionnaire��������������..��.�35
ADHD Knowledge and Opinions Survey-Revised����..�.�.36 Mini International Neuropsychiatric Interview��������....36
Objective Measures of Attention���������������..��36 Connors� Continuous Performance Test ����������...36
Trial Making Test ��������������������..37 Wechsler Adult Intelligence Scale-Third Edition: Digit Symbol-Coding, Digit Span, Symbol Search, and Letter-Number Sequencing subtests�������������������..37

v
Self-Report Measures of ADHD Symptoms���������..�.��38 Attention-Deficit Scales for Adults����������..�.��38
Wender Utah Rating Scale�������������..��.�39 Effort Tests�������������.������������....39
Memorization of 15 Items�������������..�..�.�39 The Word Memory Test�������������..��..��39
Design and Procedure�������������������..��42 RESULTS����������������������������....�46 Demographic Characteristics�����������������...�46 Preliminary Analyses�������������������. �..�.47 Objective Measures������������������.����..48 Self-Report Measures����������������..��. �.�.49 Effort Measures������������������������..49 Multivariate Analysis of Variance����������������....50 Primary Analyses����������������������..�.51 Question 1����������������������..�51.
Objective Measures���������������..����51 Self-Report Measures����������������..��55 Question 2��������������������..���57 Question 3�������������������..����58 DISCUSSION�������..����������������..��.��62 CONCLUSION���������..������������������..72 REFERENCES�����������..����������������.75 APPENDIX A. CONSENT FORM�.������������������������84 B. STRUCTURED CLINICAL INTERVIEW�..�������������.�88 C. FEEDBACK QUESTIONNAIRE�������������������..89 VITA������������������������������.�.�90

vi
ABSTRACT
Complaints of ADHD symptoms in college students are not uncommon and
college students frequently self-refer for assessment of ADHD. Some may seek
out a diagnosis to obtain academic accommodations and/or stimulant
medication. Diagnosing ADHD in college students is largely reliant on self-report
measures, and to a lesser extent, objective measures of attention. The typical
college student has easy access to information about ADHD, potentially
facilitating efforts to simulate self-reported symptoms. The present study
examined the ability of college students to effectively simulate ADHD on
objective and self-report measures of attention, and examined the relationship
between knowledge of ADHD and ability to simulate. It was hypothesized that
knowledge of ADHD would be significantly correlated with ability to simulate
ADHD on self-report measures but would be less strongly correlated with ability
to simulate ADHD on objective measures of attention. Results show that college
students were able to successfully simulate ADHD on a retrospective self-report
measure of childhood symptoms, but were not as able to simulate ADHD on a
commonly used self-report measure of current ADHD symptoms. On objective
measures of attention, college students asked to simulate ADHD, scored
similarly to participants with ADHD on four subtests of the WAIS-III that have
been found to be sensitive to attentional difficulties, but scored markedly worse
than ADHD participants on a computerized test of sustained attention and a
commonly used test of alternating attention. Clinicians are cautioned against
reliance on the WAIS-III for objective measurement of ADHD symptoms.

1
INTRODUCTION
The most commonly diagnosed psychological disorder of childhood today
is Attention-Deficit/Hyperactivity Disorder (ADHD), with an estimated prevalence
rate between 3 and 5% of all children (American Psychiatric Association
Diagnostic and Statistical Manual of Mental Disorders, 1994). Once considered a
disorder exclusively of childhood, current research indicates between 50 and
65% of diagnosed children continue to experience core clinical symptoms or
related behavior problems into adulthood (Rapport, 2001).
This dissertation examines the ability of college students to simulate
ADHD on objective measures of attention and discusses relevant implications for
assessment of ADHD in college students. A historical perspective of ADHD and
current research on the pathogenesis, course, differential diagnosis, and
treatment of ADHD in adults, as well as discussion of some special issues
pertaining to ADHD in college populations is presented. The problem of
malingering in neuropsychological assessment and its relationship and
implications for the assessment of ADHD is also addressed.
Historical Perspectives
ADHD is a behavioral syndrome characterized by a persistent pattern of
inattentiveness and/or hyperactivity/impulsivity that is maladaptive and
inconsistent with normal developmental patterns (DSM-IV-TR). Although serious
clinical attention to children with the disorder first appeared in the early 20th
century, references to individuals with attention and/or impulse maladies can be
found much earlier in Shakespeare�s King Henry VIII, German physician Heinrich

2
Hoffman�s19th century poem �Fidgety Phil�, and in William James� 1890
Principles of Psychology (Barkley, 1996).
The conceptualization of and terminology for ADHD has changed
considerably since the earliest descriptions of children with that symptom
constellation were offered. Three published lectures of the English physician
George Still (1902) refer to a group of 20 children seen in his clinical practice with
symptoms of inattentiveness, impulsivity, lawlessness, aggressiveness, and
over-activity. The similarity of Still�s clinical sample to current research samples is
noted. Still observed greater prevalence in males relative to females, familial
predisposition for the disorder, and found increased incidence of alcoholism,
criminal conduct, and depression in biological relatives of affected children.
Although Still described the children as having �a defect in moral control� (p.
1009), he conceptualized the disorder as a physical condition, rather than a
moral failing, possibly due to heredity or acquired nervous system damage.
Early in the 20th century, North American researchers and clinicians also
assumed an association between brain damage and behavioral disturbance in
children. This connection had been observed in child survivors of the encephalitis
pandemic in the early 20�s and also in instances of birth trauma, head injury,
toxin exposure, and cerebral infection, giving rise to concept of a brain�injured
child syndrome. This soon evolved to the moniker �minimal brain damage� to
refer to children who would now be diagnosed with ADHD (Barkley, 1996;
Ehrenfest, 1926; Oltmanns & Emery, 1995). The term minimal brain damage
persisted into the early 50�s and was applied to children with and without
measurable brain damage alike. However, the concept gradually fell into disuse

3
due to the absence of evidence of brain damage in many symptomatic children.
The term minimal brain dysfunction was subsequently used until the mid 60�s,
reflecting a shift in paradigm from an assumption of brain damage to a
hypothesis of brain dysfunction to explain the behavioral disturbance associated
with ADHD (Rapport, 2001).
During the same period, 1950-1960, researchers and clinicians focusing
on the hyperactive and impulsive features of the disorder labeled the condition
hyperkinetic impulse disorder, postulated to be due to thalamic dysfunction
resulting in cortical overstimulation (Knobel, Wolman, & Mason, 1959). The
increasing focus on excessive motor movement led to the notion of a hyperactive
child syndrome (Chess, 1960). Though many still believed the condition to be
primarily neurological in nature, the second edition of the American Psychiatric
Association�s Diagnostic and Statistical Manual (1968) used the label
hyperkinetic reaction of childhood. This label implies rejection of the equivocal
hypothesis of brain dysfunction and embraced the prevailing psychoanalytic
theory of that time which held that all mental disorders of childhood were
�reactions� (Barkley, 1996; Rapport, 2001). Hyperkinetic reaction of childhood
was thought to diminish in adolescence. The DSM-III (1980) classified the
condition under Disruptive Behavior Disorders and retitled the disorder Attention
Deficit Disorder (ADD) focusing on attentional deficits as the core features with
the component of hyperactivity being neither necessary nor sufficient on its own
to establish the diagnosis. Two types of ADD were differentiated based on the
presence of hyperactivity (ADDH) or its absence (ADD).

4
The DSM-III-R (1987) renamed the disorder Attention Deficit Hyperactivity
Disorder returning to the notion that both attention difficulties and
hyperactive/impulsive symptoms characterized the disorder. ADHD without
hyperactivity was relegated to a category referred to as undifferentiated attention
deficit disorder (UAD). The DSM-IV (1994) reapplied the distinction between
attention deficit disorder with and without hyperactivity, naming the disorder
Attention-Deficit/Hyperactivity Disorder.
Defining ADHD
ADHD is currently defined by the criteria contained in the DSM-IV-TR
(2000), which defines ADHD according to two behavioral domains: inattention
and hyperactivity-impulsivity, each domain containing nine possible symptoms.
Four types of ADHD are defined: Attention-Deficit/Hyperactivity Disorder,
Predominantly Inattentive Type, in which at least 6 core symptoms of inattention
are present; Attention-Deficit/Hyperactivity Disorder, Predominantly Hyperactive-
Impulsive Type, in which at least 6 core symptoms of hyperactivity-impulsivity are
present, and Attention-Deficit/Hyperactivity Disorder, Combined Type, in which at
least 6 symptoms of inattention and 6 symptoms of hyperactivity-impulsivity are
present. These symptoms must have persisted for at least 6 months to a degree
that is maladaptive and developmentally deviant and must cause significant
impairment in social, academic, or occupational settings, with impairment in at
least 2 settings. Some of the symptoms that cause impairment must have been
present before age 7. The symptoms do not occur exclusively within the course
of a Pervasive Developmental Disorder or Psychotic Disorder, and are not better
accounted for by another mental disorder (e.g. Mood Disorder, Anxiety Disorder,

5
Dissociative Disorder, or a Personality Disorder). The fourth type, Attention-
Deficit/Hyperactivity Disorder, Not Otherwise Specified, is a category reserved for
individuals with prominent symptoms of inattention or hyperactivity that do not
meet full criteria for the disorder, such as, individuals with onset of the disorder
after age seven.
The inattentive symptoms include: (a) often fails to give close attention to
details or makes careless mistakes in schoolwork, work, or other activities (b)
often has difficulty sustaining attention in tasks or play activities (c) often does
not seem to listen when spoken to directly (d) often does not follow through on
instructions and fails to finish schoolwork, chores, or duties in the workplace (not
due to oppositional behavior or failure to understand instructions) (e) often has
difficulty organizing tasks (f) often avoids, dislikes, or is reluctant to engage in
tasks that require sustained mental effort (such as schoolwork or homework) (g)
often loses things necessary for tasks or activities (h) is often easily distracted by
extraneous stimuli (i) is often forgetful in daily activities.
The symptoms of hyperactivity include: (a) often fidgets with hands or feet
or squirms in seat (b) often leaves seat in classroom or in other situations in
which remaining seated is expected (c) often runs about or climbs excessively in
situations in which it is inappropriate (in adolescents or adults, may be limited to
subjective feelings of restlessness) (d) often has difficulty playing or engaging in
leisure activities quietly (e) is often �on the go� or often acts as if �driven by a
motor� (f) often talks excessively. The symptoms of impulsivity include: (g) often
blurts out answers before questions have been completed (h) often has difficulty
awaiting turn (i) often interrupts or intrudes on others (e.g., butts into

6
conversations or games). A coding note, applying especially to adolescents and
adults, recommends the qualifier �In Partial Remission� should be used for
individuals who have symptoms, which no longer meet the full criteria. As the
coding note implies, a reduction in degree of severity of some symptoms with
increasing age has been found. Although the Practice Parameters for the
Assessment and Treatment of Children, Adolescents, and Adults with Attention-
Deficit/Hyperactivity Disorder (Dulcan & Work Group on Quality Issues, 1997)
recommend that the DSM-IV criteria for ADHD be used to identify adults with the
disorder, researchers have questioned the applicability of the criteria to adults.
The field trials associated with development of the DSM-IV criteria consisted of
individuals between the ages of 4 and 17 years from 11 sites across the United
States (Lahey et al., 1994). Some of the current literature on adult ADHD
suggests the DSM criteria thresholds are too high when applied to adults in
general (Barkley, 1996) and university students specifically (Heiligenstein,
Conyers, Berns, Miller & Smith, 1998).
Murphey and Barkley (1995) collected norms for the DSM-IV item lists on
a sample of 467 community-living adults ages 17 to 84 years and found the
symptom threshold required to place an individual at the 93rd percentile for their
respective age group decreased significantly with age. Barkley (1996) suggested
ADHD likely represents a developmentally relative deficit, much like mental
retardation, and noted the DSM-IV criteria contain items developmentally
appropriate for the relatively young age group used in the field trial, but not
necessarily for individuals falling outside of that age group. He suggested that the
identified subtypes of the disorder (e.g., primarily inattentive, primarily

7
hyperactive-impulsive, and combined type) may actually represent the
manifestations of the same disorder at different stages of development.
Hyperactivity is more prominent in affected children relative to affected adults
while symptoms of inattention, disorganization, and impulsivity typically persist
into adulthood (Pary et al., 2002).
Conversely, O�Donnell, McGann, and Pluth (2001) found that adults
reporting a prior childhood diagnosis of ADHD are more likely than controls to
make extreme self-ratings on 7 of the 9 inattention, and 5 of the 9 hyperactivity-
impulsivity symptoms of the DSM-IV, suggesting the DSM-IV thresholds may be
appropriate for young adults. But these respondents were not blind to their
diagnostic history, and therefore quite likely to be familiar with the diagnostic
criteria. Despite the findings of O�Donnell, McGann, and Pluth, the DSM-IV-TR
symptom clusters, especially the criteria for hyperactivity/impulsivity, generally
appear to describe the clinical presentation of children and adolescents more
accurately than the clinical presentation of adults with ADHD.
Epidemiological studies incorporating diagnostic interviews and careful
review of symptoms indicate the childhood prevalence rate for ADHD is between
3% and 5% (American Psychiatric Association, 1994; Rapport, 2001). However,
this estimated prevalence rate is based on the number of individuals who present
to mental health professionals for diagnosis and some researchers have
suggested it may underestimate the true number of afflicted children (Shaywitz,
Shaywitz, Sebrechts, & Anderson, 1990). Currently, ADHD is the most commonly
diagnosed psychological disorder in children (Barkley, 1998; Pelham & Gnagy,
1999). The reported ratio of males to females is about 3:1 though the ratio varies

8
depending on ADHD subtype and setting (clinic or community). The syndrome
may be manifested differently in the sexes, with males exhibiting more
oppositional behavior and conduct disturbance than females, while females have
been found to have greater intellectual impairment than males. (Dulcan and the
Work Group on Quality Issues, 1997). A higher prevalence rate across both
sexes has been associated with lower socioeconomic status and urban living
(Rapport).
Pathogenesis of ADHD
Although many separate and often conflicting theories have been posited
regarding the etiology of ADHD, biological abnormalities are generally presumed
to be the primary cause, and environmental factors are thought to contribute to
the maintenance and severity of symptoms over time. Popular theories of ADHD
have supported an organic basis of the disorder; however, the research findings
are equivocal. Researchers have considered the role of brain structure, function,
and neurotransmitters in the etiology and expression of ADHD, and have looked
to twin studies for genetic contributions to the disorder.
Various brain structures and types of brain dysfunction have been
investigated. Much emphasis has been placed on studies which indicate
dysfunction in the cortical and subcortical structures that serve the frontal/striatal
system (Bradley & Golden, 2001; Rapport, 2001), though evidence has also
been provided for involvement of the posterior right parietal, left temporal, and
callosal regions in children with ADHD (Bradley & Golden, 2001). Studies
supporting the notion of frontal/striatal system dysfunction include work by Lou,
Hendrickson, and Bruhn (1984) demonstrating bilateral hypoperfusion in the

9
frontal lobes of ADHD children as assessed by computed tomography and
regional blood flow studies, and Zametkin & Liotta, (1998) who found
hypofunction and low metabolic activity at the prefrontal and caudate nucleus
area of the brain in ADHD participants using positron emission tomography and
single-photon emission tomography functional neuroimaging techniques.
Other proposed etiologies include dysfunction of cerebral monoamines or
neurotransmitter systems involving dopamine, norephinephrine, and/or serotonin
(Pary et al., 2002). Research with other disorders has demonstrated a potential
role of some neurotransmitters in attention problems. For example, deficiency in
mesocortical dopamine has been postulated as being related to defective
information processing, executive functioning, memory, and poor attention to
detail in schizophrenia (Davis, Kahn, Ko, Davidson, 1998).
Concordance rates of ADHD in families, adopted children, and
monozygotic (MZ) versus dizygotic (DZ) twins have demonstrated genetic factors
play a significant role in the etiology of ADHD for a substantial number of
children. In a review by Bradley & Golden, (2001) it was reported that between
10% and 35% of family members of children with ADHD have been found to
have the disorder. Across multiple twin studies, concordance rates for MZ twins
range from 50% to 80%, and rates for DZ twins range from 0% to 33%, with
heritability accounting for up to 40% of the variance in symptom presentation.
Overall, controlled studies have suggested a significant genetic contribution to
the development of ADHD,
Research efforts to identify specific environmental contributions to ADHD
have covered many areas including: pre- and perinatal cerebral pathology,

10
exposure to toxins, such as maternal smoking and alcohol consumption, and
food allergies. (Bradley & Golden, 2001).
Smoking during pregnancy is a risk factor for the development of
behavioral and cognitive impairments in children, due to the effects of nicotine on
the developing fetus including possible changes in the dopanergic activity of the
developing brain and fetal brain damage secondary to prolonged hypoxia
(Fielding, 1985, Milberger, Biderman, Faraone, Chen & Jones, 1996). Milberger,
Biederman, Faraone, & Jones (1998) used a regression analysis to predict
ADHD symptomotology among children who had siblings with ADHD and control
subjects and found that maternal smoking accounted for 29% of the variance
across participants. A study by Miberger, Biederman, Faraone, and Jones (1997)
examining pre- and perinatal factors potentially related to the development of
ADHD found significantly higher rates of maternal smoking in children with ADHD
relative to children without the diagnosis, no significant differences were found in
rates of maternal alcohol consumption or use of illicit drugs. Despite this, other
researchers have reported a link between prenatal exposure to alcohol and
ADHD. O�Malley & Nanson (2002) conducted a review of animal and human
research addressing fetal alcohol spectrum disorders (FASD) and ADHD and
reported many FASD patients, through out the lifespan, present with symptoms
consistent with ADHD, though symptoms are especially prominent during
childhood. ADHD in FASD patients is more likely to be of early onset, primarily
inattentive type, and associated with developmental, psychiatric, and medical
disorders. Frequently co-occurring psychiatric disorders include anxiety, mood,
conduct, and explosive disorders. Various developmental disabilities are often

11
present including mixed expressive-receptive language disorder, deficits in social
cognition, working memory, and mathematics.
Feingold (1975) was the first to postulate the possibility that hyperactivity
in children may result from intolerance or allergic reaction to food additives.
Though some researchers have demonstrated marked behavioral improvement
for some children following restricted diets, Bradley & Golden (2001) point out
that positive behavioral response to dietary interventions is likely to occur only in
a subset of children with ADHD who demonstrate food allergies.
Course of ADHD
Rapport (2001) reviewed several studies and described the course of
ADHD from early childhood through adulthood. During early childhood, children
with ADHD have been described by their parents as overactive, fearless,
disobedient, highly curious, and requiring high levels of adult supervision.
Symptoms of the disorder tend to be exacerbated upon entry into elementary
school as children are expected to sit still, pay attention, and participate in
organized activities for extended periods of time. Additionally, more than 25% of
children with ADHD exhibit significant difficulties in reading and/or other
academic areas. Difficulty completing homework assignments may contribute to
family conflict further complicating the clinical picture. Children with ADHD may
experience poor peer relationships and interpersonal difficulties due to problems
with inattention, impulsivity, and hyperactivity. Their increased likelihood of social
isolation may promote development of low self-esteem in later years.
Approximately 30-80% of children with ADHD continue to meet criteria for
the disorder as adolescents (Barkley, 1996; Rapport, 2001). Though problems
12
with obvious overactivity may transition to fidgeting and restlessness, difficulties
with attention/concentration, impulsivity, and following directions remain
prominent (Rapport). High rates of conduct disorder, characterized by a pattern
of serious and pervasive antisocial behaviors, have been reported for
adolescents who have ADHD with estimates ranging from 35% to 60%
(Biederman, Newcorn, & Sprinch, 1991; Rapport). Adolescents with comorbid
ADHD and Conduct Disorder are particularly vulnerable to problems with alcohol
and substance abuse (Horner & Scheibe, 1997; Milin, Loh, Chow, & Wilson,
1997; Rapport), once again complicating the clinical picture.
Core clinical symptoms, related behavioral problems, and suboptimal
outcomes, such as social skills deficits, antisocial behaviors, poorer work
records, lower job status, lower socioeconomic status, and unstable marriages as
adults persist into adulthood for approximately 30% to 70% of children diagnosed
with ADHD (Klein & Mannuzza, 1991; Rapport, 2001; Weiss et. al., 1985).
Prospective controlled naturalistic longitudinal studies of hyperactive children
have reported that only about 50% function well as adults (Dulcan and the Work
Group on Quality 1997). Only 5 to 12% of children diagnosed with ADHD earn a
college degree relative to 41% of control students without the disorder who are
enrolled in college.
Diagnosing ADHD in Adults
There are no unequivocal laboratory tests or physiological markers for
diagnosing ADHD; accurate diagnosis rests on clinician judgment. ADHD is a
behaviorally based disorder and behavioral observations are required to identify
and diagnose the disorder. Ideally, this clinical judgment is based on information

13
from multiple sources including patient report, corroborated report from relative or
significant others, direct observation of the patient in multiple settings, and
patient performance on objective tests of cognitive abilities (Dulcan & Work
Group on Quality Issues, 1997).
A thorough clinical interview should assess past and current medical,
psychosocial, and academic functioning as well as presence of criteria for ADHD.
The ADHD subscale of The Mini International Neuropsychiatric Interview
(Sheehan, 1998) and rating scales such as the Attention Deficit Scale for Adults
(Triolo & Murphey, 1996), the Brown Attention Deficit Disorder Scales (Brown,
1996), and the Conners� Adult ADHD Rating Scales (Conners, Erhardt, &
Sparrow, 1999), may be useful in assessing ADHD and associated symptoms in
adults. Retrospective self-report of childhood symptoms can be attained by the
Wender Utah Rating Scale (Ward, Wender, & Reiher, 1993). Additionally,
parents of college students can complete an ADHD childhood symptom checklist
(Barkley, 1990) retrospectively to establish the presence of ADHD in childhood.
Although retrospective self-reports tend to have good predictive power in
identifying adults with ADHD in settings in which the prevalence rate of ADHD is
high, such as ADHD clinics, retrospective diagnosis made exclusively on the
basis of self-reports is likely to produce false positives in three out of four cases
when the prevalence rate of ADHD more closely approximates that of the general
population, in primary care facilities, for example (Mannuzza, Klein, Klein,
Bessler, & Shrout, 2002). Additionally, in most research the accuracy of self-
reports, current or retrospective, has tended to be examined within the context of
studies in which participants did not stand to profit from obtaining a diagnosis of
14
ADHD. When patients are motivated by external gains such as access to
stimulant medication, or academic accommodations, the accuracy of self-report
should be more carefully considered and corroborated by others with an even
greater degree of diligence.
Tests of cognitive abilities, such as the Wechsler Adult Intelligence Scale
(Wechsler, 1997), or Woodcock Johnson Tests of Cognitive Abilities (Mather &
Woodcock, 2001), memory measures, such as the Wechsler Memory Scale
(Wechsler, 1997), California Verbal Learning Test (Delis, Kramer, Kaplan, &
Ober, 1987), achievement tests, such as the Woodcock Johnson Tests of
Achievement (Mather & Woodcock, 2001) or Wechsler Individual Achievement
Tests (Wechsler, 1992), and objective neuropsychological tests of attention,
concentration, executive functioning and problem solving ability are commonly
used in assessment of ADHD in adults. Such tests may help to assess cognitive
strengths and weaknesses, help in treatment planning, and may assist in ruling
out differential diagnoses such as learning, cognitive, or amnestic disorder. Tests
of executive functioning such as the Stroop Screening Tests, Wisconsin Card
Sorting Test, Category Test, and Trial Making Test are often used in assessment
of ADHD, though they have not been found to reliably distinguish ADHD groups
from controls. Computerized tests of sustained attention, such as the Test of
Variables of Attention (TOVA) and Connors� Continuous Performance Test
(CCPT) generally provide indices of response time, omission errors, and
response speed variability. Research shows continuous performance tests have
only low to moderate sensitivity and low specificity in detecting ADHD (ECRI,
Health Technology Assessment Information Service, 2000). However, some
15
studies have indicated continuous performance tests can discriminate simulated
malingerers (that is, participants instructed to respond as if they had ADHD, as
they understood it) from controls in college students. Tests of psychological
functioning and personality can assist in differential diagnosis and in detection of
comorbid disorders, such as depression, anxiety, and personality disorder.
Differential Diagnosis
Attention deficits can occur in many Axis 1 conditions other than ADHD
and overlapping symptoms between disorders can result in misdiagnosis. Adults
suffering from mood disorders may demonstrate impaired concentration and task
completion but usually also present with disturbances in mood, sleep, appetite,
energy, and interests. In affective disorders such as depression, the problems
with concentration are usually traced to the onset of the illness. The hyperactivity,
distractibility, and impulsivity associated with hypomania and mania presents with
distinct changes in sleep, mood, and behavior.
Adults suffering from anxiety disorders may present with restlessness,
irritability, and difficulty concentrating. Concentration problems related to an
anxiety disorder, however, unlike the concentration problems experienced in
ADHD, would likely occur in combination with other behaviors, such as worry and
apprehension, and would likely abate with treatment for anxiety. The differential
diagnosis of ADHD in adults should also consider alcohol and substance abuse
or withdrawal. Determining the onset and course of inattentive and/or
hyperactive/impulsive symptoms is key in differentiating ADHD from other Axis I
disorders. In ADHD at least some of the core symptoms and resulting impairment
are persistent from childhood (Pary et al., 2002).

16
Comorbidity in Adults with ADHD
In adults with ADHD, anxiety and mood disorders, substance abuse, and
antisocial personality have been reported to frequently co-occur. About 75% of
adults with ADHD have some comorbid condition (Biederman et al., 1993).
Biederman, (1998) reported anxiety disorders are present in 50% of adults with
ADHD, substance abuse occurs in 27-46% and antisocial personality in 12-27%.
Downey et al. (1997) reported similar findings with regard to substance abuse,
and antisocial personality, but also reported depressive orders were found in
37% of their sample of 78 adults with ADHD. ADHD is significantly
overrepresented in persons with substance abuse (Horner & Scheibe, 1997;
Schubiner et al., 2000) and in prison populations (West, 1999).
Milin, Loh, Chow, & Wilson (1997) examined symptoms of conduct disorder,
antisocial personality disorder, and ADHD in a group of inpatient substance
abusers (without evidence of any major current psychiatric disorder except
substance abuse and ADHD) and obtained evidence supporting the notion that
ADHD is an independent risk factor for substance use disorders. A prevalence
rate of approximately 25% has been found among adults in substance abuse
treatment. Additionally, some research suggests presence of ADHD predicts
poor treatment response for substance abuse. Cocaine abusers with a history of
childhood ADHD were found to have poorer treatment outcome than cocaine
abusers without history of ADHD (Milin, Loh, Chow, & Wilson).
Prevalence of ADHD in Adults and College Students
The prevalence of ADHD in adult and college populations has not been
nearly as well established as the prevalence in childhood. Assuming a 4%

17
prevalence of ADHD in childhood, Hill and Schoener (1996) examined 9
longitudinal studies of children with ADHD and found that the rate of ADHD in a
given age group appeared to decline by 50% approximately every 5 years. By
extrapolating this rate of decline, they computed a prevalence rate of 0.8% at age
20. Other estimates based on the continuation of childhood symptoms are
significantly larger. Wender (1998), for example, estimated a 2% prevalence rate
in adults. Longitudinal studies of children with ADHD suggest even less decline in
symptoms with age. For college students, recent surveys assessing ADHD
symptoms have suggested prevalence rates ranging from .5 to 8% depending on
the measures, degree of significance (1.5 versus 2 standard deviations above
the mean), inclusion of reported childhood symptoms, and use of age-adjusted
threshold for hyperactive symptoms (Weyandt, Linterman, & Rice ,1995). These
estimates seem high given the childhood prevalence rate, the low percentage of
children with ADHD believed to complete college, and the consideration that at
least some symptoms may diminish with age.
Although it is now recognized that symptoms of ADHD may persist into
adulthood for many individuals, it is difficult to estimate the prevalence of ADHD
in adulthood in the absence of established base rates of inattentive, hyperactive,
and impulsive symptoms in the general adult population. Earlier research has
demonstrated the importance of establishing base rates of symptoms in non-
clinical populations prior to drawing conclusions about symptoms in clinical
populations. Gouvier, Cubic, Jones, Brantley, & Cutlip (1992) and Gouvier, Uddo-
Crane, & Brown (1988) found no significant differences in the number of post-
concussional symptoms reported by head-injured and control groups, offering a

18
caveat regarding assessment: the presence of symptoms alone, without
consideration of frequency, intensity, and duration, should not be considered
sufficient to establish a diagnosis. Additionally, base rates exert a significant
influence over the diagnostic accuracy of any assessment instrument (Gouvier,
2000). This influence may explain the high prevalence rates found for ADHD in
college students when self-report measures are used to assess for symptoms
Academic Functioning and Psychopathology in College Students with ADHD
Research has indicated college students with ADHD experience academic
impairment and may be more vulnerable to psychological distress. Heiligenstein,
Guenther, Levy, Savino, & Fulwiler (1999) found that college students meeting
criteria for ADHD during adulthood reported significantly more academic
problems, were more likely to be on academic probation, and had a significantly
lower mean grade point average relative to a control group. Students with active
comorbid psychological disorders were excluded from the study, so that
differences between groups appear to be related to ADHD rather than another
psychological disorder, such as anxiety or depression. Unfortunately, students
were not screened for learning disabilities; however, the authors reported most
participants did not have apparent academic problems during childhood. There
were no differences between groups for reported psychosocial problems, but this
is not surprising since those with comorbid psychological disorders were
excluded from the study. Other researchers have reported an association
between ADHD and psychological distress. Downey et al. (1997) compared
adults with ADHD to adults with ADHD and a comorbid Axis 1 disorder. As
19
expected, the comorbid patients endorsed significantly elevated scores on
measures of psychological distress relative to the ADHD only group. However,
even the noncomorbid ADHD patients produced significant elevations relative to
norms on some subscales of the Tridimensional Personality Questionnaire (TPQ)
novelty seeking and harm avoidance scales and generated moderate elevations
(T scores between 58 and 64) on scales F, 4, 6, & 8 of the Minnesota Multiphasic
Personality Inventory-2nd edition (MMPI-2).
Richards, Rosen, and Ramirez (1999) found that college students with
confirmed ADHD and ADHD by self-report only, produced very similar profiles on
the Symptom Check List (SCL-90-R), scoring significantly higher than a control
group on all scales of the SCL-90-R except for the Paranoid Ideation Scale. The
self-report ADHD group consisted of students whose parents�, serving as
informants for respective participants on retrospective and current symptom
checklists, disconfirmed or did not significantly endorse ADHD symptoms on the
checklists completed. The confirmed ADHD group consisted of students meeting
both childhood and current diagnostic criteria of the disorder and had parental
confirmation on self-report measures. The authors suggested the self-report
group may have experienced symptoms which mirrored ADHD, or that the
parents were poor historians. In either case, these results suggest that reliance
on self-report measures in the assessment of ADHD in college students may be
problematic.
Turnock, Rosen, & Kaminski (1998) compared the academic coping
strategies of college students who self-reported many symptoms of ADHD to
college students who reported few symptoms of ADHD. They found that high

20
symptom (HS) students used significantly fewer academic coping behaviors
relative to their low symptoms (LS) peers. HS students were less organized and
methodical while studying, procrastinated more, and employed fewer self-control
or self-disciplinary behaviors. HS students achieved significantly lower grades
and dropped out of classes more often than LS students. Moreover, academic
success of HS students was not related to the use of coping strategies, though
intelligence predicted success for HS students. For LS students, intelligence was
not significantly correlated with academic success; coping strategies, specifically
delay avoidance, were significant predictors of GPA. In other words, for college
students with many ADHD symptoms, academic achievement was more strongly
associated with intelligence, than with study skills.
Weyandt, Linterman, & Rice (1995) speculated there may exist a group of
capable ADHD college students that due to their compensatory abilities, are not
identified during childhood and attain adequate achievement in elementary and
secondary school yet experience greater difficulty during college due to
increased demands for sustained attention and inhibition. The authors
administered several neuropsychological tests (Wisconsin Card Sorting Test,
Stroop Screening Test, Visual Search Attention Test, and Raven�s Coloured
Progressive Matrices) to two groups of students reporting significantly high or low
symptoms of ADHD. There were no differences between the groups on any
neuropsychological measure except for the Raven�s Coloured Progressive
Matrices, on which the high symptom group performed better; this single finding
is the basis of their speculation regarding capable ADHD college students.

21
Treatment of ADHD
Psychosocial Treatments
Behavioral treatments such as parent training, school interventions,
contingency management techniques, intensive treatments, and cognitive-
behavioral techniques such as self-instructional training, problem-solving
strategies, cognitive modeling, self-monitoring, self-evaluation, social skills
training, and anger control have been researched extensively with children
(Pelham & Gnagy, 1999) but little research has examined the effectiveness of
these strategies with ADHD adults. Although some of the techniques, such as
parent training, are impractical for use with an adult population, cognitive-
behavioral strategies, such as self-instructional training, which focuses on
improving attention and self-control through self-mediated strategies, may be
appropriate for use with adults.
Self-instructional training usually consists of four basic steps: cognitive
modeling, overt guidance, faded self-guidance, and covert self-instruction
(Blandford & Lloyd, 1987). These four steps are used to generate six types of
self-statements to help individuals guide their work through the stages of problem
completion including problem definition, focusing of attention, planning response
guidance, self reinforcement, self-evaluation, coping, and error corrections
(Pindiprolu, 1997).
Ratey, Greenberg, Bemporad, & Lindem (1992) suggest a
psychoeducational model that includes identifying deficits associated with ADHD
and how they affect the patient, reducing self-blame, and devising coping
strategies which maximize the patient�s strengths and the fit between the

22
individual and environmental demands. Weinstein (1994) reported that cognitive
remediation or the direct teaching and practice of strategies for improving
attention and memory, and solving problems may be helpful for adults with
ADHD. Morgan (2000) developed a time-limited group treatment program for
adults which addresses a variety of common symptoms and problems associated
with ADHD. The group is designed to meet for 60-75 minutes a week for about
10 sessions and includes the following components: (a) psychoeducation (b)
referral for pharmacological and specialized treatments (c) behavioral self-
management skills training (d) cognitive behavior therapy for emotional control
and coping with stress (e) relationship and social skills training (f) group
interactions to provide mutual support, encouragement, reinforcement, exchange
of ideas and information.
Self-monitoring and scheduling daily activities may help adults with ADHD
impose structure in their daily lives and facilitate adherence to goals and
commitments (Pary et al., 2002). Comorbid disorders, such as substance abuse,
adjustment disorder, learning disorder, and anxiety, should be appropriately
addressed through rehabilitation or therapy. The focus of therapies should match
the behavioral difficulties, anger management groups or marital counseling may
be appropriate. Many colleges offer study skills, time management, and/or
college adjustment classes or orientation programs. Psychosocial treatment
strategies for treating ADHD are low risk and have very little potential for harm
due to misuse by college students, and may help adults learn problem solving
strategies that can be applied to many situations. However, many college
23
students would rather take medication than learn self-instructional training or
practice organizational strategies.
Pharmacology
Stimulants, such as methylphenidate and dextroamphetamine are
considered first-line pharmacological treatments for adults who do not abuse
alcohol or illicit drugs (Pary et al., 2002). However, despite clear evidence of
temporary beneficial effects of stimulant medications on daily classroom
performance, disruptive behavior, and peer interactions in children, there is no
evidence of enhanced long-term changes in academic achievement,
interpersonal relationships, or long-term prognosis in adolescents and adults
(Pelham & Gnagy, 1999). Side effects from these stimulants include insomnia,
anorexia, abdominal discomfort, headaches, and irritability. Stimulants may
exacerbate coexisting disorders of anxiety, panic, psychosis, or mania (Pary).
Two antidepressant drugs, Bupropion and Venlafaxine, have been reported to
have efficacy in ADHD. Guanfacine, an alpha-2-adrenergic agonist has also
been found to be effective in reducing ADHD symptoms in adults (Taylor &
Russo, 2001). Atomoxetine, a nonstimulant, selective noradrenaline reuptake
inhibitor is the first drug approved specifically for treatment of ADHD in adults
and has shown greater efficacy than placebo in two large controlled trials with
adults (Simpson & Plosker, 2004). Nonstimulant medications for ADHD may be
more appropriate than stimulant medications for adults at risk for substance or
alcohol abuse.
Current research indicates methylphenidate is a common drug of abuse
on high school and college campuses. Moline and Frankenberger (2001)

24
surveyed 651 students between the ages of 11 and 18, regarding use of and
attitude toward stimulant medications. Fifty students reported being treated with
stimulant medication to treat ADHD. Of the fifty, thirty-four percent reported being
approached to sell or trade their medication. Fifty-three percent of the students
not taking stimulant medication reported that some students taking stimulant
medication gave away or sold their medication. Babcock and Byrne (2000)
distributed a survey regarding recreational methylphenidate use to the student
body of a public liberal arts college in Massachusetts. About 17% of the 283
respondents reported using methylphenidate recreationally, with about 13%
reporting intranasal administration. These rates of stimulant abuse are
significantly higher than the rates reported in a survey completed about a decade
earlier. In that survey of 683 students enrolled at a major research university
located in the Southwestern United States during the 1986-87 academic year
assessed use of alcohol, marijuana, LSD, amphetamines, tranquilizers, and
cocaine, and found less than 3% of the participants reported using any
amphetamine in the past year (Clifford, Edmundson, Koch, & Dodd, 1989).
Abuse of methylphenidate is likely to rise as it becomes increasingly accessible.
Given this, college students who self-refer for assessment of ADHD and appear
to be seeking stimulant medication need careful examination to consider the
possibility of malingering.
Defining Malingering
Malingering is listed in the DSM-IV (1994) as an additional condition that
may be a focus of clinical attention. It is defined as the intentional production of
false or grossly exaggerated physical or psychological symptoms, motivated by
25
external incentives such as avoiding work or military duty, obtaining financial
compensation or drugs, or evading criminal prosecution. The presence of
external gain distinguishes malingering from factitious disorder, wherein an
individual has a psychological need to assume the sick role, and other clinical
disorders such as somatoform disorder, wherein motivations are presumed to be
unconscious. However, it has been acknowledged that it is difficult to distinguish
between conscious and unconscious symptom production (Soniat, 1967; Travin
& Potter, 1984). Additionally, external gains, such as special attention from
others or escape from work, often accompany assumption of the sick role.
College students who malinger or exaggerate symptoms of ADHD to
obtain a clinical diagnosis may be motivated by several various factors, both
internal and external. The specific academic accommodations for students with
disabilities vary depending on type and severity of clinical diagnosis, state
guidelines, university policy, and specific clinical recommendations. College
students diagnosed with ADHD may receive various academic accommodations
such as priority registration, preferential seating, extended time for assignments
and exams, admission to study skills classes or tutoring, a distraction free
environment during testing or individual test administration versus group
examinations. Similar accommodations may also be granted for high stakes
standardized tests used in part to determine entrance into specific fields of study,
colleges, or for credentialing purposes, such as the Scholastic Achievement Test,
Teachers� Praxis Examination, or Graduate Record Examination.
While the accommodations granted to students with some disabilities,
such as presenting testing materials in larger print for visually impaired students,
26
are logically and specifically related to disability; many of the accommodations
typically granted to college students diagnosed with ADHD, such as extended
time, would benefit most students regardless of disability status. Hence, the type
of academic accommodations typically granted to ADHD students may be
desirable to students without any disability. When these accommodations are
offered to unimpaired students, they represent an unfair advantage in otherwise
highly competitive academic situations.
A diagnosis of ADHD may fulfill an internal motivation by providing a self-
handicapping explanation, excuse, or crutch for college students experiencing
academic difficulty. It may also serve to lower the expectations of parents,
instructors, or the self, and lessen perceived pressure to perform well in college.
For many, a diagnosis or ADHD is preferable to alternative explanations of
academic difficulty, which might imply limited cognitive ability, specific learning
disability, poor fit between curriculum or university and student, or lack of effort.
Lipman (1962) described four distinct types of malingering: patients
without any symptoms may fabricate or �invent� them; patients may claim to have
symptoms that actually occurred at one time but have since ceased; patients
may exaggerate current symptoms; and patients may falsely attribute actual
symptoms to a specific injury, event, or disorder. Three of these strategies for
malingering apply to the college student attempting to feign ADHD. Most
individuals experience periods of excessive or problematic inattention at some
point, so malingerers would rarely have to claim having inattentive symptoms
they have not actually experienced, although those knowledgeable about the
diagnostic criteria for ADHD may be able to do so. College students with a

27
history of ADHD may claim continued symptoms or exaggerate residual
symptoms. Finally, college students may be experiencing inattention as a feature
of another clinical syndrome, such as anxiety, mood disorder, substance abuse,
or sleep disturbance, and consciously or unconsciously attribute their symptoms
to ADHD.
Assessing Malingering
The research literature is replete with studies on the detection of
malingering of memory and neuropsychological impairment. Although
malingering of memory and attention problems on neuropsychological tests have
been studied extensively, the focus of most studies has been on malingering of
cognitive deficits after head injury; studies examining malingering of attention
impairment in assessment of ADHD are rare. However, the stakes associated
with malingering attention problems in pursuit of an ADHD diagnosis, relative to
malingering cognitive deficits in pursuit of financial compensation following head
injury, may make it a safer disorder to fake, possibly increasing the base rate of
malingering in this situation. Additionally, individuals with antisocial personality
disorder and/or substance abuse disorders, which are frequently comorbid with
ADHD, have been found to be more prone to malinger than other individuals
(Sierles, 1984), introducing another factor which could possibly increase the base
rate of malingering in ADHD assessment.
Incentive to malinger, exaggerated complaints of impairment or distress,
inconsistent performance on test batteries, and poor performance on effort tests
all indicate the possibility of malingering. The diagnosis of malingering, like other
diagnoses, is based on information from multiple sources and clinician judgment.
28
Nies and Sweet (1994) have outlined several basic strategies consistent with the
current research evidence that are useful in detecting malingering. They
recommend evaluating patterns of performance on neuropsychological testing
measures as well as using specific tests of malingering.
Performance that falls below chance levels on forced choice tests, such as
true and false tests, for example, may indicate malingering. Nonsensical test
patterns or excessive inconsistency within or across evaluation measures, such
as better performance on free recall relative to recognition in memory tests, are
another indication of malingering. Inconsistencies in performance should
generally not extend beyond what would be expected based on the known test-
retest reliability, standard error of measure, or practice effects associated with
respective measures and the testing situation.
Patterns of performance on the Wechsler scales have been examined
extensively and multiple studies have reported that large performance
differences between selected subtests or subscales of the WAIS and WMS
batteries are indicative of malingering (Hilsabeck et al., 2003; Iverson, Slick &
Franzen, 2000; Iverson & Tulsky, 2003; Langeluddecke & Lucas, 2003;
Mittenberg, Azrin, Millsaps, & Heilbronner, 1993; Mittenberg, Theroux-Fichera,
Zielinski, & Heilbronner, 1993; Mittenberg,Thompson, Schwartz, 1991). The
analog malingerers of Mittenberg et al., (1993) scored significantly poorer on
Attention/Concentration Index of the WMS-R than on the General Memory Index,
a pattern opposite what is typically seen in head injured patients. Similarly, a
large difference score between the Vocabulary and Digit-Span subtest of the
WAIS-R and WAIS-III is also suggestive of malingering (Mittenberg et al., 1993).

29
Using such difference scores to detect malingering in assessment for ADHD is
problematic, however, since the norming studies for the WAIS-III indicate scores
on subtests measuring attention and processing speed tend to be among the
lowest subtest scores for that population and, to date, there are no empirical
studies evaluating difference scores and malingering in the ADHD population.
Tests of malingering or effort utilized in neuropsychological assessment
employ several strategies to assess malingering. Many tests present a simple
memory task or attention task presented as being more difficult than it actually is
or may utilize a forced choice paradigm that relies on probability to determine
score, with scores falling below chance level suggesting malingering. For
example, the Portland Digit Recognition Task presents a consecutive series of 5
digit numbers. After each number is presented, the patient is given a brief
distraction task (counting backward) and then asked to choose the presented
number from a set of two numbers. A similar problem may apply to the use of
effort tests in assessment of ADHD as with the use of attention-vocabulary
difference scores: malingering tests often require participants to perform
relatively simple tasks or attend/respond to a simple stimulus, as do many
objective measures of attention; hence, the similarity in task demands may yield
similar patterns of performance. Preliminary research by Booksh, Dixon, Fabian,
& Gouvier (2003) found a significant correlation between performance on a task
designed to measure inattention and a task designed to measure malingering,
indicating that the capacity for sustained effort may underlie performance on
both. Additionally, there is little empirical evidence supporting the use of
malingering tests in assessment of ADHD.
30
Malingering and ADHD
Few studies have addressed the problem of malingering and ADHD in
college students, Leark, Dixon, Hoffman, & Huynh (2002) investigated the effects
of simulating attentional disorders on the Test of Variables of Attention (TOVA)
by having college students complete the measure under normal and simulation
conditions. The authors found that simulated malingerers produced high scores
on indices of omission and commission errors, response time, and variance.
Quinn (2003) investigated the ability of college students to feign ADHD on a self-
report and a continuous performance test (CPT) and found that college students
could successfully feign ADHD on the ADHD Behavior Checklist but not on the
Integrated Visual and Auditory Continuous Performance Test. The CPT
impairment index results revealed good sensitivity and specificity, 94% and 91%,
respectively, as well as good positive predictive power and negative predictive
power in discriminating an actual ADHD group from the simulated malingering
group.
31
PURPOSE OF STUDY
The purpose of the present study is to investigate the ability of college
students to simulate ADHD symptoms on commonly used objective measures of
attention and self-report measures of ADHD symptoms. Although a few research
studies have compared the performance of simulated malingerers to ADHD and
control subjects on self-report and continuous performance tests, none have
evaluated the relationship between knowledge of ADHD and symptom production
or performance on other objective tests of attention and effort. Additionally, the
present study evaluates the appropriateness of using traditional effort tests in
assessment of ADHD in college students. The answers to these questions are
important given the prevalence of reported ADHD symptoms in college students,
and the potential for abuse of stimulant medication on college campuses.
Research Questions and Hypotheses
Question 1
Do simulated malingerers perform differently than persons with ADHD and
control subjects without a diagnosis of ADHD on objective tests of attention and
self-report measures? Or stated differently, are college students able to
effectively simulate ADHD symptoms on objective measures of attention and
self-report measures of ADHD symptoms?
Hypothesis: Simulated malingerers will endorse significantly more symptoms
than control subjects on self-report measures, performing similarly to ADHD
controls. However, simulated malingerers will perform more poorly than ADHD
controls on objective measures of attention. Previous research indicates
simulated malingerers have greater difficulty feigning disorders on objective
32
attention tests than on self-report measures (Leark et al., 2002; Quinn, 2003).
Martin, Hayes, & Gouvier (1996) reported similar findings with regard to
postconcussive disorder; simulated malingerers were able to accurately replicate
symptoms on self-report measures. This hypothesis is congruent with the finding
of previous research, but uses many measures heretofore untested with
simulated malingerers in assessment of adult ADHD.
Question 2
Is knowledge of ADHD related to ability to simulate ADHD on objective
measures of attention and self-report measures? This question addresses the
potential mediating effects of knowledge on the performance of simulators on
self-report versus objective measures of attention. The influence of knowledge on
effort tests will also be investigated.
Hypothesis: Knowledge of ADHD will be significantly correlated with performance
on self-report measures but will not be significantly correlated with performance
on effort tests or on objective measures of attention within the simulated
malingering group. Knowledge of ADHD will be measured by the ADHD
Knowledge and Opinions Survey- Revised (AKOS-R: Rostain, Power, & Atkins,
1993). No relationship is expected between ADHD knowledge and performance
on self-report, objective, or effort measures within the control group.
There is no prior research addressing the influence of knowledge on ability to
malinger ADHD. It seems logical that knowledge of a disorder would aid a
malingerer in simulating a disorder on self-report measures. However, earlier
research has demonstrated that personal experience with a disorder does not
always increase knowledge about the disorder. O�Jile et. al., (1997) found that

33
head-injured and non head-injured participants demonstrated very similar
performance on a test measuring misconceptions about head-injury. The media
attention given to ADHD has likely educated the public and decreased popular
misconceptions about the disorder.
Earlier research has found that prior experience and knowledge of head
injury does not significantly influence ability to feign mild head injury symptoms
on objective measures of neuropsychological functioning (Hayes, Martin, &
Gouvier, 1995). This finding suggests that even when malingerers are sufficiently
familiar with the symptoms of a disorder to successfully fake the self-report, they
may be unable to mimic impairment on objective measures.
Question 3
Are traditional tests of memory malingering and/or effort sensitive to
malingering in college students attempting to feign ADHD?
Hypothesis: No directional hypothesis is postulated. The sensitivity of effort tests
to malingering in ADHD assessment is important considering ADHD assessment
relies so heavily upon self-reported symptoms and college adults may have
many incentives to obtain a diagnosis. To further investigate the sensitivity of
effort tests in detecting malingering in ADHD assessment, the use of effort tests
in detecting malingering will be compared to the use of clinical judgment alone to
detect malingering. To facilitate this comparison, the data will be masked and the
primary researcher and an independent licensed clinical neuropsychologist will
make judgments as to the group membership of each participant, individually,
based on the participant�s performance on the objective measures of attention
and the Wender Utah Rating Scale.
34
METHOD
Participants
Related literature (Downey, Stelson, Pomerleau, & Giordani, 1997; Inman
& Berry, 2000; Leark, Dixon, Hoffman, & Huynh, 2002; Martin, Hayes, & Gouvier,
1996; Quinn, 2003; Weyandt, Rice, Linterman, Mitzlaff & Emert, 1998) was
reviewed and effect sizes were estimated using partial eta squared, as earlier
studies included both F and T tests. Preliminary power analysis findings showed
one hundred eight participants total is needed to find a difference between
groups at power = 0.80, alpha = .05 .
Participants were undergraduate students enrolled in psychology courses
at Louisiana State University at Baton Rouge who responded to notification on
the LSU research website. Students volunteers received class extra credit for
their participation in this study. Exclusion criteria were age less than 18 years,
history of Learning Disability, ADHD or current complaint of significant problems
with inattention, impulsivity, or hyperactivity; moderate or severe brain trauma
within the past five years, neurological disease, or seizure disorder.
Participants were randomly assigned to either the control condition or the
simulated malingerer condition. Archival testing data from students diagnosed
with ADHD at the LSU Psychological Services Center was used as an ADHD
comparison group when available. Testing data was used only from students
who had signed a voluntary consent to the anonymous use of their testing data at
the time of their assessments.

35
Materials
The materials used in this study included a structured clinical interview and
feedback questionnaire designed by the primary researcher, a questionnaire
assessing knowledge of ADHD, a structured interview for ADHD symptoms,
objective measures of attention, self-report measures of ADHD symptoms, and
effort tests. The objective measures included the Connor�s Continuous
Performance Test, The Trail Making Test, and four subtests from the Wechsler
Adult Intelligence Scale: Digit Symbol Coding, Digit Span, Symbol Search, and
Letter-Number Sequencing. The self -report measures included the Wender
Utah Rating Scales and Attention-Deficit Scales for Adults. The effort measures
included the Memorization of 15 Items, and Word Memory Test. Descriptions of
each measure follow:
Interviews and Questionnaires
Structured Clinical Interview
A structured clinical interview was developed and was administered to all
test participants to obtain the following information: gender, race, age, education,
college major and minor, grade point average, socioeconomic status, knowledge
of ADHD, and screening for exclusion criteria.
Feedback Questionnaire
A brief feedback questionnaire was developed asking participants to
summarize task instructions and provide a rating, on a scale of 0 to 10, with 0
being the lowest rating and 10 being the highest rating, of compliance with
instructions, and perceived success on the task.
ADHD Knowledge and Opinions Survey- Revised

36
The AKOS-R is a questionnaire designed to assess parental knowledge of
and attitude regarding ADHD and treatment interventions. A modified version of
the Knowledge Scale of the AKOS-R, comprised of 17 true or false statements
regarding childhood ADHD, including etiology, course, pharmacological
intervention, and academic functioning, was administered to all participants.
Three statements added to the measure by Rebecca Owen Currier (2004) for
use in a previous dissertation were retained. The original measure was designed
for parents and uses the word �child� or �children� as the participant in many
items. The items were reworded to replace all instances of the word(s) child or
children with �people� or �persons� as appropriate for use with college students.
Mini International Neuropsychiatric Interview
The MINI is a structured diagnostic psychiatric interview for DSM-IV and
ICD-10. The ADHD adult subscale assesses retrospective childhood symptoms
and current symptoms of ADHD experienced by adults. Questions in the current
section are phrased to assess the symptoms as they are experienced in
adulthood so that questions reflect problems with work, marriage,
underachievement, etc., and take into account a lessening in the severity of
some symptoms, such as hyperactivity, with age.
Objective Measures of Attention
Connors� Continuous Performance Test
The CCPT is a computer-based test designed to measure inattention,
impulsivity, and response time variability by having participants respond to
visually presented stimuli. �Target� stimuli and non-target stimuli are presented in
rapid succession. Participants are required to press the space bar on the
37
computer keyboard whenever a �target� appears and to inhibit responding to
�non-targets�. Omission errors, commission errors, response time, and several
indices of response time variability are reported. Omission errors represent
inattention and commission errors reflect impulsivity. Response speed and
response speed variability is recorded in milliseconds and is designed to
measure consistency of performance and sustained vigilance over the course of
the test.
Trail Making Test (TMT)
The TMT was originally part of the Army Individual Test Battery originated
in 1944. This paper-pencil test of motor speed and attention consists of two
parts. Part A requires the participant to draw lines connecting sequentially
numbered circles. Part B presents both numbered and lettered circles, which the
participant must alternate between and connect in sequential order (i.e. I-A-2-B-
3-C, etc.). Scores are based on time to complete the measure. A significant
difference in time to complete part A and part B is thought to reflect difficulty
alternating attention, although poor scores for either part A, or part B, may be
indicative of an attentional problem.
Wechsler Adult Intelligence Scale-Third Edition (WAIS-III): Digit Symbol-Coding
(DSC), Digit Span (DS), Symbol Search (SS), and Letter-Number Sequencing
(LNS) subtests
The ADHD sample in the normative studies for the WAIS-III was found to
perform relatively more poorly on the DSC, DS, SS, and LNS subtests (Technical
Manual for WAIS-III). The DSC subtest is a timed paper and pencil symbol
substitution or coding task. Participants use a key of paired numbers and
38
nonsense symbols to complete the task, which requires participants to draw the
corresponding symbols below rows of numbers. The DS subtest is a brief test of
auditory attention, which consists of two parts. The first part requires participants
to repeat increasingly long strings of numbers orally presented by the examiner
and the second part requires participants to recall the string of presented
numbers in reverse order. The SS subtest is a timed orthographic measure of
visual attention, scanning, and motor speed. Participants must determine if a
target nonsense figure is present in a string of figures and mark a corresponding
�yes� or �no� box presented at the end of each item. The LNS subtest is a verbal
working memory task. The examiner presents increasingly long strings of
randomly arranged numbers and letters which the participant must repeat back in
alphabetical and numerical order.
Self-report Measures of ADHD Symptoms
Attention-Deficit Scales for Adults
The ADSA is a 54 item self-report designed to assess symptoms of ADHD
in adults. The measure contains 9 clinical subscales, an internal consistency
measure, and a total score. The clinical subscales represent the multiple areas
thought to be effected by ADHD in adults and are labeled: Attention-Focus-
Concentration, Interpersonal, Behavior-Disorganized-Activity, Coordination,
Academic Theme, Emotive, Consistency-Long Term, Childhood, and Negative-
Social. The total score has been found to reliably discriminate ADHD adults from
controls. In a validation study reported in the ADSA manual, the mean total score
for ADHD adult participants (N = 87) was 45 points higher than that of the
normative group (N = 306).

39
Wender Utah Rating Scale
The WURS is a 61 item self-report questionnaire designed to measure
adults� retrospective rating of the presence and severity of childhood symptoms
associated with ADHD. The DSM-IV diagnostic criteria for ADHD specifies that
some hyperactive-impulsive or inattentive symptoms that cause impairment were
present before age 7. The WURS provides a quantitative way of assessing this
criterion. Ward et al. reported the WURS discriminated controls from adults with
ADHD with 86% accuracy. Internal consistency, as measured by Cronbach�s
alpha, and test-retest reliability coefficients have been reported to be above .85
(Weyandt et al., 1995).
Effort Tests
Memorization of 15 items
The MFIT is a technique for measuring participant cooperation or
malingering. The participant is told the task is a memory test for 15 different
items and is presented with a sheet of paper containing five rows of three
characters to study for 10 seconds before copying what they remember. The test
is presented as being more difficult than it actually is by stressing the number of
items to be remembered. The items are so closely related that participants need
remember only three or four ideas to recall most of the items. For example one
row contains the letters �A B C� and another contains the same letters in lower
case print.
The Word Memory Test
The WMT measures both verbal memory and effort. The task involves
learning a list of 20 semantically linked word pairs with each pair presented for 6

40
seconds each on the computer screen. The list is presented twice and then an
immediate recognition (IR) task is presented in which word pairs, containing only
one of the stimulus words are presented. The participant must choose the
original stimulus word from the new pairs. A similar delayed recognition (DR) task
is presented 30 minutes later, which presents the same stimulus word with a
different foil. The IR and DR comprise the effort tasks and are relatively easy and
are completed with 95% accuracy by adults with severe brain injury or
neurological diseases (Green & Allen, 1999). Consistency of responding to the IR
and DR tasks is also computed. Following the effort tests, a series of memory
tests is completed including a multiple choice (MC) test in which the participant is
given the first word and must select the other word of the pair from 8 choices, a
paired associate test, in which the participant is told the first word of the pair and
must name the second word, and a delayed free recall (DFR) task, in which the
participant recalls as many words from the list as possible, in any order, and a
long delayed free recall task, which is the same as the DFR task, but occurs after
a 20 minute delay.
All the measures described above, their scales, and subscales, are
presented in Table 1. Table 2 lists all independent and dependent variables, and
provides operational definitions.
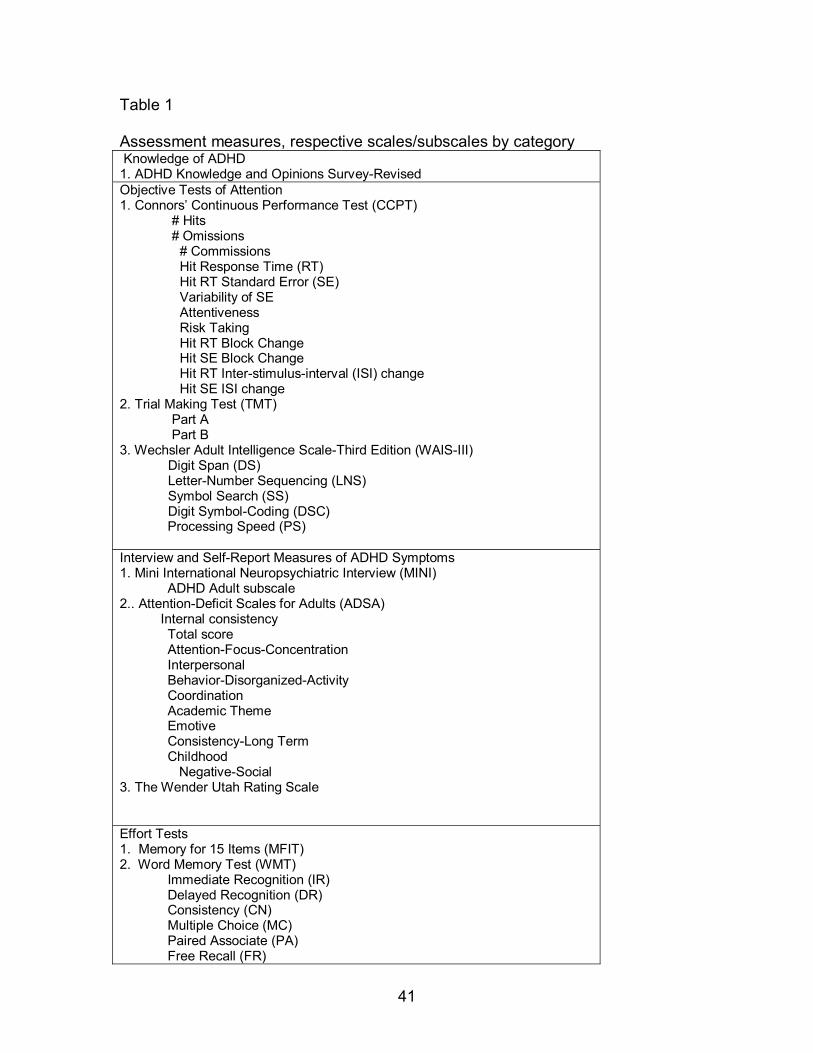
41
Table 1
Assessment measures, respective scales/subscales by category Knowledge of ADHD 1. ADHD Knowledge and Opinions Survey-Revised Objective Tests of Attention 1. Connors� Continuous Performance Test (CCPT) # Hits # Omissions
# Commissions Hit Response Time (RT) Hit RT Standard Error (SE) Variability of SE Attentiveness Risk Taking Hit RT Block Change Hit SE Block Change Hit RT Inter-stimulus-interval (ISI) change Hit SE ISI change
2. Trial Making Test (TMT) Part A Part B 3. Wechsler Adult Intelligence Scale-Third Edition (WAIS-III) Digit Span (DS) Letter-Number Sequencing (LNS) Symbol Search (SS) Digit Symbol-Coding (DSC) Processing Speed (PS) Interview and Self-Report Measures of ADHD Symptoms 1. Mini International Neuropsychiatric Interview (MINI)
ADHD Adult subscale 2.. Attention-Deficit Scales for Adults (ADSA) Internal consistency
Total score Attention-Focus-Concentration Interpersonal Behavior-Disorganized-Activity Coordination Academic Theme Emotive Consistency-Long Term Childhood Negative-Social
3. The Wender Utah Rating Scale Effort Tests 1. Memory for 15 Items (MFIT) 2. Word Memory Test (WMT)
Immediate Recognition (IR) Delayed Recognition (DR) Consistency (CN) Multiple Choice (MC) Paired Associate (PA) Free Recall (FR)

42
Table 2 Operationally defined variables by category Variable Operational Definitions Group, the primary independent variable, has three levels.
1. Normal- students asked to do their best 2. Simulate- students asked to simulate ADHD w/out arousing suspicion 3.ADHD- ADHD students� archival data
Knowledge of ADHD, is a 2nd independent variable
1. ADHD Knowledge and Opinions Survey-Revised, total raw score
Self-Reported ADHD Symptoms: 2 dependent variables
1. ADSA Total T-score 2. WURS total raw score for critical items
Performance on Objective Tests of Attention: 6 dependent variables:
1. CCPT mean total T-score 2. CCPT sum of clinically elevated scales 3. TMT part A, T-score 4. TMT part B, T-score 5. WAIS-III Processing Speed (an Index score averaged from DSC and SS subtest scaled scores, converted to T-scores 6. WAIS-III mean of DS and LNS subtest scaled scores, converted to T-scores
Performance on Effort Tests: 3 dependent variables
1. MFIT total raw score 2. WMT average of percent correct for IR and DR 3. WMT percent correct score for CN
Design and Procedure
All research procedures were completed at LSU Psychological Services
Center on campus. Undergraduate students registered for PSYC 4999 and
undergraduate Chancellor�s Aid students were trained as research assistants. All
involved researchers were certified in the Human Participant Protections
Education for Research Teams course as recommended by the National Institute
of Health. The author, a Master�s level graduate student, trained all research
assistants in clinical interviewing skills and in administration of testing
instruments used in the study. Manual directions were followed for all tests

43
administered. Research assistants were observed practicing on non-participants
before working with research participants. The primary researcher randomly
observed research assistants during the study and provided feedback to
research assistants to correct any observed variances from the standardized
procedures. Only one minor variance was observed. One research assistant was
observed making up examples during the Digit Span test rather than using the
examples provided in the manual. The research assistant was instructed to follow
the manual. The primary researcher and an assistant reviewed scored protocols
and data entry for accuracy. Data from three participants was excluded from
analysis due to incorrect administration, incorrect scoring, or failure of the
participant to follow instructions.
The consent form was presented orally and in writing to each participant.
Participants were given a copy of their signed consent form, which included the
investigators� names and contact numbers. Four extra credit points for
participating psychology classes were awarded to each participant for complete
participation in this study. Participants in the simulated ADHD group were
encouraged to successfully simulate ADHD without arousing suspicion. Both
groups were informed that many measures in the study contained validity indices
or measures of effort and honesty. As an incentive to comply with performance
instructions, participants were told that all participants with acceptable validity
scores would be entered in a drawing at the end of the semester for a $50 gift
certificate to a local restaurant. All participants were entered into the drawing
regardless of response style.

44
Participants were randomly assigned to the control condition or the
simulated malingering condition after providing informed consent and being
screened for exclusion criteria via the structured clinical interview. The AKOS-R
was administered before all other assessment instruments to measure
participants� knowledge of ADHD before participation in the remainder of the
experiment. The control group received the following instructions:
You will be taking a battery of neuropsychological tests. Some of
the tests contain validity measures of effort and honesty that indicate
whether you are putting forth good effort. It is important that you apply
maximum effort and attention while taking the tests and perform to the
best of your ability. Participants with acceptable validity scores will be
entered in a drawing at the end of the semester for a $50 gift certificate to
a local restaurant.
The simulated ADHD group received the following instructions:
Imagine that you have significant problems with inattention,
impulsivity, and/or hyperactivity that are interfering with your academic
performance. You believe that if you are diagnosed with ADHD you may
be given some academic accommodations, such as extended time for
tests, or medication, such as Ritalin, that will improve your grades. Your
job in this experiment is to successfully convince the experimenter that
you have ADHD, so you want to perform on these tests as if you actually
have ADHD. Some of the tests you will take contain validity measures of
effort and honesty that indicate whether you are putting forth good effort.
You want to fool the experimenter, that is, you want it to look as if you

45
have ADHD, without arousing any suspicion. You should appear to be
putting forth a good effort. Participants that successfully simulate ADHD
and have acceptable validity scores will be entered in a drawing at the end
of the semester for a $50 gift certificate to a local restaurant.
The first test in the battery was a malingering measure, either the WMT or
the MFIT was administered, as it has been suggested that malingerers may
perform more poorly on the first test in a battery due to not having any means for
comparing the difficulty level of the first test with other testing procedures (Inman
& Berry, 2002). The remaining measures were presented randomly. Following
completion of all measures, participants completed a brief feedback
questionnaire assessing malingering strategy and level of perceived success on
the task. All participants were thanked for their participation, provided with
documentation of their participation, and given an opportunity to ask questions
about the experiment after completing the assessment procedures.
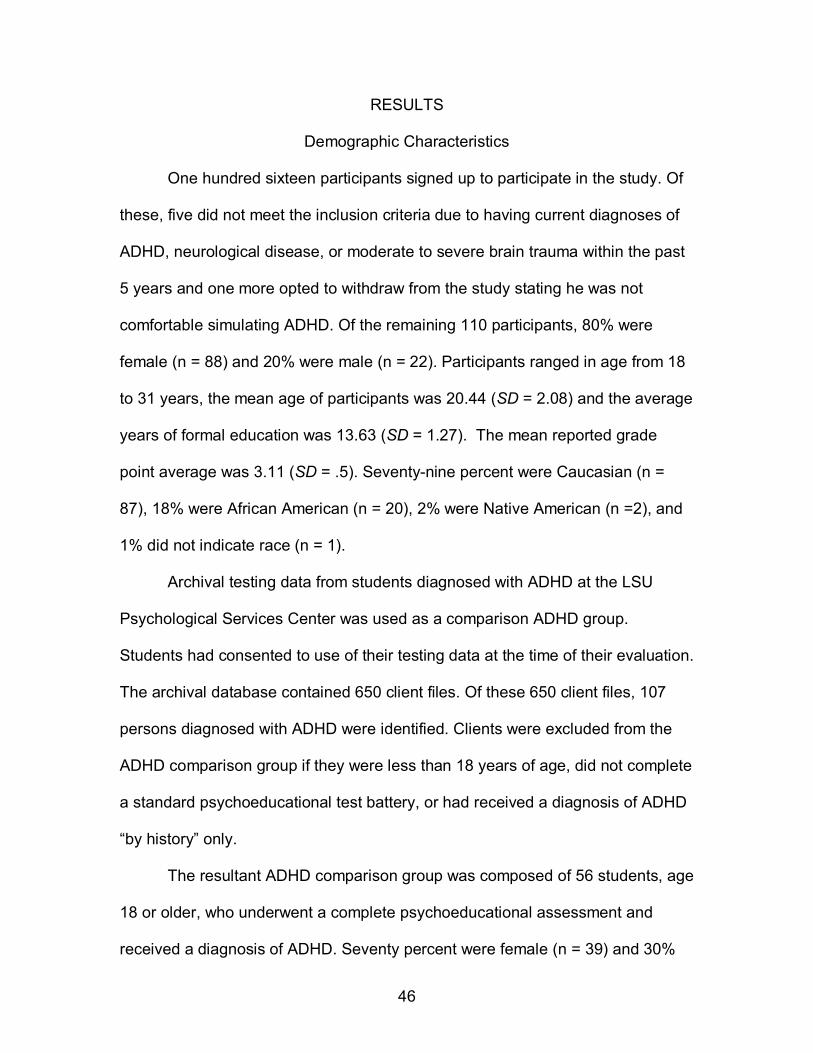
46
RESULTS
Demographic Characteristics
One hundred sixteen participants signed up to participate in the study. Of
these, five did not meet the inclusion criteria due to having current diagnoses of
ADHD, neurological disease, or moderate to severe brain trauma within the past
5 years and one more opted to withdraw from the study stating he was not
comfortable simulating ADHD. Of the remaining 110 participants, 80% were
female (n = 88) and 20% were male (n = 22). Participants ranged in age from 18
to 31 years, the mean age of participants was 20.44 (SD = 2.08) and the average
years of formal education was 13.63 (SD = 1.27). The mean reported grade
point average was 3.11 (SD = .5). Seventy-nine percent were Caucasian (n =
87), 18% were African American (n = 20), 2% were Native American (n =2), and
1% did not indicate race (n = 1).
Archival testing data from students diagnosed with ADHD at the LSU
Psychological Services Center was used as a comparison ADHD group.
Students had consented to use of their testing data at the time of their evaluation.
The archival database contained 650 client files. Of these 650 client files, 107
persons diagnosed with ADHD were identified. Clients were excluded from the
ADHD comparison group if they were less than 18 years of age, did not complete
a standard psychoeducational test battery, or had received a diagnosis of ADHD
�by history� only.
The resultant ADHD comparison group was composed of 56 students, age
18 or older, who underwent a complete psychoeducational assessment and
received a diagnosis of ADHD. Seventy percent were female (n = 39) and 30%

47
were male (n = 17). The mean age of the ADHD group was 21.11 (SD = 3.1).
Participants ranged in age from 18 to 29 years and the mean reported years of
completed formal education was 13.41 (SD = 1.82). Ninety-three percent were
Caucasian (n = 51), 5.4% were African American (n = 3), 1.8% were Asian (n =
1) and 1.8% did not report race (n = 1).
The psychoeducational battery used in assessing participants in the
archival ADHD group included all of the objective tests used with the simulate
ADHD and control groups but the ADHD group did not complete the feedback
questionnaire, ADHD Knowledge and Opinions Survey-Revised, Mini
International Neuropsychiatric Interview, or effort measures. Additionally, only
nine of the ADHD participants completed the ADSA self-report, and one of the
ADSA protocols from this group was incorrectly scored and therefore was not
used.
Preliminary Analyses
There were two independent variables. The main independent variable,
group, consisted of three levels: control, simulate, and ADHD. A second
independent variable, Knowledge of ADHD, was measured by total number
correct on the AKOS-R. The dependent measures included three categories of
psychological tests: objective measures, self-reports, and effort tests. All test
protocols were scored according to manual instructions and conventional scores
were used in the analyses unless otherwise noted. Total mean scores were
calculated for all the conventional scores on the objective measures, self-report
measures, and effort tests, and are reported by group in the respective tables
presented in the results. However, not every conventional score was used as a

48
dependent variable in subsequent analyses because many of the tests chosen
yield multiple scores, which amounted to more than forty possible scores per
participant. Composite scores, total scores, and/or averages were used as the
dependent variables on measures that generated multiple scores. All
assessment measures and their respective scales/subscales are presented in
Table 1.
There were eleven total dependent variables used in the subsequent
analyses. Six dependent variables were derived from the objective measures.
Two dependent variables came from the self-report measures and three
dependent variables came from the effort tests. All independent and dependent
variables used in this study are operationally defined in Table 2.
Objective Measures
The six dependent variables derived from the objective measures included
scores or score combinations from the Connors� Continuous Performance Test
(CCPT), Trail Making Test (TMT), and the four WAIS-III subtests used in the
study: Digit Span (DS), Letter-Number Sequencing (LNS), Digit Symbol Coding
(DSC), and Symbol Search (SS). The CCPT and TMT yield results in T-score
form. Scores on the WAIS-III subtests were converted to standardized T-scores
to allow for easier comparison and interpretation across measures in this
category. Two dependent variables were derived from the CCPT, the TMT, and
the WAIS-III each, in the following manner:
The CCPT produces over ten scores per participant, eight of which were
represented in the data collected. The more scores that fall in the deviant range
on this test, the greater the likelihood that the participant has ADHD. Two scores

49
were computed from the CPT data that reflect this principle and were used as the
dependent variables from this measure: a mean total score and a sum of the
number of total clinically significant score elevations (T-scores greater than 65).
On the TMT, the T-scores from part A and part B were used as the two
dependent variables. These two scores are based on the time taken to complete
a simple sequencing task and a complex sequencing task, respectively.
The remaining two objective dependent variables were derived from the
four subtests of the WAIS-III. One of the dependent variables, Processing Speed,
is a WAIS-III index score averaged from the SS and DSC subtest scaled scores.
The other dependent variable computed for this study is the average of the DS
and LNS subtests, which represents a combination of immediate auditory
attention and auditory working memory.
Self-Report Measures
Two dependent variables were obtained from the self-report measures,
the Attention-Deficit Scales for Adults (ADSA), and the Wender Utah Rating
Scale (Wender). The ADSA provides a mean total score, a consistency score,
and nine subscale scores for each participant. The mean total score was used as
the dependent variable as it is a composite score. The Wender�s total score of
the critical items was used as the dependent variable (DV) for that measure.
Effort Measures
The final three dependent variables were derived from the two effort tests,
the Word-Memory Test (WMT) and the Rey Memory for 15 Items (MFIT). Two of
the dependent variables were from the WMT, which provides three effort scores
and three memory scores. The three effort scores are Immediate Recognition

50
(IR), Delayed Recognition (DR), and Consistency (CN). The first two scores, IR
and DR, are generally very similar for participants giving a good effort, hence the
third (CN) score. Accordingly, the average of the IR and DR scores was used as
one dependent variable and the CN score was used as 2nd DV from this test. The
total number of 15 items recalled was used as the dependent variable on the
MFIT.
Multivariate Analysis of Variance (MANOVA)
Three multivariate analyses of variance (MANOVA) were conducted.
Groups of similar variables (objective, self-report, or effort tests) were tested in a
mixed design, similar to the research designs used in related studies comparing
the performance of two or more populations on multiple psychological measures
(Tinius, 2003; McGee, Clark, & Symons, 2000, Inman & Berry, 2002). First, a 3 x
6 MANOVA was conducted with group condition (control, simulate, and ADHD)
as the independent variable and test scores previously described from the
objective tests of attention as the dependent variables. Second, a 3 x 2 MANOVA
was conducted with group condition (control, simulate, and ADHD) as the
independent variable and test scores from the self-report measures as the
dependent variable. A third 2 x 3 MANOVA was conducted with group condition
(control and simulate) as the independent variable and test scores from the effort
tests as the dependent variable. The archival ADHD group did not complete the
effort tests and was not included in this analysis. All significant findings were
followed up with post-hoc univariate F-tests with Bonferroni adjustments as
recommended by Bland and Altman (1995).
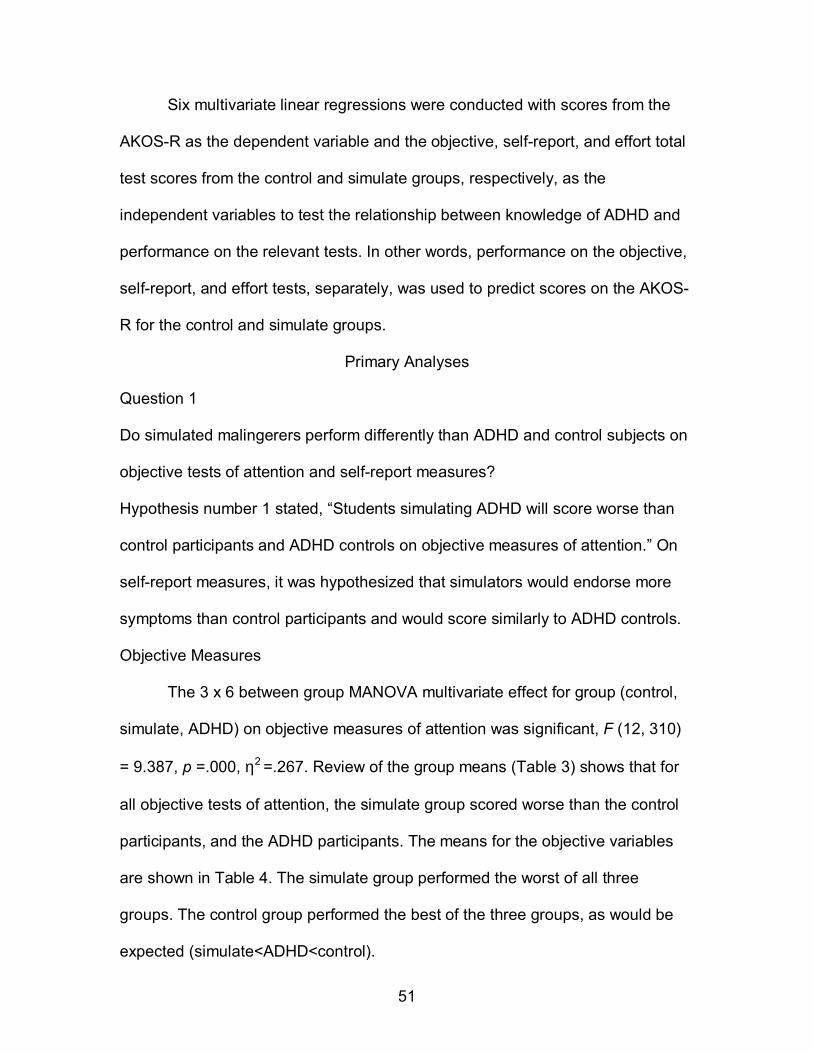
51
Six multivariate linear regressions were conducted with scores from the
AKOS-R as the dependent variable and the objective, self-report, and effort total
test scores from the control and simulate groups, respectively, as the
independent variables to test the relationship between knowledge of ADHD and
performance on the relevant tests. In other words, performance on the objective,
self-report, and effort tests, separately, was used to predict scores on the AKOS-
R for the control and simulate groups.
Primary Analyses
Question 1
Do simulated malingerers perform differently than ADHD and control subjects on
objective tests of attention and self-report measures?
Hypothesis number 1 stated, �Students simulating ADHD will score worse than
control participants and ADHD controls on objective measures of attention.� On
self-report measures, it was hypothesized that simulators would endorse more
symptoms than control participants and would score similarly to ADHD controls.
Objective Measures
The 3 x 6 between group MANOVA multivariate effect for group (control,
simulate, ADHD) on objective measures of attention was significant, F (12, 310)
= 9.387, p =.000, η2 =.267. Review of the group means (Table 3) shows that for
all objective tests of attention, the simulate group scored worse than the control
participants, and the ADHD participants. The means for the objective variables
are shown in Table 4. The simulate group performed the worst of all three
groups. The control group performed the best of the three groups, as would be
expected (simulate<ADHD<control).

52
Table 3 T-Scores on Objective Measures of Attention by Group
Group 1
Normal
Group 2
Simulate
Group 3
ADHD Group
Total Objective
Dependent
Measures Mean SD Mean SD Mean SD Mean SD
Digit Span
DS Coding
Let-Num Seq.
Symbol Sea.
Pro. Speed
Trails A
Trails B
CPT Comm.
CPT Hit RT
CPT Hit Rt. S.E.
Variability of SE
Hit RT Block
Hit SE Block
Hit RT ISI
Hit SE ISI
CPT # of ele.
52.65
55.93
53.82
55.61
56.67
44.95
49.75
51.35
54.52
59.23
52.81
47.62
54.01
62.81
55.47
1.47
7.91
8.50
9.99
7.57
8.16
10.77
9.39
11.18
10.74
13.48
10.29
13.36
10.92
10.94
7.73
1.34
44.00
43.75
45.87
46.72
44.96
35.73
44.05
66.06
52.27
81.68
72.10
54.65
57.05
80.77
63.83
3.40
11.53
13.05
9.64
13.52
12.72
15.12
13.05
13.47
15.08
25.11
16.89
27.59
20.59
20.47
11.62
1.25
46.07
45.53
46.42
47.02
45.68
42.04
44.70
63.37
52.16
67.22
62.40
52.27
57.12
64.13
56.29
2.39
8.33
8.51
7.24
8.56
8.43
9.16
10.35
14.65
10.37
14.68
11.60
15.31
15.34
13.47
10.85
1.66
47.53
48.34
48.66
49.73
49.06
40.91
46.16
60.24
52.98
69.30
62.38
51.50
56.06
69.14
58.49
2.41
10.04
11.50
9.67
10.96
11.29
12.47
11.26
14.59
12.10
20.53
15.31
19.58
16.04
17.39
10.81
1.63

53
Table 4 Mean T-scores for Objective Variables by Group Measures Normal Simulate ADHD Trail A T scores M 44.98 35.98 42.44 SD 10.87 15.14 9.08 Trail B T scores M 49.80 43.98 44.96 SD 9.47 13.17 10.38 WAIS PS T-scores M 56.67 45.00 45.86 SD 8.16 12.84 8.40 DS AND LN T-scores M 53.24 44.81 46.26 SD 8.02 9.79 7.26 CPT T-scores M 54.79 66.05 59.76 SD 6.02 9.64 6.88 Sum of CPT elevations M 1.5 3.4 2.4 SD 1.3 1.25 1.63 ________________________________________________________________
Multiple post hoc pair-wise comparisons using T`-tests with Bonferroni
adjustments to correct for the number of analyses were conducted. These
analyses indicated the differences between the simulate group and the control
group were significant for all six dependent variables derived from objective tests
of attention (see Table 5). The simulate group performed significantly worse than
control participants on all the dependent variables from objective tests as
predicted.
The differences between the simulate group and ADHD group, however,
were only significant for three of the six objective dependent variables. That is,
the simulate group performed significantly worse than the ADHD group on the
Trial Making Test part A, and the two dependent variables derived from the

54
Connors� Continuous Performance Tests. The simulate group scored worse than
the ADHD group on the other three measures, but not significantly so.
Table 5 Post Hoc Multiple Comparisons for Objective Measures Dependent Variable Mean
Difference Standard Error
Significance 95% Con. Int
Trial A Scores Normal � Simulate Normal � ADHD Simulate - ADHD
9.00* 2.54 -6.48*
2.304 2.304 2.304
.000 .817 .017
Lower 3.43 -3.04 -12.04
Upper 14.57 8.11 -.89
Trail B T-scores Normal � Simulate Normal � ADHD Simulate - ADHD
5.81* 4.83 -.98
2.140 2.140 2.140
.022 .076 1.00
.64 -.35 -6.16
10.99 10.01 4.20
WAIS PS T-scores Normal � Simulate Normal � ADHD Simulate - ADHD
11.67* 10.81* -.86
1.932 1.932 1.932
.000 .000 1.00
7.00 6.13 -5.53
16.35 15.49 3.81
DS AND LN T-scores Normal � Simulate Normal � ADHD Simulate � ADHD
8.42* 6.97* -1.45
1.621 1.621 1.621
.
.000
.000 1.00
4.50 3.05 -5.37
12.34 10.89 2.47
CPT Mean T-scores Normal � Simulate Normal � ADHD Simulate - ADHD
-11.26* -4.97* 6.29*
1.47 1.47 1.47
.000 .003 .000
-14.83 -8.54 2.71
-7.68 -1.39 9.86
Sum of CPT elev. Normal � Simulate Normal � ADHD Simulate - ADHD
-1.90* -.981* .925*
.273 .273 .273
.000 .001 .003
-2.56 -1.64 .265
-1.24 -.320 1.58
F(12,310) = 9.387, p. = .000, η2 = .26
The simulate group did not exaggerate impairment on the three other
measures as was predicted. The simulate groups� performance on the TMT part
B, and the two dependent variables derived from the WAIS-III subtests was not
significantly worse than the performance of the ADHD group.
Comparison of the control group to the ADHD group on the objective
dependent variables indicated the ADHD group performed significantly worse

55
than the control group on the two dependent variables derived from the WAIS-III,
and the two dependent variables from the CPT. An unexpected finding was that
the ADHD group and the control group were not significantly different in their
respective performance on the TMT, part A, or part B. It appears that the TMT
was not sensitive to ADHD in this study. In light of this finding, the ability of the
simulate group to perform similarly to the ADHD group on the TMT part B, cannot
be inferred to mean they are able to simulate ADHD on this measure.
Self-Report Measures
The 3 x 2 MANOVA between group and self-report measures was
significant for main effect of group F (4, 224) = 9.387, p. =. 000, η2 =. 258. It was
hypothesized that the simulate group would successfully simulate ADHD on self-
report measures of ADHD symptoms. It was predicted the simulate group would
endorse more symptoms than the control group and would score similarly to the
ADHD group on the Wender Utah Rating Scale and the Attention Deficit Scales
for Adults (ADSA).
Table 6
Mean T-scores for Self-Report Variables by Group Normal Simulate ADHD Wender Utah Rating M 18.11 48.60 37.50 SD 11.69 19.10 20.92 ADSA Total Score M 50.72 73.67 59.83 SD 12.73 13.02 13.15 ________________________________________________________________
Pair-wise comparisons of the means using T-tests with a Bonferroni
adjustment, revealed that the simulate group endorsed significantly more

56
childhood symptoms than did the control group on the Wender Utah Rating Scale
and on the total score from the ADSA, as predicted (see Table 7).
Table 7 Post Hoc Multiple Comparisons for Self-Report Measures Dependent Variable Mean
Difference Standard Error
Significance 95% Con. Int
Wender Utah Rating Normal � Simulate Normal � ADHD Simulate - ADHD
-30.49* -19.39* 11.10
3.09 6.94 6.93
.000 .018 .000
Lower -38.00 -36.27 -5.76
Upper -22.98 -2.51 27.96
ADSA Total Normal � Simulate Normal � ADHD Simulate - ADHD
-22.95* -9.11 13.84*
2.47 5.55 5.54
` .00 .310 .042
-28.96 -22.60 .36
-16.95 4.38 27.32
F (4,224) = 19.305, p. = .000, η2 =.256
Comparisons of the simulate group to the ADHD group on the self-report
measures were inconsistent. T-tests of the difference between the means
(adjusted by Bonferroni procedures) of the simulate group and the ADHD group
were not significant for the Wender. However, there was a significant difference
between these two groups on the ADSA total score. The simulate and ADHD
groups did not report significantly different rates of ADHD symptoms on
retrospective self-report, but the simulate group reported significantly more
current symptoms than the ADHD group on an adult self-report measure. This
finding is partially explained by an unexpected trend in the ADHD group.
An unanticipated finding was revealed in the post hoc comparison
between the mean of the control group and the mean of the ADHD group on the
dependent measures derived from self-report tests. While the ADHD group
endorsed significantly more childhood symptoms on the Wender, the ADHD
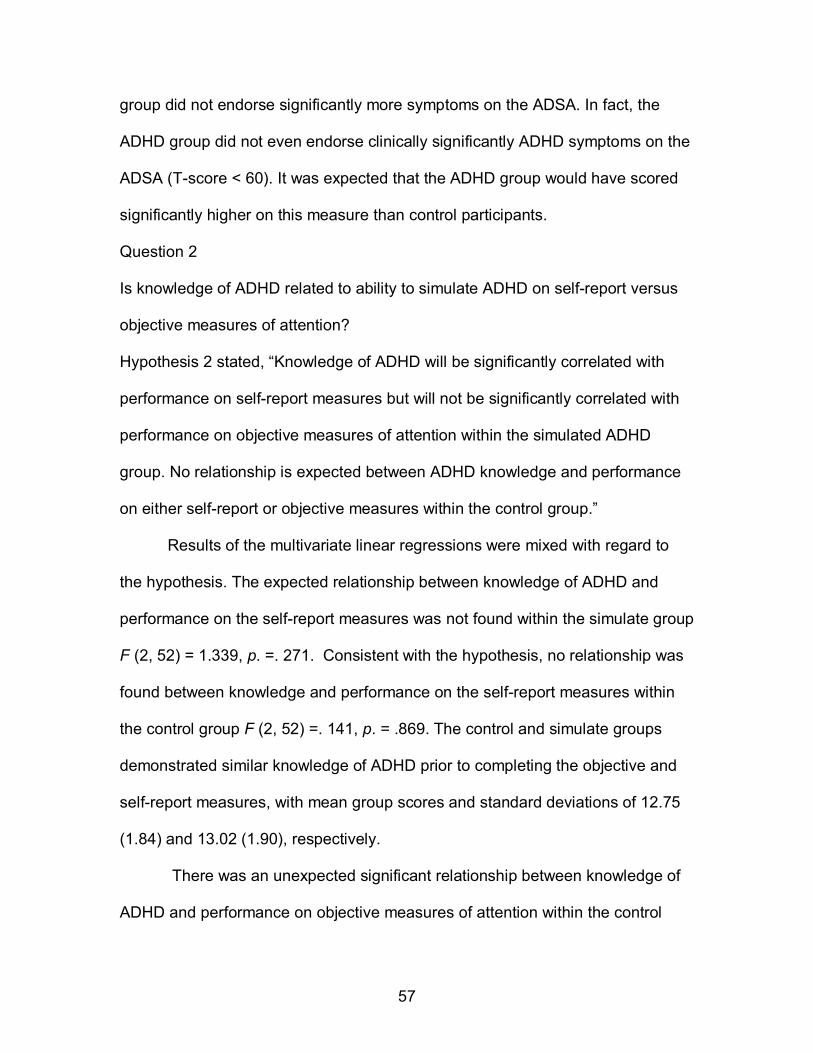
57
group did not endorse significantly more symptoms on the ADSA. In fact, the
ADHD group did not even endorse clinically significantly ADHD symptoms on the
ADSA (T-score < 60). It was expected that the ADHD group would have scored
significantly higher on this measure than control participants.
Question 2
Is knowledge of ADHD related to ability to simulate ADHD on self-report versus
objective measures of attention?
Hypothesis 2 stated, �Knowledge of ADHD will be significantly correlated with
performance on self-report measures but will not be significantly correlated with
performance on objective measures of attention within the simulated ADHD
group. No relationship is expected between ADHD knowledge and performance
on either self-report or objective measures within the control group.�
Results of the multivariate linear regressions were mixed with regard to
the hypothesis. The expected relationship between knowledge of ADHD and
performance on the self-report measures was not found within the simulate group
F (2, 52) = 1.339, p. =. 271. Consistent with the hypothesis, no relationship was
found between knowledge and performance on the self-report measures within
the control group F (2, 52) =. 141, p. = .869. The control and simulate groups
demonstrated similar knowledge of ADHD prior to completing the objective and
self-report measures, with mean group scores and standard deviations of 12.75
(1.84) and 13.02 (1.90), respectively.
There was an unexpected significant relationship between knowledge of
ADHD and performance on objective measures of attention within the control
58
group, F (6, 45) = 2.731, p. = .024, which is counter to the predicted results. This
relationship was not significant in the simulate group F (6, 45) = 1.104, p. =374.
There was no relationship between knowledge of ADHD and effort within
the control group, F (1,50) = 1.21, p. =.276, or the simulate group, F (2,52) =.179,
p. =.897.
Question 3
Are traditional effort tests sensitive to malingering in college students attempting
to feign ADHD?
Hypothesis 3: No directional hypothesis was postulated. The 2 x 3 MANOVA
conducted with group (control and simulate) as the independent variable and
performance on the 3 effort measures as the dependent variables revealed a
significant group effect, F (3, 105) = 28.468, p. = .000, η2 =. 449. The means for
the simulate group were 80.63 on the WMT average of recognition scores, 78.04
on the WMT consistency scores, and 13.80 for the MFIT while the means for the
control group were considerably higher at 99.32 on the WMT average of
recognition scores, and 98.65 on the WMT consistency score, and nearly the
same at 14.69, for the MFIT.
To further explore the sensitivity of the Word Memory Test to attempts at
simulation of ADHD, and to see how well the WMT fared at identifying simulators
relative to clinical judgment, the data were masked and the primary researcher
and an independent licensed clinical neuropsychologist, made judgments as to
the group membership of each participant, individually, based on the participant�s
performance on the objective measures of attention and the Wender (see table
8). The data used in this decision process was recorded in a separate database,

59
and it did not include or reveal in any other way, the participant�s group or scores
from the effort tests. The same dependent variables were used for each group so
that there were not any clues to group membership.
Table 8 Scores on Self-Report Measures of ADHD symptoms by Group
Normal Simulate ADHD Self-Report Measures Mean SD N Mean SD N Mean SD N Wender * ADSA Total Internal Cons. Attention-Focus-Con Interpersonal Beh.-Dis. Activity Coordination Academic-theme Emotive Con/Long-term Childhood Neg. Social
18.27 50.67 50.72 55.46 48.54 51.22 51.85 46.83 50.61 51.06 47.85 48.72
11.6511.3812.7312.4112.3311.9712.0610.8011.7514.0511.5612.32
555454545454545454545454
48.6054.3573.6776.7663.5870.2966.3159.1665.6770.8462.3362.85
19.1010.2213.0212.7313.9513.9014.6011.0812.5013.3410.2815.46
555555555555555555555555
42.11 49.89 61.25 72.56 50.78 64.44 59.33 55.67 51.78 64.22 54.78 49.33
17.599.54 11.5712.5712.1012.8313.6410.9710.6811.0911.6311.43
389 8 9 9 9 9 9 9 9 9 9
*Wender scores are raw scores; all other scores are T-scores
The independent psychologist correctly identified 33 control participants,
24 participants from the simulate group, and 23 participants from the ADHD
group. Twenty-four participants, nearly 44% the simulate group were
misclassified by the psychologist as participants belonging to the ADHD group.
The �blinded� researcher correctly identified 45 control participants, 31
participants in the simulate condition, and 22 participants in the ADHD condition.
Thirteen participants from the simulate group were misclassified by the
researcher as belonging to the ADHD group.
Using the Word Memory Test published cutoff scores for response bias
(less than 79% for IR, less than 75% for DR, and less than 82% for Consistency)
55 participants, the entire control group, were correctly classified as putting forth

60
a good effort, and therefore, belonging to the control group. Thirty-two
participants (58%) of the simulate group were correctly classified. Using the
WMT response bias cutoff scores to classify participants resulted in the
misclassification of twenty-three participants (42%) from the simulate group.
Using the WMT to classify participants did improve the accuracy rate of group
assignment over clinician judgment alone. Table 9 presents scores for effort tests
by group, while Table 10 presents the respective judgment of group membership
using masked data.
Table 9 Scores for Effort Tests by Group Effort Tests Normal
N = 54 Simulate
N= 55 Memory for Fifteen Word Memory Test Imm. Recognition Delayed Rec. Consistency Score Multiple Choice Paired Associates Free Recall
Mean 14.69 99.25 99.38 98.65 99.48 96.11 63.10 63.10
SD .94 1.34 1.60 2.26 6.26 6.49 14.8 14.81
Mean 13.80 80.63 80.63 78.04 69.36 69.90 43.45 43.45
SD 2.33 21.28 17.90 16.61 24.32 24.02 16.57 16.57
Table 10 Judgment of Group Membership using Masked Data
Independent Psychologist Blinded Researcher Judgment of Group Frequency Percent Frequency Percent
Correct Normal 33 19.9 45 27.1
Normal classified as Simulator 9 5.4 5 3.0
Normal classified as ADHD
14 8.4 4 2.4
Correct Simulator 24 14.5 31 18.7
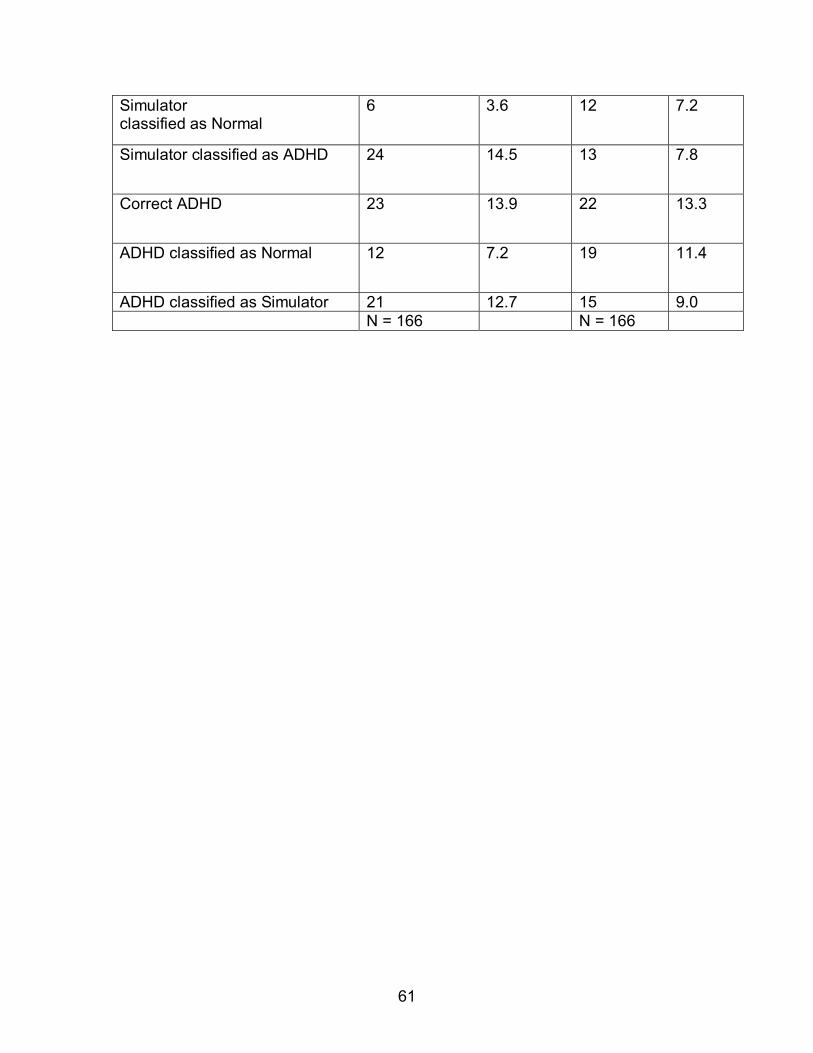
61
Simulator classified as Normal
6 3.6 12 7.2
Simulator classified as ADHD 24 14.5 13 7.8
Correct ADHD 23 13.9 22 13.3
ADHD classified as Normal 12 7.2 19 11.4
ADHD classified as Simulator 21 12.7 15 9.0 N = 166 N = 166

62
DISCUSSION
The present study examined the ability of college students to simulate
ADHD on objective tests of attention and also examined the relationship between
knowledge of ADHD and ability to simulate ADHD on objective tests of attention
and self-report measures of associated symptomotology or ADHD criteria. The
sensitivity of effort tests to simulation attempts in the assessment of ADHD was
also explored. Three main hypotheses were investigated.
The first hypothesis concerned the ability of college students to simulate
ADHD on objective tests of attention and self-report measures predicting that
college students would be able to successfully simulate ADHD on self-report
measures but would exaggerate impairment on objective measures of attention
and score significantly worse than an ADHD group on objective tests of attention.
The performance of college students in the control group, college students asked
to simulate ADHD, and college students with ADHD on objective tests of
attention, and self-report measures of ADHD symptoms was compared via 3 X 6
group MANOVA.
The results partially confirmed the first hypothesis, and also revealed
some unexpected findings. The pattern of group mean differences was generally
in the expected direction. That is the simulate group performed the poorest on all
six of the dependent variables which were derived from objective tests of
attention. The ADHD group performed better than the simulate group, but worse
than the control group, and the control group performed better than both the
ADHD and simulate groups.

63
Post-hoc pair-wise comparisons showed that the simulate group
performed significantly worse than the control group on all six of the objective
dependent variables analyzed. The simulate group performed significantly worse
than the ADHD group on three of the six dependent variables derived from the
objective measures: the Trail Making Test part A, the CPT mean score, and the
sum of CPT elevations.
The ADHD group, as expected, performed significantly more poorly than
the control group on the two dependent variables derived from the WAIS-III
subtests: the average for the scores on the Digit Span and Letter-Number
Sequencing mean, and the Processing Speed Index. The ADHD group also
scored more poorly than the control group on the dependent measures derived
from the Connors� Continuous Performance Test: CCPT mean score, and the
number of CCPT scale elevations.
Contrary to findings in previous studies, the ADHD group did not score
significantly worse than the control group on the TMT, parts A and B. In
hypothesizing that the simulate group would score worse than the control group
and the ADHD group on objective measures of attention, it was presumed that
the ADHD group would score significantly worse than the control group on the
these measures as well.
It is important to note that the ADHD group diagnosed in this study
completed an extensive clinical interview and psychoeducational test battery,
which included objective measures of personality and mood. Testing was
administered by graduate students enrolled in a doctoral program in clinical
psychology at Louisiana State University. All testing, interpretation, and

64
diagnoses were reviewed by a practicum team of graduate students and were
supervised by a licensed clinical neuropsychologist, who made the final
diagnosis. The overall pattern of scores obtained by a client was considered (so
that performance on any one test of attention was not overly weighted), and all
clients diagnosed with ADHD met the DSM-IV TR criteria for ADHD. A very high
standard was used in diagnosing students in the ADHD group, however, this
group consisted only of college students enrolled in Louisiana colleges and
universities and the findings in this study may limited in their generalizability.
Although the group means in this study were significantly different on the
objective tests of attention, for some of the objective measures, the differences
are not clinically meaningful. For example, the differences between the group
means for the WAIS-III subtests was generally within a standard deviation, and
even the lowest scores were within average limits.
The greatest score discrepancies between the simulate and ADHD group
were observed on a CPT index of response time variability, which was often as
many as three standard deviations above the mean, and for the TMT, part A. On
the objective tests of attention measured, college students attempting to simulate
ADHD were most successful, or scored most similarly to ADHD participants, on
the four WAIS-III subtests: Digit Span, Digit Symbol Coding, Letter-Number
Sequencing, and Symbol Search.
As with earlier studies (Quinn, 2003; Leark, Dixon, Hoffman, & Huynh,
2002), simulators, as a group, tended to overestimate the level of impairment that
would be expected on the sustained task of attention, the Connors� Continuous
65
Performance Test, and produced excessively poor scores that were worse than
the scores produced by the ADHD group.
Simulators also fared poorly attempting to simulate on the Trail Making
Test, part A, which is a very simple test of number sequencing and psychomotor
speed. The difference in the test demands between the four WAIS-III subtests,
the CPT, and the TMT, suggests two other factors that may be related to a
simulator�s ability to successfully feign inattention on psychological tests. In
addition to ability to accurately judge the degree of impairment expected for an
individual with ADHD on a particular task, test simplicity and level of interaction
between the examiner and the participant may be related to the simulator�s
comfort with performing poorly, or ability to simulate ADHD on a particular task.
For example, simulators may have been more comfortable simulating ADHD on
the CPT because it is a computerized test that requires little interaction between
the examiner and the individual taking the test and it may be easier to perform
poorly when there is not an examiner watching as closely. (Similarly, it may be
easier to simulate ADHD on self-report measures that are written versus
administered in interview format.)
The data regarding college simulators and objective tests of attention is
complicated and many factors need to be considered in making inferences that
can be generalized to assessment situations. Although some of the complexity
arises, in part, due to the large number and different type of objective measures
of attention studied, the data regarding simulation and self-report looked at fewer
variables, but still yielded mixed findings.

66
It was postulated that college students would be able to effectively
simulate ADHD on self-report measures, as has been found in previous studies.
On the self-report measures, the group means score profile showed the same
pattern as for the objective measures. The 3 x 2 MANOVA examining group by
self-report measure indicated there were significant differences between the
groups on the self-report measures.
The control group reported the fewest symptoms, the ADHD group
reported more symptoms than the control group, and the simulate group reported
the most symptoms for both the Wender and the ADSA. It was hypothesized that
the simulate group would endorse significantly more symptoms than the control
group and score similarly to the ADHD group on self-report measures.
Post hoc multiple comparisons of the observed means confirmed that this
is what happened on the Wender Utah Rating Scale. On this scale, the mean
difference between the control group and the simulate group, and between the
control and ADHD group was significant, while the difference between the
simulate group and the ADHD group was not significant. On the Wender, the
simulate group scored significantly higher than the control group but did not differ
significantly form the ADHD group, as the hypothesis predicted.
The hypothesis regarding self-report measures was not confirmed on the
ADSA, although the mean group differences were in the same order (i.e.
control<ADHD<simulate), the ADHD group and the control group did not differ
from each other significantly, while simulate group mean was significantly larger
than the ADHD group mean and the control group mean.
67
Interestingly, the archival ADHD group means for self-report measures
were lower than would be expected. The ADHD group had a mean T-score of
61.25 (n = 8) for the ADSA total score, which is a little more than one standard
deviation from the mean. The ADHD group mean score for the Wender was
42.11 (n = 38), which is above the raw score cutoff of 36 used to differentiate
control participants from ADHD participants.
One limitation of this study is that so few participants in the ADHD group
had completed the ADSA. The relatively low mean group scores for the ADHD
self-report measures may be due to the small sample for that measure, or if truly
representative of college students with ADHD, the findings would support the
arguments by Barkley (1996), Heligenstein et al., (1998) and other researchers
that the DSM criteria thresholds are too high when applied to adults, especially
college students. Only 21 of 50 adults in the simulate group, which as a whole
tended to exaggerate the number and degree of severity of ADHD symptoms that
are typically reported by adults with ADHD, endorsed the necessary number of
symptoms required to meet criteria for ADHD diagnosis during the MINI, which is
based on current DSM criteria. Thirty-six of the simulators reported having had 6
or more symptoms during childhood. Of these 36, 25 were apparently aware of
the DSM requirement that some symptoms be present before age 7 years.
The second hypothesis addressed the relationship between knowledge of
ADHD and performance on self-report measures of ADHD symptoms. It was
predicted that a significant relationship between knowledge and performance on
self-report measures would exist for simulators, but not for college students in the
control group.
68
It was expected that knowledge of the disorder, such as the most common
symptoms, and associated features, would facilitate attempts to simulate on self-
report measures, such as the Wender, via familiarity with what types of
symptoms to endorse. On the other hand, knowledge of ADHD was not expected
to enhance ability to simulate ADHD on objective measures, such as the Digit
Span and Symbol Search subtests of the WAIS-III, or the Connors� Continuous
Performance Test.
Knowledge of ADHD was not expected to be correlated with performance
on self-report measures or performance on objective measures of attention in the
control group because no relationship between one�s best effort on objective
measures of attention, processing speed, auditory attention, and one�s
knowledge of the disorder ADHD was expected. In other words, knowledge of the
impairments associated with ADHD was not expected to be related to
performance on objective tests of attention when one is putting forth a full effort.
The hypothesized relationship between knowledge and ability to simulate
ADHD on self-report measures was not demonstrated in the current study. This
hypothesis was rationally derived from earlier findings which suggested that it
was easier to feign a cognitive disorder on a self-report than on an objective
measure of attention (Leark et al., 2002, Quinn, 2003).
Although earlier research has demonstrated that prior knowledge of a
disorder via personal experience does not necessarily significantly improve ability
to feign a disorder on an objective measure (Hayes, Martin, & Gouvier, 1995) or
inoculate one against common misconceptions regarding the disorder (O�Jile et

69
al., 1997), still it would seem that knowledge might improve one�s chance of
endorsing the appropriate symptoms on a symptom checklist.
It remains possible that the relationship between knowledge of ADHD and
ability to simulate ADHD on self-report measures may not have been accurately
encompassed in this study, or accurately measured with the AKOS-R survey and
the Wender and/or ADSA questionnaires. There was a restricted range of scores
on the AKOS-R, and the control and simulate groups means did not differ
significantly on the AKOS-R, suggesting this measure may not be sensitive to
differences in knowledge of ADHD in a college population.
Although this study is rare among college studies in that the sample
actually came from the population of interest, at least demographically: college
students, it still has the same limitations as analog malingering studies or other
simulation designs completed with college students. Specifically that participants
asked to simulate a disorder for college credit are not working with the same
motivation as college students simulating ADHD to gain access to academic
accommodations and stimulant medication.
The correlation between knowledge of ADHD and performance on the
objective measures of attention could possible be due to a triangular relationship
between general intelligence, knowledge of ADHD, and performance on the
WAIS-III subtests, LN, DS, DSC, and SS. This explanation would be consistent
with the lack of relationship between knowledge of ADHD and the performance
on objective measures of attention within the simulate group. It could be that the
relationship between intelligence and performance on the WAIS-III subtests used

70
in this study was obscured by simulators intentionally not doing their best on the
WAIS-III subtests in attempting to simulate ADHD.
The last issue addressed by this study was the sensitivity of malingering
tests to simulation in the assessment of ADHD. The Word Memory Test cut-off
scores for response bias were able to correctly identify 27 of the simulators and
all of the control participants. Twenty-two simulators were able to pass the WMT.
Six of the simulators that were judged as �honest� by the WMT were
misclassified as ADHD by the blind researcher, and 13 of the 22 were
misclassified as ADHD participants by the independent clinician. Every
participant in the simulate group was able to pass the MFIT, making the scores
on that measure virtually meaningless in terms of identifying malingerers in the
context of an ADHD assessment.
It is difficult to find effort tests that are sensitive enough to use with a
bright college population. The fact that simple attention and effort have been
shown to be difficult to distinguish in prior research correlating performance on
the Portland Digit Recognition Test (PDRT) to some indices on the CPT,
highlights the complexity of assessing effort in an ADHD population. The PDRT
is very much like the computerized CPT in terms of the demand for chronic,
sustained attention. Children diagnosed with ADHD, age 10 years old, had a
mean correct percentage rate above 90% on the WMT, even when the scores
from children who failed the measure due to poor effort were averaged in with the
rest of the group (Green & Allen, 1999). This indicates that the confound of
simple effort and attention is not a problem with this test. Although the WMT only

71
correctly classified 27 of the simulators, it did better than the blinded researcher
or the independent clinician using masked data.

72
CONSLUSION
This study examined the ability of college students to simulate ADHD on
objective tasks of attention and self-report measures of ADHD symptoms. The
hypothesis that college students would be able to successfully simulate ADHD on
self-report measures but would overestimate the degree of impairment
associated with ADHD and would actually score significantly worse than
participants with ADHD on objective tasks was only partially confirmed.
Some of the self-report and objective measures were found to be
generally insensitive to differences between the groups� performance in this
study. The WAIS-III subtests, at least when studied in isolation, did not appear as
sensitive to attentional deficits was reported in the WAIS-III technical manual.
The difference in findings may be due to sample size of this study and the
significantly larger WAIS-III norms.
In this study, computer tests were more sensitive to attempts at simulation
than were clinical judgment, orthographic measures, or verbal tests or attention.
The greatest mean differences between the groups on objective measures of
attention was for the CPT. This test was useful as both a valid measure of
attention, when scores are between one and two standard deviations, and as an
indication of malingering, when scores exceed two standard deviations above the
mean. The WMT also fared better at detecting simulators than did clinical
subjects. The addition of computer tests to a psychoeducational battery is
recommended in the clinical assessment of ADHD.
College simulators did score similarly to ADHD participants on a
retrospective self-report of childhood symptoms, but endorsed significantly more

73
symptoms than both the control students and students with ADHD on an ADHD
scale for adults. The unexpected finding that participants in the ADHD group did
not endorse significantly more symptoms than the control group on the adult
ADHD scale challenges the assumptions underlying the study�s hypothesis or
may simply challenge the validity of the scale.
It has been proposed by some researchers that there is a subgroup of
college students with ADHD who are able to compensate for their attentional
impairments due to above average intelligence. Many researchers have argued
that the current criteria for ADHD do not accurately describe adults with the
disorder due to a decrease in symptoms with age in ADHD patients. The findings
of this study are consistent with both of these arguments.
It would seem that before trying to answer the question, �Are college
students able to simulate ADHD?� ADHD in college students must be better
defined and base rates of inattention, impulsivity, and hyperactivity must be
described in college students without ADHD. The ability of college students to
simulate ADHD is difficult to examine when there is so much controversy as to
the course of the disorder in adults. Additionally, analog simulators are not
motivated by the same factors as college students attempting to feign the
disorder to gain access to stimulant medications or academic accommodations.
The relationship between ability to simulate ADHD and knowledge of
ADHD was not clearly revealed in this study. Again, we must be able to define
ADHD better in adults before we can judge simulation of the disorder. One
inherent weakness in the design of this study is that the knowledge base of true
simulators, college students who are unequivocally attempting to feign the

74
disorder, may differ dramatically from college students asked to simulate the
disorder for course credit. In this study there was no difference in scores for
knowledge of ADHD in the simulate group and the control group.
Real simulators may be more likely to take advantage of the easy access
to information about the disorder that is available on the internet and in college
libraries and may know more than the typical college student about how to
simulate the disorder. Future studies may want to increase the motivation of
analog simulators, and give them time to prepare for the task. Additionally,
manner of recruitment may influence the type of student who volunteers for a
simulation study. The recruitment announcements for this study simply stated the
study was looking at �cognitive abilities� of college students.
In retrospect, students attracted to this study may have been more likely to
want to do well than not. Although the rationale behind the recruitment method
for this study was that the study wanted to look at the ability of college students
in general to simulate, not the ability of students who would be drawn to materials
that asked for students to simulate a disorder. However, actually asking for
simulators may result in the recruitment of volunteers who more closely resemble
simulators.
Examiners in this study were aware of subject condition, or group
placement. It may be that examiners had some demand effect on subjects,
though this could not be tested in the current study. Future studies may want to
use examiners who are blind to the subject condition.

75
REFERENCES
American Psychiatric Association. (1968). Diagnostic and statistical manual of mental disorders (2nd ed.). Washington, DC: Author.
American Psychiatric Association. (1980). Diagnostic and statistical manual of mental disorders (3rd ed.). Washington, DC: Author.
American Psychiatric Association. (1987). Diagnostic and statistical manual of mental disorders (3rd ed. , revised). Washington, DC: Author.
American Psychiatric Association. (1994). Diagnostic and statistical manual of mental disorders (4th ed.). Washington, DC: Author.
American Psychiatric Association. (2000). Diagnostic and statistical manual of mental disorders (4th ed. , text revision). Washington, DC: Author.
Babcock, Q., & Byme, T. (2000). Student perceptions ofmethylphenidate abuse at a public liberal arts college. Journal of American College Health, 49, 143 -145.
Barkley, R. A. (1996). Attention-deficity/hyperactivity disorder. In E. Mash & R.
Barkley (Eds.), Child psychopathology (pp.63-112). New York: The Guilford Press.
Barkley, R. A. (1998). Attention deficit hyperactivity disorder: A handbook for
diagnosis and tratment (2nd ed.). New York: Guilford Press. Biederman, J. (1998). Attention-deficit/hyperactivity disorder: A lifespan
perspective. Journal of Clinical Psychiatry, 59(7), 4-16. Biederman, J., Farone, S. V., Spencer, T., Wilens, T., Norman, D., Lapey, K.
A. et al. (1993). Patterns of psychiatric comorbidity, cognition and psychosocial functioning in adults with attention deficit hyperactivity disorder. American Journal of Psychiatry, 1150, 1792-1798.
Biederm, J., Newcorn, J., & Sprinch, S. (1991). Comorbidity of attention deficit
hyperactivity disorder with conduct, depressive, anxiety, and other disorders. American Journal of Psychiatry, 148, 564-577.
Bland, J.M. & Altman, D.G. (1995). Multiple significance tests: the Bonferroni
method. BMJ, 310:170. Blandford, A. J. & Lloyed, J. W. (1987). Effects of a self-instructional
procedure on handwriting. Journal of Learning Disabilities, 20 (6), 342-346.
76
Booksh, R. L., Dixon, D. R., Fabian, M., & Gouvier, W. D. (2003). An investigation of the relationship between performance on the Connors� Continuous Performance Test and the Portland Digit Recognition Test [Abstract]. Archives of Clinical Neuropsychology, 18 (7), p.780.
Bradley, J. D. D., & Golden, C. A. (2001). Biological contributions to the
presentation and understanding of attention-deficit/hyperactivity disorder: a review. Clinical Psychology Review, 21(6), 907-929.
Brown, T. (1996). Brown Attention-Deficit Disorder Scales. TX: The
Psychological Corporation. Chess, S. (1960). Diagnosis and treatment of the hyperactive child. New York
State Journal of Medicine, 60, 2379-2385. Clifford, P., Edmundson, E., Kock, W., & Dodd, B. (1989). Discerning the
epidemiology of drug use among a sample of college students. Journal of Drug Education, 19(3), 209-223.
Conners, C. K. (1995) Conners� Continuous Performance Test. Toronto:
Multihealth Systems. Conners, C. K., Erhardt, D., & Sparrow, M. A. (1999). Conners� Adult ADHD
Rating Scales, Technical manual. New York: Multihealth Systems, Inc. Currier, Rebecca Owen (2004). The relation between knowledge of ADHD and
treatment acceptability in a multi-disciplinary pediatric clinic. Retrieved June 1, 2005, from Louisiana State University Electronic Thesis & Dissertation Collection Web site: http://www. Etd.lsu.edu/docs/available/etd-04012004142458/unrestricted/dissertationfinal.pdf
Davis, K. L., Kahn, R. S., Ko, G., Davidson, M. (1991). Dopamine in
schizophrenia: A review and reconceptualization. American Journal of Psychiatry, 148(11), 1474-1486.
Delis, D. C., Kramer, J. H., Kaplan, E., & Ober, B. A. (1987). California Verbal
Learning Test: Adult Version Manual. San Antonia Tx: The Psychological Corporation.
Downey, K. K., Stetson, F. W., Ponerleau, 0. F., & Giordani, B. (1997). Adult
attention deficit hyperactivity disorder: Psychological test profiles in a clinical population. The Journal of Nervous and Mental Disease, 185(1), 32-38.
Dulcan & Work Group on Quality Issues. (1997). Practice parameters for the
assessment and treatment of children, adolescents, and adults wit attention-deficit/hyperactivity disorder. Journal of the American Academy of Child & Adolescent Psychiatry, 36(10S) (Suppl). 85S-121S.

77
DuPaul, G. J., Schaughency, E. A., Weyandt, L. L., Tripp, G., Kiesner, J., Ota, K., et al. (2001). Self-report of ADHD symptoms in university students: cross-gender and cross-national prevalence. Journal of Learning Disabilities, 34(4), 370-379.
ERCI Health Technology Assessment Information Service. (2000). Continuous
performance test (CPTs) for diagnosis and titration of medication for attention deficit hyperactivity disorder (ADHD).
Ehrenfest, H. (1926). Birth injuries of the child. Gynecological and Obstetrical
Monographs. New York: Appleton. Fielding, J. E. (1985). Smoking: Health effects and control. New England
Journal of Medicane, 313, 491-498. Feingold, B. F. (1975). Hyperkinesis and learning disabilities linked to artificial
food flavors and colors. American Journal of Nursing, 75(5), 797-803. Gouvier, W. D. (2000). Are you sure you�re really telling the truth.
Neurorehabilitation, 16, 215-219. Gouvier, W. D., Cubic, B. Jones, G., Brantley, & Cutlip, Q. (1992).
Postconcussion symptoms and daily stress in normal and head-injured college populations. Archives of Clinical Neuropsychology, 7, 193-211.
Gouvier, W. D., Uddo-Crane, M., & Brown, L. M. (1988). Base rates of post-
concussional symptoms. Archives of Clinical Neuropsychology, 3, 273-278.
Green, P., & Allen, L. M. (1999). Supplement to the Word Memory Test and
CARB �97 Manuals. Durhan, NC: Cognisyst. Green, P., Allen, L., & Astner, K. Manual for Computerised Word Memory
Test. Durham, NC: Cognisyst. Hayes, J. S., Martin, R., & Gouvier, W. D. (1995). Influence of prior knowledge
and experience on the ability to feign mild head injury symptoms in head injured and non-head-injured college students. Applied Neuropsychology, 2, 63-66.
Heiligenstein, E. , Conyers, L. M., Berns, A. R., Miller, M. A. & Smith, M. A.
(1998). Preliminary normative data on DSM-IV attention deficit disorder in college students. Journal of American College Health, 46, 185-188.
Heiligenstein, E., Guenther, G., Levy, A., Savino, F., & Fulwiler, J. (1999).
Psychological and academic functioning in college students with attention deficit hyperactivity disorder. Journal of American College Health, 47, 181-185.
78
Hill, J. C. & Schoener, E. P. (1996). Age-dependent decline of attention deficit hyperactivity disorder. American Journal of Psychiatry, 153(9), 1143-1146.
Hilsabeck, R. C., Thompson, M. D., Irby, J. W., Adams, R. L., Scott, J. G., &
Gouvier, W. D. (2003). Partial cross-validation of the Wechsler Memory Scale-Revised (WMS-R) general memory-attention/concentration malingering index in a nonlitigating sample. Archives of Clinical Neuropsychology, 18, 71-79.
Horner, B. R., & Scheibe, K. E. (1997). Prevalence and implications of
attention-deficit hyperactivity disorder among adolescents in treatment for substance abuse. Journal of the American Academy of Child and Adolescent Psychiatry, 36(1), 30-36.
Inman, T. H., & Berry, D. T. R., (2002). Cross-validation of indicators of
malingering a comparison of nine neuropsychological tests, four tests of malingering, and behavioral observations. Archives of Clinical Neuropsychology, 17, 1-23.
Iverson, G. L., & Tulsky, D. S., (2003). Detecting malingering on the WAIS-
III Unusual Digit Span performance patterns in the normal population and in clinical groups. Archives of' Clinical Neuropsychology, 18, 1-9.
Iverson, G. L., Slick, D. J., & Franzen, M. D. (2000). Evaluation of a WMS-R
malingering index in a non-litigating clinical sample. Journal of Clinical and Experimental Neuropsychology, 22(2), 191 -197.
Klein, R., & Mannuzza, S. (1991). Long term outcome of hyperactive children:
a review. Journal of the American Academy of Child and Adolescent Psychiatry, 30, 383-387.
Knobel, M., Wolman, M. B., & Mason, E. (1959). Hyperkinesis and organicity
in children. Archives of General Psychiatry, 1, 310-321. Langeluddecke, P. M., & Lucas, S. K. (2003). Quantitative measures of
memory malingering on the Wechsler Memory Scale-Third Edition in mild head injury litigants. Archives of Clinical Neuropsychology, 18, 181-197.
Lahey, B. B., Applegate, B., McBurnett, K., Biederman, J., Greenhill, L., Hynd,
G.W., et al. (1994). DSM-IV field trials for attention deficit/hyperactivity disorder in children and adolescents. Journal of the American Academy of Child and Adolescent Psychiatry, 151, 1673-1685.
Leark, R. A., Dixon, D., Hoffman, T., and Huynh, D. (2002). Fake bad test
response bias effects on the test of variables of attention. Archives of Clinical Neuropsychology, 17, 335-342.
79
Lipman, F. D. (1962). Malingering in personal injury cases. Temple Law Quarterly, 35, 141-162.
Lou, H. C., Hendrickson, L., & Bruhn, J. (1984). Focal cerebral hypoperfusion
in children with dysphasia and/or attention deficit disorder. Archives of Neurology, 41 (8), 825-829.
Mannuzza, S., Klein, R., Bessler, A., Malloy, P., & LaPadula, M. (1993). Adult
outcome of hyperactive boys: Educational achievement, occupational rank, and psychiatric status. Archives of General Psychiatry, 50, 565-576.
Mannuzza, S., Klein, R. G., Klein, D. F., Bessler, A., & Shrout, P. (2002).
Accuracy of adult recall of childhood attention deficit hyperactivity disorder. American Journal of Psychiatry, 159(11), 1882-1888.
Martin, R. C., Hayes, J. S., & Gouvier, W. D. (1996). Differential Vulnerability
between postconcussion self-report and objective malingering test in identifying simulated mild head injury. Journal of Clinical and Experimental Neuropsychology, 18(2), 265-275.
Mather, N., & Woodcock, R. W. (2001). Examiner�s manual: Woodcock-
Johnson III test of achievement. Itasca, IL: Riverside Publishing. McGee, R.A., Clark, S. E., Symons, D.K.. (2000). Does the Conners�
Continuous Performance Test aid in ADHD diagnosis? Journal of Abnormal Child Psychology, 28(5), 415-424.
Milberger, S., Biederan, J., Faraone, S. V., Chen, L., & Jones, J. (1996). Is
maternal smoking a risk factor for attention-deficit hyperactivity disorder in children? American Journal of Psychiatry, 153(9), 1138-1142.
Milberger, S., Biederan, J., Faraone, S. V., Guite, J., & Tsuang, M. T. (1997).
Pregnancy, delivery, and infancy complications and attention defiicty hyperactivity disorder:issues of gene-environment interaction. Biological Psychiatry, 41, 65-75.
Milberger, S., Biederan, J., Faraone, S. V., Jones, J. (1998). Further evidence
of an association between maternal smoking during pregnancy and attention-deficit hyperactivity disorder: Findings from a high risk sample of siblings. Journal of Clinical Child Psychology, 27, 352-358.
Milin, R., Loh, E., Chow, J., & Wilson, A. (1997). Assessment of symptoms of
attention-defict hyperactivity disorder in adults with substance use disorders. Psyciatric Services, 48(11), 1378-1380.

80
Mittenberg, W., Azrin, R., Millsaps, C., & Heilbronner, R. (1993). Identification of malingered head injury on the Wechsler Memory Scale-Revised. Psychological Assessment, 5(1), 34-40.
Mittenberg, W., Theroux-Fichera, S., Zielinski, R. E., & Heilbronner, R. (1993).
Identificantion of malingered head injury on the Wechsler Adult Intelligence Scale-Revised. Professional Psychology: Research and Practice, 26(5), 491-498.
Mittenberg, W., Thompson, G. B., & Schwartz, J. A. (1991). Abnormal and
reliable differences among Wechsler Memory Scale-Revised subtests. Psychological Assessment: A Journal of Consulting and Clinical Psychology, 3(3), 492-495.
Moline, S. & Frankenberger, W. (2001). Use of stimulant medication for
treatment of attention-deficit/hyperactivity disorder: A survey of middle and high school students� attitudes. Psychology in the Schools, 38(6), 569-584.
Morgan, W. D. (2000). In J. R. White and A. S. Freeman (Eds.). Cognitive-
behavioral group therapy for specific problems and populations. (pp. 211-232). Washington, DC: American Psychological Association.
Murphy, K., & Barkley, R. A. (1995). Preliminary normative data on DSM-IV
criteria for adults. ADHD Report, 3, 6-7. Nies, K. J., and Sweet, J. J. (1994). Neuropsychological assessment and
malingering: A critical review of past and present strategies. Archives of Clinical Neuropsychology, 9(6), 501-552.
O'Donnel, J. P., McGann, K. K., Pluth, S. (2001). Assessing adult ADHD using
a self-report symptom checklist. Psychological Reports, 88, 871-881. O�Jile, J.R., Ryan, L.M., Parks-Levy, J., Gouvier, W.D., Betz, B., Haptonstahl,
D., & Coon, R.C. (1997). Effects of head injury experience on head injury misconceptions. International Journal of Rehabilitation and Health, 3, 61-67.
Oltmanns, T. F., & Emery, R. E. (1995). Psychological problems of childhood
and eating disorders. Abnormal Psychology (pp. 527-531). New Jersey: Prentice-Hall, Inc.
O�Malley, K. & Nanson, J. (2002). Clinical implications of a link between fetal
alcohol spectrum disorder and attention-deficit hyperactivity disorder. Canadian Journal of Psychiatry, 47(4), 349-354.
81
Pary, R., Lewis, S., Matuschka, P., Rudzinskiy, P., Safi, M., and Lippman, S. (2002). Attention deficit disorder in adults. Annals of Clinical Psychiatry, 14(2), 105-111.
Pelham, W. E. & Gnagy, E. M. (1999). Psychosocial and combined treatments
for ADHD. Mental Retardation and Developmental Disabilities Research Reviews, 5, 225-236.
Perneger, T. (1998). What�s wrong with Bonferroni adjustments. BMJ,
316:1236-1238. Pindiprolu, S. (1997). Self-instructional training for children with arithmetic
difficulties. Theories & Practices in Supervision and Curriculum. Retrieved June 26, 2004, from http://www.coe.usu.edu/uascd/ journal/current_issue/april97/april97.htm
Psychological Corporation. (1992). Wechsler Individual Achievement Test:
Author. Quinn, C. (2003). Detection of malingering in assessment of adult ADHD.
Archives of Clinical Neuropsychology, 18(4), 379-395. Rapoport, J. L. & Inoff-Germain, G. (2002). Responses to methylphenidate in
attention-deficit/hyperactivity disorder and normal children. Journal of Attention Disorders, 6 (Suppl 1), S57-60.
Rapport, M. D. (2001). Attention-deficit/hyperactivity disorder. In. Herson &
Van Hasselt (Eds.), Advanced abnormal psychology, seconed edition (pp. 191-208). New York: Kluwer Academic/Plenum Publishers.
Ratey, J. J., Greenberg, M. S., Bemporad, J. R., & Lindem, K. J. (1992).
Unrecognized attention-deficit hyperactivity disorder in adults presenting for out patient psychotherapy. Journal of Child and Adolescent Psychopharmacology, 2, 267-275.
Rey, A. (1964). L�examen Clinique en Psychologia. Paris: Pressee
Universitaires de France. Richards, T. L., Rosen, L. A., and Ramirez, C. A. (1999). Psychological
functioning differences among college students with confirmed ADHD, ADHD by self-report only, and without ADHD. Journal of College Student Development, 40(3), 299-304.
Rostain, A. L., Power, T. J., & Atkins, M. S. (1993). Assessing parents�
willingness to pursue treatment for children with attention-deficit hyperactivity disorder. Journal of the American Academy of Child and Adolescent Psychiatry, 32, 175-181.
Schubiner, H., Tzelepis, A., Milberger, S., Lockhart, N., Kruger, M., Kelley, B.,
et al. (2000). Prevalence of attention-deficit/hyperactivity disorder and
82
conduct disorder among substnace abusers. Journal of Clinical Psychiatry, 61(4), 244-251.
Semrud-Clikeman, M., Biederman, J., Sprich-Buckminster, S., Lehman, B. K.,
Faraone, S. V., & Norman, D. (1992). Comorbidity between ADDH and learning disability: A review and report in a clinically referred sample. Journal of the American Academy of Child and Adolescent Psychiatry, 31, 439-448.
Shaywitz, B. A., Shaywitz, S. E., Sebrechts, M., & Anderson, G. M. (1990).
Growth hormone and prolactin response to methylphenidate in children with attention deficit disorder. Life Sciences, 46, 625-633.
Sheehan, D. V., Lecrubier, Y., Sheehan, K. H., Amorim, P., Janavs, J., Weiler,
E., et al. (1998). The Mini-International Neuropsychiatric Interview (M.I.N.I.). The development and validation of a structured diagnostic psychiatric interviw for DSM-IV and ICD-10. Journal of Clinical Psychiatry,
Sierles, F. S.. (1984). Correlates of malingering. Behavioral Science and the
Law, 2, 113-118. Simpson, D., & Plosker, G. L. (2004). Spotlight on atomoxetine in adults with
attention-deficit hyperactivity disoder. Central Nervous System Drugs, 18(6), 397-401.
Still, G.F. (1902). Some abnormal psychical conditions in children. Lancet, 1,
1008-1012, 1077-1082, 1163-1168. Soniat, T. L. (1967). The problem of compensation neurosis. South Medical
Journal, 53, 365-368. Taylor, F. B., & Russo, J. (2001). Comparing guanfacine and
dextroamphetamine for the treatment of adult attention deficity/hyperactivity disorder. Clinical Psychopharacology, 21(2), 223-228.
Tinius, T. (2003), The intermediate visual and auditory continuous
performance test as a neuropsychological measure. Archives of Clinical Neuropsychology, 18, 199-214.
Travin, S., & Potter, B. (1984). Malingering and malingering-like behavior.
Some clinical and conceptual issues. Psychiatric Quarterly, 56(3), 189-197.
Triolo, S.J., & Murphy, K.R. (1996). Attention-Deficit Scales for Adults. New
York: Brunner-Maxel Inc. Turnock, P., Rosen, L. A., and Kaminski, P. L. (1998). Differences in academic coping strategies of college students who self-report high
83
and low symptoms of attention deficit hyperactivity disorder. Journal of College Student Development, 39(5), 484-493.
Ward, M., Wender, P., & Reimherr, F. (1993). The Wender Utah Rating Scale:
An aid in retrospective diagnosis of children with ADHD. American Journal of Psychiatry, 160, 245-256.
Wechsler, D. (1997). Manual for the Wechsler Adult Intelligence Scale III. New
York: The Psychological Corporation. Wechsler, D. (1997). Wechsler Memory Scale (3rd ed.). San Antonio, Tx: The
Psychological Corporation. Weinstein, C. S. (1994). Cognitive remediation strategies: an adjunct to the
psychotherapy of adults with attention-deficit hyperactivity disorder. Journal of Psychotherapy Practice and Research, 3, 44-57.
Weiss, G., Hechtman, L, Milroy, T., & Perlman, T. (1985), Psychiatric status of
hyperactives as adults: A controlled prospective 15-year follow-up of 63 hyperactive children. Journal of American Academy of Child Psychiatry, 24(2), 211-220.
Wender, P. H. (1998). Attention deficit disorder in adults. Psychiatric Clinics of
North America, 21(4), 761-774. West, M. (1999). Attention Deficit/Hyperactivity Disorders Through the
Lifespan (2nd ed.). South Easton, MA: Western Schools Press. Weyandt, L.. Linterman, I., & Rice, J. (1995). Reported prevalence of
attentional difficulties in a general sample of college students. Journal of Psychopathology and Behavioral Assessment, 17(3), 293-304.
Weyandt, L. L., Rice, J. A., Linterman, I., Mitzlaff, L. & Emert, E. (1998).
Neuropsychological performance of a sample of adults with ADHD, developmental reading disorder, and controls. Developmental Neuropsychology, 14(4), 643-656.
Zametkin, A. J. & Liotta, W. (1998). The neurobiology of attention-
deficity/hyperactivity disorder. Journal of Clinical Psychiatry, 59(7), 17-23.
84
APPENDIX A
CONSENT FORM
Louisiana State University
236 Audubon Hall
Baton Rouge, LA 70803-5501
(225) 578-1494
1. Study Title:
Ability of College Students to Simulate Attention-Deficit/Hyperactivity
Disorder on Objective Measures of Attention.
2. Performance Sites:
Louisiana State University in the Psychological Services Center.
3. Contacts:
The investigators listed below are available to answer questions about
the research, Monday through Friday, 8:00 a.m.� 4:00 p.m.
Wm. Drew Gouvier, Ph.D. (225) 578-1494
Randee Lee Booksh, M.A (504) 237-7614
4. Purpose of the Study:
The purpose of this research project is to investigate the ability of
college students to simulate Attention-Deficit/Hyperactivity Disorder(ADHD)on.
5. Subjects:
A. Inclusion Criteria: At least 18 years old
Current undergraduate at LSU
85
B. Exclusion Criteria:
History of Learning Disorder, ADHD, or current complaint of significant
problems with inattention, hyperactivity, or impulsivity; moderate or severe head injury
within the past five years, neurological disease or seizure disorder.
C. Maximum number of subjects: 200
6. Study Procedures:
Each subject will be interviewed about their medical and psychological
history, complete self-report measures of ADHD, objective tests of attention, tests of
cognitive abilities, and effort tests. The interview and testing will be completed during
one scheduled appointment and should not exceed 2 hours.
7. Benefits:
Each subject will receive four (4) extra credit points for participation in
this two (2) hour study. Subjects who perform within average limits on effort tests will
be entered in a drawing for a chance to win a $50.00 gift certificate to a local
restaurant. Information gained from this study may help to improve the accuracy of
assessment for ADHD in college students.
8. Risks/Discomforts:
There is no known risk associated with participation in this study above
what might be experienced during an average day.
9. Measures taken to reduce risk
To assure that subject privacy is respected, this study will be
anonymous.
10. Right to Refuse:
86
Participation in this study is completely voluntary and subjects may
decide to withdraw from the study at any time without penalty.
11. Privacy:
Subjects� names on consent forms will not be able to be linked to
interview, questionnaire, or test responses. Consent forms will be stored separately
from data.
The LSU Institutional Review board (which oversees university research
with human subjects) and Wm. Drew Gouvier, Ph.D. may inspect and/or copy the
study records.
Results of this study may be published, but no names or identifying
information will be included in the publication
12. Financial Information:
There is no cost to subjects for participation. Subjects will receive four(4) extra
credit points for participation in this study.
13. Withdrawal:
You may withdraw from this study at any time. However, extra credit
points will not be given for less than full participation. To withdraw, inform the principal
investigator or research assistant of your decision.
14. Removal:
If it becomes apparent that a subject meets exclusion criteria at any point in the
study, the subject will be removed from the study without his or her consent.
87
Part 5: Signatures
The study has been discussed with me and all my questions have been answered. I may
direct additional questions regarding study specifics to the investigators. If I have questions about
subjects' rights or other concerns, I can contact Robert C. Mathews, Chairman, LSU Institutional
Review Board, (225)578-8692. I agree to participate in the study described above and
acknowledge the researchers� obligation to provide me with a copy of this consent form if signed by
me.
Subject Signature ________________________Date ______________
Subject Name (Print)_______________________________________
Subject phone number or email address (for gift certificate purposes
only)_____________________
Witness Signature _________________________Date ______________

88
APPENDIX B STRUCTURED CLINICAL INTERVIEW
Date:_________ Age: ________ Gender: male female
Race: Caucasian, African American, Hispanic, Asian, Other_________________
Years of education and college status:__________________________________
College major and minor:____________________________________________
Current grade point average:_________________________________________
Rule outs
Have you ever had a head injury? Yes No
(Have you ever been hit on the head hard enough to make you see stars [dizziness, trouble
concentrating after, confused] lose consciousness, or seek medical treatment?) Yes No
If yes, describe head injury(ies): type of injury, length of unconsciousness, medical treatment,
diagnosis, hospitalization, and post-traumatic amnesia.
________________________________________________________________
Do you have any neurological conditions? Yes No
If yes, please describe______________________________________________
Do you have a seizure disorder? Yes No
Have you ever been diagnosed with Attention-Deficit/Hyperactivity Disorder? Yes No
Do you currently have significant problems with inattention, impulsivity, or hyperactivity that
interfere with your academic functioning, social life, or work performance? Yes No
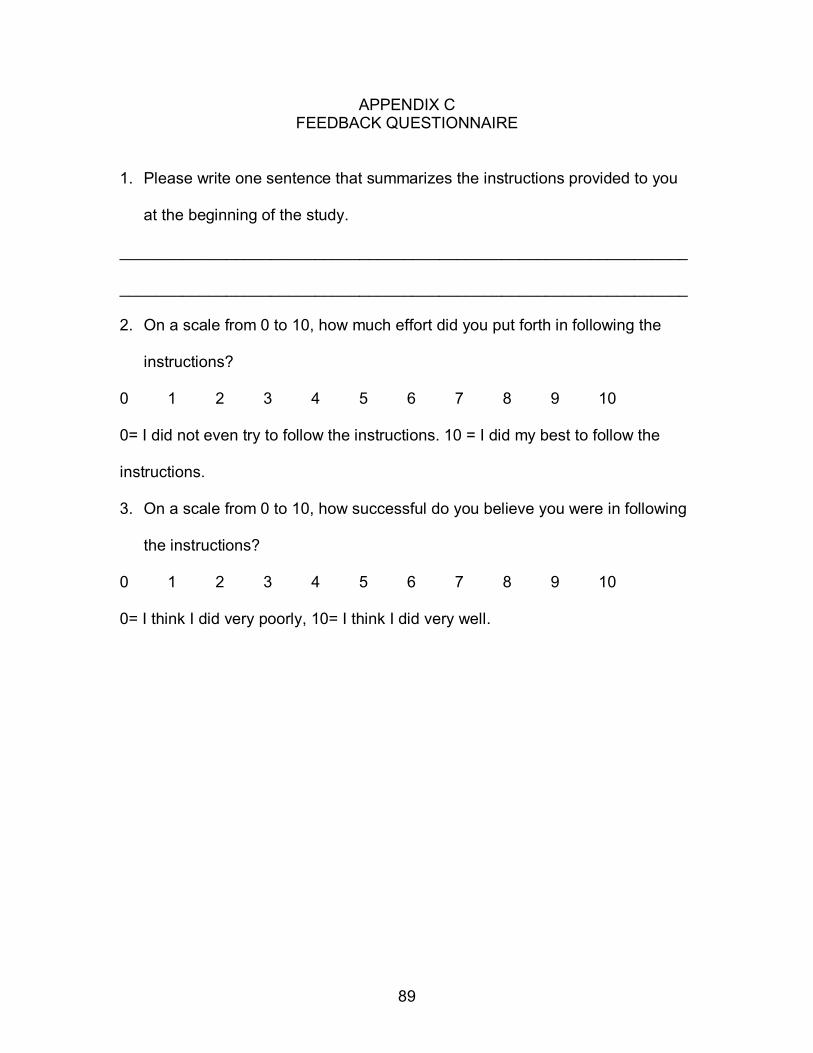
89
APPENDIX C FEEDBACK QUESTIONNAIRE
1. Please write one sentence that summarizes the instructions provided to you
at the beginning of the study.
________________________________________________________________
________________________________________________________________
2. On a scale from 0 to 10, how much effort did you put forth in following the
instructions?
0 1 2 3 4 5 6 7 8 9 10
0= I did not even try to follow the instructions. 10 = I did my best to follow the
instructions.
3. On a scale from 0 to 10, how successful do you believe you were in following
the instructions?
0 1 2 3 4 5 6 7 8 9 10
0= I think I did very poorly, 10= I think I did very well.

90
VITA
Randee Lee Booksh earned her Bachelor of Arts in psychology at the
University of New Orleans in 1995. She earned her Master of Arts in psychology
in 1999 from Southeastern Louisiana University. She is currently a Doctor of
Philosophy candidate in the Department of Psychology at Louisiana State
University and Agricultural and Mechanical College in Baton Rouge, Louisiana.
She is in the Adult Clinical Psychology program and is specializing in
neuropsychology under the supervision of Wm. Drew Gouvier, Ph.D. Mrs.
Booksh completed her predoctoral internship at the Southern Louisiana
Internship Consortium.
Related Documents